Submitted:
29 September 2025
Posted:
30 September 2025
You are already at the latest version
Abstract
Wearable smart heart monitors have become popular in health care due to their small size, light weight, and accuracy. In this paper, we used such monitors to collect real-time ECG (electrocardiogram) data from high school students during school weeks. The data were transmitted to a smartphone application via Bluetooth. The raw data was then downloaded to be processed by a software tool, which generated the HRV(Heart Rate Variability) parameter RMSSD, used to analyze the subjects' stress levels. We studied and confirmed the correlation between RMSSD and stress level. Subsequently, the effect of Yoga breathing exercises on stress relief and management was investigated. The study specifically examined the impact of this practice on sleep quality and daytime stress relief, as well as its potential to improve academic performance during test-taking.
Keywords:
heart rate variability
; RMSSD
; stress management
; ECG monitoring
; high school students’ mental health
; Yoga breathing
I. Introduction
High school students experience significant and chronic stress from various sources, including academic pressure, social demands, family expectations, and future uncertainty. These chronic high stress levels can lead to serious psychological and mental health issues [1,2]. Consequently, it has become increasingly important to find effective ways to monitor their stress levels and help them relieve or manage stress. This paper describes an efficient and convenient method for monitoring stress levels by measuring the ECG signal from the heart [3]. We used a wearable, integrated heart monitor to collect both short-term and long-term ECG data from a group of high school students. The non-invasive technology of the monitor enabled subjects to wear it continuously throughout their daily routines, including both day and night. The collected data were downloaded and processed with a software tool designed to extract the Heart Rate Variability (HRV) metrics. In this paper, we focus on the time domain HRV parameter - RMSSD, a widely used HRV metric to evaluate stress [4,5,6,7,8,9,10,11,12]. Measurement data show a strong correlation between RMSSD values and the subjects’ stress levels. Our research explored the effect of Yoga breathing on stress relief, with one specific focus on how it could improve sleep quality. In addition, we conducted experiments to demonstrate how this soothing exercise helps students cope with stress and potentially improve their academic performance, particularly during test-taking.
II. The Stress Monitoring System
- System Architecture
In this study, we utilized the Heart Smart ECG Monitor from SMW MED [13]. It integrates an ECG sensor, detection circuit, flash memory, wireless link, and accelerometer into one small package. The light and comfortable design allowed students to wear it on a daily basis without inconvenience. The complete ECG monitoring system is illustrated in Figure 1.
The monitor is attached to a single-use patch containing three sticky electrodes that collect electrical signals from the heart. As shown in Figure 1, the subject wears the patch on the chest near the heart. A dedicated application, installed on an Android smartphone, connects to the sensor via Bluetooth. Once connected, subjects can initiate the data collection process and monitor their real-time ECG signals through the APP. All ECG data for this study was collected at a sampling rate of 256 Hz. The monitor features very low power consumption, enabling continuous data collection for over 24 hours on a single charge. After data collection begins, subjects can resume their daily routines as usual. The monitor dynamically records ECG data and stores it in its internal flash memory. Once a collection period is complete, the APP generates a data record that can be exported for further processing. The measurement data is also securely stored in the cloud for later use. This low-power, non-invasive ECG monitoring system allows students to wear it throughout school, extracurricular activities, and sleep. Their stress information can be evaluated by analyzing the collected ECG raw data.
- 2.
- ECG Stress Analyzer Tool
The ECG monitor records the electrical activity of the heart. A typical ECG waveform, as shown in Figure 2, consists of the P wave, QRS complex, and T wave, each representing a specific electrical event in the heart.
Heart Rate Variability (HRV) measures the subtle, millisecond-level changes in the intervals between successive R-R peaks. In this study, we used RMSSD (Root Mean Square of Successive Differences) to analyze the stress level. RMSSD is calculated as shown in the following equation:
where N is the number of R-R peak values within the measurement time window. The RMSSD value is a reliable and widely used time domain marker that reflects the activity and adaptability of the Autonomic Nervous System (ANS). A healthy heart system should dynamically adapt to internal and external stimuli. A high RMSSD suggests that the ANS is flexible and responsive, indicating a relaxed and low-stress state. Conversely, a low RMSSD indicates that the nervous system may be in a high-stress state, likely due to fatigue or poor recovery [4,5,6,7,8,9,10,11,12].
In this study, an ECG stress analyzer tool developed by SMW MED and implemented in Python was used to process the raw ECG data. The processing began with bandpass filtering (0.5~40 Hz) to remove baseline wander from respiration and electrode drift (low-frequency noise) as well as muscle activity and power-line interference (high-frequency noise). A FIR filter was used to preserve waveform morphology through its linear phase response, ensuring accurate representation of the P, QRS, and T waves. R-peaks are identified by measuring the absolute gradient of the filtered signal and R-peaks as local maxima within QRS complexes. After that, RR intervals were derived and used to compute Heart Rate Variability (HRV) metrics. In this research, average RMSSD values were calculated for specific time windows, as defined by the user (e.g., 1, 5, or 15 minutes). This systematic approach enabled a precise analysis of the heart rate variability parameters used to evaluate the subjects’ stress levels.
III. Study Cases and Experimental Results
Using the wearable heart monitoring system described in Section II, ECG data were collected from a group of high school students. Data collection occurred at different periods, including regular school weeks and the final exam week. Throughout the measurement period, subjects maintained detailed log files of their activities, physical conditions, and mental states. These records provided critical information for studying the correlation between stress and various daily stimuli that the students encountered. After collection, the raw ECG data were downloaded from the mobile APP and processed using an ECG stress analyzer software tool. The resulting RMSSD values were then used to analyze the subjects’ stress levels. Several case studies, along with the experimental results and key findings, will be presented in this section.
- Correlation Between RMSSD and Stress Level
As a marker for stress, RMSSD varies significantly from person to person because HRV is influenced by a wide range of factors, including age, genetics, fitness level, and health conditions. Therefore, when analyzing a person’s HRV, it should be compared to their own established baseline. In this study, a subject’s baseline was calculated by averaging 14 days of RMSSD values recorded during sleep (0:00 - 6:00 AM) to smooth out day-to-day variations. A low-stress threshold was set at a 5% increase from the baseline, as RMSSD values above this indicate a state of good recovery and high parasympathetic activity, suggesting the person is relaxed and well-rested. A high-stress threshold was set at 70% of the baseline, as RMSSD values lower than this level indicate a suppressed parasympathetic nervous system, often linked to physical or psychological stress, poor sleep, or inadequate recovery. Values between the low-stress threshold and the high-stress threshold indicate the moderate-stress state or normal range.
Figure 3 illustrates one subject’s RMSSD values from 0:00 to 18:00 on a final exam day, which is considered one of the most stressful days for high school students. In Figure 3, the subject’s established baseline, as well as the defined low-stress and high-stress thresholds, are included to provide a clear visualization of their stress level fluctuations throughout the day.
As shown in Figure 3, the fluctuation in RMSSD during sleep reflects the subject’s poor sleep quality before the exam. Morning stress is evident upon waking, and a significantly low RMSSD value matches the subject’s anxious state just before exam#1. During exam#1 itself, the subject’s RMSSD values began to increase slowly. As shown in Figure 3, this pattern was consistently observed during the subject’s subsequent exam#2 on the same day. This is likely due to the subject’s extreme concentration during the exam and her stress level decreasing as the exam’s uncertainty unfolded. Before exam#2, the subject was again very nervous, and low RMSSD values indicated high stress. As exam#2 progressed, RMSSD started to increase and stayed in the normal range until the subject found a mistake near the end of the exam, and the RMSSD value dropped under the high-stress threshold. After a brief break followed exam #2, the subject attended an intense orchestra concert rehearsal, and the exceptionally low RMSSD values correctly reflected her highly stressful mental state recorded in the subject’s activity log file. In summary, the measured RMSSD values show a very strong correlation with the subject’s stress state, confirming RMSSD as a valid stress indicator.
Table 1 presents the RMSSD data for three students across two different weeks: a regular school week and a final exam week. The average values for the sleep period and daytime period are reported and compared. The baseline, low-stress threshold, and high-stress threshold for each subject are also listed.
As shown in Table 1, during a regular school week, both Subject #1 and Subject #2 had RMSSD values above their respective low-stress thresholds during sleep, indicating a relaxed state and likely good sleep quality. However, their RMSSD values during sleep dropped, and stress levels increased in the final exam week, indicating the impact of stress on sleep quality. During the daytime, Subject #1 was in a moderate stress state in the regular week, but turned to a high-stress state during the final exam week as expected. In contrast, the low daytime RMSSD values for Subject #2 across both weeks suggest the individual’s persistent stressful state, which aligns with the subject’s self-report of frequent anxiety at school. This pattern may reflect chronic stress or anxiety. On the other hand, data for Subject #3 showed little variation between day and night in both weeks. This lack of fluctuation may indicate a reduced adaptability of the individual’s autonomic nervous system.
As Table 1 shows, HRV RMSSD values are highly individual. Although the test subjects were of the same gender and similar age, each exhibited a different baseline and stress threshold. Their cardiac responses to similar stressors varied considerably.
- 2.
- Effect of Yoga Breathing on Sleep Quality and Daytime Stress
Research and data consistently show that high school students are suffering from chronic stress. Monitoring their stress levels and finding effective stress management methods are critical not only for their health but also for improving their performance during this key stage of their lives. A widely recognized stress-relief exercise is Yoga breathing, which involves deep breaths with specific patterns of inhales, exhales, and holding [14,15,16,17]. In this study, measurements were taken to quantitatively confirm the soothing impact of Yoga breathing on stress.
In the stress monitoring system, the APP on the mobile phone has a dedicated feature to guide the subject to do a certain Yoga breathing pattern (inhale 4s, hold 2s, exhale 4s, hold 2s) during the measurement. Figure 4 shows the RMSSD when a subject performs 10 minutes of Yoga breathing after waking up in the morning. In the graph, the subject experienced morning stress, with RMSSD values dropping dramatically after getting out of bed. However, while performing the 10 minutes of Yoga breathing, the RMSSD values increased significantly, indicating an obvious stress relief. Figure 4 shows short-term stress relief, as the RMSSD values dropped after the breathing exercise stopped. The long-term effects of Yoga breathing are also investigated. One interesting topic is how Yoga breathing affects sleep quality, which is critical for stressed high school students. A stable, low-stress state (high RMSSD values) during sleep indicates high-quality rest [18,19].
An experiment was conducted to investigate the long-term effects of a pre-sleep Yoga breathing exercise. For one school week, subjects performed 10 minutes of Yoga breathing right before sleeping. The average RMSSD values during sleep (from 0:00 AM to 6:00 AM) were recorded and compared to data from another school week when the subjects did not perform this exercise. Daytime RMSSD values were also measured to check for any potential long-term effect on daytime stress levels.
As shown in Table 2, for both subjects, with Yoga breathing exercise before sleeping, the average RMSSD values during sleep increased by over 20% compared to the data during the week without Yoga breathing. This strongly indicates that a pre-sleep yoga breathing exercise effectively relieves stress and improves sleep quality. However, the data show a different effect on daytime stress relief. Subject #4 appeared to benefit from the exercise, with daytime RMSSD values increasing by 24.6%. In contrast, Subject #1’s daytime RMSSD values dropped by 4.6%. This discrepancy suggests that the long-term effect of pre-sleep yoga breathing on daytime stress varies between individuals and requires further investigation.
- 3.
- Effect of Yoga Breathing on Stress During Exams
Research has shown that chronic stress impairs the brain’s ability to learn and remember. This can lead to difficulties with concentration and focus in the classroom, as well as a decrease in problem-solving skills, all of which directly impair a student’s academic performance [1,2,20]. The soothing effect of Yoga breathing was demonstrated in the previous section. In this study, we extended this investigation by exploring the impact of this stress-relief exercise on students’ academic performance.
In one experiment, the subject performed five minutes of Yoga breathing immediately before a math test, and the resulting RMSSD values were compared to the RMSSD for the regular case where the subject did not perform the exercise before taking the exam. The data for both cases, as plotted in Figure 5, clearly show that five minutes of Yoga breathing increased the subject’s pre-test RMSSD values, indicating the subject was relaxed and became less stressed. The subsequent RMSSD values throughout the test also remained higher compared to the regular case. Notably, the subject’s test score showed a marked improvement after the Yoga breathing intervention.
More experimental data were collected to further confirm the effect. A subject took six 20-minute Texas UIL math tests for each of two conditions: 1) regular (did nothing); 2) performed 5 minutes of Yoga breathing before the test. Six tests for each condition were taken randomly over several weekends. All tests were official UIL tests with similar difficulty. The test scores, average RMSSD values, and heart rates during the test were listed in Table 3 for each case. They were also plotted as a box and whisker diagram in Figure 6.
As shown in Table 3 and Figure 6, compared to the "Regular" case where the subject did nothing, five minutes of Yoga breathing intervention before the test increased the average RMSSD values during the test by 36.6% and decreased the heart rate by 6.7%. This significant increase in RMSSD indicates that after Yoga breathing, the subject’s stress level was much lower during the test. The test score also showed a notable improvement of 13.7%. This surprising result is particularly valuable as it demonstrates a promising method that students could employ to manage their stress before an exam, potentially effectively improving their academic performance. More extensive research with a larger sample size and broader data collection is needed to fully explore this topic.
Conflicts of Interest
The authors declare no conflicts of interest.
References
- Sheth C, McGlade E, Yurgelun-Todd D. Chronic Stress in Adolescents and Its Neurobiological and Psychopathological Consequences: An RDoC Perspective. Chronic Stress (Thousand Oaks). 2017Jan-Dec;1:2470547017715645. Epub 2017 Jun 18. [CrossRef] [PubMed] [PubMed Central]
- Kortsch Timo, Wegener Nico, Schwake Manon Elisa, “Improving mental health in high school students shortly before their final exams — a pilot study of a stress management intervention”, Frontiers in Education, Volume 10-2025. Available online: https://www.frontiersin.org/journals/education/articles/10.3389/feduc.2025.1548425.
- Kemeng Chen, Wolfgang Fink, Janet Roveda, Richard Lane, John Allen, and Johnny Vanuk, “Wearable Sensor Based Stress Management Using Integrated Respiratory and ECG Waveforms”,2015 IEEE 12th International Conference on Wearable and Implantable Body Sensor Networks (BSN), Cambridge, MA, USA, 2015, pp. 1-6.
- Fred Shaffer and J. P. Ginsberg, “An Overview of Heart Rate Variability Metrics and Norms”, Frontiers in Public Health, Sept 2017, Vol 5,Article 258.
- Shaffer F, McCraty R, Zerr CL. A healthy heart is not a metronome: an integrative review of the heart’s anatomy and heart rate variability. Front Psychol(2014) 5:1040. [CrossRef]
- HRV analysis methods - How is HRV calculated - Kubios. Available online: https://www.kubios.com/blog/hrv-analysis-methods/.
- Hadeer Ahmed Mahmoud1, Yehia S. Mohamed, “Comprehensive Analysis of Heart Rate Variability Using Various Methods”, SSRG International Journal of Electrical and Electronics Engineering, Volume 11 Issue 2, 129-143, 2024.
- Tiwari R, Kumar R, Malik S, Raj T, Kumar P. “Analysis of Heart Rate Variability and Implication of Different Factors on Heart Rate Variability”. Curr Cardiol Rev. 2021;17(5):e160721189770. [CrossRef] [PubMed] [PubMed Central]
- McCraty R, Shaffer F. Heart rate variability: new perspectives on physiological mechanisms, assessment of self-regulatory capacity, and health risk. Glob Adv Health Med (2015) 4:46–61. [CrossRef]
- Billman GE, Huikuri HV, Sacha J, Trimmel K. An introduction to heart rate variability: methodological considerations and clinical applications. Front Physiol (2015) 6:55. [CrossRef]
- Tyagi A, Cohen M. Yoga and heart rate variability: A comprehensive review of the literature. Int J Yoga 2016; 9(2): 97-113. [CrossRef] [PubMed]
- Verkuil B, Brosschot JF, Tollenaar MS, Lane RD, Thayer JF. Prolonged Non-metabolic Heart Rate Variability Reduction as a Physiological Marker of Psychological Stress in Daily Life. Ann Behav Med. 2016 Oct;50(5):704-714. [CrossRef] [PubMed] [PubMed Central]
- Available online: https://smwmed.com/.
- Vinay AV, Venkatesh D, Ambarish V. Impact of short-term practice of yoga on heart rate variability. Int J Yoga 2016; 9(1): 62-6. [CrossRef] [PubMed]
- Muralikrishnan K, Balakrishnan B, Balasubramanian K, Visne-garawla F. Measurement of the effect of Isha Yoga on cardiac autonomic nervous system using short-term heart rate variability. J Ayurveda Integr Med 2012; 3(2): 91-6. [CrossRef] [PubMed]
- Epe J, Stark R, Ott U. Different Effects of Four Yogic Breathing Techniques on Mindfulness, Stress, and Well-being. OBM Integrative and Complementary Medicine 2021; 6(3): 031. [CrossRef]
- Balban MY, Neri E, Kogon MM, Weed L, Nouriani B, Jo B, Holl G, Zeitzer JM, Spiegel D, Huberman AD. Brief structured respiration practices enhance mood and reduce physiological arousal. Cell Rep Med. 2023 Jan 17;4(1):100895. Epub 2023 Jan 10. [CrossRef] [PubMed] [PubMed Central]
- Eleonora Tobaldini, Lino Nobili, Silvia Strada1, Karina R. Casali, Alberto Braghiroli and Nicola Montano, “Heart rate variability in normal and pathological sleep”: October 2013.
- Stein, Phyllis K., and Yachuan Pu. "Heart rate variability, sleep and sleep disorders." Sleep medicine reviews 16.1 (2012): 47-66.
- Córdova A, Caballero-García A, Drobnic F, Roche E, Noriega DC. Influence of Stress and Emotions in the Learning Process: The Example of COVID-19 on University Students: A Narrative Review. Healthcare (Basel). 2023 Jun 17;11(12):1787. [CrossRef] [PubMed] [PubMed Central]
Figure 1.
Architecture of Stress Monitoring System.
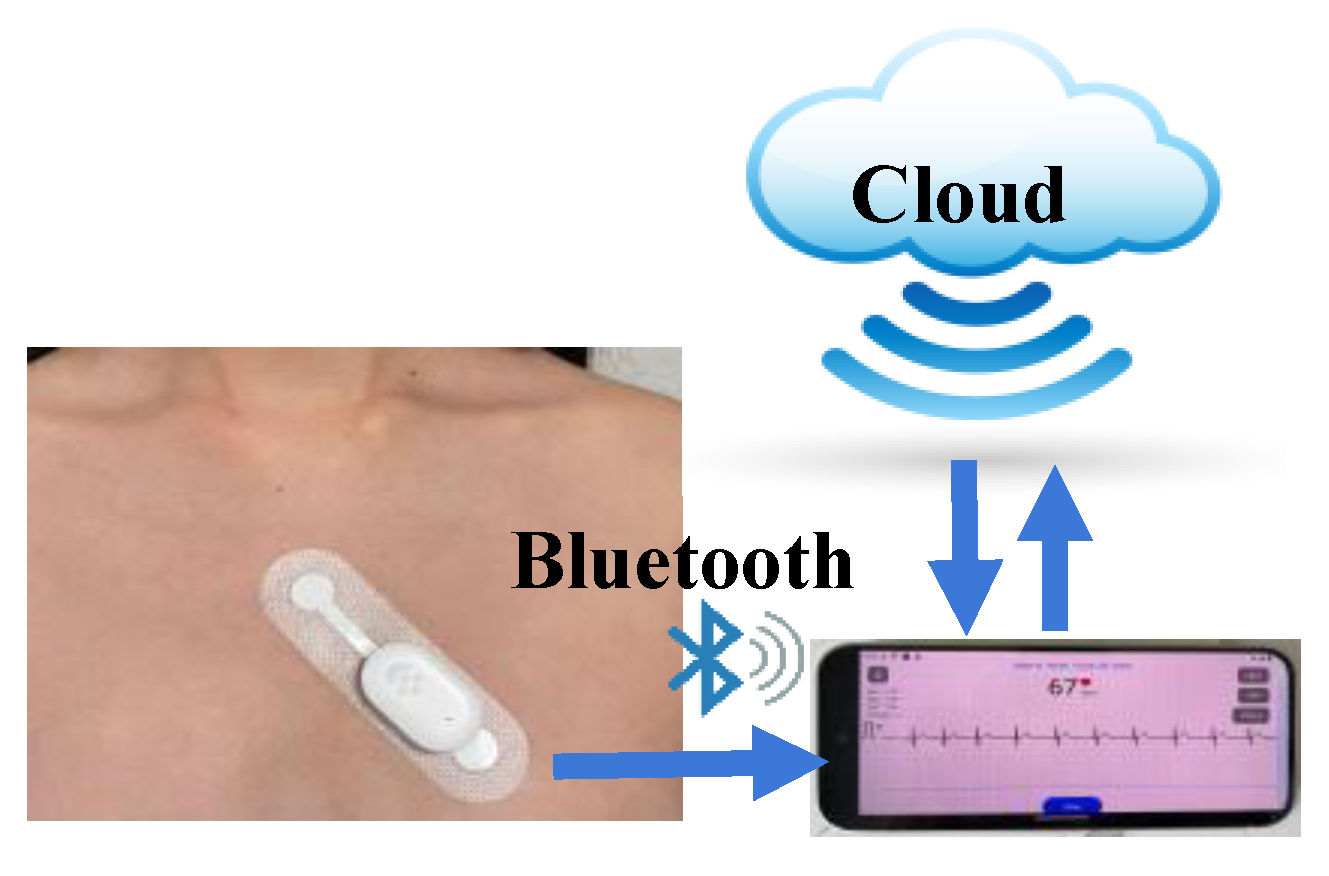
Figure 2.
ECG Signal: QRS Complex and R-R Peaks.
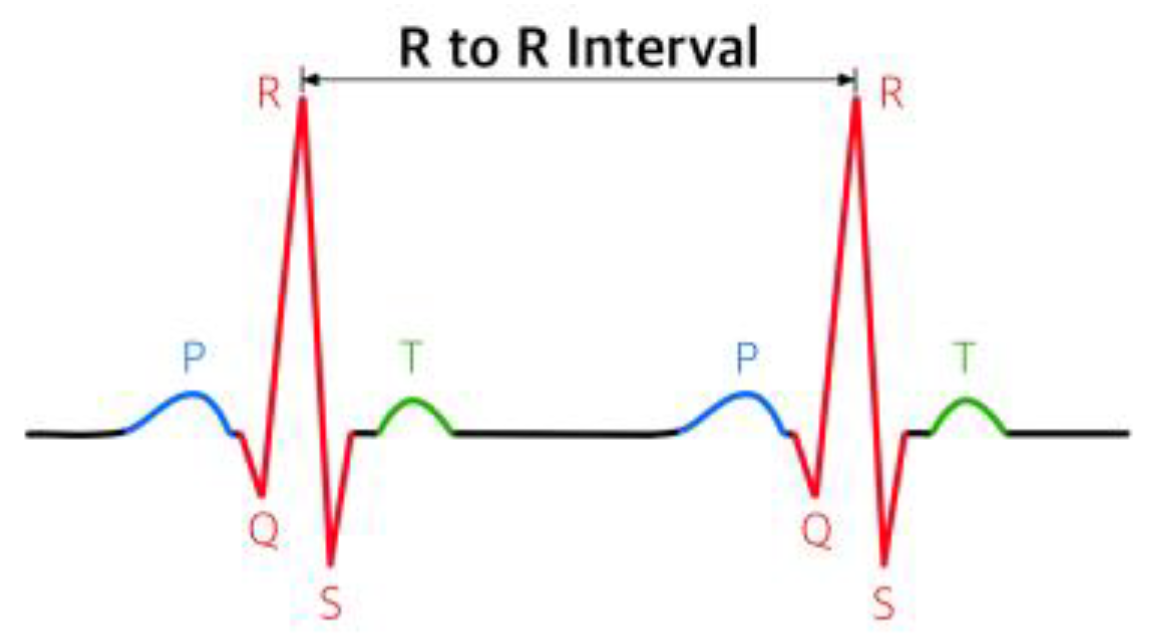
Figure 3.
RMSSDs on Final Exam Day.
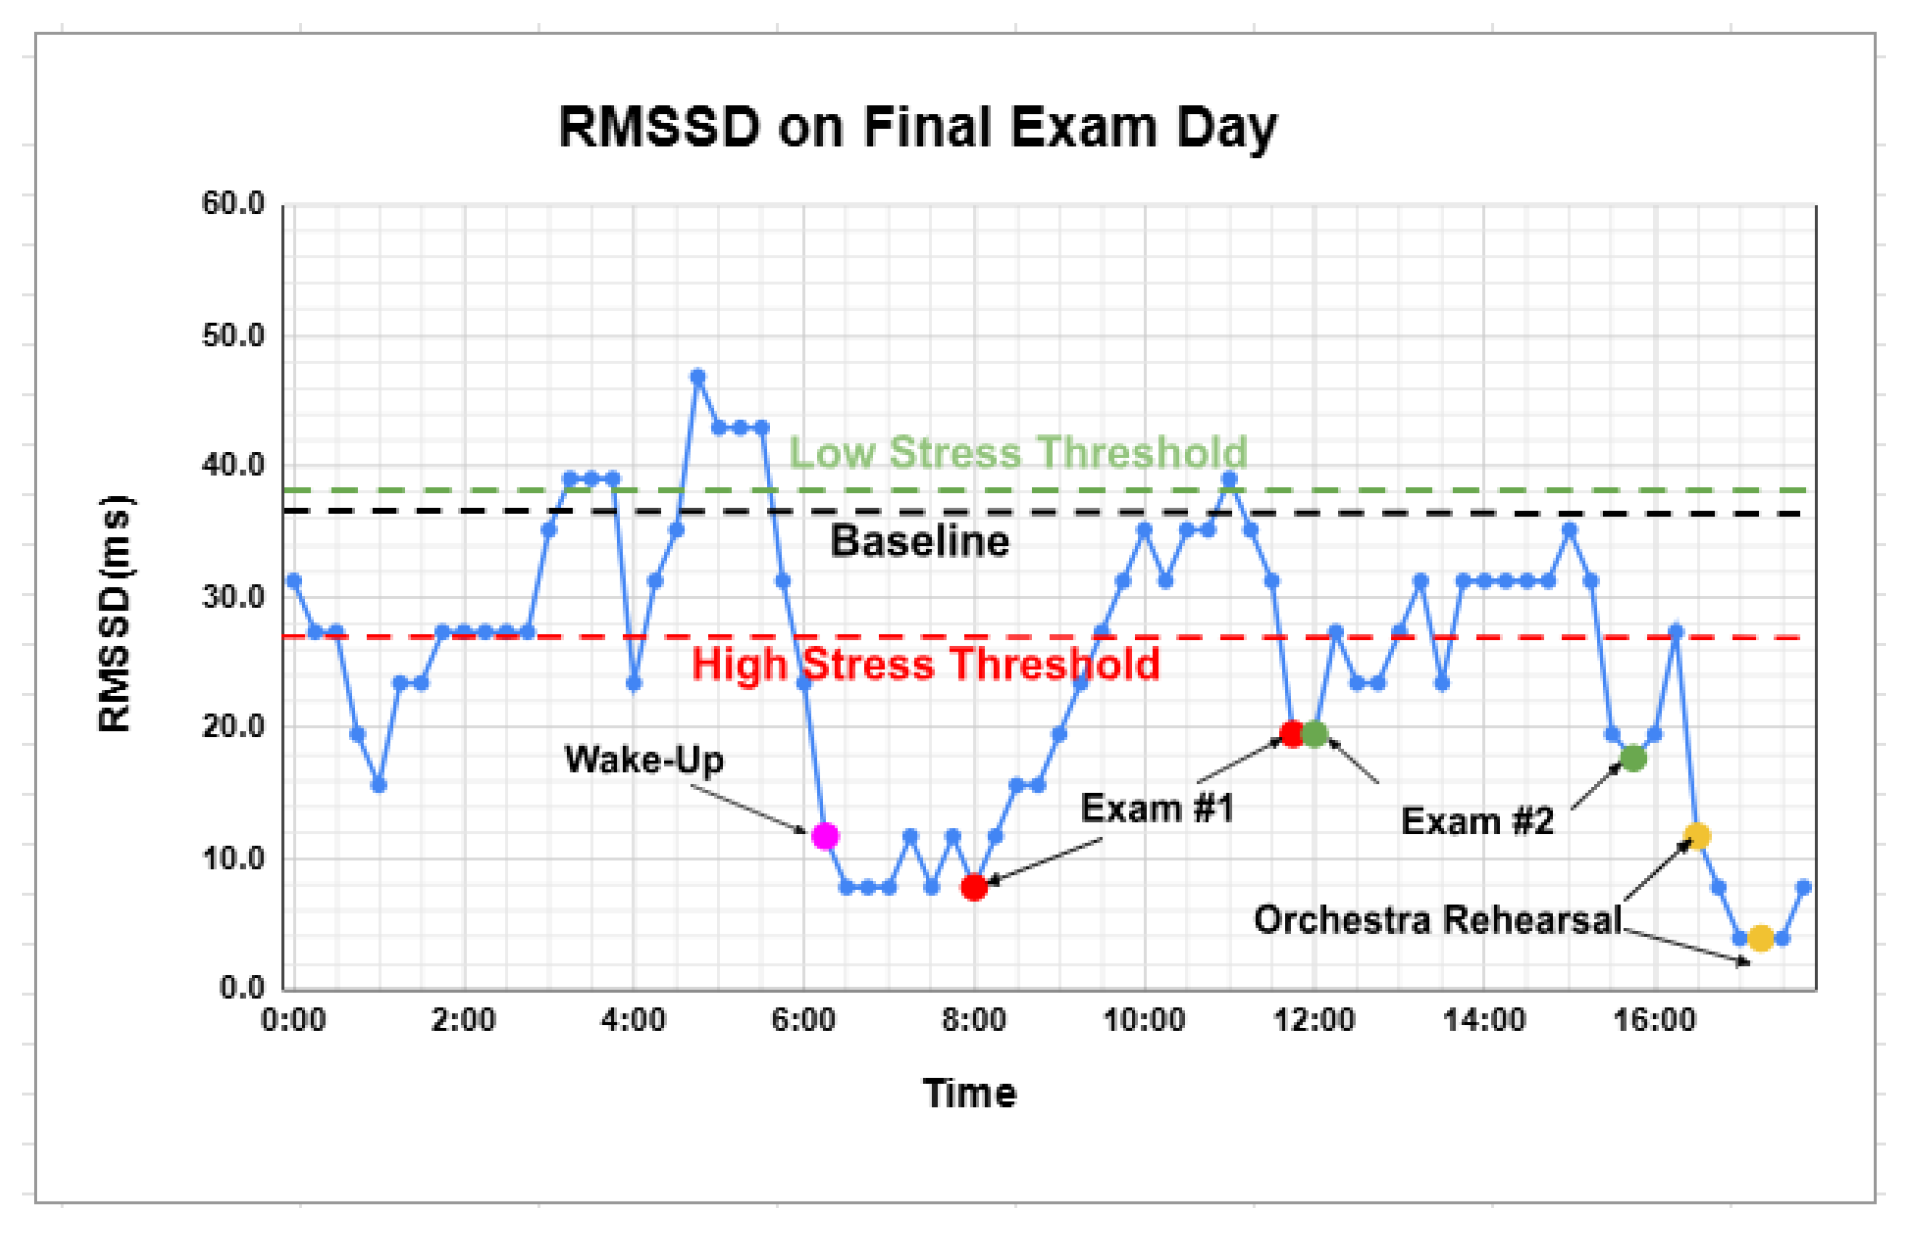
Figure 4.
Effect of Ten Minutes of Yoga Breathing on RMSSD.
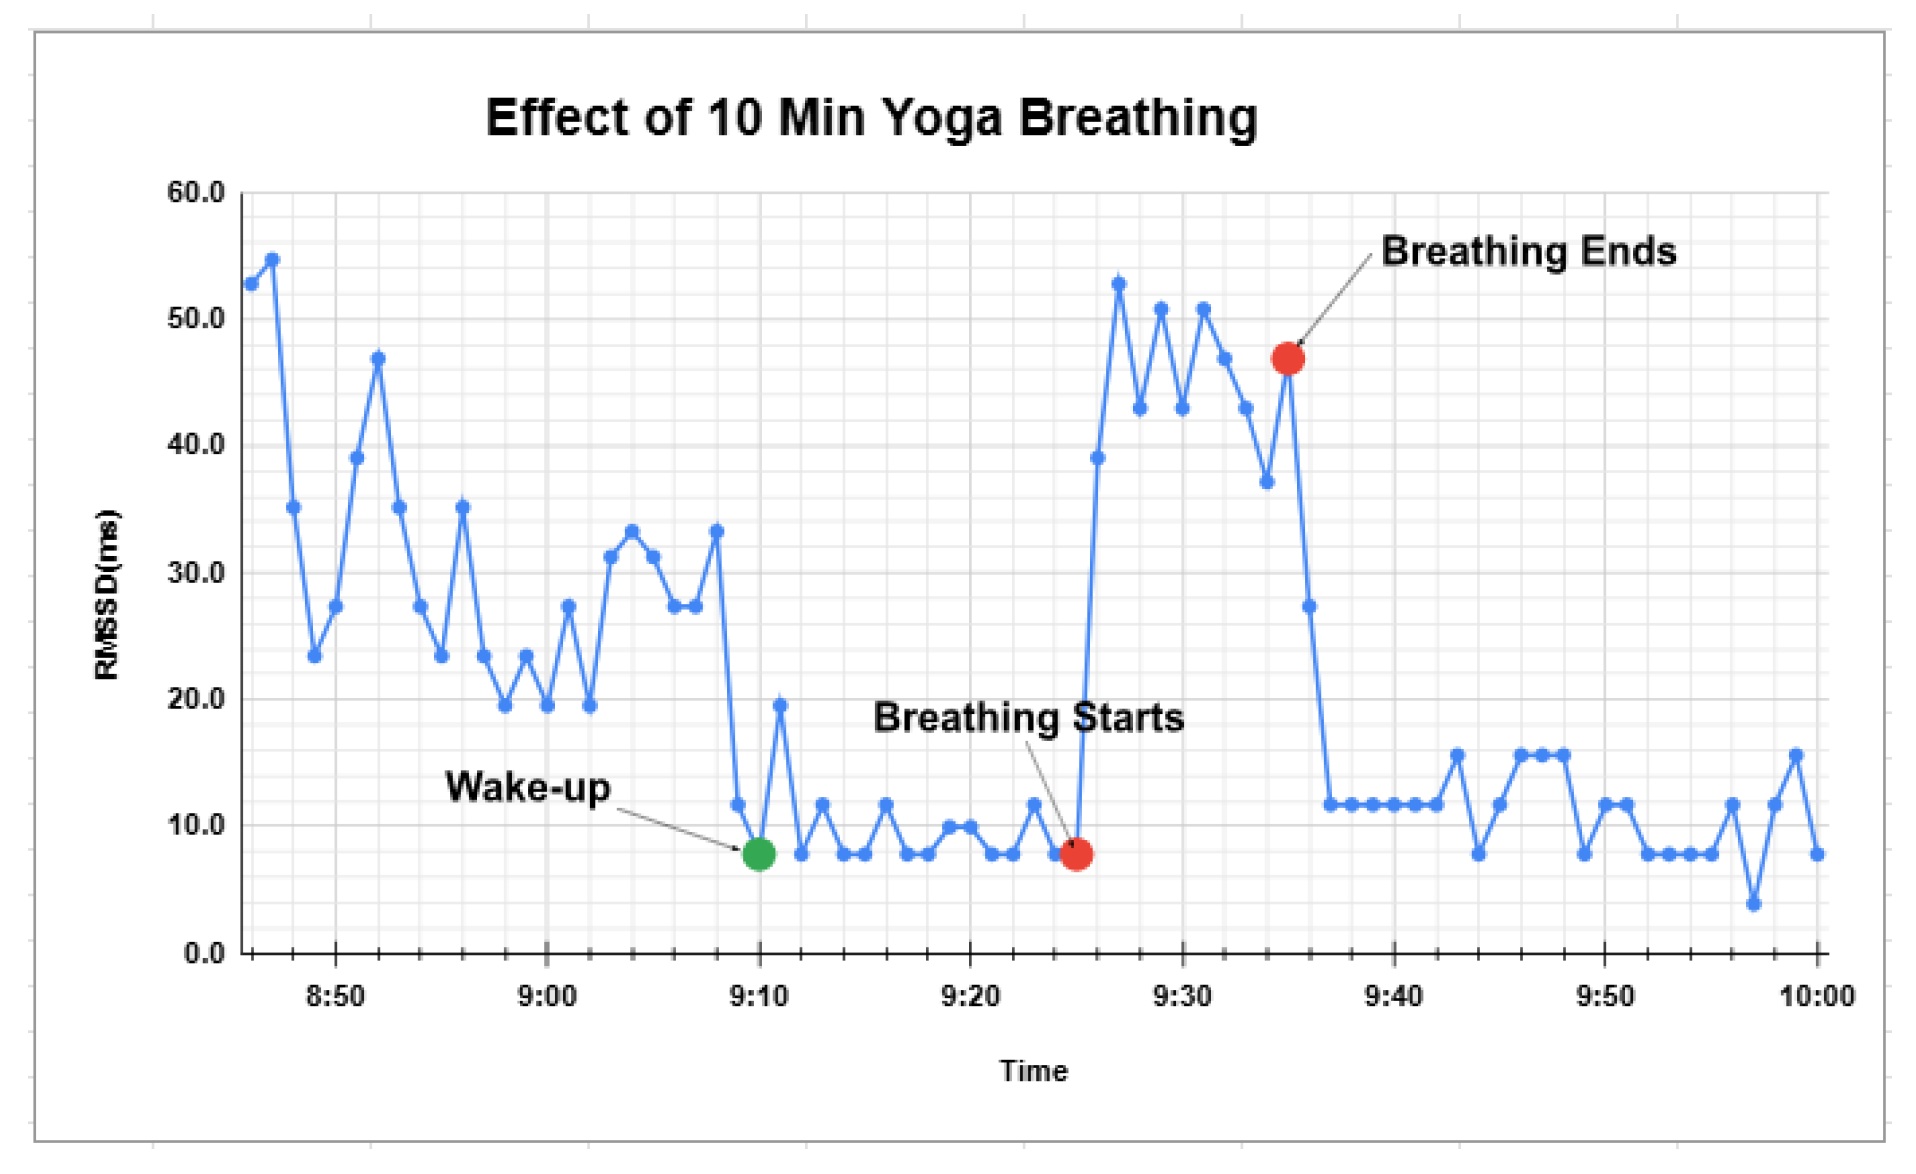
Figure 5.
RMSSDs Before and During Test: Yoga Breathing vs Regular.
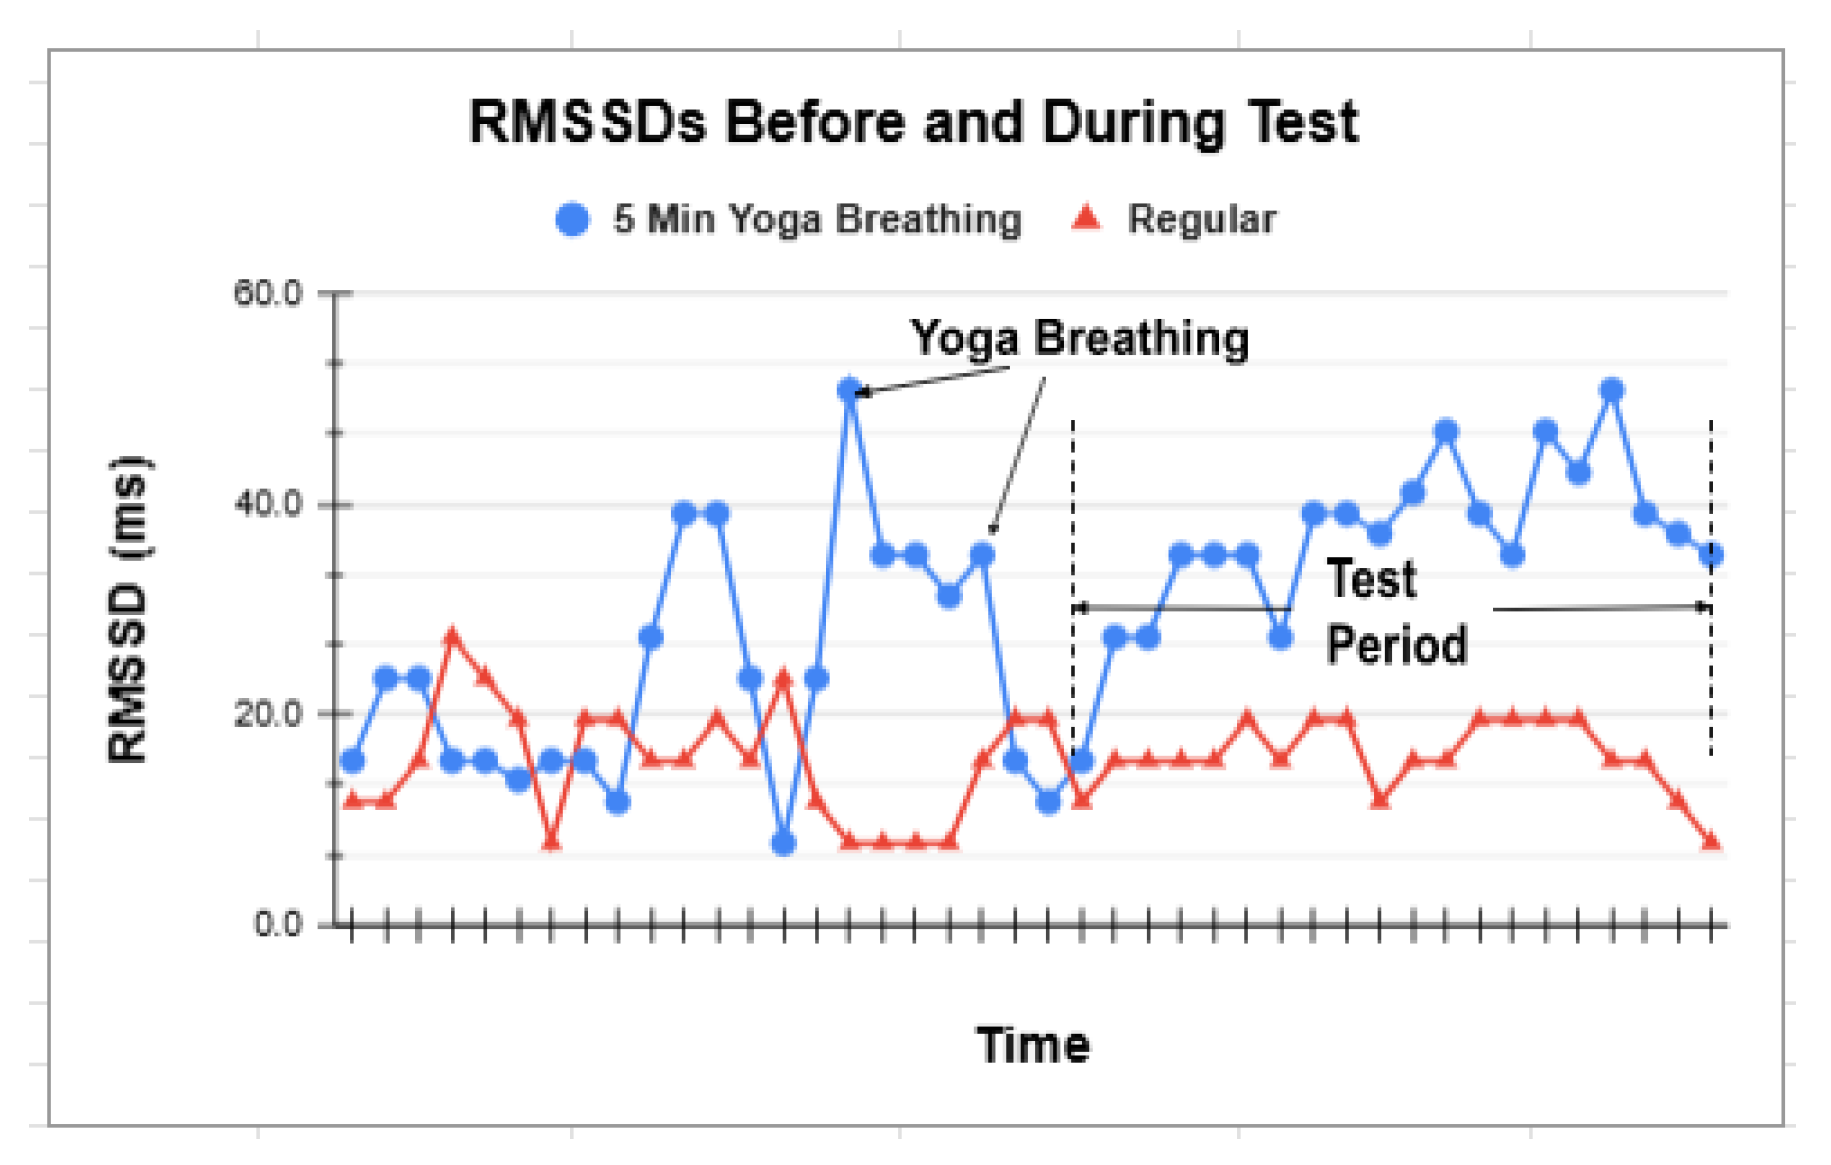
Figure 6.
Effect of Yoga Breathing on Test.
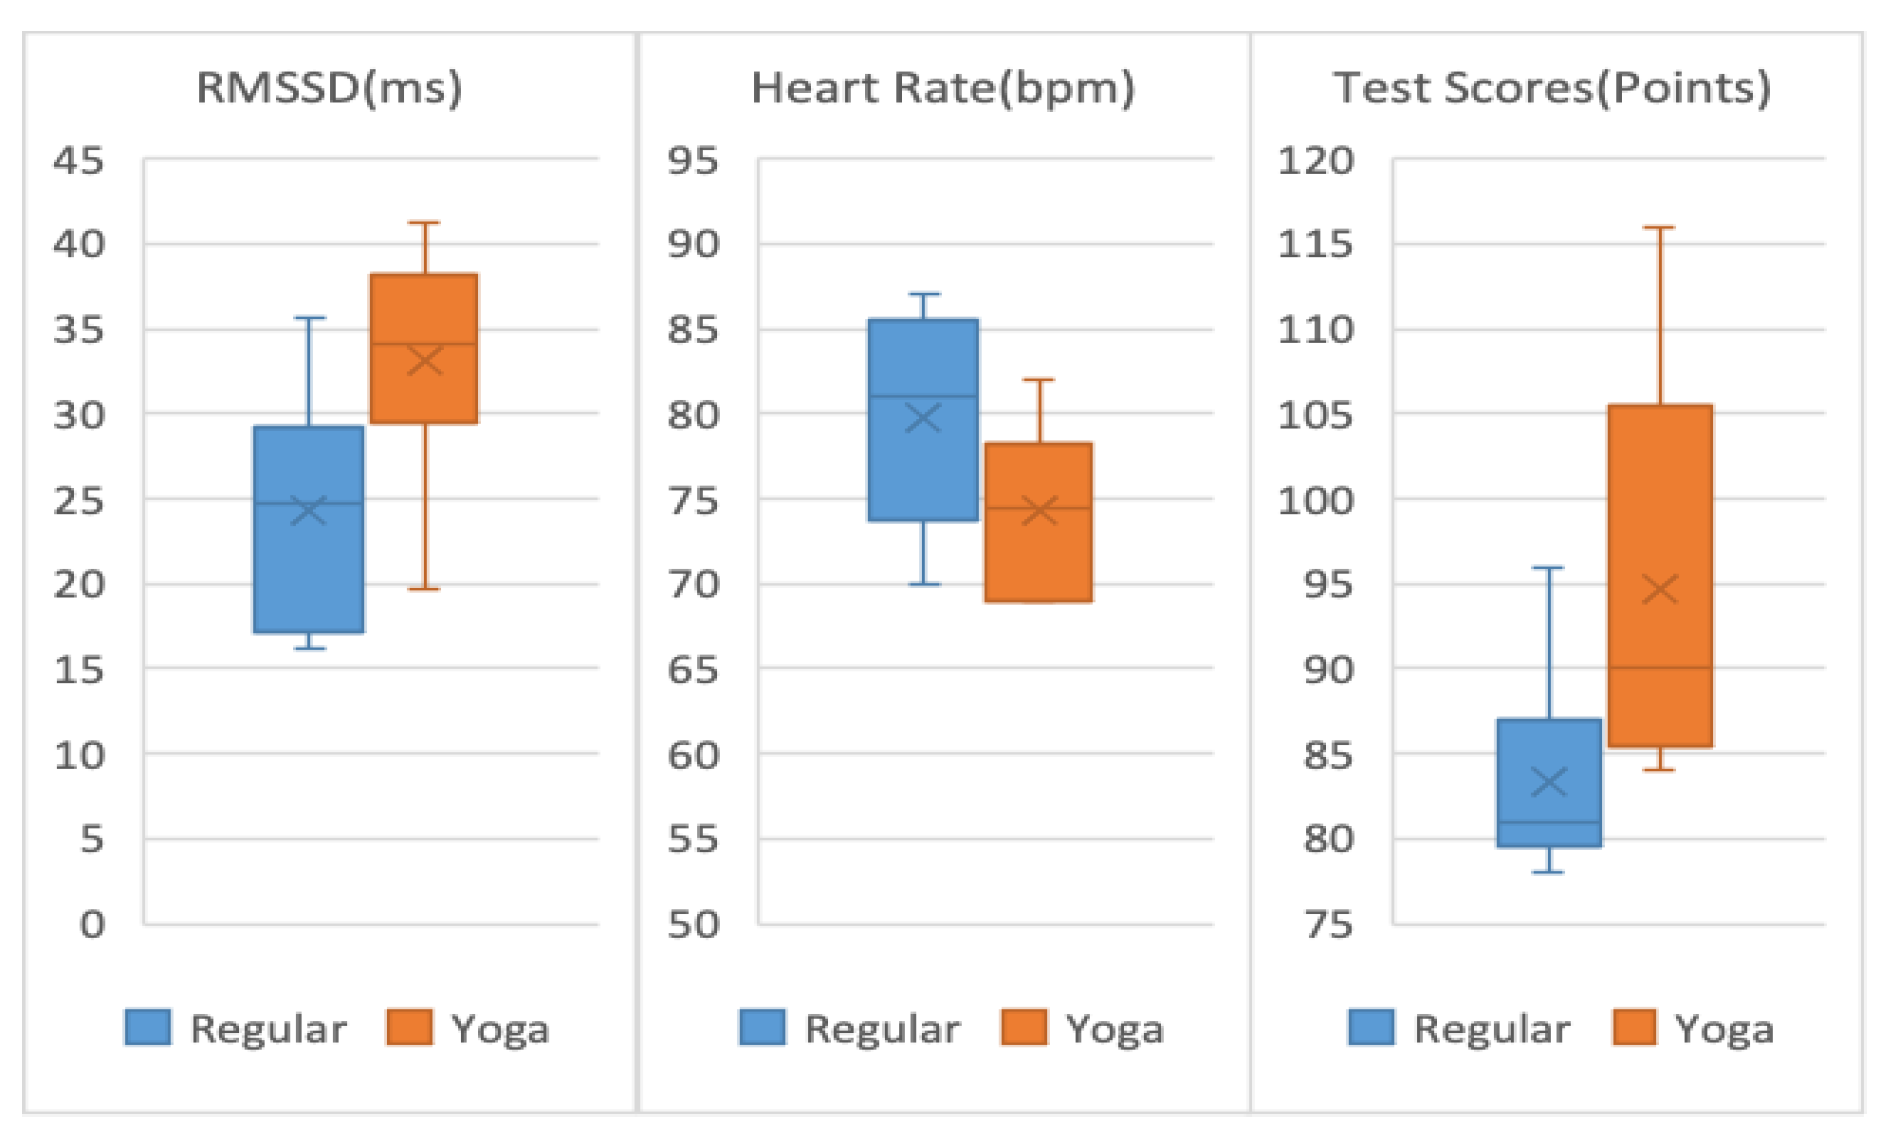

Table 1.
RMSSD Comparison: Regular School Week vs. Final Exam Week.
| Subject #1 | Subject #2 | Subject #3 | ||||
|---|---|---|---|---|---|---|
| Baseline (ms) | 36.7 | 42 | 32.4 | |||
| Low-Stress Threshold(ms) | 38.6 | 44.1 | 34.1 | |||
| High-Stress Threshold(ms) | 25.7 | 29.4 | 22.7 | |||
| Sleep | Day Time | Sleep | Day Time | Sleep | Day time | |
| RMSSD (ms) in Regular School Week | 39.8 | 28.3 | 48 | 13.8 | 32.1 | 30.8 |
| RMSSD (ms) in Final Exam Week | 28.1 | 20 | 36.2 | 15.1 | 32.8 | 30.5 |
Table 2.
RMSSD Comparison: Regular week w vs. w/o Yoga breathing.
| RMSSD (ms) Subject #4 Sleep | RMSSD (ms) Subject #1 Sleep | RMSSD (ms) Subject #4 Daytime | RMSSD (ms) Subject #1 Daytime | |
|---|---|---|---|---|
| Regular school week (w/o Yoga Breathing) | 36.7 | 39.8 | 22.8 | 28.3 |
| Regular school week (w 10 Min Yoga Breathing before sleep) | 44.8 | 49.8 | 28.4 | 27 |
| Improve (%) | 22.1% | 25.1% | 24.6% | -4.6% |
Table 3.
Effect of Yoga Breathing on Test.
| Regular | 5 min Yoga Breathing | Improvement | |
|---|---|---|---|
| Test Scores (points) | 83.3 | 94.7 | 13.7 % |
| RMSSDs (ms) | 24.3 | 33.2 | 36.6 % |
| Heart Rates (bpm) | 79.6 | 74.3 | 6.7 % |
Disclaimer/Publisher’s Note: The statements, opinions and data contained in all publications are solely those of the individual author(s) and contributor(s) and not of MDPI and/or the editor(s). MDPI and/or the editor(s) disclaim responsibility for any injury to people or property resulting from any ideas, methods, instructions or products referred to in the content. |
© 2025 by the authors. Licensee MDPI, Basel, Switzerland. This article is an open access article distributed under the terms and conditions of the Creative Commons Attribution (CC BY) license (https://creativecommons.org/licenses/by/4.0/).
Copyright: This open access article is published under a Creative Commons CC BY 4.0 license, which permit the free download, distribution, and reuse, provided that the author and preprint are cited in any reuse.


