Submitted:
28 September 2025
Posted:
29 September 2025
You are already at the latest version
Abstract
In recent years CO2 reforming of methane has attracted great interest as it produces high CO/H2 ratio syngas suitable for the synthesis of higher hydrocarbons and oxygenated derivatives, since it is a way for disposing and recycling two greenhouse gases with high environmental impact, CH4 and CO2, and because it is regarded as a potential route to store and transmit energy due to its strong endothermic effect. Along with noble metals, all the group VIII metals, except for osmium, have been studied for catalytic CO2 reforming of methane. It was found that the catalytic activity of Ni, though lower than those of Ru and Rh, was higher than the catalytic activity of Pt and Pd. Although noble metals have been proved to be insensitive to coke, the high cost and restricted availability limit their use in this process. It is therefore valuable to develop stable Ni-based catalysts. In this contribution, we show how their activity and coking resistivity is greatly related to the size and dispersion of Ni particles. Well-dispersed Ni nanoparticles were achieved by multistep impregnation on a mesoporous silica support, namely SBA-15, obtained through a sol-gel method, using acetate as nickel precursor and keeping the Ni loading between 5 wt% and 11 wt%. Significant catalytic activity was obtained at temperatures as low as 450 °C, temperature well below their deactivation temperature, i.e., 700 °C. For the pre-reduced samples complete CO2 conversion was obtained around 680 ºC. As such, their deactivation by sintering and coke formation was prevented. To the best of our knowledge, no Ni-based catalysts with complete CO2 conversion at temperatures lower than 800 ºC were reported so far.
Keywords:
dry reforming of methane
; Ni/SBA-15 catalysts
; TAP Reactor
1. Introduction
Recent global energy deficiency and more severe emission regulations, especially for CO2, have motivated worldwide research on valorisation of biomass as a source of renewable energy and fuels. Seen as a way to mitigate global warming and diversify the energy sources, the use of biomass for fuels, power production, and chemicals that would otherwise be made from fossil fuels, provides many benefits. Beside direct combustion, the fermentation of carbohydrates to ethanol or 1st generation of biofuels, the fermentation of lignocellulosic feedstock to 2nd generation of biofuels, the cultivation of oil seeds for biodiesel, and the generation of biogas via anaerobic digestion followed by a further catalytic conversion of biogas to syngas or “green gas” through the dry reforming and then, by a Fischer-Tropsch (FT) transformation to synoil, were considered. Our work focuses on using advanced catalysis to develop sustainable technologies for chemicals, fuels and energy, with the ultimate goal of zero waste, zero pollution.
Lately there have been considerable efforts to develop cost effective processes for converting natural gas, composed mainly of methane, to fuels, fuel additives and chemicals. One potential route involves the conversion of methane via a Dry Reforming of Methane (DRM) process to a syngas intermediate suitable for synthesis of the desired products using Fischer-Tropsch technology; however, the viability of these processes has been hampered by both cost and technical limitations. One potential option to reduce the cost of syngas production (which typically represents more than 60% of the process cost) is the utilization of renewable resources such as biogas. As biogas consists mainly of CH4 and CO2, the most suitable process for its utilization is the dry reforming of methane (DRM) to syngas and then, to liquid energy carriers via Fischer-Tropsch technology. The DRM process provides, both, a way for disposing and recycling CO2 and CH4, two greenhouse gases with high environmental impact, [1], together with an alternative route for producing syngas with higher purity and lower H2/CO ratio than steam reforming and partial oxidation [2]. Lower H2/CO ratio syngas are ideal for Fischer-Tropsch synthesis of long-chain hydrocarbons, while higher purity syngas is preferable feedstock for hydrogen production. Hydrogen is emerging as a future replacement fuel for traditional fossil fuels, possible to ensure energy security and environmental viability [3]. Although DRM process has many environmental and economic incentives, unfortunately, at the present time, there are no commercial processes for reforming of methane with CO2.
This study seeks to explore a potential new catalytic approach that might be developed to achieve this.
Key to the efficient production of syngas by DRM is the use of an effective catalyst. Presently, noble metal catalysts, such as Rh [4], Ru and Pt [5,6,7] are used in such processes as they exhibit outstanding catalytic activity. However, noble metal catalysts suffer from several disadvantages including high cost and poor availability. Further research has shown that transition metal catalysts, such as nickel, may offer a suitable alternative as they are low cost, easily accessible and offer high activity and selectivity towards the production of syngas from DRM [8,9,10,11,12,13,14,15,16]. Despite their apparent suitability, nickel catalysts are easily deactivated at temperatures higher than 700 ºC. Deactivation occurs through two mechanisms, one known as sintering, which involves an increase in metal crystallites growth leading to the loss of exposed metal surface area and changes in the catalytic properties, and another known as coking, which involves carbon and coke-forming processes [17,18]. Nickel catalyses carbon formation via hydrocarbon decomposition and CO disproportionation reactions. To date, only one pilot plant scale-up has been attempted and, although high conversion rates of carbon dioxide were achieved, the process was considered commercially unattractive as the operating temperature (namely 800 ºC) was over their deactivation temperature [19]. Therefore, the challenge is to develop highly active catalysts which exhibit a high selectivity toward hydrogen and carbon monoxide without forming carbon.
It has been reported that highly dispersed Ni catalysts show good coke resistance [20,21], while the use of supports such as titania, alumina or silica offers high thermal stability [11,22]. However, despite all the research efforts, supported Ni catalysts highly active at temperatures lower than their deactivation temperature and, as such, suitable for commercial applications, have not been reported yet.
A suggested solution to inhibit the carbon deposition has been to promote the Ni-based catalysts with a metal oxide, especially CeO2 (which, due to its redox properties, would induce the formation of oxygen vacancies, responsible for enhanced mobility of surface oxygen, which, in turn, would contribute to lowering the carbon deposition on the metallic particles), or with ceria-zirconia mixed oxides [23]. Nevertheless, good activity was observed, but by adding an extra element (or two) the cost of the Ni/SBA-15 catalysts will increase and as such, higher prices will hamper their commercialization.
What is more, most of the studies on DRM reaction over Ni-based catalysts have been performed using a CH4:CO2 ratio of 1:1, ratio which would less favour the carbon formation via methane decomposition. In our study, a CH4:CO2 ratio of 1.5:1 is used instead, ratio closer to the one in the biogas.
Therefore, we have recently focused our work on the preparation and characterization of nickel-based catalysts suitable for commercial applications. Their extensive physical and chemical characterization has allowed us to assess the way preparation conditions affect the structure, morphology, texture, resistance to coke formation, stability and, last but not least, the catalytic activity. Single and/or multiple step impregnation of nickel precursors, acetate, nitrate and citrate, respectively, onto a mesoporous silica support, i.e. SBA-15, obtained through a sol-gel method, were carried out under different preparation conditions. SBA-15 was chosen as support due to a relatively well-defined geometry, involving ordered hexagonal arrays of mesopores, with a tunable pore size and high surface area. Samples with increasing Ni loading from 1 wt% to 30 wt% were prepared by single step impregnation of nickel nitrate. Both single and multiple step impregnation methods of nickel acetate were used to prepare samples with Ni loading from 1 wt% to 11 wt%. When nickel citrate was used as precursor, the maximum Ni loading was 15 wt% for the single step impregnation. The knowledge gained through this very demanding preparation process allowed us to identify the conditions to be used to synthesize the optimal formulation catalysts, allowed us to better understand the structure-activity relationship of these Ni-based catalysts. We have found that the best dispersion of nickel species over the mesoporous support was achieved by using acetate as nickel precursor, while a nickel loading between 5 wt% and 11 wt% obtained through the multiple step impregnation was responsible for the highest activity and resistance to coke formation of these catalysts.
Hence, in light of the above considerations, this paper presents the synthesis and the characterization of two samples, the 5 wt% and 11 wt% Ni ones, as catalysts with Ni loading within this window are the most likely to be used for commercial applications. What is more, by using a CH4:CO2 ratio closer to the one in biogas, a sustainable DRM commercial technology can be develop further, if the two catalysts will prove to be active and selective and, at the same time, resistant to coke formation.
2. Materials and Methods
2.1. Synthesis of Support, SBA-15
The general experimental procedure followed in the preparation of SBA-15 mesoporous silica was described in detail by Zhao et al. [24,25]. This procedure was modified, and the preparation conditions were optimized through experiments. The optimized procedure is described below.
4 g of tri-block copolymer of Poly(Ethylene Oxide)-Poly(Propylene Oxide)-Poly(Ethylene Oxide) (EO20PO70EO20 or Pluronic P123, with a typical Mn = 5800) was dissolved in 130 g deionised water. The formed solution was kept stirring at 40 ºC until clear. Then 20 ml HCl (37 wt%) was added followed by the drop wise addition of 9.25 g of Tetraethyl orthosilicate (TEOS). The reaction mixture was stirred moderately for 24 hours, followed by aging at 95 oC for another day without stirring. The white product was collected by filtration, dried, and then calcined at 550 oC for 6 h with the heating ramp of 1 oC/min. SBA-15 was then re-hydrated in boiling water for 2 h. Obtained hydrated SBA-15 was dried at 130 oC for 3 h.
2.2. Synthesis of Catalysts
1.0 g of SBA-15 was impregnated with 12 ml water solution containing 0.153 g Nickel acetate tetrahydrate (wet impregnation). After sonication for several minutes, the mixture was stirred for 1 h at room temperature. Impregnated silica was collected and dried at 100 oC in vacuum and calcined at 550 oC for 2 h with heating rate of 10 oC/min.
This process was repeated several times to increase the Ni content.
2.3. Support and Catalysts Characterization
X-ray diffraction (XRD) patterns of the support and catalyst’s samples were recorded on a Bruker D8 (25 kV, 20 mA) powder X-ray diffractometer, using Cu Kα (λ=0.15406 nm) radiation, the tube voltage 40 kV, and the current was 20 mA. The data were collected from 0.5–4° (2Ө) with a resolution step size of 0.01° or angular increment of 0.01o (low-angle XRD patterns) and from 10–100° (2Ө) with a resolution step size of 0.02° (conventional wide-angle XRD patterns). Small-angle XRD gives information on the mesoporous structure while wide-angle XRD gives information on the crystalline structure.
Scanning Electron Microscopy (SEM) was used to monitor the morphology of the support and of the catalyst’s samples as well. SEM examination was performed using a Hitachi S-3400N electronic microscope. A beam of highly energetic electrons (0.1-50 keV) is focused on the sample surface. The microscope is equipped with a secondary electron detector, a backscattered electron (BSE) detector, and X-rays energy dispersive spectroscopy (EDS or EDX). A secondary electron detector records topography of the surface under observation with high resolution imaging on the order of 1-2 nm and magnification range from 10 to 500,000 x.
Transmission electron microscopy (TEM) equipped with energy dispersive X-ray (EDX) characterization was performed on JEOL, JEM-1010 at an accelerating voltage of 100 kV. The samples were prepared in the following way: 0.02 g of each sample was dispersed in 3 ml of ethanol solution, and the suspension was sonicated for 30 min. A drop of the suspension was transferred to a Cu mesh grid covered with carbon film. The grid was dried in vacuum at room temperature for 24 hours.
The total surface area, the pore volume and the pore size distribution were determined by Nitrogen sorption at 77 K (on a Micromeritics ASAP2010 apparatus; prior to the analysis the samples were evacuated at 473 K for 10 h) and Mercury porosimetry (carried out on a Micromeritics Autopore IV 9510 analyser). After degassing the samples, mercury was intruded in the pressure range from vacuum to 418 MPa. Measurements were performed using a contact angle of 140º for mercury and a pressure equilibration time of 10 s. The Washburn equation was applied to calculate the pore size distribution. The specific surface area was calculated using the Brunauer–Emmett–Teller (BET) method.
TeraHertz Spectroscopy (Reflectance and Transmission) measurements were acquired using a TPS spectra 3000 spectrometer (TeraView Ltd., UK).
Temperature programmed reduction (CH4-TPR), oxidation (O2-TPO), and reaction (CH4:CO2 = 1.5:1) experiments were performed using a CATLAB system ( Hiden Analytical, UK) on fresh and in-situ reduced Ni catalysts. Heating rates were 10oC min-1. In-situ reduction was performed under a H2 flow by heating to 550oC at 10oC min-1 and holding at this temperature for 1 hour.
X-ray photoelectron spectroscopy (XPS) was carried out on Escalab 220 XL spectrometer (Vacuum Generators). The monochromatic Al K_ X-ray source was used, and electron energies were measured in the constant analyser energy mode. The pass energy was 100 eV for the survey of spectra and 40 eV for the single element spectra. All XPS binding energies were referred to C1s core level at 285 eV. The angle between the incident X-rays and the analyser was 58º, photoelectrons being collected perpendicularly to the sample surface. Spectra were analysed with CasaXPS software.
2.4. Evaluation of Catalytic Activity
The activity and selectivity towards the dry reforming of methane reaction were tested using both steady-state and transient experiments. The steady-state experiments were performed using the Catlab system (Hiden Analytical, UK), while the transient experiments were performed using a TAP (Temporal Analysis of Products) reactor, available at The University of Tokyo. The Catlab system consists of a feeding section, a reaction section and an analysis section, i.e. a quadrupole mass spectrometer. The reaction section consists of a quartz tube reactor approximately 100 mm long with a radius of 5 mm, filled with the required mass of catalyst (0.05 g if not otherwise specified) and placed within a programmable induction furnace. The catalyst bed was sandwiched between two quartz wool layers, while the dead volumes before and after the catalyst bed were filled with quartz chips in order to minimize potential homogeneous reactions at higher temperatures. The reaction gases entered the system from compressed cylinders via mass flow controllers and left the reactor, being sent to the vent. A small amount of the gases leaving the reactor were sent to the mass spectrometer for analysis.
The TAP reactor system, invented by Professor John Gleaves, has been described in detail elsewhere [26]. Briefly, the apparatus consists of a catalytic micro-reactor, a gas delivery system for introduction of either high-speed gas pulses or a continuous flow of gas, a high-throughput, a high vacuum system and a computer-controlled quadrupole mass spectrometer. The micro-reactor is made from a stainless-steel tube whose diameter and length are 2 mm and 25 mm, respectively. Catalyst particles (about 0.005 g) are fixed in the reactor by stainless steel mesh. The reactor can be heated up to 1000 K by cartilage heaters. The two high-speed pulse valves can be operated at the interval up to 50 pulses per second. The minimum pulse width is 200 ms. Pulse intensities were varied between1013 and 1020 molecules per pulse. Before each experiment the catalyst was heated at 473 K for 30 min in vacuum to desorb pre-adsorbed species. The 150 to 250 pulses in the TAP experiments were averaged to increase the signal-to-noise ratio in the response. The pulse-to-pulse reproducibility of the system was good enough for averaging.
3. Results and Discussion
3.1. Characterization Results of Support
The structure, morphology and texture of the support and catalysts were assessed through low-angle XRD, SEM, TEM and physisorption measurements, respectively. Table 1 presents their physico-chemical properties.
Figure 1 shows the low angle powder XRD patterns of SBA-15. Three XRD peaks are observed at 2θ ~1 – 4º, which can be indexed as (100), (110), and (200) reflections of a well-ordered 2D hexagonal (p6mm) mesostructure possessing long-range order, with a quite large unit cell [24,25], namely a = 9.7 nm. (The unit cell parameter a is calculated from a = 2d100/√3, where the d-spacing values are calculated by nλ = 2d100 sin θ.) The obtained hexagonal mesostructured was expected as the volume fraction of the block copolymer, i.e., ΦP123 (%), in the mesostructured composite was in the range of 38-52% for H2O-P123 and 40-55% for SiO2-P123. Lamelar, hexagonal or cubic mesophases can be obtained by controlling the ΦP123 fraction [27]. However, it should be noted that SBA-15 cannot be regarded as an ideal hexagonal lattice of pores imbedded in a uniform matrix, as the structure of the silica walls is more complex. This can be easily assessed by calculating the dS/V number, where d is pore diameter, S is specific surface area and V is pore volume. For a material possessing an ideal hexagonal geometry this number should be equal to 4 [28,29]. By using the structural parameters displayed in Table 1, the value of 4.3 is obtained for the prepared SBA-5 sample, which is rather close to the theoretical value.
SEM image reveals that the calcined SBA-15 sample consists of many fiber (rope)-like domains (Figure 2). Each fiber seems to be formed by end-to-end aggregations of apparently wheat grain shaped SBA-15 particles (primary particles) of 0.5-1.0 μm in length and 0.5 μm in width. As such the surface energy of the hydrophilic ends due to hydroxyl groups is reduced and their growth is encouraged in the 001 plane.
TEM measurements confirm the highly well-ordered hexagonal network of rather straight cylindrical mesopores. As seen in Figure 3, SBA-15 shows a 2D hexagonal packed array of pores with long 1D channels (p6mm plane group) [30]. The channels are interconnected by small micropores. Thus, SBA-15 exhibits mainly mesoporous structure and possesses a small amount of micropores. The mesopore diameter estimated from TEM micrographs is between 6.3 and 6.5 nm; the distance between mesopores (interplanar distance), d100, is estimated to be ~ 8.5 nm, in good agreement with that determined from the XRD data, using Bragg’s law.
The N2 isotherms are of type IV with an H1 hysteresis loop, according to IUPAC classification, and present a steep capillary condensation step at medium relative pressure (P/P0 ~ 0.6), characteristic of high-quality open, nearly cylindrical large-pore SBA-15 mesoporous silica (see Figure 4). Three distinct regions can be discerned in the isotherm for SBA-15 sample: (1) monolayer–multilayer adsorption of nitrogen on the pore walls at low pressures, (2) a sudden steep increase of the adsorbed nitrogen at intermediate pressures due to the capillary condensation, and (3) multilayer adsorption on the external surface of the particles. The broad hysteresis loop of SBA-15 sample is caused by the presence of long mesopores connected by smaller micropores, thus hampering the filling and emptying of the accessible volume. The sharpness of the capillary condensation steps indicates uniformity of pore channels and their narrow pore size distribution. Indeed, the pore size distribution, defined as the pore volume increments per unit logarithm of pore diameter versus the logarithm of the corresponding pore diameters, was narrow although the SBA-15 sample shows, besides the main pores of 6.5 nm diameter, pore volume of 0.94 cm3/g, and BET surface area of 720 m2/g, the presence of smaller pores of about 3.9 nm diameters as well. The fact that there is some N2 adsorption at very low relative pressure evidences the presence of micropores. Along with the N2 adsorption measurements, mercury intrusion porosimetry measurements were performed, which evidenced the presence of intra- and inter-particles macropores, with relative narrow pore size distribution as well (in the range of 50 – 300 nm and 10 – 175 μm, respectively). Figure 5A shows the cumulative specific adsorbed and intrusion volumes plotted versus the logarithm of the pore diameter while Figure 5B presents the pore size distribution.
Using the XRD and BET measurements’ results, the thickness of the pore walls was calculated as 3.2 nm (thickness = a – pore diameter). With these rather thick pore walls, the prepared SBA-15 sample is expected to have good mechanical and thermal resistance during the impregnation and calcination of the catalyst samples and, as such, the well-ordered structure to be preserved.
3.2. Characterization Results of Catalysts
The well-ordered hexagonal structure was maintained by multi-step impregnation of nickel acetate into SBA-15 (results not shown). All samples displayed the three reflections: (100), (110) and (200), characteristic of the hexagonal array of mesochannels, although slightly shifted towards higher 2θ values as compared with the bare sample. The higher the loading, the higher the shift, and the higher the unit cell contraction. A possible interpretation of this result could be that some of the nickel was impregnated on the surface and not inside the silica framework. If this is the case, the volume of the pores for the catalyst’s samples should decrease as the loading is increased.
TEM/EDX revealed that the NiO wt% was 4.98 for the sample prepared through two impregnation cycles, while for the one with five impregnation cycles, the NiO wt% was 10.60. Therefore, the two samples were labelled as 5 % Ni and 11% Ni, respectively.
From the wide-angle XRD results over the two samples (not shown here), no peaks corresponding to crystalline nickel oxide can be identified, indicating either the samples were amorphous or, if crystalline, the nickel oxide clusters were very small (less than 3 nm) and beyond the detection limit.
The lack of crystallinity was also supported by the TeraHertz spectroscopy, performed both in ATR (Attenuated Total Reflectance) and Transmission modes, as shown in Figure 6. To the best of our knowledge, this was the first time that TeraHertz spectroscopy has been applied to catalysts characterization.
Clear type IV with H1 hysteresis loop nitrogen physisorption curves, similar to the one of SBA-15, were observed (results not shown). Although narrow pore size distributions were detected (see Figure 7 and Figure 8), the main mesopore size decreased to about 2.6 nm, while the mesopores volume decreased to about 0.74 cm3/g as the Ni loading was increased at 11 wt %. The measured BET surface area was 547 m2/g for the 5% Ni sample and 506 m2/g for the 11% Ni one (Table 1). The significant reduction in specific surface area, pore volume and size with increasing Ni loading implies some local blockage of the pore channel induced by depositing Ni species at the pore entrance or at the wall’s surface and/or partial structural degradation, which can take place under higher Ni loading. The structural degradation can be assessed by calculating the dS/V number and compare the value with the one obtained for SBA-15 above. For the 5% Ni sample, this number is 2.3, while for the 11% Ni sample is 1.8, clearly indicating that the structure suffered some degree of degradation if compare with SBA-15, for which the dS/V number is 4.3. If the impregnation led to the inclusion of nickel species in the wall by isomorphous substitution of silicon (Si4+ ion radius, 0.41 Å, Ni2+ ion radius, 0.69 Å), instead of unit cell contraction, an expansion would be observed. As the Hg-intrusion results show (Figure 7 and Figure 8), there is a slight decrease in the macropores’ diameter as well, especially for those in the region of 50 – 300 nm, and a broader size distribution, especially for macropores with diameter in the 10 – 175 μm region. These changes are caused, in our opinion, by the deposition of nickel within the intra-particle voids as well.
TEM measurements over the two Ni samples (Figure 9) confirmed that the highly ordered mesoporous structure was maintained after the impregnation process and that the nickel species were uniformly distributed over the support, as XRD results have already revealed. Figure 9 shows the TEM micrograph of a selected area on the sample 5% Ni (A) and the chemical mapping of the same area (B, C, D). The TEM micrograph reveals that most of the nickel is located inside the pores. However, small amount of nickel is present on the external surface. This means that the Ni oxide particles are larger than the diameter of the SBA-15 mesopore. TEM images for the 11% Ni sample were similar (not shown).
To further confirm the good dispersion of nickel oxide over the SBA-15 support, XPS measurements were performed for the two catalyst’s samples. Because of the high porosity of SBA-15, depth with XPS is in the order of 5-10 nanometers (equivalent to 2-4 cylindrical pores). Figure 10 shows the XPS spectra for the Ni 2p region of the two as-synthetized samples along with the spectra of the 5% Ni pre-reduced one. The main Ni peaks in the fresh samples are the Ni 2p3/2 peak at 856.1 eV, and the Ni 2p1/2 at 874.5 eV, as well as their corresponding shake-up resonances at 863.1 and 880.2 eV. These peaks are assigned to oxidized nickel in a disperse phase [31]. From the XPS analysis, the atomic Ni/Si surface ratio was 0.13 for the 5% Ni sample and 0.17 for the 11% Ni one. From the EDX analysis, the atomic Ni/Si bulk ratio was 0.06 and 0.08, respectively. These results confirmed again the well dispersion of nickel species for both loadings, as the Ni/Si (surface) to Ni/Si (bulk) ratio is higher than 1. What is more, the XPS data obtained over the pre-reduced samples confirmed that the dispersion was not significantly altered by reduction; the Ni/Si ratio was 0.09 for the 5% Ni sample and 0.13 for the 11 % Ni one.
Trying to comprehend even better the excellent dispersion of the nickel species over the support, we also looked at the influence of the impregnation and drying conditions on the metal distribution. It is generally understood that it is possible to control the structure, shape and metal content when preparing heterogeneous catalysts by dry and wet impregnation. There are four main categories of metal profiles obtained by impregnation of the active phase into supports: uniform, egg-yolk, egg-shell and egg-white. The choice of optimal metal profile in the support is determined by the required activity and selectivity, and by other characteristics of the chemical reactions (kinetics, mass transfer) [32].
For the dry reforming of methane application, we were interested on a uniform metal profile, as this profile proved to confer high activity and thermal stability of the catalyst. The ratio of the bulk solvent volume to the support volume has a significant effect on the metal distribution during the impregnation process, and this effect is more pronounced for wet impregnation than for dry support impregnation. But at the same time, this effect can be controlled and optimized, by controlling the volume of the solvent. Therefore, the wet impregnation method was used in this study. Preliminary experiments concluded that using a bulk solvent volume: support volume ratio of 10-15:1 would result on a uniform metal profile. Consequently, a 13:1 ratio was used for this study. The precursor plays an important role as well on the active phase dispersion. We choose nickel acetate as precursor because it was found that acetate has a stronger interaction with the support
The concentration profile of the impregnated compound also depends on the mass transfer conditions within the support’s pores during impregnation and drying. With this in mind our choice for the SBA-15 as support was obvious. Using an optimised method, SBA-15 with high internal surface area and high thermal stability was prepared, as described below. Vacuum drying was chosen to avoid the collapse of the well-ordered mesoporous structure. In the case of mesoporous SBA-15, the impregnation solution should be easily sucked up by the mesoporous channels and generally fill the pores quickly, due to the capillary pressure [33]. However, as we expected that the SBA-15 support could lose some of its hydrophilicity by calcination, resulting in relatively low hydroxyl density, causing the incomplete wetting and thus, leading to inhomogeneous filling of pores during impregnation, the calcined SBA-15 sample was rehydrated in boiling water for 2 h.
The activity and selectivity towards the dry reforming of methane reaction of the two nickel samples was tested via temperature programmed reaction (TPRx), with CH4:CO2 = 1.5:1 mixtures. As shown in Figure 11 A and B for the 5% Ni sample and Figure 12 A and B for the 11% Ni one, both fresh (as-synthesised) and pre-reduced catalyst’s samples proved to be very active.
However, for both loadings, the pre-reduced samples were more active than the fresh ones. As for example, for the 5% Ni loading, the pre-reduced sample starts to produce H2 and CO at 480 ºC, while the fresh one must exceed 600 ºC to start to convert the reactants. While for the pre-reduced sample almost complete CO2 conversion was obtained around 680 ºC, for the fresh one, only 75% CO2 conversion was obtained at this temperature. A slightly improved catalytic activity was observed for both 11% loading samples. The fresh 11% Ni sample starts to convert the reactants around 580 ºC, while for the pre-reduced sample, the reaction was initiated at temperature as low as 380 ºC with complete CO2 conversion at the same temperature as that for the 5% Ni pre-reduced sample, i.e., 680 ºC. The CO2 conversion over the fresh sample at 680 ºC was the same as for the fresh 5% Ni sample. Therefore, the only difference in activity between the two catalysts was in terms of their initial activity. The 11% Ni pre-reduced sample was slightly more active as it starts to convert the reactants at 380 ºC, about 100 ºC less than the 5% Ni pre-reduced one. Obviously, by increasing the Ni loading, the number of active sites increased, which explains the earlier start of the reaction over the 11% Ni pre-reduced sample. However, as the maximum performance was obtained at the same temperature for both pre-reduced samples, one can conclude that the active species/sites were the same for both loadings.
A more careful analysis of the TPRx data (Figure 11 and Figure 12) revealed that while CH4 and CO2 are not adsorbed on the fresh catalysts at temperatures lower than the starting reaction temperatures, for the pre-reduced samples, some adsorption (about 5 mol% of both, CH4 and CO2) is noticed as the samples are heated up.
These results were confirmed by the TAP measurements as well. As previously reported [34], over the fresh 5% Ni sample, both CH4 and CO2 were only weakly and reversible adsorbed at temperatures lower than 600 ºC. Additional TAP measurements were performed over the pre-reduced 5% Ni sample while single pulses of a CH4:CO2 = 1.5:1 mixture were sent over the catalyst, at temperatures varying between room temperature and 600 ºC. The results are presented in Figure 13 A, B and C, respectively. It seems that CO2 is physically adsorbed at low temperatures and slightly chemisorbed at high temperatures, while CH4 is only slightly chemisorbed at high temperatures. At 600 °C, a broader peak CO2 response was observed suggesting that the CO2 interaction with catalysts was stronger than the CH4 one.
As the TPRx data revealed, both catalyst’s samples are very active. The well dispersion of the nickel species over the support was, in our opinion, responsible for their very high activity. To the best of our knowledge, no Ni-based catalysts with almost complete CO2 conversion at temperatures lower than 800 ºC were reported so far. Although Ni/SBA-15 catalysts have been already reported [29,35], their catalytic activity towards DRM reaction was much lower than that of the samples of this study. As for example, the CO2 conversion at 700 ºC was between 68% and 75%, as the Ni loading was increased from 2.5% to 20%. For a 5% Ni/SBA-15 catalyst, prepared by wet impregnation method (same as the one used in this study) but using nickel nitrate as Ni precursor, the reported CO2 conversion at 700 °C is 65% [36]. It is clear evidenced the effect of the Ni precursor. And, as mentioned above, the nature of the precursor is one of the factors responsible for the Ni dispersion. To understand why and how the Ni dispersion is affected by the nature of the precursor, we took a deeper look at the drying process during catalyst’s preparation.
In accordance with literature data [33], the physical picture of drying can be described as follows: as drying proceeds, the solution of the precursor with low surface tension could diffuse deeply at first and be transported toward the internal surface of the mesoporous channels via capillary forces; towards the end of drying, the enhanced viscosity could lead to a strong interaction with the internal surface of the support and inhibit the redistribution of the impregnation solution during drying, thus favouring a uniform distribution of the active component in the mesoporous channels. In contrast, the solution of the precursor with higher surface tension has a weak interaction with the support, and the concentrated solvent sucked up by the mesoporous pores could be back diffused by higher surface tension and migrate toward the external surface of the mesoporous channels, resulting in a concentration build-up on the external rim of the support. As a consequence, inhomogeneous distributions of the precursor appeared. Knowing that the surface tension of acetic acid is lower than that of nitric acid, i.e., 0.028 N/m compared to 0.04115 N/m at 20 °C [37,38] our choice of nickel acetate tetrahydrate as Ni precursor was obvious and homogeneous impregnation was obtained as expected.
Although the prepared catalyst’s samples proved to be very active at low temperatures, there was another challenge to address. As seen in Figure 11 and Figure 12, the amount of hydrogen produced was almost double than the amount of carbon dioxide. This means that besides the main reaction, the catalysts favoured the methane decomposition as well, which, unfortunately might have led to the carbon deposition over the surface, and in time, to the deactivation of catalyst (not seen in the above figures). On the other hand, small amounts of water were noticed as well. This can be ascribed to the simultaneous occurrence of the reverse water-gas shift reaction. To support these assumptions, temperature programmed CH4 decomposition (reduction) (Figure 14A and Figure 15A) followed by temperature programmed oxidation (TPO) (Figures 14B and 15B) measurements were also performed on both fresh samples. For both samples, the methane activation reaches its maximum at 580 ºC. The TPO measurements showed that for both samples, three CO2 peaks are present, meaning that three carbon species were formed during methane decomposition. Along with carbon dioxide some carbon monoxide was formed and almost constant, though higher for the 5% Ni sample, amount of water was also released. The formation of CO indicates that the carbon species, formed by the dissociation of CH4, react rapidly with oxygen species from the catalyst. This is another evidence that the presence of carbonaceous species will not contribute to the catalyst’s deactivation.
The three surface carbon species, labelled as Cα, Cβ and Cγ, respectively, showed various mobility, thermal stability, and reactivity [36]. The peaks’ temperatures were the same for both Ni loadings, i.e., 280, 400 and 580 °C, respectively. The distribution and features of these carbonaceous species sensitively depend on the nature of the transition metals and the conditions of methane adsorption. These carbonaceous species can be described as: completely dehydrogenated carbidic Cα type, partially dehydrogenated CHx (1 ≤ x ≤3) species, namely Cβ type, and carbidic clusters Cγ type (formed by the agglomeration and conversion of Cα and Cβ species under certain conditions). Their reactivity was assessed by performing TPSR with hydrogen [35]. Similar results with those obtained from TPO measurements of this study were obtained. A fraction of the surface carbon species, which might be assigned to carbidic Cα (~188 °C), were mainly hydrogenated to methane at temperatures even below 227 °C. This showed that carbidic Cα species are rather active and thermally unstable on the nickel surface. The carbidic Cα species were suggested to be responsible for CO formation. A significant number of surface carbon species were hydrogenated to methane below 327 °C and were assigned to partially dehydrogenated Cβ species. Most of the surface carbon was hydrogenated above 527 °C and was attributed to carbidic clusters Cγ [39].
As all those three carbonaceous species were rather active, being converted to carbon dioxide at temperatures lower than the starting temperature of CO2 reforming, one can assume that they will not contribute to the catalyst deactivation. To support this statement, post-reaction temperature-programmed oxidation (TPO) experiments were carried out by exposing the spent catalysts to 5% oxygen in helium flow in order to determine the amount of carbon formed during the DRM reaction, run for 200 min at 600 °C. No CO2 peaks were observed for either of the samples. In addition, in this TPO experiment, there was no signal for water which was in line with previous work [40]. What is more, a transient study on the dry reforming of methane showed that when both reactants are fed contemporaneously the presence of CHX species promotes the CO2 activation that is responsible for the reforming reaction [41]. Our understanding is that the uniform distribution of the metal component throughout the oxide support with high surface area helped to reduce coking by physically separating carbon species formed on the nickel surface. That is, carbon species must be formed if the main reaction is to proceed, but prevention of polymerization by separating the carbon species should reduce coking while leaving the main reaction unaffected [42].
4. Conclusions
Two highly ordered Ni-based catalysts samples have been prepared, their physical properties assessed, and their catalytic activity was tested towards the reforming of methane with carbon dioxide, in their as-synthesised and as pre-reduced form. The two Ni catalysts samples, namely 5% Ni and 11% Ni, respectively, supported on the sol-gel made SBA-15 mesoporous silica, using an optimised preparation method and nickel acetate tetrahydrate as Ni precursor, have showed high and almost identical catalytic activity for CO2 reforming of methane to synthesis gas, with the 11% Ni sample having a slightly improved activity. Significant catalytic activity can be obtained at temperatures as low as 450 °C. The catalysts in their pre-reduced respectively forms have showed a higher activity compared to the as-synthesised (fresh) ones.
Along with the high activity, the two catalyst samples proved to have high coking resistivity. Their outstanding performance and coking resistivity have been found to be greatly related to the very small size of Ni particles and their high dispersion over the high BET surface area support.
Due to their high coking resistivity and complete CO2 conversion at temperatures lower than their deactivation temperature and for CH4:CO2 ratio closer to the one in biogas, i.e., 1.5:1, these catalysts are suitable for the scaling-up to a sustainable DRM commercial technology, with high impact at economic, environmental and societal level.
Acknowledgements
We thank Dr. David Reece for the TeraHertz spectroscopy measurements, Dr. David Lundie from Hiden Analytical for some preliminary Catlab measuremenst, Dr. Nouria Fatah for Mercury porosimetry and Dr. Wei Wang for useful discussions regarding the preparation of mesoporous materials.
References
- M. C.J. Bradford and M.A. Vannice. Catalytic reforming of methane with carbon dioxide over nickel catalysts I. Catalyst characterization and activity. Appl. Catal. A, 1996, 142, 73–96. [Google Scholar] [CrossRef]
- A. N.J. van Keulen, K. Seshan, J.H.B.J. Hoebink and J.R.H. Ross. TAP Investigations of the CO2Reforming of CH4over Pt/ZrO2. J. Catal., 1997, 166, 306–314. [Google Scholar] [CrossRef]
- S. Chytil, L. Haugland and E.A. Blekkan. On the mechanical stability of mesoporous silica SBA-15. Microporous Mesoporous Mater., 2008, 111, 134–142. [Google Scholar] [CrossRef]
- R. Wang, H. Xu, X. Liu, Q. Ge and W. Li. Role of redox couples of Rh0/Rhδ+ and Ce4+/Ce3+ in CH4/CO2 reforming over Rh–CeO2/Al2O3 catalyst. Appl. Catal. A, 2006, 305, 204–210. [Google Scholar] [CrossRef]
- B. Nematollahi, M. Rezaei and M. Khajenoori. Combined dry reforming and partial oxidation of methane to synthesis gas on noble metal catalysts. Int. J. Hydrogen Energy, 2011, 36, 2969–2978. [Google Scholar] [CrossRef]
- K. Tao, Y. Zhang, S. Terao, N. Tsubaki. Development of platinum-based bimodal pore catalyst for CO2 reforming of CH4. Catal. Today, 2010, 153, 150–155. [Google Scholar] [CrossRef]
- K. Tao, Y. Zhang, S. Terao, Y. Yoneyama, T. Kawabata, K. Matsuda, S. Ikeno and N. Tsubaki. Chemical and spatial promotional effects of bimodal pore catalysts for methane dry reforming. Chem. Eng. J., 2011, 170, 258–263. [Google Scholar] [CrossRef]
- Y. -X.Pan, C. –J. Liu and P. Shi. Preparation and characterization of coke resistant Ni/SiO2 catalyst for carbon dioxide reforming of methane. J. Power Sources, 2008, 176, 46–53. [Google Scholar] [CrossRef]
- S. A. Al-Fatish, A. A. Ibrahim, A. H. Fakeeha, M. A. Soliman, M.R.H. Siddiqui and A. E. Abasaeed. Coke formation during CO2 reforming of CH4 over alumina-supported nickel catalysts. Appl. Catal. A, 2009, 364, 150–155. [Google Scholar] [CrossRef]
- L. Tian, X. Zhao, B.S. Liu and W. Zhang. Preparation of an Industrial Ni-Based Catalyst and Investigation on CH4/CO2 Reforming to Syngas. Energy Fuels, 2009, 23, 607–612. [Google Scholar] [CrossRef]
- I. Rivas, J. Alvarez, E. Pietri, M.J. Pérez-Zurita and M.R. Goldwasser. Perovskite-type oxides in methane dry reforming: Effect of their incorporation into a mesoporous SBA-15 silica-host. Catal. Today, 2010, 149, 388–393. [Google Scholar] [CrossRef]
- J. Xu, W. Zhou, Z. Li, J. Wang and J. Ma. Biogas reforming for hydrogen production over a Ni–Co bimetallic catalyst: Effect of operating conditions. Int. J. Hydrogen Energy, 2010, 35, 13013–13020. [Google Scholar] [CrossRef]
- T. Huang, W. Huang, J. Huang and P. Ji. Methane reforming reaction with carbon dioxide over SBA-15 supported Ni–Mo bimetallic catalysts. Fuel Process. Technol., 2011, 92, 1868–1875. [Google Scholar] [CrossRef]
- S.Y. Foo, C.K. Cheng, T-H. Nguyen and A.A. Adesina. Kinetic study of methane CO2 reforming on Co–Ni/Al2O3 and Ce–Co–Ni/Al2O3 catalysts. Catal. Today, 2011, 164, 221–226.
- N. Wang, W. Chu, T. Zhang and X.S. Zhao. Synthesis, characterization and catalytic performances of Ce-SBA-15 supported nickel catalysts for methane dry reforming to hydrogen and syngas. Int. J. Hydrogen Energy, 2012, 37, 19–30. [Google Scholar] [CrossRef]
- X. Li, Q. Hu, Y. Yang, Y. Wang and F. He. Studies on stability and coking resistance of Ni/BaTiO3–Al2O3 catalysts for lower temperature dry reforming of methane (LTDRM). Appl. Catal. A, 2012, 413–414, 163-169. [CrossRef]
- C. H. Bartholomew. Mechanisms of catalyst deactivation. Appl. Catal. A, 2001, 212, 17–60. [Google Scholar] [CrossRef]
- Y. Matsumura and T. Nakamori. Steam reforming of methane over nickel catalysts at low reaction temperature. Appl. Catal. A, 2004, 258, 107–114. [Google Scholar] [CrossRef]
- Y. Cai et all. Recent advances in Ni-based catalysts for CH4-CO2 reforming (2013-2023). Atmosphere, 2023, 14(9), 1323. [CrossRef]
- K. Y. Koo, H.-S. Roh, Y.T. Seo, D.J. Seo, W.L. Yoon and S. Bin Park. A highly effective and stable nano-sized Ni/MgO–Al2O3 catalyst for gas to liquids (GTL) process. Int. J. Hydrogen Energy, 2008, 33, 2036–2043. [Google Scholar] [CrossRef]
- M. C.J. Bradford and M.A. Vannice. CO2 Reforming of CH4. Catal. Rev. Sci. Eng., 1999, 41, 1–42. [Google Scholar] [CrossRef]
- S. Zhang, J. Wang, H. Liu and X. Wang. One-pot synthesis of Ni-nanoparticle-embedded mesoporous titania/silica catalyst and its application for CO2-reforming of methane. Catal. Commun., 2008, 9, 995–1000. [Google Scholar] [CrossRef]
- M-N. Kaydouh, N. El Hassan, A. Davidson, S.Casale, H. El Zakhem and P. Massiani. Effect of the order of Ni and Ce addition in SBA-15 on the activity in dry reforming of methane. C.R. Chimie, 2015, 18, 293-301. [CrossRef]
- D. Zhao, Q. Huo, J. Feng, B. F. Chmelka and G. D. Stucky. Nonionic Triblock and Star Diblock Copolymer and Oligomeric Surfactant Syntheses of Highly Ordered, Hydrothermally Stable, Mesoporous Silica Structures. J. Am. Chem. Soc., 1998, 120, 6024-6036.
- D. Zhao, J. Feng, Q. Huo, N. Melosh, G. H. Fredrickson, B. F. Chmelka and G. D. Stucky. Triblock Copolymer Syntheses of Mesoporous Silica with Periodic 50 to 300 Angstrom Pores. Science, 1998, 279, 548-552. [CrossRef]
- M. Olea, M. Kunitake, T. Shido, K. Asakura and Y. Iwasawa. Temporal Analysis of Products (TAP) Study of the Adsorption of CO, O2, and CO2 on a Au/Ti(OH)4* Catalyst. Bull. Chem. Soc. Jpn., 2001, 74, 255-265. [CrossRef]
- P. Holmqvist, P. Alexandridis and B. Lindman. Modification of the Microstructure in Block Copolymer−Water−“Oil” Systems by Varying the Copolymer Composition and the “Oil” Type: Small-Angle X-ray Scattering and Deuterium-NMR Investigation. J. Phys. Chem. B, 1998, 102, 1149-1158.
- D. Eliche-Quesada, J. Merida-Robles, P. Maireles-Torres, E. Rodriguez-Castellon and A. Jimenez-Lopez. Hydrogenation and Ring Opening of Tetralin on Supported Nickel Zirconium-Doped Mesoporous Silica Catalysts. Influence of the Nickel Precursor. Langmuir, 2003, 19, 4985–4991. [Google Scholar] [CrossRef]
- M. Zhang, S. Ji, L. Hu, F. Yin, C. Li and H. Liu. Structural Characterization of Highly Stable Ni/SBA-15 Catalyst and Its Catalytic Performance for Methane Reforming with CO2. Chinese J. Catal., 2006, 27, 777-781. [CrossRef]
- F. Zhang, Y. Yan, H.Yang, Y. Meng, C. Yu, B. Tu and D. Zhao. Understanding Effect of Wall Structure on the Hydrothermal Stability of Mesostructured Silica SBA-15. J. Phys. Chem. B, 2005, 109, 8723–8732. [Google Scholar] [CrossRef] [PubMed]
- K. S. Kim and R.E. Davis. Electron spectroscopy of the nickel-oxygen system. J. Electron Spectrosc. Relat. Phenom., 1972, 1, 251–258. [Google Scholar] [CrossRef]
- X. Liu, J.G. Khinast and B.J. Glasser. A parametric investigation of impregnation and drying of supported catalysts. Chem. Eng. Sci., 2008, 63, 4517-4530. [CrossRef]
- P. Munnik, P. E. de Jongh and K. P. de Jong. Recent Developments in the Synthesis of Supported Catalysts. Chem. Rev., 2015, 115, 6687–6718. [Google Scholar] [CrossRef]
- M. Olea, S. Hodgson, T. Sasaki, N. Aoki and K. Mae. TAP (TEMPORAL ANALYSIS OF PRODUCTS) STUDIES OF THE CATALYTIC CONVERSION OF BIOGAS TO SYNGAS OVER NI/SIO2 CATALYSTS. Chemical Engineering Transactions, 2009, 17, 7-12.
- H.D. Setiabudia, K.H. Lima, N. Ainirazalia, S.Y. China and N.H.N. Kamarudin, JMES, 2017, 8, 573-581.
- D. Liu, X-Y Quek, H.H.A. Wah, G. Zeng, Y. Li and Y. Yang. Carbon dioxide reforming of methane over nickel-grafted SBA-15 and MCM-41 catalysts. Catal. Today, 2009, 148, 243-250.
- Gerhartz, W. (exec ed.). Ullmann’s Encyclopedia of Industrial Chemistry. 5th ed.Vol A1: Deerfield Beach, FL: VCH Publishers, 1985 to Present., p. VA17: 294 (1991).
- http://www.engineeringtoolbox.com/surface-tension-d_962.html, accessed on the 23rd of July 2025.
- L. Qian and Z. Yan. Mechanistic Study of Carbon Dioxide Reforming with Methane over Supported Nickel Catalysts. J. Natural Gas Chem., 2002, 11, 151–158. [Google Scholar] [CrossRef]
- D. Liu, R. Lau, A. Borgna and Y.Yang. Carbon dioxide reforming of methane to synthesis gas over Ni-MCM-41 catalysts. Appl. Catal. A: General, 2008, 358,110-118. [CrossRef]
- M. García-Dieguéz, I.S. Pieta, M.C. Herrera, M.A. Larrubia, I. Malpartida and L.J. Alemany. Transient study of the dry reforming of methane over Pt supported on different γ-Al2O3. Catal. Today, 2010, 149, 380–387. [CrossRef]
- D. J. Suh, T.-J. Park, J.-H. Kim and K-L. Kim. Nickel–alumina aerogel catalysts prepared by fast sol–gel synthesis. J. Non-Cryst. Solids, 1998, 225, 168–172.
Figure 1.
Low-angle XRD patterns of SBA-15.
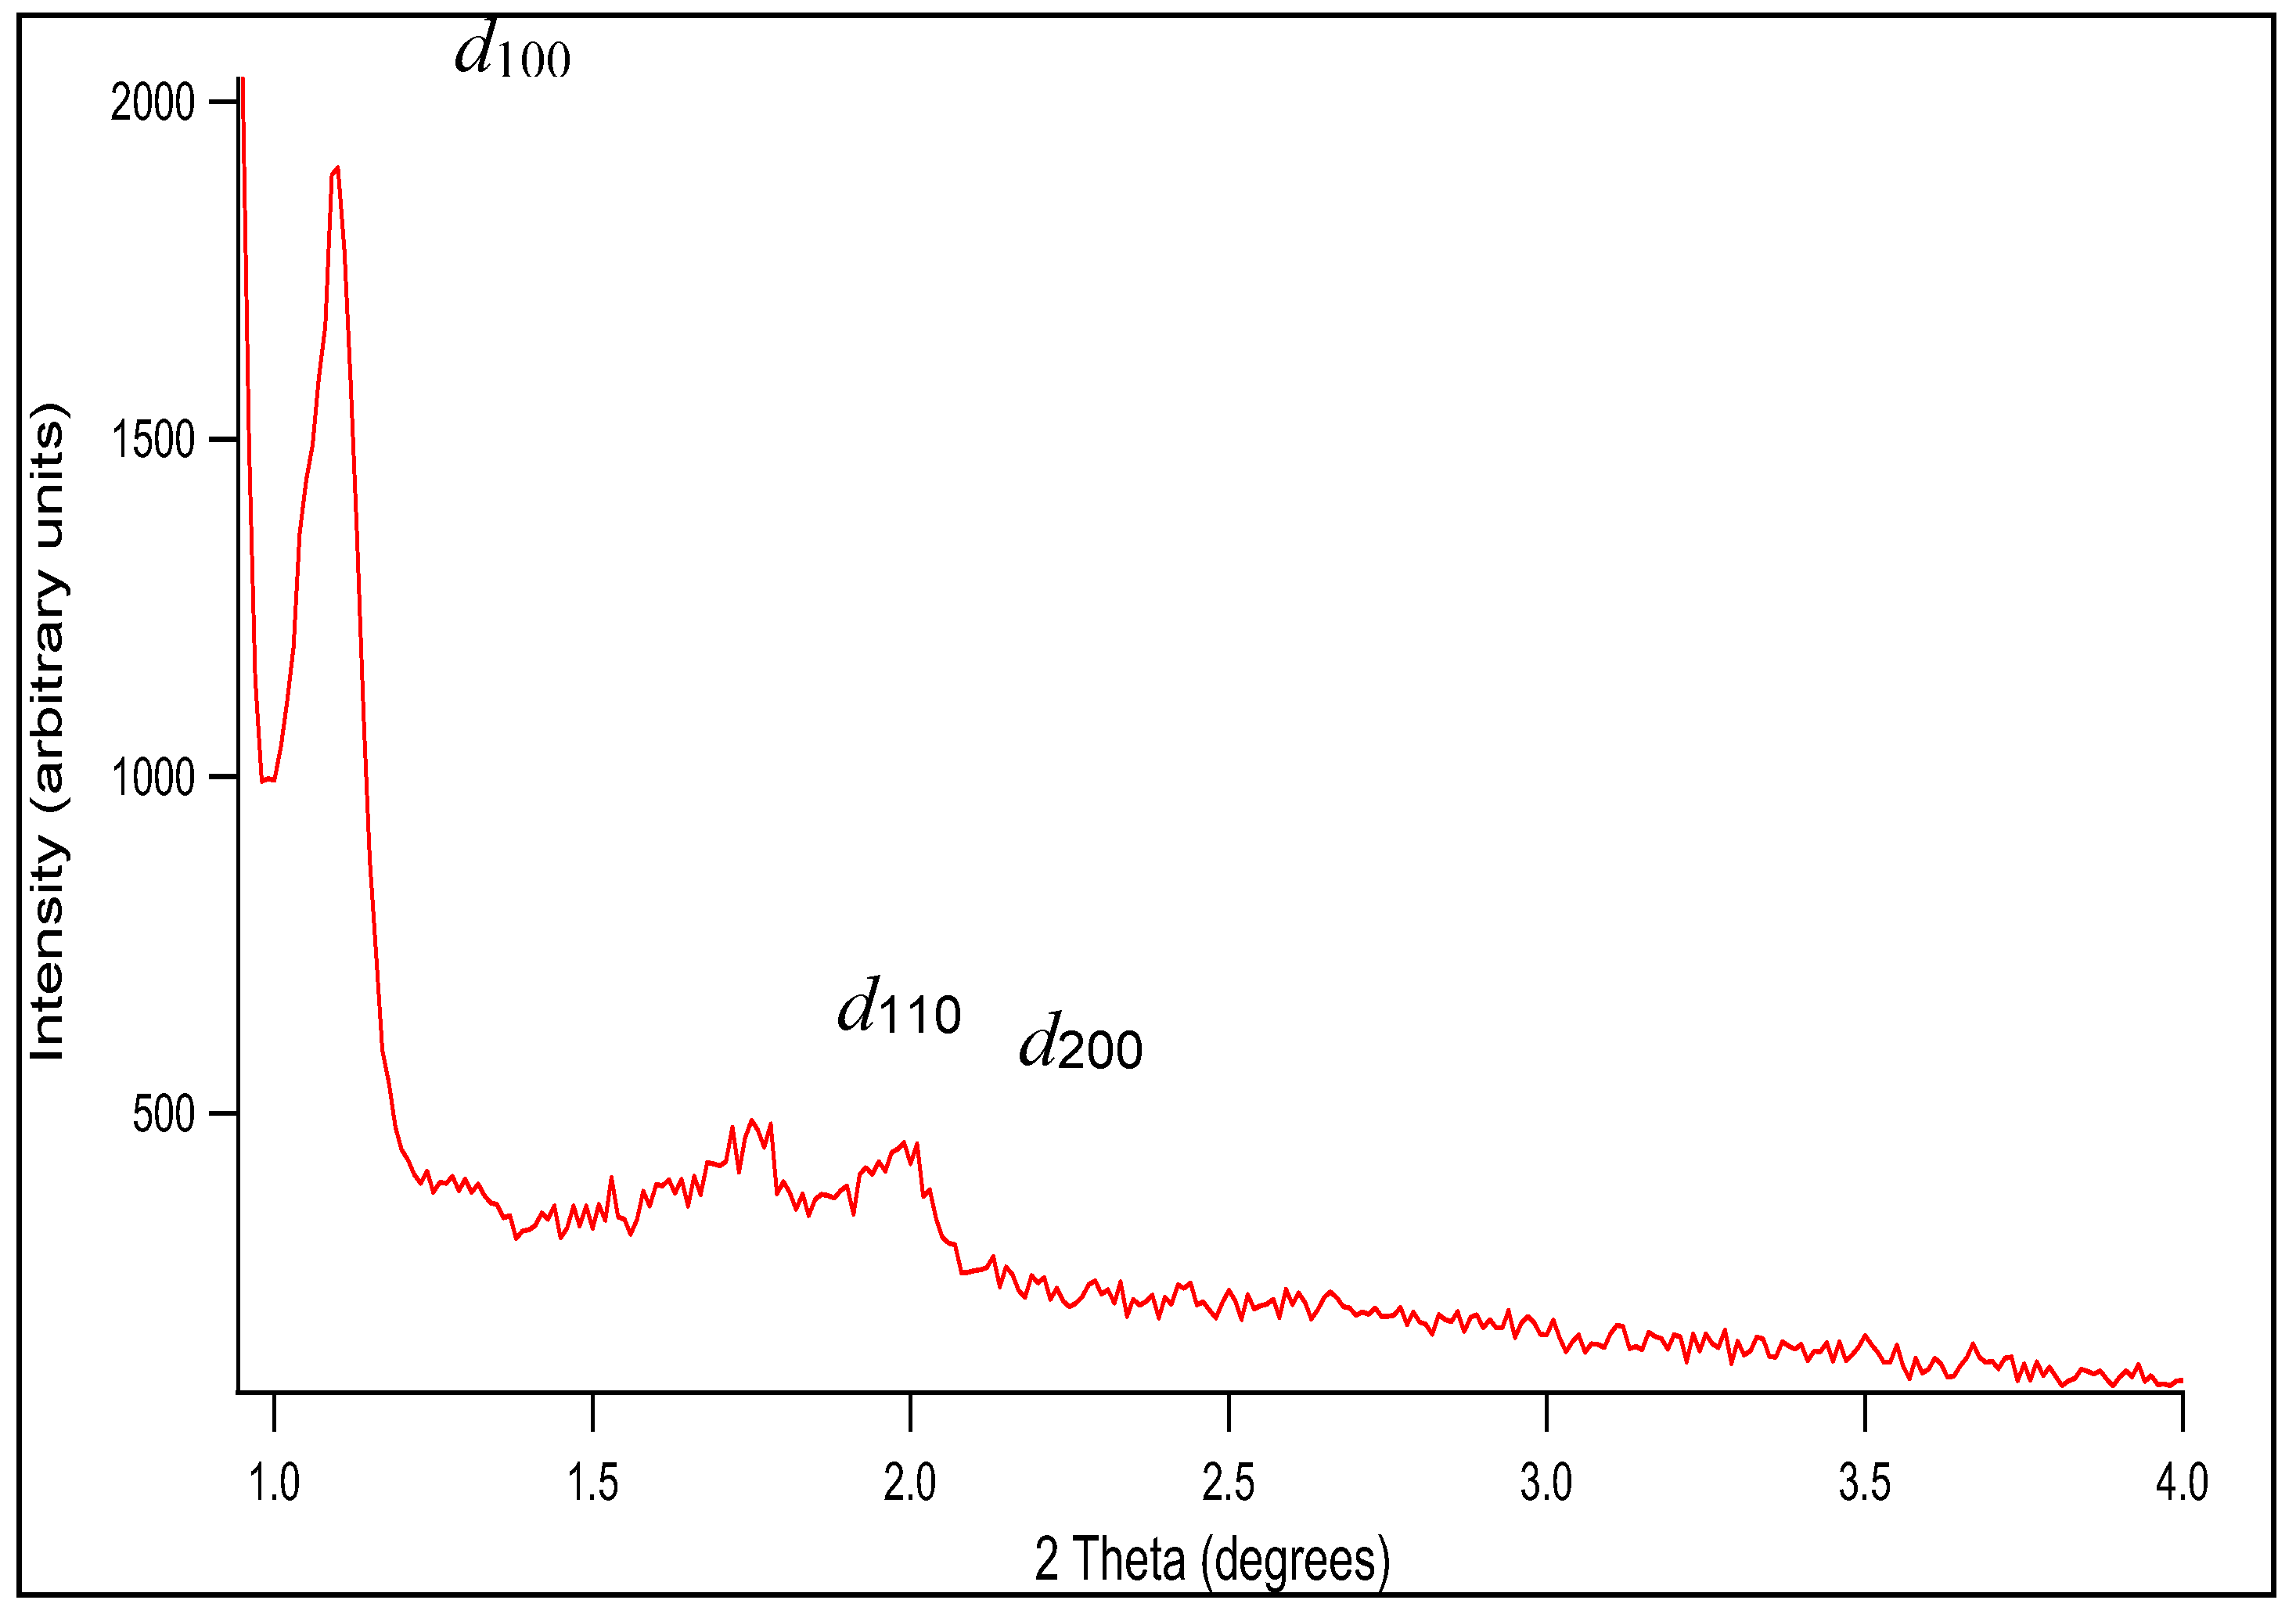
Figure 2.
SEM image of SBA-15.
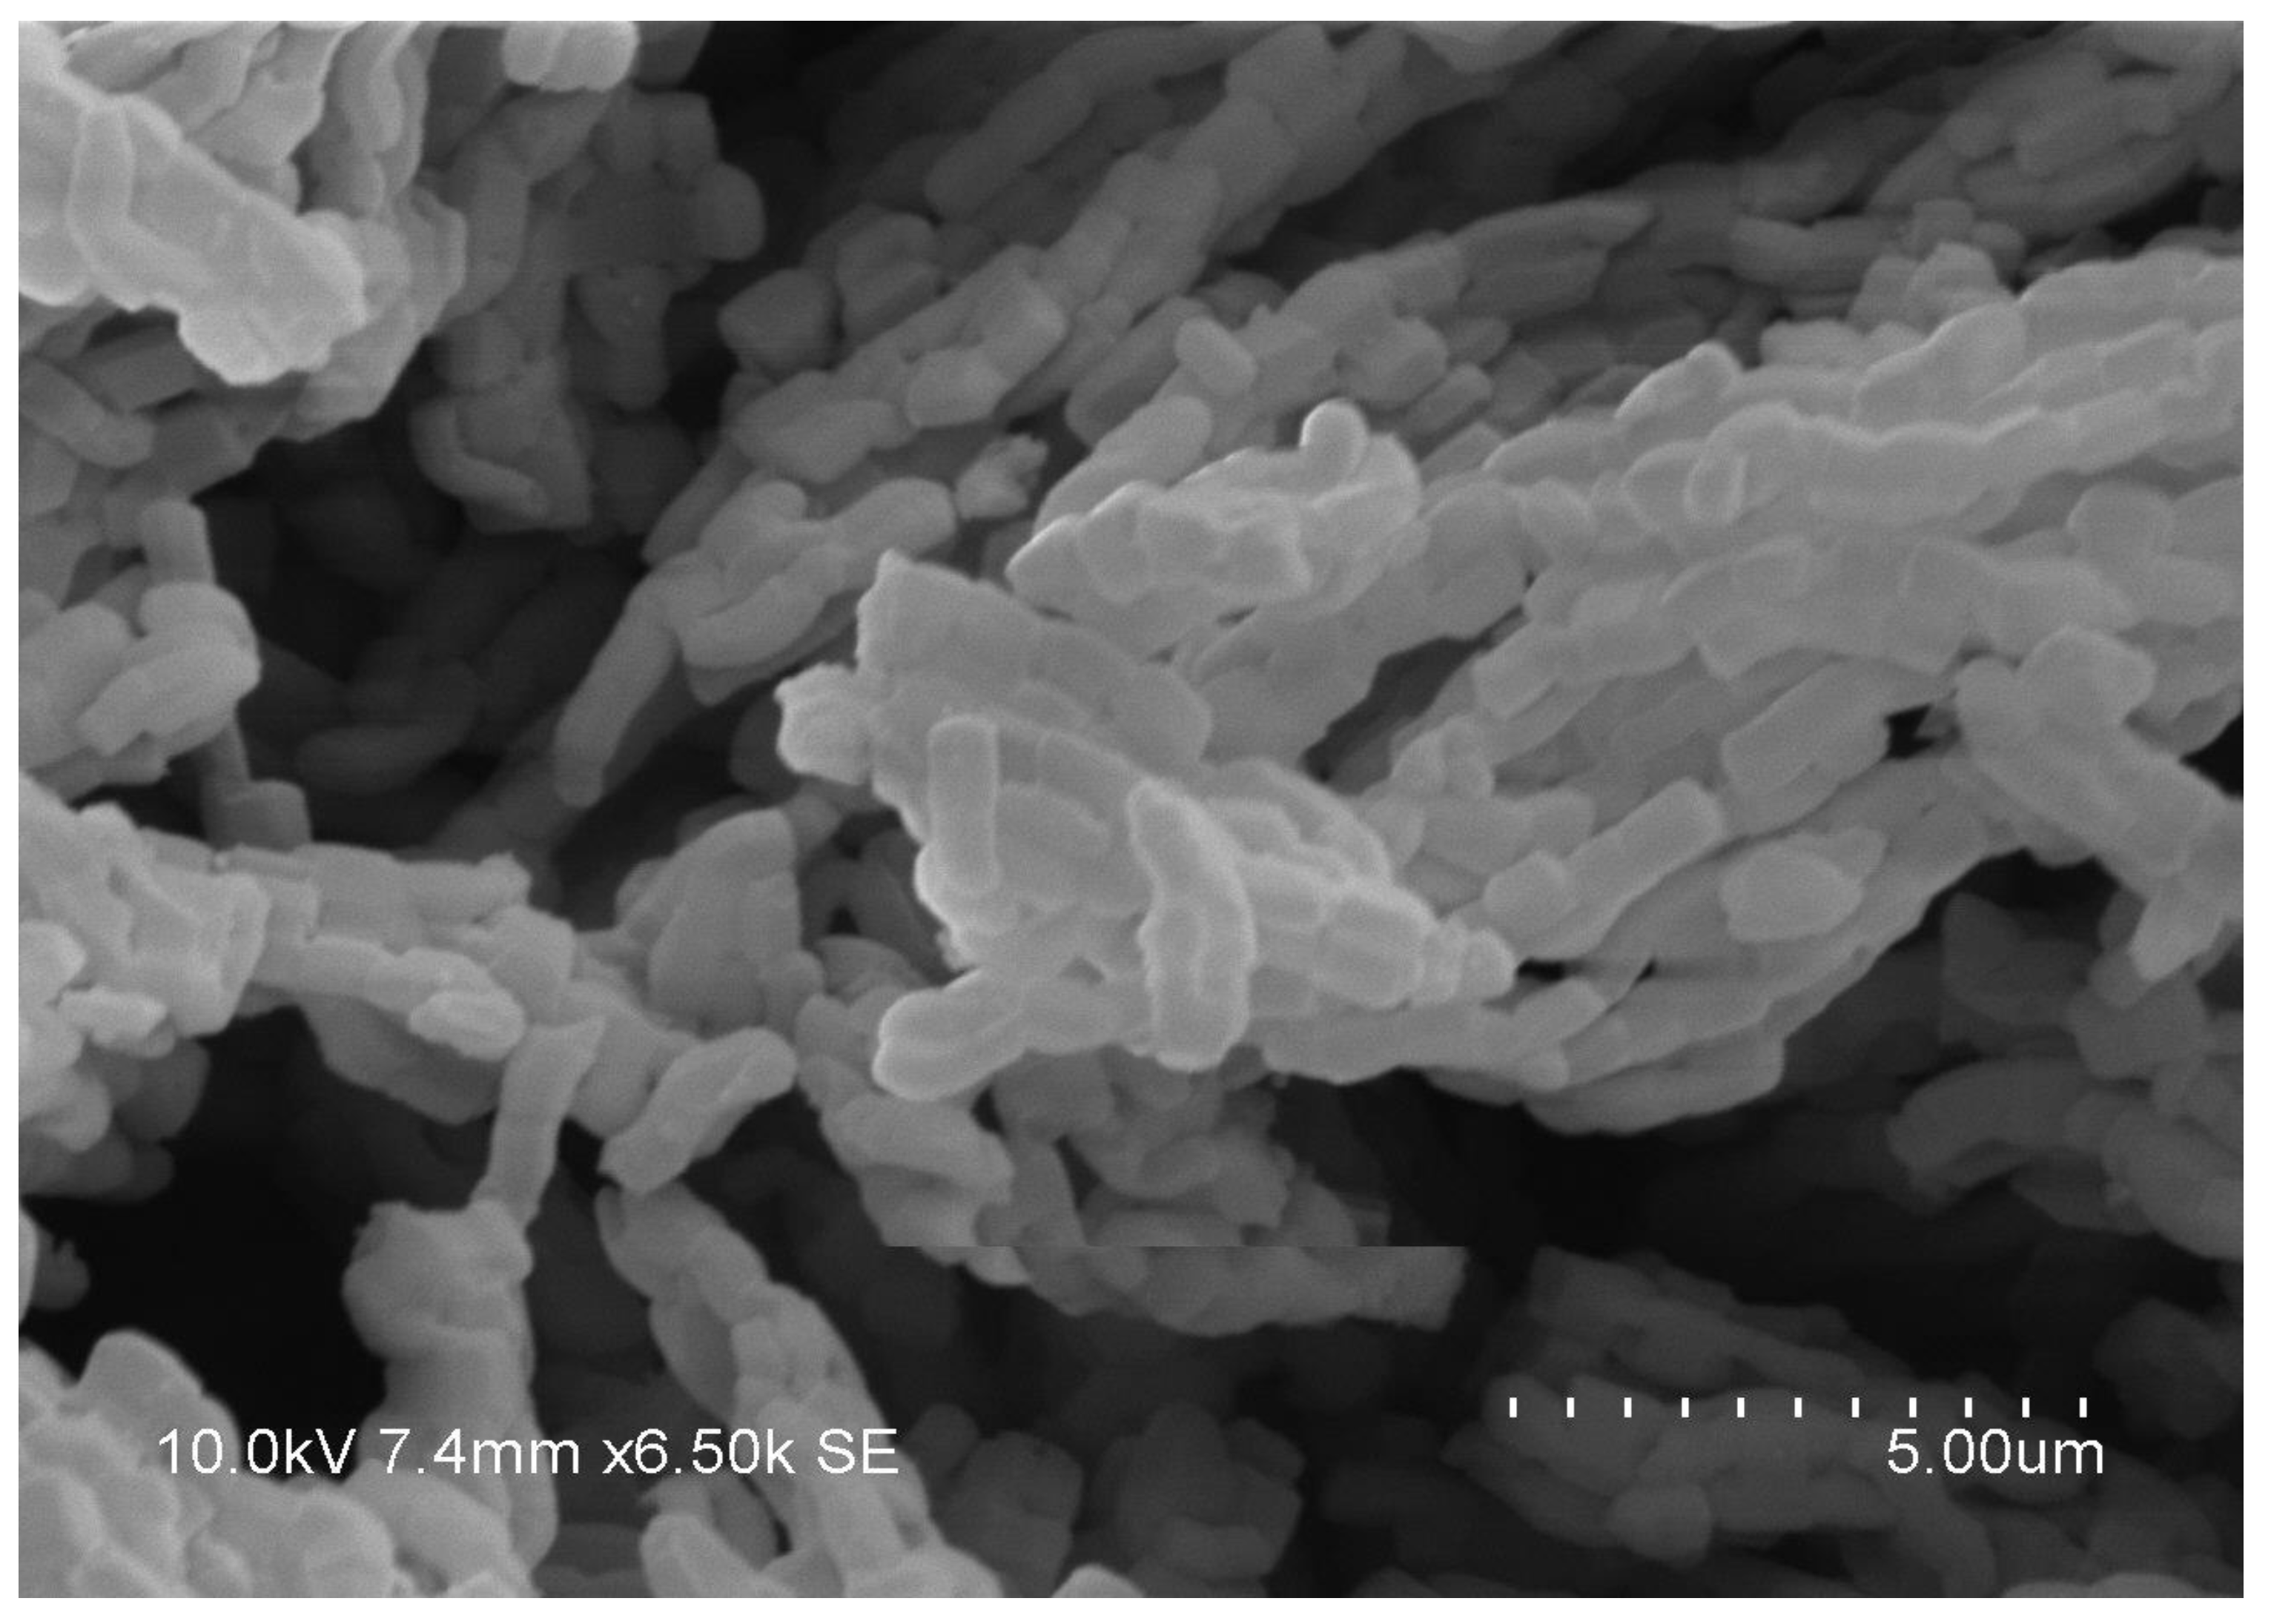
Figure 3.
TEM image of SBA-15.
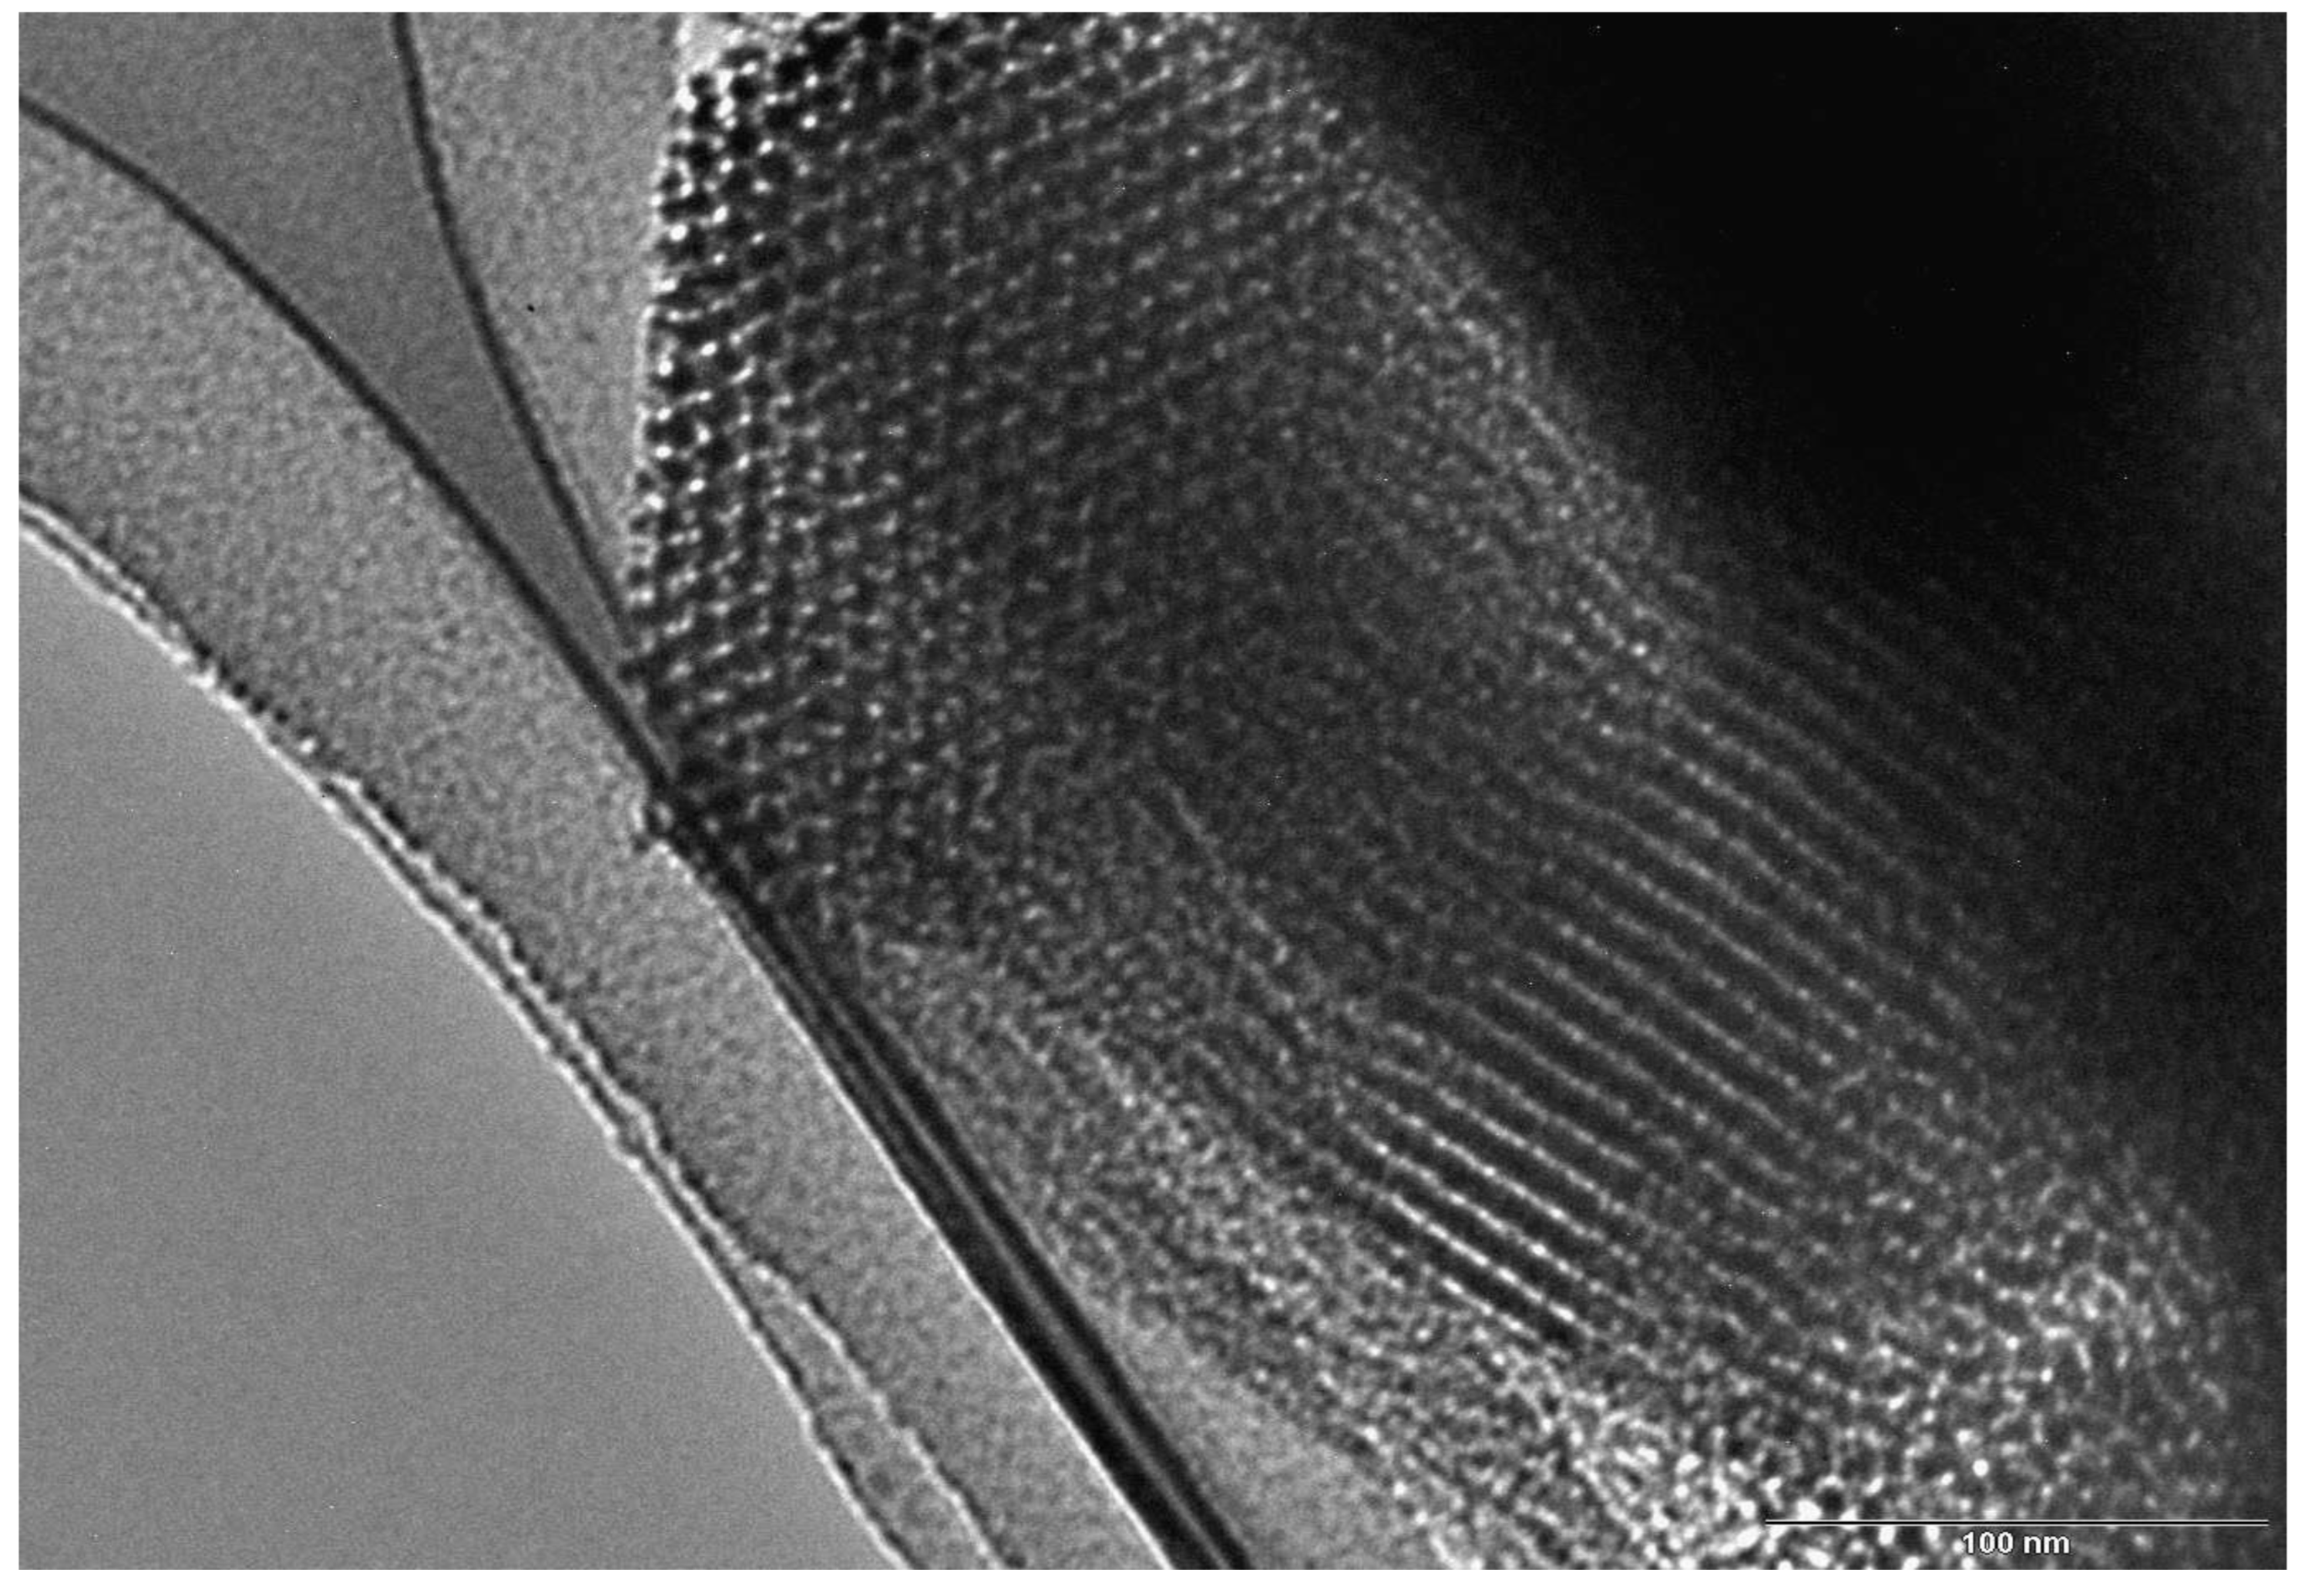
Figure 4.
Nitrogen adsorption-desorption isotherms of calcined SBA-15.
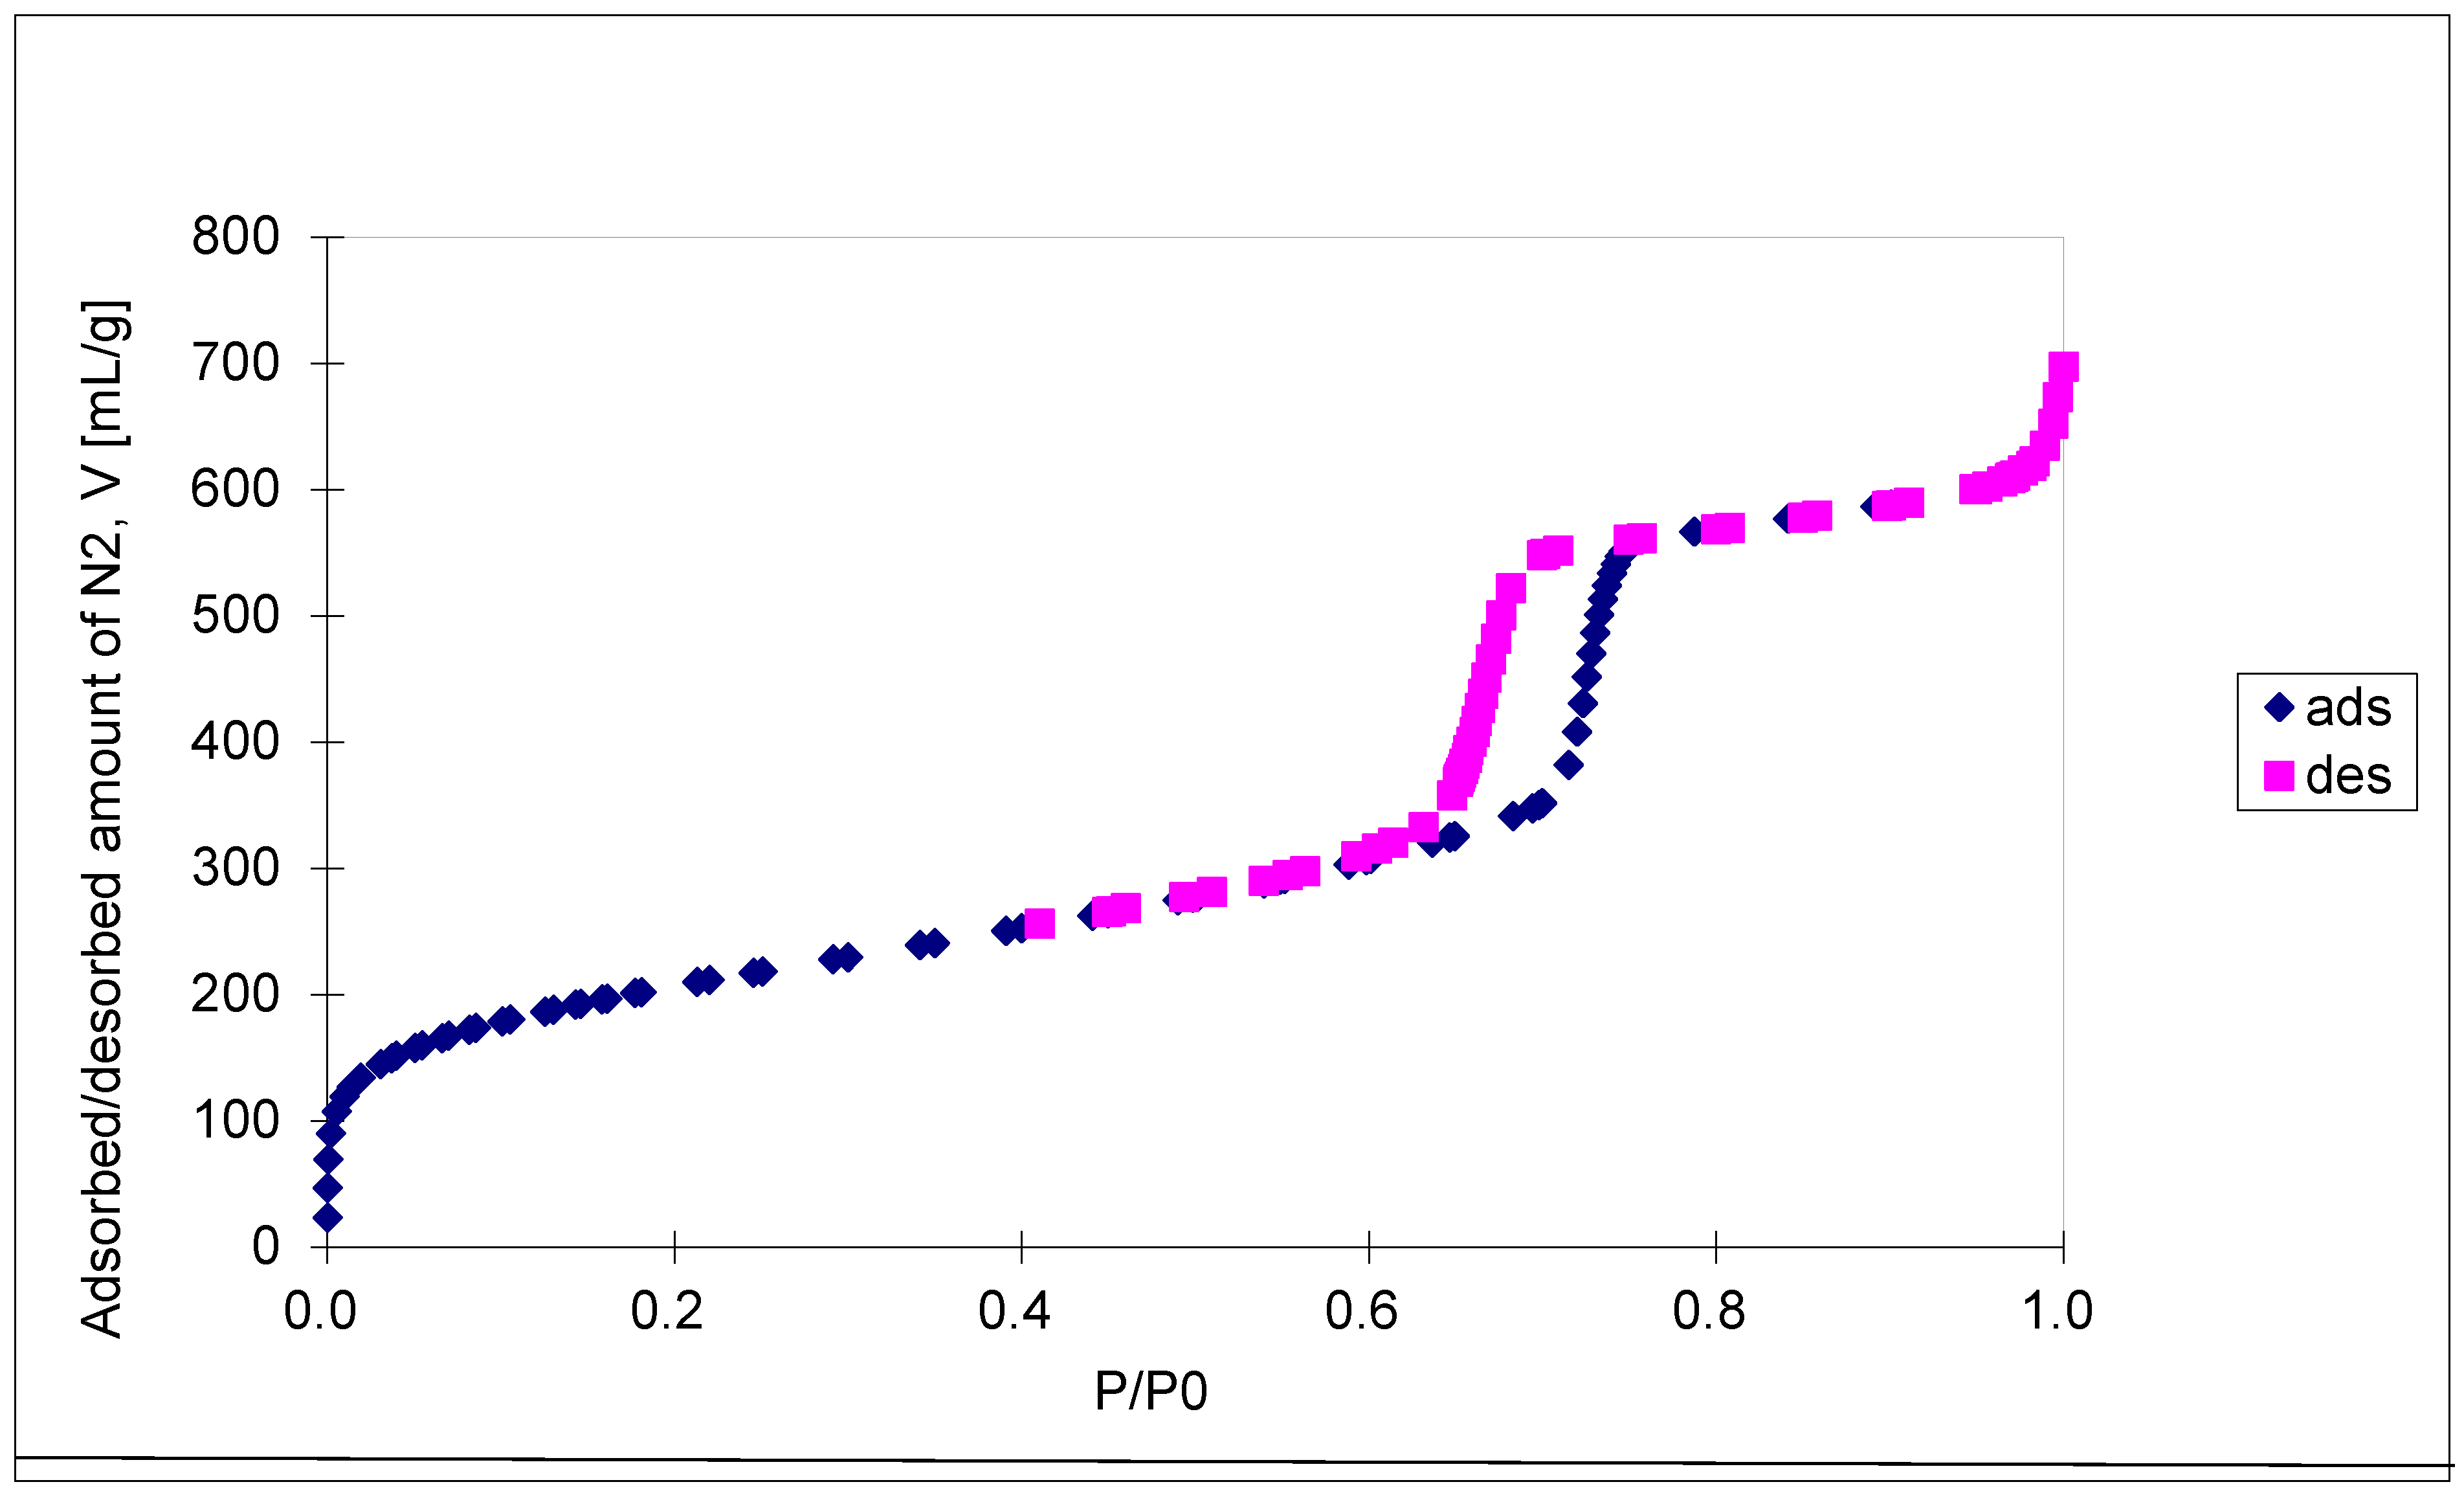
Figure 5.
SBA-15 N2-adsorption and Hg-intrusion data (A) and pore size distribution (B).
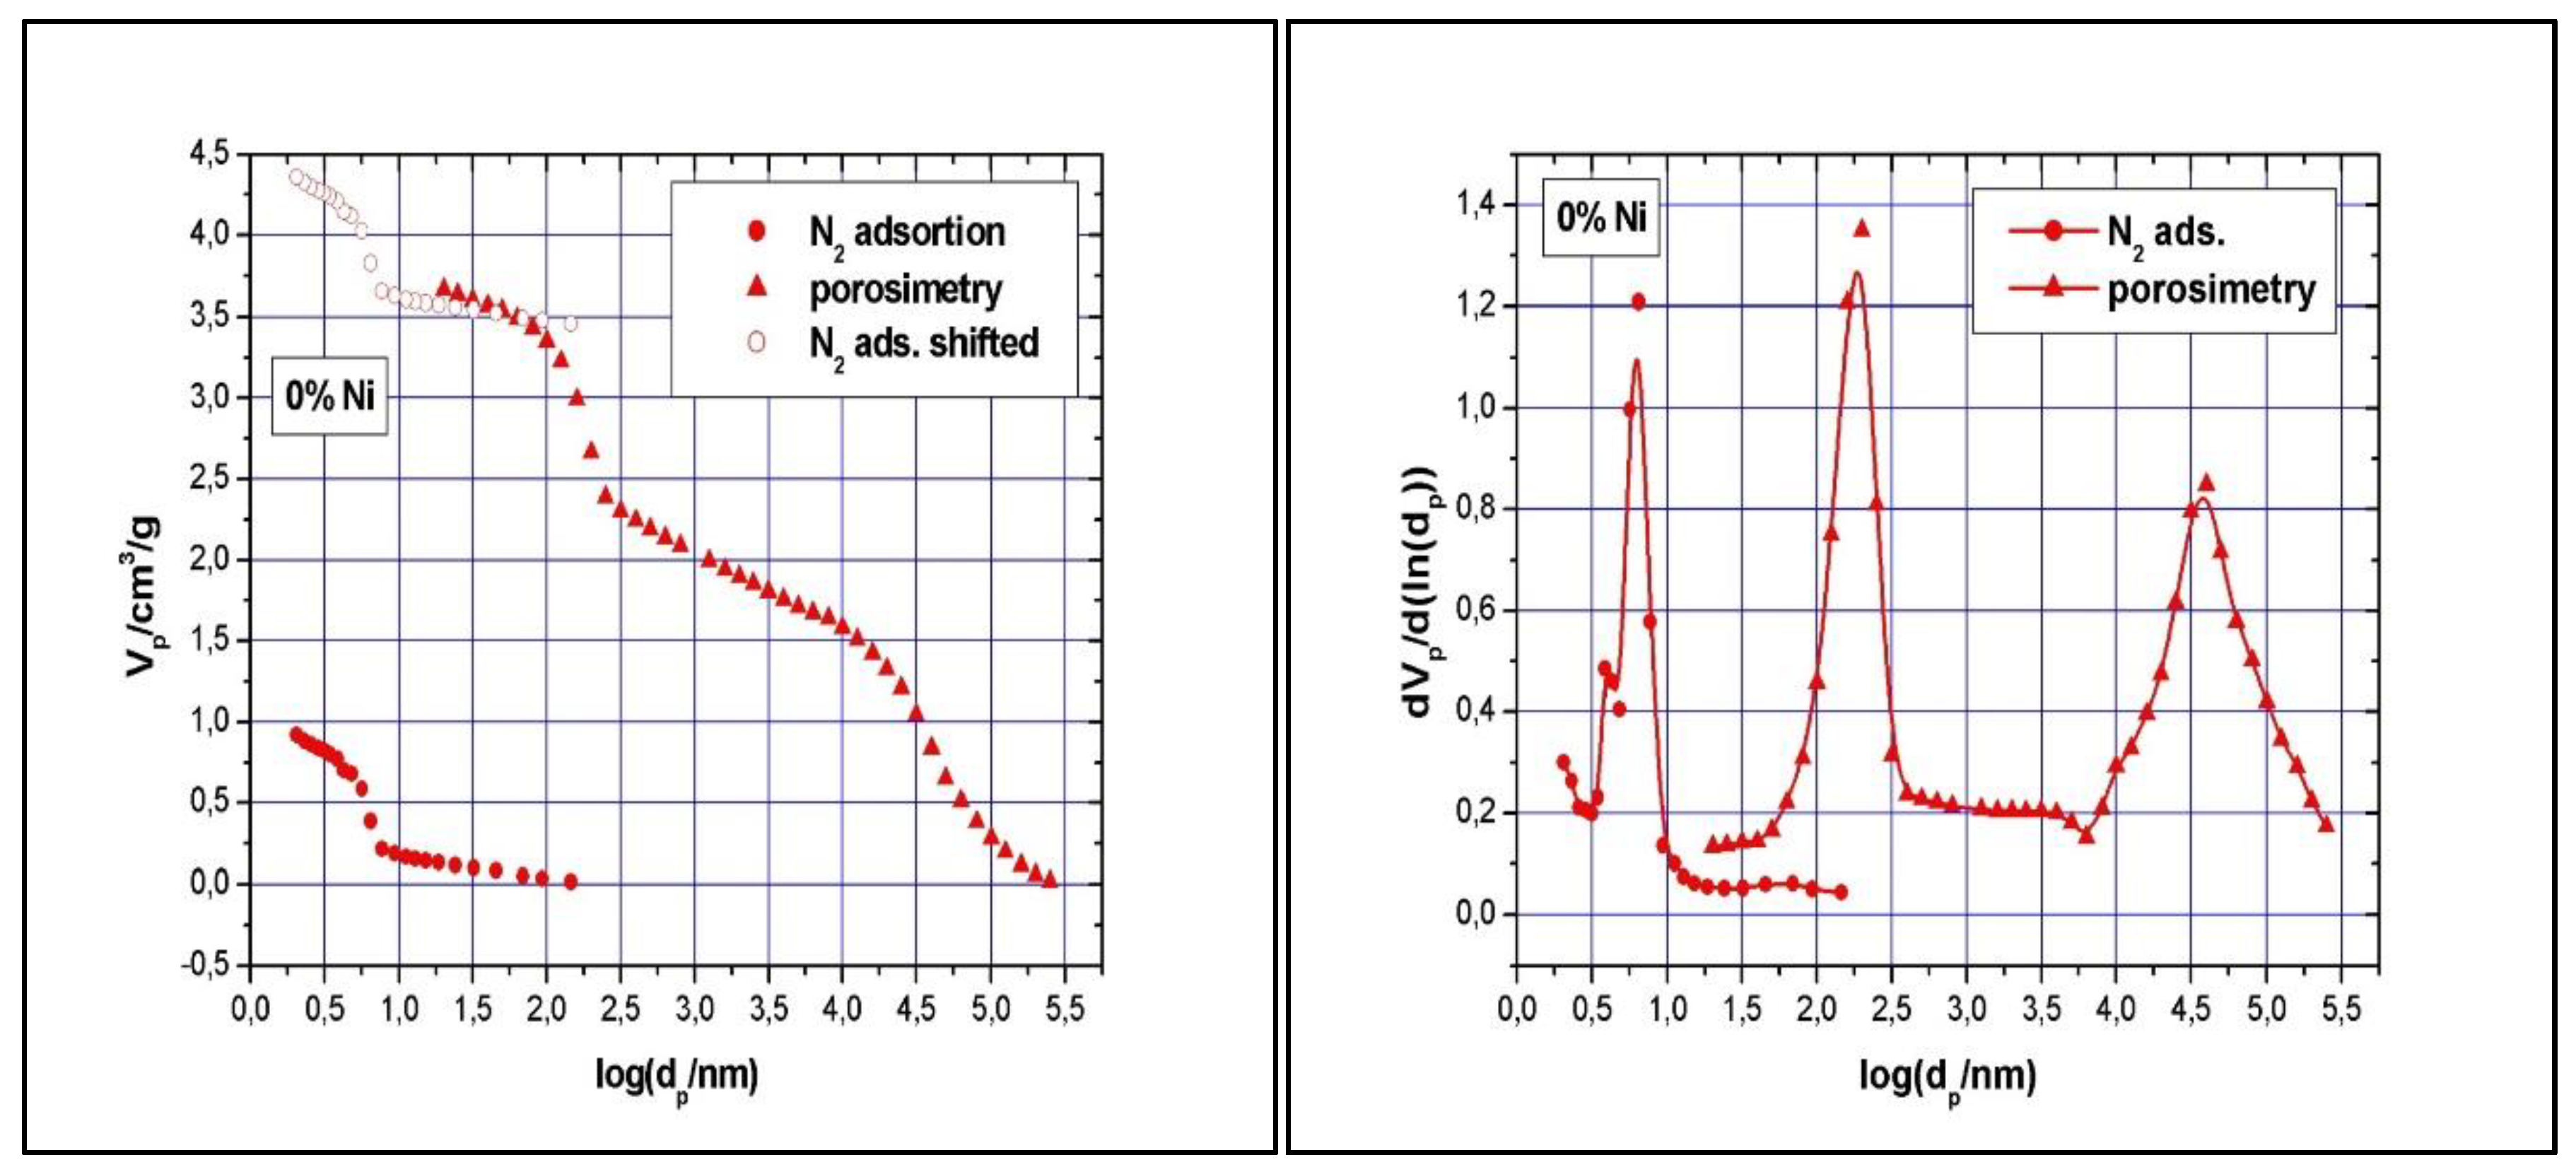
Figure 6.
TeraHertz spectra of SBA-15 and catalysts samples.
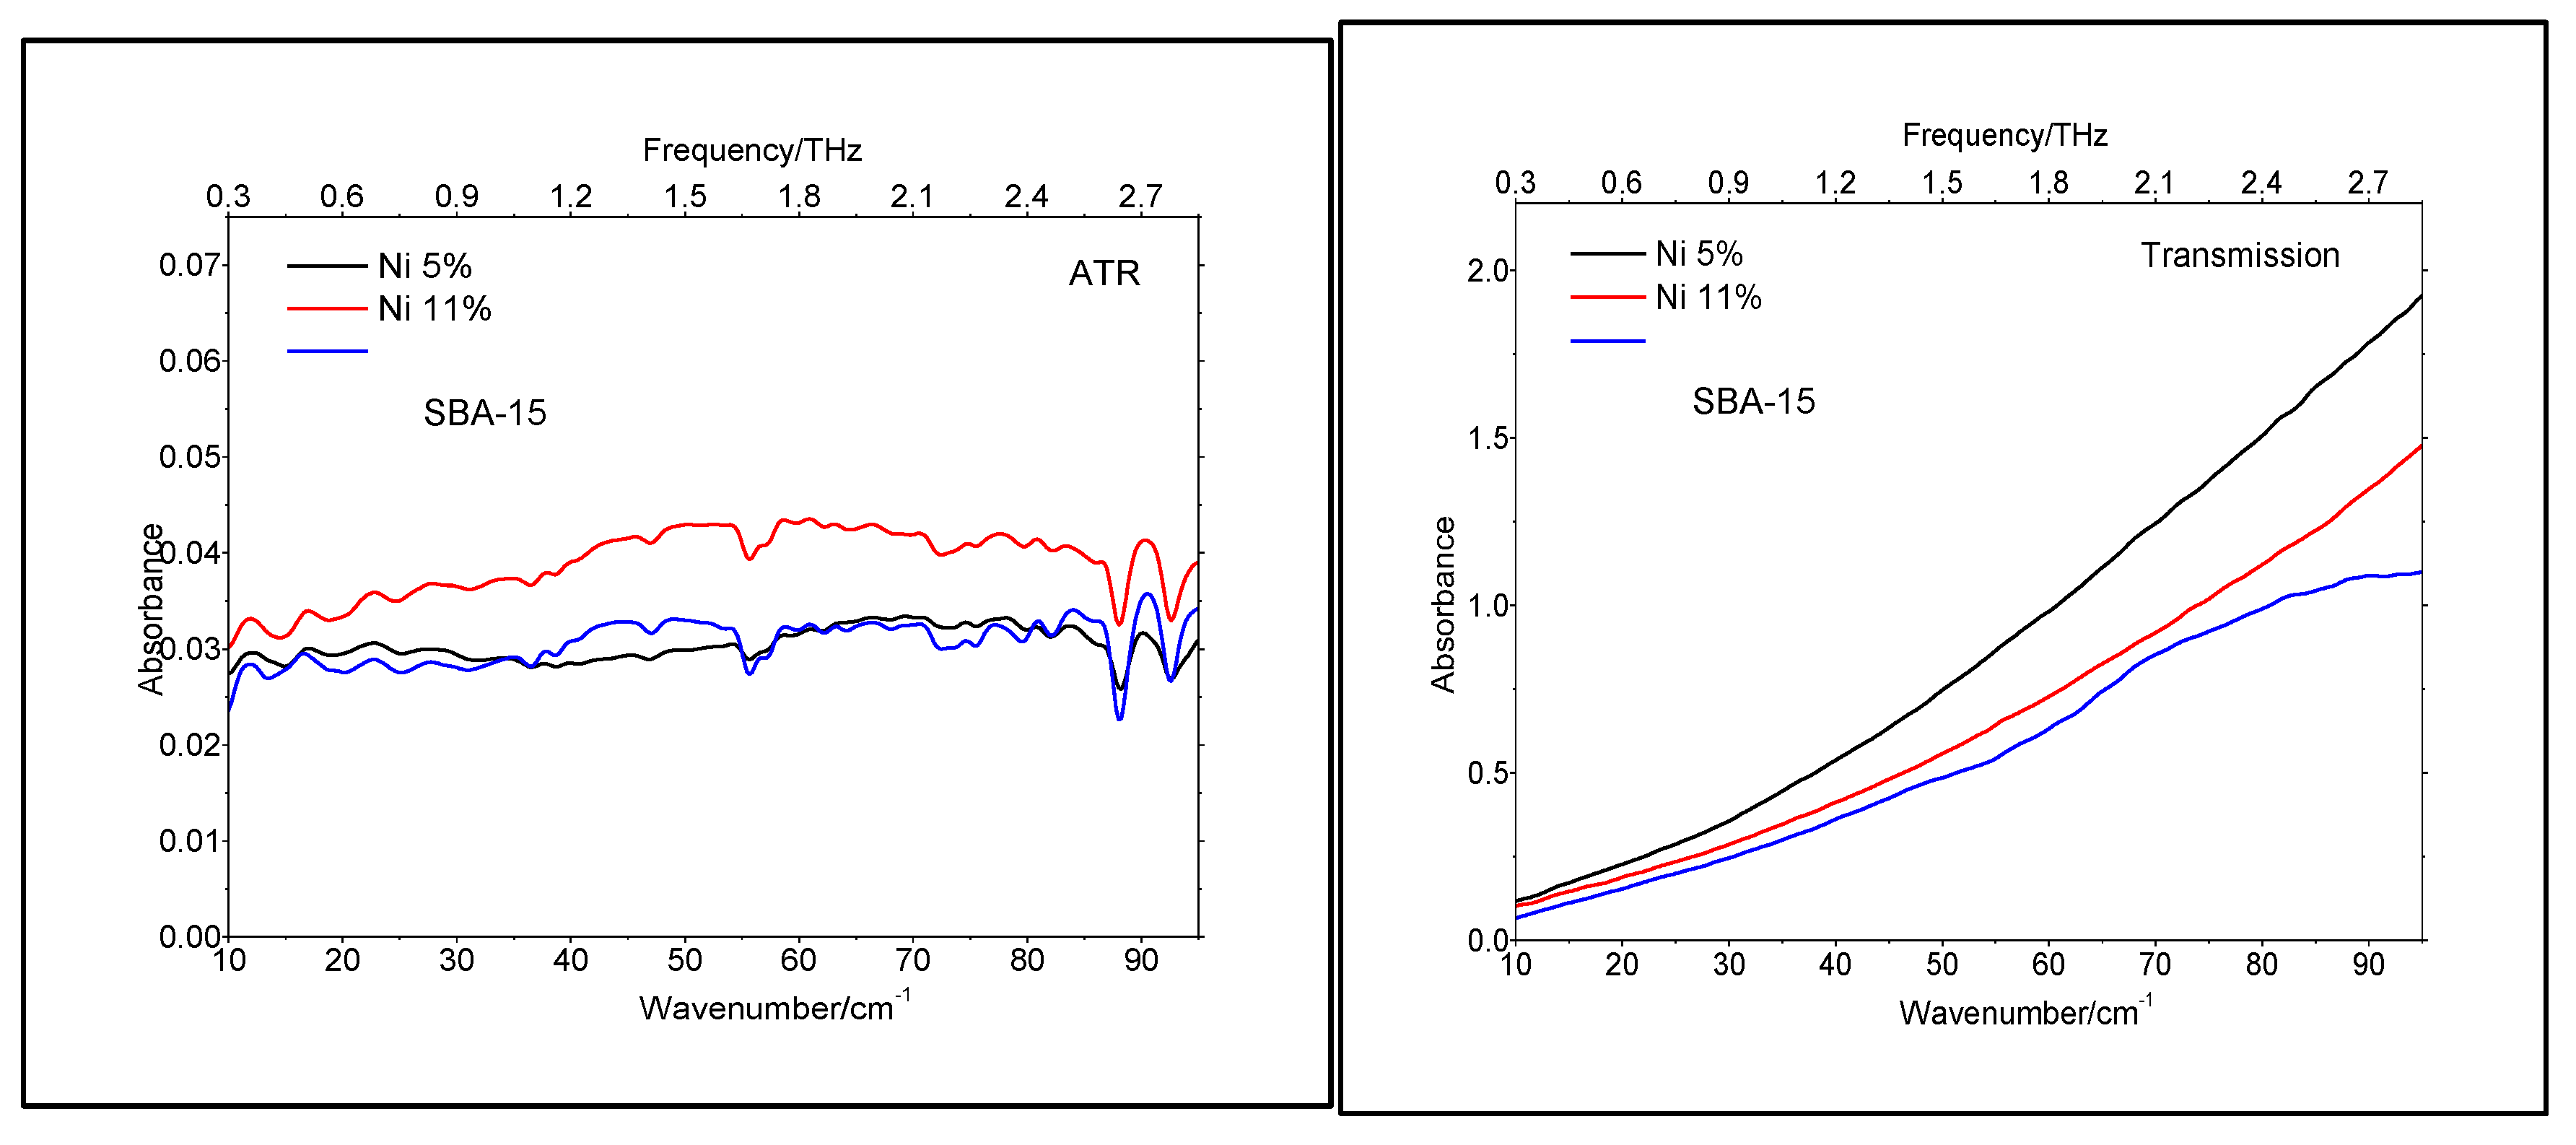
Figure 7.
5% Ni N2-adsorption and Hg-intrusion data (A) and pore size distribution (B).
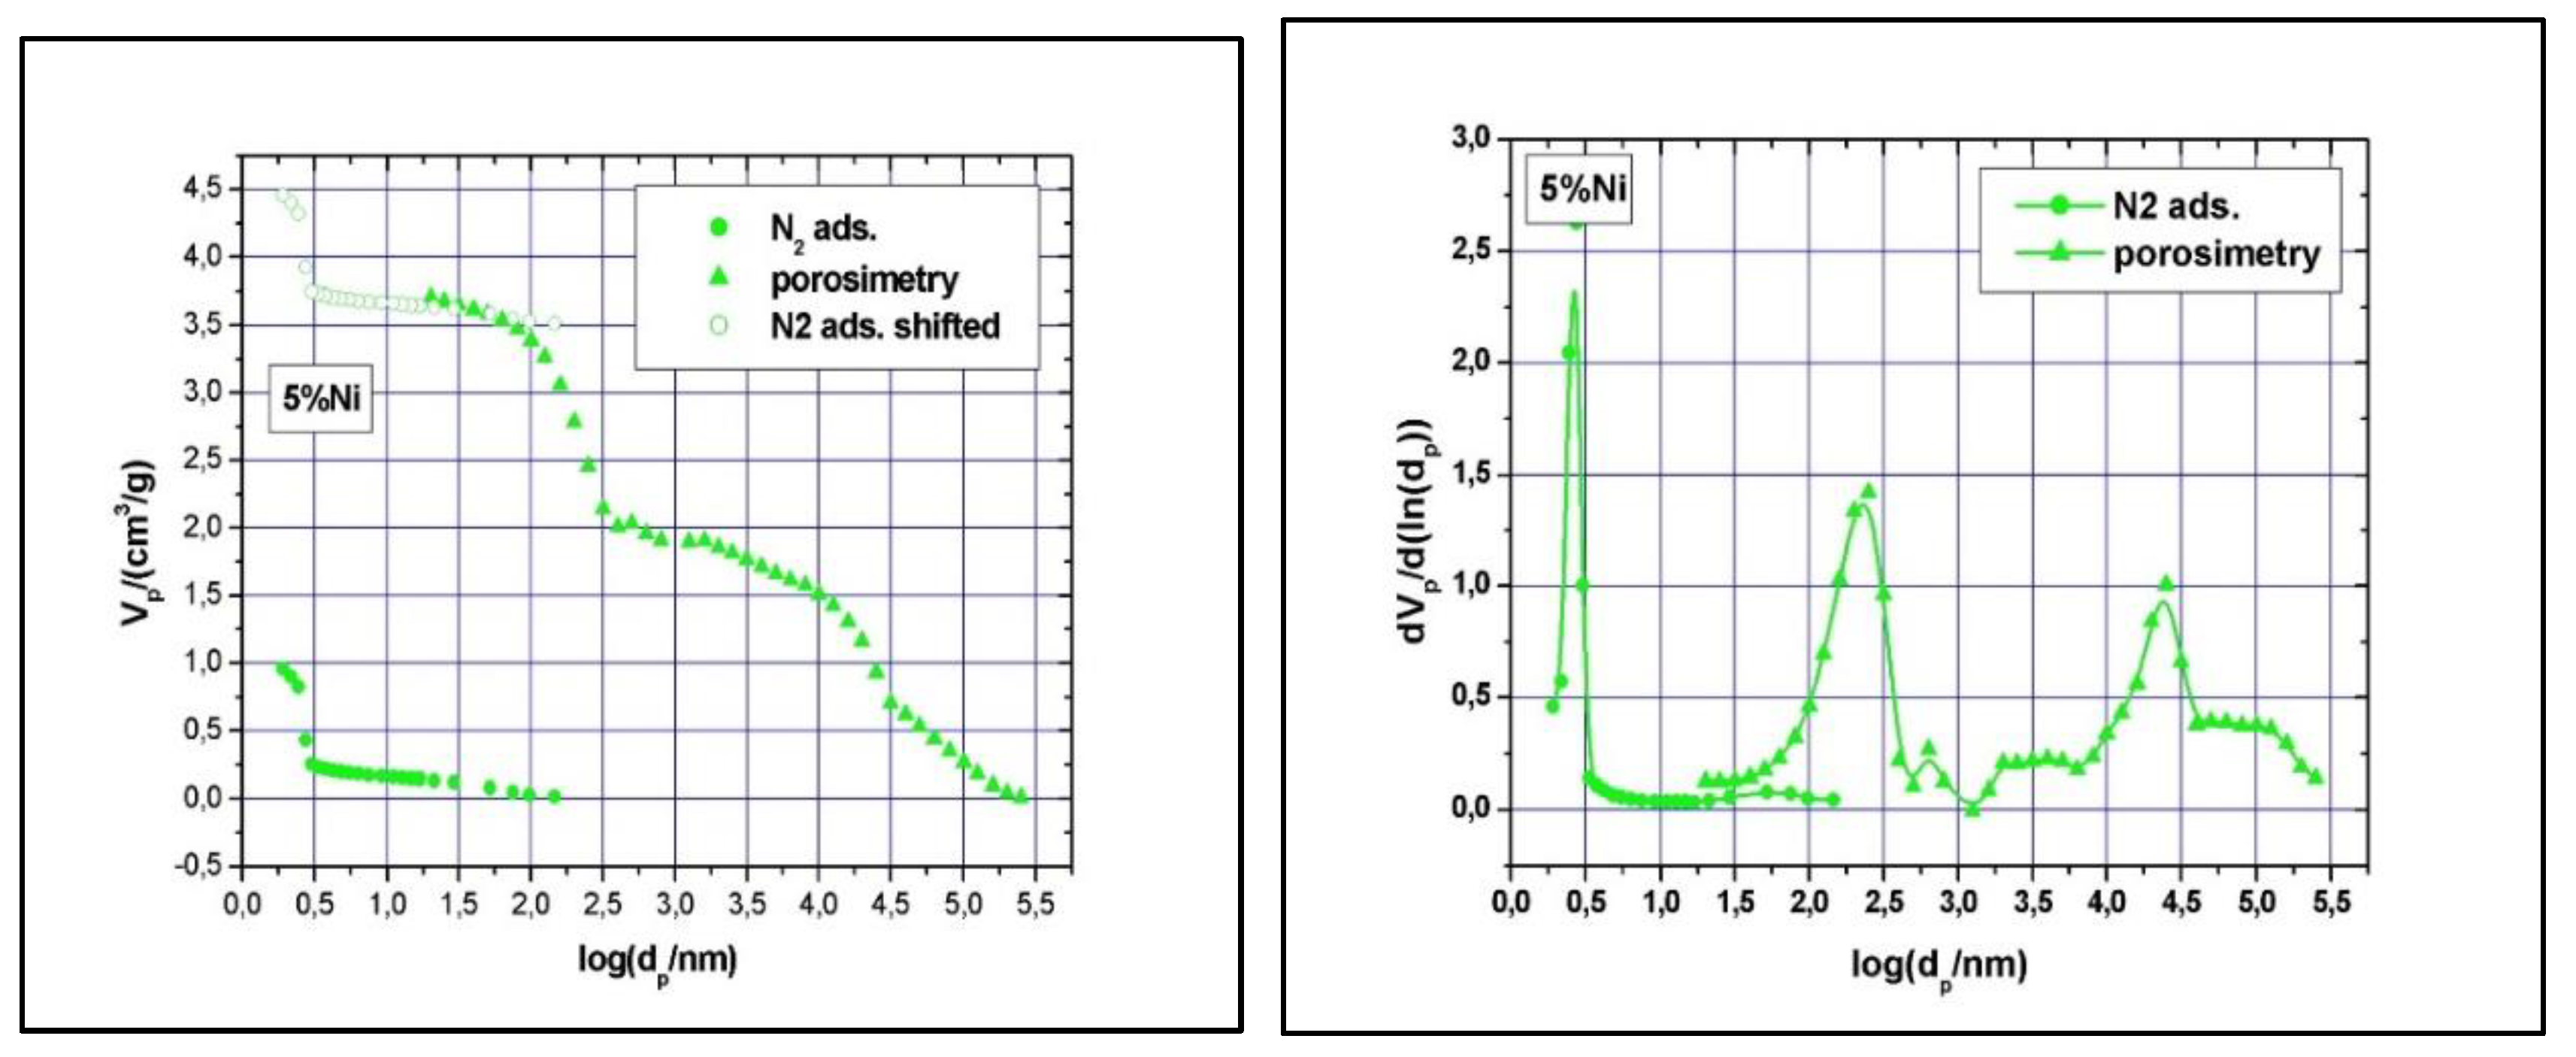
Figure 8.
11% Ni N2-adsorption and Hg-intrusion data (A) and pore size distribution (B).
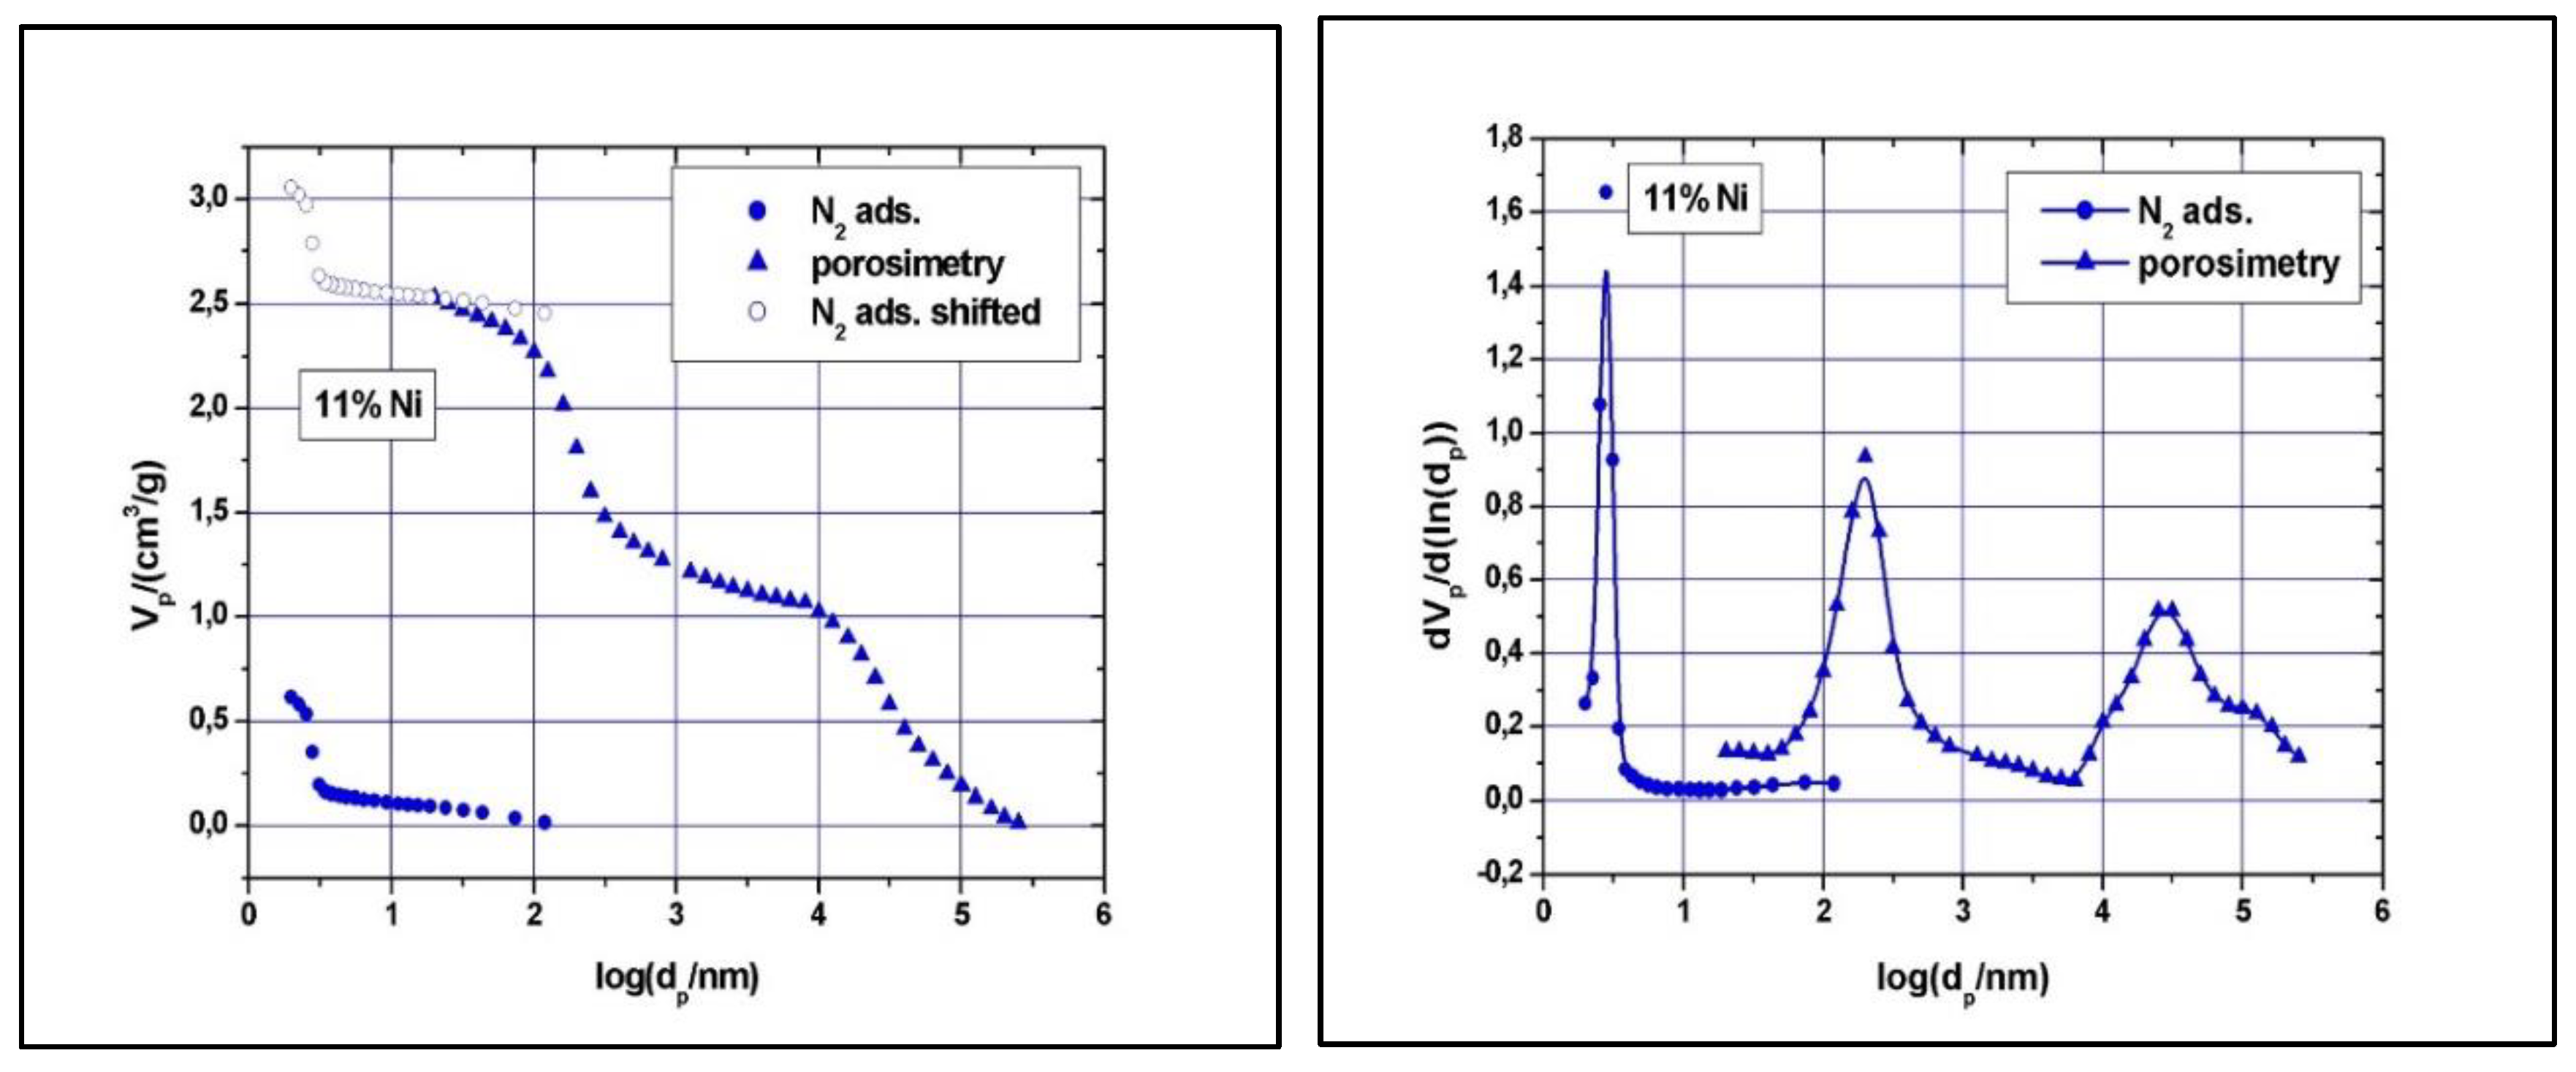
Figure 9.
TEM micrograph of 5% Ni (A) and chemical mapping, Nickel (B), Oxygen (C) and Silicon (D).
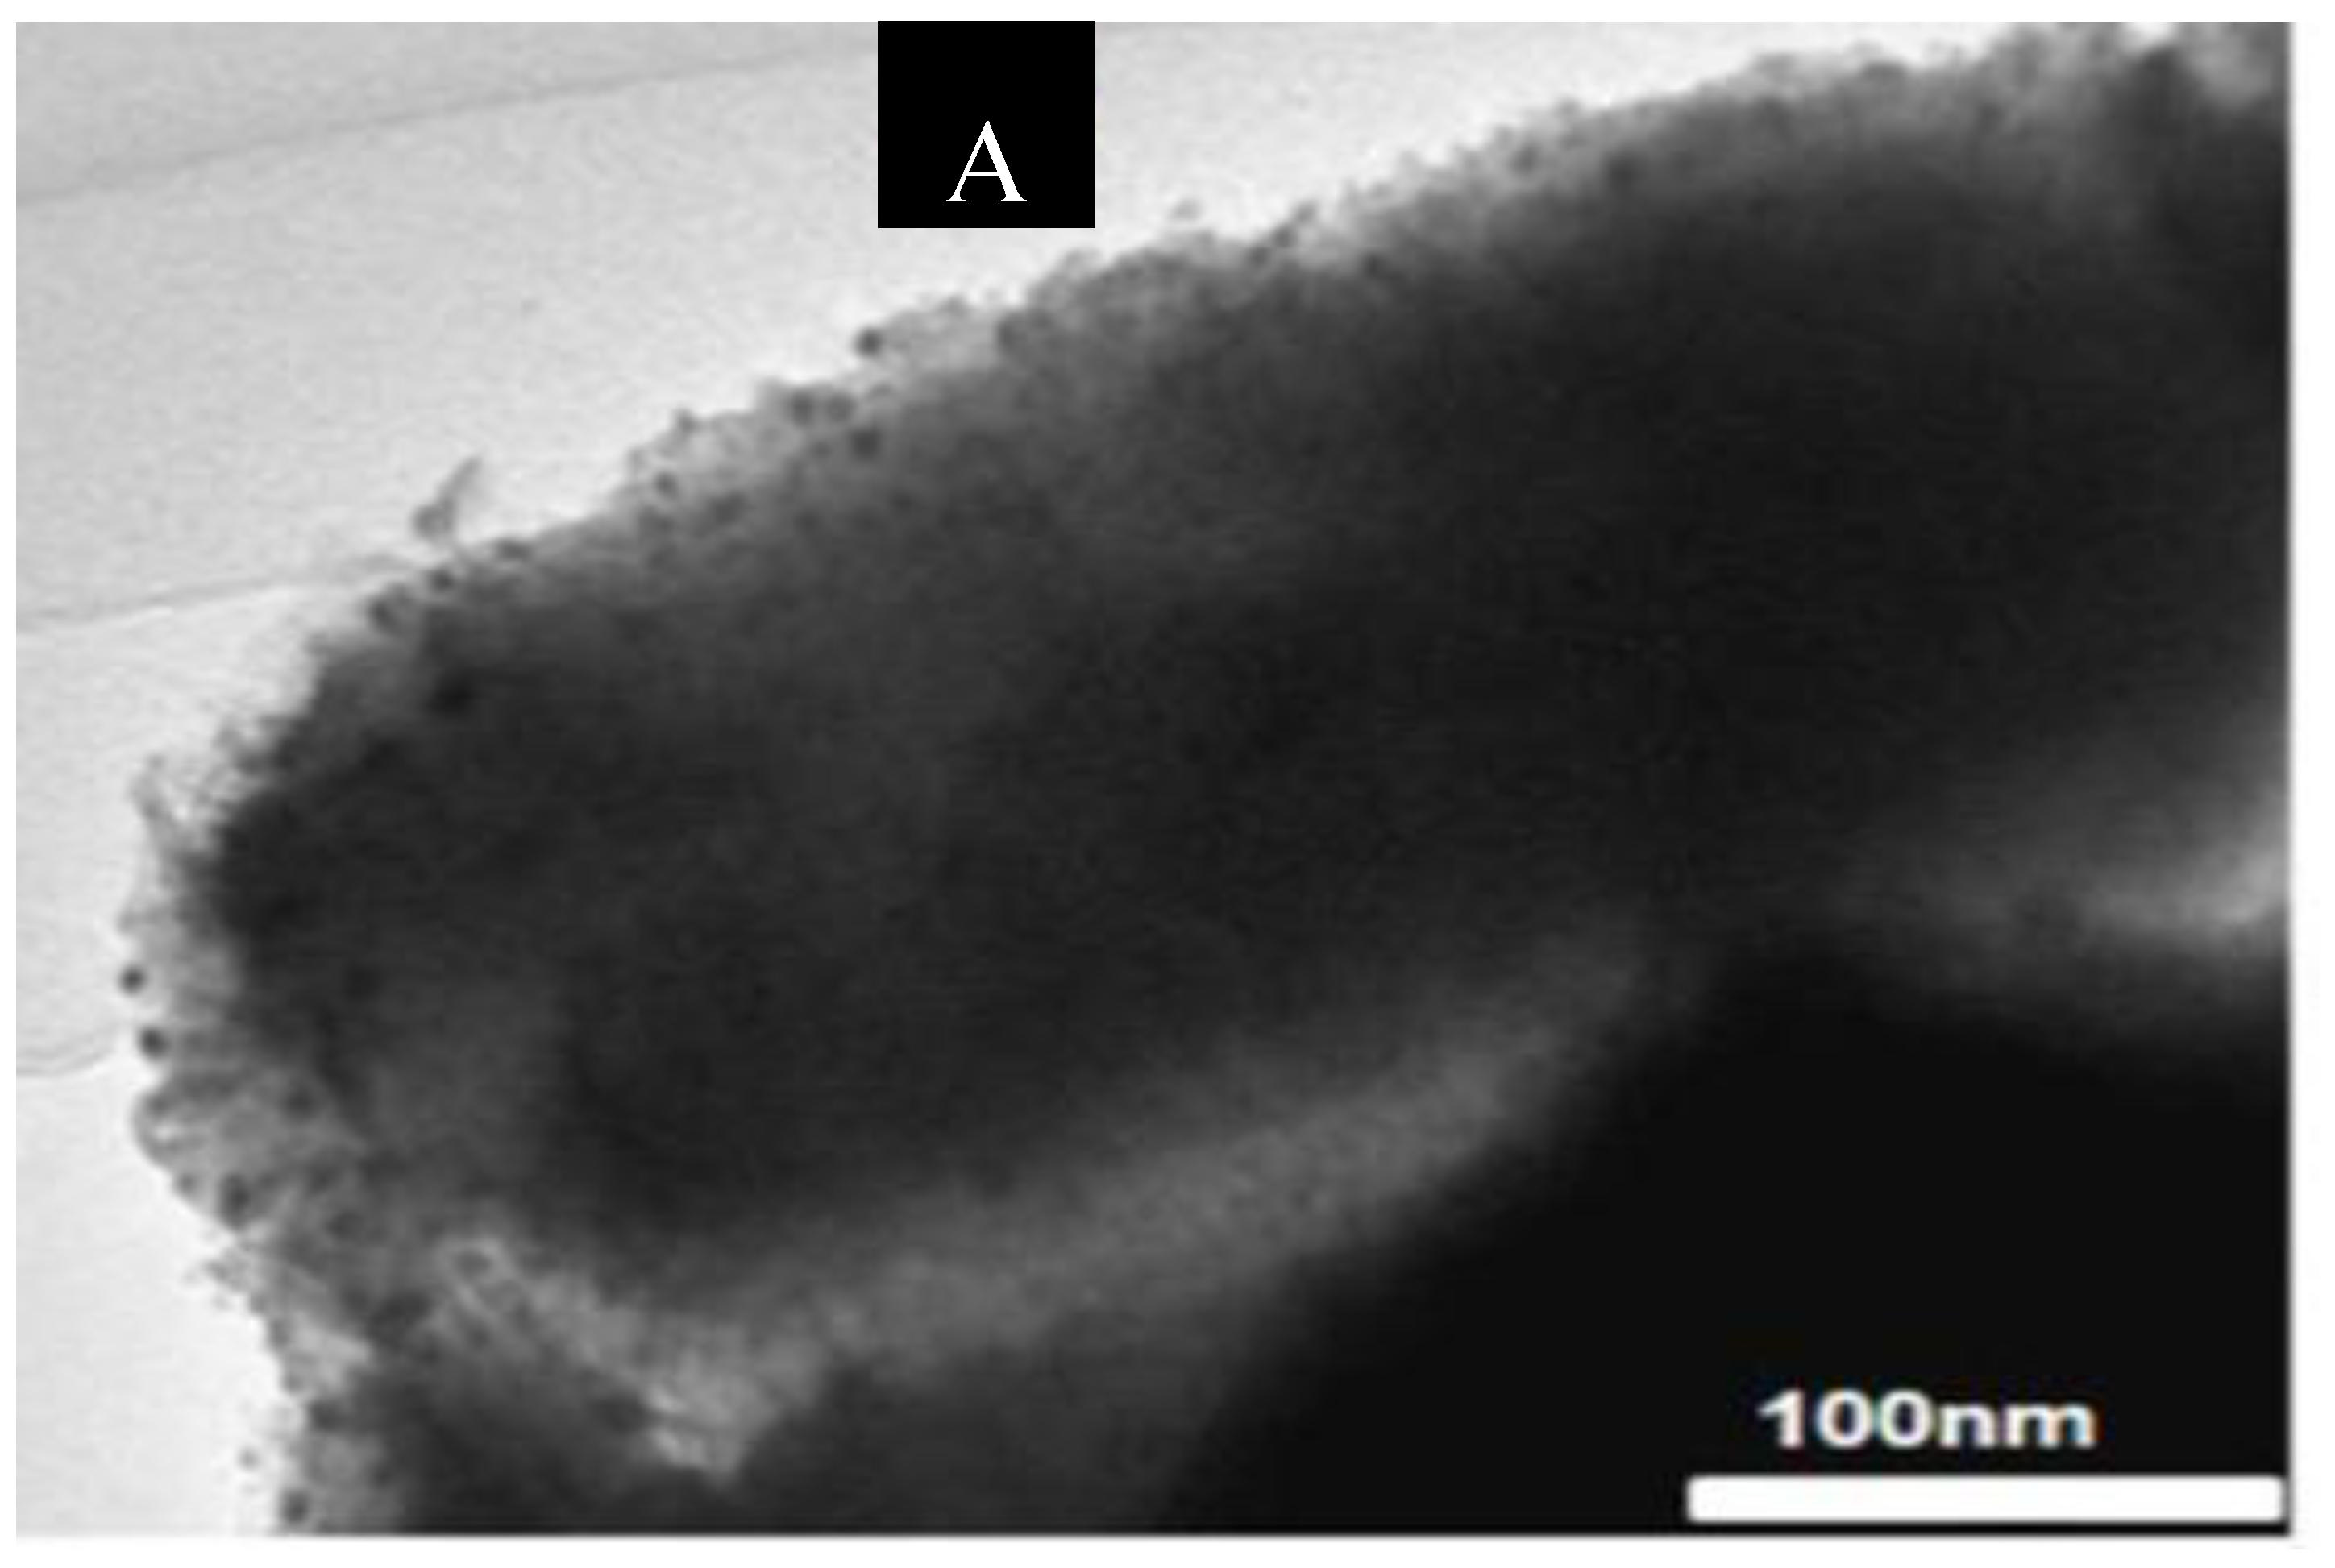
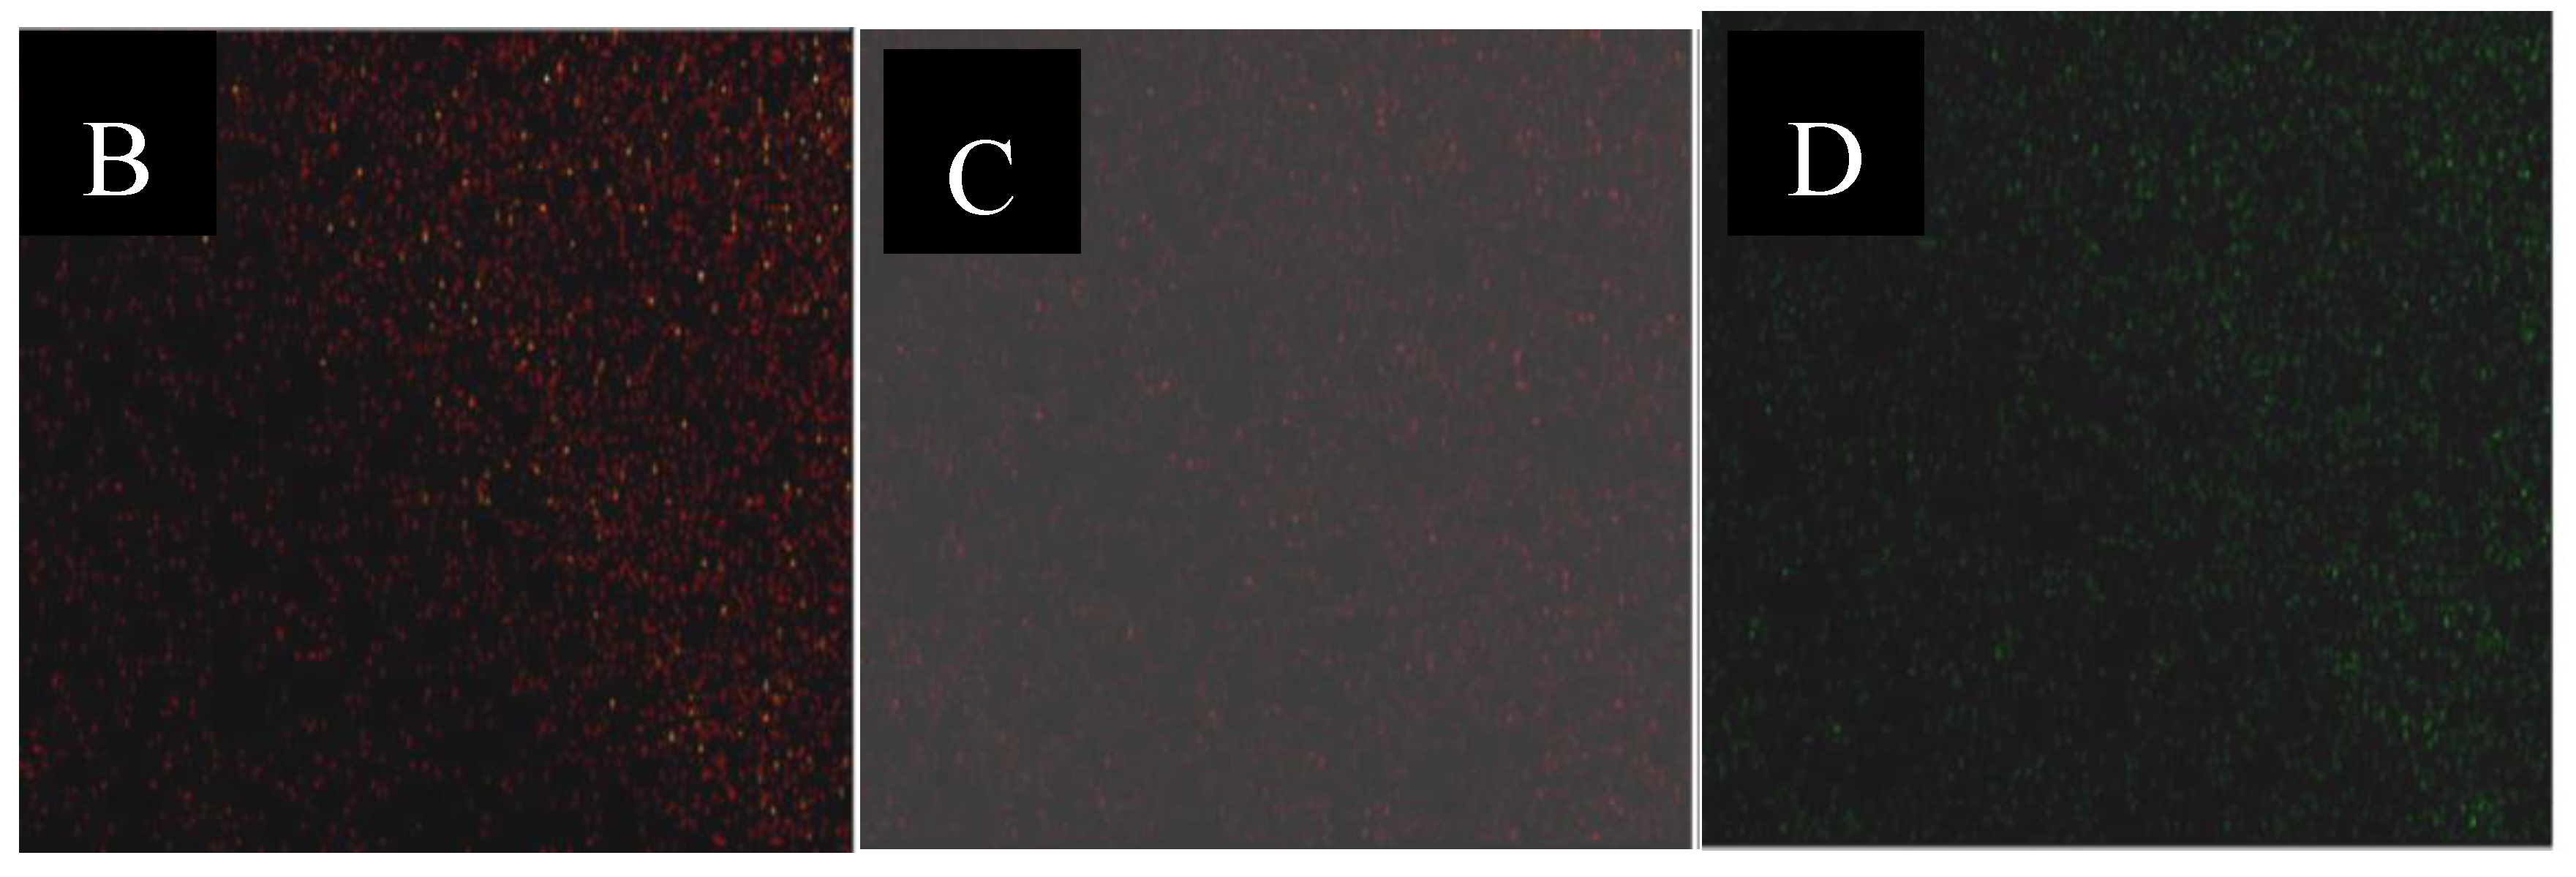
Figure 10.
XPS spectra for Ni samples, fresh (5% Ni and 11% Ni) and pre-reduced (5% Ni).
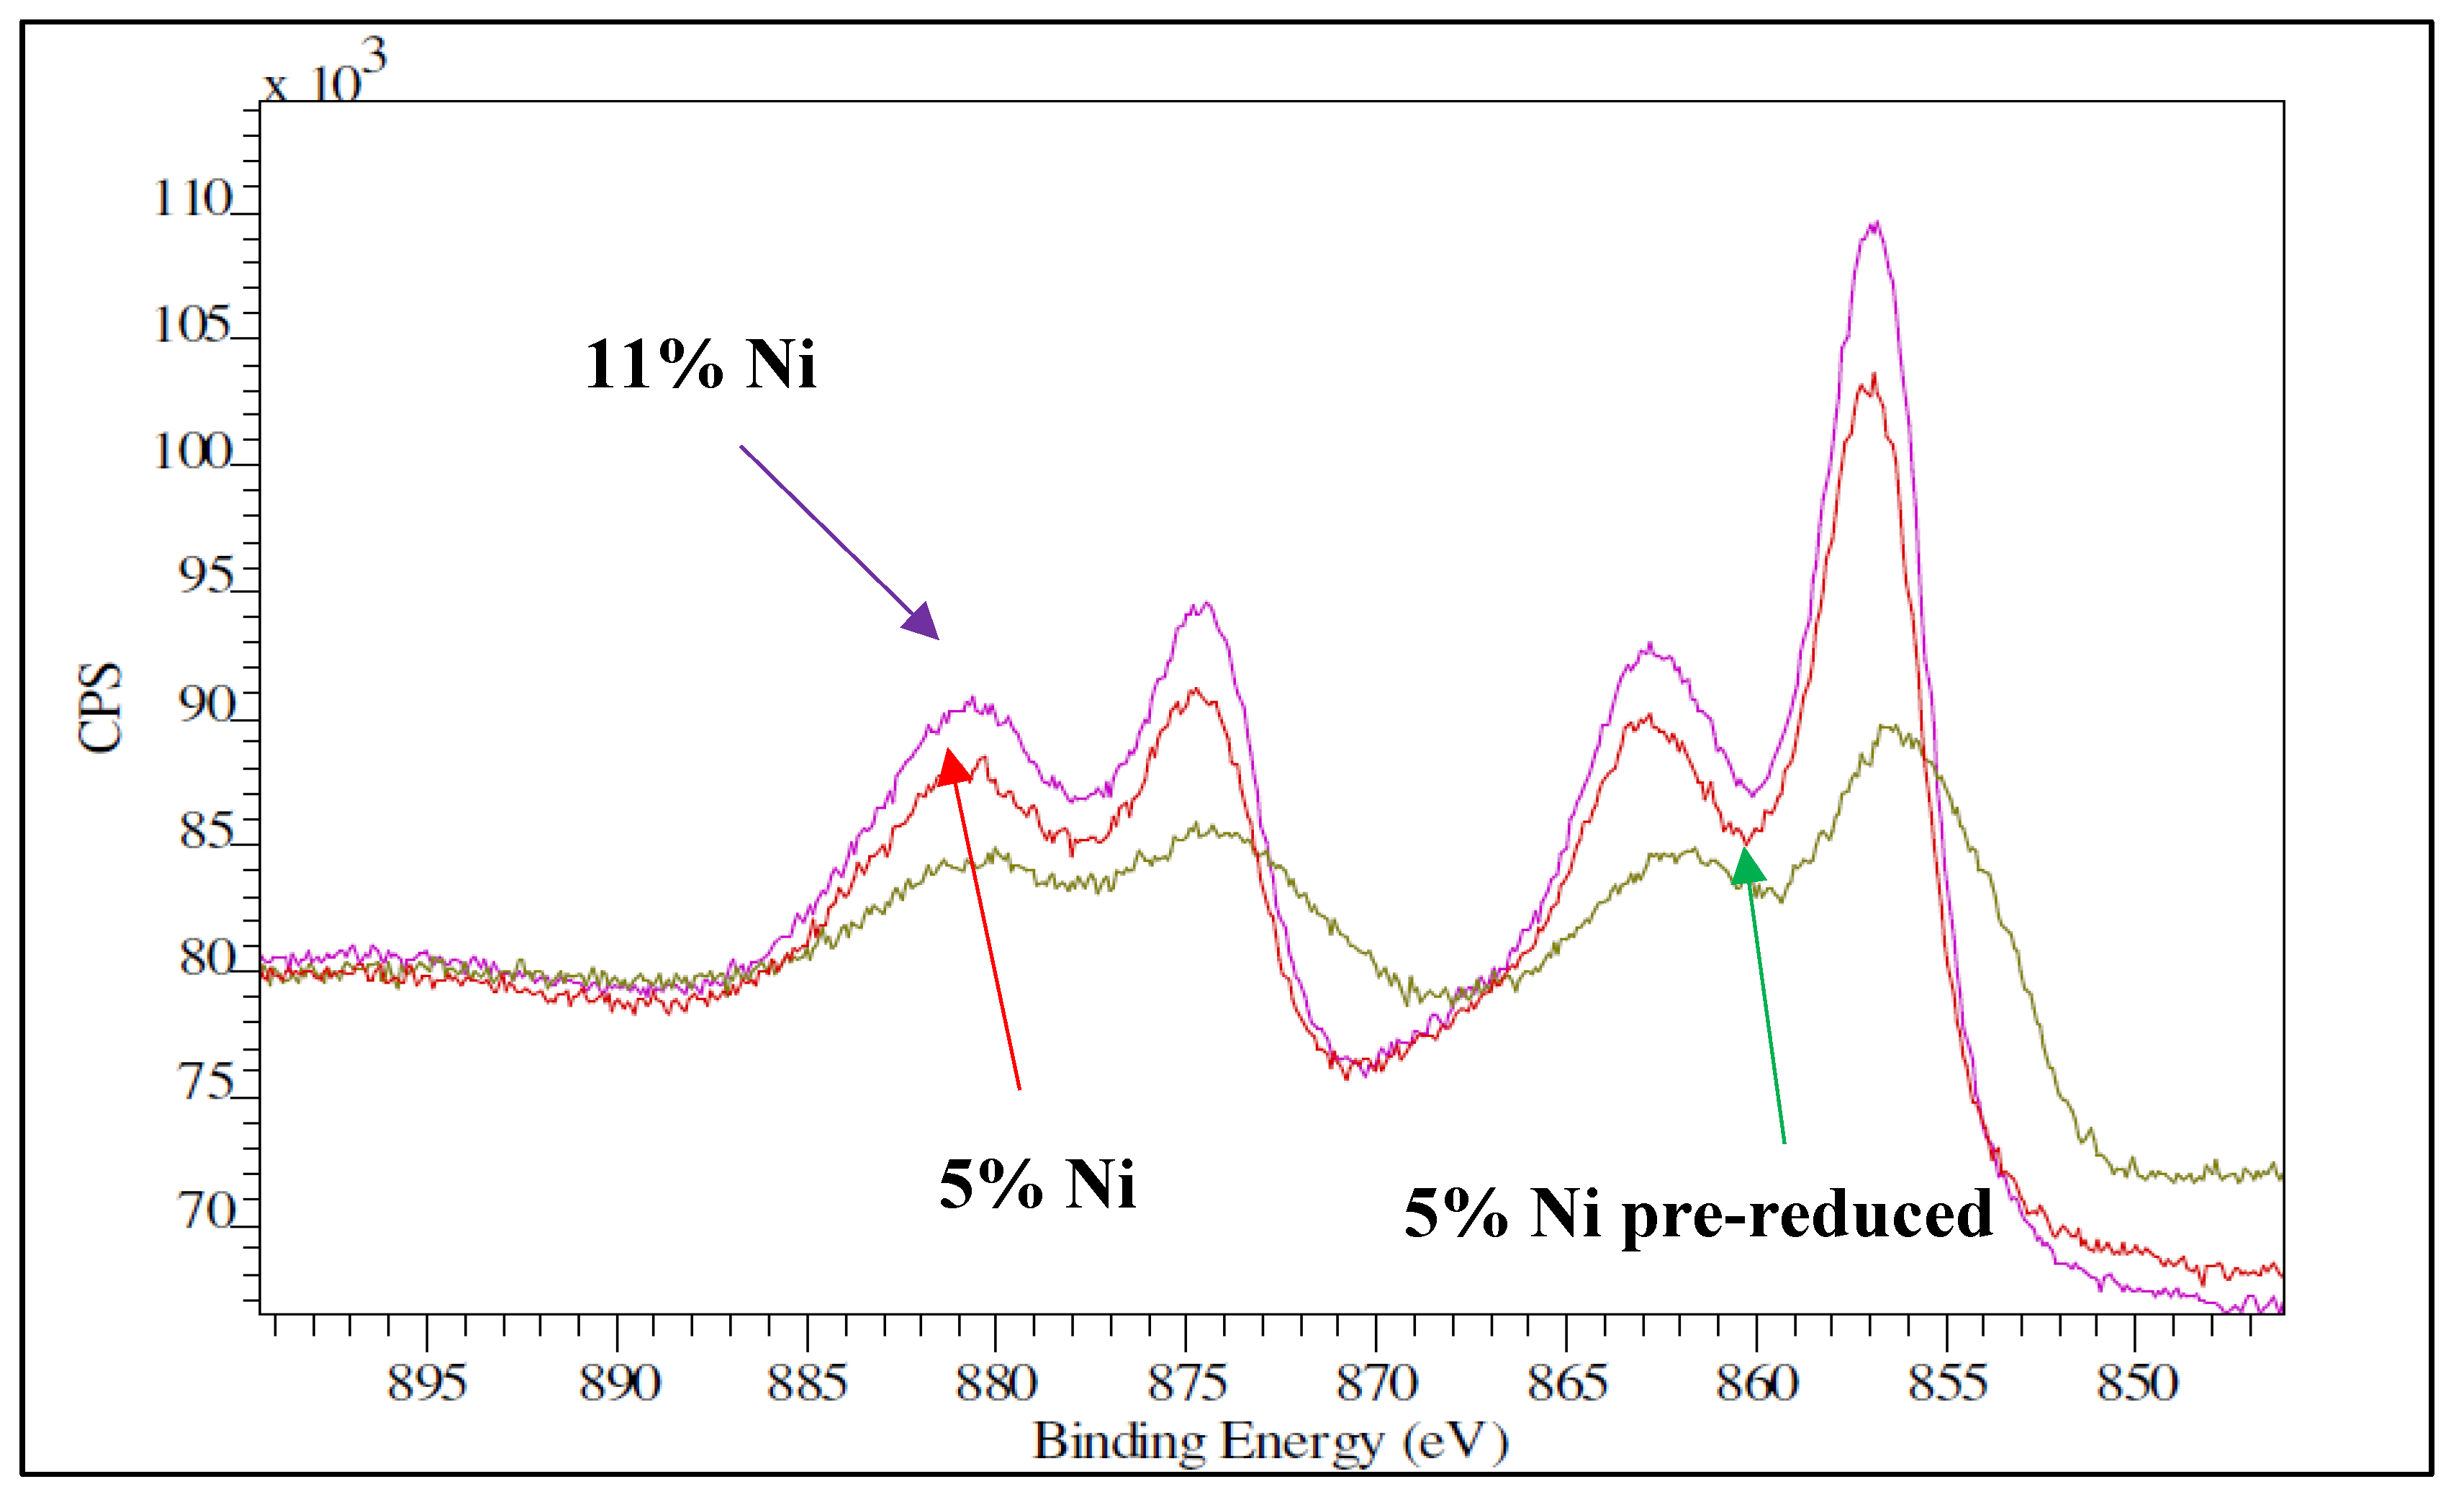
Figure 11.
Temperature programmed reaction over 5% Ni fresh (A) and 5% Ni pre-reduced (B).
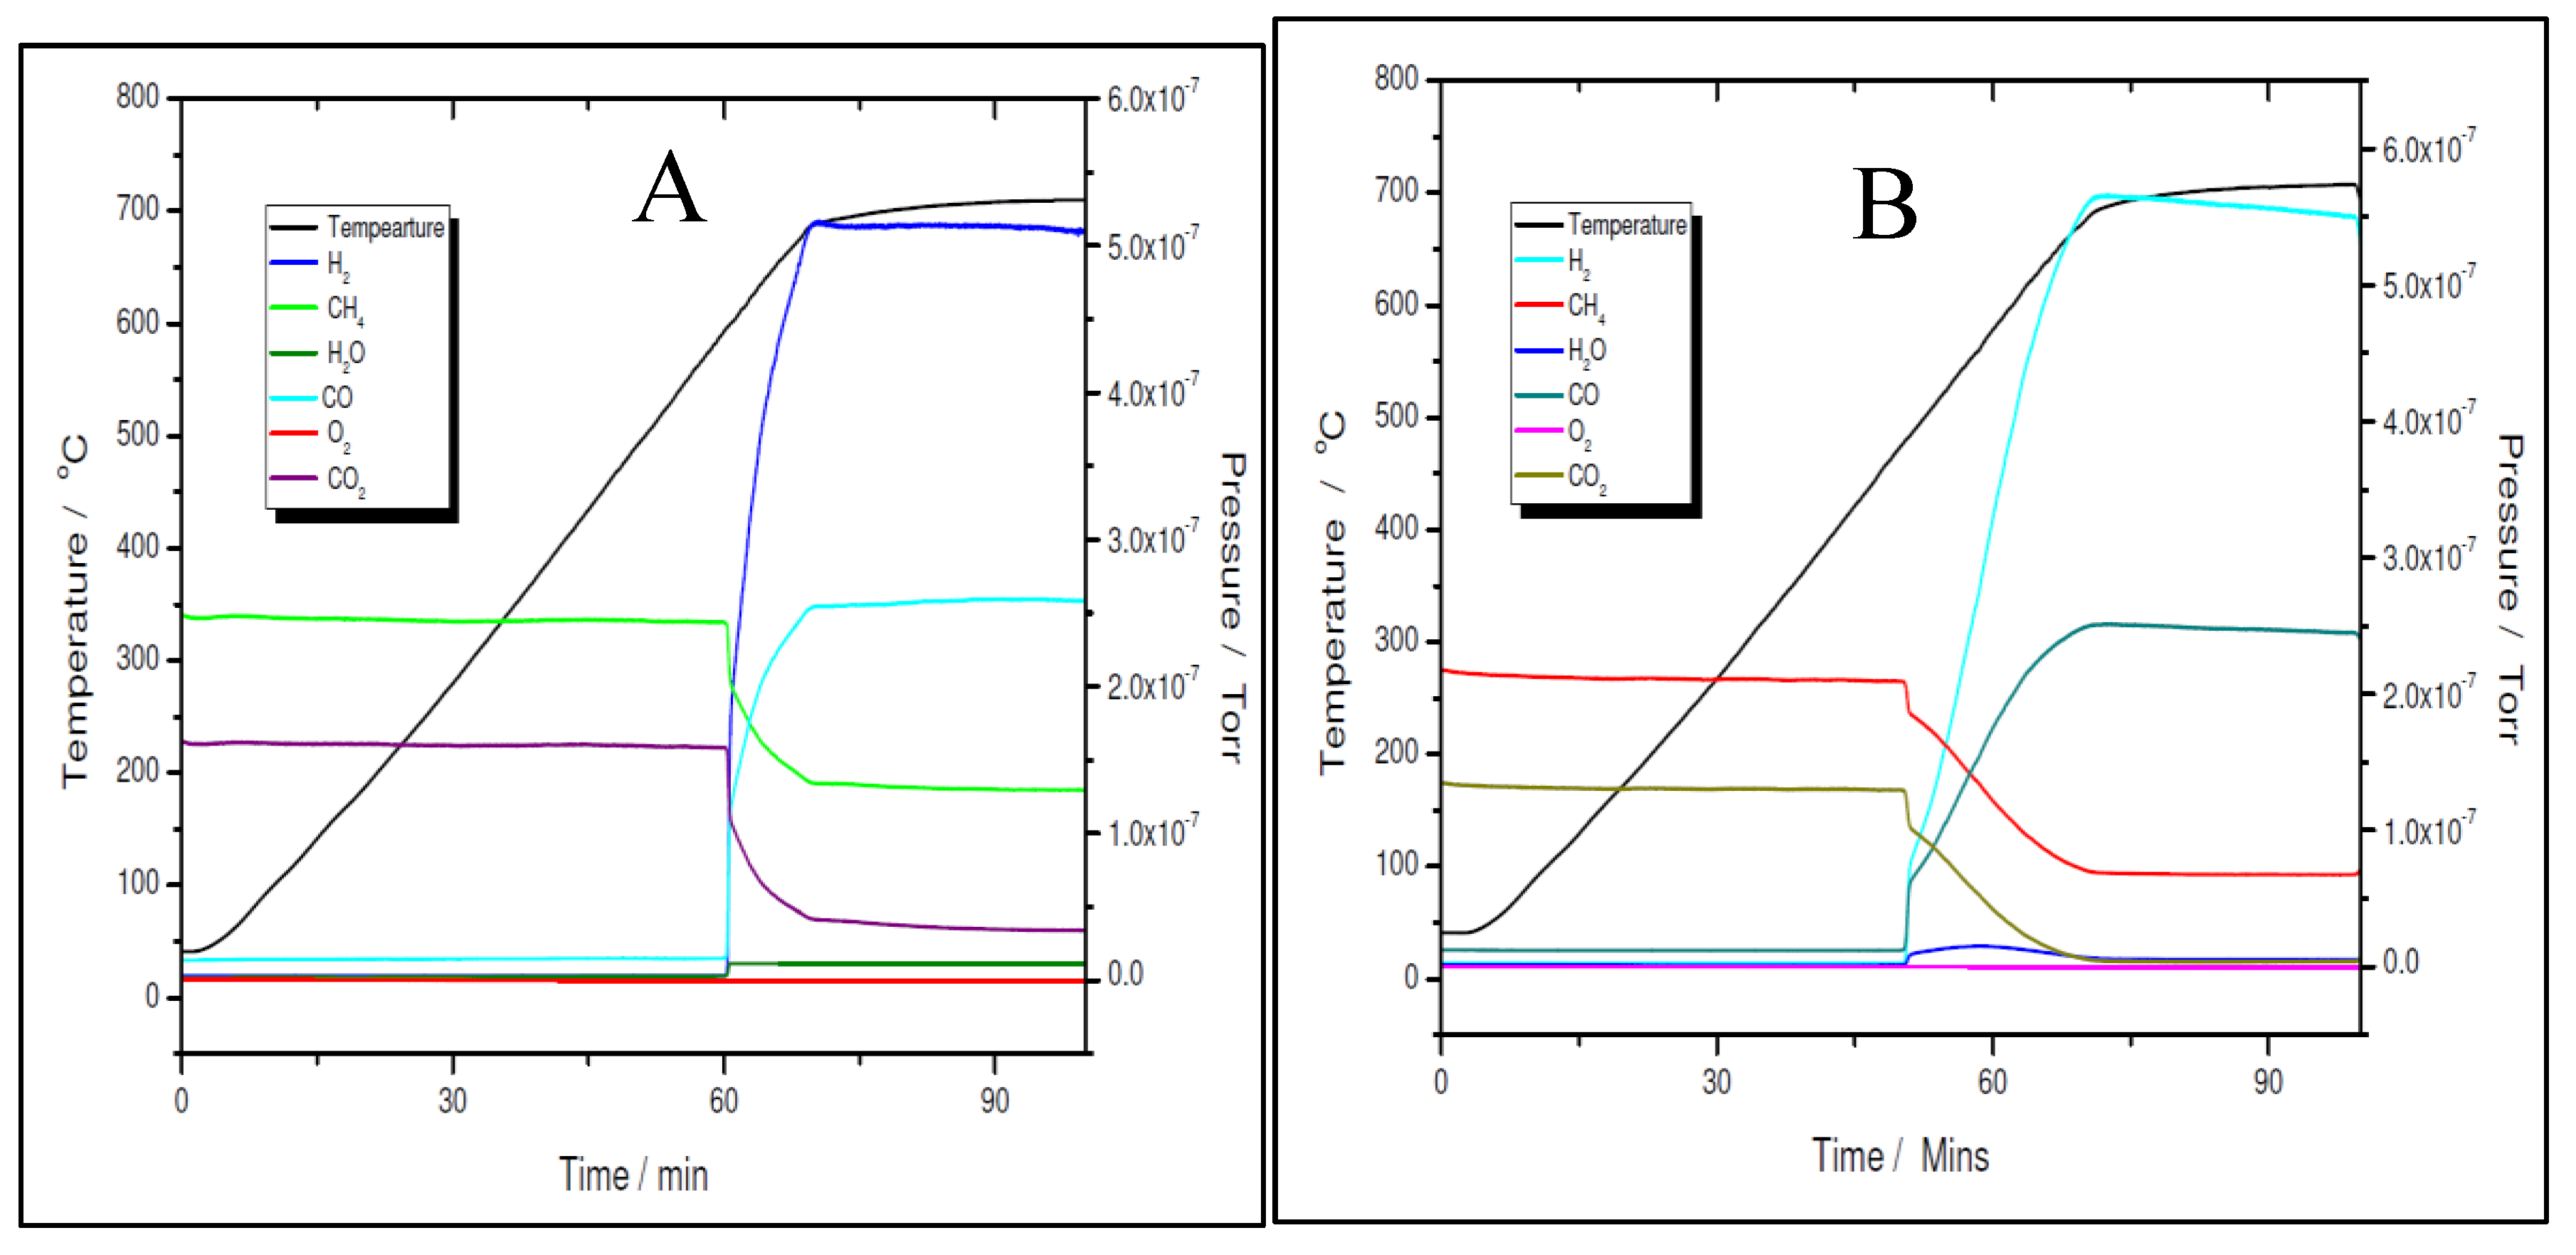
Figure 12.
Temperature programmed reaction over 11% Ni fresh (A) and 11% Ni pre-reduced (B).
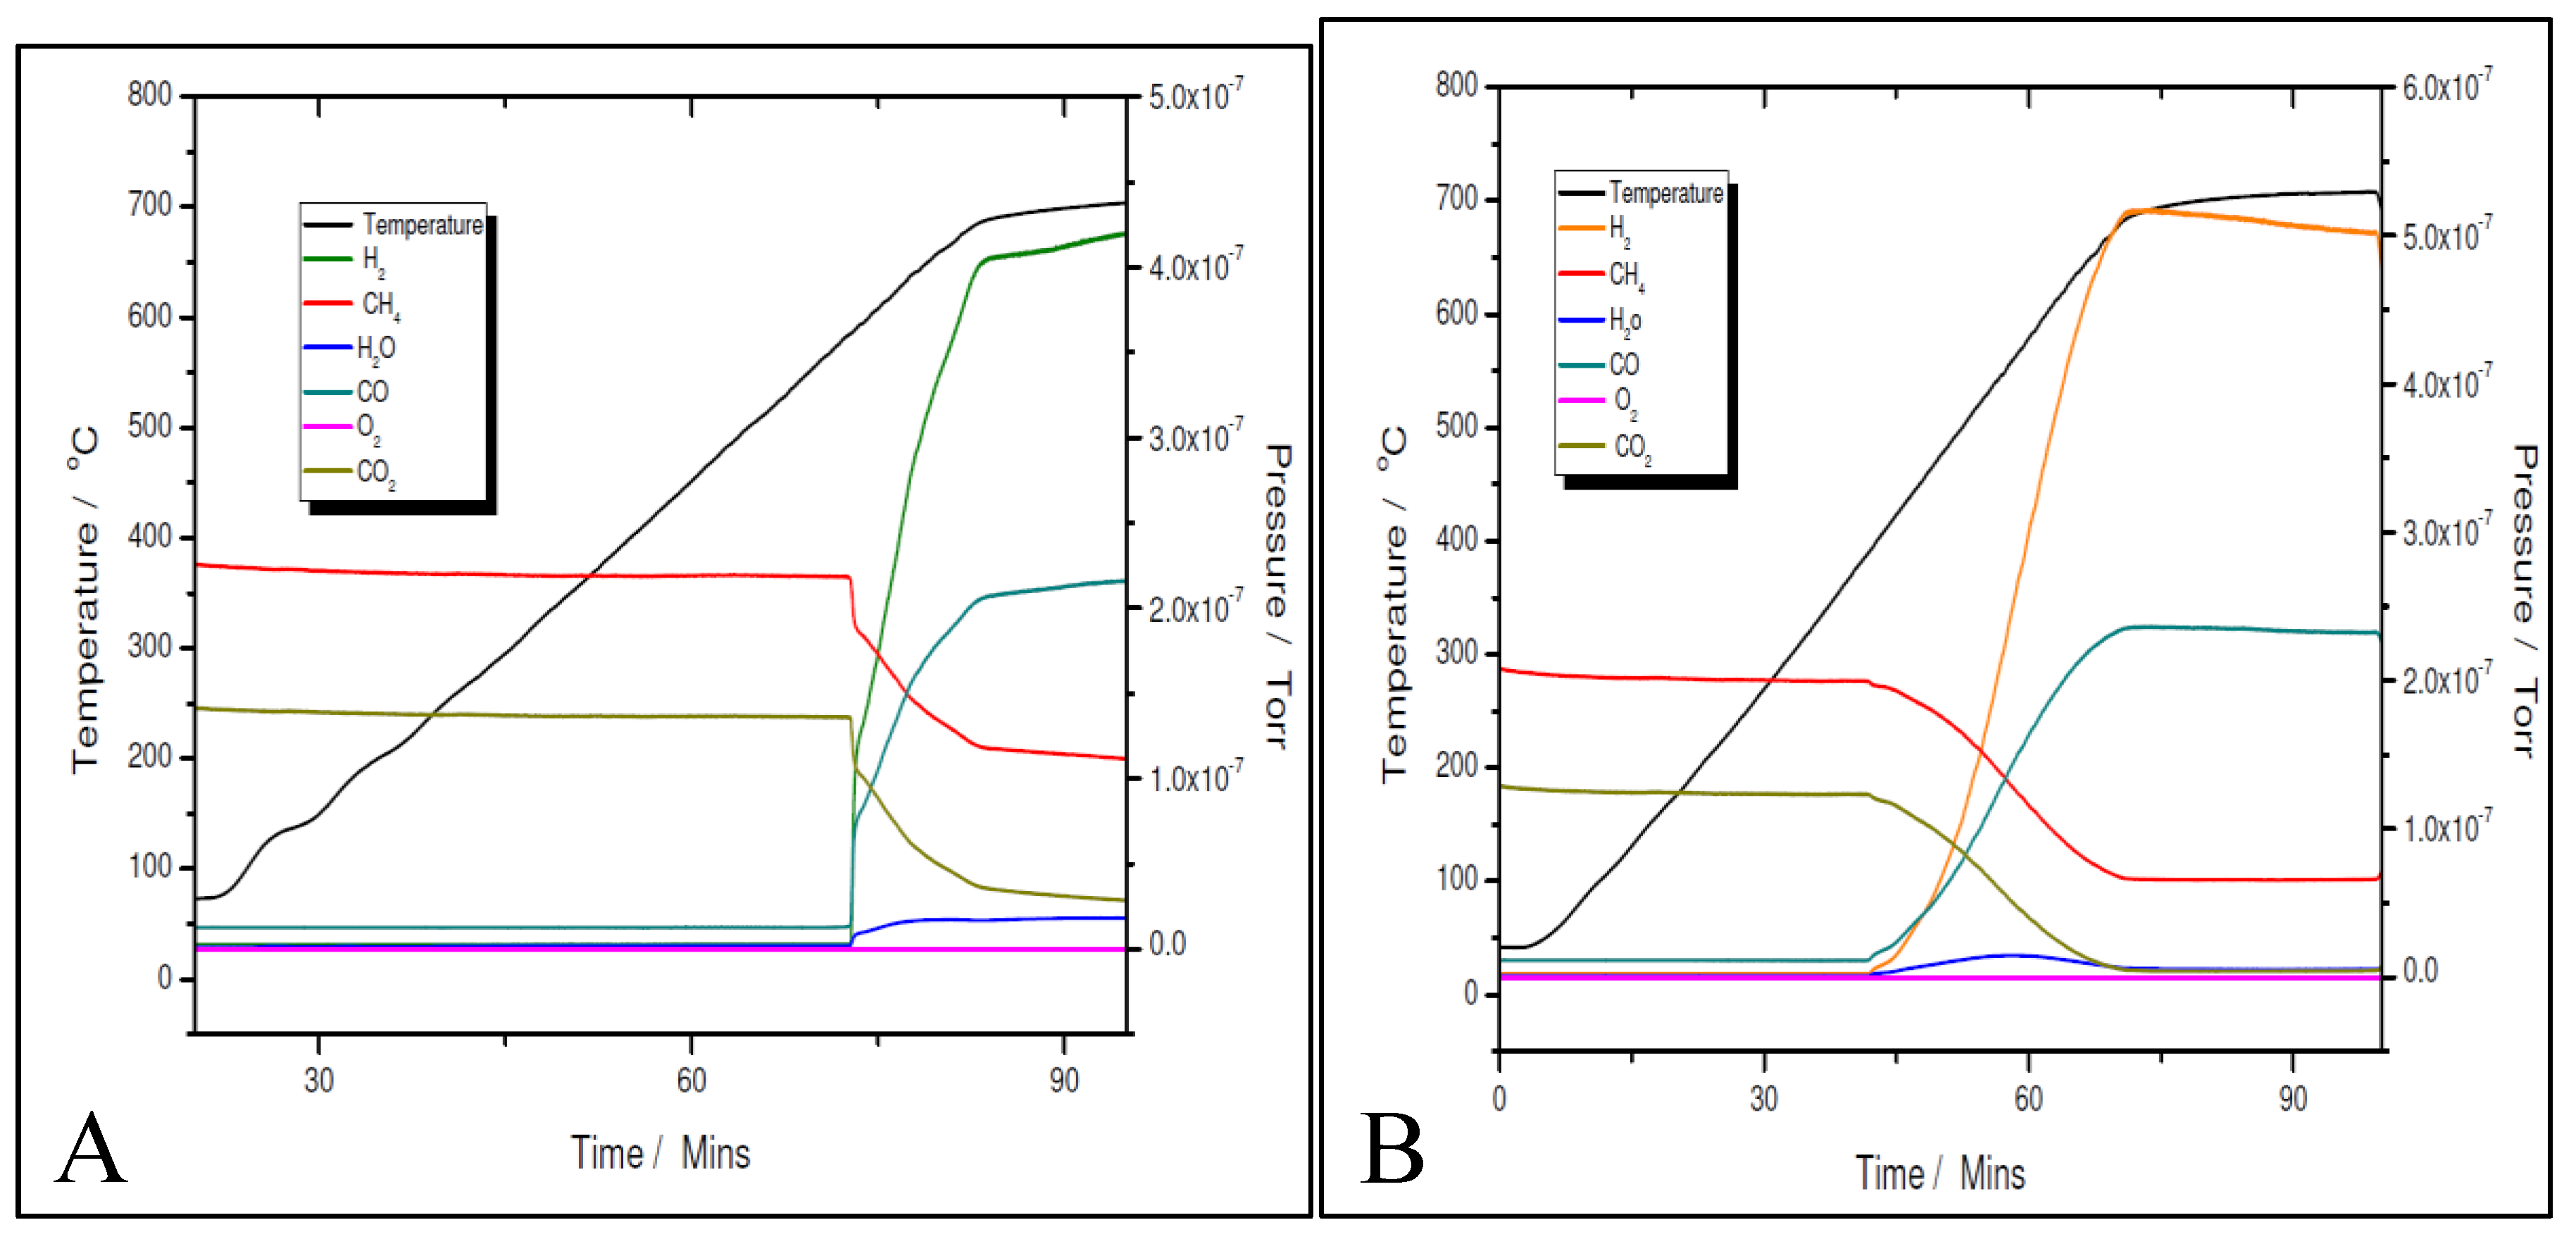
Figure 14.
Temperature programmed CH4 decomposition (reduction) over 5% Ni (A) and 11% Ni (B).
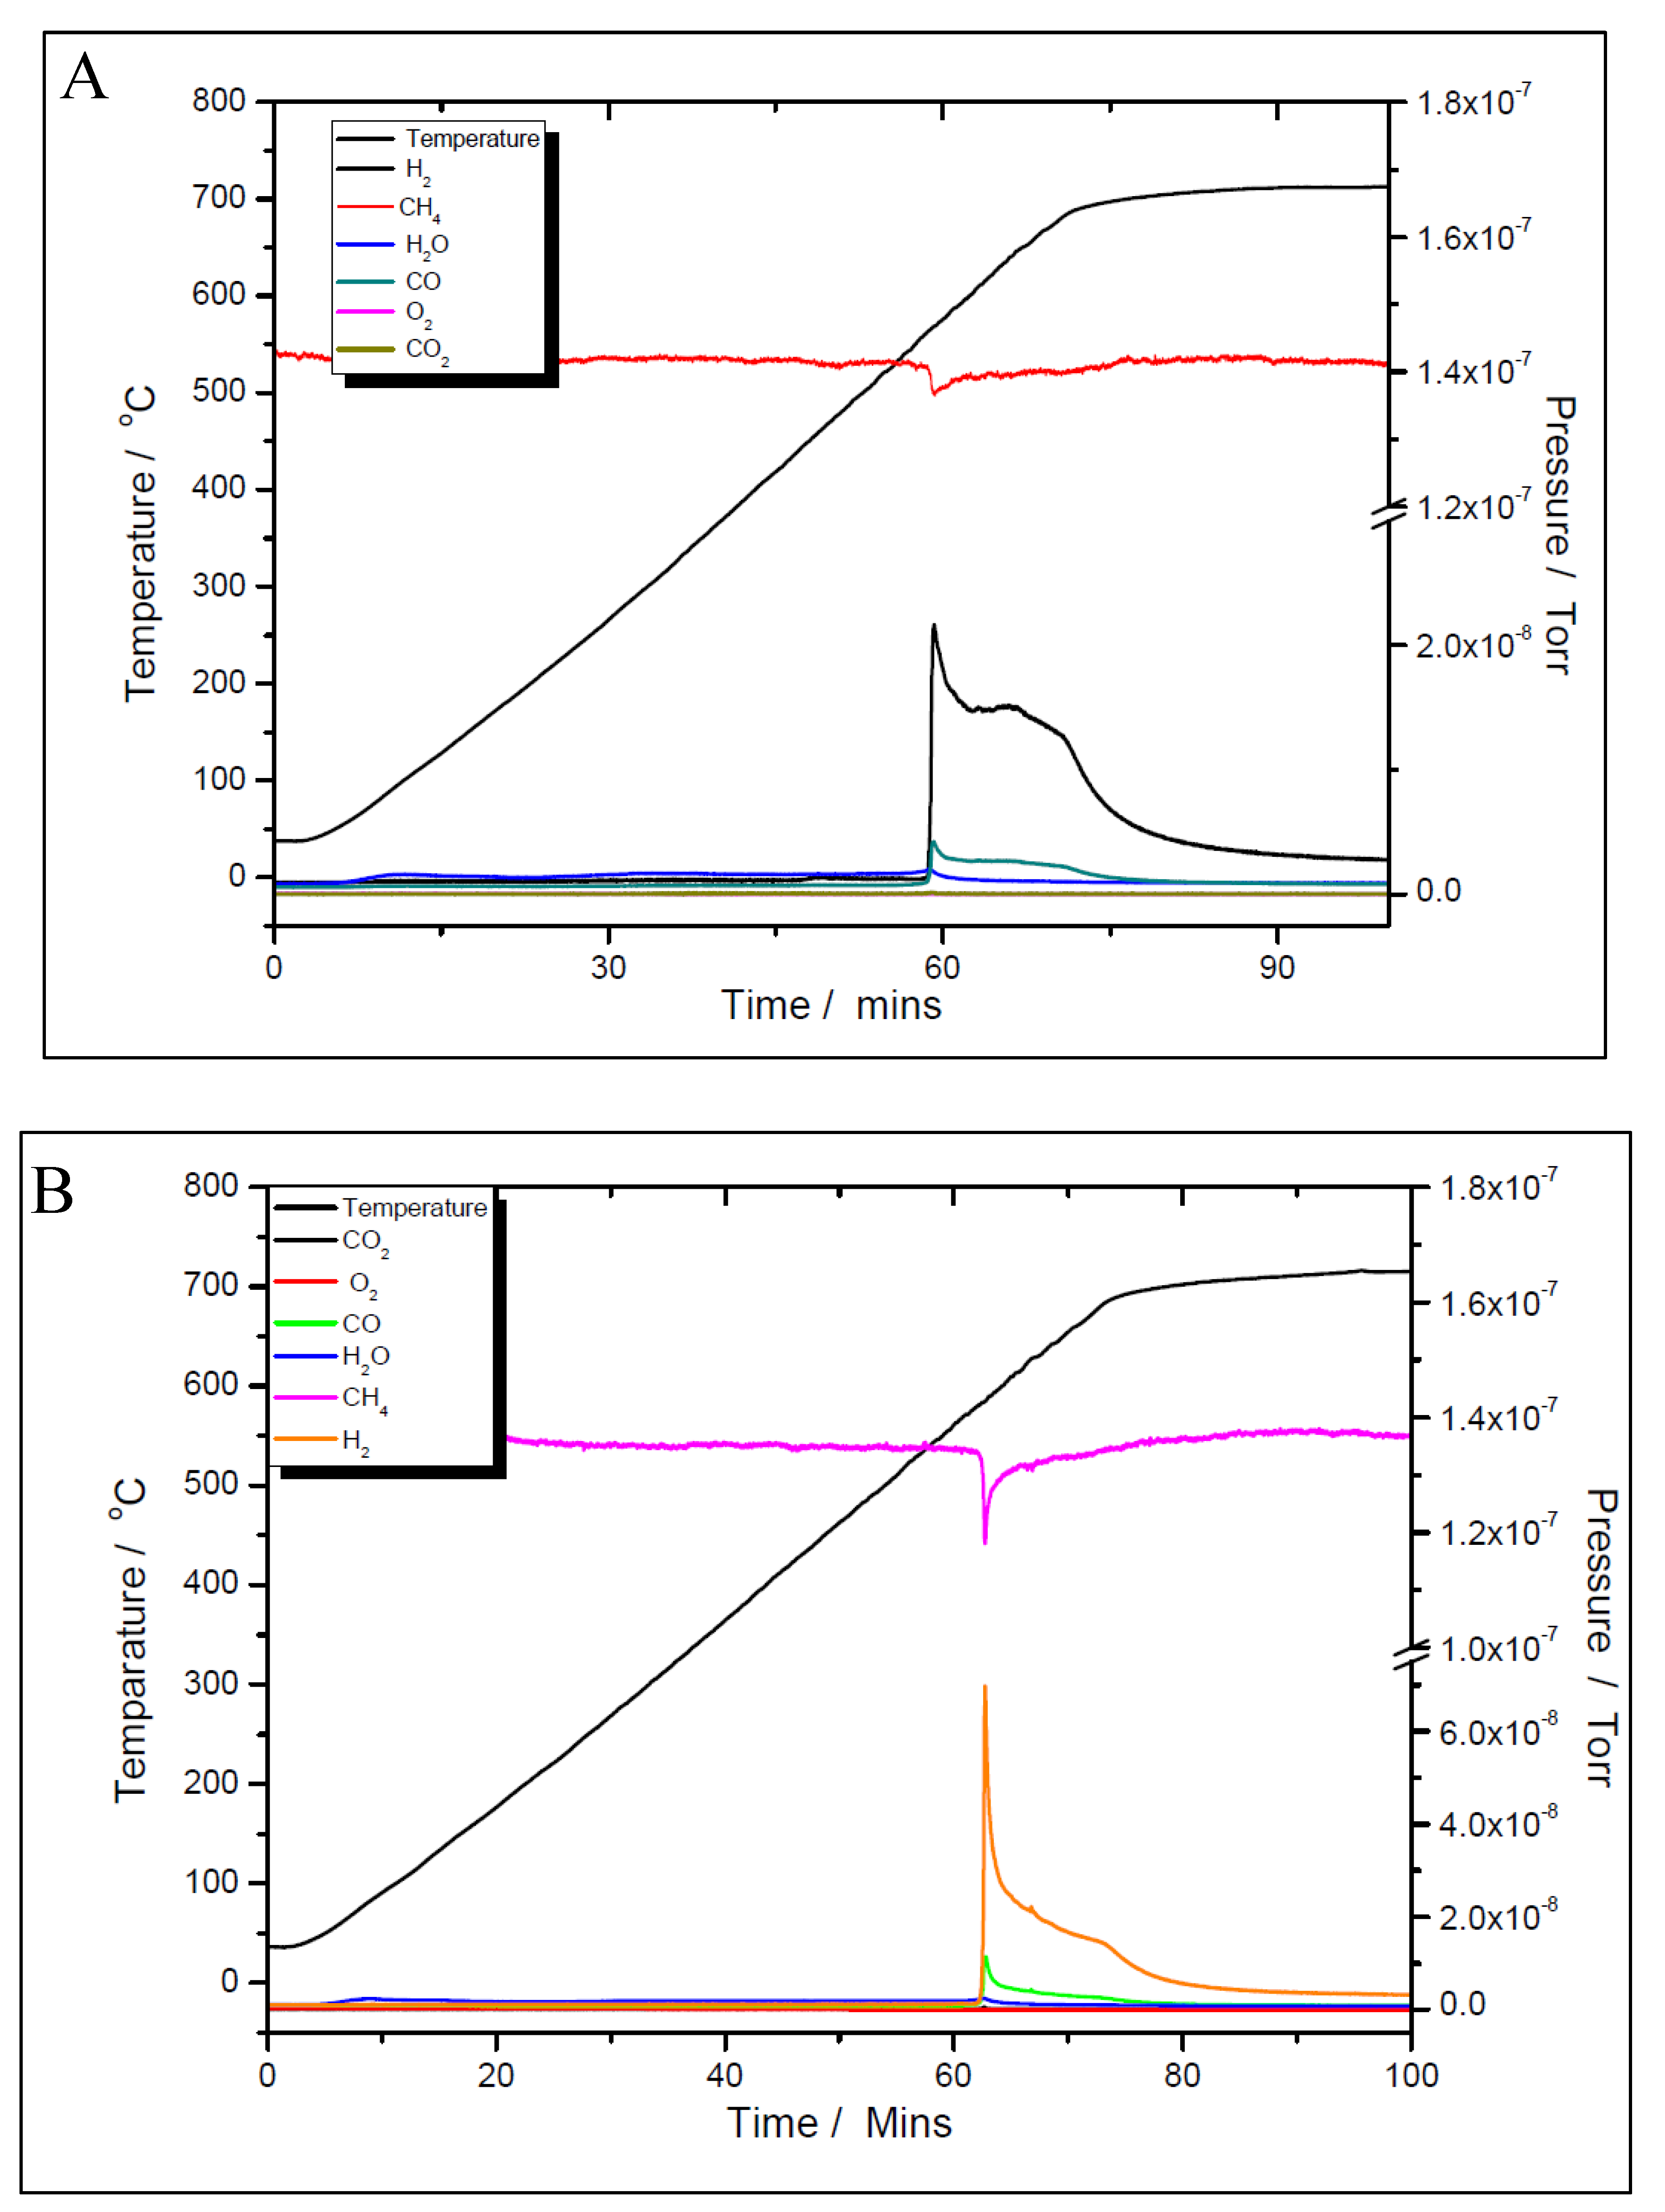
Figure 13.
CH4 (A) and CO2 (B) response to single-pulse experiments with a CH4:CO2 = 1.5:1 mixture over pre-reduced 5% Ni sample at temperatures from RT to 600 °C; CH4 and CO2 intensity normalized responses at 600 °C.
Figure 13.
CH4 (A) and CO2 (B) response to single-pulse experiments with a CH4:CO2 = 1.5:1 mixture over pre-reduced 5% Ni sample at temperatures from RT to 600 °C; CH4 and CO2 intensity normalized responses at 600 °C.
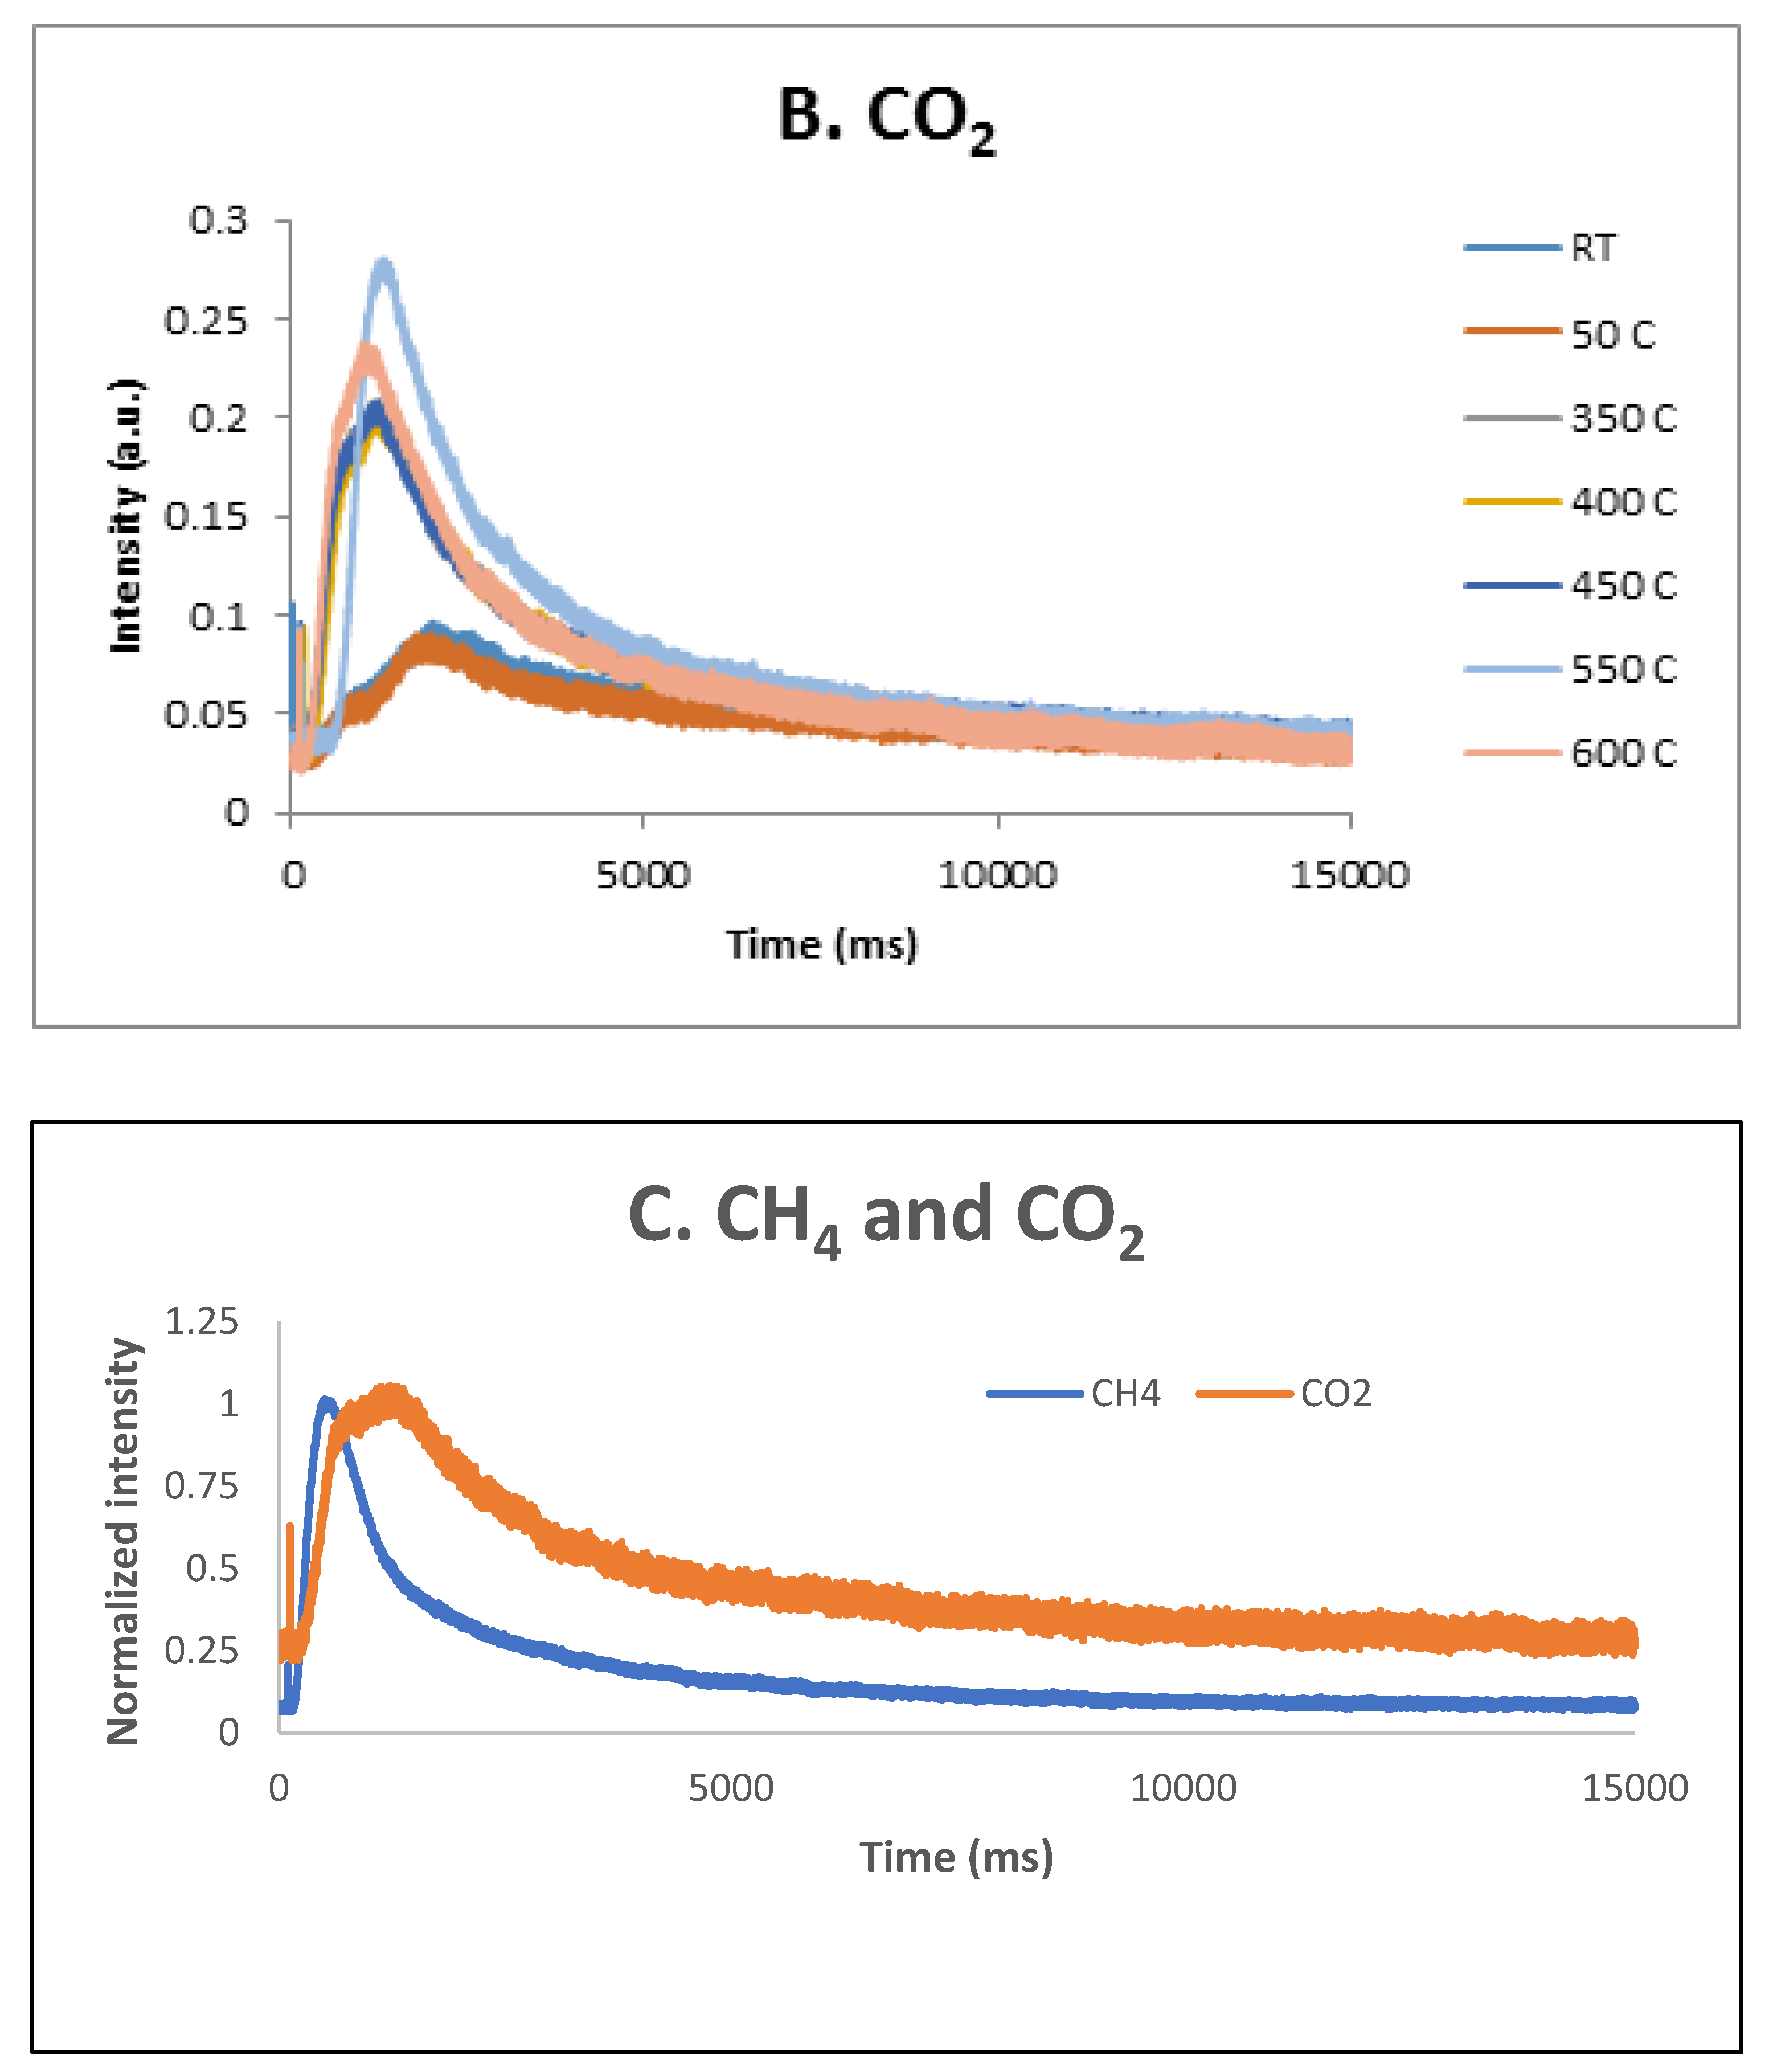
Figure 15.
Temperature programmed oxidation to recover carbon from the surface of 5% Ni (A) and 11% Ni (B).
Figure 15.
Temperature programmed oxidation to recover carbon from the surface of 5% Ni (A) and 11% Ni (B).
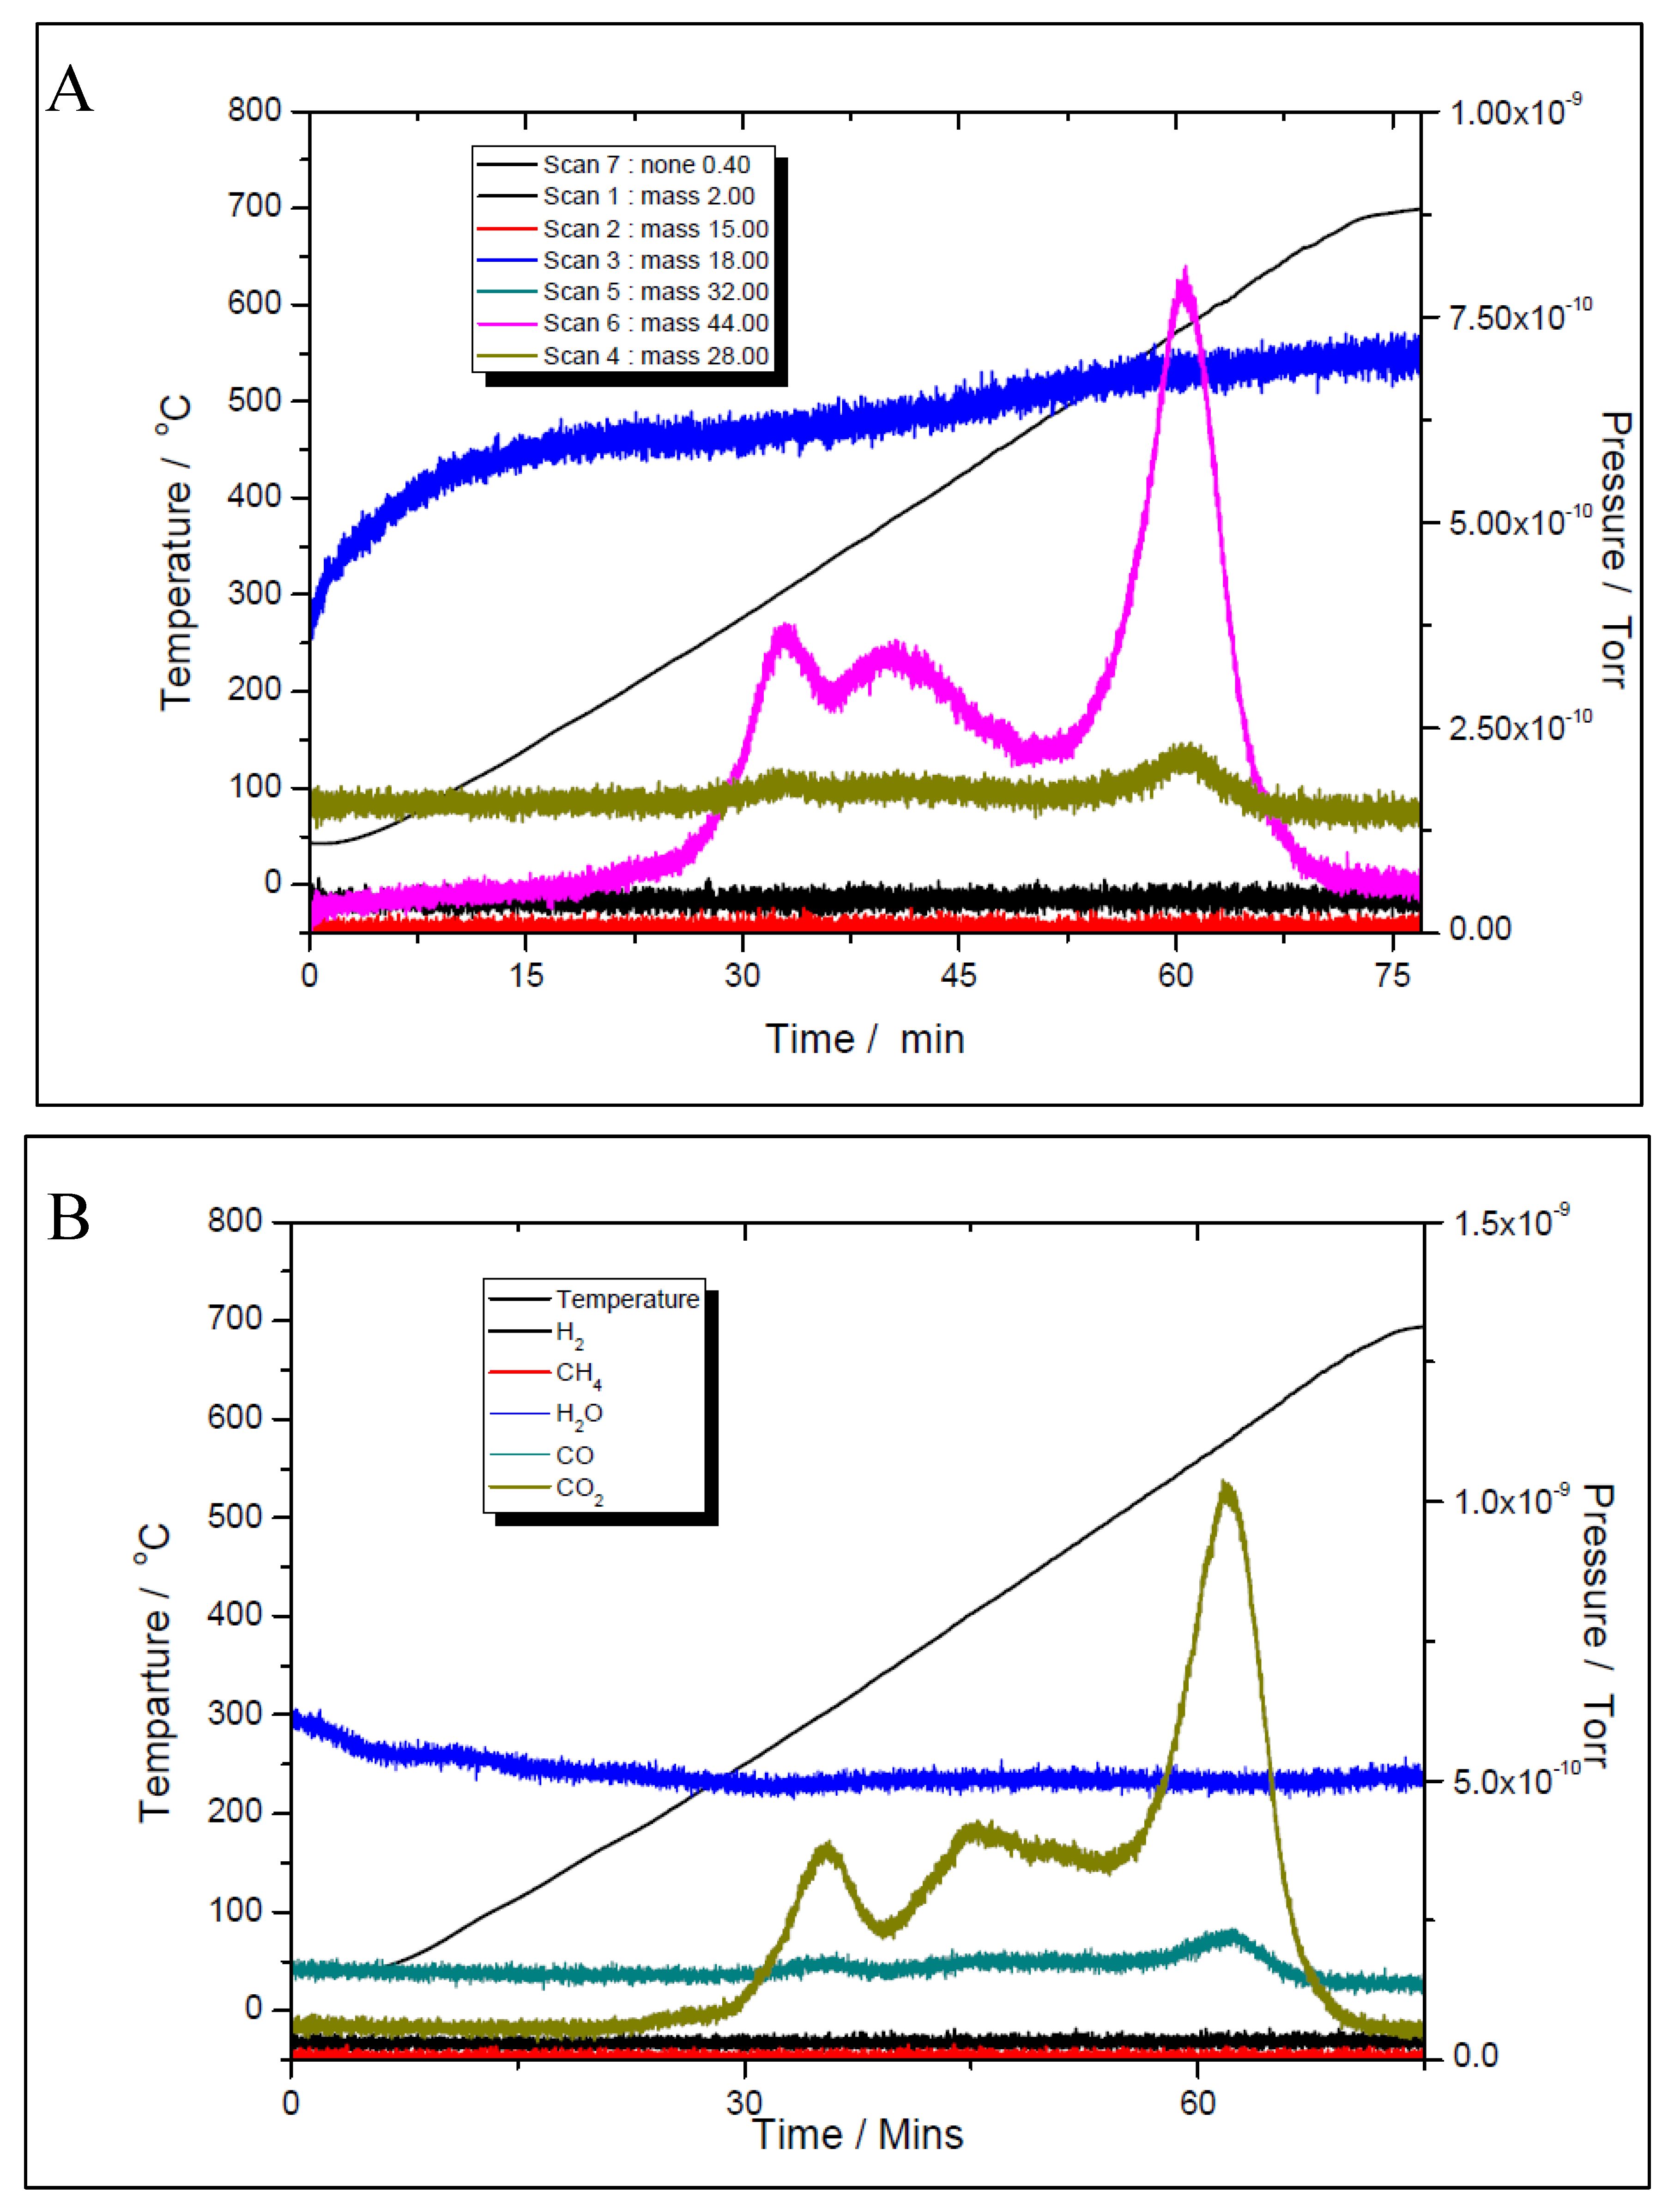

Table 1.
Physico-chemical properties of support and catalysts.
| Sample | d100 (nm) | a (nm) | SBET (m2/g) | Pore diameter (nm) | Pore vol. (cm3/g) |
|---|---|---|---|---|---|
| SBA-15 | 8.4 | 9.7 | 720 | 6.5 | 0.94 |
| 5% Ni | 7.7 | 8.9 | 547 | 3.2 | 0.82 |
| 11% Ni | 7.4 | 8.5 | 506 | 2.6 | 0.74 |
Disclaimer/Publisher’s Note: The statements, opinions and data contained in all publications are solely those of the individual author(s) and contributor(s) and not of MDPI and/or the editor(s). MDPI and/or the editor(s) disclaim responsibility for any injury to people or property resulting from any ideas, methods, instructions or products referred to in the content. |
© 2025 by the authors. Licensee MDPI, Basel, Switzerland. This article is an open access article distributed under the terms and conditions of the Creative Commons Attribution (CC BY) license (http://creativecommons.org/licenses/by/4.0/).
Copyright: This open access article is published under a Creative Commons CC BY 4.0 license, which permit the free download, distribution, and reuse, provided that the author and preprint are cited in any reuse.


