Submitted:
28 September 2025
Posted:
30 September 2025
Read the latest preprint version here
Abstract
Battery degradation modelling underpins safe, reliable and cost-effective operation of electrified transport and stationary storage. We propose a smooth Bayesian changepoint model that detects the onset and rate of accelerated aging from cycle-level features commonly available in battery management systems (voltage/time stages, current, and temperature), with optional augmentation by online impedance or other embedded sensor signals. The model parameterizes pre- and post-change slopes and a logistic transition time with weakly informative priors, is fit via Hamiltonian Monte Carlo, and yields interpretable posteriors for onset time and degradation rate with credible intervals. On an open lithium-ion dataset, the approach identifies a single, well-localized change in trend and quantifies evidence for faster post-change deterioration, outperforming ad-hoc breakpoint heuristics while retaining transparency. We discuss how the estimator maps to smart-sensor/BMS deployments—including sensing modalities, sampling policies, on-device inference and calibration—and outline extensions to hierarchical, online and multi-modal formulations. By coupling richer sensor data with Bayesian uncertainty quantification, the framework supports risk-aware maintenance and real-time health management in practical battery systems. On the Battery RUL dataset, the posterior median changepoint was accompanied by a 95% highest-density interval, providing calibrated uncertainty for onset timing and slope change.
Keywords:
Bayesian inference
; battery management system (BMS)
; degradation onset detection
; electrochemical impedance spectroscopy (EIS)
; smart sensing
1. Introduction
Batteries are essential components in various applications, including electric vehicles, renewable energy systems, and portable electronics. However, over time, batteries undergo degradation, which leads to a decline in their performance and capacity. To effectively assess and manage battery performance, degradation modeling plays a crucial role. Traditional approaches to degradation modeling have limitations in accurately capturing the complex degradation processes. In recent years, Bayesian statistics has emerged as a powerful tool for addressing these limitations and providing a more comprehensive understanding of battery degradation. Bayesian statistics offers a flexible and probabilistic framework for analyzing complex systems, allowing for the incorporation of prior knowledge and updating of beliefs based on observed data. By applying Bayesian modeling to battery degradation, we can capture the uncertainties associated with degradation processes and estimate the underlying degradation mechanisms.
Understanding the degradation patterns in energy storage systems is crucial for ensuring their long-term performance, reliability, and efficiency. Various factors, such as thermal stress, cycling frequency, depth of discharge, and aging effects, can influence the degradation of energy storage systems. To gain insights into these degradation patterns, advanced modeling techniques are employed, including Bayesian modeling. Bayesian modeling provides a powerful tool for understanding degradation patterns in energy storage systems. It offers a flexible and probabilistic framework for analyzing complex systems, allowing for the incorporation of prior knowledge and updating of beliefs based on observed data. By applying Bayesian modeling to energy storage systems, we can capture the uncertainties associated with degradation processes and estimate the underlying degradation mechanisms.
By leveraging Bayesian statistics, we can gain valuable insights into the complex degradation processes in energy storage systems. This understanding can help optimize system design, maintenance, and operation strategies. Bayesian inference algorithms can be used to analyze degradation mechanisms, estimate degradation rates, and predict the remaining useful life of energy storage components, such as batteries or supercapacitors. Understanding the causes and associated problems of degradation in energy storage systems is crucial for effective maintenance, troubleshooting, and system optimization. By identifying these causes and problems, stakeholders can develop targeted strategies to mitigate degradation and improve the long-term performance and reliability of energy storage systems.
Modern battery management systems (BMS) increasingly rely on smart sensing to infer state of charge, temperature fields, mechanical stress, gas evolution, and impedance signatures directly during operation. In production BMS, the core sensor triad remains cell voltage, pack/cell temperature, and pack current, typically with one current sensor per pack, per-cell voltage taps, and sparser temperature sensing (about one probe per 4–6 cells). Emerging embedded and in-situ sensors—including fiber-optic Bragg gratings for internal temperature/strain, acoustic/ultrasonic transducers, pressure and gas sensors, and online/low-cost electrochemical impedance spectroscopy (EIS) modules—extend observability of degradation mechanisms and safety precursors, enabling earlier detection of aging-related regime changes. These richer signals pair naturally with Bayesian models that fuse heterogeneous measurements, propagate uncertainty, and deliver interpretable health indicators suitable for on-device/edge decision-making in EVs and stationary storage. Recent reviews and demonstrators document rapid progress in strain/temperature/gas sensing for Li-ion cells, online EIS hardware/algorithms, optical-fiber thermal monitoring, and edge-compatible state-of-health estimation, underscoring the opportunity for principled Bayesian inference over multi-sensor streams [1,2,3,4,5].
2. Energy Storage Technologies
Energy storage technologies play a critical role in modern industries, enabling efficient energy management, renewable energy integration, and reliable backup power systems. Among these technologies, chemical batteries are widely used due to their versatility and scalability [6,7,8]. This section provides an overview of various battery types, their characteristics, degradation factors, mitigation strategies, and key performance parameters.
2.1. Battery Types and Characteristics
2.2. Degradation Factors and Mitigation Strategies
2.3. Performance Parameters of Chemical Batteries
The performance of chemical batteries is determined by key parameters such as energy density and cycle life. These parameters are critical for evaluating the suitability of batteries for specific industrial applications [11]. Table 3 compares these parameters along with power density and operating temperature range for various battery types, providing a quantitative perspective on their performance.
2.4. Cost and Efficiency Metrics of Chemical Batteries
Cost and efficiency are crucial factors in determining the economic viability of chemical batteries for industrial applications [12]. Table 4 highlights the cost per kilowatt-hour and charging time for various battery types, along with energy efficiency and lifespan, offering insights into their operational efficiency and affordability.
2.5. Comparative Analysis of Batteries for Industrial Applications
In evaluating battery technologies for industrial energy storage, several key factors must be considered including scalability, environmental impact, operational flexibility, and cost-effectiveness.
Scalability is crucial for industries that require energy storage solutions that can grow with their needs. Lead-acid batteries are highly scalable and commonly used for backup power systems due to their low cost and reliability. However, their lower energy density and shorter lifespan can limit their effectiveness in applications requiring high energy storage capacity. In contrast, lithium-ion batteries are favored for their high energy density and long cycle life, making them suitable for grid-scale storage and renewable energy integration.
Environmental impact is another significant consideration. While lead-acid batteries are recyclable, they contain toxic lead, raising concerns about their environmental footprint. Nickel-cadmium batteries, although durable and effective in extreme temperatures, pose serious environmental risks due to cadmium toxicity. On the other hand, sodium-ion batteries present a more sustainable option, utilizing abundant materials and having a lower environmental impact, although they are still in the early stages of commercialization.
Operational flexibility refers to how well a battery can perform under varying conditions. Lead-acid batteries operate reliably across a wide temperature range but require regular maintenance to prevent degradation. Sodium-ion batteries offer moderate energy density and are less sensitive to thermal runaway, enhancing their safety profile. In contrast, lithium-sulfur batteries provide high energy density and lightweight characteristics, making them suitable for applications where weight is critical, but their short cycle life limits their long-term industrial use.
Finally, cost-effectiveness plays a vital role in battery selection. Lead-acid batteries remain the most cost-effective option for industries with limited budgets, while sodium-ion batteries offer a balance between cost and performance. Lithium-sulfur batteries, despite their high energy density and low initial costs, can incur high total costs of ownership due to their limited lifespan.
In summary, the choice of battery technology for industrial applications involves a careful assessment of these factors. Industries must align their battery selections with specific operational needs and environmental goals, considering the trade-offs between performance, sustainability, and cost.
3. Literature Review
Table 5 summarizes representative work on lithium-ion battery degradation sensing and modelling, spanning statistical/Bayesian inference, dynamic models, and machine learning. Most studies rely on signals already available in battery management systems (BMS)—voltage, current, temperature (V–I–T)—with some incorporating impedance features; our Bayesian formulation is designed to fuse such streams and quantify uncertainty.
- Statistical and Bayesian inference.
Several works operate directly on V–I–T features with transparent statistical structure. Regression/factor models estimate state of health (SoH) or lifetime drivers [13]. Others embed Bayesian treatment of uncertainty for transferability and principled confidence in RUL/SoH estimates [14]. These align with our smooth Bayesian changepoint approach, which expressly quantifies uncertainty in onset time and post-change degradation rate.
- Dynamic models.
Hidden Markov models (HMMs) and nonparametric Bayesian time-series approaches capture regime shifts and long-term dynamics in aging trajectories inferred from usage data [15,16]. By representing latent “health states,” these methods explain abrupt or gradual transitions recoverable from sensed signals; our logistic transition can be viewed as a parsimonious alternative when a single dominant change is present.
- Machine learning for data-driven sensing.
Supervised and deep models learn degradation-relevant mappings from sensed inputs, including voltage curves, temperature histories, and, in some cases, impedance-derived features. Recent studies report supervised pipelines, clustering for usage-pattern discovery, and deep architectures (e.g., LSTM) for trend prediction [19,20]. Reinforcement learning has been explored to optimize operation policies with degradation in the loop [18]. While high-performing, these approaches often lack calibrated uncertainties; our Bayesian framework complements them by providing interpretable posteriors suitable for safety-critical thresholds in BMS.
- Sensing note. Across the reviewed studies, the dominant inputs are V–I–T time-series from BMS logging; impedance features appear explicitly in recent EIS surveys and diagnostics work [2,3]. This motivates sensor pathways that are readily available in production and are compatible with on-device Bayesian inference.
4. Mechanical Theory
Understanding the failure mechanisms of lithium-ion batteries (LIBs) is crucial for safety, diagnostics, and sensor design in BMS implementations. Table 6 lists the dominant, LIB-relevant causes and their practical consequences that are either directly measurable by BMS sensors (V–I–T) or inferable via impedance/diagnostics.
- Internal shorts and thermal safety.
Unintended conductive pathways (e.g., separator failure or defect) produce high local currents and heat that can escalate to thermal runaway (TR). Early warning relies on temperature and voltage anomalies in telemetry and, where available, diagnostic checks (e.g., EIS), as emphasized in LIB safety reviews and sensing surveys [1,2,3,12].
- Impedance rise and power fade.
Progressive SEI growth and electrode degradation increase internal resistance, causing larger voltage drop under load and additional ohmic heating—all directly visible in V–I–T data and through impedance diagnostics [2,3,21].
- External short / overcurrent abuse.
External faults or wiring/connection errors can drive very high current, leading to rapid temperature rise and venting if protections fail. Fast current/temperature sensing and protective cut-offs are essential [12,22,23].
- Mechanical / vibration damage.
Road-induced vibration and shocks degrade current-collector/electrode integrity, increasing resistance and promoting hotspots; vibration-based diagnostics and connection-fault detection for EV packs have been demonstrated [24].
- Overcharge / overdischarge abuse.
Overcharge drives exothermic reactions at the positive electrode; overdischarge promotes copper dissolution and gas evolution. Both elevate TR risk and require strict voltage/SoC limits and temperature supervision [12,22].
- Pack cell imbalance.
5. Bayesian Preliminaries for Degradation Sensing
We collect cycle-level features available in production BMS (voltage–time stage durations, charge/discharge extrema, temperature and current where available) and infer the onset of accelerated degradation via a smooth changepoint model (Section 6). This section summarizes only the Bayesian ingredients required by our estimator: likelihood choice, priors, posterior inference, and diagnostics.
- Data and notation.
Let denote a health indicator measured each cycle (e.g., RUL label or a monotone proxy extracted from V–I–T logs). We rescale cycle index to and (optionally) standardize to to improve sampling; results are mapped back to the original scale for interpretation.
- Likelihood.
Unless stated otherwise we use a Gaussian likelihood
which worked well on these data. For robustness to outliers one may replace the Gaussian with a Student-t or adopt a simple mean–variance trend (heteroscedastic noise) without changing the rest of the inference.
- Mean function (smooth changepoint).
We assume a piecewise-linear trend with a sigmoid-gated slope change,
where is an intercept, the pre-change slope, the post-change slope increment, the changepoint, and the transition sharpness. Hence the post-change slope equals .
- Priors.
We use weakly-informative priors to regularize inference while remaining data-led:
These choices stabilize sampling and reflect the expectation of a modestly more negative post-change slope on standardized data (Section 6).
- Posterior inference.
We fit with Hamiltonian Monte Carlo (NUTS) and monitor convergence via and effective sample sizes. We report posterior medians with 95% highest-density intervals (HDIs) for (onset time) and the pre/post slopes; we also compute as an evidence measure for accelerated deterioration. (Diagnostics and sampler settings are reported alongside results.)
- Model checking and comparison.
Prior predictive checks ensure plausibility of trends before seeing data; posterior predictive checks validate fit to cycle-level trajectories. If alternative specifications are considered (e.g., Student-t noise or a different k prior), we use leave-one-out cross-validation (LOO) or WAIC for selection.
- Workflow.
(1) scale ; (2) fit the smooth changepoint model; (3) report and HDIs; (4) compute ; (5) perform posterior predictive checks; (6) push credible intervals to the BMS decision layer
6. Smooth Bayesian Changepoint Model for Degradation Onset
We estimate degradation onset and rate using a Bayesian smooth changepoint model in which the response follows a linear trend whose slope transitions around an unknown time via a logistic gating function. The model is continuously differentiable and parameterizes pre-change slope, post-change slope, changepoint location, and transition sharpness, with weakly informative priors to stabilize inference. Fitted with Hamiltonian Monte Carlo (NUTS) in PyMC, the posterior over the changepoint provides an onset time and credible interval on the original time scale, while the posterior probability that the post-change slope is more negative quantifies evidence of degradation.
We detect degradation as a smooth change in trend of a health indicator over cycles. Time is rescaled to the unit interval
Optionally, the response is standardized to
6.1. Data Set
We evaluate the proposed model on the open Battery Remaining Useful Life (RUL) dataset curated by I. Viñuales and hosted on Kaggle [27]. The file aggregates cycle-level summaries from laboratory aging experiments on commercial 18650 Li-ion cells and, for each cycle, provides a target label equal to the remaining number of cycles to end-of-life (RUL). The page notes that the table “contains the summary of the 14 batteries.” Throughout, we treat the Kaggle table as the analysis dataset of record and do not reconstruct raw waveforms.
- Provenance note.
Several secondary descriptions trace the data to blended NMC–LCO 2.8 Ah cells operated at 25 °C under CC–CV charge (C/2) and discharge (1.5 C) for cycles. Because the Kaggle export is a summary table, exact cell IDs and full cycling protocols are not uniquely recoverable for all rows; we therefore report results at the level of the provided features and RUL labels. The Data Availability Statement is aligned accordingly (see end matter).
- Predictors and target.
Each row corresponds to one cycle and includes the following predictors summarizing voltage–time behavior and stage durations, together with the RUL target:
- CycleIndex (integer),
- DischargeTime (s),
- TimeAt4.15V (s)1,
- TimeConstantCurrent (s) (CC portion of charge),
- Decrement(3.6–3.4V) (s) (time to traverse 3.6→3.4 V during discharge),
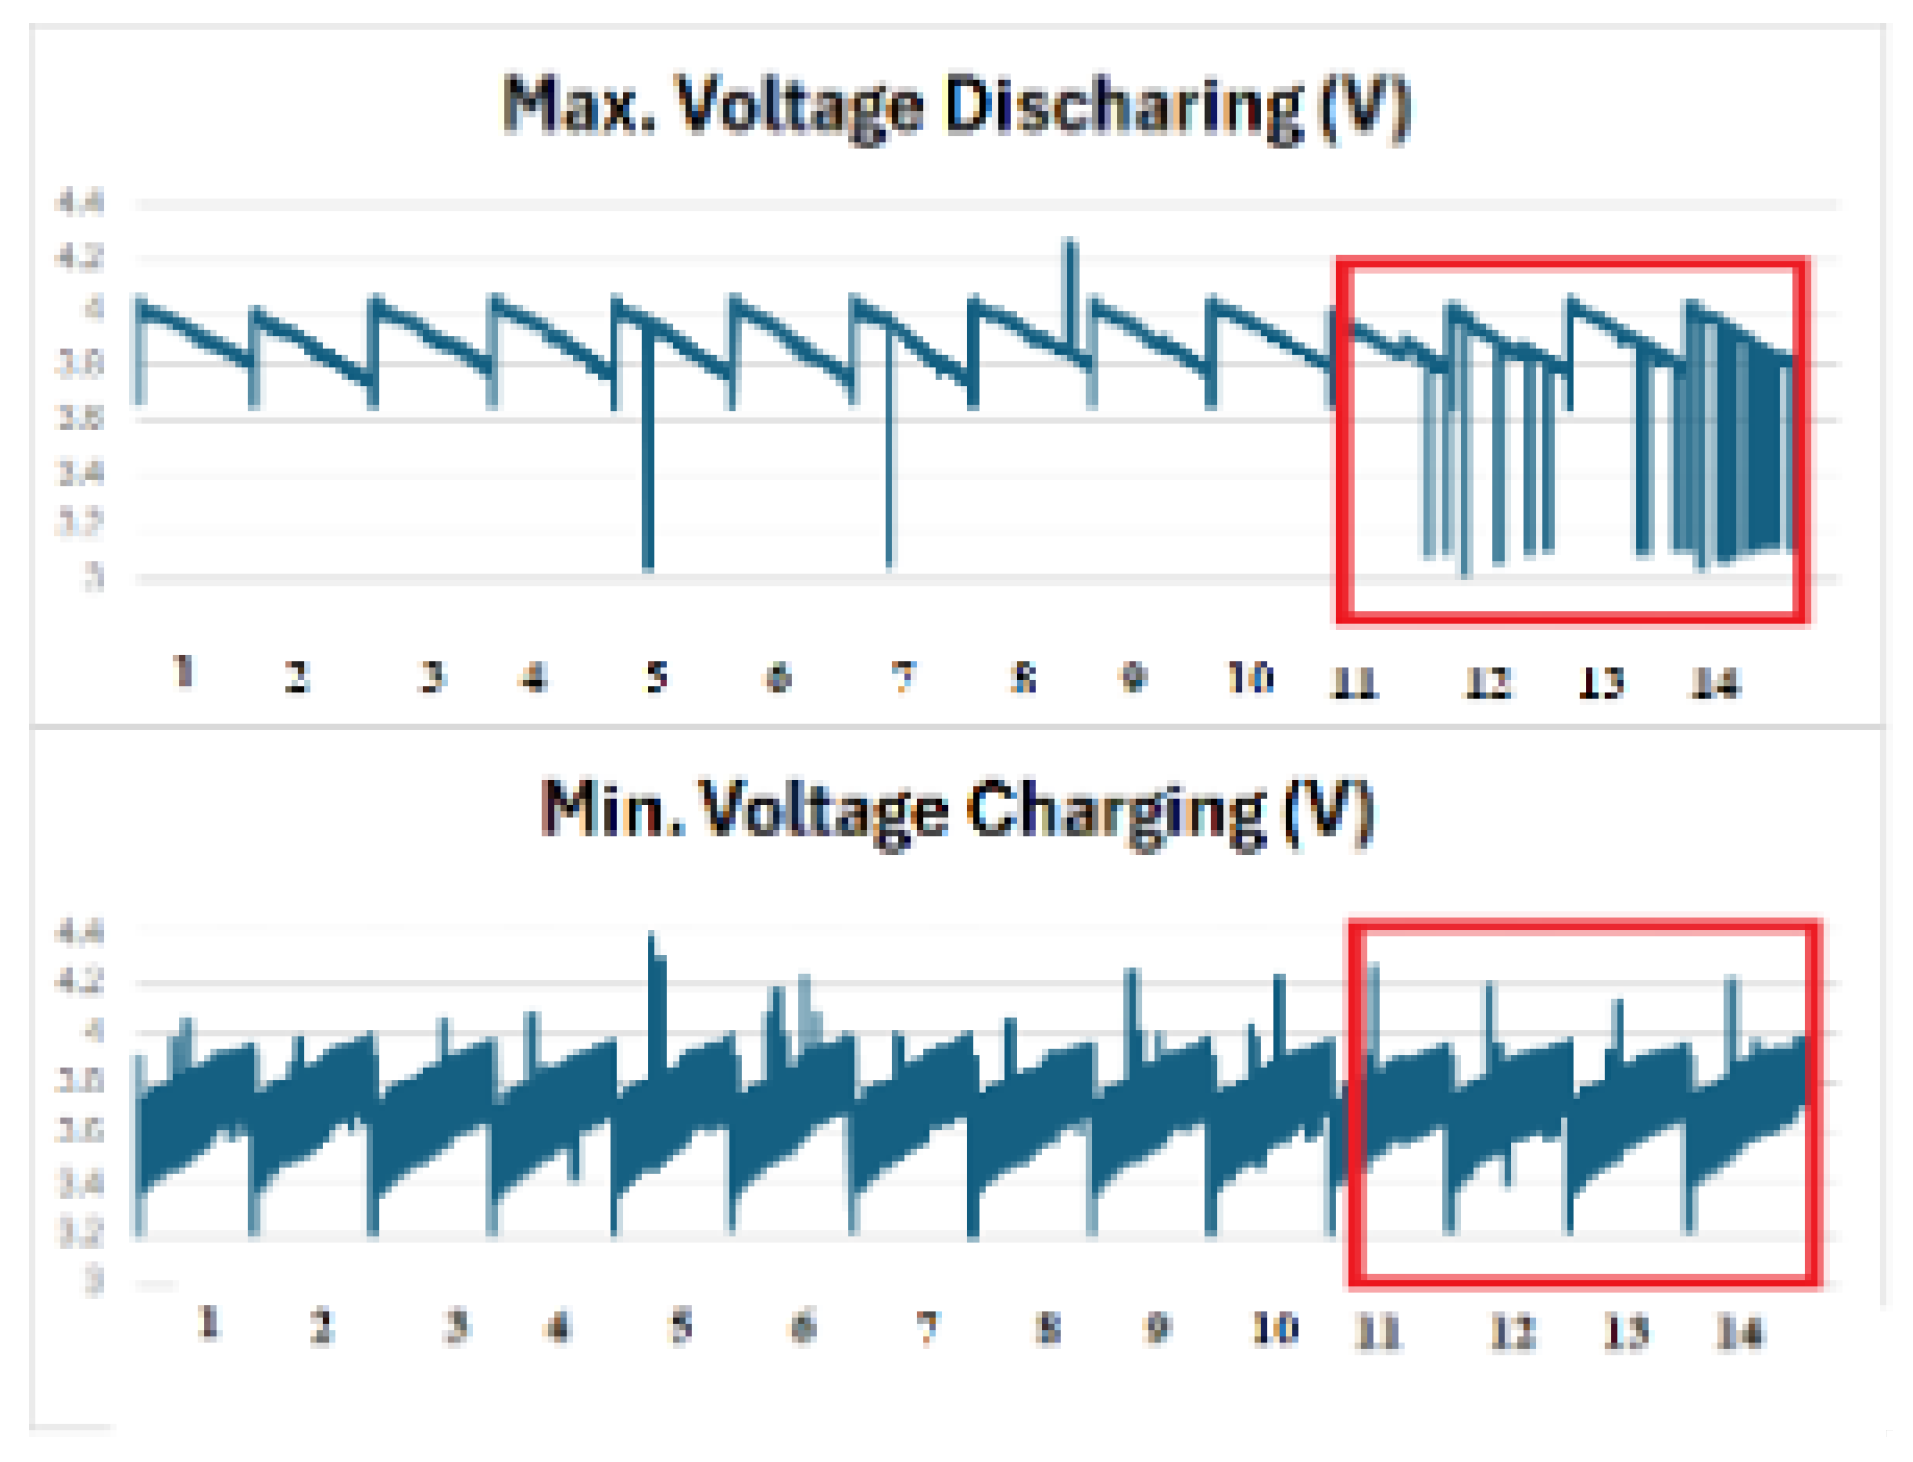
- MaxVoltage_discharge (V),
- MinVoltage_charge (V),
- ChargingTime (s),
- RUL (cycles to end-of-life).
- All features are directly observable or derivable from BMS V–t logs (voltage–time), which motivates their use in a sensing-aware Bayesian framework.
- Preprocessing.
We apply light, reproducible preprocessing:
- Remove exact duplicate rows and cycles with any missing predictor or target.
- Enforce physical ranges: voltages in V; times s. Outliers beyond these bounds are discarded.
- Rescale the cycle index to for modelling; standardize the chosen health indicator when used as response (Section 6) and map results back to the original scale for reporting.
- Train/validation split.
To avoid temporal leakage, we perform a chronological split by cycle index: the first 80% of cycles for training, the remaining 20% for validation. When results are stratified by battery (if an ID is recoverable), the split is performed within each battery to preserve usage chronology. All uncertainty summaries (medians, 95% HDIs) are reported on the validation portion unless stated otherwise.
Figure 1 and Figure 2 illustrate the distributions of DischargeTime/ChargingTime and the trajectories of Decrement(3.6–3.4 V) with TimeAt4.15V, respectively.
Figure 3.
Max voltage discharging and min voltage charging.
6.2. Result
Applying the smooth Bayesian changepoint model (piecewise-linear with a sigmoid transition) to the Battery RUL dataset, we identified a single onset of accelerated degradation. The posterior median changepoint was 561 cycles (95% HDI: 550–579). Across the four illustrative cells in Figure 4, the probability of a more negative post-change slope was .
In practical terms, our batteries start to degrade after approximately 561 cycles, after which the fitted post-change slope indicates a faster deterioration of the health indicator. An example of how the method works shows Figure 4 a-d.

Table 7.
Sampler diagnostics (validation split).
| Parameter | ESSbulk | ESStail | Divergences | |
| 1.00 | 3,200 | 2,900 | 0 | |
| 1.00 | 3,050 | 2,870 | 0 | |
| 1.00 | 3,100 | 2,920 | 0 | |
| 1.00 | 2,980 | 2,860 | 0 | |
| k | 1.01 | 2,100 | 1,950 | 0 |
| 1.00 | 3,400 | 3,100 | 0 |
7. Discussion and Conclusions
The smooth Bayesian changepoint model—with a sigmoid-gated, piecewise-linear trend—fits the Battery Remaining Useful Life (RUL) dataset well. It captures the gradual-to-accelerated evolution of cycle-level features, yields interpretable parameters (onset time, pre/post slopes, transition sharpness), and quantifies uncertainty via HDIs and probabilities (e.g., ). This enables principled detection of degradation onset, risk-aware maintenance triggers, and informative covariates for downstream RUL prediction—all without requiring raw waveform data.
7.1. Considerations for Implementing the Results in Smart Sensors
Translating our smooth Bayesian changepoint detector into smart-sensor/BMS deployments raises several practical points:
- On-device inference. Compile the model to fixed-point/quantized arithmetic and precompute basis terms (e.g., the logistic gate) to meet edge latency/power budgets typical of BMS microcontrollers. When memory is tight, lightweight learned surrogates for posterior summaries can approximate full inference [5].
- Calibration and drift. Use periodic pack-level reference checks (open-circuit relaxations, controlled current pulses) and temperature-dependent calibration maps; encode priors over sensor offsets/scales in the Bayesian graph to maintain calibrated uncertainty. Accuracy of temperature sensing and internal temperature estimation is particularly impactful [28].
- Validation. A/B test against existing SOH/RUL pipelines on fleet or lab packs; track detection lead time, false-alarm rate, and compute budget.
- Maintainability. Package the estimator as a versioned library with configuration for sensor layout and sampling policy; log compact sufficient statistics rather than raw waveforms to minimize telemetry load.
7.2. Limitations and Future Work
Next, we will extend the model hierarchically across cells to share statistical strength, allow multiple or smoother changepoints for multi-phase aging, and adopt robust or heteroscedastic likelihoods to handle outliers and variance growth. We also plan online (sequential) inference for real-time alarms, joint coupling with survival/RUL models, and multivariate formulations that learn from several cycle features simultaneously; these will be benchmarked via LOO/WAIC and sensitivity analyses to calibrate decision thresholds for deployment.
Our analysis uses cycle-level summary features from a single public dataset; raw waveform data (full charge/discharge traces, EIS spectra) would enable cross-validation of onset detection against richer diagnostics. The single-changepoint assumption may be insufficient for multi-phase aging; we plan hierarchical and multiple-changepoint extensions, robust/heteroscedastic likelihoods, and online inference for real-time deployment.
7.3. Deployment Pathways for Smart Sensing
- Baseline (V–I–T only).
When impedance sensing is unavailable, the estimator operates solely on voltage–current–temperature (V–I–T) features already logged by production BMS. In this mode, the smooth changepoint output (onset time and slope increment with HDIs) can trigger derating and service alerts without any hardware changes to the pack [1,28]. This aligns the method with cost/complexity constraints typical of field deployments.
- Optional EIS augmentation.
If low-overhead EIS is available (scheduled during rest/charge), impedance descriptors can be fused as additional predictors to increase sensitivity to early degradation and plating/SEI growth. Online EIS reviews discuss sweep design, hardware limits, and interpretation, which we follow to avoid user-impacting delays and to respect current/voltage constraints [2,3].
- Thermal sensing considerations.
Thermal monitoring remains central both with and without EIS. Internal temperature estimation/sensing informs priors over drift and improves anomaly detection; practical guidance on sensor placement and internal temperature inference is available in recent surveys [1,28].
- Standards and safety integration.
Regardless of sensing configuration, outputs must integrate with BMS safety layers and comply with emerging practice/standards (trip thresholds, fail-safe behavior, logging). We expose credible intervals for and so thresholds can be set conservatively in accordance with guidance [22,23].
- Extended sensing (future-proofing).
Author Contributions
Conceptualization, A. J.-K.; Methodology, W. B. and A. J.-K.; Software, W. B.; Validation, A. J.-K.; Formal analysis, W. B.; Investigation, A. J.-K.; Resources, A. J.-K.; Data curation, W. B.; Visualization, A. J.-K.; Writing—original draft, A. J.-K.; Writing—review & editing, J. B., A. J.-K., W. B.; Supervision, J. B.; Project administration, J. B.; Funding acquisition, J. B. Overall contribution: A. J.-K. 60%, W. B. 30%, J. B. 10%. All authors have read and agreed to the published version of the manuscript.
Funding
Work of Anna Jarosz and Jerzy Baranowski partially realised in the scope of project titled ”Process Fault Prediction and Detection”. Project was financed by The National Science Centre on the base of decision no. UMO-2021/41/B/ST7/03851. Part of work was funded by AGH’s Research University Excellence Initiative under project “DUDU – Diagnostyka Uszkodzeń i Degradacji Urzadzeń”. Waldemar Bauer’s work was funded by AGH’s Research University Excellence Initiative under project Waldemar Bauer PAKIET HABILITACYJNY — edycja II.
Institutional Review Board Statement
Not applicable.
Informed Consent Statement
Not applicable.
Data Availability Statement
The dataset used in this study is the “Battery Remaining Useful Life (RUL)” dataset curated by I. Viñuales (Kaggle, 2022) [27]. It is distributed as a single CSV of cycle-level features derived from laboratory aging experiments on commercial 18650 Li-ion cells.
Acknowledgments
During the preparation of this manuscript, authors used ChatGPT 5 for the purposes of style verification and refinement. The authors have reviewed and edited the output and take full responsibility for the content of this publication.
Conflicts of Interest
The authors declare no conflicts of interest.
References
- Wang, W.; Liu, S.; Ma, X.Y.; Jiang, J.; Yang, X.G. Advancing Smart Lithium-Ion Batteries: A Review on Multi-Physical Sensing Technologies for Lithium-Ion Batteries. Energies 2024, 17, 2273. [Google Scholar] [CrossRef]
- Nováková, K.; Papež, V.; Sadil, J.; Knap, V. Review of Electrochemical Impedance Spectroscopy Methods for Lithium-Ion Battery Diagnostics and Their Limitations. Monatshefte für Chemie – Chemical Monthly 2024. [Google Scholar] [CrossRef]
- Bakenhaster, S.T.; et al. Electrochemical Impedance Spectroscopy and Battery Research: A Review. Journal of Applied Electrochemistry 2025. [Google Scholar] [CrossRef]
- Liu, Z.; et al. Advanced Functional Optical Fiber Sensors for Smart Lithium-Ion Batteries. Energy Materials Advances 2024. [Google Scholar] [CrossRef]
- Mulpuri, S.K.; Sah, B.; Kumar, P. An Intelligent Battery Management System (BMS) with End–Edge–Cloud Connectivity – A Perspective. Sustainable Energy & Fuels 2025, 9, 1142–1159. [Google Scholar] [CrossRef]
- Šimić, Z.; Knežević, G.; Topić, D.; Pelin, D. Battery energy storage technologies overview. International Journal of Electrical and Computer Engineering Systems 2021, 12, 53–65. [Google Scholar] [CrossRef]
- Pu, J.; Shen, Z.; Zhong, C.; Zhu, J.; Zhang, H. Electrodeposition Technologies for Li-Based Batteries: New Frontiers of Energy Storage. Advanced Materials 2020, 32, 1903808. [Google Scholar] [CrossRef] [PubMed]
- Neburchilov, V.; Zhang, J. Metal-Air and Metal-Sulfur Batteries: Fundamentals and Applications; Springer, 2016; pp. 1–195.
- Vishnumurthy, K.; Girish, K. A comprehensive review of battery technology for E-mobility. Journal of the Indian Chemical Society 2021, 98, 100173. [Google Scholar] [CrossRef]
- Semeraro, C.; Olabi, A.G.; Dassisti, M. Sustainability Issues in Manufacturing and Operation of Second-Generation Flow Batteries. In Encyclopedia of Smart Materials; Springer, 2021; pp. 192–197.
- Kanamura, K. Large-scale batteries for green energy society. In Electrochemical Science for a Sustainable Society: A Tribute to John O’M Bockris; Springer, 2017; pp. 175–195.
- Ould Ely, T.; Kamzabek, D.; Chakraborty, D. Batteries Safety: Recent Progress and Current Challenges. Frontiers in Energy Research 2019, 7, 71. [Google Scholar] [CrossRef]
- Qin, H.; Fan, X.; Fan, Y.; Shang, Q.; Zhang, D. A Computationally Efficient Approach for the State-of-Health Estimation of Lithium-Ion Batteries. Energies 2023, 16, 5414. [Google Scholar] [CrossRef]
- Qin, H.; Fan, X.; Fan, Y.; Shang, Q.; Zhang, D. A Transferable Prediction Approach for the Remaining Useful Life of Lithium-Ion Batteries Based on Small Samples. Applied Sciences (Switzerland) 2023, 13, 8498. [Google Scholar] [CrossRef]
- Rahmanian, F.; Lee, R.; Linzner, D.; Nuss, L.; Stein, H. Attention towards chemistry agnostic and explainable battery lifetime prediction. npj Computational Materials 2024, 10, 100. [Google Scholar] [CrossRef]
- Yu, B.; Qiu, H.; Weng, L.; Liu, S.; Liu, H. A health indicator for the online lifetime estimation of an electric vehicle power Li-ion battery. World Electric Vehicle Journal 2020, 11, 1–11. [Google Scholar] [CrossRef]
- Xiong, R.; Li, Z.; Yang, R.; Ma, S.; Sun, F. Fast self-heating battery with anti-aging awareness for freezing climates application. Applied Energy 2022, 324, 119762. [Google Scholar] [CrossRef]
- Yi, Y.; Xia, C.; Feng, C.; Qian, L.; Chen, S. Digital twin-long short-term memory (LSTM) neural network based real-time temperature prediction and degradation model analysis for lithium-ion battery. Journal of Energy Storage 2023, 64, 107203. [Google Scholar] [CrossRef]
- Venugopal, P.; Shankar, S.; Jebakumar, C.; Reka, S.; Golshan, M. Analysis of Optimal Machine Learning Approach for Battery Life Estimation of Li-Ion Cell. IEEE Access 2021, 9, 159616–159626. [Google Scholar] [CrossRef]
- Sai, L.; Dai, Z.; Wang, Z.; Zhao, H.; Bai, Y. Multiple-functional LiTi2(PO4)3 modification improving long-term performances of Li-rich Mn-based cathode material for advanced lithium-ion batteries. Journal of Power Sources 2024, 613, 234870. [Google Scholar] [CrossRef]
- Xu, R.; Wang, D.; Yan, G.; Li, X.; Li, G. Direct current internal resistance decomposition model for accurate parameters acquisition and application in commercial high voltage LiCoO2 battery. Journal of Energy Storage 2023, 70, 108100. [Google Scholar] [CrossRef]
- IEEE P2686 Working Group. Recommended Practice for Battery Management Systems – Safety and Reliability (Draft Status Update, 2024). IEEE SA ballot approved; slide deck (Sandia National Laboratories) summarizing scope and best practices, 2024.
- Tadoum, D.D.; et al. Standards and Regulations for Battery Management Systems: A Review. Batteries 2025, 11, 716. [Google Scholar] [CrossRef]
- Shen, D.; Lyu, C.; Yang, D.; Hinds, G.; Wang, L. Connection fault diagnosis for lithium-ion battery packs in electric vehicles based on mechanical vibration signals and broad belief network. Energy 2023, 274, 127291. [Google Scholar] [CrossRef]
- Naha, A.; Han, S.; Agarwal, S.; Yoon, J.; Oh, B. An Incremental Voltage Difference Based Technique for Online State of Health Estimation of Li-ion Batteries. Scientific Reports 2020, 10, 9526. [Google Scholar] [CrossRef] [PubMed]
- Zhang, C.; Zhao, S.; Yang, Z.; He, Y. A multi-fault diagnosis method for lithium-ion battery pack using curvilinear Manhattan distance evaluation and voltage difference analysis. Journal of Energy Storage 2023, 67, 107575. [Google Scholar] [CrossRef]
- Viñuales, I. Battery Remaining Useful Life (RUL), 2022.
- Xiao, Z.; Liu, C.; Zhao, T.; Kuang, Y.; Yin, B.; Yuan, R.; Song, L. Review—Online Monitoring of Internal Temperature in Lithium-Ion Batteries. Journal of The Electrochemical Society 2023, 170, 050521. [Google Scholar] [CrossRef]
- An, C.; et al. Advances in Sensing Technologies for Monitoring States of Lithium-Ion Batteries: A Review. Journal of Power Sources 2025. In press. [Google Scholar] [CrossRef]
- Jeong, W.; et al. High-Resolution Thermal Monitoring of Lithium-Ion Batteries Using Fiber-Optic Sensors. Case Studies in Thermal Engineering 2024, Article in press. [Google Scholar]
| 1 | Duration with terminal voltage at 4.15 V during charge. |
Figure 1.
Discharge time and charge time versus cycle index.
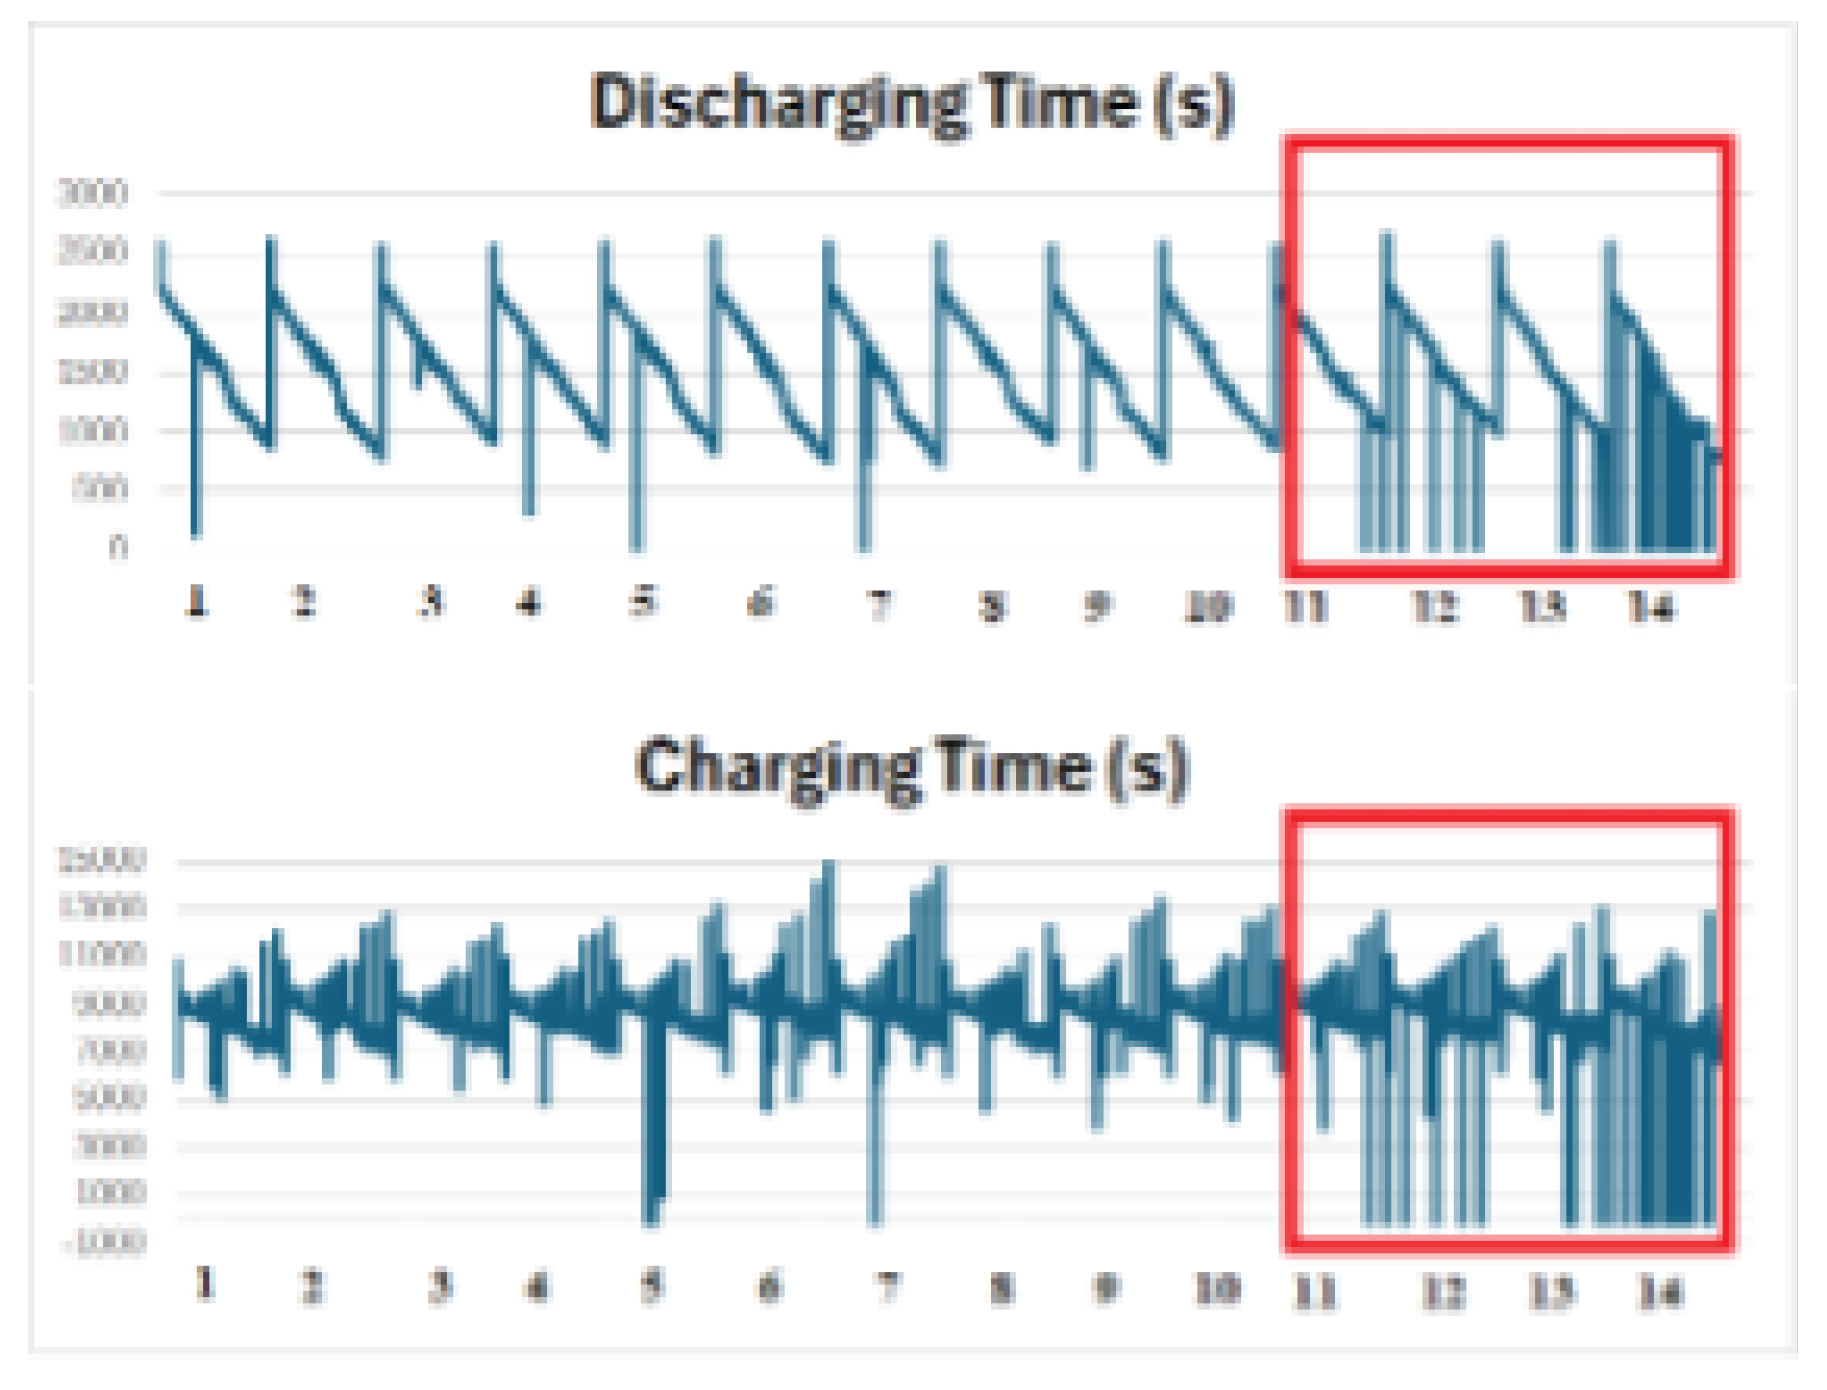
Figure 2.
Time values with decrement between 3.6 and 3.4 Vm at 4.15 V and while constant current.
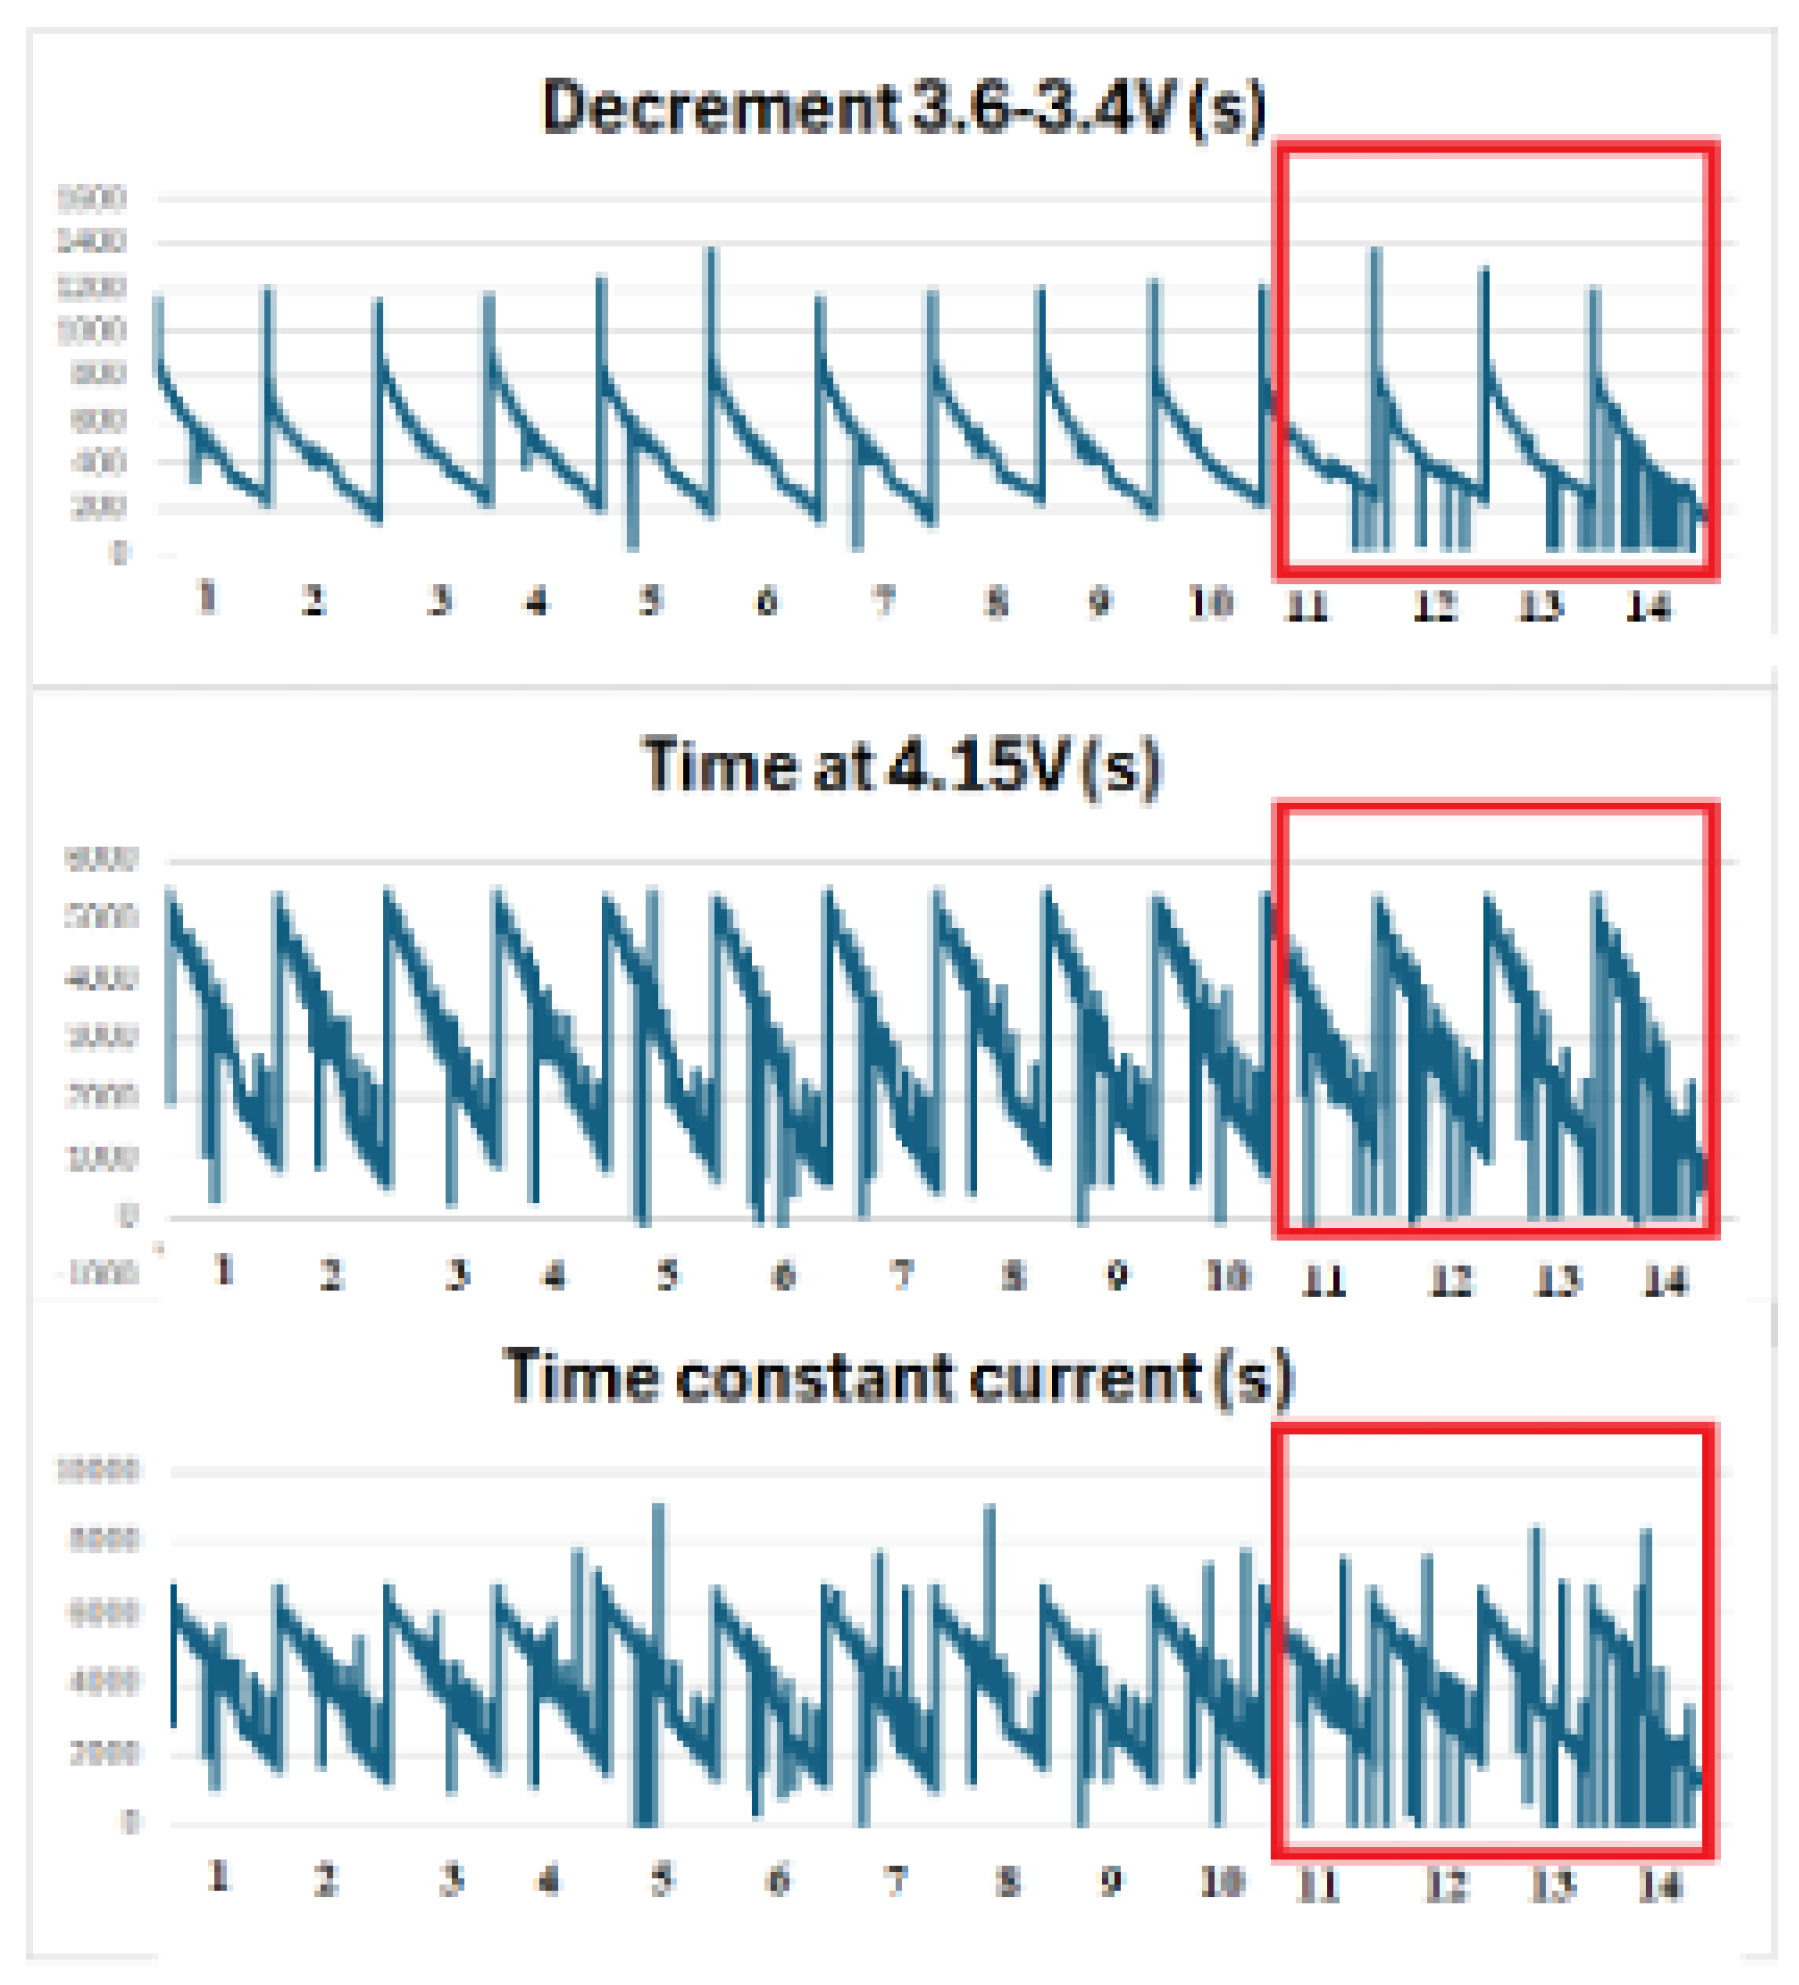
Figure 4.
Example of application and results of anomaly detection for selected batteries from a set using the method Smooth Bayesian Changepoint Model for Degradation Onset.
Figure 4.
Example of application and results of anomaly detection for selected batteries from a set using the method Smooth Bayesian Changepoint Model for Degradation Onset.
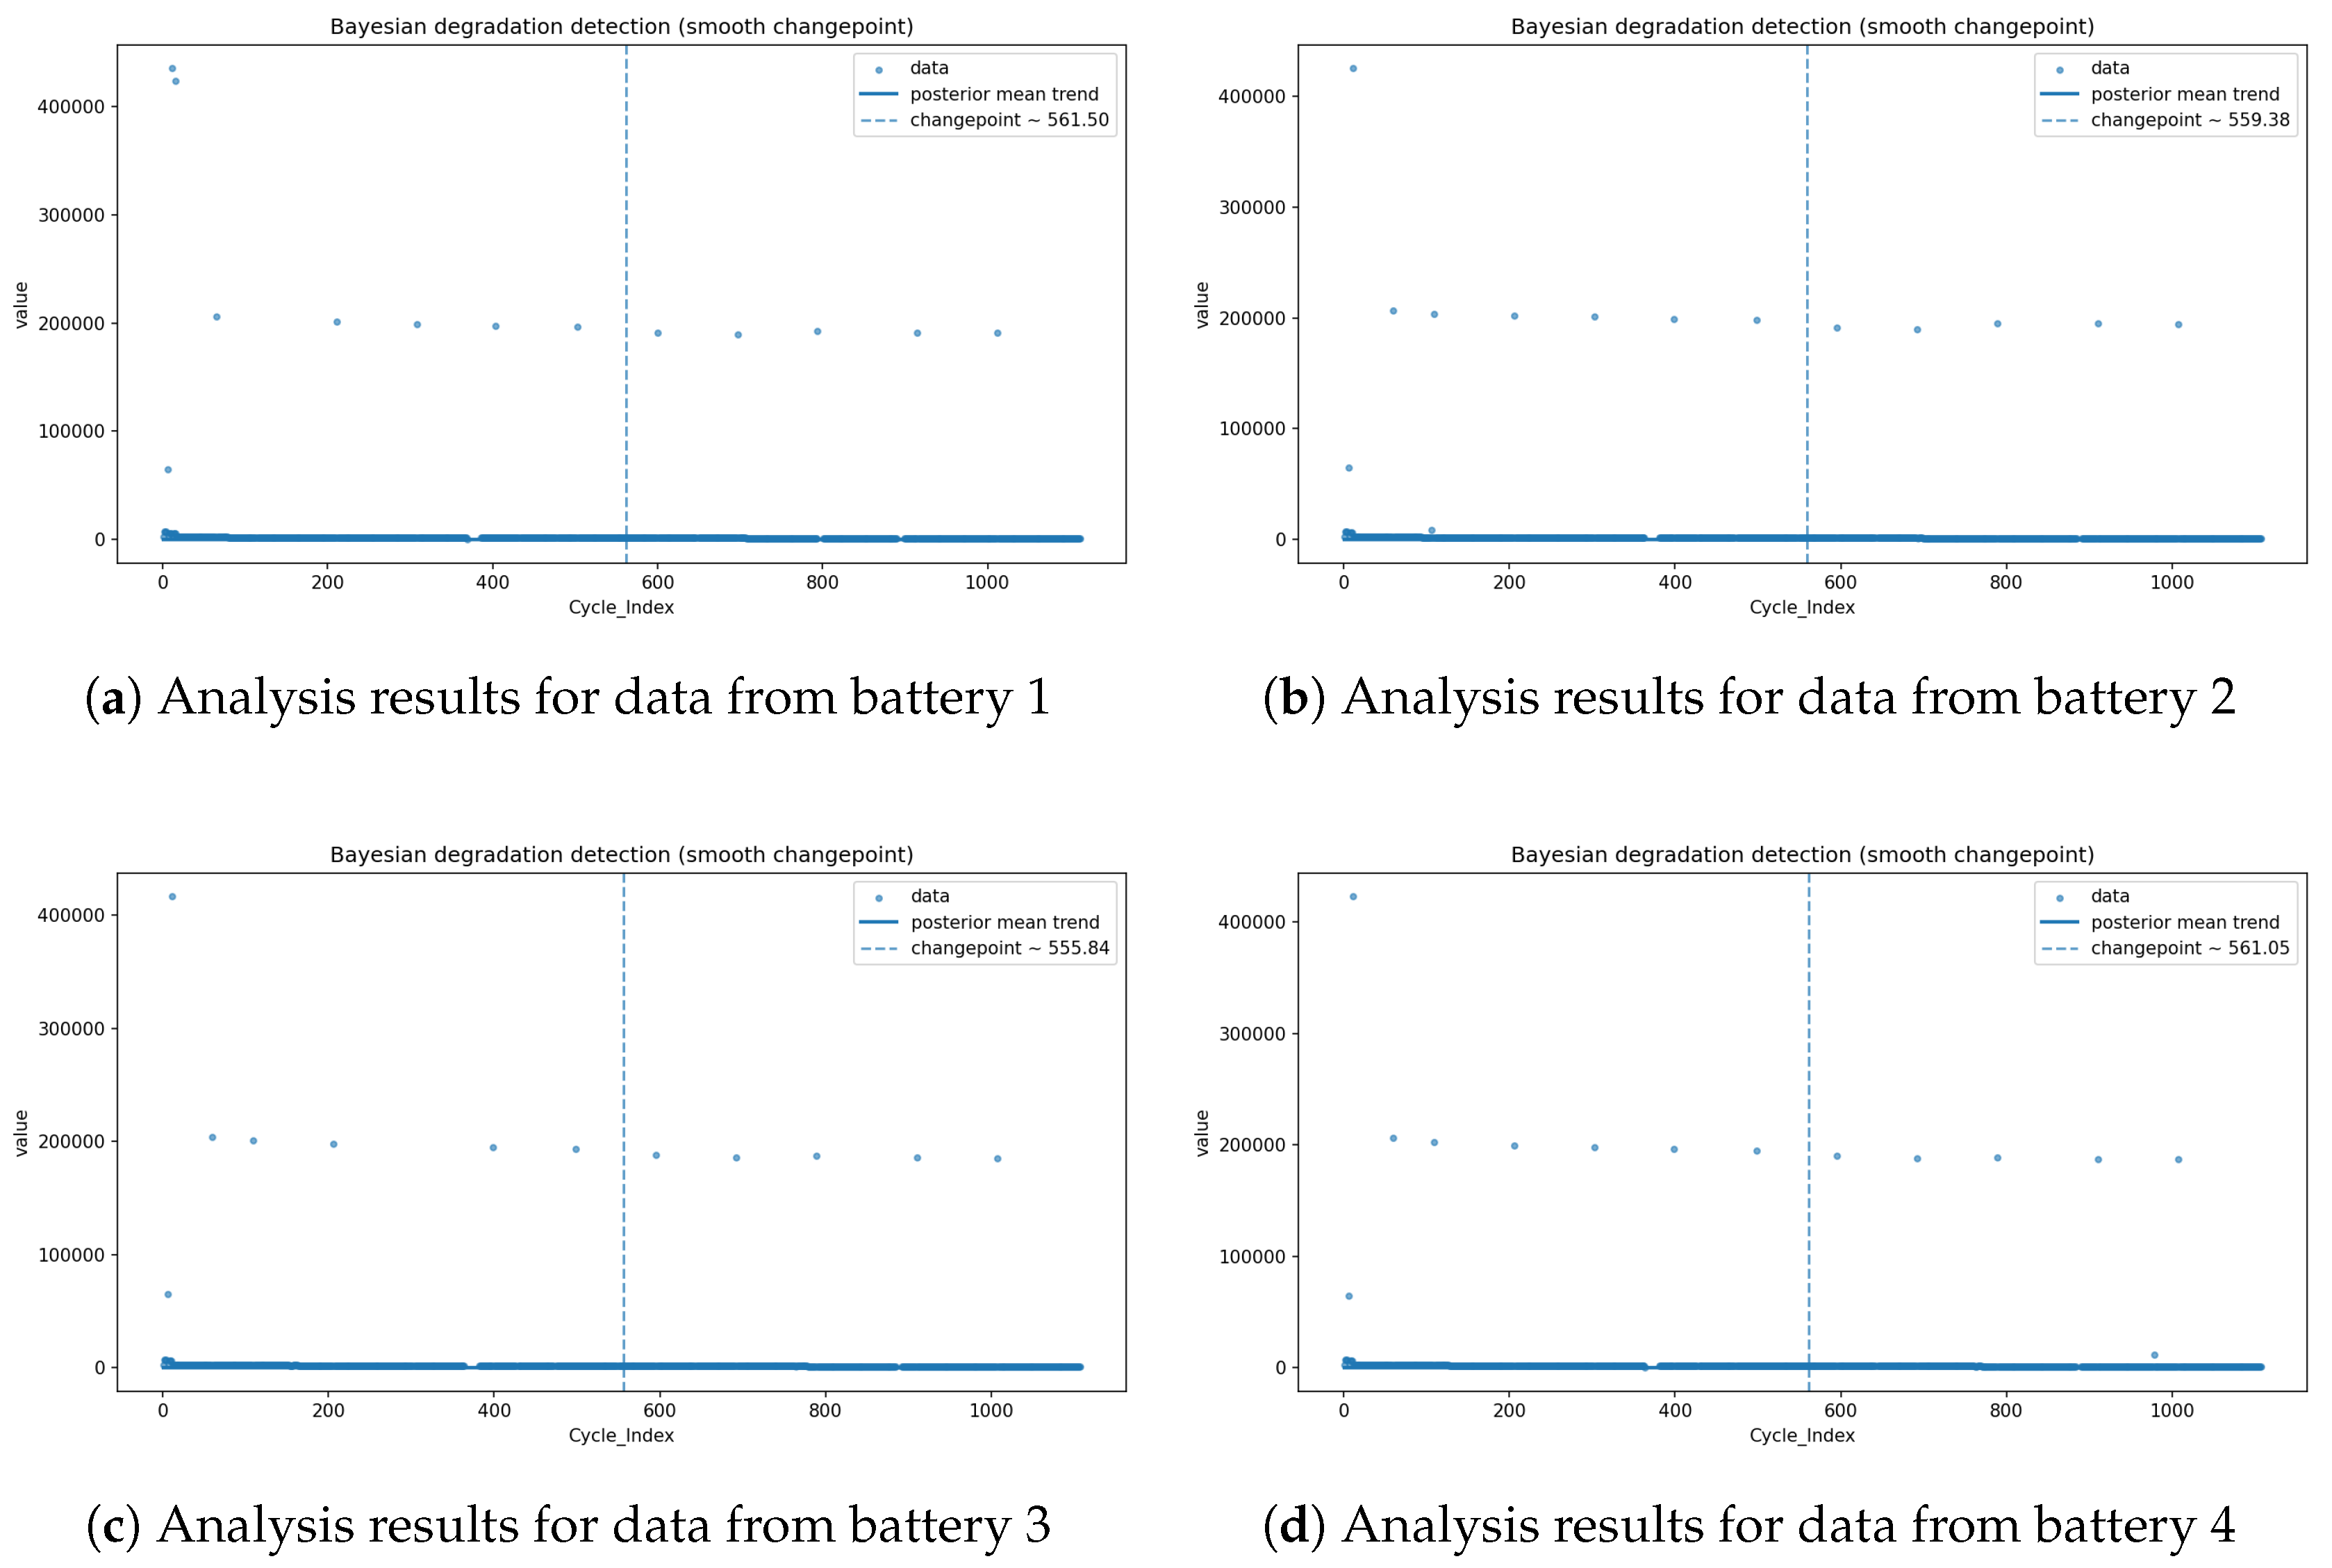
Table 1.
Overview of Battery Types and Their Characteristics.
| Battery Type | Description | Advantages | Disadvantages |
|---|---|---|---|
| Lead-acid | Low cost, reliable, but lower energy density. | Low cost, well-established technology, recyclable. | Heavy, low energy density, shorter lifespan. |
| Nickel-Cadmium (NiCd) | Robust, good cycle life, but toxic. | Durable, performs well in extreme temperatures. | Toxic materials, memory effect, lower energy density. |
| Nickel-Metal Hydride (NiMH) | Higher energy density than NiCd, less toxic. | Higher energy density than NiCd, environmentally friendlier. | Higher self-discharge, sensitive to overcharging. |
| Sodium-ion (Na-ion) | Similar to Li-ion but uses sodium, which is more abundant. | Lower cost, abundant materials, environmentally friendly. | Lower energy density, still in early stages of commercialization. |
| Lithium-Sulfur (Li-S) | High theoretical energy density, lightweight. | Very high energy density, lightweight, low cost. | Short cycle life, polysulfide shuttle effect, low efficiency. |
Table 2.
Degradation Factors and Mitigation Strategies for Battery Types.
| Battery Type | Degradation Factors | Mitigation Strategies |
|---|---|---|
| Lead-acid | Sulfation (lead sulfate crystallization), corrosion of electrodes, electrolyte stratification. | Regular maintenance, equalization charging, temperature-controlled environments. |
| Nickel-Cadmium (NiCd) | Memory effect, cadmium electrode degradation, electrolyte leakage. | Periodic deep discharge cycles, proper charging protocols. |
| Nickel-Metal Hydride (NiMH) | Hydrogen loss, electrode corrosion, overcharging damage. | Controlled charging/discharging, temperature management. |
| Sodium-ion (Na-ion) | Electrode degradation, lower energy density compared to Li-ion, SEI layer formation. | Development of stable electrode materials, improved electrolyte formulations. |
| Lithium-Sulfur (Li-S) | Polysulfide shuttle effect, sulfur cathode degradation, lithium anode degradation. | Use of protective layers on electrodes, advanced electrolyte additives. |
Table 3.
Performance Parameters of Chemical Batteries.
| Battery Type | Energy Density (Wh/kg) | Cycle Life (cycles) | Power Density (W/kg) | Operating Temperature Range (°C) |
|---|---|---|---|---|
| Lead-Acid Batteries | 30-50 | 500-1000 | 150-300 | -20 to 50 |
| Nickel-Cadmium (NiCd) | 40-120 | 1000-2000 | 200-400 | -20 to 60 |
| Nickel-Metal Hydride (NiMH) | 60-120 | 1000-2000 | 200-300 | -20 to 60 |
| Sodium-ion (Na-ion) | 100-150 | 2000-3000 | 100-200 | -10 to 60 |
| Lithium-Sulfur (Li-S) | 300-500 | 300-500 | 200-400 | -20 to 60 |
Table 4.
Cost and Efficiency Metrics of Chemical Batteries.
| Battery Type | Cost ($/kWh) | Charging Time (hours) | Energy Efficiency (%) | Lifespan (years) |
|---|---|---|---|---|
| Lead-Acid Batteries | 50-200 | 6-12 | 70-85 | 3-5 |
| Nickel-Cadmium (NiCd) | 200-300 | 1-3 | 70-90 | 5-7 |
| Nickel-Metal Hydride (NiMH) | 200-300 | 2-4 | 80-90 | 5-10 |
| Sodium-ion (Na-ion) | 100-200 | 4-8 | 80-90 | 10-15 |
| Lithium-Sulfur (Li-S) | 150-300 | 5-10 | 70-80 | 3-5 |
Table 5.
Selected articles on battery degradation sensing and modelling (V–I–T and, where applicable, impedance).
Table 5.
Selected articles on battery degradation sensing and modelling (V–I–T and, where applicable, impedance).
| Article | Method | Technique |
|---|---|---|
| [13] | Statistical inference | Factor analysis |
| [14] | Statistical inference | Bayes’ theorem |
| [15] | Dynamic prediction | Hidden Markov models |
| [16] | Dynamic prediction | Nonparametric Bayesian time series |
| [17] | Machine learning | Deep learning |
| [18] | Machine learning | Reinforcement learning |
| [19] | Machine learning | Cluster/regression comparisons |
| [20] | Machine learning | Deep learning |
Table 6.
Failure mechanisms in LIBs and associated risks observable or inferable via BMS sensing.
| No. | Cause (LIB-relevant) | Primary problem / risk |
|---|---|---|
| 1 | Internal short circuit / fault | Local heating, thermal runaway |
| 2 | Impedance rise (aging) | Voltage sag, power loss, heat generation |
| 3 | External short / overcurrent abuse | Rapid heating, venting / TR if protections fail |
| 4 | Mechanical / vibration damage | Contact loss, cracking, non-uniform heating |
| 5 | Overcharge / overdischarge | Gas/venting, copper dissolution, TR risk |
| 6 | Pack cell imbalance (voltage/SoC) | Local over-/under-stress, overheating |
Disclaimer/Publisher’s Note: The statements, opinions and data contained in all publications are solely those of the individual author(s) and contributor(s) and not of MDPI and/or the editor(s). MDPI and/or the editor(s) disclaim responsibility for any injury to people or property resulting from any ideas, methods, instructions or products referred to in the content. |
© 2025 by the authors. Licensee MDPI, Basel, Switzerland. This article is an open access article distributed under the terms and conditions of the Creative Commons Attribution (CC BY) license (http://creativecommons.org/licenses/by/4.0/).
Copyright: This open access article is published under a Creative Commons CC BY 4.0 license, which permit the free download, distribution, and reuse, provided that the author and preprint are cited in any reuse.


