
Submitted:
28 September 2025
Posted:
30 September 2025
You are already at the latest version
Abstract
Quantitative seismic inversion for transitional shale gas resources in the Da Ning-Ji Xian area of the Ordos Basin faces formidable challenges due to a complex coal-measure stratigraphy and rapid lithological variations, which result in ambiguous seismic responses. This ambiguity is compounded by severe signal attenuation from a thick loess cover and numerous coal seams, leading to a significant loss of vertical resolution that undermines the reliability of quantitative predictions. This study presents a robust inversion scheme designed to overcome these limitations by systematically compensating for seismic attenuation prior to inversion. Our workflow commences with the data-driven estimation of the quality factor (Q) using the local centroid frequency shift (LCFS) method, followed by the application of pre-stack inverse Q filtering to correct for amplitude decay and phase dispersion, thereby broadening the seismic bandwidth. High-fidelity shale gas evaluation parameters, including Total Organic Carbon (TOC), are then derived through pre-stack simultaneous inversion of the compensated dataset. Validation on a field dataset from the area confirms the efficacy of our proposed scheme, with the resulting inverted volumes revealing substantially improved detail, clearer delineation of stratigraphic features, and more distinct lithological boundaries. This attenuation-compensated inversion strategy offers a powerful and effective pathway for exploring and developing unconventional resources in regions plagued by poor seismic data quality.
Keywords:
Q-value inversion
; local centroid frequency shift
; attenuation compensation
; unconventional reservoir characterization
; ordos basin
1. Introduction
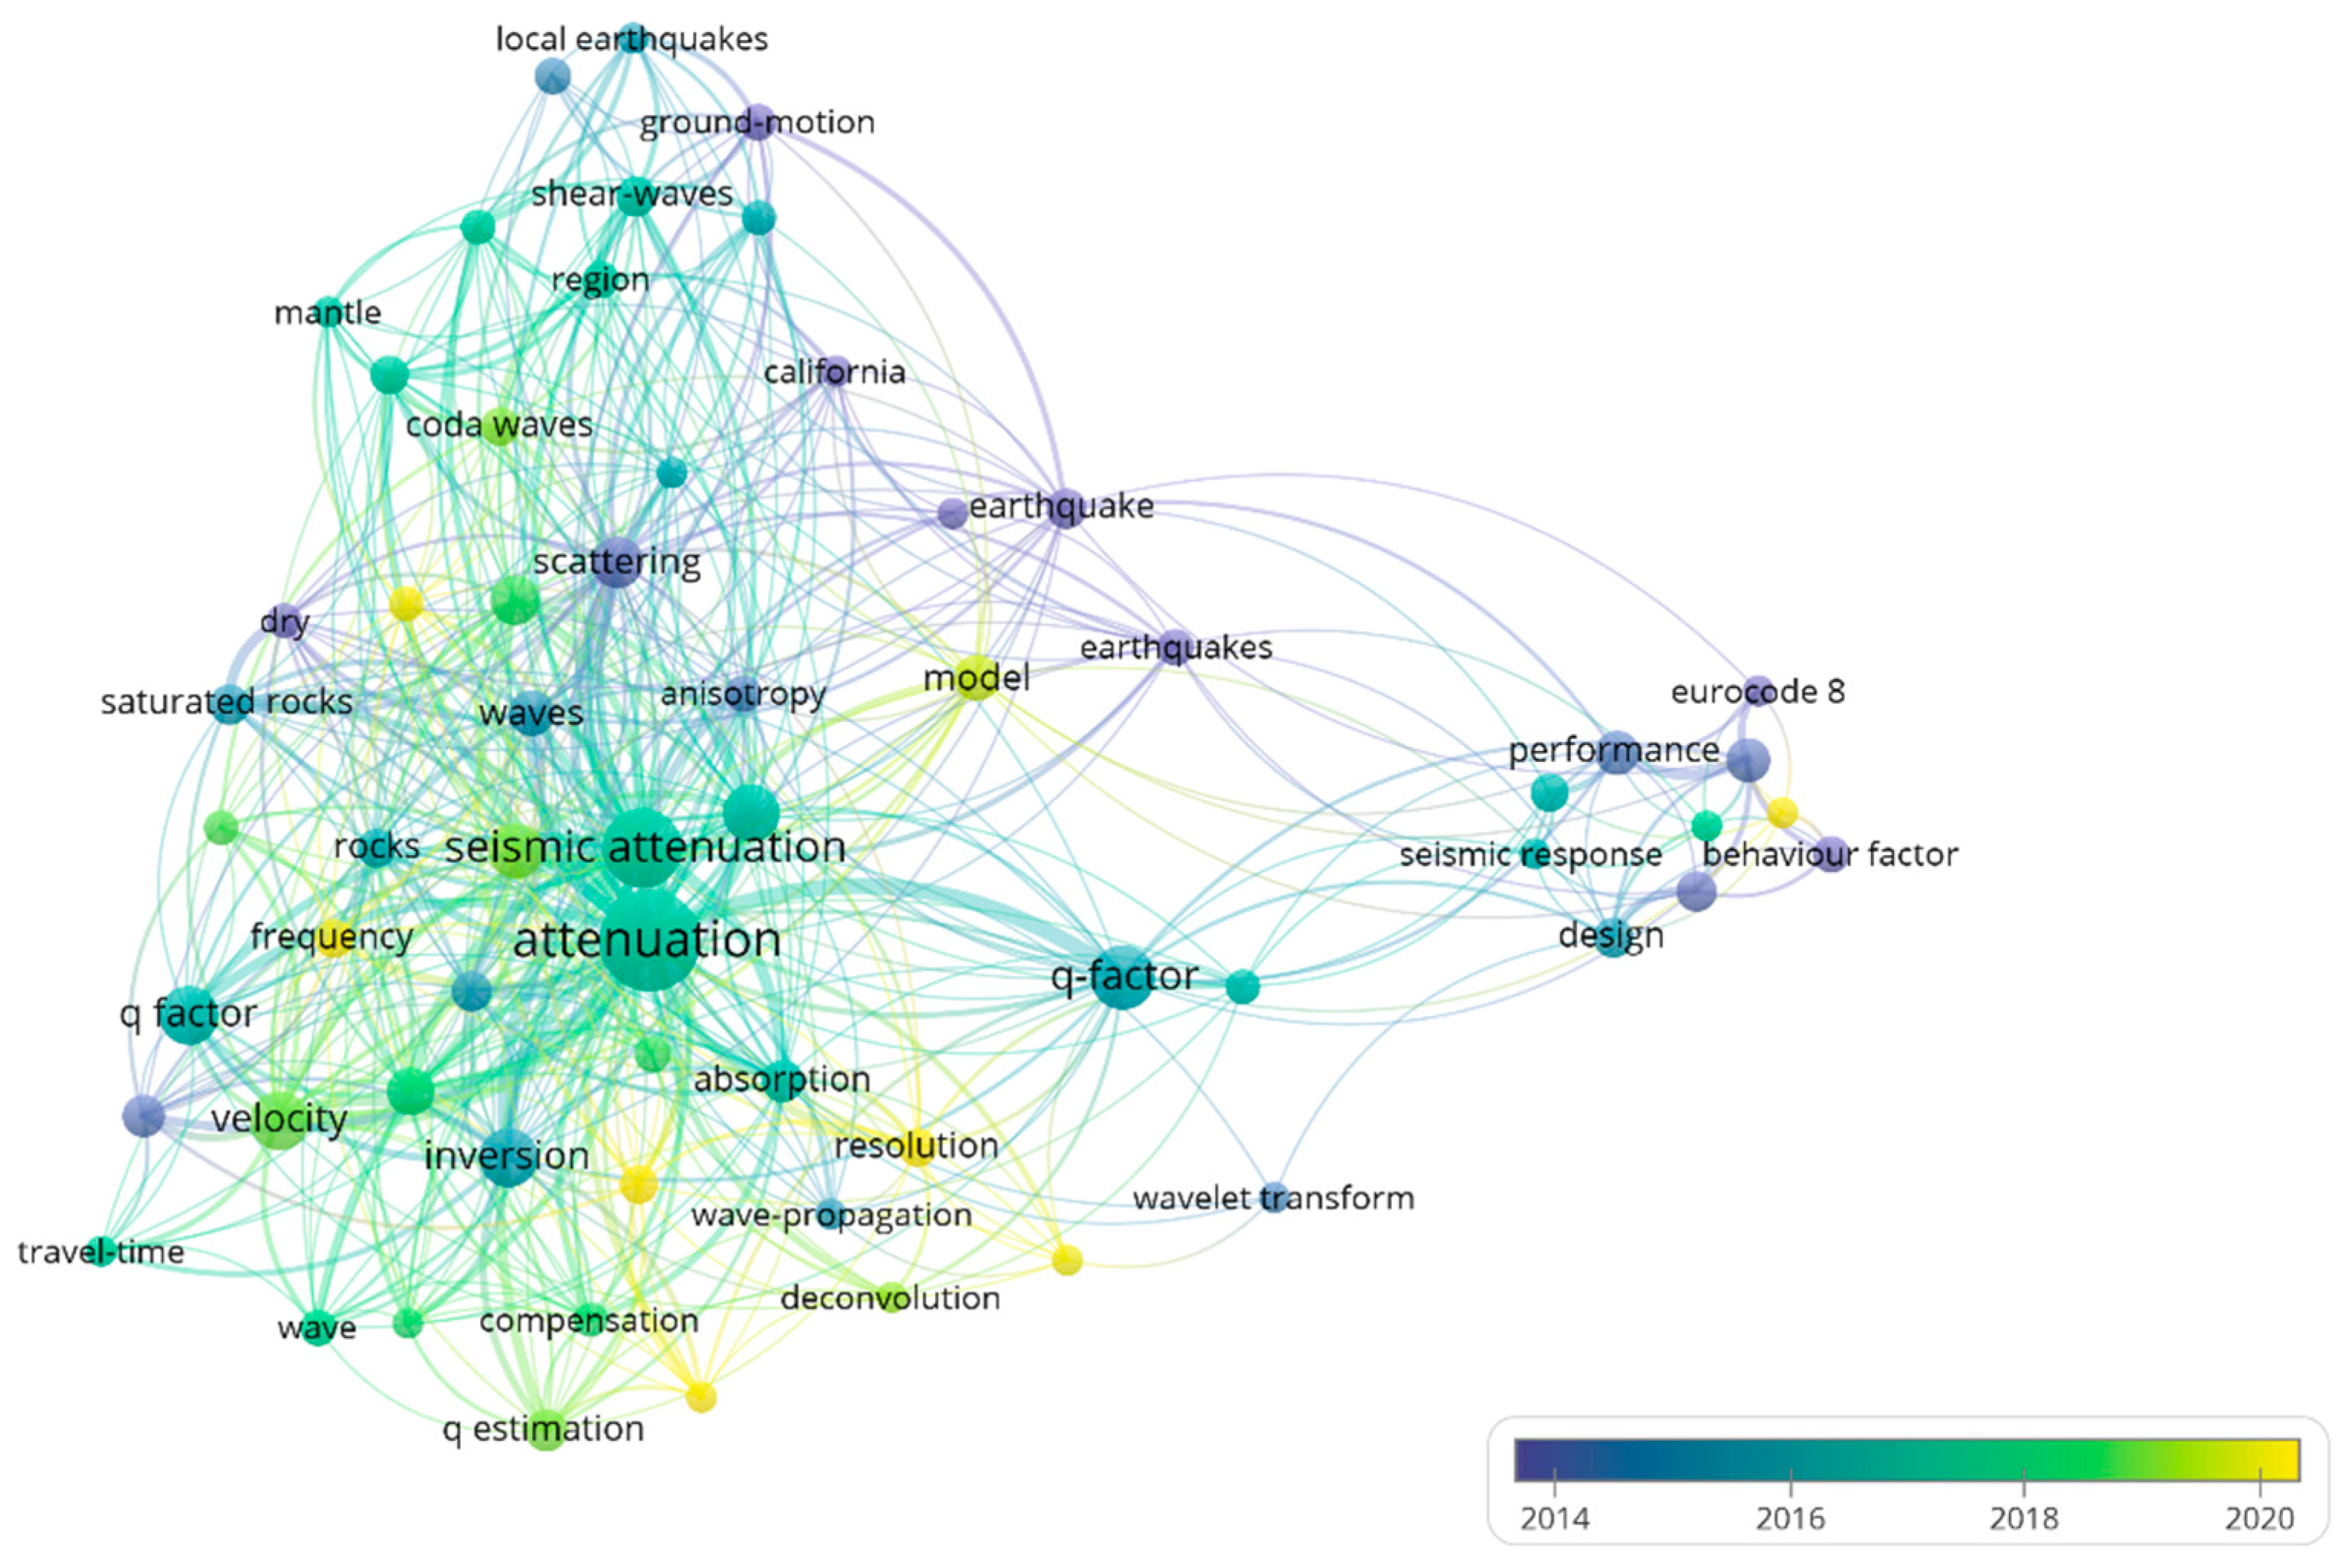
Seismic attenuation—the inevitable loss of energy as waves propagate through the subsurface—is a fundamental phenomenon with profound implications across the earth sciences [1,2,3]. As illustrated by the keyword co-occurrence map (Figure. 1), the quality factor, Q, serves as a critical nexus, linking disciplines from earthquake seismology (ground-motion, local earthquakes) [4,5,6,7] and rock physics (saturated rocks, scattering) [8,9] to reservoir characterization and engineering design [10,11]. The recent surge in research, highlighted by the temporal overlay, underscores a growing recognition that accurately accounting for attenuation is a frontier challenge, particularly in the domains of Q estimation [2,12,13], compensation [14], and high-resolution inversion.
Motivated by this pivotal role, a diverse and evolving suite of algorithms has been developed to estimate Q, from frequency-domain methods [10,11,15] like the spectral ratio to time-frequency approaches such as the S-transform [16,17,18,19,20], each aiming to precisely quantify the spectral decay of the seismic wavelet. Once estimated, the resulting Q-field offers a dual utility. It can serve as a powerful diagnostic attribute in its own right, for instance, Yin et al. [21] established a compelling link between Q anisotropy and fracture orientation, an insight highly relevant to unconventional reservoir characterization.
More central to our investigation, however, is its role as an indispensable prerequisite for data conditioning via inverse Q filtering. This crucial step compensates for the cumulative effects of amplitude loss and phase dispersion [1,22,23,24], which, if left uncorrected, can severely degrade the fidelity of seismic images. Its efficacy is particularly tested in geologically complex settings [25,26]. Our study confronts the severe imaging challenges posed by strong coal seam masking in the Ordos Basin—a scenario where conventional seismic attributes fail and the subsurface remains acoustically obscured [27,28,29]. We therefore posit that an optimized inverse Q filtering workflow is not merely a refinement but the foundational step required to recover the high-resolution signal necessary for any subsequent quantitative inversion of reservoir properties.
Figure 1.
Keyword co-occurrence network in the field of seismic attenuation research.
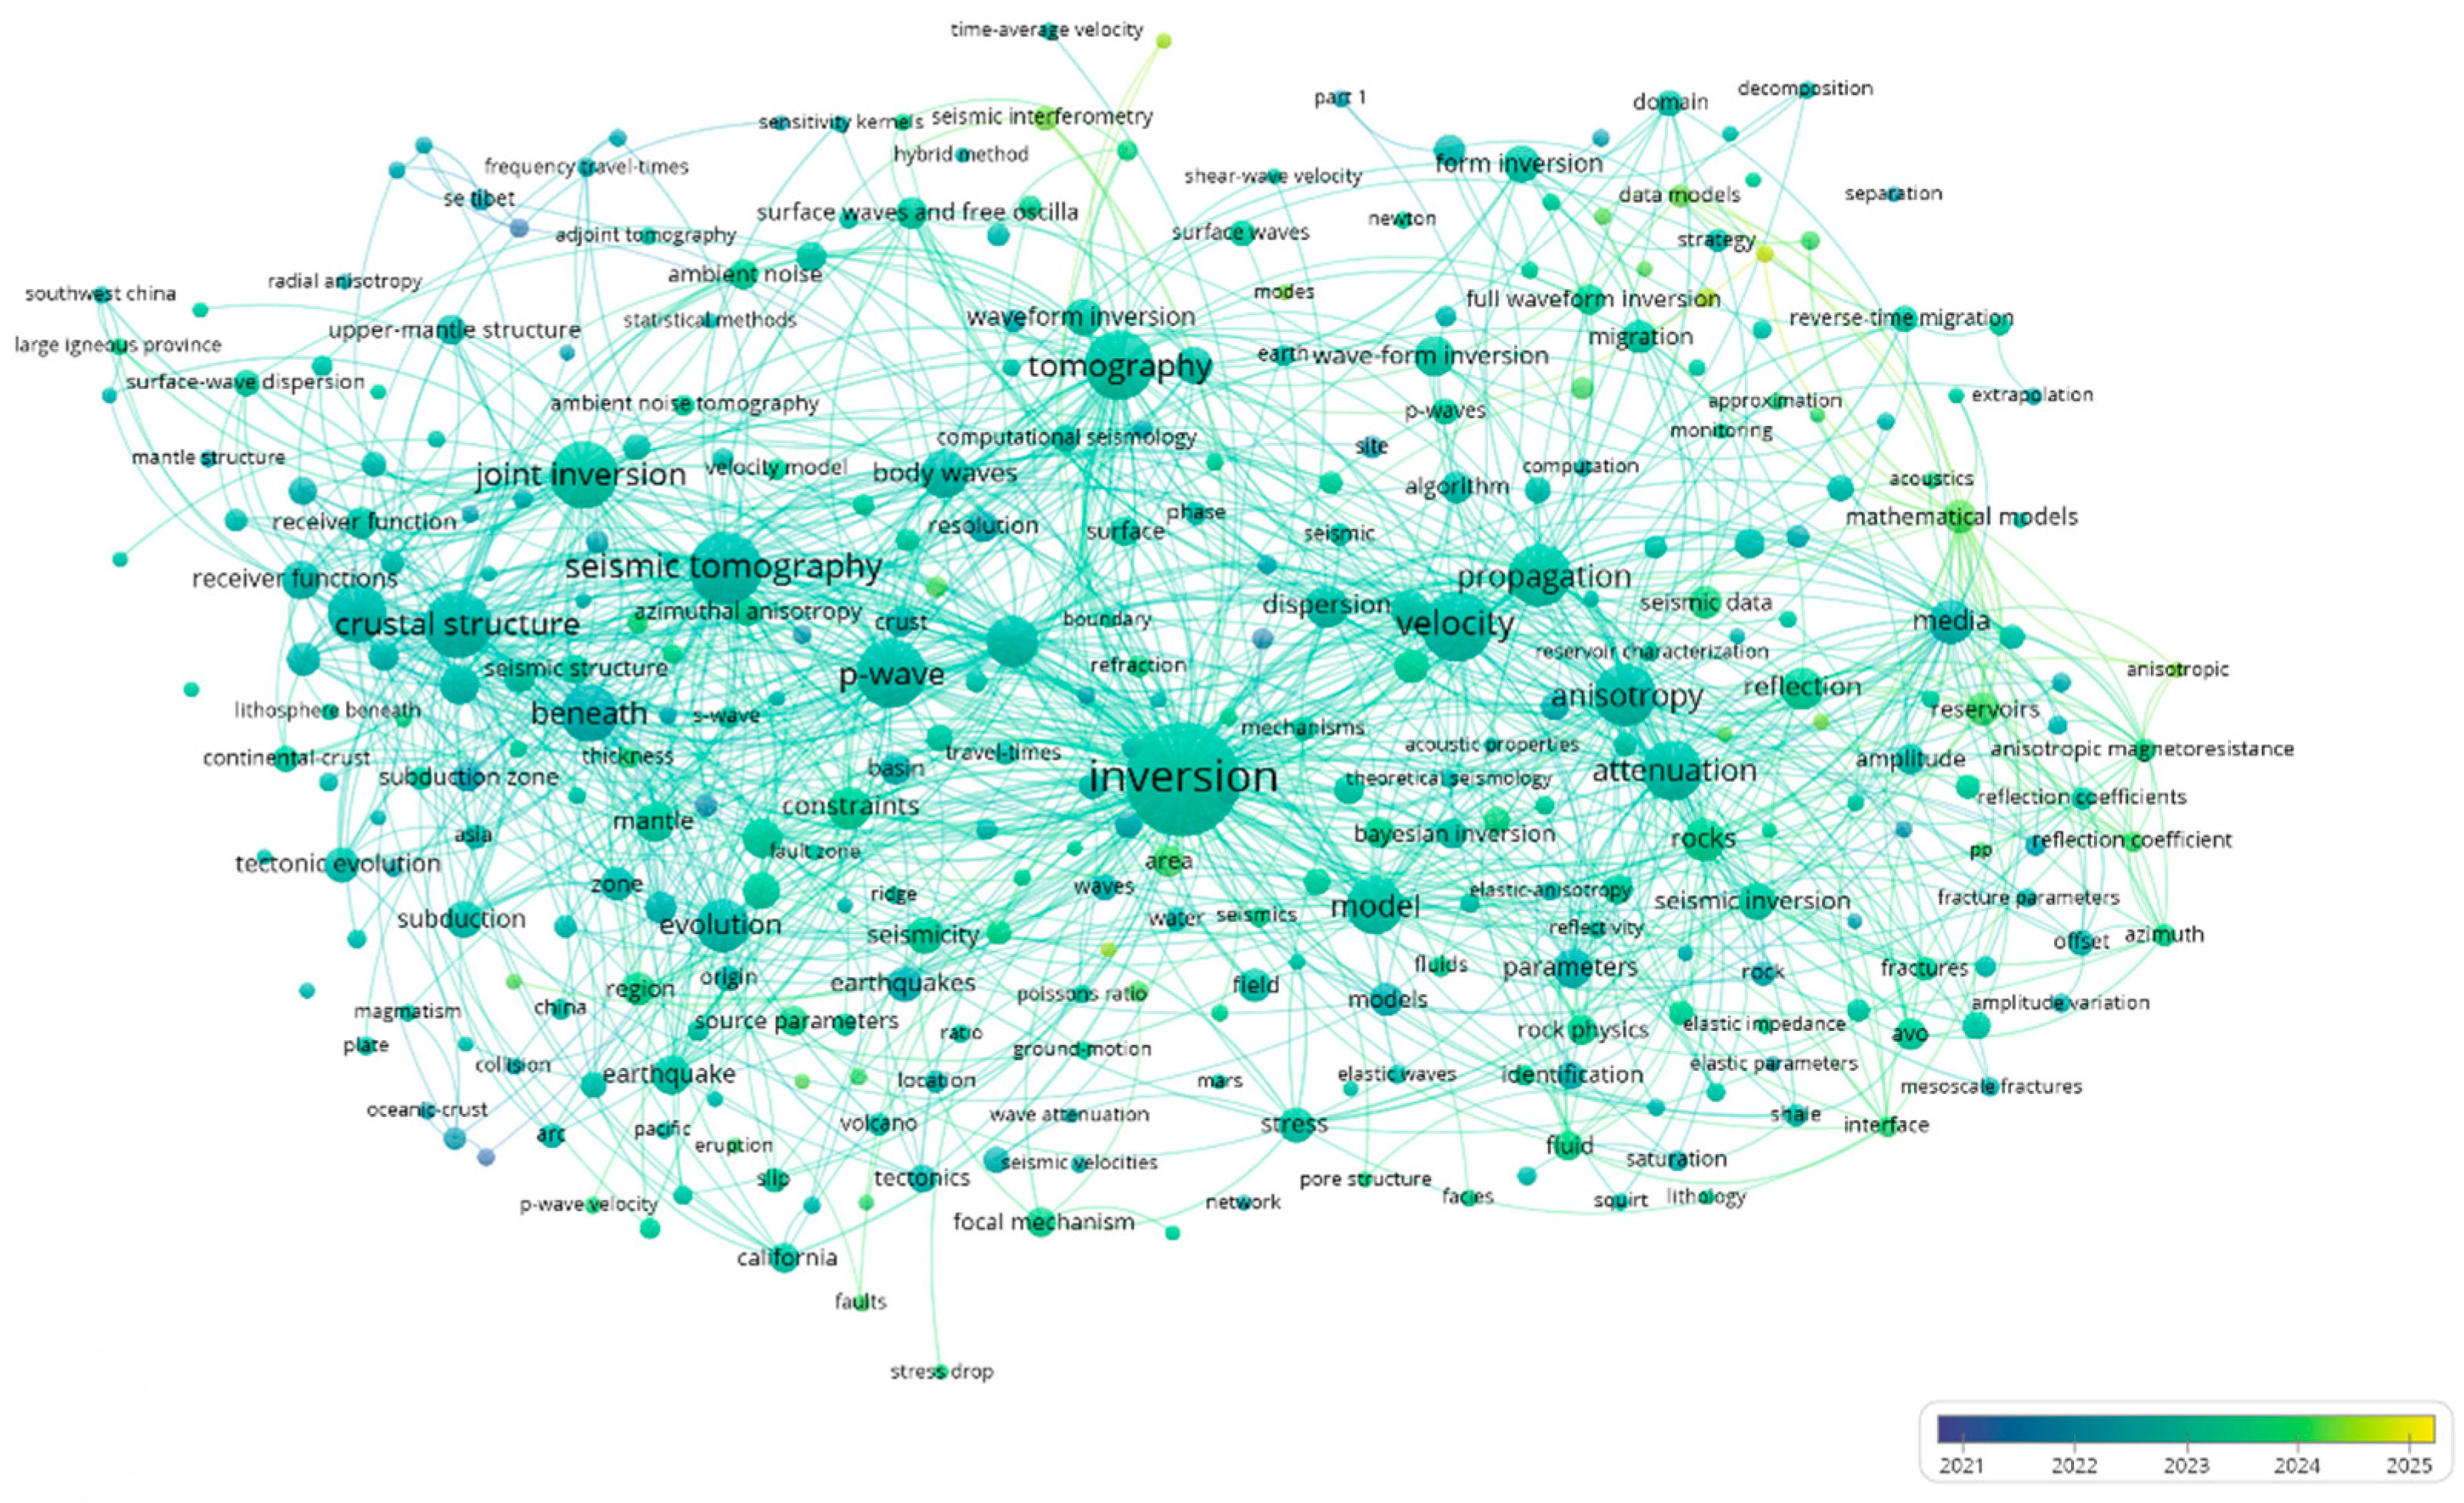
The geophysical community has made significant strides in seismic inversion, moving from post-stack acoustic impedance methods [30,31,32] to sophisticated pre-stack simultaneous inversions [33] that can estimate a suite of elastic parameters like P -impedance [34] and S-impedance [35,36] and density [37]. These advanced algorithms, often formulated within a Bayesian [38] or geostatistical framework [39,40,41,42,43], excel at integrating well log data [44,45,46,47] and geological constraints [48,49,50] to produce quantitative models of the subsurface. However, a critical and often overlooked assumption underpins their efficacy: the input seismic data must be a faithful representation of the earth’s reflectivity, free from the distorting effects of wave propagation [51]. When this assumption is violated—as is demonstrably the case in highly attenuating media—even the most mathematically robust inversion algorithms are forced to reconcile flawed waveforms with geological models [52,53,54,55,56]. This can lead to non-unique, geologically ambiguous, or even erroneous results, where the derived rock properties reflect the imprint of attenuation as much as the true lithology [57,58,59]. It is precisely this gap—the disconnect between the theoretical power of modern inversion and the practical limitations imposed by data quality—that our research aims to bridge.
Figure 2.
Keyword co-occurrence network in the field of seismic inversion and tomography.
Our investigation focuses on the Daji Block, located within the Jinxi Flexural Belt—a second-order tectonic unit on the southeastern margin of the multi-cycle cratonic Ordos Basin [60,61,62]. During the Late Paleozoic, this area was a dynamic depositional nexus, transitioning from a marine carbonate platform to deltaic-littoral and eventually continental fluvial systems during the Carboniferous-Permian period [63,64,65,66,67]. This complex paleo-environmental evolution resulted in a highly heterogeneous stratigraphy [68,69]. The Shanxi Formation, particularly its Shan sub-member, represents a key interval of this transition and is the primary target for shale gas exploration in the region [70,71,72]. It is characterized by the complex interbedding of organic-rich shales, tight sandstones, and problematic coal seams [73,74,75,76], which, despite significant exploration progress, continue to pose formidable challenges for high-resolution reservoir characterization [77,78,79]. The objective of this study is therefore to develop a geophysical workflow capable of resolving these fine-scale lithological variations and accurately predicting shale reservoir properties within this geologically intricate setting.
While previous studies have acknowledged the geological complexities of the Shanxi Formation [64,80,81,82,83], conventional quantitative interpretation workflows often fail to adequately address the severe signal degradation preceding the inversion step. This paper presents an integrated seismic inversion framework, predicated on the principle that robust attenuation compensation is not an optional refinement but a prerequisite for reliable reservoir characterization in this setting. Our methodology begins with a rigorous, data-driven estimation of the interval Q-field, tailored to the specific stratigraphic conditions of the Da Ning-Ji Xian area [84,85,86]. This Q model then informs a targeted pre-stack inverse Q filtering application designed specifically to counteract the pronounced masking effects of the region’s prevalent coal seams [87,88,89]. The resultant, resolution-enhanced seismic volume serves as the input for a subsequent pre-stack simultaneous inversion. We hypothesize that this systematic, physics-based data conditioning will unlock a level of detail in key reservoir property models (e.g., Total Organic Carbon, porosity) that remains inaccessible to standard approaches, thereby providing a more robust and geologically plausible framework for sweet-spot delineation in these challenging transitional shale systems.
2. Geological Setting
Our study area, the Da Ning-Ji Xian (Daji) Block, is situated within the Jinxi Flexural Belt on the eastern margin of the Ordos Basin, a large, multi-cycle intracratonic basin in northern China [90,91,92]. The Late Paleozoic stratigraphic architecture of this region is a product of a dynamic paleo-environmental transition, evolving from a stable marine carbonate platform to a complex deltaic-littoral system and, ultimately, to a continental regime during the Carboniferous-Permian period [90,93,94]. This depositional history culminates in the Permian Shanxi Formation [66,95,96], which hosts the primary exploration target: the transitional shales of the Shan-2 sub-member [91,97,98]. This interval is characterized by a highly heterogeneous assemblage of thin, interbedded organic-rich shales, tight sandstones, and critically, thick coal seams, such as the prominent No. 5 coal bed near its upper boundary [99,100,101].
This intricate geological framework presents a formidable challenge for seismic characterization, rendering conventional quantitative methods inadequate. The severe signal degradation originates from the surface downwards; a thick loess overburden and the interspersed coal seams act as highly attenuative layers, reducing the main frequency near the target to a mere 32 Hz and narrowing the effective bandwidth (5-80 Hz) [102,103]. Compounding this issue is a profound scale mismatch between the seismic resolution and the geological target. The theoretical vertical resolution of the raw seismic data is approximately 33 meters, an order of magnitude larger than the average sandstone reservoir thickness of only 4.2 meters, rendering these reservoirs seismically invisible as discrete units [104,105]. This challenge is further exacerbated by the non-unique seismic signatures of the varied lithological combinations (shale, sandstone, coal) [106,107], which confound standard inversion and make direct sandstone identification from the raw data nearly impossible. The Daji Block therefore serves not merely as a study area, but as a quintessential testbed where the limitations of conventional seismic analysis are starkly exposed, and the necessity for an advanced, attenuation-aware characterization workflow becomes paramount.
3. Theory and Methodology
The profound seismic attenuation and geological complexity in the Da Ning-Ji Xian area render conventional inversion workflows unreliable [108,109]. Our response is an integrated, three-stage framework (Figure 3) predicated on a core principle: accurate quantitative characterization is only possible after the seismic signal’s integrity has been systematically restored. This mandates a physics-based attenuation compensation sequence as an indispensable prerequisite to inversion. The framework unfolds by first estimating the interval Q-field [110], then using it to govern a robust inverse Q filtering application. Only the resulting conditioned, high-resolution dataset is deemed a valid input for the final post-stack simultaneous inversion.
3.1. Q-Factor Estimation via the Local Centroid Frequency Shift (LCFS)
The entire framework’s efficacy hinges on the accurate estimation of the interval Q-field. Our approach is founded on the centroid frequency shift (CFS) principle, originally established by [111], which exploits the direct physical relationship between the quality factor, Q, and the progressive downshift of a wavelet's spectral centroid caused by the preferential attenuation of high-frequency components.
The centroid frequency (fc) and its variance () for a signal with a Fourier amplitude spectrum F(f) are fundamentally defined as its first and second moments, respectively:
For a non-stationary seismic signal, these can be extended into the time-frequency domain to define the instantaneous centroid frequency fc(t) and instantaneous variance
using a time-frequency spectrum B (f, t):
The original CFS method, however, is limited by a critical, oversimplified assumption: that the source wavelet's spectrum S(f) conforms to an idealized mathematical form, typically a Gaussian distribution:
This assumption rarely holds for real seismic data, introducing a systematic bias into the Q estimation. To overcome this limitation, our study adopts the Local Centroid Frequency Shift (LCFS) method, which employs shaping regularization [112] to derive a stable, local measure of centroid frequency without assuming a global spectral shape.
Following [113], we express the instantaneous centroid frequency from Equation (3) in a linear algebra notation:
Where W is the vector of instantaneous centroid frequencies, D and z are operators constructed from the denominator and numerator of Equation (3), respectively. To stabilize this ill-posed problem, we introduce a shaping regularization constraint, which seeks a solution that is smoothly varying. The shaping operator S is defined as:
Where L is a finite-difference Laplacian operator and λ is a scale parameter controlling the smoothness. The least-squares solution subject to this constraint yields the stable local centroid frequency (floc):
A similar derivation provides the local variance ().
By substituting these robust, locally derived attributes into the Q-estimation equation, we arrive at the LCFS formula for time-varying Q:
This approach, which we refer to as LCFS, provides a continuous and stable Q-field estimate, even in the presence of noise or data gaps [110], making it ideally suited for the challenging data in our study area.
3.2. Attenuation Compensation via Stable Inverse Q Filtering
With a robust, spatially varying Q-field now established, we can proceed to the critical task of analytically reversing the attenuation effects of amplitude loss and phase dispersion. To this end, we employ a stable inverse Q filtering algorithm governed by this time-varying Q model.
The propagation of a plane wave in a 1D viscoelastic medium can be described in the frequency domain as:
Where is the complex wavefield at travel time τ and angular frequency ω, is the initial wavefield at , i is the imaginary unit.
The forward Q-filtering operator that simulates the earth’s attenuation effect is therefore:
Here, the operator comprises two distinct physical processes: a frequency-dependent amplitude decay and a causal phase rotation (dispersion), governed by the signum function, sgn(ω).
Inverse Q filtering is designed to be the inverse operation, intended to analytically remove this operator from the seismic data [114,115]. However, a critical challenge arises: the amplitude compensation term, being an exponential gain function, is inherently unstable as it explosively amplifies any high-frequency noise present in the data. To address this fundamental instability, we adopt the stabilized implementation pioneered by [116]:
Where σ is a small stabilization factor. The output of this stage is a seismic dataset with restored bandwidth and corrected phase, rendering it a high-fidelity input suitable for quantitative inversion.
3.3. Post-Stack Model-Based Acoustic Impedance Inversion for Reservoir Properties
Having restored the signal’s bandwidth and phase integrity, the conditioned post-stack seismic dataset is now poised for the extraction of quantitative reservoir parameters. Our approach is a model-based post-stack inversion, which aims to transform the seismic reflection data into a quantitative volume of P-wave acoustic impedance.
The fundamental principle is that the post-stack seismic trace approximates the zero-offset or normal-incidence response of the earth [117,118,119]. The reflectivity at an interface under normal incidence(R) is primarily controlled by the contrast in P-wave acoustic impedance ():
Where andare the P-impedances of the upper and lower layers, respectively.
The recorded seismic trace S(t) is modeled as the convolution of the normal-incidence reflectivity series R(t) with a source wavelet W(t):
Where N(t) represents noise.
Model-based inversion solves this inverse problem by finding the P-impedance model that best explains the observed seismic data. The process starts with a low-frequency model (LFM) constructed from well log data, which provides the background impedance trend that is absent in the band-limited seismic data [120,121,122]. The algorithm then iteratively perturbs this model until the synthetic seismogram, generated from the updated impedance model, achieves the best match with the actual seismic traces [123,124]. This process yields a high-resolution, quantitative volume of P-impedance, which forms the basis for subsequent lithology interpretation and the estimation of shale gas evaluation parameters like TOC through established rock physics relationships.
4. Application and Results
The efficacy of our proposed attenuation-compensated inversion framework is validated through a multi-stage investigation designed to build a comprehensive case for its superiority. We begin by demonstrating the theoretical soundness of the LCFS methodology on a synthetic dataset tailored to the study area’s geology. The validated workflow is then applied to a 2D field seismic line from the Da Ning-Ji Xian area to showcase its performance in Q-field estimation and signal restoration. The investigation culminates in a direct comparative inversion analysis, designed to quantify the tangible improvements in reservoir characterization that are unattainable with conventional approaches.
4.1. Synthetic Data Validation
To establish the practical viability of the LCFS method, we first confronted it with a challenging synthetic dataset—a 2D seismic model engineered to mirror the geology of our study area (Figure 4a). This digital phantom, featuring a constant background Q and multiple reflectors at key intervals (0.1s, 0.3s, 0.4s, and 0.6s), served as a controlled environment to probe the method's fundamental limits and capabilities, with the initial layer treated as non-attenuative.
At the heart of attenuation estimation lies a critical choice: how to resolve a seismic signal into its time-frequency constituents [125,126]. The selection of the transform is not merely a technical step but a foundational decision that dictates the fidelity of all subsequent analysis. We pitted our proposed Local Time-Frequency Transform (LTFT) against the widely adopted S-transform [127,128,129] to see which could more faithfully capture the signal’s evolving spectral character. The results, presented in Figure 5, are telling. The S-transform (Figure 5b), while functional, yields a spectrum where the energy of reflection events appears smeared and indistinct. In stark contrast, the LTFT (Figure 5a) delivers a sharp, highly resolved spectral image, where individual seismic events are crisply delineated in both time and frequency.
This superior resolving power proved to be the decisive factor. An accurate local centroid frequency—the cornerstone of the LCFS method—can only be derived from a spectrum that is itself accurate. The quantitative ramifications of this difference are laid bare in Figure 6. The centroid frequency estimated from the LTFT’s high-fidelity spectrum (blue line) tracks the known theoretical value (gray line) with remarkable precision, faithfully capturing the smooth downward trend associated with attenuation. Conversely, the S-transform-derived estimate (red line), handicapped by its smeared spectrum, is plagued by inaccuracies. It exhibits not only a significant systematic overestimation across the entire time window but also introduces non-physical, high-frequency artifacts, particularly evident in the sharp, erratic breaks in the curve. This critical test unequivocally established the LTFT as the superior engine for our workflow.
With this foundational challenge met, we deployed the full LCFS algorithm. The estimated Q-field was then used to perform inverse Q filtering, effectively turning back the clock on attenuation. The compensated section (Figure 4b) is a testament to the method's efficacy. The signal, once distorted, is revitalized: amplitudes are robustly recovered, phase fidelity is restored, and the seismic image is sharpened to a degree that reveals fine structural detail. This synthetic validation does more than just confirm a theoretical concept; it demonstrates that with the right methodological choices, particularly in the crucial domain of time-frequency analysis, the LCFS framework can robustly dismantle the effects of attenuation and restore the integrity of seismic data.
4.2. Field Data Application: Q-Estimation and Attenuation Compensation
To ensure a robust Q-estimation, which is highly sensitive to amplitude variations, the seismic data was first conditioned with Automatic Gain Control (AGC), as shown in Figure 7b. This crucial pre-processing step normalizes the energy across the section, preventing the spectral decay signature of deeper, weaker events from being masked by dominant shallow reflections. This gain-balanced volume then served as the input for a time-varying Q-factor estimation using the LCFS method.
The resulting Q-profile (Figure 7c) is not merely a processing byproduct but a diagnostic tool in itself. It captures the expected background trend of decreasing Q with depth, reflecting cumulative attenuation. More importantly, it reveals a pronounced, structurally conformable low-Q anomaly (Q ≈ 60-80) that is spatially coincident with the high-amplitude, multi-cycle reflection package near 1.5 s. This strong, data-driven correlation provides compelling evidence that this target zone is a region of high intrinsic attenuation, potentially linked to specific geological factors such as gas-charged sands, coal layers, or poorly consolidated shales [130].
Leveraging this detailed Q-field, inverse Q filtering was applied to compensate for the identified attenuation effects. The transformative impact is demonstrated in the final section (Figure 7d). A visual comparison against the original data (Figure 7a) confirms that the process has achieved more than a simple cosmetic enhancement. The phase correction has sharpened the seismic wavelets, leading to a substantial increase in vertical resolution and allowing for the delineation of previously obscured stratigraphic details. Furthermore, the amplitude compensation has restored the energy of deeper reflectors, improving their continuity and structural definition. Ultimately, this workflow has yielded a seismic image that more accurately represents the true subsurface reflectivity, providing a more reliable foundation for subsequent interpretation.
4.3. Quantitative Inversion and Reservoir Characterization
While enhanced seismic imaging is a valuable outcome, the true scientific and commercial validation of our attenuation compensation framework lies in a more demanding test: its ability to improve the quantitative prediction of reservoir properties. To rigorously assess this impact, we moved beyond visual comparison and subjected both the original and our compensated datasets to a full post-stack simultaneous inversion. This parallel analysis serves as a controlled experiment, designed to isolate and quantify how restoring the attenuated components of the seismic signal directly translates into a more reliable characterization of the subsurface.
4.3.1. Building a Constrained Inversion Framework
Our post-stack inversion methodology, based on the convolutional model, required the construction of a robust, low-frequency background model. This model, constrained by well logs and geological interpretation, served as the essential framework for the inversion algorithm [131,132]. The entire workflow was treated as an integrated process rather than a sequence of independent steps, ensuring that the initial model, inversion parameters, and final acoustic impedance volume were geologically plausible and consistent with the seismic data.
The cornerstone of this framework was the well-seismic calibration, which anchored the entire model to ground-truth geological data [133]. By generating synthetic seismograms from sonic and density logs, we established a precise tie with our attenuation-compensated seismic volume (Figure 8). The excellent match achieved, particularly at the Shan-23 target level, not only validated the phase of our seismic data but also provided a high-confidence time-depth relationship that guided all subsequent modeling.
With the seismic data securely anchored to geological depth, our focus shifted to defining the seismic wavelet. This wavelet is more than a mere processing parameter; it is the fundamental seismic “language” the inversion uses to translate reflectivity into rock properties [134]. An inaccurate wavelet would introduce systemic bias, undermining the entire quantitative interpretation. Therefore, we derived a statistical wavelet directly from the most reliable portion of our attenuation-compensated data, within a window encompassing the target reservoir.
The character of this wavelet, shown in Figure 9, proved to be ideal for high-resolution inversion. Its symmetric, zero-phase form in the time domain (top panel) ensures that geological boundaries are imaged at their correct positions, free from phase-induced artifacts [135]. The corresponding amplitude spectrum (bottom panel) is equally important, revealing a broad and robust bandwidth that is essential for delineating the fine stratigraphy of the target formation.
However, a wavelet extracted from a limited window must be validated as representative of the broader seismic response. We confirmed this by comparing its spectral signature against the average spectrum of the entire target volume (Figure 10). The remarkable consistency between the two—both dominated by a potent 15-35 Hz frequency band—provides compelling, data-driven evidence that our wavelet is not a local anomaly but a faithful representation of the signal illuminating the Shan-23 member. This rigorous validation provides high confidence that our inversion is built upon a solid and representative geophysical foundation, poised to resolve meaningful geological detail.
Finally, to create a complete and geologically coherent representation of the subsurface, we constructed a low-frequency model to populate the seismic null band below 10 Hz. This initial model is not an arbitrary background trend; it is a critical, geologically driven foundation that guides the inversion towards a plausible solution, especially in areas of poor data quality.
The construction process involved Kriging the P-wave velocity, S-wave velocity, and density logs along a framework of key interpreted horizons, ensuring the long-wavelength trends honor the established stratigraphy. Figure 11 provides a cross-section through the resulting P-velocity volume, which serves as the low-frequency foundation for our P-impedance inversion. The model clearly captures the large-scale velocity layering: lower velocities in the shallower section (blue and green hues) gradually transitioning to higher velocities at depth. A prominent high-velocity layer (deep red) is evident below 1500ms, consistent with regional geological knowledge.
The integrity of this model is anchored by its tie to the ground-truth well data. As demonstrated in Figure 11, the overlaid P-wave log from well DJ29 shows an excellent match with the interpolated background model, confirming that our approach accurately captures both the vertical trends and the absolute velocity values at the well location. This robust, well-calibrated foundation is essential for ensuring the stability and accuracy of the final inversion. The synergy of this integrated framework is further validated in the subsequent critical quality control step, where the well logs, this low-frequency model, and the final high-resolution inversion result show excellent agreement, confirming the internal consistency of our entire workflow overall.
The internal consistency of our multi-component model is best visualized at the well location, where we can directly compare the foundational elements of the inversion with its final output. Figure 12 provides this critical quality control check, displaying the synergy between the three key curves that define our result.
The smooth black curve represents the low-frequency model, which provides the essential long-wavelength trend. The jagged blue curve is the original, high-frequency P-impedance log, representing the ground-truth data we aim to honor. The red curve is the final, high-resolution inversion result, which integrates the low-frequency model with the high-frequency information derived from the seismic data.
Within the primary zone of interest (approximately 1300–1600 ms), the alignment between the three curves is excellent. The red inversion result successfully captures the major peaks and troughs of the blue well log, demonstrating that the seismic data has accurately reintroduced the high-frequency detail. Furthermore, both curves correctly follow the broader trend established by the black low-frequency model. This strong three-way correspondence validates the fidelity of our inversion framework within the target zone. Below this interval, the match deteriorates, likely due to a combination of decreasing seismic signal quality and potential artifacts [136] in the deeper portions of the well log. This understanding allows us to confidently focus our subsequent geological interpretation on the well-calibrated upper section, where the model is most reliable.
4.3.2. Impact on P-Impedance: The Foundation for Quantitative Interpretation
With our inversion framework rigorously validated, we applied it to the attenuation-compensated dataset to derive the final P-impedance volume. Figure 13 presents a key cross-section from this volume, intersecting well DJ29, which serves as our ground-truth calibration point. The result is a high-fidelity image of the subsurface elastic properties, providing the essential foundation for our subsequent quantitative interpretation.
The P-impedance section reveals a clear and geologically plausible layering. The values, ranging from approximately 6,716 to 14,036 (g/cc*m/s), are consistent with the known lithologies in the area. The overall structure is laterally continuous, yet the section is rich with the vertical detail necessary to characterize the complex stratigraphy of the Shanxi Formation.
Our primary target, the Shan-2 member, is clearly delineated. This unit, known to be a deltaic sequence of interbedded mudstones, sandstones, and coal seams, is characterized by significant impedance contrasts [98,137]. The inversion successfully resolves this heterogeneity. Notably, a prominent, laterally continuous high-impedance layer (deep red hues, Zp > 13,000) is imaged near 1500ms, which correlates with known coal-bearing strata within the Shan-2 member. Above this, the section from 1400ms to 1500ms displays a more moderate impedance (yellow-orange hues), corresponding to the organic-rich and sandy mudstones of the upper Shan-2 sub-members [138]. The overlaid P-wave log at the DJ29 well location shows an excellent match with the inverted impedance, lending high confidence to these lithological interpretations. This detailed and well-calibrated impedance volume is not merely an improved image; it is a quantitative representation of the subsurface, poised to unlock a more reliable prediction of the reservoir’s key properties.
To rigorously quantify the scientific uplift of our attenuation compensation workflow, we first established a crucial baseline for comparison. An identical post-stack simultaneous inversion was performed using the original, uncompensated seismic data, creating a benchmark that represents the best possible outcome from a conventional approach. The resulting P-impedance volume is shown in the Figure 14 cross-section.
At a cursory glance, this conventional result appears geologically plausible; it captures the main structural elements and the large-scale impedance contrasts, showing a reasonable overall match with the overlaid DJ29 well log. However, a more critical analysis reveals the profound limitations imposed by the lower-bandwidth, phase-distorted input data—limitations that directly impede reliable reservoir characterization.
Within the target Shan-2 member, the stratigraphic details essential for understanding the reservoir architecture are blurred. The boundaries between sandstones, shales, and thin coal seams are diffuse, and their distinct impedance signatures are smeared into an averaged, ambiguous response. This loss of resolution is not a minor flaw; it is a critical failure that prevents the delineation of individual flow units and baffles. This result perfectly exemplifies a fundamental challenge in quantitative interpretation: even the most sophisticated inversion algorithm cannot recover geological detail that has already been lost to attenuation. The fidelity of the final model is irrevocably capped by the quality of the input seismic data.
This conventional result, therefore, does more than serve as a simple benchmark. It starkly defines the specific problem our framework is designed to solve and sets the stage for demonstrating a pivotal leap in capability: moving from a blurry, generalized image of the subsurface to a high-fidelity model capable of underpinning reliable predictions of critical reservoir parameters like TOC and porosity.
4.3.3. Unlocking Higher-Fidelity Reservoir Parameter Prediction
The superior resolution of the P-impedance volume, derived from our attenuation-compensated framework, serves as a robust foundation for quantitative reservoir characterization. This crucial step bridges the gap between a refined geophysical attribute and actionable geological insight. By applying a multi-regression petrophysical model established from well data (Equation 15), we transform the high-fidelity P-impedance data into a Total Organic Carbon (TOC) volume, enabling a detailed investigation of the hydrocarbon source rock potential:
In the equation, x represents TOC, and y represents the longitudinal wave impedance. This equation reveals the relationship between TOC and longitudinal wave impedance, allowing for the calculation of TOC data volumes across the entire study area
Figure 15(a) presents the resulting TOC prediction profile, which passes through the calibration well DJ29. The improvement over conventional methods is immediately apparent. Where a standard inversion might yield blurry, over-smoothed estimates, our result delineates the organic-rich intervals with exceptional clarity and geological realism. The profile reveals a thick, laterally continuous source rock interval, distinguished by the vibrant red and dark-red hues, which correspond to TOC values peaking at approximately 7%. This zone is not a homogenous block; rather, it displays subtle internal variations in organic richness, details that were previously lost in the noise or filtered out by conventional processing. Crucially, the predicted TOC values show excellent correlation with the inserted log data from well DJ29, validating the accuracy of our model and the underlying impedance data. The sharp, well-defined boundaries at the top and bottom of this high-TOC layer underscore the enhanced vertical resolution, allowing for a more precise estimation of the source rock’s net thickness.
While the vertical profile confirms the presence and richness of the source rock, its lateral distribution is paramount for understanding the depositional system and identifying the most prolific "hydrocarbon kitchens." To this end, we extracted TOC attribute maps along the key stratigraphic horizons of the Shan-23 member. Figure 15(b) displays the TOC distribution along the top surface, while Figure 15(c) maps the TOC along its base.
A comparative analysis of these two maps yields critical geological insights. Spatially, both surfaces confirm a consistent trend: the primary centers of organic matter accumulation are concentrated in the eastern and southeastern portions of the study area. These regions emerge as the depositional sweet spots, representing the most favorable zones for hydrocarbon generation. However, a significant difference in richness is observed between the two surfaces. The basal layer of Shan-23 (Figure 15c) exhibits a generally higher and more widespread organic enrichment, with TOC values ranging from a minimum of approximately 4.89% to a peak of 5.61%. This is consistently higher than the values observed on the top surface. This vertical gradient suggests a depositional history where the most anoxic and favorable conditions for organic matter preservation occurred during the initial stages of the Shan-23 member's formation. As deposition continued, conditions may have become slightly less favorable, leading to the comparatively lower TOC at the top surface.
This detailed, three-dimensional characterization of TOC—delineating not only the high-potential geographic areas but also the most enriched intervals within the vertical succession—represents a significant leap in predictive capability. It moves beyond simple anomaly-finding to provide a geologically sound model of the source rock system, directly guiding future exploration strategies toward the most promising drilling targets.
While TOC analysis successfully delineates the hydrocarbon source kitchens, the economic viability of the reservoir hinges on its capacity to store and transmit these hydrocarbons. Porosity is the key parameter that governs this storage capacity. Building upon the same high-fidelity, attenuation-compensated P-impedance volume, we employed a corresponding multi-regression model (Equation 16) to derive a quantitative porosity volume for the entire study area.
This equation establishes the empirical relationship between porosity (x) and P-wave impedance (y), serving as the petrophysical transform to convert the entire impedance volume into a corresponding porosity volume for the study area.
The resulting porosity volume, visualized in the cross-well profile of Figure 16(a), provides a much clearer picture of the reservoir's storage architecture. While confirming the overall low-porosity nature of the shale, a characteristic feature of such tight formations, our result moves beyond this general observation. The enhanced resolution, a direct benefit of the Q-compensated inversion, resolves subtle, higher-porosity streaks and lenses that are typically smeared and averaged out in conventional inversion outputs. These discrete zones, indicated by the warmer colors, represent the most promising storage intervals. The strong correlation with the DJ29 well log provides high confidence in the prediction, affirming that our methodology accurately captures even these slight variations in reservoir quality. The profile also reveals a distinct trend of decreasing porosity with depth, likely attributable to increased compaction and diagenetic effects, which is now imaged with unprecedented clarity.
To understand the lateral heterogeneity of storage potential, we extracted porosity maps along the same Shan-23 horizons used for the TOC analysis. The map of the top surface (Figure 16b) reveals a well-defined, high-porosity fairway concentrated in the southwestern portion of the study area. This region stands out as the primary sweet spot for hydrocarbon storage. In contrast, the bottom surface (Figure 16c) exhibits a more uniformly distributed but generally lower porosity, reinforcing the vertical compaction trend observed in the profile.
A crucial insight emerges when integrating this porosity distribution with the previously discussed TOC map. The primary storage sweet spots in the southwest are geographically distinct from the main source kitchens identified in the east and southeast. This spatial partitioning between generation and storage zones is a critical finding, suggesting a potential hydrocarbon migration pathway from east/southeast to southwest. Such detailed characterization is invaluable for development strategy. It allows for the high-grading of drilling locations not just based on one attribute, but on the integrated understanding of both source richness and storage quality. This level of detail, which enables the distinction between source and reservoir domains, is a direct outcome of the superior imaging provided by our advanced workflow, ultimately transforming a geophysical dataset into an actionable tool for optimizing well placement and predicting production performance.
The distinct spatial partitioning revealed by our analysis—between the primary source kitchens in the east and southeast and the optimal storage fairways in the southwest—paints a comprehensive and previously unresolved picture of the reservoir's petroleum system. This clear geographic separation strongly suggests a potential hydrocarbon migration pathway, a critical insight for understanding charge and accumulation [83]. Such a detailed characterization of reservoir heterogeneity, which distinguishes source from storage, is a direct dividend of the enhanced resolution and fidelity afforded by the Q-compensated impedance volume. This work therefore transforms the reservoir from a generalized low-porosity, low-permeability challenge into a mappable system of distinct geological opportunities, providing a robust framework for de-risking exploration and focusing development efforts with unprecedented confidence.
5. Discussion
The central premise of this investigation is that in geologically complex and highly attenuating settings, such as the Da Ning-Ji Xian area, physics-based attenuation compensation is not an optional refinement but an indispensable prerequisite for quantitative seismic inversion. Our findings compellingly validate this thesis, demonstrating that conventional workflows, despite their mathematical sophistication, are fundamentally constrained by the integrity of their input data. When applied to seismograms marred by narrow bandwidth and phase distortion, they produce an impedance volume that offers only a veneer of geological plausibility—a "blurry" image that masks the very details essential for shale gas characterization.
The foundation of our proposed framework—and its transformative impact—is the rigorous, data-driven estimation of the attenuation factor, Q. The high-resolution Local Time-Frequency Transform (LTFT) at the core of our methodology proved critical, yielding a geologically coherent Q-field that avoids the non-physical artifacts common to traditional methods. More than just a processing parameter, this Q-field emerged as a powerful diagnostic attribute in its own right. The pronounced low-Q anomaly (Q ≈ 60-80) structurally conforming to the target Shanxi Formation is a direct geophysical expression of intrinsic energy dissipation within the organic-rich mudstones and coal seams. This provides a new, independent dimension of evidence for prospecting, one that is sensitive to the lithological complexity that conventional amplitude analysis often struggles to resolve.
The definitive validation of our approach is crystallized in the stark contrast between the P-impedance volumes derived before and after Q-compensation. The inversion of the compensated dataset achieves a transformative leap from ambiguity to clarity. This is not a subtle improvement; it is the difference between an uninterpretable, smeared response and a sharp, geologically articulate image where stratigraphic boundaries are crisply defined and impedance contrasts accentuate lithological differences. This comparison provides unequivocal evidence that inversion algorithms cannot create information that has been irrevocably lost to attenuation. They can only faithfully translate the information present in the seismic waveform. By restoring this information before inversion, our workflow empowers the algorithm to resolve the internal architecture of the reservoir, turning a blurred geophysical anomaly into a clearly delineated set of rock properties.
With this high-fidelity geophysical foundation established, the ultimate objective was to translate it into a predictive geological model. The resulting TOC and porosity volumes unveil an unprecedentedly detailed picture of the study area's petroleum system, leading to a critical geological insight: the distinct spatial partitioning between the source rock "kitchen" and the reservoir storage "sweet spot." Our analysis identifies the primary depocenters of organic matter—the engine of hydrocarbon generation—as being concentrated in the eastern and southeastern parts of the study area. Conversely, the zones with the best storage capacity are predominantly located in the southwest. This geographic separation is profoundly significant for exploration, as it illuminates a dominant hydrocarbon migration fairway and provides a robust framework for understanding charge and accumulation. This elevates exploration strategy from simply targeting isolated high-value anomalies to pursuing the geological fairways that connect the source with the reservoir.
A rigorous scientific assessment requires acknowledging the inherent limitations and charting a path for future enhancement. The stability of Q-estimation is contingent upon the signal-to-noise ratio, and the empirical rock-physics transforms assume lateral facies stability, which may introduce uncertainty away from well control. The path forward involves mitigating these factors. Integrating multi-scale constraints from VSP or full-waveform inversion could yield more robust Q-models. A more ambitious step would be a transition towards rock-physics driven inversion, embedding petrophysical models directly within the objective function to reduce reliance on post-inversion transforms. Finally, geostatistical methods could quantify the uncertainty in sweet spot prediction, providing a suite of equiprobable reservoir models to support risk-based decision-making.
In conclusion, by building an interpretation framework centered on rigorous attenuation compensation, this study provides a validated and effective technical solution for characterizing one of China's most challenging shale gas plays. More importantly, it demonstrates a clear link between advanced seismic processing and profound geological insight, offering a robust template for unlocking similar unconventional resources worldwide.
Author Contributions
Conceptualization, J.Z; methodology, Y.Y; software, Y.Y and H.P; validation, T.S; investigation, Y.Y; resources, Z.Q and Q.Z; data curation, Z.Q and Q.Z; writing—original draft preparation, Y.Y.; writing—review and editing, J.Z.; visualization, J.Z.; supervision, J.Z.; project administration, J.Z; funding acquisition, J.Z. All authors have read and agreed to the published version of the manuscript.
Funding
This work is supported by Science Fund for Creative Research Groups of the National Natural Science Foundation of China (No. 42321002), Fundamental Research Funds for the Central Universities (Grant No. grant no. 2022JCCXMT01, 2602020RC130).
Acknowledgments
We would like to express our gratitude to the editor-in-chief and the two anonymous reviewing experts for their valuable comments and feedback on this manuscript.
Conflicts of Interest
The authors declare no conflict of interest.
References
- LI Y, DUAN W, QIN L, et al. Adjacent channel attenuation difference estimation and its application in near-surface Q inversion [J]. Journal of Applied Geophysics, 2023, 215. [CrossRef]
- LIU W, LI Z, HUANG X, et al. Seismic Attenuation Parameter Estimation Based on Improved GLCT [J]. Ieee Geoscience and Remote Sensing Letters, 2024, 21. [CrossRef]
- ZHANG Q, LV X-Y, LEI Q, et al. Seismic multiple attenuation based on improved U-Net [J]. Applied Geophysics, 2024, 21(4): 680-96. [CrossRef]
- JEE H W, HAN S W, LEE K. Three-dimensional path-effect model to simulate ground motion attenuation on the Korean Peninsula [J]. Earthquake Spectra, 2024, 40(4): 2651-68.
- MONIKA P, SANDEEP S, KUMAR P, et al. Modelling of 1991 Uttarkashi and 2011 Indo-Nepal earthquakes using the modified semi-empirical technique by integrating site-specific quality factor [J]. Journal of Earth System Science, 2023, 132(4). [CrossRef]
- WAN W, BO J, PENG D. Prediction Equation for Horizontal Ground Motion Peak Values in the Loess Plateau Region [J]. Applied Sciences-Basel, 2025, 15(3). [CrossRef]
- WANG H, XU L, XIE X, et al. An Empirical Spatiotemporal Input Model for Regional Seismic Ground Motions [J]. International Journal of Structural Stability and Dynamics, 2024. [CrossRef]
- JIN Z, LIU Z, SHI Y, et al. A novel method to estimate Q from seismic data based on rock-physics modeling [J]. Geophysics, 2023, 88(2): MR55-MR63. [CrossRef]
- ZHENG Y, HUANG C, ZHAO L, et al. Rock Physics Model Constrained Viscoacoustic Full Waveform Inversion for Saturation and Porosity Estimation [J]. Ieee Transactions on Geoscience and Remote Sensing, 2025, 63. [CrossRef]
- ZHANG M, GAO J, WANG Z, et al. The Kernel-Based Regression for Seismic Attenuation Estimation on Wasserstein Space [J]. Ieee Transactions on Geoscience and Remote Sensing, 2024, 62. [CrossRef]
- ZHAO H, GAO J, LI Z. Absorption-Constrained Wavelet Power Spectrum Inversion for Robust Extraction From VSP Data [J]. Ieee Transactions on Geoscience and Remote Sensing, 2024, 62. [CrossRef]
- JIN Z, WANG R, SHI Y. T* Revise Attenuation Tomography for Q Estimation [J]. Applied Sciences-Basel, 2023, 13(8). [CrossRef]
- LUO R, YIN Y, CHEN H, et al. Attenuation Compensation and Q Estimation of Nonstationary Data Using Semi-Supervised Learning [J]. Ieee Geoscience and Remote Sensing Letters, 2023, 20. [CrossRef]
- CHENG L, ZHANG Z, TAN H, et al. Seismic-bandwidth enhancement by the nonstationary sparse inversion [J]. Chinese Journal of Geophysics-Chinese Edition, 2025, 68(2): 696-712.
- FREITAS D F, CETALE M, FIGUEIREDO JR A G, et al. Multi-window spectrum analysis of B?zios oil field PSDM seismic data applied to frequency attenuation study [J]. Journal of Applied Geophysics, 2023, 213.
- LIU J, CHEN X, QIE C, et al. Generalized S-Transform Based on Sparse Representation and Its Application on Attenuation Gradient Estimation [J]. Ieee Geoscience and Remote Sensing Letters, 2024, 21. [CrossRef]
- LIU N, WEI S, LI S, et al. Sparse unscaled time-frequency transform and its application on seismic attenuation delineation [J]. Geophysics, 2023, 88(6): B355-B68. [CrossRef]
- LIU N-H, ZHANG Y-X, YANG Y, et al. Application of sparse S transform network with knowledge distillation in seismic attenuation delineation [J]. Petroleum Science, 2024, 21(4): 2345-55. [CrossRef]
- XU S, HU X, XU D, et al. Analysis and application of low frequency shadows based on the asymptotic theory for porous media [J]. Scientific Reports, 2024, 14(1). [CrossRef]
- ZHAO Y, CAO H, YANG Z, et al. A seismic thin-layer detection factor calculated by integrated transform with non-negative matrix factorization [J]. Geophysical Prospecting, 2024, 72(6): 2274-81.
- YIN Z, WEI J, DI B. Identification of fracture strike using Q-anisotropy [J]. Petroleum Geophysical Prospecting, 2011, 46(3): 429-33.
- ALSHANGITI A, ZHOU H-W. Estimation of seismic attenuation for reservoirs mapping and inverse Q-filtering: An application on land seismic data [J]. Geophysical Prospecting, 2023, 71(4): 682-97. [CrossRef]
- DUAN C, FANCHANG F, HONG H. Multichannel Prestack Attenuation Compensation Based on Low-Dimensional Manifold Model [J]. Ieee Transactions on Geoscience and Remote Sensing, 2025, 63.
- ZHANG M, ZHOU H, CHEN H, et al. Stable Q-compensated reverse-time migration based on regularization strategy [J]. Chinese Journal of Geophysics-Chinese Edition, 2023, 66(8): 3427-43.
- BOSE S, SINGH C, SARKAR S, et al. Crustal Heterogeneity of the Bhutan Himalaya: Insights from PgQ Tomography [J]. Bulletin of the Seismological Society of America, 2025, 115(1): 248-59. [CrossRef]
- DUAN M, ZHOU L, FU Y, et al. The 3D QP model of the China Seismic Experimental Site (CSES-Q1.0) and its tectonic implications [J]. Solid Earth, 2025, 16(4/5): 391-408.
- PENG Z, QU J, CHEN C, et al. Coal Accumulation in Marine to Continental Transitional Sequence During Late Carboniferous-Early Permian in the Southeastern Ordos Basin, China [J]. Geological Journal, 2025. [CrossRef]
- QI Y, WU K, LI Q, et al. Seismic prediction technology for thin reservoirs of tight gas in coal measure strata: a case study of Block L in the eastern margin of the Ordos Basin [J]. Frontiers in Earth Science, 2025, 12. [CrossRef]
- ZHANG K, LI S, ZHONG G, et al. Characteristics of in-situ stress field of coalbed methane reservoir in the eastern margin of Ordos basin [J]. International Journal of Coal Geology, 2025, 301. ttps://doi.org/10.1016/j.coal.2025.104715.
- SEELAM N K, KUMAR T, DHUBIA S, et al. Enhancing Thin Coal Seam Detection in Eastern Indian Coalfields Using ICWT-Decon-Based Seismic Attributes and Acoustic Impedance Inversion [J]. Minerals, 2024, 14(9). [CrossRef]
- WANG X, ZHOU L, WU Y, et al. Factors controlling spatial distribution of complex lithology in transitional shale strata: Implications from logging and 3D seismic data, Shan-2 Lower Sub-member, Eastern Ordos Basin [J]. Frontiers in Earth Science, 2023, 10. [CrossRef]
- YU H, WANG H, WU L, et al. A precise time-depth conversion method for coal seam based on machine learning and seismic velocity inversion [J]. Acta Geophysica, 2025, 73(5): 4059-73. [CrossRef]
- WU H, ZHU S, LIU Q, et al. Amplitude variation with offset and azimuth inversion to predict and evaluate coal seam fracture parameters [J]. Frontiers of Earth Science, 2023, 17(2): 505-13. [CrossRef]
- VEEKEN P, DA SILVA. Seismic inversion methods and some of their constraints [J]. First break, 2004, 22(6).
- GHOLAMI, A. A fast automatic multichannel blind seismic inversion for high-resolution impedance recovery [J]. Geophysics, 2016, 81(5): V357-V64. [CrossRef]
- ZHANG B, PU Y, DAI R, et al. Seismic poststack impedance inversion using geophysics-informed deep-learning neural network [J]. Interpretation, 2025, 13(2): T219-T32. [CrossRef]
- ZHAO Y, WEN X, XIE C, et al. Seismic inversion of anisotropic and isotropic fluid indicators and fracture density in the TTI medium [J]. IEEE Transactions on Geoscience and Remote Sensing, 2025. [CrossRef]
- ARABPOUR A, HAMIDZADEH MOGHADAM R, NIRI M E. Bayesian seismic inversion by residual flow [J]. Geophysics, 2025, 90(5): 1-81.
- CARMO S, AZEVEDO L, SOARES A. Exploring seismic inversion methodologies for non-stationary geological environments: a benchmark study between deterministic and geostatistical seismic inversion [J]. Geophysical Prospecting, 2017, 65(5): 1333-50. [CrossRef]
- ESMAEILZADEH S, MORADZADEH A, ASGHARI O, et al. Iterative geostatistical seismic inversion with adaptive local variogram models [J]. Earth Science Informatics, 2025, 18(3). [CrossRef]
- GRANA D, DE FIGUEIREDO L. SeReMpy: Seismic reservoir modeling Python library [J]. Geophysics, 2021, 86(6): F61-F9.
- NI X-B, ZHANG J-J, CHEN K, et al. Geostatistical inversion method based on seismic waveform similarity [J]. Applied Geophysics, 2023, 20(2): 186-97.
- NWAFOR B O, HERMANA M, ELSAADANY M. Geostatistical Inversion of Spectrally Broadened Seismic Data for Re-Evaluation of Oil Reservoir Continuity in Inas Field, Offshore Malay Basin [J]. Journal of Marine Science and Engineering, 2022, 10(6). [CrossRef]
- GAO B, ZHOU H, WANG L, et al. Nonstationary Prestack Linear Bayesian Stochastic Inversion [J]. Ieee Transactions on Geoscience and Remote Sensing, 2024, 62. [CrossRef]
- KUMAR B, KANT R, MAURYA S P, et al. Reservoir characterization using simultaneous inversion of pre-stack seismic data based on traditional conjugate gradient methods and particle swarm optimization: A comparative case study [J]. Earth Science Informatics, 2025, 18(1). [CrossRef]
- YANG K, AI D-F, GENG J-H. A new geostatistical inversion and reservoir modeling technique constrained by well-log, crosshole and surface seismic data [J]. Chinese Journal of Geophysics-Chinese Edition, 2012, 55(8): 2695-704.
- ZHANG J, SONG J, ZHAO S. A High-Resolution Post-Stack Inversion Method Constrained by Seismic Waveform Characteristics [J]. Ieee Transactions on Geoscience and Remote Sensing, 2025, 63. [CrossRef]
- CHEN X, XIA J, PANG J, et al. Deep learning inversion of Rayleigh-wave dispersion curves with geological constraints for near-surface investigations [J]. Geophysical Journal International, 2022, 231(1): 1-14. [CrossRef]
- LELIEVRE P G, FARQUHARSON C G, TYCHOLIZ C J. Integrating geological constraints into 3D geophysical inversions using unstructured meshes; proceedings of the 12th Biennial SGA Meeting on Mineral Deposit Research for a High-Tech World, Geol Survey Sweden, Uppsala, SWEDEN, F 2013Aug 12-15, 2013 [C]. 2013.
- LIPARI V, URBANO D, SPADAVECCHIA E, et al. Regularized tomographic inversion with geological constraints [J]. Geophysical Prospecting, 2017, 65(1): 305-15.
- DING Q, CHEN S, SHEN J, et al. Multiparameter Inversion of Seismic Pre-Stack Amplitude Variation with Angle Based on a New Propagation Matrix Method [J]. Applied Sciences-Basel, 2025, 15(5). [CrossRef]
- CAO C, FENG D, TANG J, et al. Seismic Multi-Parameter Full-Waveform Inversion Based on Rock Physical Constraints [J]. Applied Sciences-Basel, 2025, 15(14). [CrossRef]
- DUAN X-L, ZHAI H-Y, WANG Y-B, et al. Effect of stratigraphic attenuation on inverse-scattering seismic velocity inversion [J]. Chinese Journal of Geophysics-Chinese Edition, 2016, 59(10): 3788-97.
- HUANG G, CHEN X, LUO C, et al. Time-Lapse Seismic Difference-and-Joint Prestack AVA Inversion [J]. Ieee Transactions on Geoscience and Remote Sensing, 2021, 59(11): 9132-43. [CrossRef]
- LIU B, GONG Z, ZHANG F, et al. Full-waveform inversion method for tunnel seismic forward prospecting [J]. Geophysical Journal International, 2023, 232(3): 2186-204. [CrossRef]
- LIU J, SUN Y, LIU Y. Model-data-driven seismic inversion method based on small sample data [J]. Petroleum Exploration and Development, 2022, 49(5): 1046-55. [CrossRef]
- BULAND A, KOLBJORNSEN O, HAUGE R, et al. Bayesian lithology and fluid prediction from seismic prestack data [J]. Geophysics, 2008, 73(3): C13-C21. [CrossRef]
- DAI R, ZHANG F, YIN C, et al. Multi-trace post-stack seismic data sparse inversion with nuclear norm constraint [J]. Acta Geophysica, 2021, 69(1): 53-64. [CrossRef]
- OUMAROU S, MABROUK D, TABOD T C, et al. Seismic Inversion and Lithological Characterization of Reservoirs: Case of Penobscot, Nova Scotia Offshore (Canada); proceedings of the 3rd Conference of the Arabian-Journal-of-Geosciences (CAJG), Electr Network, F 2024. Nov 02-05, 2020 [C]. 2024.
- JING S, DENGFA H. Tectonic characteristics and evolution of the middle segment of the Jinxi flexure fold belt in the eastern margin of the Ordos Basin [J]. Chinese Journal of Geology, 2024, 59(3): 723-31.
- LIU, S. The coupling mechanism of basin and orogen in the western Ordos Basin and adjacent regions of China [J]. Journal of Asian Earth Sciences, 1998, 16(4): 369-83. [CrossRef]
- DENGFA H, CHENG X, ZHANG G, et al. Scope, nature, and exploration significance of Ordos Basin during geological historical periods, NW China [J]. Petroleum Exploration and Development, 2025, 52(4): 855-71. [CrossRef]
- DENG J, ZENG H, WU P, et al. Pore structure differentiation between deltaic and epicontinental tight sandstones of the upper Paleozoic in the eastern linxing area, ordos basin, China [J]. Geofluids, 2021, 2021(1): 9015041. [CrossRef]
- WANG H, ZHANG J, YONG Z, et al. The Differential Enrichment Law of Tight Sandstone Gas in the Eighth Member of Shihezi Formation in the North and South of Ordos Basin [J]. Energies, 2024, 17(23): 5978. [CrossRef]
- GAO S, YANG J. Palaeostructure, evolution and tight oil distribution of the Ordos Basin, China [J]. Oil & Gas Science and Technology–Revue d’IFP Energies nouvelles, 2019, 74: 35. [CrossRef]
- DU W, JIANG Z, ZHANG Y, et al. Sequence stratigraphy and sedimentary facies in the lower member of the Permian Shanxi formation, northeastern Ordos Basin, China [J]. Journal of Earth Science, 2013, 24(1): 75-88. [CrossRef]
- GUAN Y, GUO Q, PU R, et al. Distribution of Upper Paleozoic coal seams in the Southeastern Ordos basin [J]. Energies, 2022, 15(14): 5110. [CrossRef]
- LIU J, LIU K, HUANG X. Effect of sedimentary heterogeneities on hydrocarbon accumulations in the Permian Shanxi Formation, Ordos Basin, China: Insight from an integrated stratigraphic forward and petroleum system modelling [J]. Marine and Petroleum Geology, 2016, 76: 412-31. [CrossRef]
- LIU S, LI J, JIN F, et al. Genesis of efficient reservoirs in mixed sedimentary setting: a case study of Benxi Formation in the Gaoqiao area, Ordos Basin [J]. Turkish Journal of Earth Sciences, 2024, 33(2): 118-45. [CrossRef]
- LI, Y. Depositional environment analysis of Shanxi Formation in eastern Ordos Basin [J]. Acta Sedimentologica Sinica, 2008, 26(2): 202-10.
- LI J, LI X, TIAN W, et al. Characterization of the sedimentary environment of the Shanxi Formation in the southeastern Ordos Basin revealed by detrital zircon and geochemical analyses [J]. Minerals, 2023, 13(10): 1331. [CrossRef]
- XUE Y, DANG W, ZHANG Q, et al. Lithofacies and its reservoir characteristics of marine–continental transitional shales: a case study of Shanxi Formation in Eastern Ordos Basin [J]. Energy & Fuels, 2024, 38(19): 18441-56. [CrossRef]
- GUO W, SHEN W, ZHOU S, et al. Shale favorable area optimization in coal-bearing series: A case study from the Shanxi Formation in Northern Ordos Basin, China [J]. Energy Exploration & Exploitation, 2018, 36(5): 1295-309. [CrossRef]
- CHEN Y, ZHAO J, GUO M, et al. Depositional process and its control on the densification of coal-measure tight sandstones: insights from the Permian Shanxi Formation of the northeastern Ordos Basin, China [J]. International Journal of Earth Sciences, 2023, 112(6): 1871-90. [CrossRef]
- ZHAO W-B, ZHANG H, SHI Y-H, et al. Geological characteristics and exploration potential of the coal measure gas from Shan 2 of the Shanxi formation in the eastern Ordos Basin [J]. Frontiers in Earth Science, 2023, 11: 1142141. ttps://doi.org/10.3389/feart.2023.1142141.
- LIU Z, ZHAO S, HU Z, et al. Characteristics and controlling factors of coal-measure unconventional reservoirs–A case study of the Carboniferous-Permian in the Ordos Basin [J]. Unconventional Resources, 2025, 6: 100153. [CrossRef]
- LIU J, ZHANG X. Quantitative characterization of permeability heterogeneity of tight-sand reservoirs using nano-CT technology: A case study of the Yanchang Formation, Ordos Basin [J]. Energy Geoscience, 2025, 6(2): 100388. [CrossRef]
- WANG J, WU S, LI Q, et al. Characterization of the pore-throat size of tight oil reservoirs and its control on reservoir physical properties: A case study of the Triassic tight sandstone of the sediment gravity flow in the Ordos Basin, China [J]. Journal of Petroleum Science and Engineering, 2020, 186: 106701. [CrossRef]
- LIAO J, HONG L, LI Z, et al. Characterization of ultra-low permeability tight sandstone reservoir properties and criteria for hydrocarbon accumulation in Chang 6 member, Huaqing area, Ordos basin [J]. Frontiers in Earth Science, 2022, 10: 1013776. [CrossRef]
- FAN S, ZHANG T, CHEN S E, et al. New findings regarding the Fen-Wei Graben on the southeastern margin of the Ordos Block: Evidence from the Cenozoic sedimentary record from the borehole [J]. Geological Journal, 2020, 55(12): 7581-93. [CrossRef]
- XI S, LIU X, MENG P. Exploration practices and prospect of Upper Paleozoic giant gas fields in the Ordos Basin [J]. Natural Gas Industry B, 2015, 2(5): 430-9.
- SONG P, SHI J, LIU X, et al. Comprehensive Evaluation Method of the Tight Oil Reservoir Quality in the Ordos Basin [J]. Geofluids, 2025, 2025(1): 7745871. [CrossRef]
- GUAN Q, ZHANG J. Petroleum System Analysis and Migration Pathways in the Late Paleozoic Source Rock Strata and Sandstone Reservoirs in the Ordos Basin [J]. Energies, 2025, 18(1): 210. [CrossRef]
- TAO H, CUI J, ZHAO F, et al. Thermal history and hydrocarbon accumulation stages in Majiagou Formation of Ordovician in the East-Central Ordos Basin [J]. Energies, 2024, 17(17): 4435. [CrossRef]
- FANG X, QIU F, SHU L, et al. Reservoir Properties and Gas Potential of the Carboniferous Deep Coal Seam in the Yulin Area of Ordos Basin, North China [J]. Energies, 2025, 18(15): 3987. [CrossRef]
- ZHAO W, WEN Z, ZHANG H, et al. Integrated assessment of marine-continental transitional facies shale gas of the carboniferous Benxi Formation in the Eastern Ordos Basin [J]. Energies, 2021, 14(24): 8500. [CrossRef]
- CHEN S, XU Y, YU Y, et al. Geologically Guided Sparse Multitrace Reflectivity Inversion for High-Resolution Characterization of Subtle Reservoirs [J]. Applied Sciences, 2025, 15(9): 5125. [CrossRef]
- QI Y, WU K, WANG B, et al. Lithofacies identification of deep coalbed methane reservoir based on high-resolution seismic inversion [J]. Frontiers in Earth Science, 2024, 12: 1440729. [CrossRef]
- BASIN, T. Analysis of Seismic Response Characteristics of Coal-Bearing Sandstone Reservoirs in the Middle and Lower Jurassic in the South; proceedings of the Proceedings of the International Field Exploration and Development Conference 2023: Volume 2, F, 2024 [C]. Springer Nature.
- LIHONG Z, YONG L, RONG D, et al. Differential accumulation characteristics and production of coalbed methane/coal-rock gas: A case study of the No. 8 coal seam of the Carboniferous Benxi Formation in the Daji block, Ordos Basin, NW China [J]. Petroleum Exploration and Development, 2025, 52(4): 872-82.
- LIYUAN L, YONG L, SHUXIN L, et al. Controlling factors of Marine and continental transitional shale gas enrichment in Shan2 3 sub-member, Daji area, eastern margin of Ordos Basin [J]. Natural Gas Geoscience, 2025, 36(3): 554-66.
- LIN H, LIU X, XIONG J, et al. Research on transversely isotropic in-situ stress logging prediction of transitional shale reservoir: a case study of Daji Block, Eastern Ordos Basin, North China [J]. Petroleum Science and Technology, 2024, 42(10): 1296-315. [CrossRef]
- YAN T, HE S, ZHENG S, et al. Critical tectonic events and their geological controls on deep buried coalbed methane accumulation in Daning-Jixian Block, eastern Ordos Basin [J]. Frontiers of Earth Science, 2023, 17(1): 197-217. [CrossRef]
- ZHANG L, DONG D, QIU Z, et al. Sedimentology and geochemistry of Carboniferous-Permian marine-continental transitional shales in the eastern Ordos Basin, North China [J]. Palaeogeography, Palaeoclimatology, Palaeoecology, 2021, 571: 110389. [CrossRef]
- GUO Y-Q, LI B-Q, LI B, et al. Sedimentary system and palaeogeographic evolution of Ordos Basin, northern China [J]. Journal of Palaeogeography, 2025, 14(2): 501-34.
- GAO W, ZHANG Q, ZHAO J, et al. Transitional shale reservoir quality evaluation based on Random Forest algorithm—a case study of the Shanxi Formation, eastern Ordos Basin, China [J]. Earth Science Informatics, 2025, 18(1): 157. [CrossRef]
- SUN J, CHEN M, WANG B, et al. Analysis of Factors Influencing Tight Sandstone Gas Production and Identification of Favorable Gas Layers in the Shan 23 Sub-Member of the Daning-Jixian Block, Eastern Ordos Basin [J]. Processes, 2024, 12(9): 1810. [CrossRef]
- CHEN M, WANG B, TIAN H, et al. Multilayer Gas-Bearing System and Productivity Characteristics in Carboniferous–Permian Tight Sandstones: Taking the Daning–Jixian Block, Eastern Ordos Basin, as an Example [J]. Energies, 2025, 18(9): 2398.
- KUANG L, DAZHONG D, WENYUAN H, et al. Geological characteristics and development potential of transitional shale gas in the east margin of the Ordos Basin, NW China [J]. Petroleum Exploration and Development, 2020, 47(3): 471-82.
- PAN B, WANG K, DONG G, et al. Geochemical Characteristics and Paleoenvironmental Significance of No. 5 Coal in Shanxi Formation, Central–Eastern Ordos Basin (China) [J]. Minerals, 2025, 15(2): 177. [CrossRef]
- QIU Y, WANG H, GUO G, et al. Gas distribution and its geological factors in the No. 5 coal seam of the Weibei field, Southeastern Ordos Basin, North China [J]. Processes, 2022, 10(4): 659. [CrossRef]
- WANG D-X, WANG Y-G, ZHAO Y-H, et al. A strong seismic reflection amplitude suppressing method applied in the Ordos Basin; proceedings of the SPG/SEG 2016 International Geophysical Conference, Beijing, China, 20-22 April 2016, F, 2016 [C]. Society of Exploration Geophysicists and Society of Petroleum Geophysicists. 22 April.
- RONGTAO G, YUN C, ZIQI T, et al. Data Processing Solutions on Low Signal-to-Noise Data in Loess Plateau Area-A Case Study in Ordos Basin, China [J]. CT Theory and Applications, 2025.
- ZHANG J, GAO N, HUANG L-G, et al. Seismic Prediction of Laminated-Type Shale Oil Reservoirs and Its Application in Qingcheng Area, Ordos Basin; proceedings of the International Field Exploration and Development Conference, F, 2024 [C]. Springer.
- MANZOOR U, EHSAN M, HUSSAIN M, et al. Improved reservoir characterization of thin beds by advanced deep learning approach [J]. Applied Computing and Geosciences, 2024, 23: 100188. [CrossRef]
- CHEN Z, LI X, CHEN H, et al. The characteristics of lithofacies and depositional model of fine-grained sedimentary rocks in the Ordos Basin, China [J]. Energies, 2023, 16(5): 2390. [CrossRef]
- ZHOU C, LIU Z, ZHANG L, et al. Applications of NMR logs to complex lithology interpretation of ordos basin; proceedings of the SPWLA Annual Logging Symposium, F, 2007 [C]. SPWLA.
- HUANG Z, ZHOU R, YANG J, et al. Study on optimization of well pattern and well spacing for CBM development: Taking Daning Block as an example [J]. COAL SCIENCE AND TECHNOLOGY, 2023, 51(S2): 121-31.
- WANGHUA, S. Catastrophic mechanism of seepage deformation and failure of mining rock mass and its prevention & control Ⅰ: Water-sand mixture inrush from seam roof [J]. Journal of Earth Sciences and Environment, 2022, 44(6): 903-21.
- WANG Q-H, LIU Y, LIU C, et al. Continuous time-varying Q-factor estimation method in the time-frequency domain [J]. Applied Geophysics, 2020, 17(5-6): 844-56. [CrossRef]
- QUAN Y, HARRIS J M. Seismic attenuation tomography using the frequency shift method [J]. Geophysics, 1997, 62(3): 895-905. [CrossRef]
- FOMEL, S. Shaping regularization in geophysical-estimation problems [J]. Geophysics, 2007, 72(2): R29-R36.
- FOMEL, S. Local seismic attributes [J]. Geophysics, 2007, 72(3): A29-A33.
- WANG, Y. Inverse Q-filter for seismic resolution enhancement [J]. Geophysics, 2006, 71(3): V51-V60. [CrossRef]
- ALSHANGITI A, ZHOU H W. Estimation of seismic attenuation for reservoirs mapping and inverse Q-filtering: an application on land seismic data [J]. Geophysical Prospecting, 2023, 71(4): 682-97.
- WANG, Y. Seismic inverse Q filtering [M]. John Wiley & Sons, 2009.
- MAURYA S, SINGH N, SINGH K. Post-stack seismic inversion [M]. Seismic inversion methods: A Practical approach. Springer. 2020: 39-80.
- KUMAR R, DAS B, CHATTERJEE R, et al. A methodology of porosity estimation from inversion of post-stack seismic data [J]. Journal of Natural Gas Science and Engineering, 2016, 28: 356-64. [CrossRef]
- SOTELO V, ALMANZA O, MONTES L. Post-stack seismic inversion through probabilistic neural networks and deep forward neural networks [J]. Earth Science Informatics, 2024, 17(3): 1957-66. [CrossRef]
- SHAKIR U, ALI A, HUSSAIN M, et al. Selection of sensitive post-stack and pre-stack seismic inversion attributes for improved characterization of thin gas-bearing sands [J]. Pure and Applied Geophysics, 2022, 179(1): 169-96. [CrossRef]
- PRAMUDITO D, HARISANDI A, SINAGA R P, et al. Enhancing Low-Frequency Model for Post-Stack Inversion using Geostatistics: A Case Study in Imaging Carbonate Structure [J]. Jurnal Geofisika, 2021, 19(2): 69-73. [CrossRef]
- DATTA GUPTA S, SINHA S K, CHAHAL R. Capture the variation of acoustic impedance property in the Jaisalmer Formation due to structural deformation based on post-stack seismic inversion study: a case study from Jaisalmer sub-basin, India [J]. Journal of Petroleum Exploration and Production Technology, 2022, 12(7): 1919-43. [CrossRef]
- DAS B, CHATTERJEE R. Porosity mapping from inversion of post-stack seismic data [J]. Georesursy, 2016, 18(4): 306-13. [CrossRef]
- EL-SAYED A S, MABROUK W M, METWALLY A M. Utilizing post-stack seismic inversion for delineation of gas-bearing sand in a pleistocene reservoir, baltim gas field, nile delta, Egypt [J]. Scientific Reports, 2024, 14(1): 29596. [CrossRef]
- XUE Y-J, CAO J-X, WANG X-J, et al. Estimation of seismic quality factor in the time-frequency domain using variational mode decomposition [J]. Geophysics, 2020, 85(4): V329-V43. [CrossRef]
- BOUCHAALA F, ALI M Y, MATSUSHIMA J, et al. Estimation of seismic wave attenuation from 3D seismic data: a case study of OBC data acquired in an offshore oilfield [J]. Energies, 2022, 15(2): 534. [CrossRef]
- LIU W, ZHAI Z, FANG Z. A multisynchrosqueezing-based S-transform for time-frequency analysis of seismic data [J]. Pure and Applied Geophysics, 2025, 182(3): 1279-95. [CrossRef]
- SUN H, XU R, ZHANG J, et al. A Modified Unscaled S-Transform for Seismic Time-Frequency Analysis of Road Detection in Intelligent Transportation Systems [J]. IEEE Transactions on Intelligent Transportation Systems, 2025. [CrossRef]
- MA S, CAO J. An Efficient Transformer Model Enhanced by S-transform and Transfer Learning for Predicting Gas Distribution in Deeply Buried Reservoirs [J]. IEEE Transactions on Geoscience and Remote Sensing, 2025. [CrossRef]
- BA J, BA X-Y, DONG H-J, et al. Reservoir property estimation of interbedded sandstone and shale layers using segmented 3D rock-physics templates [J]. Applied Geophysics, 2025: 1-17. [CrossRef]
- FAWEI M, YANXIAO H, ZHENGXIN T, et al. A seismic reservoir characterization method based on post and pre-stack joint inversion [J]. Petroleum Science Bulletin, 2025, 10(4): 666.
- SAMUEL S, A. Integrated Post-Stack Seismic Inversion, Multi-Attribute Analysis, and Machine Learning for Carbon Storage [D]; Oklahoma State University, 2025.
- LIU S, ZHOU L, ZHANG B, et al. Thin-Layer Siliceous Dolomite Prediction Based on Post-Stack Seismic Data Mining and Optimization [J]. Applied Sciences, 2025, 15(17): 9631. [CrossRef]
- LI M, HUANG X, TANG S, et al. Reservoir-oriented migrated seismic image improvement and poststack seismic inversion using well-seismic mistie [J]. Interpretation, 2025, 13(1): T99-T112. [CrossRef]
- KIRKEVIK, T. Simultaneous Inversion of Post-Stack Seismic Time-Lapse Data; proceedings of the 86th EAGE Annual Conference & Exhibition, F, 2025 [C]. European Association of Geoscientists & Engineers.
- EWIDA H F, SARHAN M A. Assessing the efficacy of the post-stack processing in enhancing the quality of seismic data covering the Heba Oil Field, Abu Gharadig Basin, Egypt [J]. Arabian Journal of Geosciences, 2025, 18(4): 1-29. [CrossRef]
- CAI G, GU Y, SONG D, et al. Gas occurrence characteristics in marine-continental transitional shale from Shan23 sub-member shale in the Ordos Basin: Implications for shale gas production [J]. Natural Gas Industry B, 2025. [CrossRef]
- ZHANG J, DANG W, ZHANG Q, et al. Fractal Characterization of Pore Structures in Marine–Continental Transitional Shale Gas Reservoirs: A Case Study of the Shanxi Formation in the Ordos Basin [J]. Energies, 2025, 18(15): 4013. [CrossRef]
Figure 3.
The proposed integrated framework for high-resolution quantitative inversion.
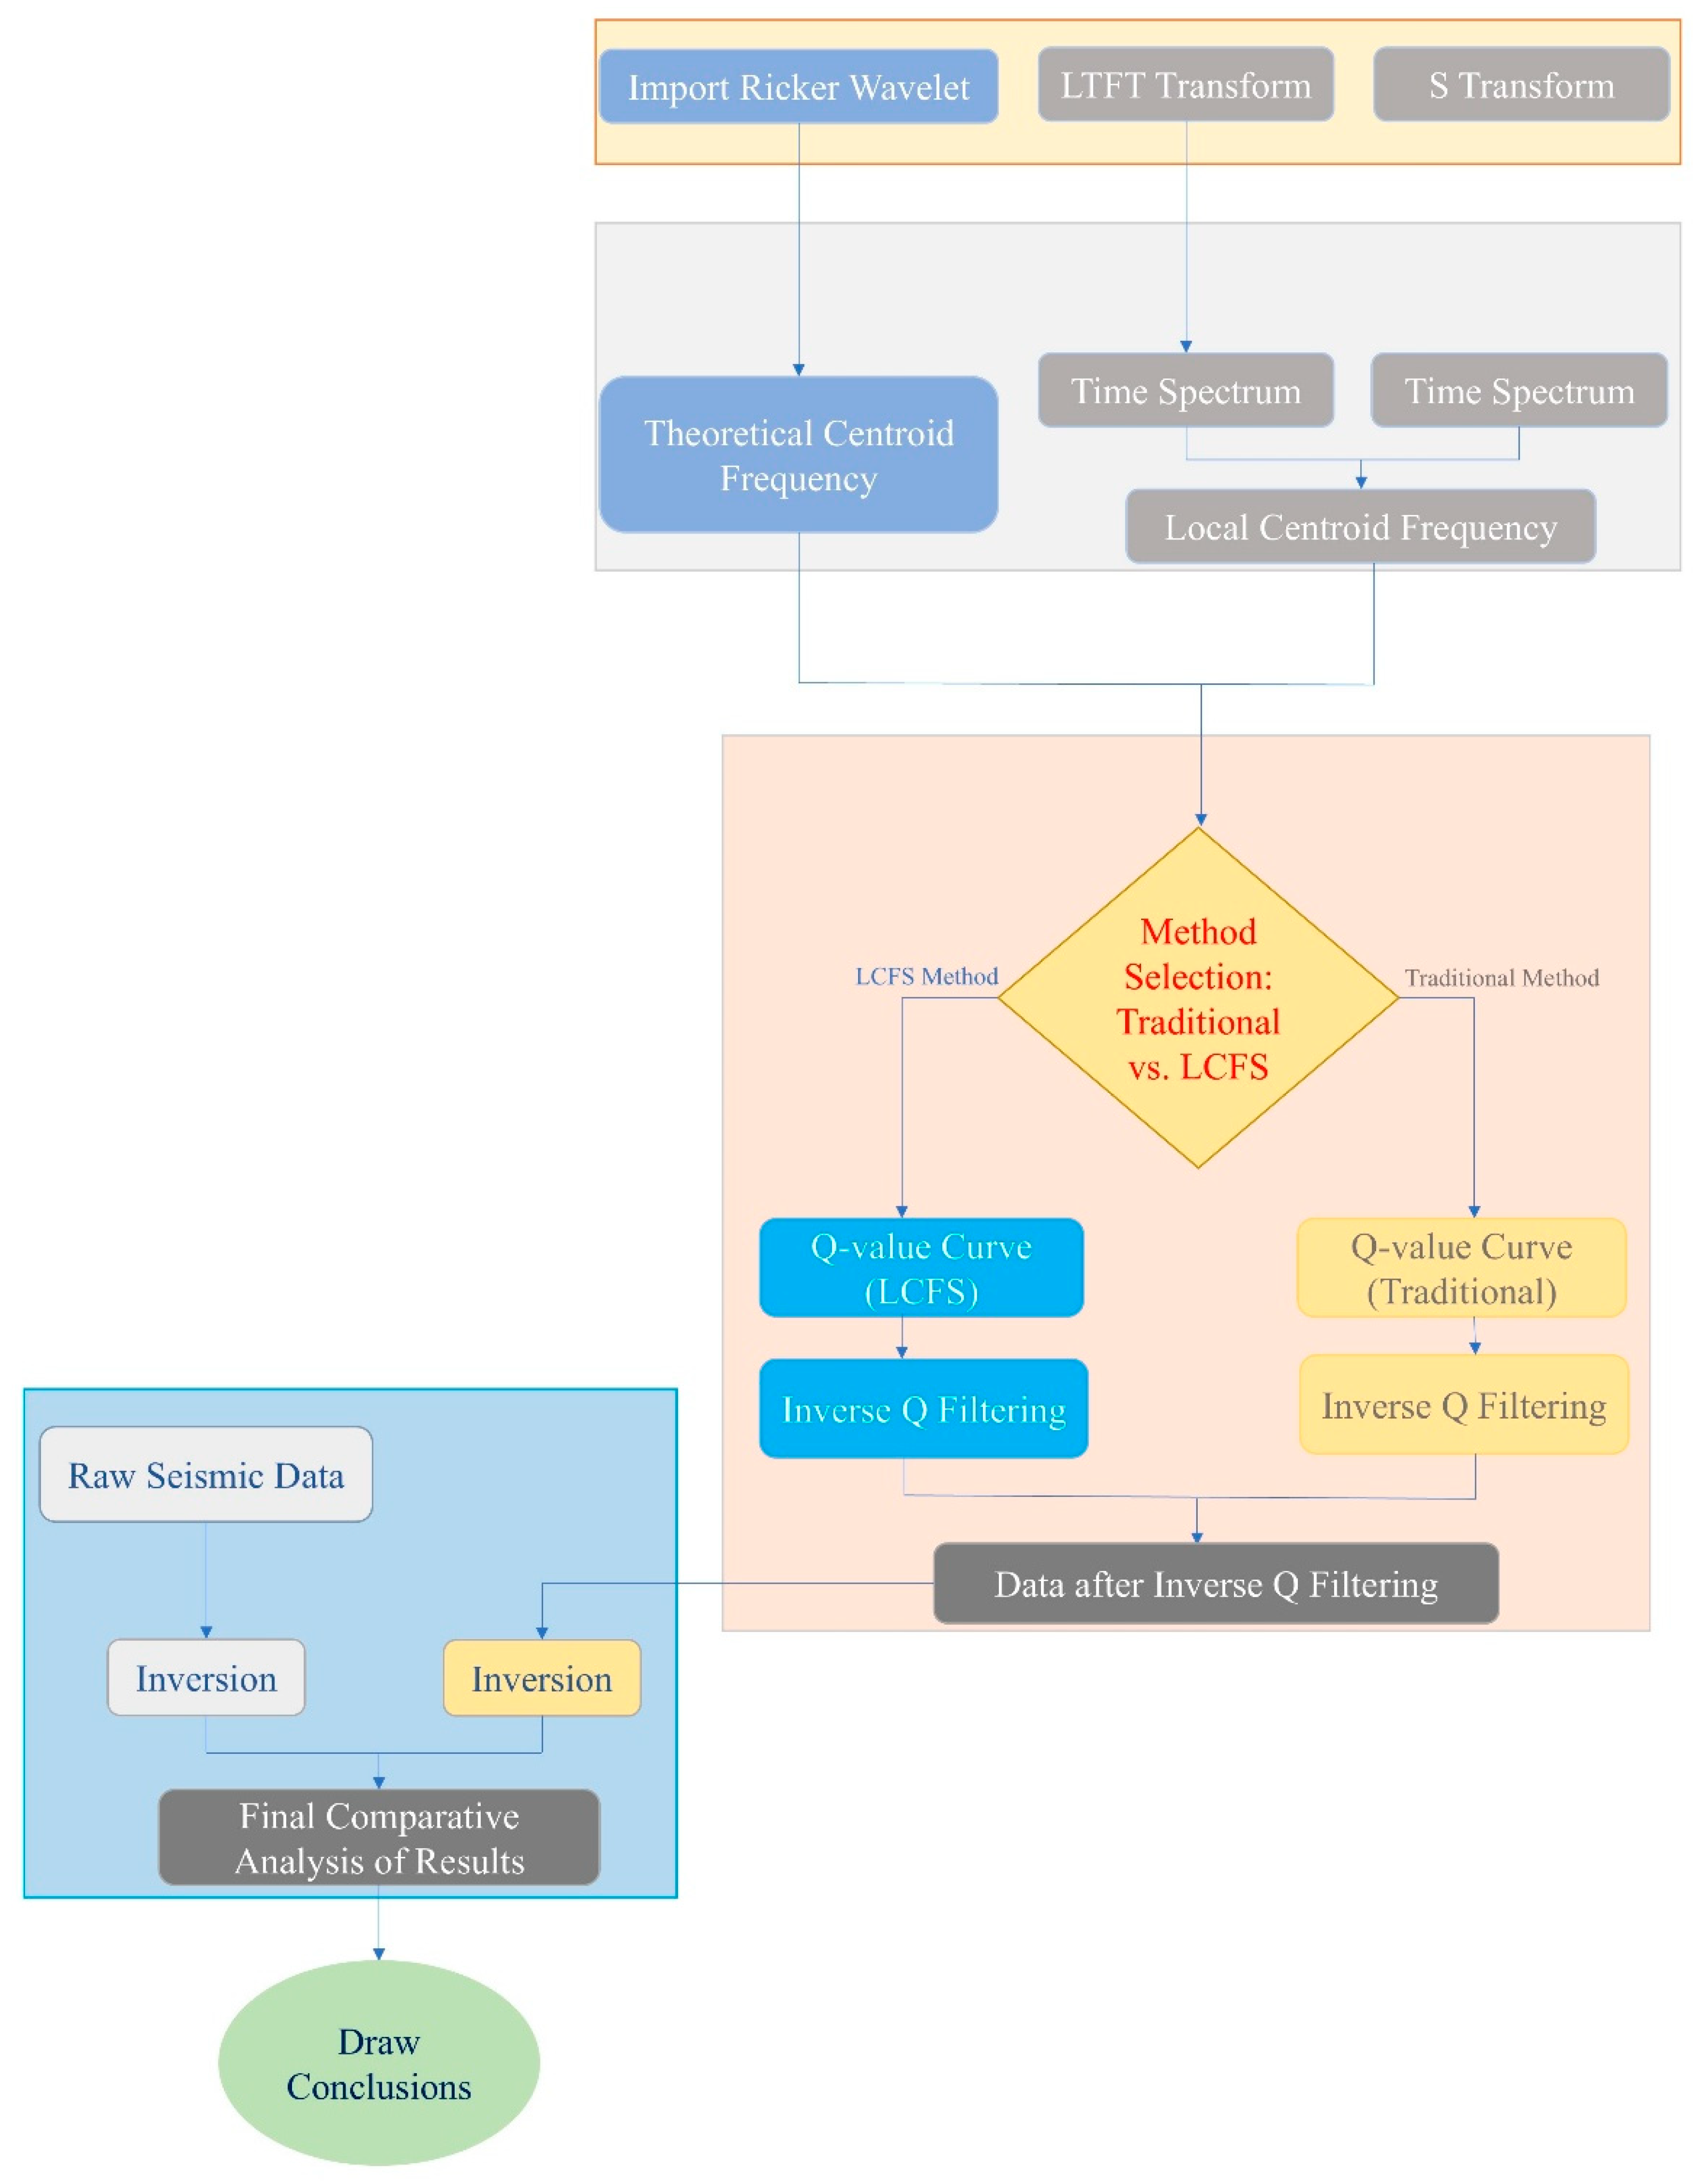
Figure 4.
The 2D synthetic model used for methodology validation: (a) The layered interval Q-model, featuring a constant background Q value below the unattenuated first layer. (b) The corresponding zero-offset synthetic seismic section generated from the model, exhibiting progressive amplitude decay and waveform broadening with increasing travel time.
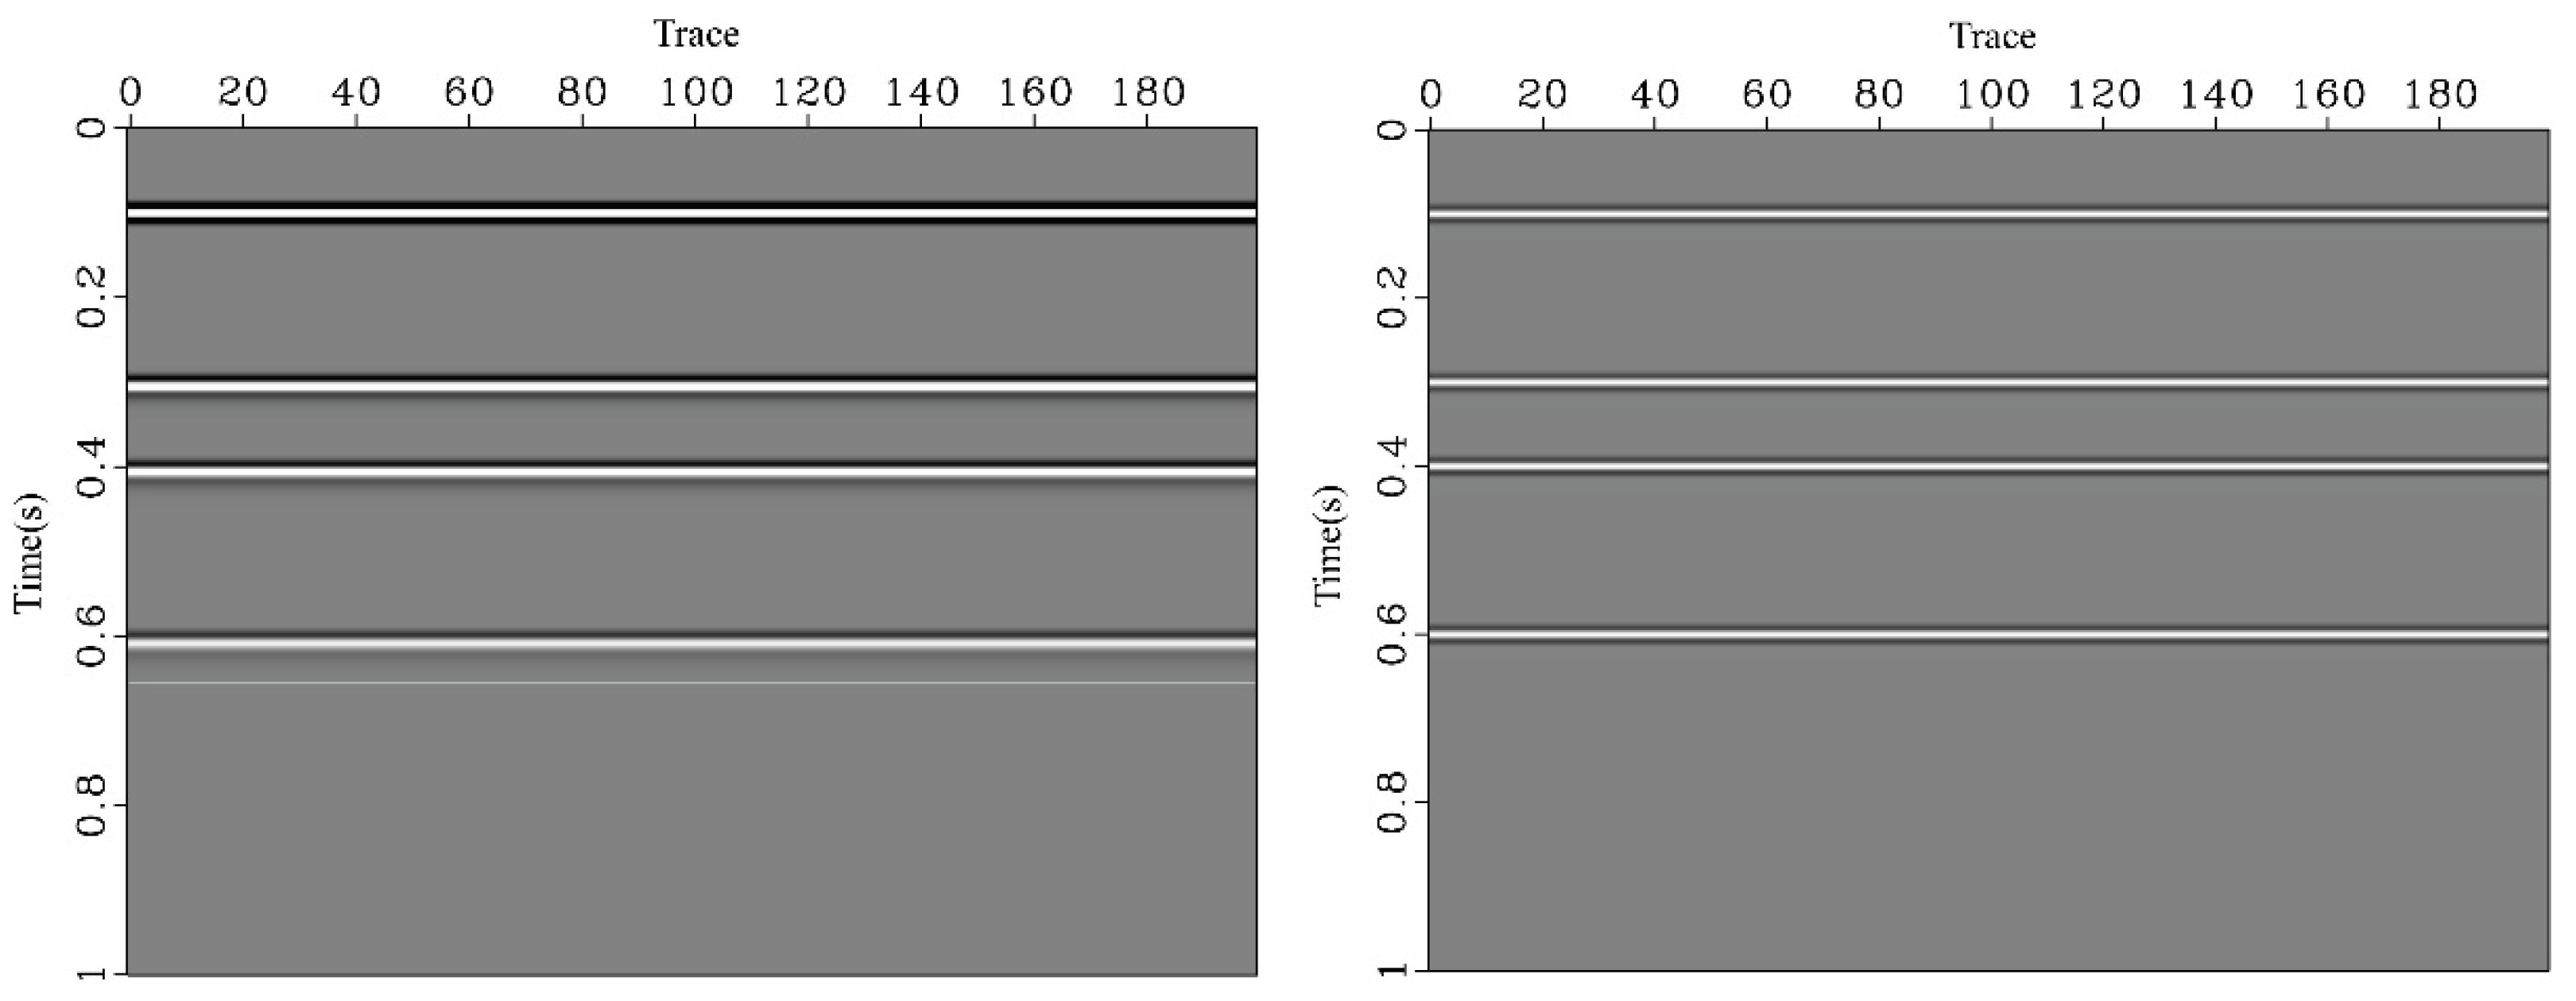
Figure 5.
Comparison of time-frequency spectra for a synthetic seismic trace, derived from (a) the Local Time-Frequency Transform (LTFT) and (b) the S-transform.
Figure 5.
Comparison of time-frequency spectra for a synthetic seismic trace, derived from (a) the Local Time-Frequency Transform (LTFT) and (b) the S-transform.
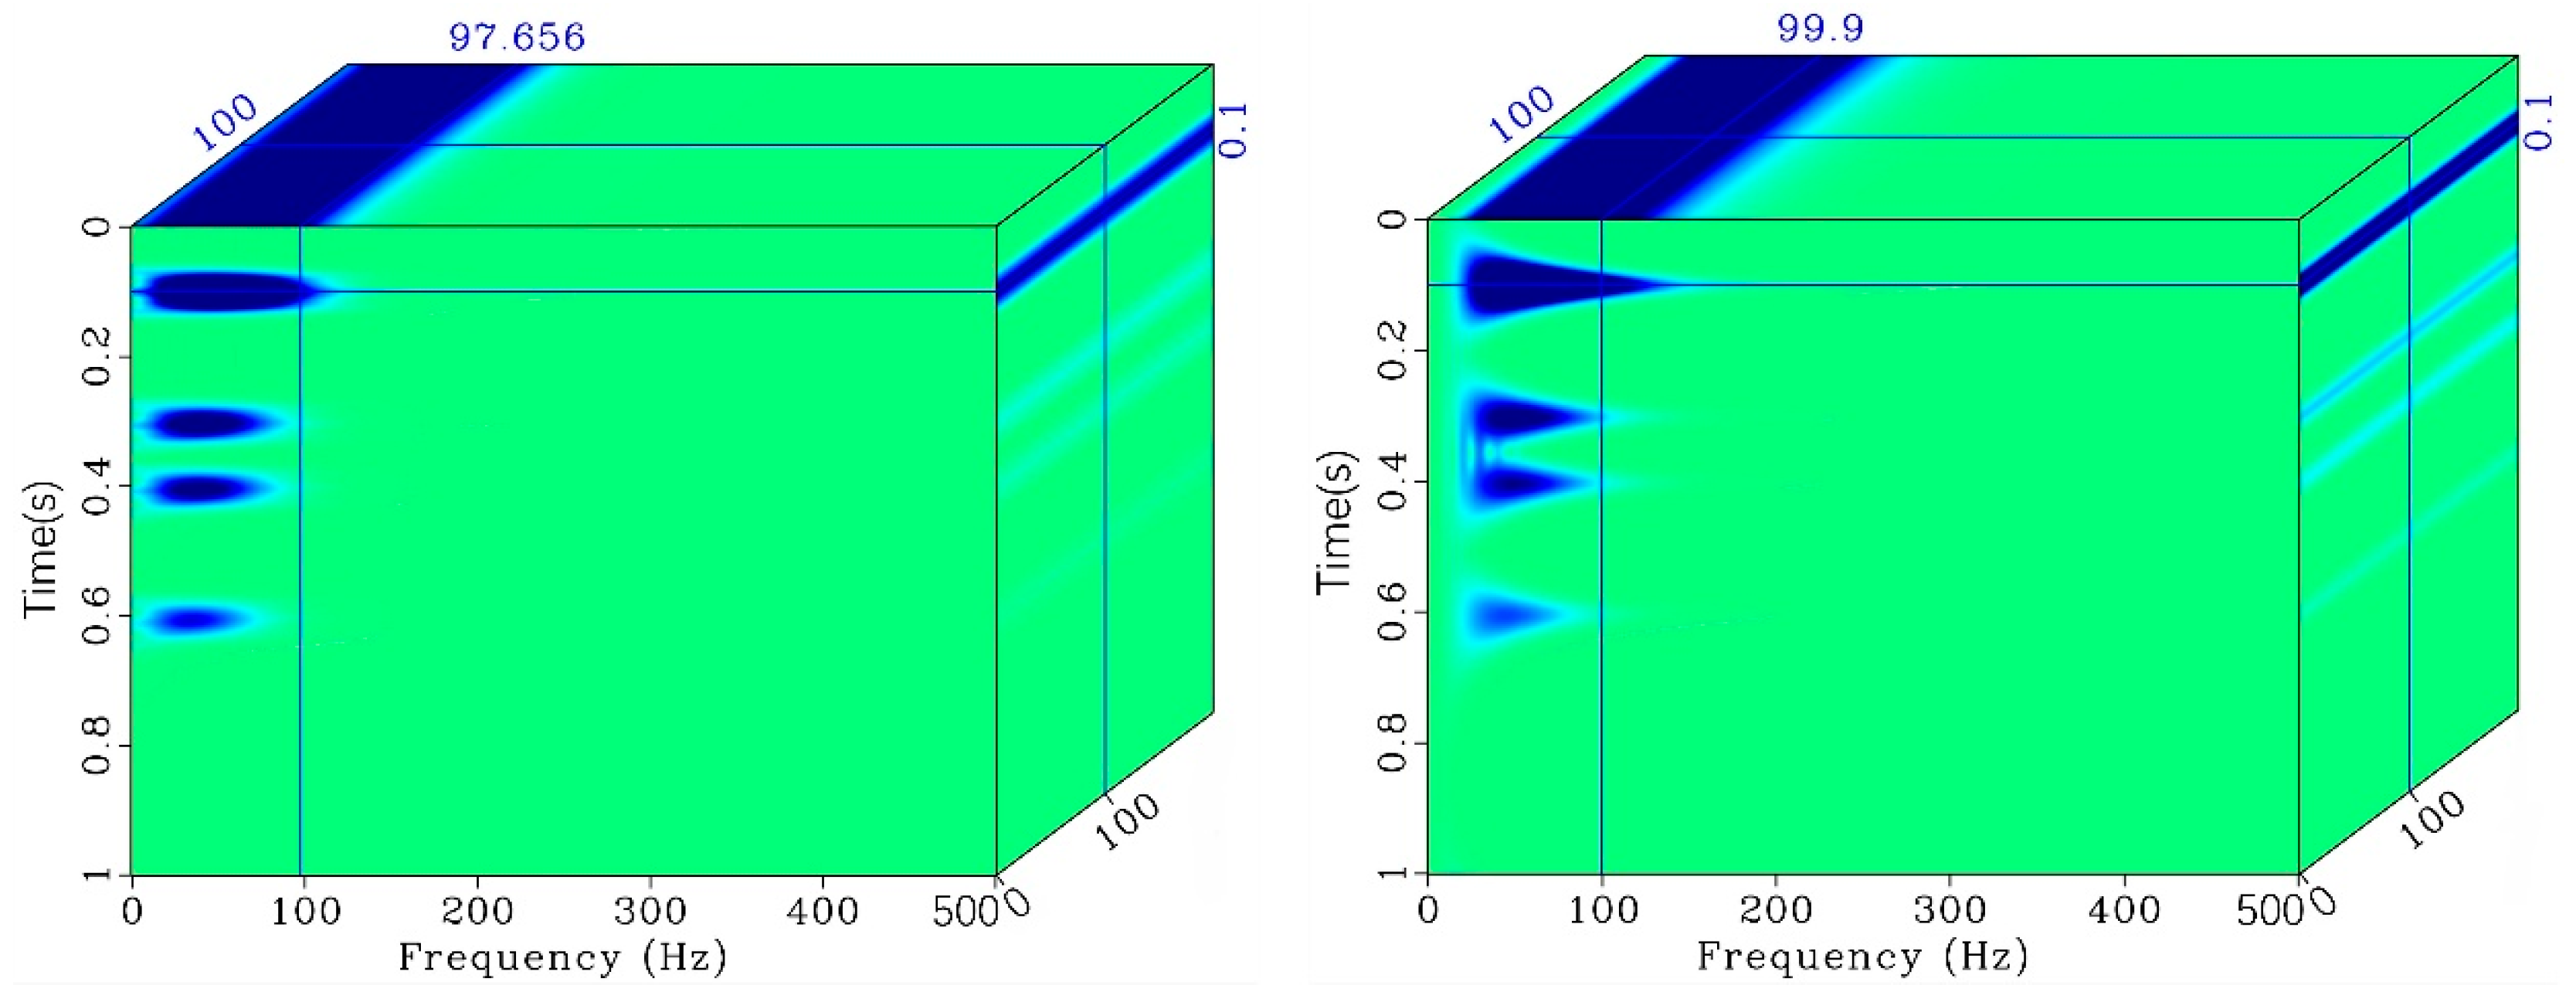
Figure 6.
Comparative accuracy of centroid frequency estimation.

Figure 7.
Workflow and results of inverse Q filtering on a seismic profile from the Ordos Basin:. (a)Original post-stack seismic section, (b)Seismic section after applying Automatic Gain Control (AGC) (c) Estimated equivalent time-varying Q-factor profile (d) Seismic section after inverse Q filtering for attenuation compensation.
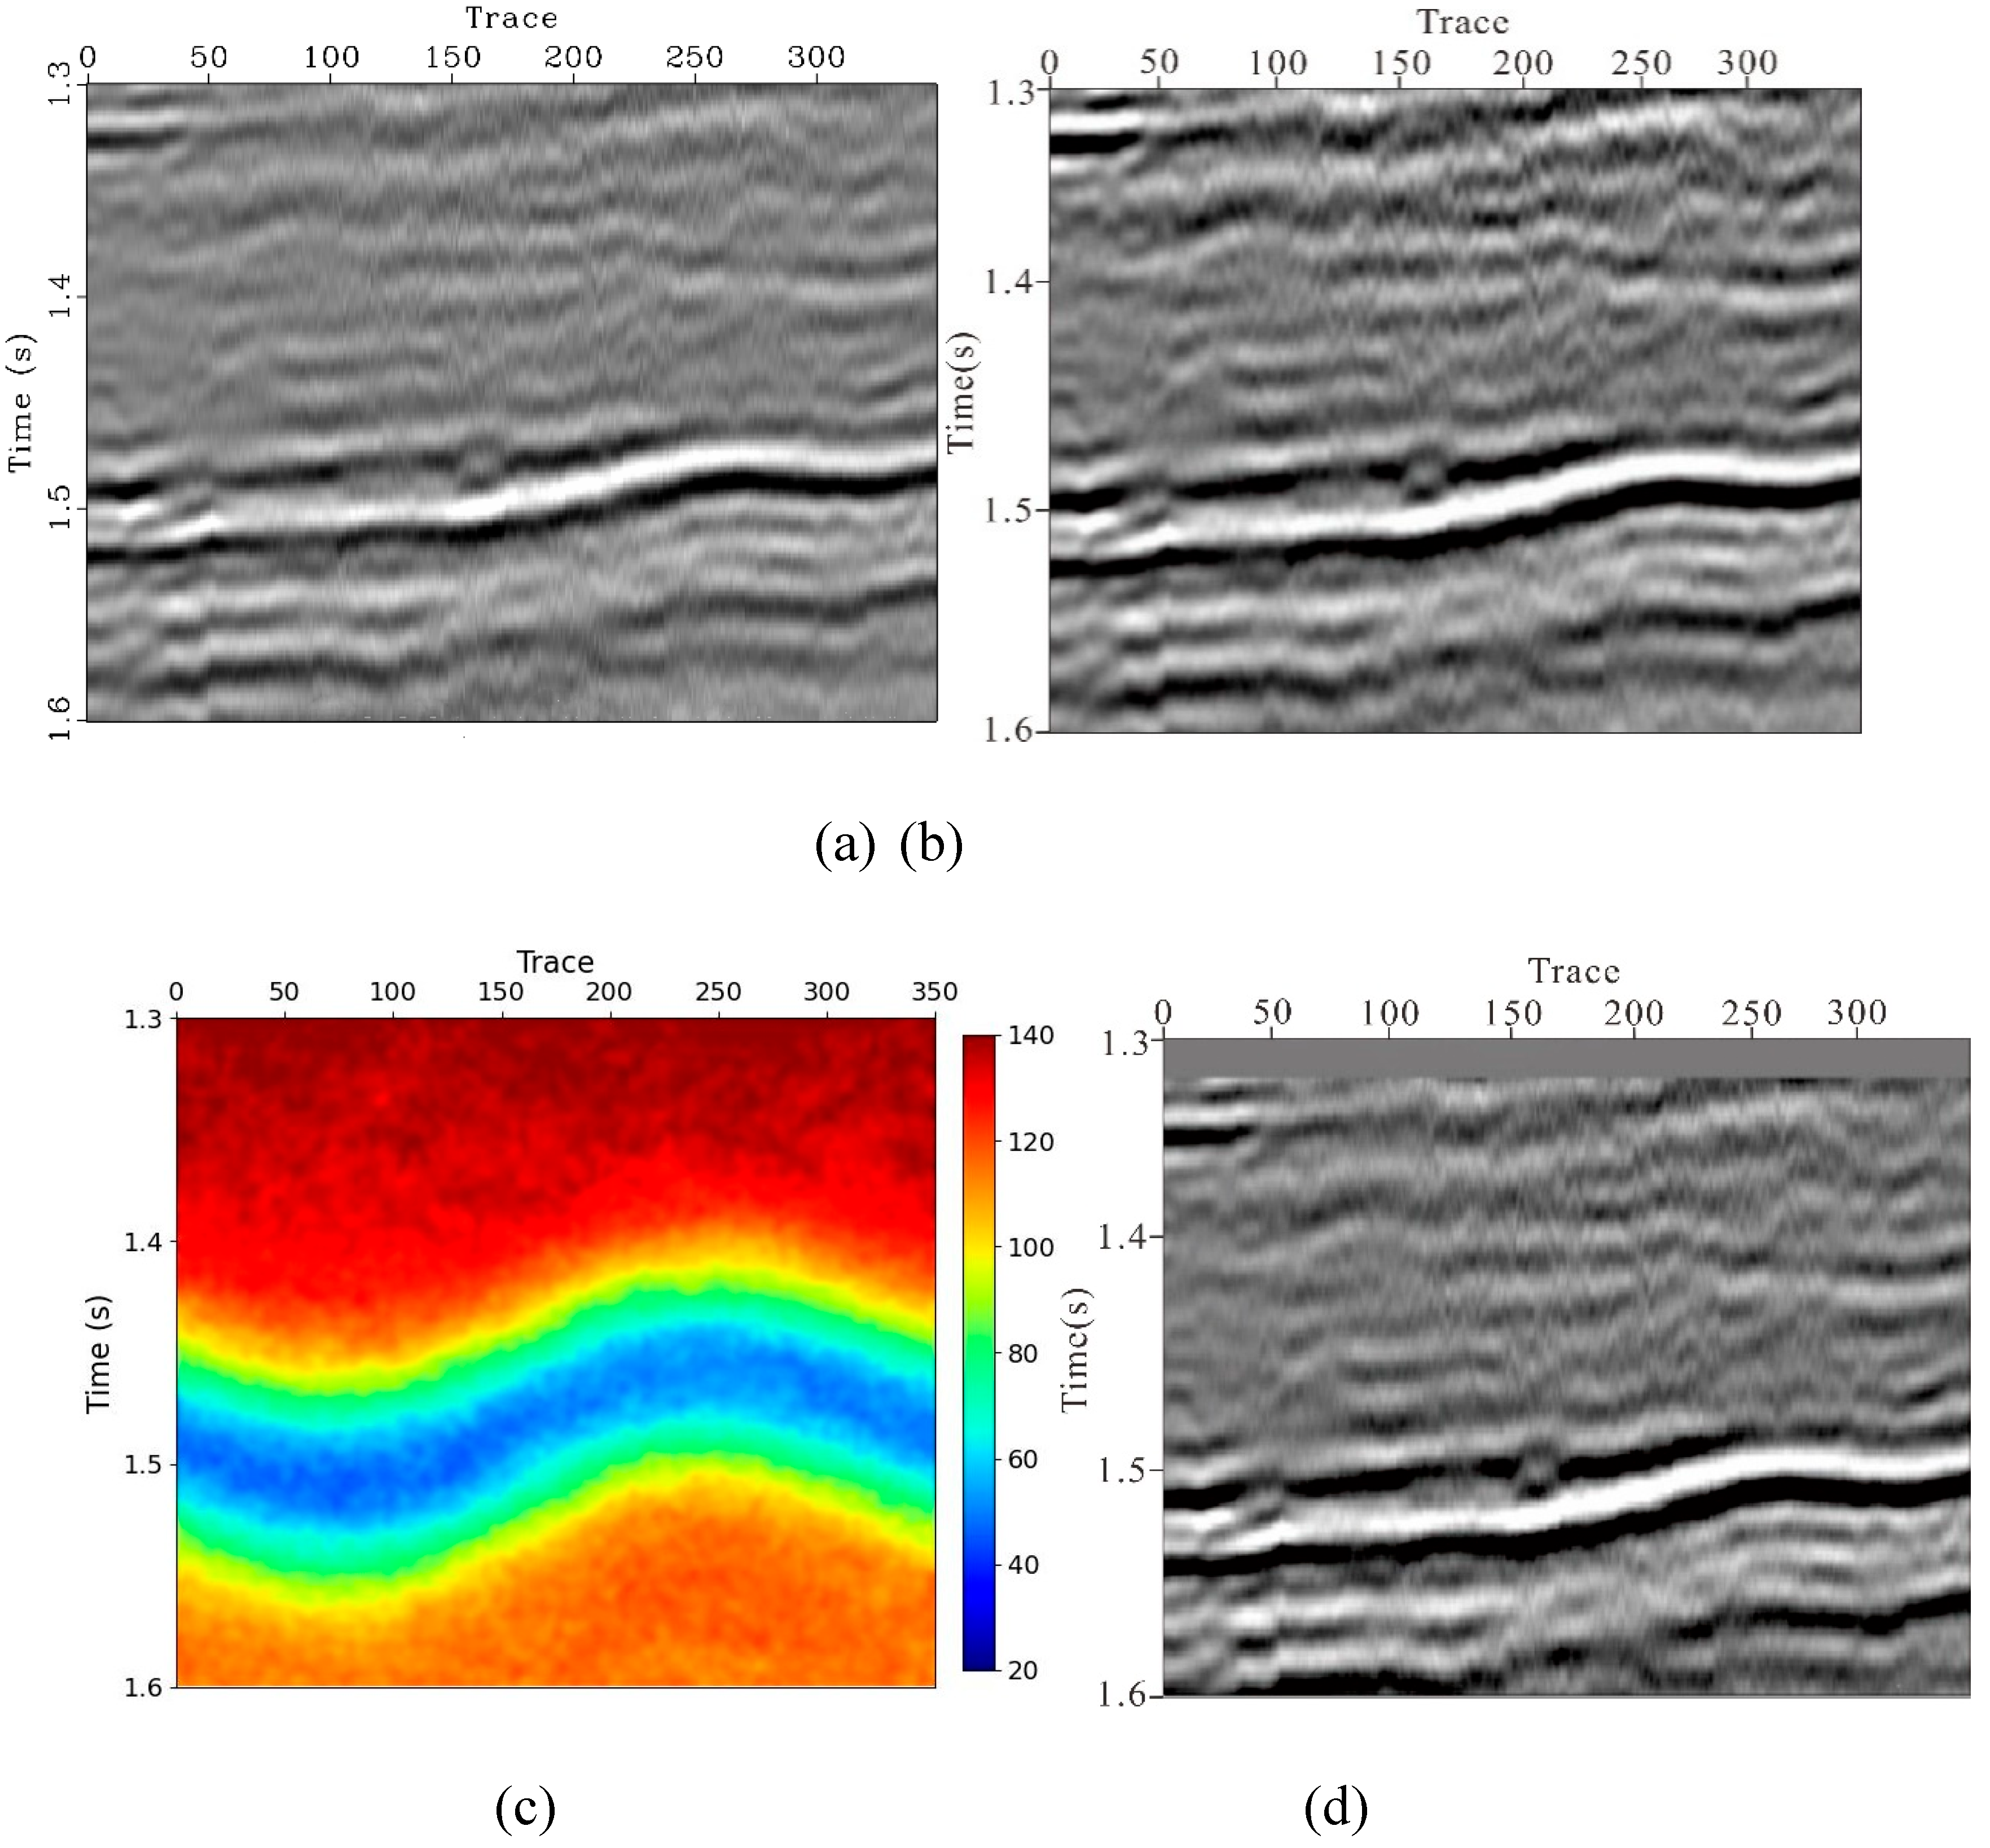
Figure 8.
Well-seismic calibration at a key well location.
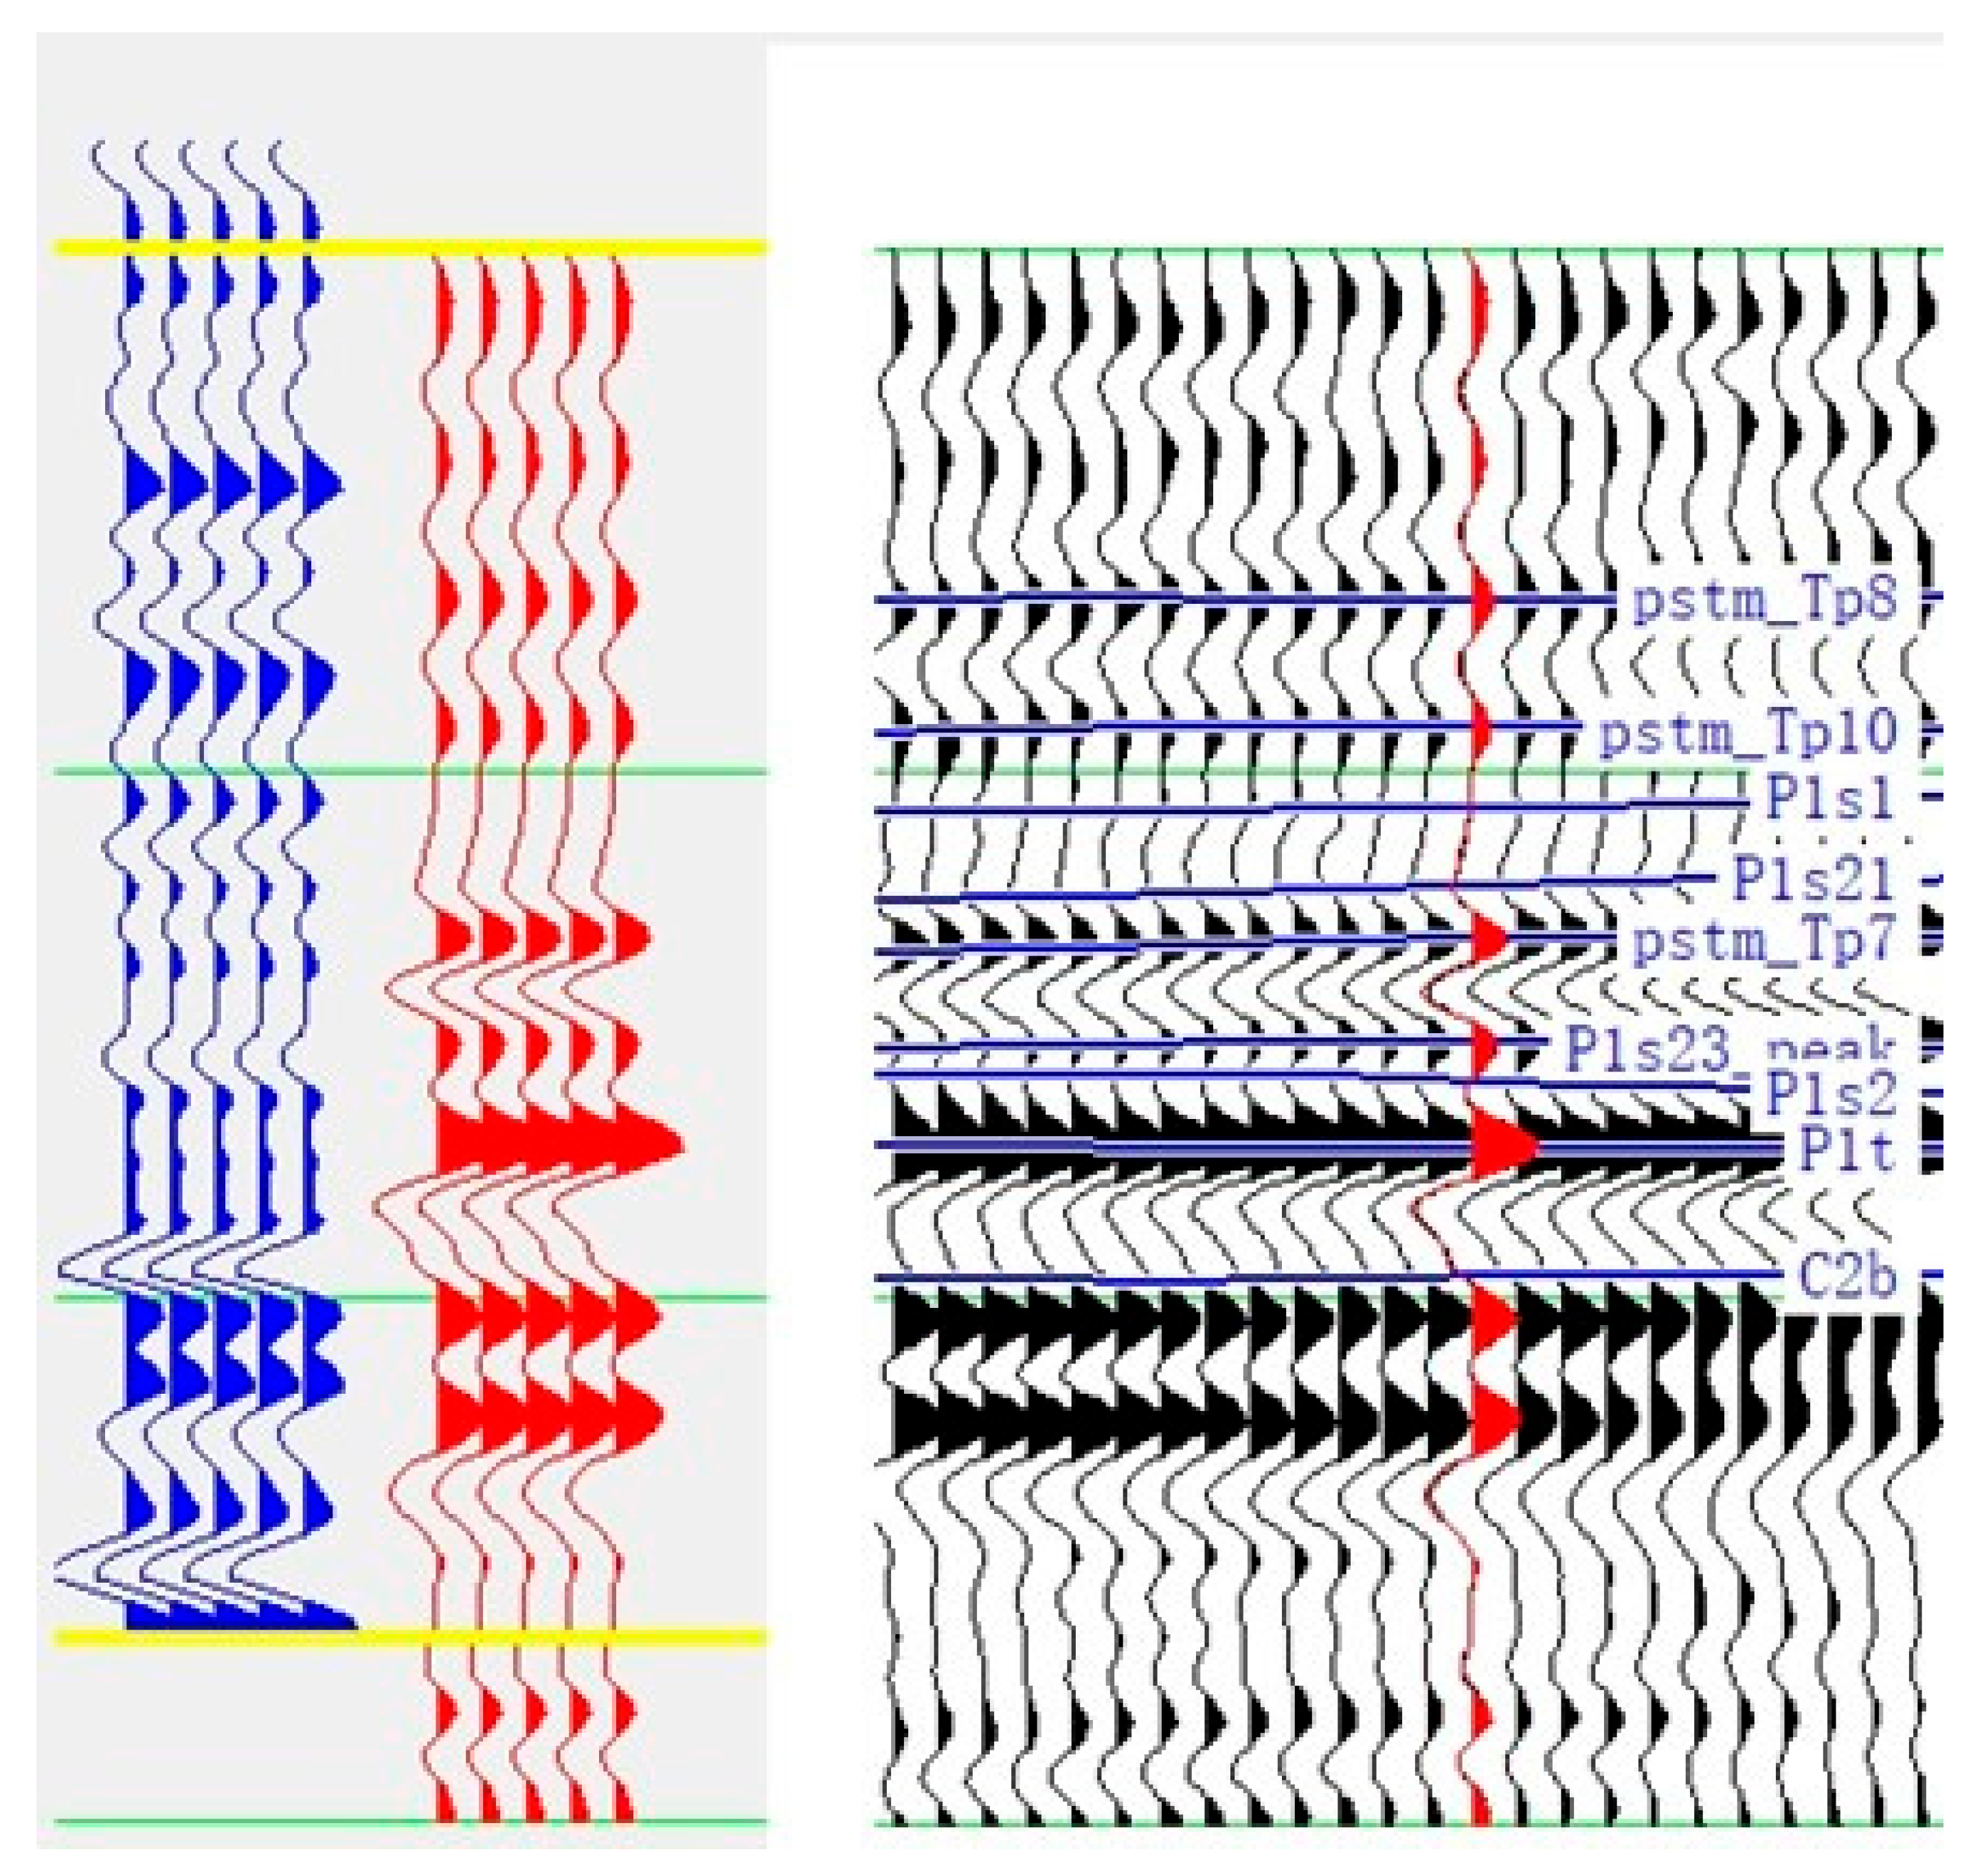
Figure 9.
Characteristics of the statistical wavelet extracted for inversion.
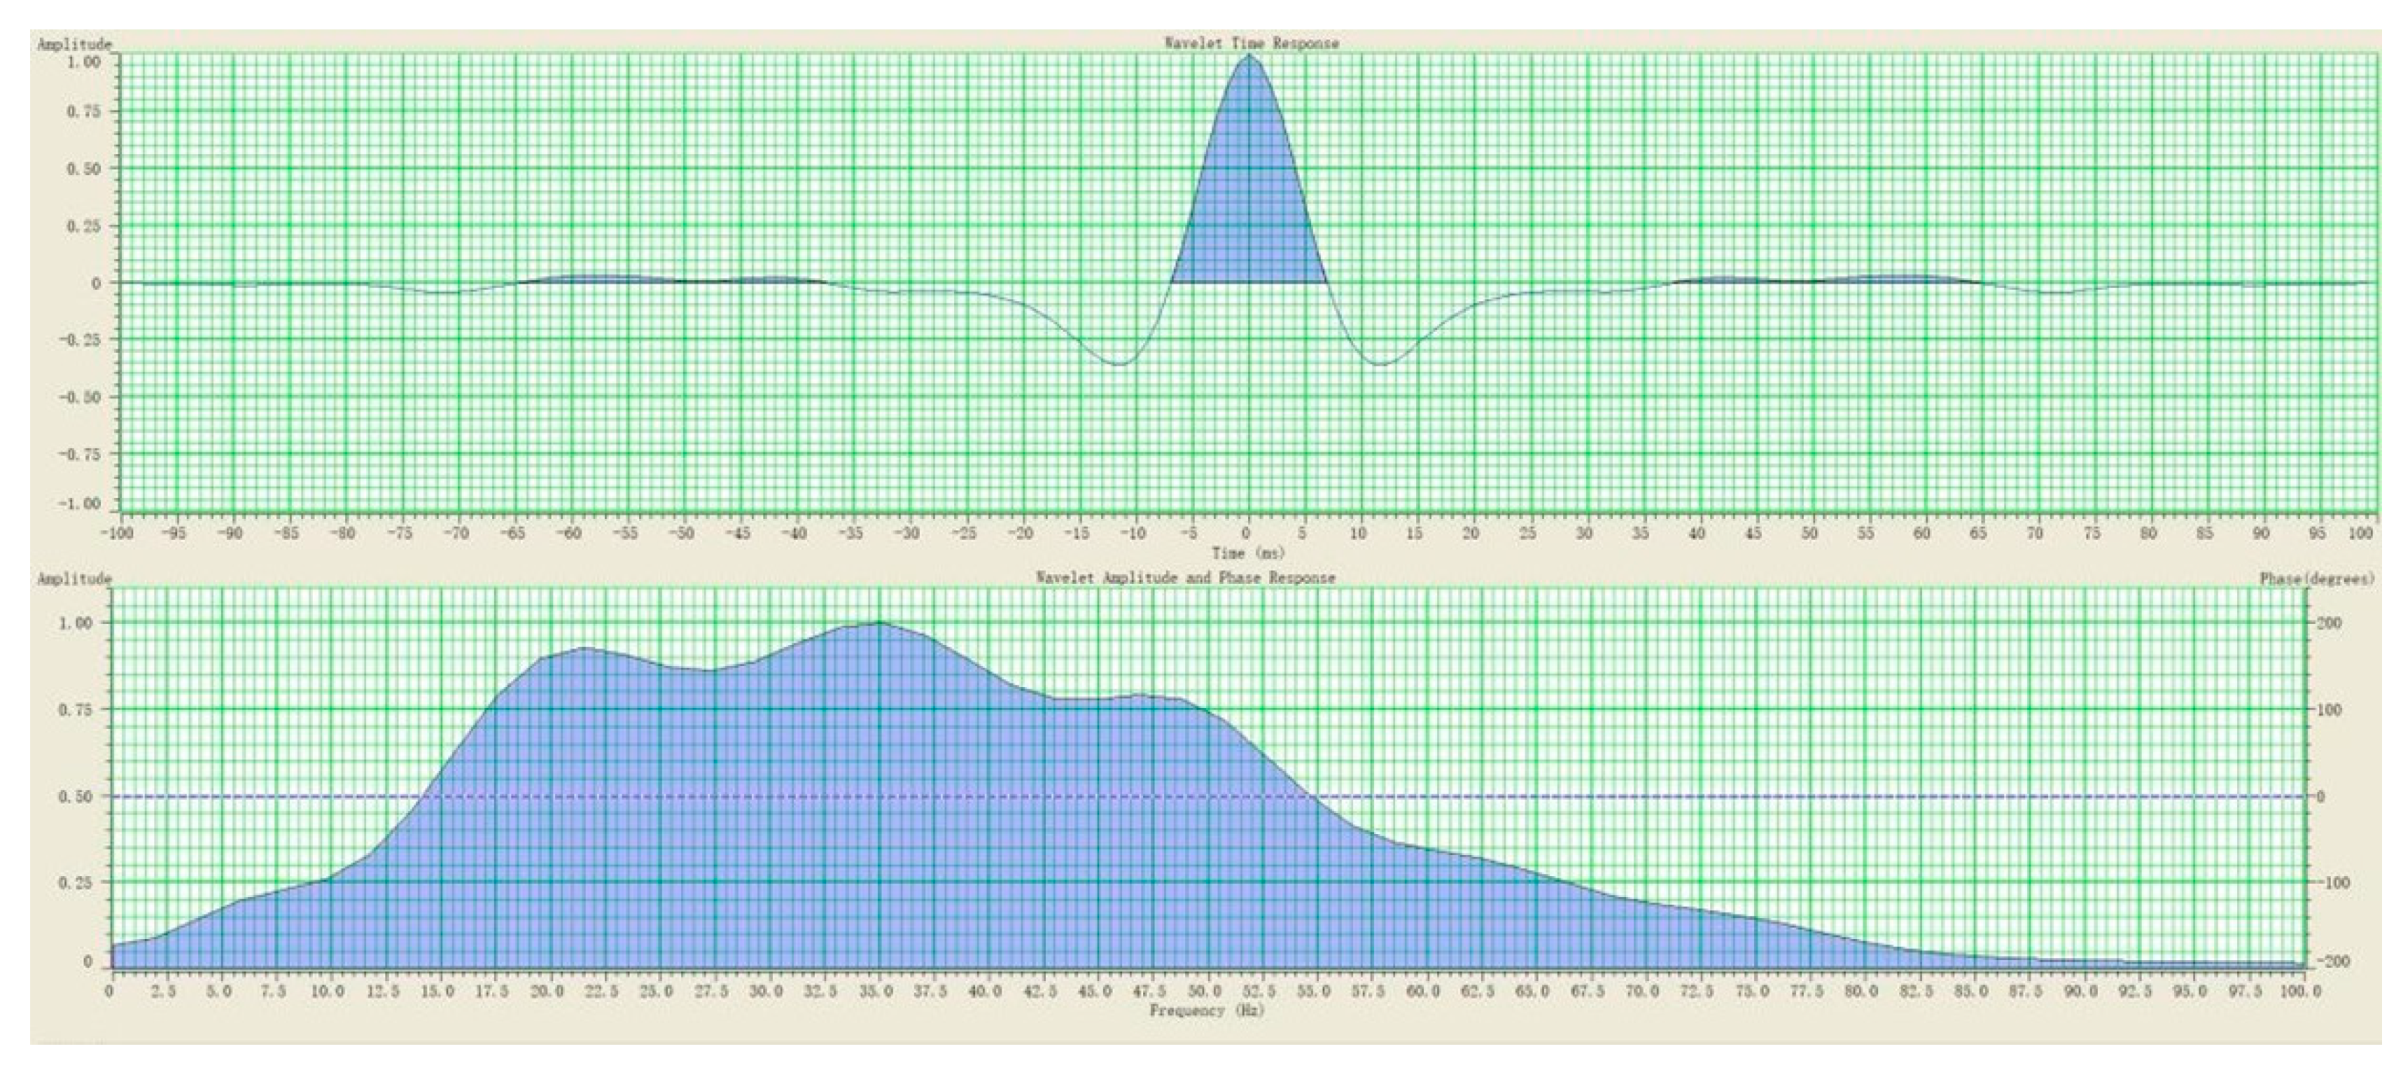
Figure 10.
Amplitude spectrum of the seismic data in the target window.
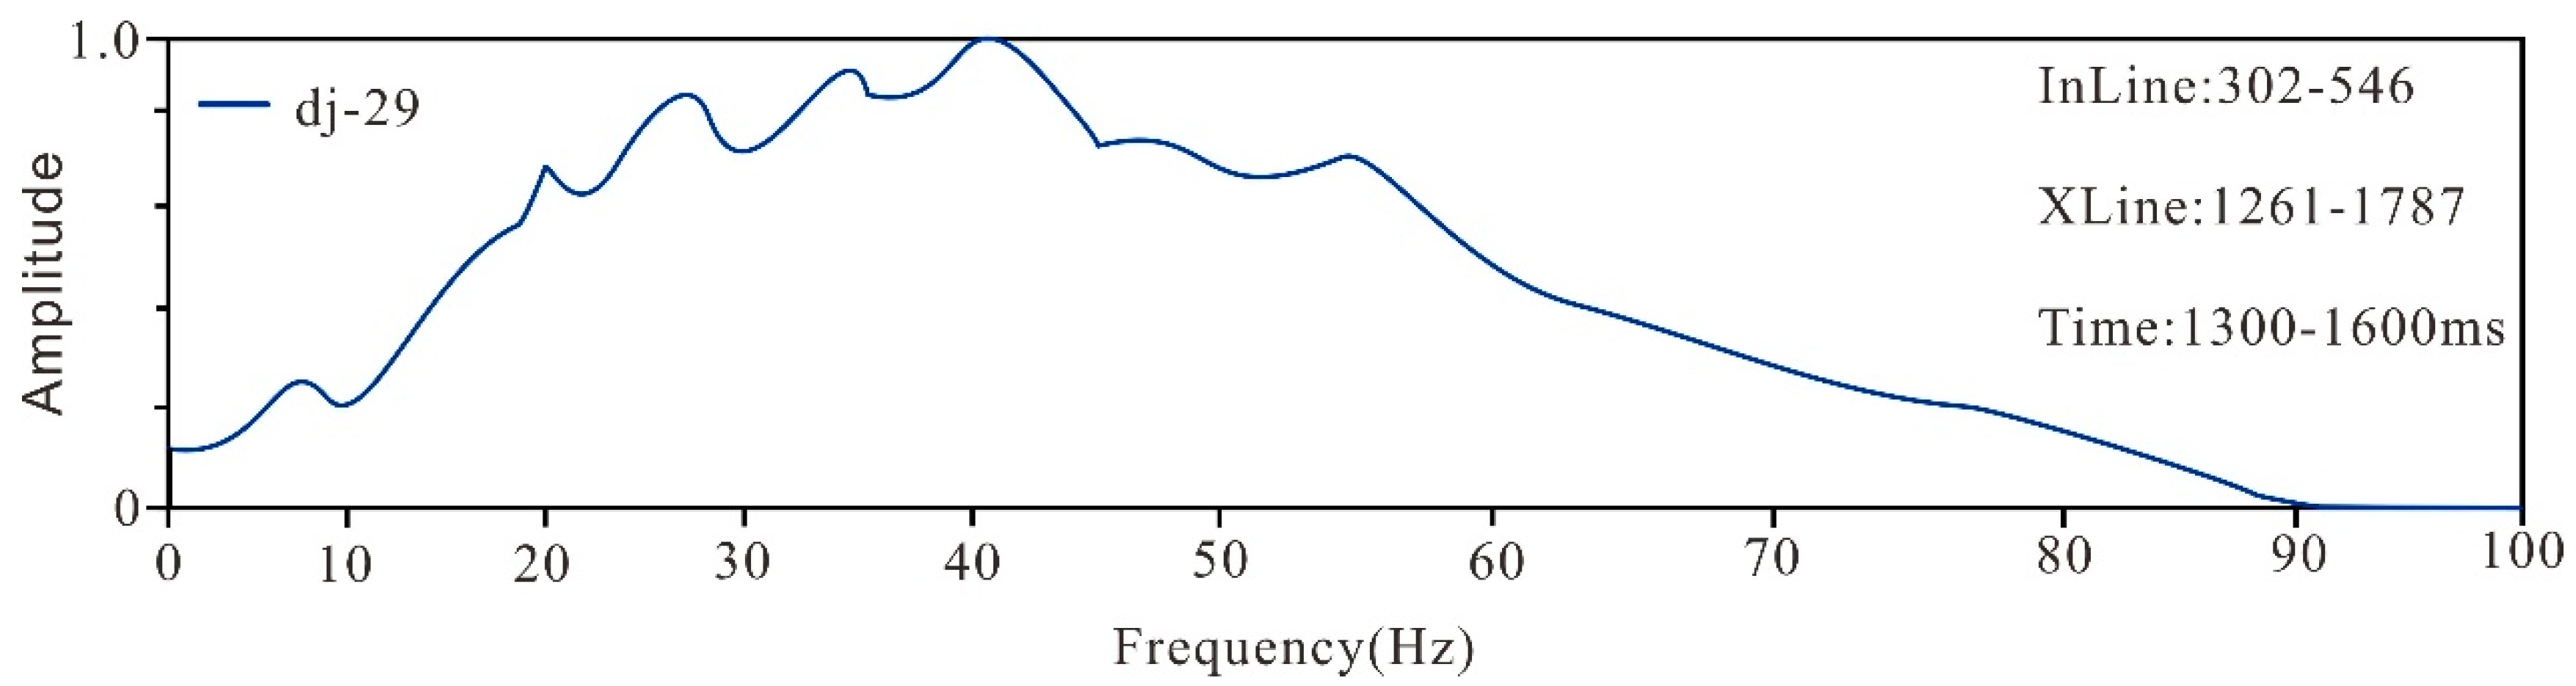
Figure 11.
Low-frequency P-impedance model used as an initial constraint for inversion.
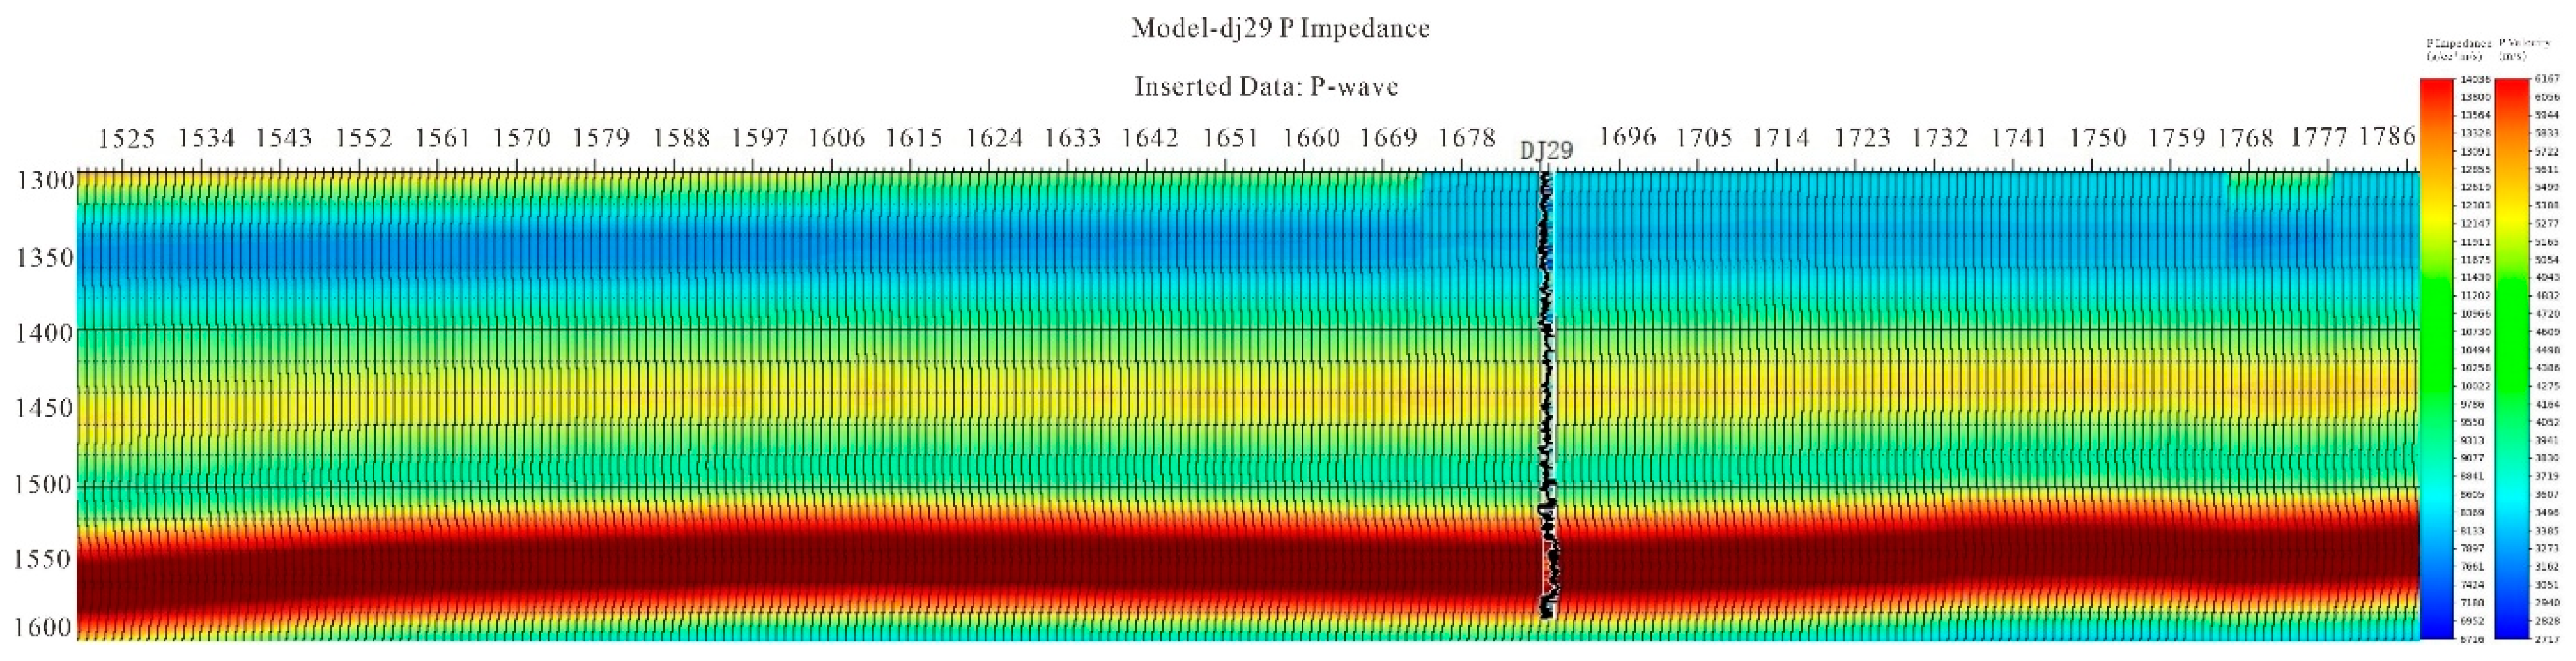
Figure 12.
Inversion quality control at the well location: the inverted P-impedance (red) with the initial low-frequency model (black) and the ground-truth P-impedance log (blue). Key formation tops are marked.
Figure 12.
Inversion quality control at the well location: the inverted P-impedance (red) with the initial low-frequency model (black) and the ground-truth P-impedance log (blue). Key formation tops are marked.
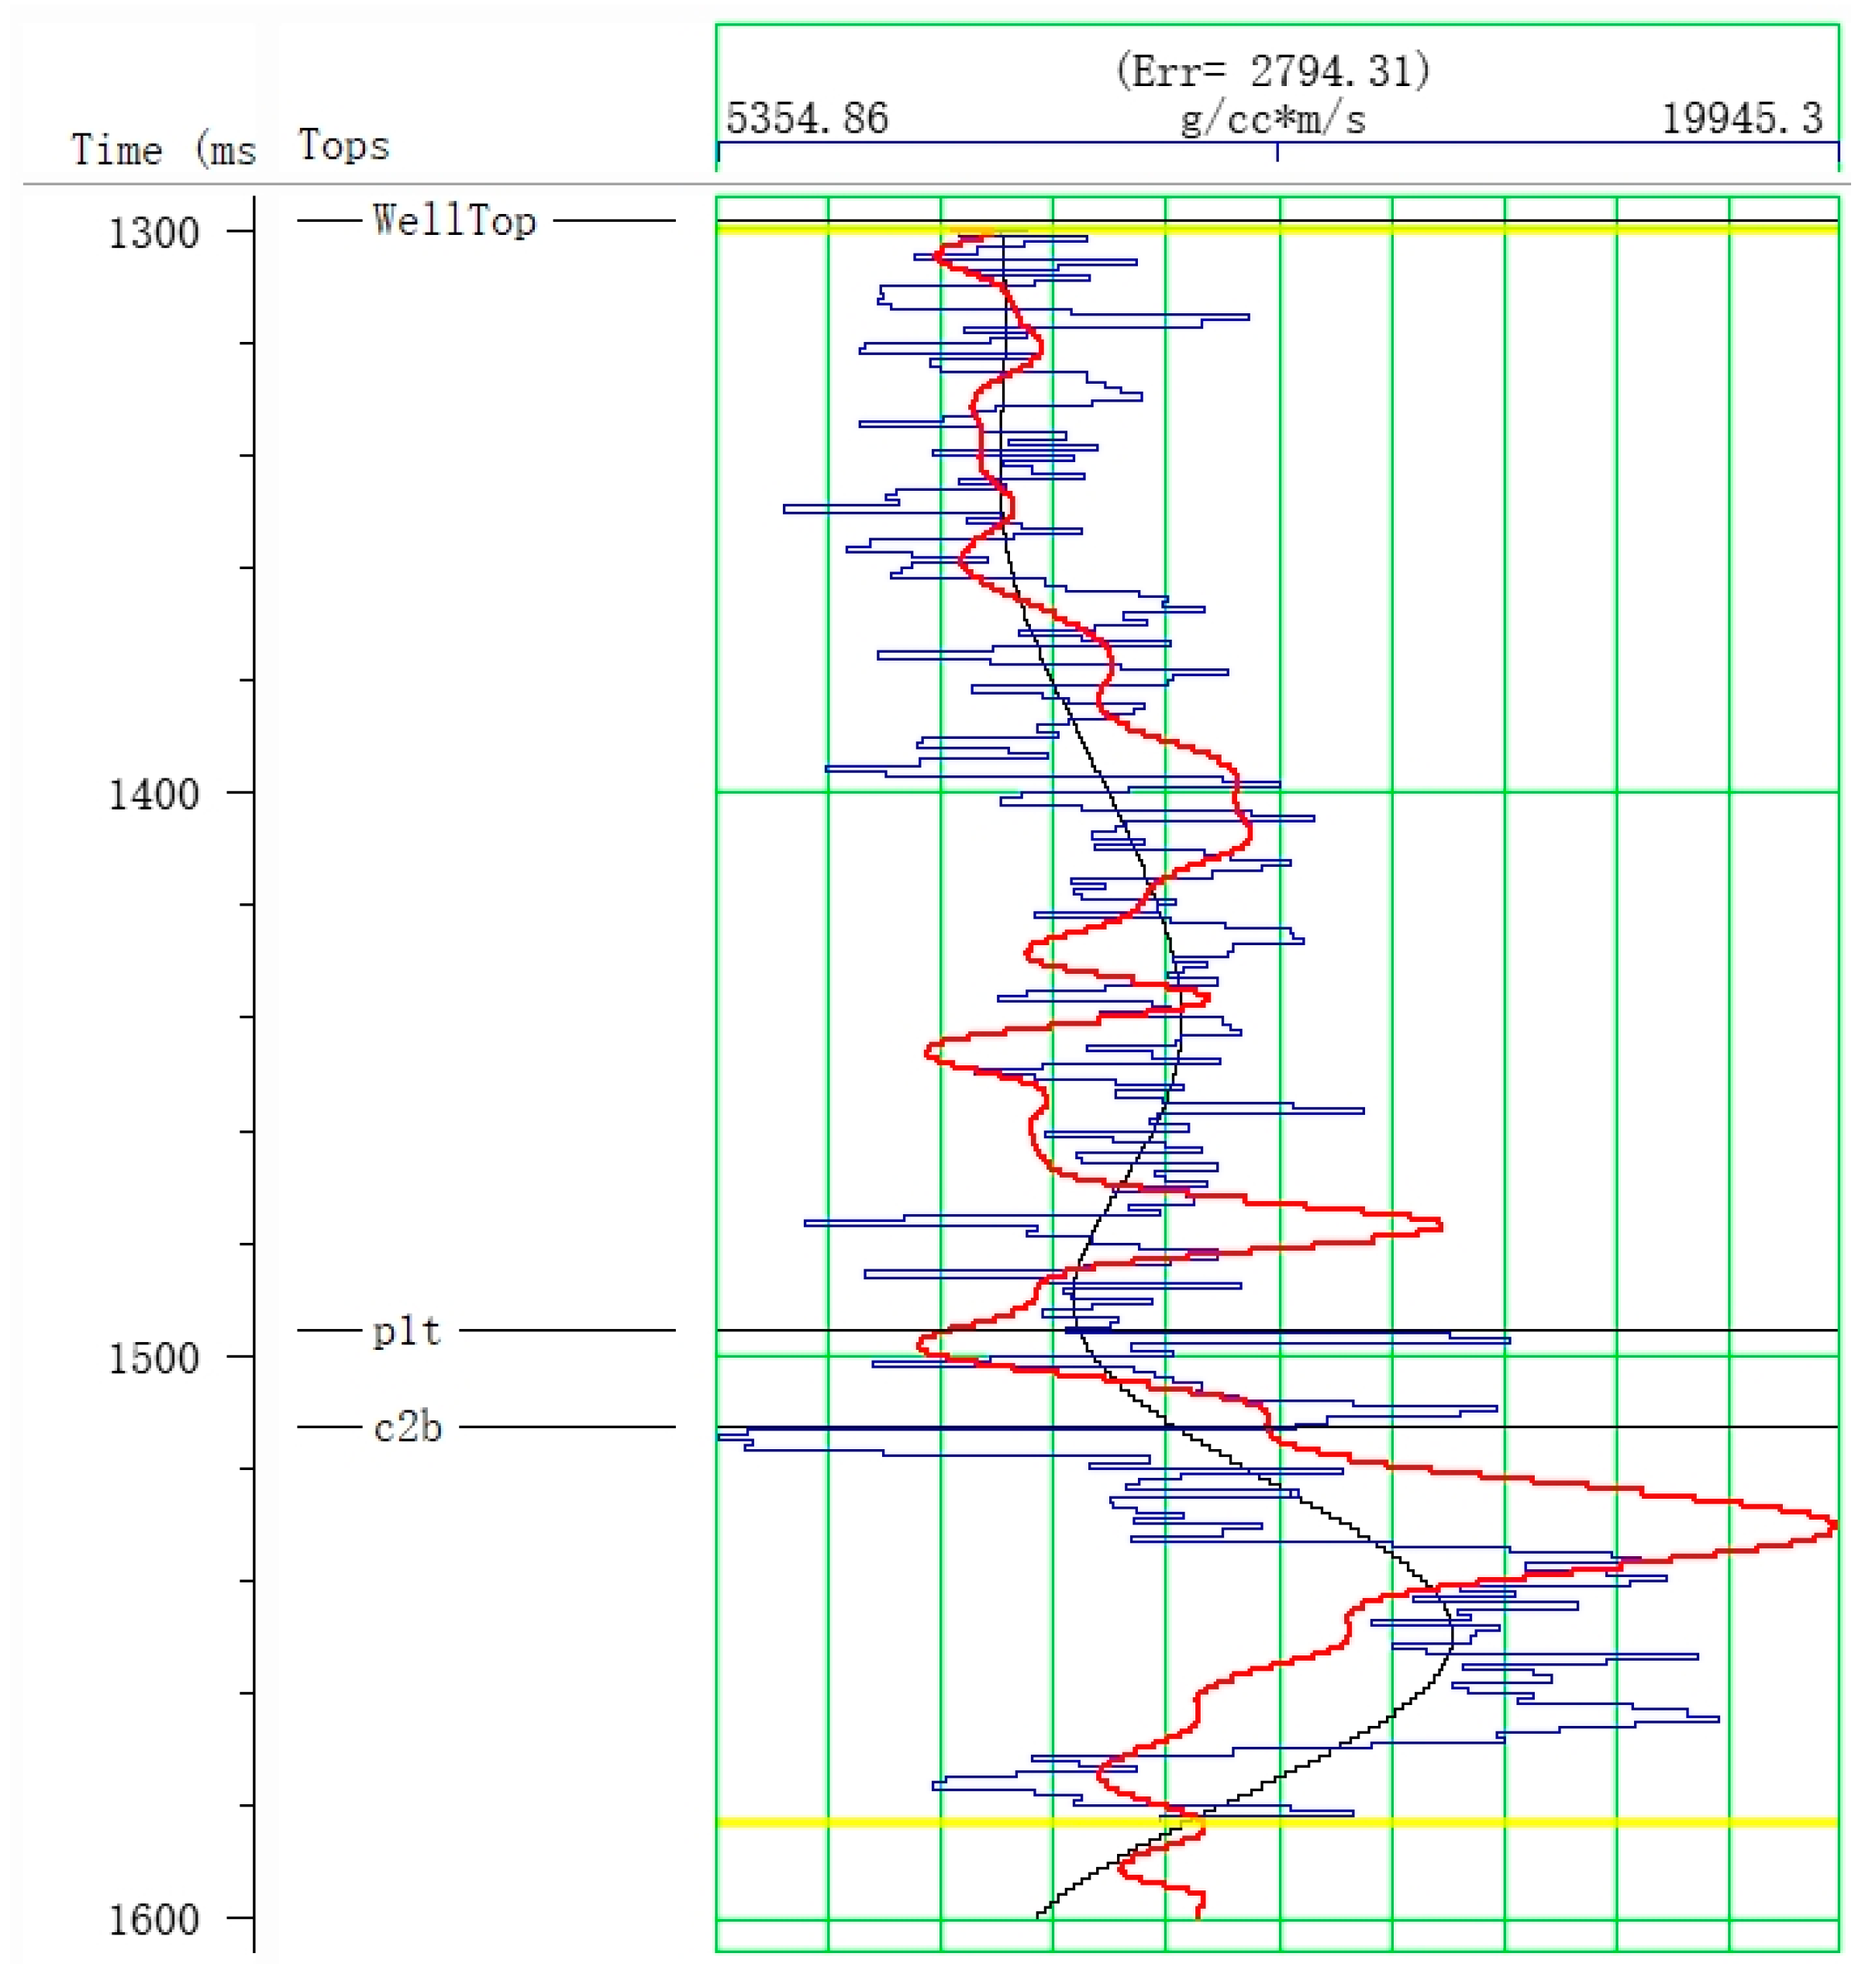
Figure 13.
P-impedance section derived from the attenuation-compensated seismic data.
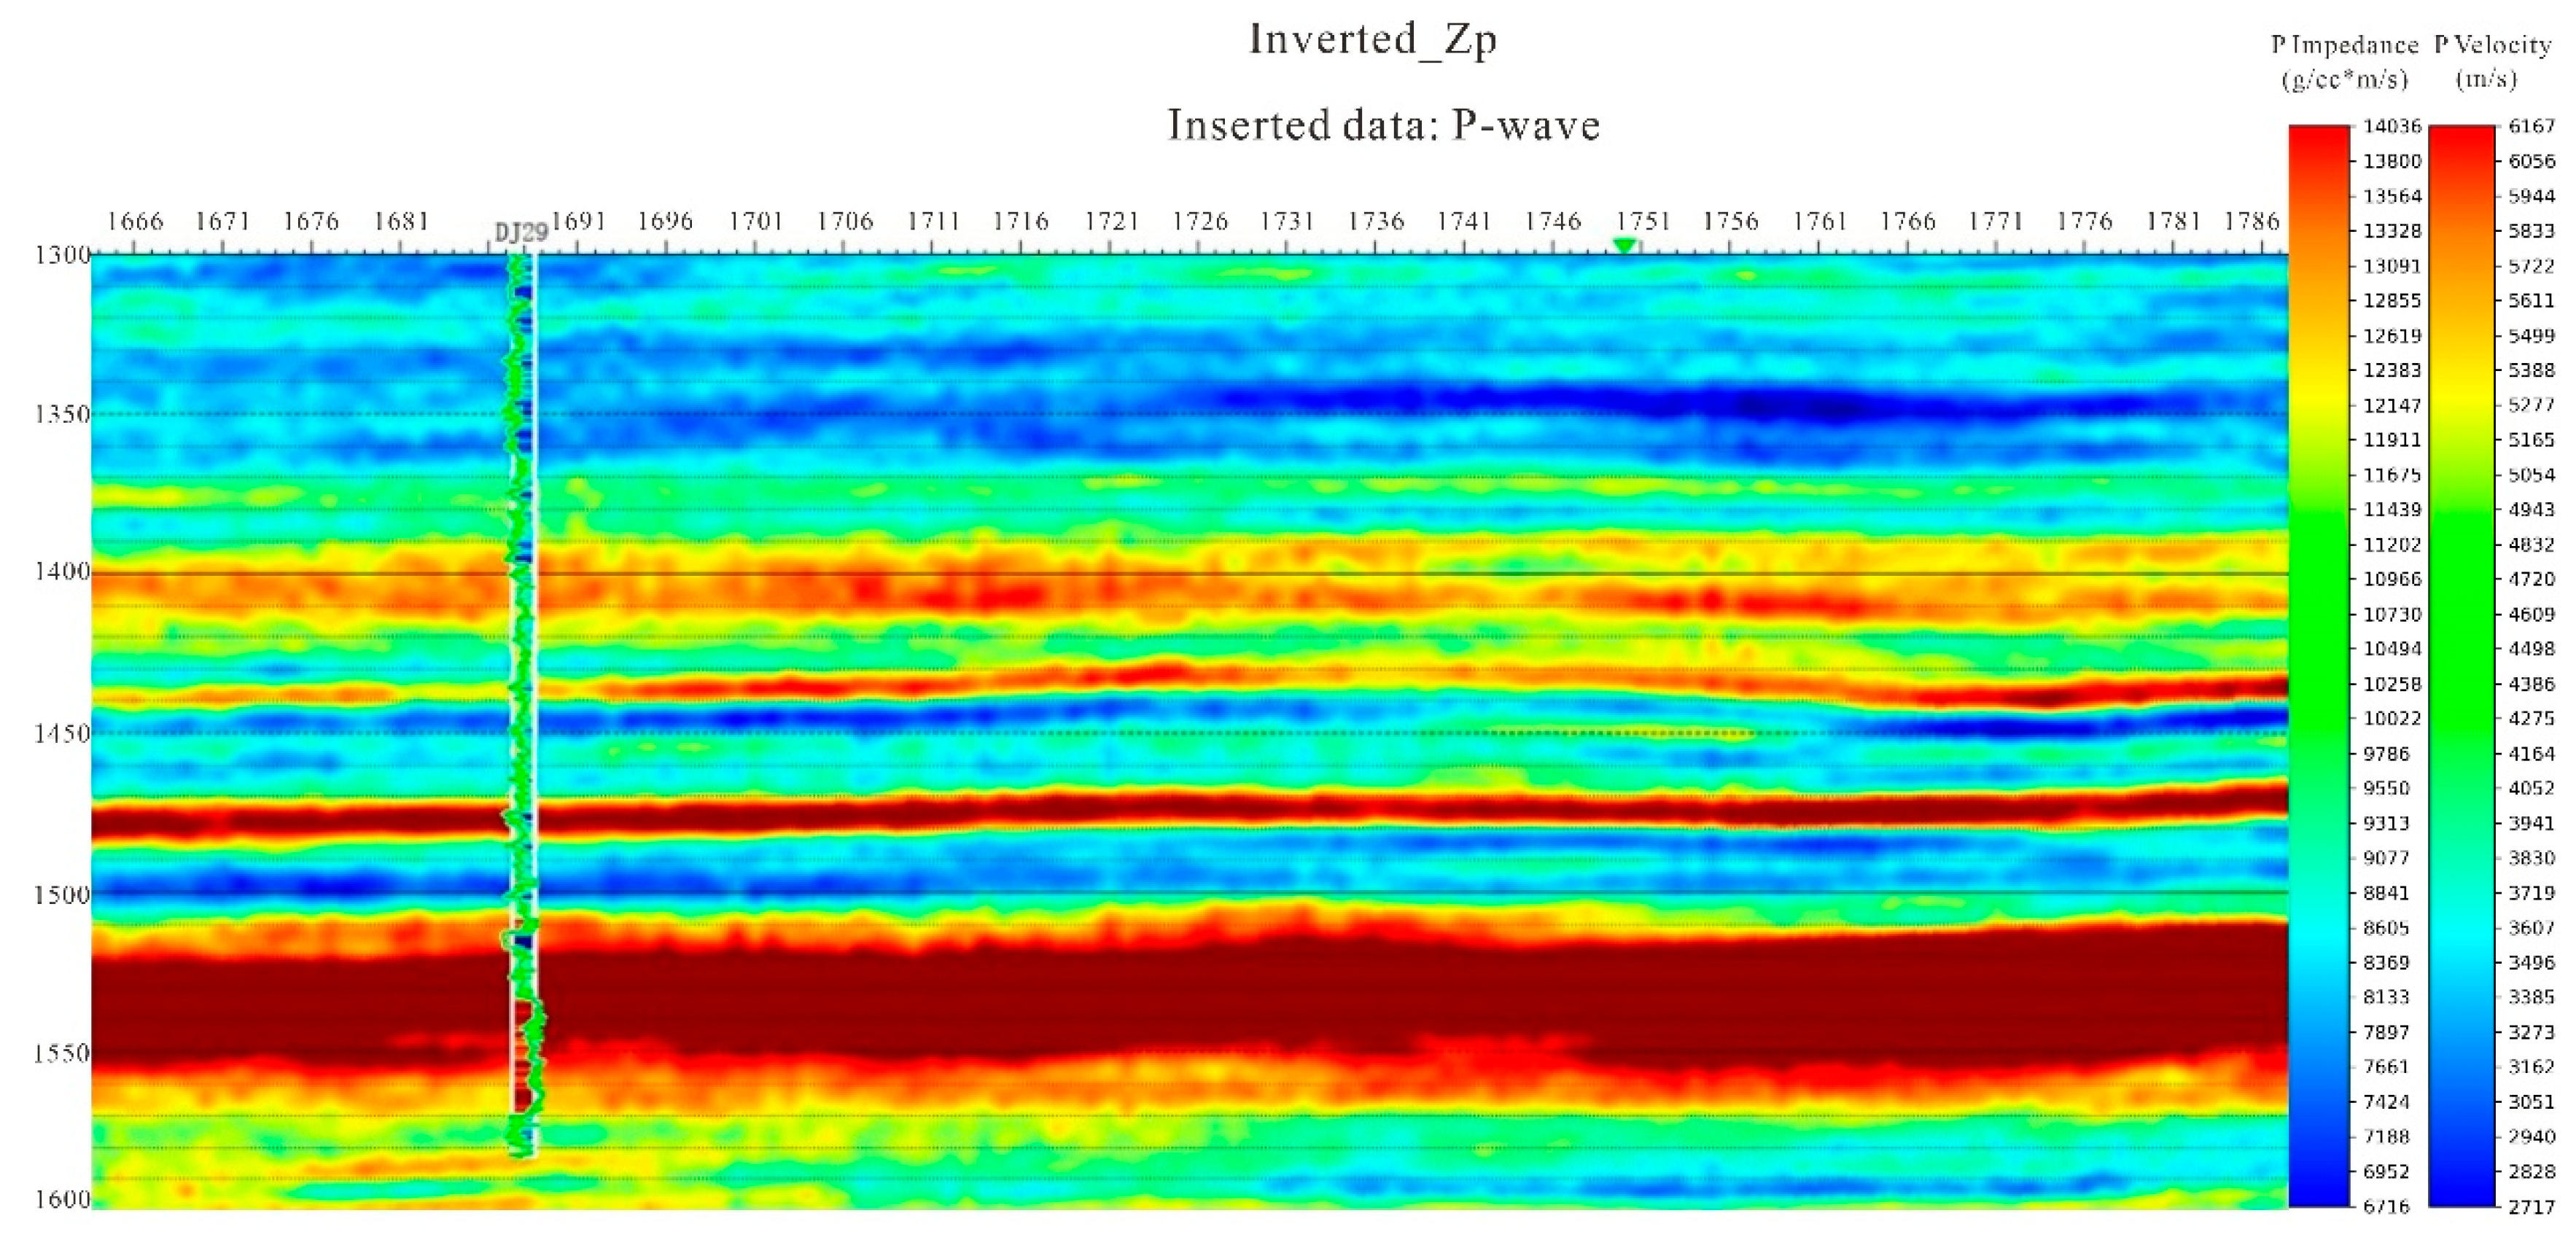
Figure 14.
P-impedance section derived from well-constrained seismic inversion.
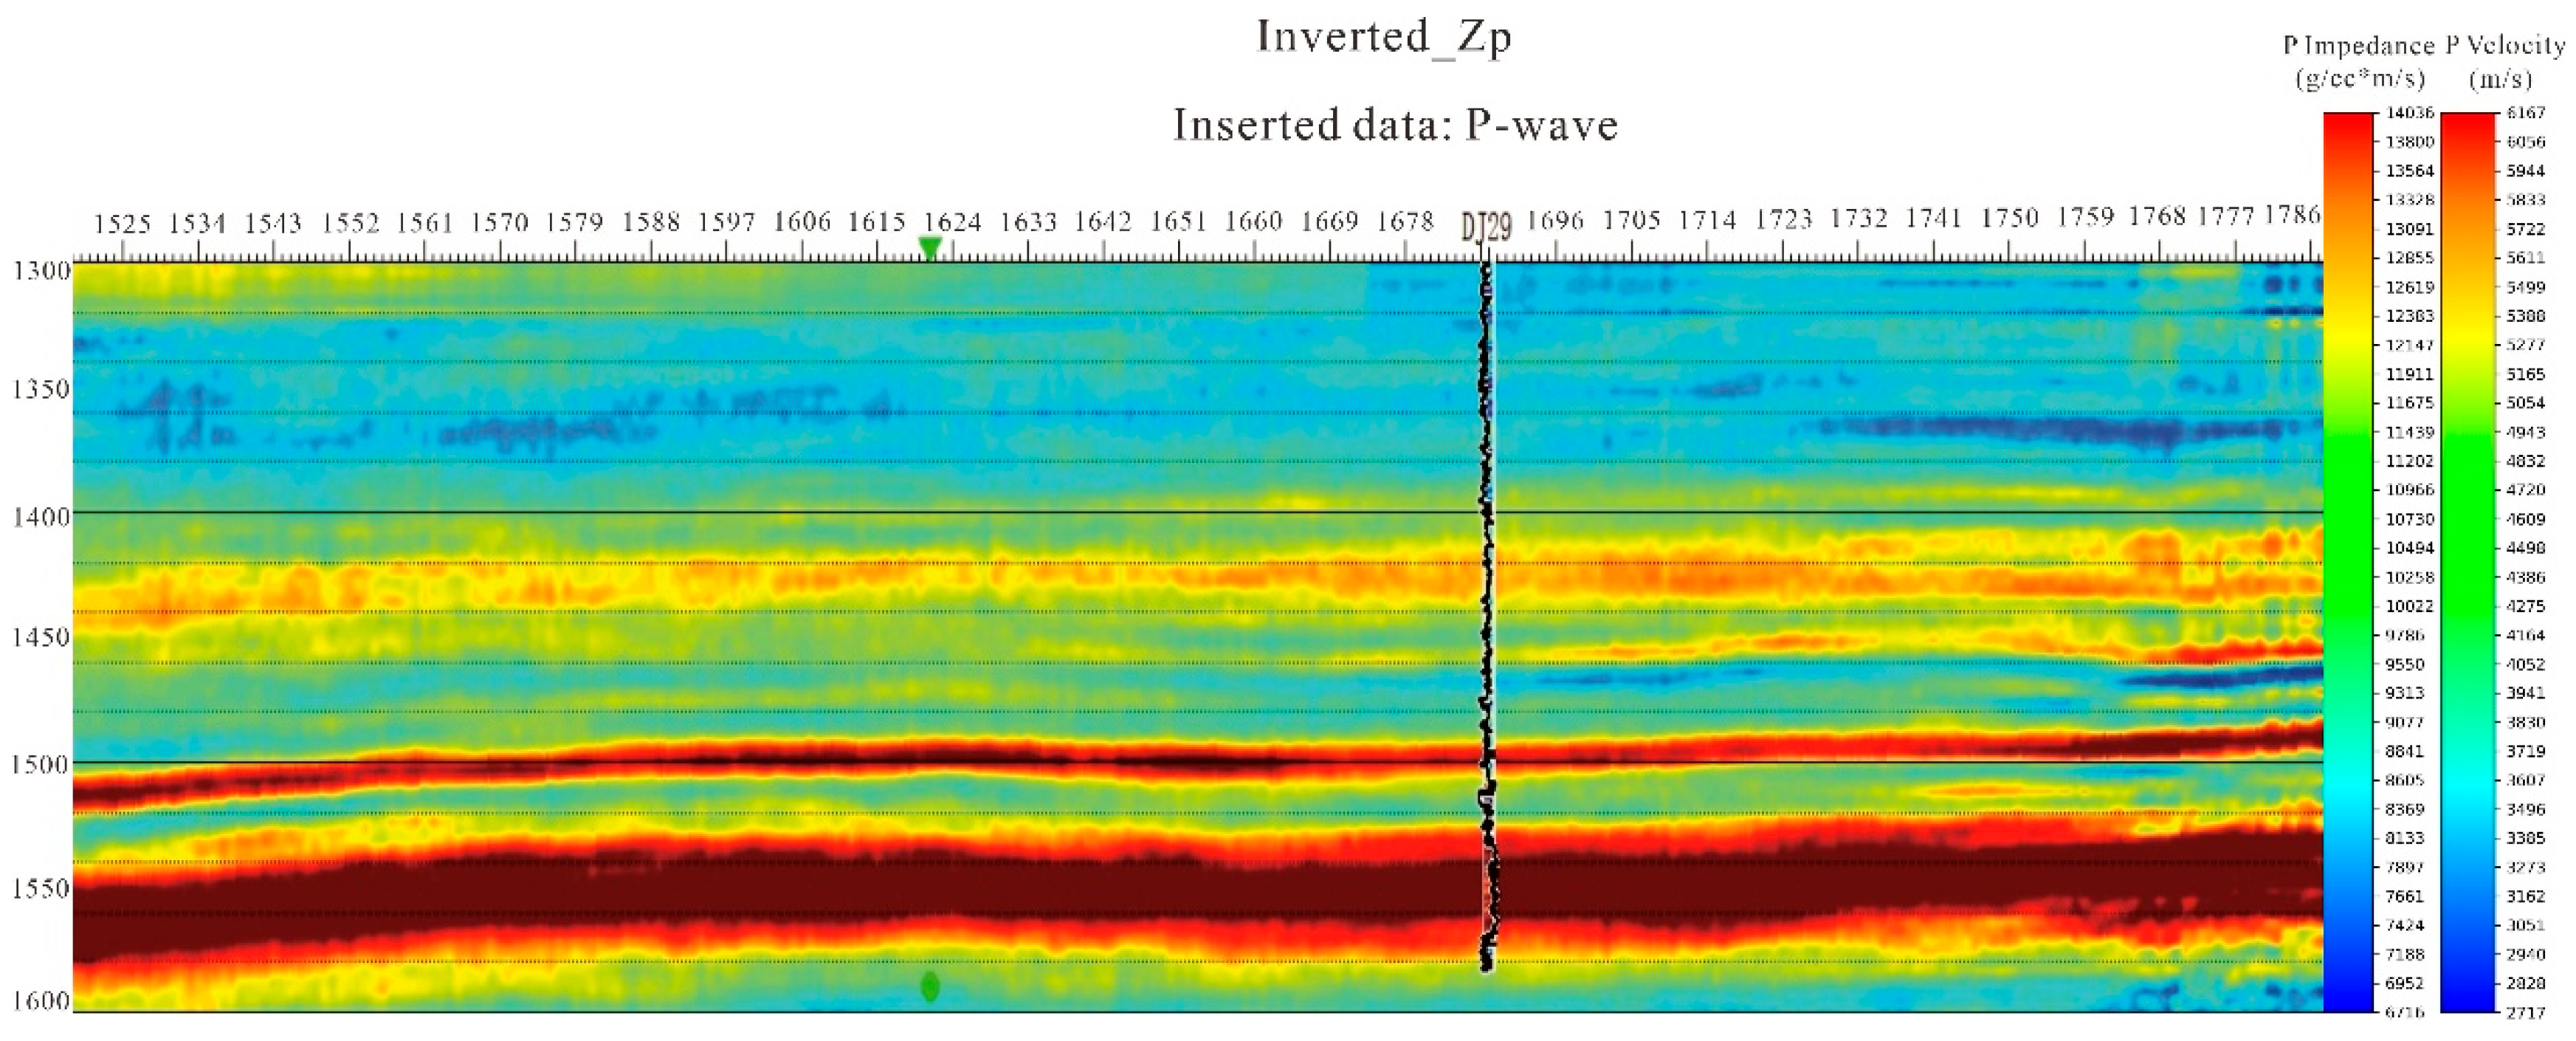
Figure 15.
Predicted TOC distribution in the target interval: (a) cross-well TOC profile, (b) TOC map of the top horizon, and (c) TOC map of the bottom horizon.
Figure 15.
Predicted TOC distribution in the target interval: (a) cross-well TOC profile, (b) TOC map of the top horizon, and (c) TOC map of the bottom horizon.
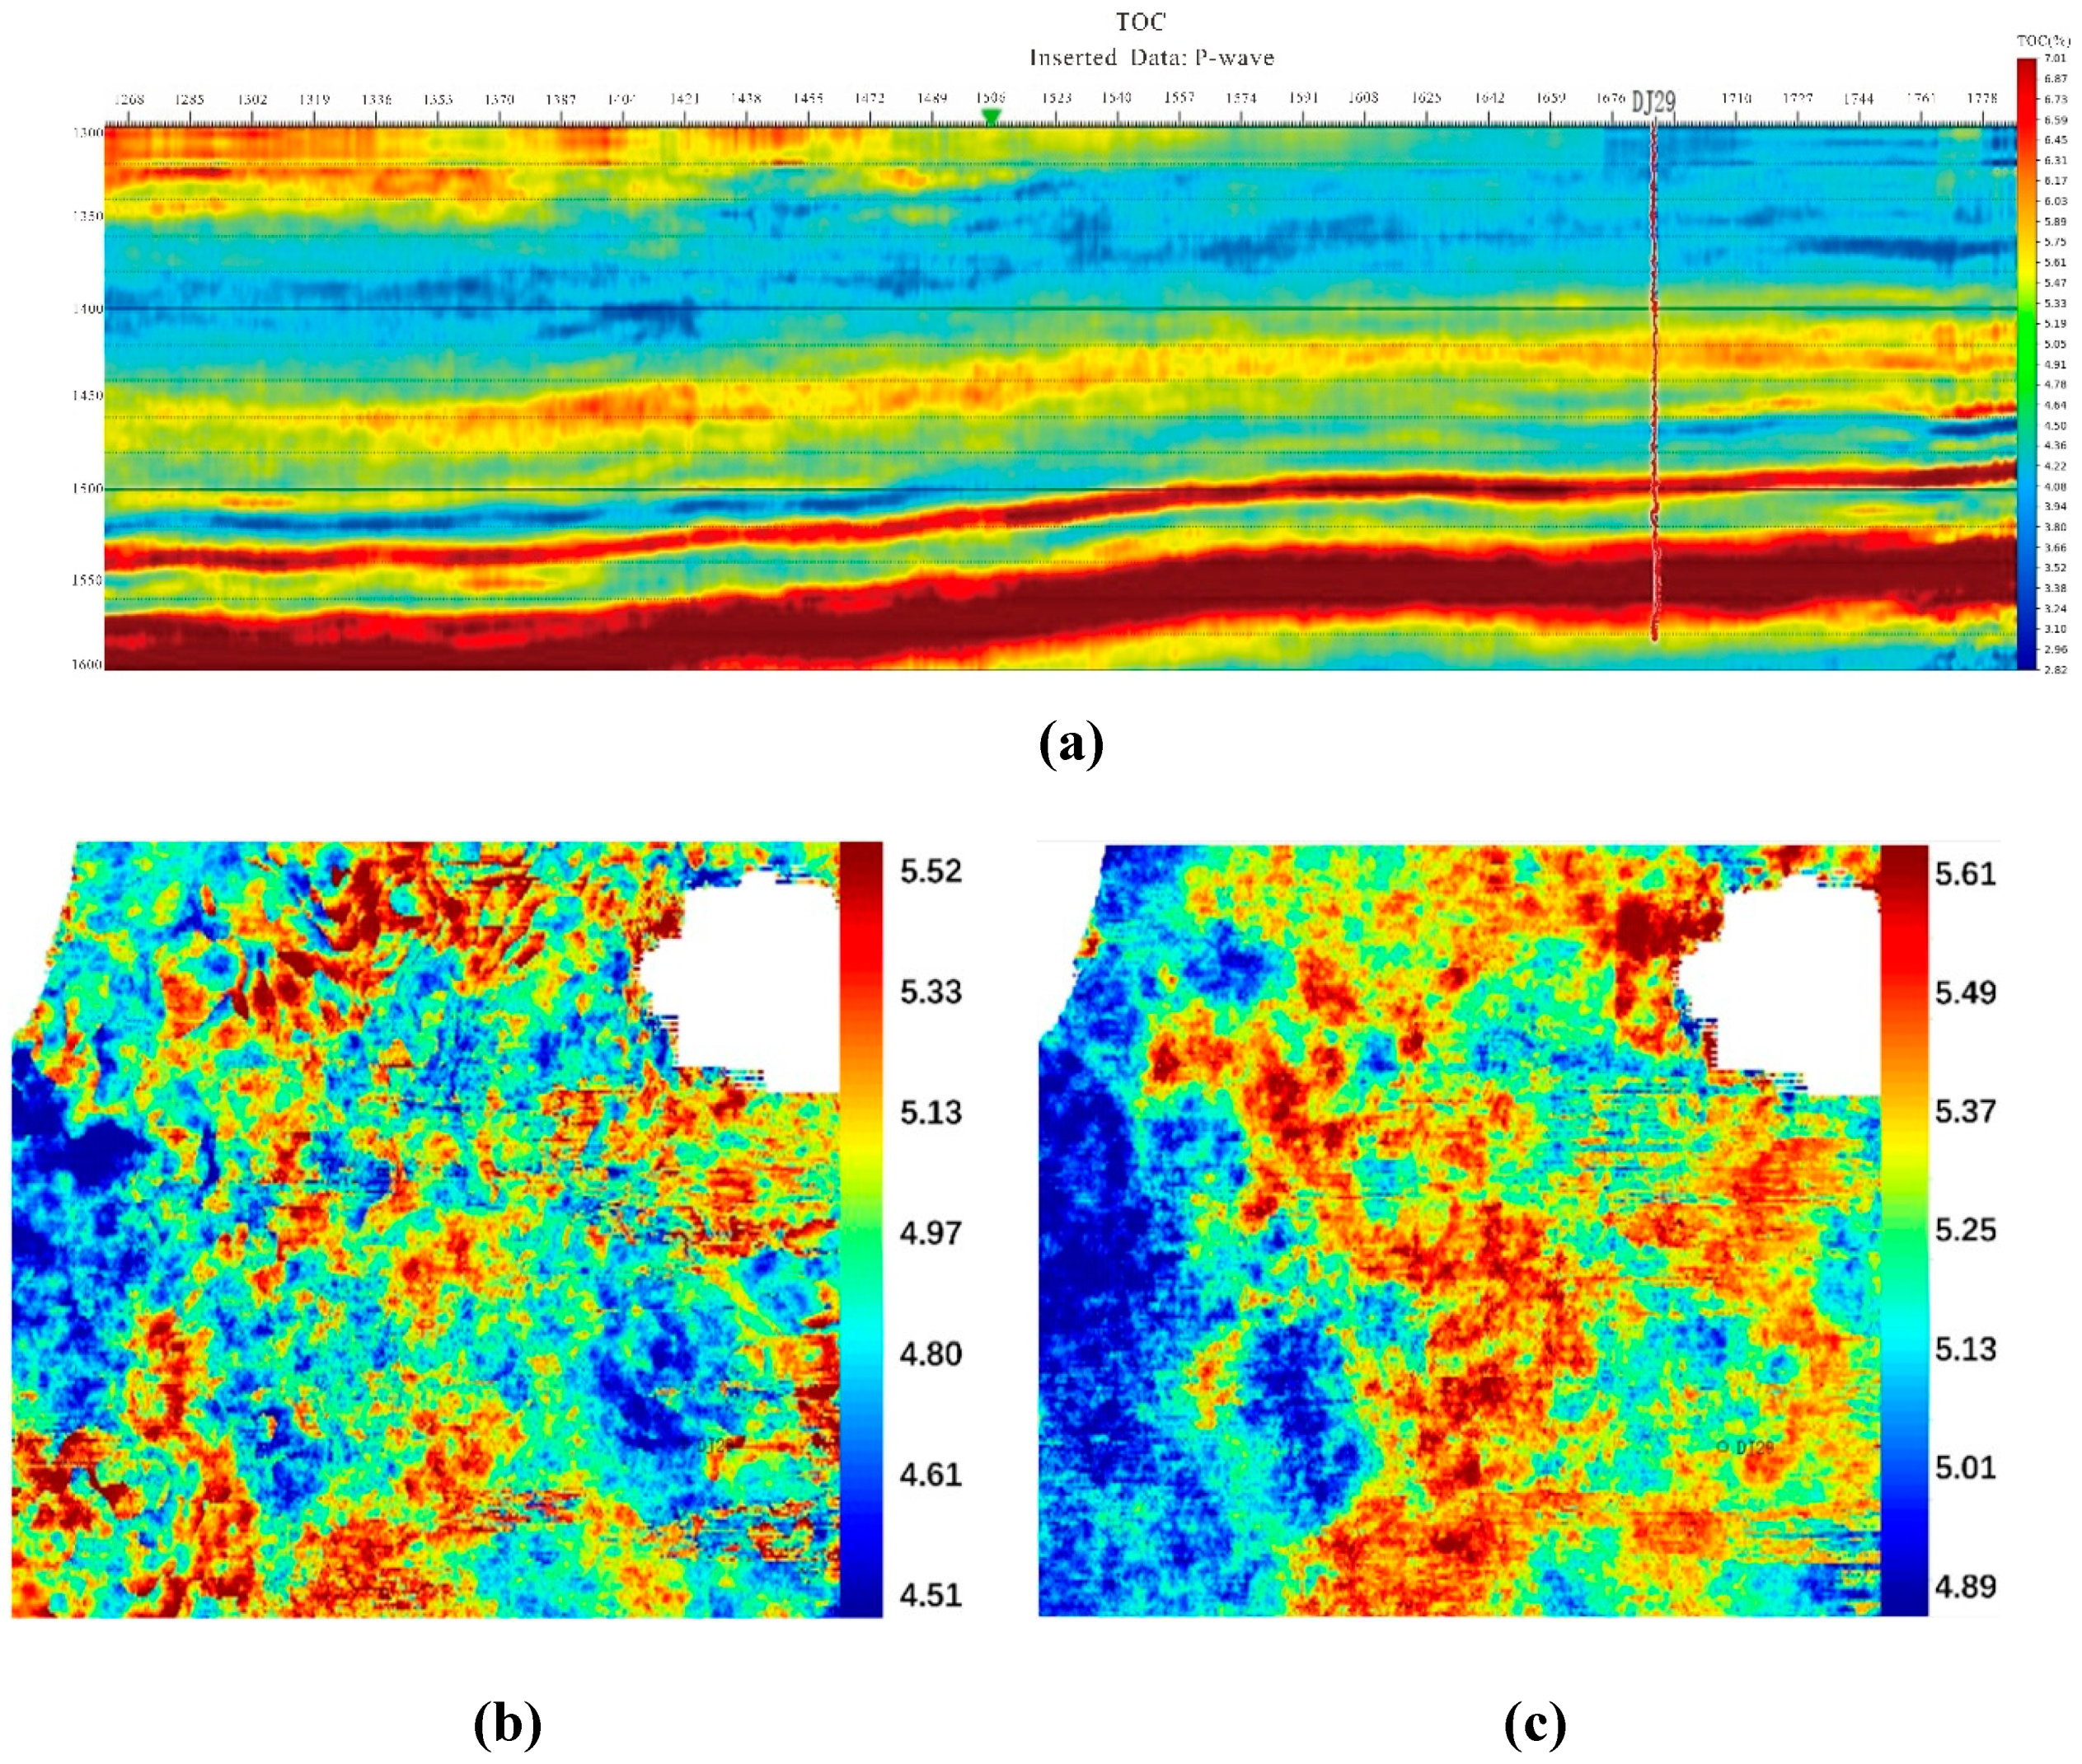
Figure 16.
Predicted porosity distribution in the target interval: (a) cross-well porosity profile, (b) porosity map of the top horizon, and (c) porosity map of the bottom horizon.
Figure 16.
Predicted porosity distribution in the target interval: (a) cross-well porosity profile, (b) porosity map of the top horizon, and (c) porosity map of the bottom horizon.
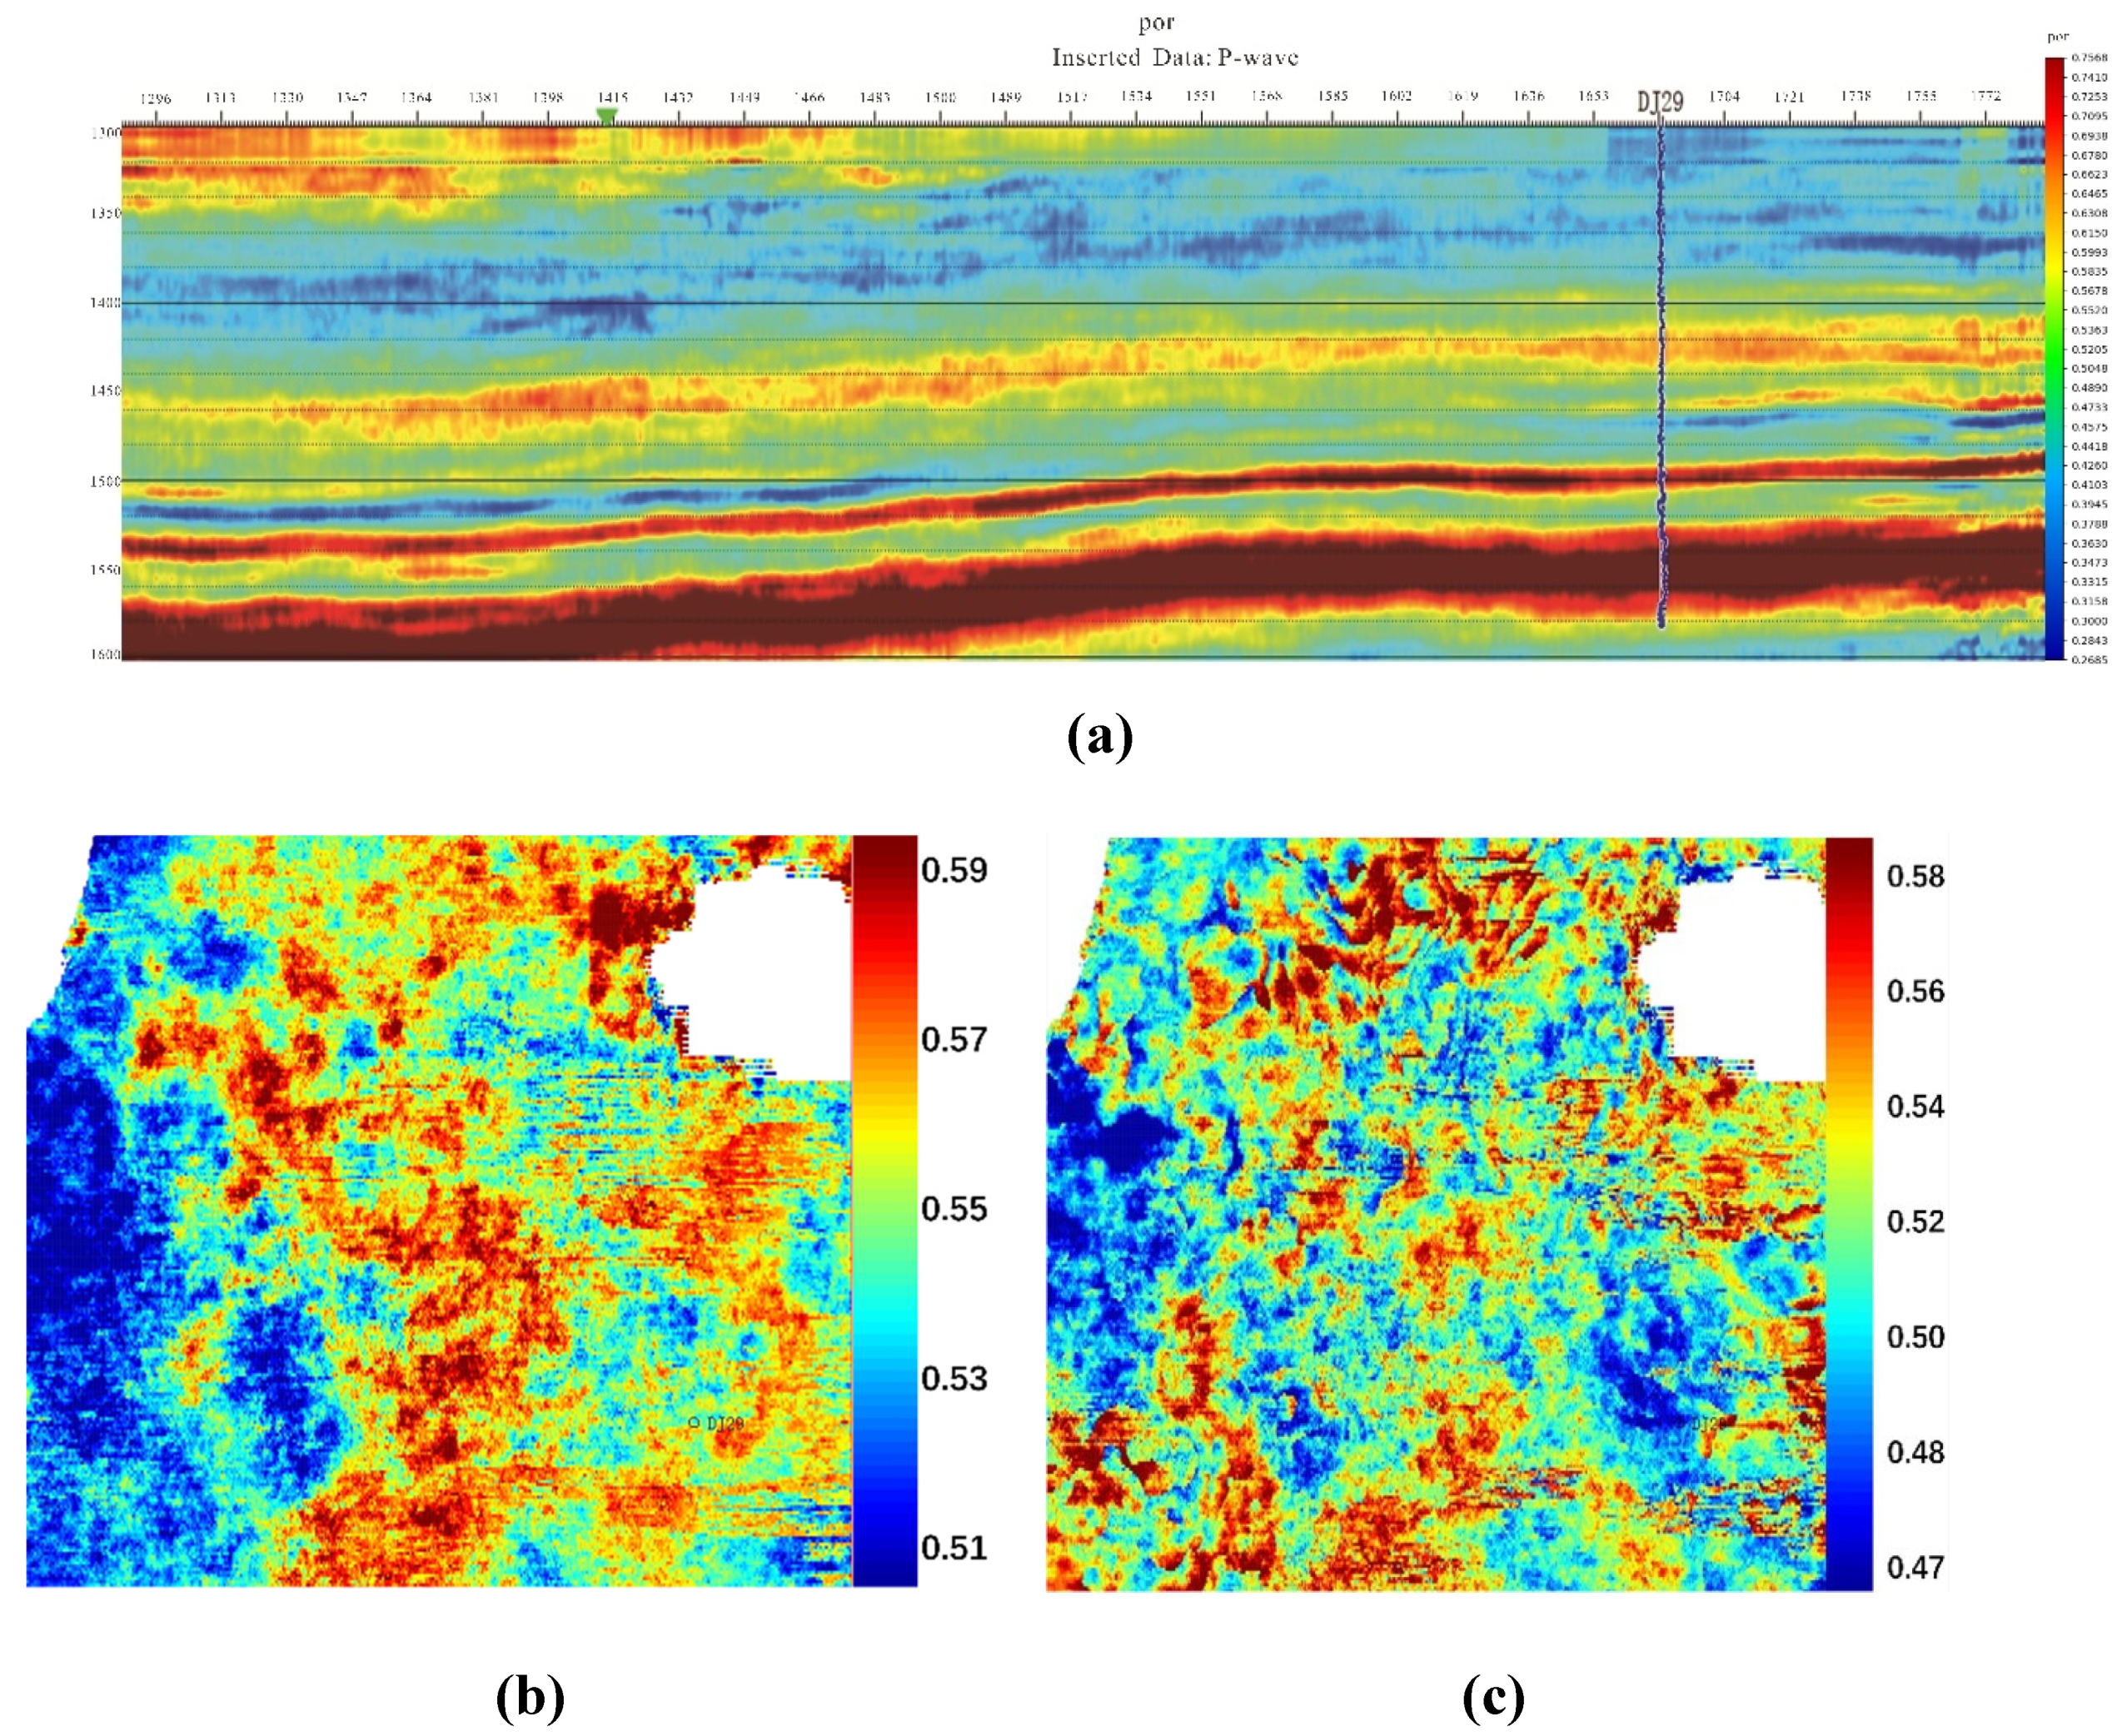
Disclaimer/Publisher’s Note: The statements, opinions and data contained in all publications are solely those of the individual author(s) and contributor(s) and not of MDPI and/or the editor(s). MDPI and/or the editor(s) disclaim responsibility for any injury to people or property resulting from any ideas, methods, instructions or products referred to in the content. |
© 2025 by the authors. Licensee MDPI, Basel, Switzerland. This article is an open access article distributed under the terms and conditions of the Creative Commons Attribution (CC BY) license (http://creativecommons.org/licenses/by/4.0/).
Copyright: This open access article is published under a Creative Commons CC BY 4.0 license, which permit the free download, distribution, and reuse, provided that the author and preprint are cited in any reuse.


