
Submitted:
26 September 2025
Posted:
28 September 2025
You are already at the latest version
Abstract
Quantitative neuroimaging techniques have proven to be powerful tools for studying normal brain physiology and investigating the structural and functional alterations associated with different brain disorders. Despite their huge potential, their contribution to the clinic has largely been limited to supporting (when possible) more standardised neuroradiological imaging procedures.Traditionally, quantitative neuroimaging research relies on cross-sectional analyses, where groups of patients sharing similar diagnostic labels are compared to matched groups of controls. However, this approach may overlook important variations among individuals, particularly in the context of disease diagnosis and treatment response.In this respect, normative modelling (NM) represents a promising innovation for the field of neuroimaging, mapping brain imaging anomalies at the individual level, thus facilitating the shift towards personalised applications. Instead of treating all individuals as part of a homogeneous population, NM describes the variance of imaging phenotypes within a reference population and exploits it to identify subject-specific measures of disease states via the quantification of individual deviations from the normative expected model.In this paper, we showcase the latest research on NM in neuroimaging to investigate neurological and neuropsychiatric disorders. We lead the readers through the key steps of implementing the NM framework, starting from the normative model selection to model estimation, evaluation, and application. Finally, we highlight how the NM is applied across various neuroimaging techniques to pinpoint biomarkers of functional and structural brain alterations.
Keywords:
normative modelling
; neuroimaging
; precision medicine
; quantitative imaging
Three Key Points:
- Normative modelling entails quantifying the normative variability of an imaging biomarker in a reference condition and identifying subject-specific pathological deviations.
- Normative modelling addresses the limitations of traditional population-level studies by enabling the detection of subject-level deviations from the normative range, without requiring a shared pattern of abnormalities across multiple individuals.
- The specific application and methodological complexity of the normative modelling framework may vary across studies and imaging methods, depending on several operative choices, including the selection of the modelling approach, the definition of a deviation metric, and the necessity for a data harmonization step.
1. Introduction
Since the introduction of X-ray techniques in the late nineteenth century, it quickly became evident that medical imaging would drastically transform our approach to studying and understanding the brain (Narang and Jha, 2017). Today, after more than a century of use, neuroimaging methods have become part of the clinical routine for the diagnosis and monitoring of many brain disorders, as well as tools to define interventions, assist neurosurgery, and inform patient treatment plans. With the advancement of technology and scientific knowledge, neuroimaging methods have significantly evolved (Mishra and Singh, 2010), adding to their capacity to pinpoint the spatial localization of both structural and functional alterations, quantitative information on the magnitude of these aberrant changes. Quantitative neuroimaging refers to the use of imaging techniques, such as magnetic resonance imaging (MRI), positron emission tomography (PET), single-photon emission computed tomography (SPECT), computed tomography (CT), and others, in combination with computational methods to quantify various aspects of brain structure and function (Bremner, 2005). Examples of these include brain morphometry (i.e., quantification of the size, shape, and volume of different brain structures) (Mechelli et al., 2005), brain connectivity (i.e., analysis of the structural and functional connections between different regions of the brain) (Jirsa and McIntosh, 2007), brain metabolism (i.e., measurement of brain glucose or oxygen consumption using techniques such as PET) (Guedj et al., 2022; Sokoloff et al., 1977), and molecular profiles (i.e., quantification of neurochemicals, neurotransmitters, or their receptors using techniques like magnetic resonance spectroscopy and molecular imaging) (Gunn et al., 2015).
Quantitative neuroimaging has played a crucial role in understanding various neurological and psychiatric disorders, as well as in studying normal brain development and aging (Cole and Franke, 2017). It has enabled researchers to objectively assess changes in the brain associated with different conditions and to investigate the effects of novel and existing interventions. Most of these findings follow traditional population-level neuroimaging studies, exemplified by cross-sectional analyses, aimed at identifying differences between average or representative subjects from distinct groups, such as healthy controls versus individuals with a specific brain disorder. While these approaches have proven valuable for gleaning insights into disease mechanisms and therapeutic strategies, they often overlook a fundamental aspect of the disease: its inherent variability across the population. By exclusively examining population averages, cross-sectional analyses make the implicit assumptions that the measured parameters manifest homogeneously across all individuals and that the disease exerts a uniform effect on all patients. In practice, these assumptions frequently do not align with reality (Kapur et al., 2012; Meyer-Lindenberg, 2023).
Recent years have witnessed a notable pivot toward embracing more personalised approaches in the realms of disease diagnosis and treatment (Verdi et al., 2021; Williams and Whitfield Gabrieli, 2025), often defined as “the tailoring of a medical treatment to the individual characteristics of a subject, reducing the need for unnecessary testing and therapies” (Ginsburg and Phillips, 2018). As a result, the landscape of neuroimaging research is undergoing a significant paradigm shift from the conventional “population-level approach” in favour of a more personalised perspective, with implications not only for research but also for clinical applications (Brammer, 2009). One pioneering approach at the forefront of the neuroimaging field is normative modelling (NM). NM is an emerging and data-driven statistical framework that tries to overcome some limitations of traditional cross-sectional analysis. By describing the neuroanatomical variation of brain imaging between subjects and quantifying the individual’s deviation from an expected pattern learned from a reference population, NM aims to identify subject-specific neuroimaging biomarkers of disease state.
In this work, we showcase the current body of work in the field of NM by presenting the practical steps of NM implementation, the main methodologies adopted for model estimation, the evaluation of model fit, and scoring metrics commonly used as measures of deviation from normality. We additionally summarise the state of the art in the most common neuroimaging modalities, including structural MRI (sMRI), functional MRI (fMRI), diffusion MRI (dMRI), and molecular imaging (PET and SPECT). Lastly, we discuss limitations and potential future development for the field.
2. The NM Framework in Neuroimaging Studies
NM always begins with the estimation of reference standards against which individual patients are compared. The rationale behind NM methods is that, to fully characterise the value of any biological measure in disease, one must first understand how it is distributed within a reference healthy population. Once the “normal” range is established, it becomes possible to quantify whether the same measure is altered in the presence of a condition, and if so, the magnitude of this alteration.
In the field of neuroimaging, NM offers the significant advantage of modelling the between-subject variability of any imaging-based biomarker, while preserving the spatial organization of brain measures, without assuming that the manifestation of brain abnormalities – whether structural, functional, or molecular – is homogeneous across individuals for any given disease (Marquand et al., 2016a, 2019). NM implementation requires neuroimaging measures from a reference cohort (generally healthy individuals) and a target cohort (e.g., a patient population). The former is used to model a statistical relationship between the biomarker of interest and a predefined set of covariates of interest. The latter is used for model application to estimate individual maps of deviation from normality.
More specifically, the NM framework involves several steps, as suggested by (Marquand et al., 2019) and summarised in Figure 1: 1) the study design, 2) the statistical model definition and identification, 3) the model validation, and 4) the application to the target cohort. When successfully applied, NM returns both the brain average pattern of the biomarker of interest and its centiles of variation, as a function of a set of covariates of interest. These centiles are used to describe the variability of the reference population and make statistical inferences about the significance of the deviation exhibited by a target subject. The concept is analogous to that of growth charts for pediatric populations, where a newborn’s normal body development (e.g., height, weight, and head circumference) is described as a function of age (Cole, 2012; Rutherford et al., 2022a), and the centiles of variation provide a measure of the expected variability and allow the detection of potential abnormalities.
2.1. Study Design: Data Collection, Harmonization, and Covariates Selection
The study design step is where operative choices are made and necessary data are identified, gathered, and prepared for the analysis.
First, the relevant biological features for the biomarker of interest are computed from the neuroimaging data. This could correspond to some morphological brain measures, as well as some functional ones. The raw data are rarely used for NM in their original forms, but rather processed, quality-checked, and harmonised with each other, to identify from the neuroimaging measures the signal of interest and to remove possible confounding effects. Neuroimaging data can be used with different levels of spatial granularity. This can be at the voxel or vertex level, providing the highest spatial resolution, or at the region-of-interest (ROI) level, which sacrifices spatial resolution for a higher signal-to-noise ratio. If ROI-based NM is adopted, the investigator must also select an appropriate atlas for brain parcellation, which should be consistent across all data. Once the NM is estimated, brain parcellation cannot be changed and must be consistent for both training and application.
One important choice regards the identification of the reference and target cohorts: the reference cohort should represent a normative population, often consisting of healthy individuals or matched controls for a particular class of patients; the target cohort usually represents a group of individuals with a specific disease or condition of interest for the investigation. Particularly critical is the identification of the reference cohort, which should be a large sample that captures a wide range of variability within the whole normative population. As a rule of thumb, the larger the sample, the more accurate the description of population variability, but so far, an optimal strategy for sample size calculations in the context of NM has not been defined.
Independent of the modality, the multicentric nature of large-scale neuroimaging initiatives inevitably induces pooling data from different imaging sites and/or scanners (Fortin et al., 2018), creating data inconsistency and batch effects (similarly to what happens in genomics). This adds to the NM analysis an extra level of complexity, as effects of interest might be hidden by differences in acquisitions (Marzi et al., 2024). Several ways have been proposed to either harmonise the data or account for the site effect when estimating the model (Bayer et al., 2022, 2021; Kia et al., 2022). The simplest approach would consist of the estimation of a different model for each site, thus without the need to handle site differences. However, this approach is unable to take advantage of the richness of available data and can be prone to overfitting when the sample size of each batch is small. Amongst the alternative solutions are the Combat-family methods (Fortin et al., 2018; Pinto et al., 2025). These methods allow for data harmonization by removing the variance associated with batch effects and preserving a priori known sources of variation in data (accounted for in a design matrix) and unknown sources of variation that are not correlated with batch effects. However, they suffer from the risk of removing unknown biologically relevant factors or partially preserving batch effects because of correlation with other covariates of interest. Additionally, it requires a re-harmonization of the data and re-training of the model any time a new scanner/batch is included. On the other side, hierarchical models overcome this issue by modelling instead of removing any side effects. More specifically, these models account for site differences by including an additional random effect. Random effects differ from traditional covariates (fixed effects) as they assume that not all the observations have been observed and allow for the approximation of the effect of a new observation. The effect of a new scanner can be estimated directly in the model without the need for harmonization with other methods and retraining the model. Hierarchical models allow for federated learning approaches in normative modelling, allowing for learning, updating, and adaptation of model parameters on decentralised neuroimaging data (Kia et al., 2022).
Another critical choice in the design of a NM study is related to the selection of biological, clinical, and demographic covariates to use as independent regressors in the statistical model. These variables should be able to explain a “significant” amount of the response variance, which ultimately is defined by the neuroimaging biomarker variability across individuals. On the other hand, it is important to consider the practical availability of these covariates both for the reference and target cohorts. While variables like age or sex are easily accessible, other potential regressors for neuroimaging data, like polygenic risk scores (D’Ambrosio et al., 2022; Janahi et al., 2022) or neuropsychological assessments (Bigler, 1994), may be more rarely available or inconsistent across individuals. In general, as for neuroimaging measures, data collection for predictors should be standardised and homogenous for both reference and target samples.
While most NM applications aim to characterise normative variability in a neuroimaging biomarker as a function of biological, clinical, and demographic covariates, a peculiar class of NM is represented by brain age models. Brain age models focus on predicting individual brain age based on brain imaging data and computing the brain age gap, i.e., the difference between predicted brain age and actual chronological age (Chen et al., 2022a, 2022b; Cropley et al., 2021; Erus et al., 2015). In this approach, we have an inverse problem compared to traditional NM applications in neuroimaging, with the brain imaging biomarkers adopted as model predictors and subjects’ age as model response.
2.2. Model Definition and Identification
This step involves selecting the best model(s) fitting the data at hand and estimating its parameters on the training set. When deciding on the type of modelling, three main families of methodologies can be considered: frequentist, Bayesian, and Deep Learning (DL) methods.
Frequentist Methods
Frequentist methods are so-called for their use of frequentist or inferential statistics. This class of methods can be divided into two sub-groups.
The first group focuses on the mean effect only. Several models have been used in literature belonging to this group, including simple linear regression (LR) or polynomial regression (Coupé et al., 2022; Romascano et al., 2024; Zhang et al., 2023), support vector regression (SVR) (Cropley et al., 2021; Erus et al., 2015), and generalised linear model (GLM) (Ji et al., 2023; Zhang et al., 2022). LR is the simplest method and assumes a linear relationship between the neuroimaging variable and predictors. The point-estimate parameters of the predictors (i.e., mean parameters) are generally estimated via maximum likelihood estimation (MLE). SVR is a type of supervised machine learning algorithm used for regression tasks, where the goal is to predict a continuous numerical output. Analogously to Support Vector Machines (SVM), by employing a kernelized approach, SVR maps input data into a higher-dimensional space, enabling the algorithm to identify an optimal hyperplane that minimises prediction error. The algorithm considers a user-defined tolerance for deviations from the actual values and ignores the errors of any training data close to the model prediction within this tolerance (Erus et al., 2015; Smola and Schölkopf, 2004). Lastly, GLM is a statistical framework that extends the ordinary linear regression model to accommodate various types of response variables, including binary, count, and categorical data. GLMs model the relationship between the mean of the response variable and the predictors through a link function (e.g., logit, probit, and log), which transforms the mean of the response variable to the scale of the linear predictor and specifies a probability distribution for the response variable that belongs to the exponential family of distributions (Wüthrich and Merz, 2023). By design, this class of methods estimates only the mean of the response variable and assesses individual deviations from normality by computing model residuals, i.e., the difference between observed and predicted responses. These approaches are quite appealing for their simplicity and permit obtaining group-level inferences. However, they do not quantify the uncertainty and variation of the biomarker across the whole population, and this must be used by post-hoc regressing the residuals with the true response variable (Erus et al., 2015; Marquand et al., 2019).
This limitation is overcome by other frequentist methods that directly measure the centiles of variation within the population. An example is the quantile regression (Bedford et al., 2024; Lin et al., 2023; Lv et al., 2021; Wong et al., 2023), which estimates the relationship between specific quantiles of the data distribution and a set of covariates (Huizinga et al., 2018; Koenker and Hallock, 2001). Unlike traditional LR, which models the mean, quantile regression focuses on one or more quantiles of interest (e.g., median, quartiles). Another example is given by the Nandaraya-Watson (NW) estimator, a non-parametric kernel regression method that estimates the conditional probability of the response from the set of predictors via computation of a weighted average of the observed values of the response with weights depending on the distance between the points (Elad et al., 2021). More recently, the Generalized Additive Model of Location, Scale, and Shape (GAMLSS) model (Bethlehem et al., 2022; Dinga et al., 2021), has been proposed in neuroimaging studies. GAMLSS extends traditional GLM by allowing not only the mean (i.e., location), but also the scale, skewness, and kurtosis (i.e., shape parameters) of the response variable’s distribution to be modelled as functions of selected covariates. As a generalized additive model, it also overcomes the assumption of linearity of GLM models.
Notably, alongside standard NM approaches, few studies uniquely relied on correlation analysis (e.g., by exploiting Pearson’s based similarity index) to identify deviations from the typical pattern of brain inter-regions anatomical similarity or functional connections (Antoniades et al., 2021; Baldwin et al., 2022; Doucet et al., 2020; Yang et al., 2020).
Bayesian Methods
Bayesian methods represent the bulk of NM approaches. Among them, the most used approaches are Bayesian Linear Regression (BLR) and Gaussian Process Regression (GPR).
BLR is a Bayesian parametric estimation approach that extends traditional LR (Baldwin and Larson, 2017; Corrigan et al., 2024; Schulz et al., 2018) by assuming that both the response variable and the model parameters come from a Gaussian probability distribution. Model estimation will thus reduce to the definition of probability distributions (rather than the point estimates) of these parameters. By adopting Bayesian inference, BLR enables the inclusion of prior knowledge and expectations about model parameters and responses. According to Bayes’ rule, once a set of data is collected, the probability distribution for the model parameters (i.e., the posterior distribution) is computed as the product of the likelihood function, representing the probability of the data given the parameters, and the prior probability. Conceptually, starting from an initial estimate provided by the prior, the model is updated as new evidence is gathered from the data. The resulting probability distribution over model parameters, informed by both the data and the prior, can then be used to estimate the predictive distribution of the response for a new set of predictors (Harnett et al., 2024; Kasper et al., 2024; Savage et al., 2024). It is worth noting that BLR assumes a linear relationship between the response variable and covariates, an assumption that is rarely satisfied in real-world scenarios. One possible solution to this problem involves using a non-linear function to transform the set of inputs into a new, linearised feature space. This approach offers high flexibility to model functions of any shape, but it requires identifying the optimal mapping from numerous available options, which can be challenging in practice. Similarly, extensions of the BLR model, such as B-spline BLR (Shao et al., 2024) and Warped BLR (Lotter et al., 2024; Meijer et al., 2024; Rutherford et al., 2023), have been developed to handle non-Gaussian data distributions. Specifically, these models employ basis functions to map the data onto a Gaussian space (Fraza et al., 2021).
One flexible data-driven Bayesian alternative method is represented by GPR (Blok et al., 2022; Liu et al., 2024; Sun et al., 2023), which allows addressing some limitations of BLR approaches, such as the linearity of response (Marquand et al., 2016a, 2019; Schulz et al., 2018; Wang, 2023). The estimation concept in GPR is similar to BLR, but the mapping is chosen implicitly, allowing the data to determine the shape of the regressing function. Unlike BLR, which determines a distribution over the coefficients, GPR adopts Bayesian inference to directly define a probability distribution over the regressing function, which is modelled as a Gaussian Process (GP). A GP is a statistical process that defines a distribution over functions so that any set of points follows a joint multivariate Gaussian distribution.
The first stage in GPR approaches is to establish a prior GP that defines the prior probability distribution over the set of interpolating functions. This prior is determined by a mean function, usually assumed to be zero, and a covariance function (kernel), that specifies the shape, smoothness, and uncertainty of the function. After establishing the prior, Bayes’ rule is applied to incorporate the knowledge gained from the training data and restrict the GP distribution according to the observed data points. By conditioning the joint Gaussian prior distribution on the collected observations, the posterior distribution over the regressing function can be determined and used to obtain a predictive distribution on new input data. For a more comprehensive and detailed description of the GPR models refer to (Rasmussen and Williams, 2006).
Bayesian methods directly provide a full predictive distribution of the response variable (Ge et al., 2024b), with the mean function describing the expected trajectory and the variances indicating predictive uncertainties. The more data that is available, the more accurate the predictive distribution becomes; conversely, a smaller amount of data results in a wider spread of the posterior distribution.
Bayesian approaches can additionally be estimated as hierarchical models. These models adopt random effects as additional covariates, which differ from the other covariates (referred to as fixed effects), as they assume that not all observations have been observed. The inclusion of random effects allows the approximation of the effect of a new, unseen observation on the fly. This is particularly useful when modelling site effects, since the effect of a new scanner can be estimated directly in the model without the need for harmonization with other methods (Bayer et al., 2022, 2021; Kia et al., 2020).
DL Methods
DL methods represent an emerging family of applications within the context of NM, overcoming some limitations of traditional statistical approaches. In neuroimaging, the study of neurological or psychiatric disorders involves analysing complex, multivariate data with highly variable spatial patterns that standard statistical approaches often fail to model (Lopez Pinaya et al., 2020). To address these challenges, recent studies have proposed DL methods to detect brain abnormalities starting from MRI images (Kumar et al., 2023a, 2023b; Lawry Aguila et al., 2022; Pinaya et al., 2021, 2019). These approaches often use autoencoders to identify patterns relating the response and the covariates in the data. Autoencoders are neural network (NN) architectures composed of two blocks, an encoder and a decoder, trained with unsupervised strategies (Bank et al., 2021). Specifically, the encoder compresses the input into a low-dimensional representation, and the decoder reconstructs the original image from this representation. The objective is to produce a reconstructed image that closely resembles the original.
Autoencoders are particularly suited for applications in NM, and two main types used are variational autoencoders (Feng et al., 2024a, 2024b; Kumar et al., 2023a, 2023b; Lawry Aguila et al., 2022; Wang et al., 2022) and adversarial autoencoders (Pinaya et al., 2021). In DL applications, the contribution of the covariates is integrated into the NM in the form of a loss function for the NNs (Pinaya et al., 2019). Once the training on the reference data is completed, deviation maps are calculated from the neuroimaging data of a new individual as reconstruction error, i.e., the difference between the reconstructed and the original brain image (Kumar et al., 2023b). Individual deviation maps are usually normalised with respect to the mean and variance of the reference deviation map, assuming a minimal reconstruction error for the reference cohort (Kumar et al., 2023b).
2.3. Model Evaluation
After the parameter estimation, the performance of NM is evaluated in terms of data fit and model accuracy to predict the response variable. This step is particularly crucial: if the reference data are not adequately modelled, the estimated subject’s abnormality scores in the target population may be biased. To ensure the generalizability of the model, the evaluation must be performed on unseen data, either in-sample, through k-fold cross-validation (mostly with k=5 or k=10) (Floris et al., 2021; Ge et al., 2024b; Wolfers et al., 2018), or, ideally, out-of-sample on an independent cohort.
Practically, the assessment of model performance reduces to the evaluation of a set of performance metrics measuring the ability of the NM to fit the data. Several alternatives have been proposed in the literature. A detailed description of the metrics can be found in (Dinga et al., 2021) where they are subdivided into two subgroups: measures of goodness of fit of the central tendency and measures of total goodness. Measures of goodness of fit of the central tendency assess how accurately the centre of the distribution (i.e., the mean) is predicted. This is crucial, as poor fit can lead to systematic under- or over-estimation of the predicted response. The most common metrics include the explained variance (EV, or alternatively the coefficient of determination, R2), standardised mean squared error (SMSE), and Rho coefficient between true and predicted responses (Rutherford et al., 2022b). In addition to these, the mean absolute error (MAE) has been used in some works as a goodness-of-fit metric (Dinga et al., 2021; Macleod et al., 2020). On the other hand, measures of total goodness of fit are sensitive to all possible misspecifications of the model, including location, scale, and shape of the predicted distribution. These include measures based on the maximization of model likelihood, such as the mean standardised log-loss (MSLL), Validation Global Deviance (VGD), and the Logarithmic Score (log-score).
In addition to these validation metrics, a few articles also analysed the beta coefficients defining the weight of each regressor and resulting from model fit (Cropley et al., 2021; Floris et al., 2021; Wolfers et al., 2021, 2018). Plotting the estimated beta, especially at the voxel level, may pose challenges due to potential distributions over multiple parameters. Nevertheless, it can offer a rapid and basic method to assess the importance of each regressing covariate on the response variance, allowing a better interpretation and evaluation of the estimated model.
Independent of the specific approach and metric adopted, the evaluation of model performance metrics is a fundamental step in the application of NM since these metrics provide a benchmark of NM performance, prior to its application in the patient cohort. For this reason, they should always be reported before the analysis of any testing cohort. Moreover, when several competing statistical models are estimated, this step allows for an objective and quantitative model selection strategy.
2.4. Model Application to the Target Cohort
The final step of NM is its application: once the model has been defined and trained, given the set of covariates characterizing the target subject, the predictive response for a given target subject – based on their covariates – is quantified, either as a point estimate or as a predictive distribution. Once the predicted and true responses are available, one can measure the discrepancy between them through the computation of a deviation score, which will quantify the distance between the subject’s measures of interest and their expected normal range (Marquand et al., 2016a, 2019).
The most used deviation metric is the Z-score, defined as the ratio between the prediction error (i.e., the bias between true and predicted values of the response) and the model variability (i.e., the standard deviation of the predicted response) (Rutherford et al., 2022b). The Z-score enables evaluation of prediction error while accounting for differences in predictive uncertainty and supports probabilistic inferences about which individuals significantly deviate from the normative pattern (Marquand et al., 2016a). Depending on the granularity at which the neuroimaging biomarker and model have been estimated, Z-scores can be used to generate a deviation map, also known as a Normative Probability Map (NPM), for each subject, either at voxel or ROI level (Marquand et al., 2016a).
Practically, applying a symmetric threshold to Z-scores, defining the range of normality, allows the identification of extreme deviations from the norm (Floris et al., 2021; Janssen et al., 2021; Meijer et al., 2024; Wolfers et al., 2021, 2018). These extreme deviations are interpreted as significant alterations of the biomarker under investigation. The threshold choice reflects the desired significance level (e.g., a Z-score of 2.6 corresponds to a p-value of about 0.01, while a Z-score of 2 corresponds to a p-value of 0.05) and the choice to account or not for multiple comparison.
Participant-level summary statistics of deviation from the normative pattern can also be obtained by aggregating Z-scores across brain regions. This can be performed by averaging all Z-scores or calculating the proportion of extreme deviations relative to the total. Depending on the study goal, either signed (positive or negative) or unsigned (absolute) deviations may be analysed. Importantly, the interpretation of these deviations depends on various study choices, such as imaging modality and Z-score threshold.
An alternative to Z-score thresholding is the extreme value theory, which focuses on the statistical modelling and analysis of the tail ends of a distribution, where rare events occur. These events may correspond to exceptionally large or small values, depending on the context (Gomes and Guillou, 2015). Extreme value statistics is widely used in several fields like environmental sciences, economics, and healthcare to model low-probability, high-impact outcomes (Cotter, 2006; Hamdi et al., 2021; Thomas et al., 2016). This approach can be applied to NM when large enough sample sizes are available, fitting a generalised extreme value (GEV) distribution to the tails of the Z-score distribution of the reference population. This approach offers more accurate modelling of rare deviations and can enhance the detection of atypicality, particularly in psychiatric research (Fraza et al., 2022).
While the Z-score remains the most common deviation metric, alternative measures are also employed. For example, the MAE is often used in DL approaches to quantify reconstruction error, which tends to increase as individual data deviates more from the normative pattern that the trained network has learned (Feng et al., 2024b, 2024a). Additionally, effect size metrics such as Cliff’s delta (Pinaya et al., 2021, 2019) and other specific deviation scores are also used.
3. NM Applications to Neuroimaging
The current section provides an overview of NM applications across major neuroimaging modalities, including sMRI, fMRI, dMRI, and molecular imaging. Literature searches were conducted in November 2024, resulting in the identification of a total of 131 studies from an initial pool of 173. Full details on the search query and inclusion/exclusion criteria are provided in the Supplementary Materials. Selected papers included NM methodological contributions as well as studies presenting NM applications to human brain imaging biomarkers for the study of different clinical or physiological conditions. Specifically, 110 applicative studies were included (Supplementary Table S1). Summary information for these studies is visually illustrated in Figure 2.
At first glance, it appears clear that NM is gaining momentum across various neuroimaging modalities, with an increase of 67% in the number of NM applications to neuroimaging data in 2024 (Figure 2a) with 44 published studies. This approach has been widely adopted in the study of neurodevelopmental conditions, including autism and attention deficit hyperactivity disorder (ADHD) (Bayer et al., 2021; Bedford et al., 2024; Bethlehem et al., 2019; Duan et al., 2024; Floris et al., 2021; Nunes et al., 2020; Pinaya et al., 2019; Rutherford et al., 2022a; Shan et al., 2022; Wolfers et al., 2020; Zabihi et al., 2020, 2019), as well as psychiatric disorders, specifically within the schizophrenia and psychosis spectrum (Berthet et al., 2024; García-San-Martín et al., 2024; Janssen et al., 2021; Kia et al., 2022, 2020; Pinaya et al., 2019; Rutherford et al., 2022a; Segal et al., 2023; Wolfers et al., 2021, 2020, 2018), inherently characterised by high heterogeneity in brain structure and function. A consistent number of studies have also applied NM to neurocognitive disorders (Guo et al., 2024; Kia et al., 2022, 2020; Pinaya et al., 2021) including Alzheimer’s disease, mild cognitive impairment, and Lewy body dementia, mood disorders (Fang et al., 2024; Kia et al., 2022, 2020; Rutherford et al., 2022a; Wolfers et al., 2021, 2018) such as bipolar disorder and depression, as well as to physiological processes such as aging (Bethlehem et al., 2022; Di Biase et al., 2023; Rutherford et al., 2022a). Fewer applications have been reported in the context of pediatric and perinatal conditions (Cromb et al., 2024; Dimitrova et al., 2021; Gaiser et al., 2024), obsessive-compulsive disorders (Han et al., 2023b; Segal et al., 2023, 2024), neurodegenerative diseases (Lawry Aguila et al., 2022) (Chen et al., 2022b) (Villalón-Reina et al., 2023) (Bhome et al., 2024), genetic conditions (Fukami-Gartner et al., 2023; Villalón-Reina et al., 2023, 2022), and other clinical populations (Figure 2b).
Concerning the design of the NM models (Figure 2c), around 60% of the studies employed a Bayesian model, with BLR, either hierarchical or not hierarchical, and GPR models being the most adopted. On the other hand, only a few studies adopted a hierarchical version of the GPR model. Several different frequentist approaches have also been applied (around 28% studies), ranging from log-log regressor (Reardon et al., 2018), and local polynomial regression (Bethlehem et al., 2019), to NW estimator (Elad et al., 2021) and quantile regression (Bedford et al., 2024; Lin et al., 2023; Lv et al., 2021; Wong et al., 2023). More complex approaches were also proposed by more recent works, such as the Rotation-Based Iterative Gaussianization (Snyder et al., 2021), which helps in handling non-Gaussianity of data, or the GAMLSS, for a complete characterization of the probability distribution of the response variable (Dinga et al., 2021; Ge et al., 2024b). Finally, only ~11% of the reviewed studies employed a DL approach for NM (Kumar et al., 2024, 2023a, 2023b; Lawry Aguila et al., 2022; Pinaya et al., 2021, 2019), with the majority of these studies preferring a variational autoencoder as architecture.
Independent of the specific application field, the model set up, and the neuroimaging modality involved, age and sex are generally the most common covariates, followed by data acquisition site and scanner type (Figure 2d).
Approximately 77% of the 78 studies employing multi-site data addressed possible batch effects arising from inter-site differences in scanner and acquisition protocols, either by harmonizing data with Combat, hierarchical modelling, inclusion of site as a predictor, or, more simply, by standardizing preprocessing pipelines to reduce scanner-related variability. A few recent studies have adopted more sophisticated approaches, such as transfer learning and dataset adaptation, to fine-tune pre-trained models on new target datasets (Figure 2e).
Regarding model validation, performance evaluation was explicitly reported only in 78 of the 110 reviewed studies.
The numerosity of reference cohorts ranges from less than 100 scans (Snyder et al., 2021) to over 50,000 (Rutherford et al., 2022a), with one study including more than 100,000 scans (Bethlehem et al., 2022). Data availability is generally highly dependent on the imaging modality chosen (Figure 3). More common modalities, such as sMRI, generally support larger datasets. In contrast, molecular neuroimaging techniques (e.g., PET) often involve smaller datasets, primarily due to higher acquisition costs and modality-specific limitations, such as radiation exposure. Overall, the establishment of international consortia (e.g., ENIGMA (Thompson et al., 2014), ADNI (Petersen et al., 2010)), open-source datasets containing acquisitions from both healthy and clinical populations (e.g., ADNI (Mueller et al., 2005; Petersen et al., 2010), OASIS (Marcus et al., 2007), ARWiBo (Frisoni et al., 2009)), and standardised data-sharing frameworks (e.g., BIDS and its derivatives (Gorgolewski et al., 2016; Holdgraf et al., 2019; Niso et al., 2018; Norgaard et al., 2021; Pernet et al., 2019)) have facilitated the aggregation of large-scale neuroimaging cohorts. Notably, efforts have recently led to the creation of the Normative Neuroimaging Library, including structural, diffusion, and functional MRI scans as well as comprehensive demographic information on around 1,900 healthy individuals, designed as a reference dataset to support the diagnosis and therapeutic development of neurological and psychiatric conditions (Gage et al., 2024).
Interestingly, a different number of quantitative metrics has been adopted for each neuroimaging modality (Figure 4), with sMRI being the best one to be characterised and molecular imaging being the one involving the lowest number of features (only 2 metrics). This trend reflects a greater number of NM applications to MRI data — particularly sMRI data — compared to molecular imaging.
3.1. sMRI
The majority of NM applications (88 out of 110 studies) in neuroimaging focus on sMRI data. The higher number of sMRI publications compared to other modalities reflects the greater availability of this data type, due to its relatively low cost and high adaptability across experimental settings. Applying NM to sMRI data aims to map physiological interindividual variability in brain morphology metrics as a function of age and sex. Among the most commonly used measures are regional cortical thickness (Alvarez et al., 2019; Bayer et al., 2021; Gaiser et al., 2024; Harnett et al., 2024), surface area, and cortical and subcortical volumes (Bedford et al., 2024; Bethlehem et al., 2022; ENIGMA Clinical High Risk for Psychosis Working Group et al., 2024), as well as gray matter volumes (García-San-Martín et al., 2024; Han et al., 2024, 2023b, 2023a), white matter volumes (Sampaio et al., 2024; Wolfers et al., 2020, 2018), and whole brain and intrcranial volumes (Ge et al., 2024a; Laidi et al., 2022; Lawry Aguila et al., 2022; Pinaya et al., 2021). NM approaches have been widely adopted in the study of psychiatric, neurodevelopmental, and mood disorders and have allowed the detection of morphological abnormalities in schizophrenia (Janssen et al., 2021; Kia et al., 2022, 2020; Pinaya et al., 2019; Rutherford et al., 2022a; Wolfers et al., 2021, 2020, 2018), psychosis spectum (Berthet et al., 2024; ENIGMA Clinical High Risk for Psychosis Working Group et al., 2024; García-San-Martín et al., 2024), depression (Fang et al., 2024; Kia et al., 2020; Rutherford et al., 2022a), bipolar disorder (Fang et al., 2024; Kia et al., 2022, 2020; Rutherford et al., 2022a; Wolfers et al., 2021, 2018), but also autism (Bayer et al., 2021; Bethlehem et al., 2019; Floris et al., 2021; Nunes et al., 2020; Pinaya et al., 2019; Rutherford et al., 2022a; Shan et al., 2022; Zabihi et al., 2020, 2019), and ADHD (Bedford et al., 2024; Kia et al., 2022, 2020; Rutherford et al., 2022a; Wolfers et al., 2020). NM provides indeed a powerful tool to account for the high interindividual variability in disease manifestation in these cohorts and detect morphological alterations linked to the pathology. Additionally, a few works also applied NM to study neurodegenerative conditions such as Alzheimer’s disease (Guo et al., 2024; Kia et al., 2022, 2020; Pinaya et al., 2021) or mild cognitive impairment (Kia et al., 2022, 2020).
Another key application of NM to sMRI data is to map brain development and aging through morphological markers (Bethlehem et al., 2022; Di Biase et al., 2023; Rutherford et al., 2022a). Similar to traditional growth charts, brain charts offer a powerful tool to track structural changes across the lifespan, providing normative reference points against which individual brain data can be compared. A notable example is the CentileBrain project, which applied NM, artificial intelligence, and machine learning techniques to brain morphometric data from over 37,000 scans of healthy controls, aged 3 to 90, collected across multiple sites within the ENIGMA consortium (Ge et al., 2024a; Muili et al., 2024). The resulting model establishes reference values for the size of various brain regions, enabling earlier and more accurate detection of atypical structural patterns. Commercial models are also currently available and approved for diagnostic clinical use. An example is icobrain, a CE-marked, FDA-cleared medical imaging software developed by icometrix for the automated analysis of MRI and CT scans, which provides tools for lesion and abnormality detection to adopt in the diagnosis of neurodegenerative disorders (Sima et al., 2024).
3.2. fMRI
Although less represented in the literature compared to sMRI applications (20 out of 110 studies), the use of the NM framework in the analysis of resting state and task fMRI has already demonstrated its ability to capture individual functional alterations across different clinical contexts, including schizophrenia (Lawn et al., 2024; Lin et al., 2024; Oliveira-Saraiva and Ferreira, 2023; Rutherford et al., 2023; Yamashita et al., 2018), bipolar disorder (Lawn et al., 2024; Oliveira-Saraiva and Ferreira, 2023), depression, autism (Jiang et al., 2024; Looden et al., 2022; Savage et al., 2024; Sun et al., 2024) e ADHD (Lawn et al., 2024; Oliveira-Saraiva and Ferreira, 2023; Savage et al., 2024), but also Alzheimer’s and cognitively impaired patients (Huo et al., 2025; Wang et al., 2022). Despite the high heterogeneity of methodologies adopted, most of these studies modelled a response variable derived from resting state functional connectivity analysis of fMRI data, either static or dynamic, including the functional connectivity matrix itself or related derivative metrics (Jiang et al., 2024; Jing et al., 2023; Liu et al., 2024; Looden et al., 2022). These studies aimed to investigate physiological and pathological deviations in normative inter-region connectivity networks (Huo et al., 2025; Jiang et al., 2017; Liu et al., 2024). Only a few papers applied NM to task fMRI data (Floris et al., 2024; Savage et al., 2024; Zabihi et al., 2024). Alongside more standard NM approaches, a few studies uniquely relied on correlation analysis to identify deviations from the typical pattern of brain inter-region connections. As an example, in the study by Yang and colleagues (Yang et al., 2020), voxel-wise fMRI time series were averaged across healthy controls to construct a normative spatio-temporal template of synchronised brain activity. A measure of individual patient deviation from this template was then derived via the computation of similarity maps describing the voxel-wise correlation between the BOLD time series of patients and the norm template, allowing to highlight areas of divergence from the normative pattern. In addition to the studies employing NM directly on fMRI data, one recent study investigated the application of fMRI data enriched by molecular targets (Lawn et al., 2024). In this study, Lawn and colleagues enriched fMRI data with six molecular targets using the REACT framework (Dipasquale et al., 2019). The authors developed region-wise models of functional connectivity related to the six molecular targets using a hierarchical BLR approach, with age and sex as fixed effects and site as the random effect. The constructed models were then applied to cohorts of patients with schizophrenia, ADHD, and bipolar disorder. The estimated NM, by characterizing neurodisorders as divergence from normative ageing, enhanced robustness of between-group similarities and deviation-symptom relationships compared to traditional approaches. Along with clinical research studies, fMRI data was finally adopted in a methodological NM study by Kia and Marquand (Kia and Marquand, 2018) aimed at exploring and validating a novel scalable multi-task GPR model on high-dimensional fMRI data.
3.3. dMRI
A consistent number of applications of the NM to dMRI data is reported in the literature (16 out of 110 studies). By allowing the mapping of water molecules diffusion within the brain tissue, diffusion imaging enables the visualization and delineation of white matter tracts, providing insights into the organization and integrity of white matter pathways, and thus the identification of possible alterations in white matter microstructure. The majority of NM applications to dMRI data aim to model brain regional fractional anisotropy (FA) and mean diffusivity (i.e., measures of the degree of anisotropy and average rate of water molecule diffusion, respectively), often in combination with structural measures derived from anatomical MR images, as a function of age, sex, and other covariates of interest. In the study by Liv and colleagues (Lv et al., 2021), for example, the quantile regression approach was adopted to map regional FA and CT measures as a function of subject age and sex and then applied to patients affected by schizophrenia, highlighting the strong heterogeneity across patients in anatomical loci presenting deviations. A few studies also applied the NM framework to the analysis of white matter fiber geometry derived from tractography. Feng and colleagues proposed a novel DL-based NM framework for analysing white matter microstructure and macrostructure in the context of Alzheimer’s disease, demonstrating its high potential to detect the effects of degenerative disease on white matter structure (Feng et al., 2024a, 2024b). Additionally, Shen and colleagues (Shen et al., 2024) proposed the Brain Representation via Individualized Deep Generative Embedding (BRIDGE) framework, which integrates Bayesian NM and deep generative AI, to model the neurotypical development of the brain structural connectome derived from dMRI tractography. This framework enables the characterization of age-related changes in connectivity and the identification of region-specific patterns of neurodivergence.
3.4. Molecular Imaging
So far, NM applications to the study of molecular imaging data have been notably limited. As far as we know, there are no examples of NM applications to SPECT data, and only recently, a few studies have investigated the validity of the NM framework in PET imaging. The first example is represented by the study of Giacomel and colleagues (Giacomel et al., 2025), who used [18F]FDOPA scans on healthy controls to estimate voxel-wise BLR models with age and sex used as covariates. These models were applied to a cohort of patients affected by first-episode or chronic psychosis, and the analysis of Z-score allowed the investigation of whole-brain abnormalities of the dopaminergic system in these patients. Comparisons with current state-of-the-art analyses (i.e., assessment of the striatal binding) for the specific tracer and disorder under investigation showed the ability of the NM framework to highlight patterns of alteration in psychosis, normally overlooked in studies with [18F]FDOPA (i.e., non-striatal regions). Another recent study by Kumar and colleagues (Kumar et al., 2023a) combined standardised uptake values ratio (SUVr) maps from [18F]-AV45 Amyloid PET images with sMRI data using a multimodal variational autoencoder to identify functional and anatomical deviations in patients with Alzheimer’s disease with respect to a healthy condition. After training the model on cognitively impaired subjects and out-of-sample validation, the model was applied to individuals at various stages of Alzheimer’s disease. The deviation of each Alzheimer’s disease subject from the latent distribution of healthy controls was found to be sensitive to different Alzheimer’s disease stages and significantly associated with individual cognition status. In another recent preprint, Kumar also applied a DL approach to model tau SUVr data (Kumar et al., 2024).
4. Open-Source Tools to Implement Normative Modelling in Neuroimaging Studies
Implementing NM in neuroimaging is not easy, due to the multivariate nature of neuroimaging data and the datasets size. Most studies presented in the literature implement NM with in-house solutions. Nevertheless, several open-source tools have been developed to support and facilitate the application of the NM framework. These tools strongly contribute to promoting NM application in clinical research studies by facilitating its methodological implementation.
- Predictive Clinical Neuroscience Toolkit (PCNtoolkit) (Rutherford et al., 2022b): Python package of pipelines for NM estimation and application to neuroimaging data; based on Bayesian approaches, it is highly flexible in handling multi-site data and complex relationships between response and covariates (https://github.com/amarquand/PCNtoolkit).
- Predictive Clinical Neuroscience Portal (PCN Portal) (Barkema et al., 2023): online platform integrated with the PCNtoolkit providing a user-friendly interface where researchers can access pre-trained normative models estimated from large datasets, upload their data, and obtain normative models without requiring local computational resources or programming expertise (https://github.com/predictive-clinical-neuroscience/PCNportal?tab=readme-ov-file).
- PyNM (Harvey and Dumas, 2022): lightweight Python NM implementation designed to facilitate the implementation of NM operative steps (model estimation, comparison, validation, etc) for users with low technical expertise, providing both a Python API and a command-line interface and a comprehensive tutorial (https://github.com/ppsp-team/PyNM?tab=readme-ov-file#readme).
- CentileBrain (Ge et al., 2024a): web portal providing pre-trained models of typical brain trajectories estimated on large multi-site ENIGMA data for their application to users’ datasets (https://centilebrain.org).
5. Discussion
In this work, we made the case for the use of NM in neuroimaging. The goal of this methodological framework is to model the population variability of neuroimaging biomarkers of interest, such as cortical thickness, responses to functional stimuli, or orientation of brain fibers, and to use it to interpret meaningful alterations when applied to a single patient.
This methodology has been developed and applied to neuroimaging with the intent of overcoming some of the limitations imposed by traditional case-control studies and clustering methods. These methods rely on average representations of subject groups and are the most predominant methods used for the investigation of group differences and within-cohort heterogeneity. However, they both still present some shortcomings. Case-control studies have the limitation of necessitating a priori-defined classes (e.g., healthy controls and schizophrenia patients) and disregarding, or considering as noise or measurement error, the naturally occurring variability of the response variable in the population. This is problematic for clinical domains, such as psychiatry, where different disorders present with a set of heterogeneous and overlapping symptoms and are diagnosed solely from the manifestation of these (Segal et al., 2025). Clustering methods, on the other hand, used for the stratification of patients into subgroups, require the user to select, through appropriate methods, the optimal number of clusters and, once this number is determined, the clustering algorithms will necessarily converge to it (Marquand et al., 2016b). NM relies on a variety of methods to explicitly model the inter-subject variability of the response of interest within the population, without the need for a predefined assignment of subjects of the target cohort to clinical subtypes. Moreover, this methodology allows the detection of distinct patterns of abnormality without requiring a consistent pattern of deviation across individuals (Han et al., 2023b; Huo et al., 2025; Janssen et al., 2025; Lv et al., 2021; Segal et al., 2024, 2023). By doing so, NM addresses key limitations of traditional neuroimaging analysis methods, providing insight into whether a single individual deviates from the normative range, as well as the extent and spatial characteristics of that deviation. This marks a significant shift from group-level to subject-specific statistical analysis, enhancing the clinical utility of neuroimaging biomarkers. Indeed, quantitative neuroimaging biomarkers, such as DAT scans for Parkinson’s disease diagnosis and amyloid imaging as companion diagnostics for newly approved Alzheimer’s disease therapies, rely fundamentally on normative reference values (Klunk et al., 2015; Varrone et al., 2013). Without these benchmarks, their clinical application would not be feasible.
On the other hand, the estimation of NM faces many methodological challenges that hinder its applicability and portability across sites. Firstly, it is worth mentioning the general high computational demand required for the estimation of the NM for the reference cohort, especially in Bayesian methods, which necessitate running multiple chains of Markov Chain Monte Carlo (MCMC), and DL methods, where additional computing power from GPUs is mandatory. Additionally, the NM framework suffers from the need for big datasets for the estimation of the model. Despite the efforts to investigate the sensitivity of model performance to varying training sample sizes (Bozek et al., 2023), explicit, standardised, and comprehensive guidelines for defining the minimum sample size required to ensure reliable estimation of normative models are still lacking.
Generally, to increase the reference cohort size for NM estimation, it is common practice to combine data from multiple studies. However, this often introduces additional sources of variability due to differences in scanners, acquisition protocols, preprocessing pipelines, and inclusion criteria or different definitions of the “healthy” cohorts. The latter, in particular, represents a critical aspect as NM studies typically rely on matched controls from previous cross-sectional studies, where the controls are generally defined merely by the absence of the specific clinical condition of interest and are not necessarily healthy. It is therefore crucial to clearly define the inclusion criteria and, when possible, acquire ad hoc data to establish well-characterised reference cohorts. In general, the variability included by pooling data from different centres does not necessarily represent a limitation, as it increases the heterogeneity of the sample. However, it requires that the complexity of the study is increased by adding some sort of harmonization strategy, either in the model (i.e., hierarchical models) or as an additional preliminary step before modelling (e.g., with the Combat family of methods). Regardless of the specific model adopted, most of these studies on multi-site data included some sort of data harmonization or accounted for the site as a model predictor or random effect. In some cases, specific preprocessing steps for data standardization were adopted.
So far, most NM studies in neuroimaging have used Bayesian approaches, particularly GPR (Fraza et al., 2021), for model estimation. Bayesian approaches provide a probability distribution over the response variable; consequently, they directly allow both the prediction of the response variable, given a new input, and the estimation of the uncertainty of the prediction. They also allow the user to include any a priori information during model estimation. Among Bayesian approaches, GPR has proven particularly powerful as a flexible data-driven method allowing the mapping of different relationships (both linear and non-linear) between the response and covariates, without any a priori assumption on the shape of the regressing function. However, although suitable for smaller datasets (up to a few thousand participants), these approaches do not scale well to larger cohorts (Fraza et al., 2021; Rutherford et al., 2022b). A novel BLR approach with likelihood warping was specifically proposed to address major limitations of widely used GPR methods, namely the poor scalability to large datasets and model non-Gaussian predictive distributions (Fraza et al., 2021). Moreover, Xu et al. (Xu et al., 2021) argued that this type of model alone may not capture the full variability required for accurate normative model estimation.
Recently, DL has emerged as a powerful alternative for the application of NM in neuroimaging. In recent years, DL methods have been increasingly used across various neuroimaging tasks, supported by the growing availability of open datasets and advances in computational power. However, the number of studies applying DL specifically to NM remains relatively limited. DL offers several advantages in the NM context. As “black box” models, DL methods do not require prior assumptions about the underlying system or populations under study. Moreover, recent work has demonstrated the potential of DL to construct multimodal models that incorporate multiple neuroimaging modalities. For example, Kumar and colleagues proposed a multimodal DL-based NM framework combining sMRI and PET data to quantify deviations in Alzheimer’s disease patients (Kumar et al., 2023a). Despite their strong learning capacity, DL approaches face challenges, particularly regarding interpretability and generalizability. Unlike GPR, which may not scale efficiently with large training datasets, DL models can fully exploit large sample sizes. However, in some cases, these methods have underperformed compared to more traditional frequentist approaches in detecting abnormal brain structural patterns (Pinaya et al., 2021, 2019).
Despite methodological complexity and operative issues, NM has been successfully applied to the study of different anatomical, functional, and molecular neuroimaging markers across a wide range of psychiatric diseases (especially in the schizophrenia and psychosis spectrum), neurodevelopmental disorders, but also mood disorders, neurocognitive diseases, and others. This highlights the flexibility and disease-agnostic nature of this approach, reinforcing its potential as a powerful tool for advancing personalised medicine in brain disorders.
6. Conclusion
The NM framework has recently emerged as a pioneering approach in neuroimaging studies of brain disorders. This methodology overcomes the limitations of traditional population-level studies by enabling the detection of subject-level deviations from the normal condition, without requiring a shared pattern of abnormalities across multiple individuals. While future research should prioritise the development of well-defined normative cohorts tailored to different neuroimaging techniques, the rapid expansion of NM demonstrates that this approach is no longer confined to experimental medicine but is increasingly paving the way for the integration of quantitative neuroimaging into clinical practice.
Supplementary Materials
The following supporting information can be downloaded at the website of this paper posted on Preprints.org.
Author’s contributions
Lucia Maccioni, Alessio Giacomel, and Mattia Veronese designed the research. Lucia Maccioni, Alessio Giacomel, Marco Pinamonti, Mattia De Francisci, Federico Del Pup, Alice Giubergia, Giulia Vallini, Valentina Visani, and Manuela Moretto reviewed the literature. Lucia Maccioni and Alessio Giacomel realised the figures for the manuscript. Lucia Maccioni, Alessio Giacomel, and Mattia Veronese drafted the manuscript. All the authors critically revised the manuscript and approved the last version.
Acknowledgments
This research was funded by the Ministry of University and Research within the Complementary National Plan PNC-I.1, “Research initiatives for innovative technologies and pathways in the health and welfare sector, D.D. 931 of 06/06/2022, PNC0000002 DARE - Digital Lifelong Prevention CUP: B53C22006440001
Conflict of interest
Authors do not report any relevant conflict of interest.
References
- Alvarez, I., Parker, A.J., Bridge, H., 2019. Normative cerebral cortical thickness for human visual areas. NeuroImage 201, 116057. [CrossRef]
- Antoniades, M., Haas, S.S., Modabbernia, A., Bykowsky, O., Frangou, S., Borgwardt, S., Schmidt, A., 2021. Personalized Estimates of Brain Structural Variability in Individuals With Early Psychosis. Schizophrenia Bulletin 47, 1029–1038. [CrossRef]
- Baldwin, H., Radua, J., Antoniades, M., Haas, S.S., Frangou, S., Agartz, I., Allen, P., Andreassen, O.A., Atkinson, K., Bachman, P., Baeza, I., Bartholomeusz, C.F., Chee, M.W.L., Colibazzi, T., Cooper, R.E., Corcoran, C.M., Cropley, V.L., Ebdrup, B.H., Fortea, A., Glenthøj, L.B., Hamilton, H.K., Haut, K.M., Hayes, R.A., He, Y., Heekeren, K., Kaess, M., Kasai, K., Katagiri, N., Kim, M., Kindler, J., Klaunig, M.J., Koike, S., Koppel, A., Kristensen, T.D., Bin Kwak, Y., Kwon, J.S., Lawrie, S.M., Lebedeva, I., Lee, J., Lin, A., Loewy, R.L., Mathalon, D.H., Michel, C., Mizrahi, R., Møller, P., Nelson, B., Nemoto, T., Nordholm, D., Omelchenko, M.A., Pantelis, C., Raghava, J.M., Røssberg, J.I., Rössler, W., Salisbury, D.F., Sasabayashi, D., Schall, U., Smigielski, L., Sugranyes, G., Suzuki, M., Takahashi, T., Tamnes, C.K., Tang, J., Theodoridou, A., Thomopoulos, S.I., Tomyshev, A.S., Uhlhaas, P.J., Værnes, T.G., van Amelsvoort, T.A.M.J., Van Erp, T.G.M., Waltz, J.A., Westlye, L.T., Wood, S.J., Zhou, J.H., McGuire, P., Thompson, P.M., Jalbrzikowski, M., Hernaus, D., Fusar-Poli, P., 2022. Neuroanatomical heterogeneity and homogeneity in individuals at clinical high risk for psychosis. Transl Psychiatry 12, 1–11. [CrossRef]
- Baldwin, S.A., Larson, M.J., 2017. An introduction to using Bayesian linear regression with clinical data. Behaviour Research and Therapy 98, 58–75. [CrossRef]
- Bank, D., Koenigstein, N., Giryes, R., 2021. Autoencoders. [CrossRef]
- Barkema, P., Rutherford, S., Lee, H.-C., Kia, S.M., Savage, H., Beckmann, C., Marquand, A., 2023. Predictive Clinical Neuroscience Portal (PCNportal): instant online access to research-grade normative models for clinical neuroscientists. Wellcome Open Res 8, 326. [CrossRef]
- Bayer, J.M.M., Dinga, R., Kia, S.M., Kottaram, A.R., Wolfers, T., Lv, J., Zalesky, A., Schmaal, L., Marquand, A., 2021. Accommodating site variation in neuroimaging data using normative and hierarchical Bayesian models.
- Bayer, J.M.M., Thompson, P.M., Ching, C.R.K., Liu, M., Chen, A., Panzenhagen, A.C., Jahanshad, N., Marquand, A., Schmaal, L., Sämann, P.G., 2022. Site effects how-to and when: An overview of retrospective techniques to accommodate site effects in multi-site neuroimaging analyses. Front. Neurol. 13, 923988. [CrossRef]
- Bedford, S.A., Lai, M.-C., Lombardo, M.V., Chakrabarti, B., Ruigrok, A., Suckling, J., Anagnostou, E., Lerch, J.P., Taylor, M., Nicolson, R., Stelios, G., Crosbie, J., Schachar, R., Kelley, E., Jones, J., Arnold, P.D., Courchesne, E., Pierce, K., Eyler, L.T., Campbell, K., Barnes, C.C., Seidlitz, J., Alexander-Bloch, A.F., Bullmore, E.T., Baron-Cohen, S., Bethlehem, R.A.I., Bailey, A.J., Baron-Cohen, S., Bolton, P.F., Bullmore, E.T., Carrington, S., Catani, M., Chakrabarti, B., Craig, M.C., Daly, E.M., Deoni, S.C.L., Ecker, C., Happé, F., Henty, J., Jezzard, P., Johnston, P., Jones, D.K., Lai, M.-C., Lombardo, M.V., Madden, A., Mullins, D., Murphy, C.M., Murphy, D.G.M., Pasco, G., Ruigrok, A.N.V., Sadek, S.A., Spain, D., Stewart, R., Suckling, J., Wheelwright, S.J., Williams, S.C., 2024. Brain-Charting Autism and Attention-Deficit/Hyperactivity Disorder Reveals Distinct and Overlapping Neurobiology. Biological Psychiatry 0. [CrossRef]
- Berthet, P., Haatveit, B.C., Kjelkenes, R., Worker, A., Kia, S.M., Wolfers, T., Rutherford, S., Alnaes, D., Dinga, R., Pedersen, M.L., Dahl, A., Fernandez-Cabello, S., Dazzan, P., Agartz, I., Nesvåg, R., Ueland, T., Andreassen, O.A., Simonsen, C., Westlye, L.T., Melle, I., Marquand, A., 2024. A 10-Year Longitudinal Study of Brain Cortical Thickness in People with First-Episode Psychosis Using Normative Models. Schizophr Bull 51, 95–107. [CrossRef]
- Bethlehem, R. a. I., Seidlitz, J., White, S.R., Vogel, J.W., Anderson, K.M., Adamson, C., Adler, S., Alexopoulos, G.S., Anagnostou, E., Areces-Gonzalez, A., Astle, D.E., Auyeung, B., Ayub, M., Bae, J., Ball, G., Baron-Cohen, S., Beare, R., Bedford, S.A., Benegal, V., Beyer, F., Blangero, J., Blesa Cábez, M., Boardman, J.P., Borzage, M., Bosch-Bayard, J.F., Bourke, N., Calhoun, V.D., Chakravarty, M.M., Chen, C., Chertavian, C., Chetelat, G., Chong, Y.S., Cole, J.H., Corvin, A., Costantino, M., Courchesne, E., Crivello, F., Cropley, V.L., Crosbie, J., Crossley, N., Delarue, M., Delorme, R., Desrivieres, S., Devenyi, G.A., Di Biase, M.A., Dolan, R., Donald, K.A., Donohoe, G., Dunlop, K., Edwards, A.D., Elison, J.T., Ellis, C.T., Elman, J.A., Eyler, L., Fair, D.A., Feczko, E., Fletcher, P.C., Fonagy, P., Franz, C.E., Galan-Garcia, L., Gholipour, A., Giedd, J., Gilmore, J.H., Glahn, D.C., Goodyer, I.M., Grant, P.E., Groenewold, N.A., Gunning, F.M., Gur, R.E., Gur, R.C., Hammill, C.F., Hansson, O., Hedden, T., Heinz, A., Henson, R.N., Heuer, K., Hoare, J., Holla, B., Holmes, A.J., Holt, R., Huang, H., Im, K., Ipser, J., Jack, C.R., Jackowski, A.P., Jia, T., Johnson, K.A., Jones, P.B., Jones, D.T., Kahn, R.S., Karlsson, H., Karlsson, L., Kawashima, R., Kelley, E.A., Kern, S., Kim, K.W., Kitzbichler, M.G., Kremen, W.S., Lalonde, F., Landeau, B., Lee, S., Lerch, J., Lewis, J.D., Li, J., Liao, W., Liston, C., Lombardo, M.V., Lv, J., Lynch, C., Mallard, T.T., Marcelis, M., Markello, R.D., Mathias, S.R., Mazoyer, B., McGuire, P., Meaney, M.J., Mechelli, A., Medic, N., Misic, B., Morgan, S.E., Mothersill, D., Nigg, J., Ong, M.Q.W., Ortinau, C., Ossenkoppele, R., Ouyang, M., Palaniyappan, L., Paly, L., Pan, P.M., Pantelis, C., Park, M.M., Paus, T., Pausova, Z., Paz-Linares, D., Pichet Binette, A., Pierce, K., Qian, X., Qiu, J., Qiu, A., Raznahan, A., Rittman, T., Rodrigue, A., Rollins, C.K., Romero-Garcia, R., Ronan, L., Rosenberg, M.D., Rowitch, D.H., Salum, G.A., Satterthwaite, T.D., Schaare, H.L., Schachar, R.J., Schultz, A.P., Schumann, G., Schöll, M., Sharp, D., Shinohara, R.T., Skoog, I., Smyser, C.D., Sperling, R.A., Stein, D.J., Stolicyn, A., Suckling, J., Sullivan, G., Taki, Y., Thyreau, B., Toro, R., Traut, N., Tsvetanov, K.A., Turk-Browne, N.B., Tuulari, J.J., Tzourio, C., Vachon-Presseau, É., Valdes-Sosa, M.J., Valdes-Sosa, P.A., Valk, S.L., van Amelsvoort, T., Vandekar, S.N., Vasung, L., Victoria, L.W., Villeneuve, S., Villringer, A., Vértes, P.E., Wagstyl, K., Wang, Y.S., Warfield, S.K., Warrier, V., Westman, E., Westwater, M.L., Whalley, H.C., Witte, A.V., Yang, N., Yeo, B., Yun, H., Zalesky, A., Zar, H.J., Zettergren, A., Zhou, J.H., Ziauddeen, H., Zugman, A., Zuo, X.N., Bullmore, E.T., Alexander-Bloch, A.F., 2022. Brain charts for the human lifespan. Nature 604, 525–533. [CrossRef]
- Bethlehem, R.A.I., Seidlitz, J., Romero-Garcia, R., Dumas, G., Lombardo, M.V., 2019. Normative age modelling of cortical thickness in autistic males. [CrossRef]
- Bhome, R., Verdi, S., Martin, S.A., Hannaway, N., Dobreva, I., Oxtoby, N.P., Castro Leal, G., Rutherford, S., Marquand, A.F., Weil, R.S., Cole, J.H., 2024. A neuroimaging measure to capture heterogeneous patterns of atrophy in Parkinson’s disease and dementia with Lewy bodies. NeuroImage: Clinical 42, 103596. [CrossRef]
- Bigler, E.D., 1994. Neuroimaging and Neuropsychological Assessment, in: Reynolds, C.R. (Ed.), Cognitive Assessment: A Multidisciplinary Perspective. Springer US, Boston, MA, pp. 1–34. [CrossRef]
- Blok, E., Geenjaar, E.P.T., Geenjaar, E.A.W., Calhoun, V.D., White, T., 2022. Neurodevelopmental Trajectories in Children With Internalizing, Externalizing and Emotion Dysregulation Symptoms. Front. Psychiatry 13, 846201. [CrossRef]
- Bozek, J., Griffanti, L., Lau, S., Jenkinson, M., 2023. Normative models for neuroimaging markers: Impact of model selection, sample size and evaluation criteria. NeuroImage 268, 119864. [CrossRef]
- Brammer, M., 2009. The role of neuroimaging in diagnosis and personalized medicine--current position and likely future directions. Dialogues Clin Neurosci 11, 389–396. [CrossRef]
- Bremner, J.D., 2005. Brain imaging handbook, Brain imaging handbook. W W Norton & Co, New York, NY, US.
- Chen, C.-L., Hwang, T., Tung, Y.-H., Yang, L.-Y., Hsu, Y.-C., Liu, C., Lin, Y.-T., Hsieh, M.-H., Liu, C.-C., Chien, Y.-L., Hwu, H., Tseng, W.-Y.I., 2022a. Detection of advanced brain aging in schizophrenia and its structural underpinning by using normative brain age metrics. Neuroimage Clin 34, 103003. [CrossRef]
- Chen, C.-L., Kuo, M.-C., Wu, W.-C., Hsu, Y.-C., Wu, R.-M., Tseng, W.-Y.I., 2022b. Advanced brain aging in multiple system atrophy compared to Parkinson’s disease. NeuroImage: Clinical 34, 102997. [CrossRef]
- Cole, J.H., Franke, K., 2017. Predicting Age Using Neuroimaging: Innovative Brain Ageing Biomarkers. Trends Neurosci 40, 681–690. [CrossRef]
- Cole, T.J., 2012. The development of growth references and growth charts. Annals of Human Biology 39, 382–394. [CrossRef]
- Corrigan, N.M., Rokem, A., Kuhl, P.K., 2024. COVID-19 lockdown effects on adolescent brain structure suggest accelerated maturation that is more pronounced in females than in males. Proceedings of the National Academy of Sciences 121, e2403200121. [CrossRef]
- Cotter, J., 2006. Extreme Value Estimation of Boom and Crash Statistics. The European Journal of Finance 12, 553–566. [CrossRef]
- Coupé, P., Manjón, J.V., Mansencal, B., Tourdias, T., Catheline, G., Planche, V., 2022. Hippocampal-amygdalo-ventricular atrophy score: Alzheimer disease detection using normative and pathological lifespan models. Hum Brain Mapp 43, 3270–3282. [CrossRef]
- Cromb, D., Wilson, S., Bonthrone, A.F., Chew, A., Kelly, C., Kumar, M., Cawley, P., Dimitrova, R., Arichi, T., Tournier, J.D., Pushparajah, K., Simpson, J., Rutherford, M., Hajnal, J.V., Edwards, A.D., Nosarti, C., O’Muircheartaigh, J., Counsell, S.J., 2024. Individualized cortical gyrification in neonates with congenital heart disease. Brain Commun 6, fcae356. [CrossRef]
- Cropley, V.L., Tian, Y., Fernando, K., Mansour L, S., Pantelis, C., Cocchi, L., Zalesky, A., 2021. Brain-Predicted Age Associates With Psychopathology Dimensions in Youths. Biol Psychiatry Cogn Neurosci Neuroimaging 6, 410–419. [CrossRef]
- D’Ambrosio, E., Pergola, G., Pardiñas, A.F., Dahoun, T., Veronese, M., Sportelli, L., Taurisano, P., Griffiths, K., Jauhar, S., Rogdaki, M., Bloomfield, M.A.P., Froudist-Walsh, S., Bonoldi, I., Walters, J.T.R., Blasi, G., Bertolino, A., Howes, O.D., 2022. A polygenic score indexing a DRD2-related co-expression network is associated with striatal dopamine function. Scientific reports 12, 12610. [CrossRef]
- Di Biase, M.A., Tian, Y.E., Bethlehem, R.A.I., Seidlitz, J., Alexander-Bloch, A.F., Yeo, B.T.T., Zalesky, A., 2023. Mapping human brain charts cross-sectionally and longitudinally. Proc Natl Acad Sci U S A 120, e2216798120. [CrossRef]
- Dimitrova, R., Arulkumaran, S., Carney, O., Chew, A., Falconer, S., Ciarrusta, J., Wolfers, T., Batalle, D., Cordero-Grande, L., Price, A.N., Teixeira, R.P.A.G., Hughes, E., Egloff, A., Hutter, J., Makropoulos, A., Robinson, E.C., Schuh, A., Vecchiato, K., Steinweg, J.K., Macleod, R., Marquand, A.F., McAlonan, G., Rutherford, M.A., Counsell, S.J., Smith, S.M., Rueckert, D., Hajnal, J.V., O’Muircheartaigh, J., Edwards, A.D., 2021. Phenotyping the Preterm Brain: Characterizing Individual Deviations From Normative Volumetric Development in Two Large Infant Cohorts. Cerebral Cortex 31, 3665–3677. [CrossRef]
- Dinga, R., Fraza, C.J., Bayer, J.M.M., Kia, S.M., Beckmann, C.F., Marquand, A.F., 2021. Normative modeling of neuroimaging data using generalized additive models of location scale and shape (preprint). Neuroscience. [CrossRef]
- Dipasquale, O., Selvaggi, P., Veronese, M., Gabay, A.S., Turkheimer, F., Mehta, M.A., 2019. Receptor-Enriched Analysis of functional connectivity by targets (REACT): A novel, multimodal analytical approach informed by PET to study the pharmacodynamic response of the brain under MDMA. Neuroimage 195, 252–260. [CrossRef]
- Doucet, G.E., Glahn, D.C., Frangou, S., 2020. Person-based similarity in brain structure and functional connectivity in bipolar disorder. J Affect Disord 276, 38–44. [CrossRef]
- Duan, X., Shan, X., Uddin, L.Q., Chen, H., 2024. The Future of Disentangling the Heterogeneity of Autism With Neuroimaging Studies. Biological Psychiatry S0006322324015361. [CrossRef]
- Elad, D., Cetin-Karayumak, S., Zhang, F., Cho, K.I.K., Lyall, A.E., Seitz-Holland, J., Ben-Ari, R., Pearlson, G.D., Tamminga, C.A., Sweeney, J.A., Clementz, B.A., Schretlen, D.J., Viher, P.V., Stegmayer, K., Walther, S., Lee, J., Crow, T.J., James, A., Voineskos, A.N., Buchanan, R.W., Szeszko, P.R., Malhotra, A.K., Keshavan, M.S., Shenton, M.E., Rathi, Y., Bouix, S., Sochen, N., Kubicki, M.R., Pasternak, O., 2021. Improving the predictive potential of diffusion MRI in schizophrenia using normative models—Towards subject-level classification. Human Brain Mapping 42, 4658–4670. [CrossRef]
- ENIGMA Clinical High Risk for Psychosis Working Group, Haas, S.S., Ge, R., Agartz, I., Amminger, G.P., Andreassen, O.A., Bachman, P., Baeza, I., Choi, S., Colibazzi, T., Cropley, V.L., de la Fuente-Sandoval, C., Ebdrup, B.H., Fortea, A., Fusar-Poli, P., Glenthøj, B.Y., Glenthøj, L.B., Haut, K.M., Hayes, R.A., Heekeren, K., Hooker, C.I., Hwang, W.J., Jahanshad, N., Kaess, M., Kasai, K., Katagiri, N., Kim, M., Kindler, J., Koike, S., Kristensen, T.D., Kwon, J.S., Lawrie, S.M., Lebedeva, I., Lee, J., Lemmers-Jansen, I.L.J., Lin, A., Ma, X., Mathalon, D.H., McGuire, P., Michel, C., Mizrahi, R., Mizuno, M., Møller, P., Mora-Durán, R., Nelson, B., Nemoto, T., Nordentoft, M., Nordholm, D., Omelchenko, M.A., Pantelis, C., Pariente, J.C., Raghava, J.M., Reyes-Madrigal, F., Røssberg, J.I., Rössler, W., Salisbury, D.F., Sasabayashi, D., Schall, U., Smigielski, L., Sugranyes, G., Suzuki, M., Takahashi, T., Tamnes, C.K., Theodoridou, A., Thomopoulos, S.I., Thompson, P.M., Tomyshev, A.S., Uhlhaas, P.J., Værnes, T.G., van Amelsvoort, T.A.M.J., van Erp, T.G.M., Waltz, J.A., Wenneberg, C., Westlye, L.T., Wood, S.J., Zhou, J.H., Hernaus, D., Jalbrzikowski, M., Kahn, R.S., Corcoran, C.M., Frangou, S., 2024. Normative Modeling of Brain Morphometry in Clinical High Risk for Psychosis. JAMA Psychiatry 81, 77–88. [CrossRef]
- Erus, G., Battapady, H., Satterthwaite, T.D., Hakonarson, H., Gur, R.E., Davatzikos, C., Gur, R.C., 2015. Imaging Patterns of Brain Development and their Relationship to Cognition. Cerebral Cortex 25, 1676–1684. [CrossRef]
- Fang, K., Hou, Y., Niu, L., Han, S., Zhang, W., 2024. Individualized gray matter morphological abnormalities uncover two robust transdiagnostic biotypes. Journal of Affective Disorders 365, 193–204. [CrossRef]
- Feng, Y., Chandio, B.Q., Villalon-Reina, J.E., Benavidez, S., Chattopadhyay, T., Chehrzadeh, S., Laltoo, E., Thomopoulos, S.I., Joshi, H., Venkatasubramanian, G., John, J.P., Jahanshad, N., Thompson, P.M., 2024a. Deep Normative Tractometry for Identifying Joint White Matter Macro- and Micro-structural Abnormalities in Alzheimer’s Disease. bioRxiv 2024.02.05.578943. [CrossRef]
- Feng, Y., Chandio, B.Q., Villalon-Reina, J.E., Thomopoulos, S.I., Nir, T.M., Benavidez, S., Laltoo, E., Chattopadhyay, T., Joshi, H., Venkatasubramanian, G., John, J.P., Jahanshad, N., Reid, R.I., Jack, C.R., Weiner, M.W., Thompson, P.M., Alzheimers Disease Neuroimaging Initiative, 2024b. Microstructural Mapping of Neural Pathways in Alzheimer’s Disease using Macrostructure-Informed Normative Tractometry. bioRxiv 2024.04.25.591183. [CrossRef]
- Floris, D., Llera, A., Zabihi, M., Jones, E., Mason, L., Haartsen, R., Holz, N., Mei, T., Elleaume, C., Hebling Vieira, B., Pretzsch, C., Forde, N., Baumeister, S., Dell’Acqua, F., Durston, S., Banaschewski, T., Ecker, C., Holt, R., Baron-Cohen, S., Langer, N., 2024. A multimodal neural signature of face processing in autism within the fusiform gyrus. [CrossRef]
- Floris, D.L., Wolfers, T., Zabihi, M., Holz, N.E., Zwiers, M.P., Charman, T., Tillmann, J., Ecker, C., Dell’Acqua, F., Banaschewski, T., Moessnang, C., Baron-Cohen, S., Holt, R., Durston, S., Loth, E., Murphy, D.G.M., Marquand, A., Buitelaar, J.K., Beckmann, C.F., Ahmad, J., Ambrosino, S., Auyeung, B., Banaschewski, T., Baron-Cohen, S., Baumeister, S., Beckmann, C.F., Bölte, S., Bourgeron, T., Bours, C., Brammer, M., Brandeis, D., Brogna, C., De Bruijn, Y., Buitelaar, J.K., Chakrabarti, B., Charman, T., Cornelissen, I., Crawley, D., Dell’Acqua, F., Dumas, G., Durston, S., Ecker, C., Faulkner, J., Frouin, V., Garcés, P., Goyard, D., Ham, L., Hayward, H., Hipp, J., Holt, R., Johnson, M.H., Jones, E.J.H., Kundu, P., Lai, M.-C., Liogier d’Ardhuy, X., Lombardo, M.V., Loth, E., Lythgoe, D.J., Mandl, R., Marquand, A., Mason, L., Mennes, M., Meyer-Lindenberg, A., Moessnang, C., Mueller, N., Murphy, D.G.M., Oakley, B., O’Dwyer, L., Oldehinkel, M., Oranje, B., Pandina, G., Persico, A.M., Ruggeri, B., Ruigrok, A., Sabet, J., Sacco, R., San José Cáceres, A., Simonoff, E., Spooren, W., Tillmann, J., Toro, R., Tost, H., Waldman, J., Williams, S.C.R., Wooldridge, C., Zwiers, M.P., 2021. Atypical Brain Asymmetry in Autism—A Candidate for Clinically Meaningful Stratification. Biological Psychiatry: Cognitive Neuroscience and Neuroimaging 6, 802–812. [CrossRef]
- Fortin, J.-P., Cullen, N., Sheline, Y.I., Taylor, W.D., Aselcioglu, I., Cook, P.A., Adams, P., Cooper, C., Fava, M., McGrath, P.J., McInnis, M., Phillips, M.L., Trivedi, M.H., Weissman, M.M., Shinohara, R.T., 2018. Harmonization of cortical thickness measurements across scanners and sites. Neuroimage 167, 104–120. [CrossRef]
- Fraza, C., Zabihi, M., Beckmann, C.F., Marquand, A.F., 2022. The Extremes of Normative Modelling. [CrossRef]
- Fraza, C.J., Dinga, R., Beckmann, C.F., Marquand, A.F., 2021. Warped Bayesian linear regression for normative modelling of big data. Neuroimage 245, 118715. [CrossRef]
- Frisoni, G.B., Prestia, A., Zanetti, O., Galluzzi, S., Romano, M., Cotelli, M., Gennarelli, M., Binetti, G., Bocchio, L., Paghera, B., Amicucci, G., Bonetti, M., Benussi, L., Ghidoni, R., Geroldi, C., 2009. Markers of Alzheimer’s disease in a population attending a memory clinic. Alzheimer’s & Dementia 5, 307–317. [CrossRef]
- Fukami-Gartner, A., Baburamani, A.A., Dimitrova, R., Patkee, P.A., Ojinaga-Alfageme, O., Bonthrone, A.F., Cromb, D., Uus, A.U., Counsell, S.J., Hajnal, J.V., O’Muircheartaigh, J., Rutherford, M.A., 2023. Comprehensive volumetric phenotyping of the neonatal brain in Down syndrome. Cereb Cortex 33, 8921–8941. [CrossRef]
- Gage, A.T., Stone, J.R., Wilde, E.A., McCauley, S.R., Welsh, R.C., Mugler, J.P., Tustison, N., Avants, B., Whitlow, C.T., Lancashire, L., Bhatt, S.D., Haas, M., 2024. Normative Neuroimaging Library: Designing a Comprehensive and Demographically Diverse Dataset of Healthy Controls to Support Traumatic Brain Injury Diagnostic and Therapeutic Development. J Neurotrauma 41, 2497–2512. [CrossRef]
- Gaiser, C., Berthet, P., Kia, S.M., Frens, M.A., Beckmann, C.F., Muetzel, R.L., Marquand, A.F., 2024. Estimating cortical thickness trajectories in children across different scanners using transfer learning from normative models. Hum Brain Mapp 45, e26565. [CrossRef]
- García-San-Martín, N., Bethlehem, R.A.I., Mihalik, A., Seidlitz, J., Sebenius, I., Alemán-Morillo, C., Dorfschmidt, L., Shafiei, G., Ortiz-García de la Foz, V., Merritt, K., David, A., Morgan, S.E., Ruiz-Veguilla, M., Ayesa-Arriola, R., Vázquez-Bourgon, J., Alexander-Bloch, A., Misic, B., Bullmore, E.T., Suckling, J., Crespo-Facorro, B., Romero-García, R., 2024. Molecular and micro-architectural mapping of gray matter alterations in psychosis. Mol Psychiatry 30, 1287–1296. [CrossRef]
- Ge, R., Yu, Y., Qi, Y.X., Fan, Y., Chen, S., Gao, C., Haas, S.S., New, F., Boomsma, D.I., Brodaty, H., Brouwer, R.M., Buckner, R., Caseras, X., Crivello, F., Crone, E.A., Erk, S., Fisher, S.E., Franke, B., Glahn, D.C., Dannlowski, U., Grotegerd, D., Gruber, O., Hulshoff Pol, H.E., Schumann, G., Tamnes, C.K., Walter, H., Wierenga, L.M., Jahanshad, N., Thompson, P.M., Frangou, S., Agartz, I., Asherson, P., Ayesa-Arriola, R., Banaj, N., Banaschewski, T., Baumeister, S., Bertolino, A., Borgwardt, S., Bourque, J., Brandeis, D., Breier, A., Buitelaar, J.K., Cannon, D.M., Cervenka, S., Conrod, P.J., Crespo-Facorro, B., Davey, C.G., De Haan, L., De Zubicaray, G.I., Di Giorgio, A., Frodl, T., Gruner, P., Gur, R.E., Gur, R.C., Harrison, B.J., Hatton, S.N., Hickie, I., Howells, F.M., Huyser, C., Jernigan, T.L., Jiang, J., Joska, J.A., Kahn, R.S., Kalnin, A.J., Kochan, N.A., Koops, S., Kuntsi, J., Lagopoulos, J., Lazaro, L., Lebedeva, I.S., Lochner, C., Martin, N.G., Mazoyer, B., McDonald, B.C., McDonald, C., McMahon, K.L., Medland, S., Modabbernia, A., Mwangi, B., Nakao, T., Nyberg, L., Piras, F., Portella, M.J., Qiu, J., Roffman, J.L., Sachdev, P.S., Sanford, N., Satterthwaite, T.D., Saykin, A.J., Sellgren, C.M., Sim, K., Smoller, J.W., Soares, J.C., Sommer, I.E., Spalletta, G., Stein, D.J., Thomopoulos, S.I., Tomyshev, A.S., Tordesillas-Gutiérrez, D., Trollor, J.N., Van ’T Ent, D., Van Den Heuvel, O.A., Van Erp, T.G., Van Haren, N.E., Vecchio, D., Veltman, D.J., Wang, Y., Weber, B., Wei, D., Wen, W., Westlye, L.T., Williams, S.C., Wright, M.J., Wu, M.-J., Yu, K., 2024a. Normative modelling of brain morphometry across the lifespan with CentileBrain: algorithm benchmarking and model optimisation. The Lancet Digital Health 6, e211–e221. [CrossRef]
- Ge, R., Yu, Y., Qi, Y.X., Fan, Y.-N., Chen, S., Gao, C., Haas, S.S., New, F., Boomsma, D.I., Brodaty, H., Brouwer, R.M., Buckner, R., Caseras, X., Crivello, F., Crone, E.A., Erk, S., Fisher, S.E., Franke, B., Glahn, D.C., Dannlowski, U., Grotegerd, D., Gruber, O., Hulshoff Pol, H.E., Schumann, G., Tamnes, C.K., Walter, H., Wierenga, L.M., Jahanshad, N., Thompson, P.M., Frangou, S., ENIGMA Lifespan Working Group, 2024b. Normative modelling of brain morphometry across the lifespan with CentileBrain: algorithm benchmarking and model optimisation. Lancet Digit Health 6, e211–e221. [CrossRef]
- Giacomel, A., Martins, D., Nordio, G., Easmin, R., Howes, O., Selvaggi, P., Williams, S.C.R., Turkheimer, F., De Groot, M., Dipasquale, O., Veronese, M., 2025. Investigating dopaminergic abnormalities in schizophrenia and first-episode psychosis with normative modelling and multisite molecular neuroimaging. Mol Psychiatry. [CrossRef]
- Ginsburg, G.S., Phillips, K.A., 2018. Precision Medicine: From Science To Value. Health Aff (Millwood) 37, 694–701. [CrossRef]
- Gomes, M.I., Guillou, A., 2015. Extreme Value Theory and Statistics of Univariate Extremes: A Review. International Statistical Review / Revue Internationale de Statistique 83, 263–292.
- Gorgolewski, K.J., Auer, T., Calhoun, V.D., Craddock, R.C., Das, S., Duff, E.P., Flandin, G., Ghosh, S.S., Glatard, T., Halchenko, Y.O., Handwerker, D.A., Hanke, M., Keator, D., Li, X., Michael, Z., Maumet, C., Nichols, B.N., Nichols, T.E., Pellman, J., Poline, J.-B., Rokem, A., Schaefer, G., Sochat, V., Triplett, W., Turner, J.A., Varoquaux, G., Poldrack, R.A., 2016. The brain imaging data structure, a format for organizing and describing outputs of neuroimaging experiments. Sci Data 3, 160044. [CrossRef]
- Guedj, E., Varrone, A., Boellaard, R., Albert, N.L., Barthel, H., van Berckel, B., Brendel, M., Cecchin, D., Ekmekcioglu, O., Garibotto, V., Lammertsma, A.A., Law, I., Peñuelas, I., Semah, F., Traub-Weidinger, T., van de Giessen, E., Van Weehaeghe, D., Morbelli, S., 2022. EANM procedure guidelines for brain PET imaging using [18F]FDG, version 3. Eur J Nucl Med Mol Imaging 49, 632–651. [CrossRef]
- Gunn, R.N., Slifstein, M., Searle, G.E., Price, J.C., 2015. Quantitative imaging of protein targets in the human brain with PET. Phys Med Biol 60, R363-411. [CrossRef]
- Guo, B., Chen, Y., Lin, J., Huang, B., Bai, Xiangzhuo, Guo, C., Gao, B., Gong, Q., Bai, Xiangzhi, 2024. Self-supervised learning for accurately modelling hierarchical evolutionary patterns of cerebrovasculature. Nat Commun 15, 9235. [CrossRef]
- Hamdi, Y., Haigh, I.D., Parey, S., Wahl, T., 2021. Preface: Advances in extreme value analysis and application to natural hazards. Natural Hazards and Earth System Sciences 21, 1461–1465. [CrossRef]
- Han, S., Cui, Q., Zheng, R., Li, S., Zhou, B., Fang, K., Sheng, W., Wen, B., Liu, L., Wei, Y., Chen, H., Chen, Y., Cheng, J., Zhang, Y., 2023a. Parsing altered gray matter morphology of depression using a framework integrating the normative model and non-negative matrix factorization. Nat Commun 14, 4053. [CrossRef]
- Han, S., Fang, K., Zheng, R., Li, S., Zhou, B., Sheng, W., Wen, B., Liu, L., Wei, Y., Chen, Y., Chen, H., Cui, Q., Cheng, J., Zhang, Y., 2024. Gray matter atrophy is constrained by normal structural brain network architecture in depression. Psychol Med 54, 1318–1328. [CrossRef]
- Han, S., Xu, Y., Fang, K., Guo, H.-R., Wei, Y., Liu, L., Wen, B., Liu, H., Zhang, Y., Cheng, J., 2023b. Mapping the neuroanatomical heterogeneity of OCD using a framework integrating normative model and non-negative matrix factorization. Cereb Cortex 33, 8667–8678. [CrossRef]
- Harnett, N.G., Fani, N., Rowland, G., Kumar, P., Rutherford, S., Nickerson, L.D., 2024. Population-level normative models reveal race- and socioeconomic-related variability in cortical thickness of threat neurocircuitry. Commun Biol 7, 745. [CrossRef]
- Harvey, A., Dumas, G., 2022. PyNM: a Lightweight Python implementation of Normative Modeling. Journal of Open Source Software 7, 4321. [CrossRef]
- Holdgraf, C., Appelhoff, S., Bickel, S., Bouchard, K., D’Ambrosio, S., David, O., Devinsky, O., Dichter, B., Flinker, A., Foster, B.L., Gorgolewski, K.J., Groen, I., Groppe, D., Gunduz, A., Hamilton, L., Honey, C.J., Jas, M., Knight, R., Lachaux, J., Lau, J.C., Lee-Messer, C., Lundstrom, B.N., Miller, K.J., Ojemann, J.G., Oostenveld, R., Petridou, N., Piantoni, G., Pigorini, A., Pouratian, N., Ramsey, N.F., Stolk, A., Swann, N.C., Tadel, F., Voytek, B., Wandell, B.A., Winawer, J., Whitaker, K., Zehl, L., Hermes, D., 2019. iEEG-BIDS, extending the Brain Imaging Data Structure specification to human intracranial electrophysiology. [CrossRef]
- Huizinga, W., Poot, D.H.J., Vernooij, M.W., Roshchupkin, G.V., Bron, E.E., Ikram, M.A., Rueckert, D., Niessen, W.J., Klein, S., 2018. A spatio-temporal reference model of the aging brain. NeuroImage 169, 11–22. [CrossRef]
- Huo, Y., Jing, R., Li, P., Chen, P., Si, J., Liu, G., Liu, Y., 2025. Delineating the Heterogeneity of Alzheimer’s Disease and Mild Cognitive Impairment Using Normative Models of Dynamic Brain Functional Networks. Biological Psychiatry, Cortical Connectivity in Alzheimer’s Disease 97, 1034–1044. [CrossRef]
- Janahi, M., Aksman, L., Schott, J.M., Mokrab, Y., Altmann, A., Alzheimer’s Disease Neuroimaging Initiative, 2022. Nomograms of human hippocampal volume shifted by polygenic scores. Elife 11, e78232. [CrossRef]
- Janssen, J., Díaz-Caneja, C.M., Alloza, C., Schippers, A., De Hoyos, L., Santonja, J., Gordaliza, P.M., Buimer, E.E.L., Van Haren, N.E.M., Cahn, W., Arango, C., Kahn, R.S., Hulshoff Pol, H.E., Schnack, H.G., 2021. Dissimilarity in Sulcal Width Patterns in the Cortex can be Used to Identify Patients With Schizophrenia With Extreme Deficits in Cognitive Performance. Schizophrenia Bulletin 47, 552–561. [CrossRef]
- Janssen, J., Guil Gallego, A., Díaz-Caneja, C.M., Gonzalez Lois, N., Janssen, N., González-Peñas, J., Macias Gordaliza, P., Buimer, E., van Haren, N., Arango, C., Kahn, R., Pol, H.E.H., Schnack, H.G., 2025. Heterogeneity of morphometric similarity networks in health and schizophrenia. Schizophr 11, 70. [CrossRef]
- Ji, G.-J., Zalesky, A., Wang, Y., He, K., Wang, L., Du, R., Sun, J., Bai, T., Chen, X., Tian, Y., Zhu, C., Wang, K., 2023. Linking Personalized Brain Atrophy to Schizophrenia Network and Treatment Response. Schizophr Bull 49, 43–52. [CrossRef]
- Jiang, A., Ma, X., Li, S., Wang, L., Yang, B., Wang, S., Li, M., Dong, G., 2024. Age-atypical brain functional networks in autism spectrum disorder: a normative modeling approach. Psychol Med 54, 2042–2053. [CrossRef]
- Jiang, J., Zhou, H., Duan, H., Liu, X., Zuo, C., Huang, Z., Yu, Z., Yan, Z., 2017. A novel individual-level morphological brain networks constructing method and its evaluation in PET and MR images. Heliyon 3, e00475. [CrossRef]
- Jing, R., Lin, X., Ding, Z., Chang, S., Shi, L., Liu, L., Wang, Q., Si, J., Yu, M., Zhuo, C., Shi, J., Li, P., Fan, Y., Lu, L., 2023. Heterogeneous brain dynamic functional connectivity patterns in first-episode drug-naive patients with major depressive disorder. Hum Brain Mapp 44, 3112–3122. [CrossRef]
- Jirsa, V.K., McIntosh, A. (Eds.), 2007. Handbook of Brain Connectivity, Understanding Complex Systems. Springer, Berlin, Heidelberg. [CrossRef]
- Kapur, S., Phillips, A.G., Insel, T.R., 2012. Why has it taken so long for biological psychiatry to develop clinical tests and what to do about it? Mol Psychiatry 17, 1174–1179. [CrossRef]
- Kasper, J., Caspers, S., Lotter, L.D., Hoffstaedter, F., Eickhoff, S.B., Dukart, J., 2024. Resting-State Changes in Aging and Parkinson’s Disease Are Shaped by Underlying Neurotransmission: A Normative Modeling Study. Biological Psychiatry: Cognitive Neuroscience and Neuroimaging 9, 986–997. [CrossRef]
- Kia, S.M., Huijsdens, H., Dinga, R., Wolfers, T., Mennes, M., Andreassen, O.A., Westlye, L.T., Beckmann, C.F., Marquand, A.F., 2020. Hierarchical Bayesian Regression for Multi-Site Normative Modeling of Neuroimaging Data.
- Kia, S.M., Huijsdens, H., Rutherford, S., De Boer, A., Dinga, R., Wolfers, T., Berthet, P., Mennes, M., Andreassen, O.A., Westlye, L.T., Beckmann, C.F., Marquand, A.F., 2022. Closing the life-cycle of normative modeling using federated hierarchical Bayesian regression. PLoS ONE 17, e0278776. [CrossRef]
- Kia, S.M., Marquand, A., 2018. Normative Modeling of Neuroimaging Data Using Scalable Multi-task Gaussian Processes, in: Frangi, A.F., Schnabel, J.A., Davatzikos, C., Alberola-López, C., Fichtinger, G. (Eds.), Medical Image Computing and Computer Assisted Intervention – MICCAI 2018. Springer International Publishing, Cham, pp. 127–135. [CrossRef]
- Klunk, W.E., Koeppe, R.A., Price, J.C., Benzinger, T.L., Devous, M.D., Jagust, W.J., Johnson, K.A., Mathis, C.A., Minhas, D., Pontecorvo, M.J., Rowe, C.C., Skovronsky, D.M., Mintun, M.A., 2015. The Centiloid Project: Standardizing quantitative amyloid plaque estimation by PET. Alzheimer’s & Dementia 11, 1-15.e4. [CrossRef]
- Koenker, R., Hallock, K.F., 2001. Quantile Regression. Journal of Economic Perspectives 15, 143–156. [CrossRef]
- Kumar, S., Earnest, T., Yang, B., Kothapalli, D., Aschenbrenner, A.J., Hassenstab, J., Xiong, C., Ances, B., Morris, J., Benzinger, T.L.S., Gordon, B.A., Payne, P., Sotiras, A., Alzheimer’s Disease Neuroimaging Initiative, 2024. Analyzing heterogeneity in Alzheimer Disease using multimodal normative modeling on imaging-based ATN biomarkers. bioRxiv 2023.08.15.553412. [CrossRef]
- Kumar, S., Payne, P., Sotiras, A., 2023a. Improving Normative Modeling for Multi-modal Neuroimaging Data using mixture-of-product-of-experts variational autoencoders. [CrossRef]
- Kumar, S., Payne, P.R.O., Sotiras, A., 2023b. Normative Modeling using Multimodal Variational Autoencoders to Identify Abnormal Brain Volume Deviations in Alzheimer’s Disease. Proc SPIE Int Soc Opt Eng 12465, 1246503. [CrossRef]
- Laidi, C., Floris, D.L., Tillmann, J., Elandaloussi, Y., Zabihi, M., Charman, T., Wolfers, T., Durston, S., Moessnang, C., Dell’Acqua, F., Ecker, C., Loth, E., Murphy, D., Baron-Cohen, S., Buitelaar, J.K., Marquand, A.F., Beckmann, C.F., Frouin, V., Leboyer, M., Duchesnay, E., Coupé, P., Houenou, J., Tobias Banaschewski, Persico, A., San Jose Caceres, A., Hayward, H., Crawley, D., Faulkner, J., Sabet, J., Ellis, C., Oakley, B., Holt, R., Ambrosino, S., Bast, N., Baumeister, S., Rausch, A., Bours, C., Cornelissen, I., von Rhein, D., O’Dwyer, L., Ahmad, J., Simonoff, E., 2022. Cerebellar Atypicalities in Autism? Biological Psychiatry, Brain Development and Communication in Autism Spectrum Disorder 92, 674–682. [CrossRef]
- Lawn, T., Giacomel, A., Martins, D., Veronese, M., Howard, M., Turkheimer, F.E., Dipasquale, O., 2024. Normative modelling of molecular-based functional circuits captures clinical heterogeneity transdiagnostically in psychiatric patients. Commun Biol 7, 689. [CrossRef]
- Lawry Aguila, A., Chapman, J., Janahi, M., Altmann, A., 2022. Conditional VAEs for Confound Removal and Normative Modelling of Neurodegenerative Diseases [WWW Document]. In: Wang, L and Dou, Q and Fletcher, PT and Speidel, S and Li, S, (eds.) Medical Image Computing and Computer Assisted Intervention – MICCAI 2022. (pp. pp. 430-440). Springer: Cham, Switzerland. (2022). [CrossRef]
- Lin, X., Huo, Y., Wang, Q., Liu, G., Shi, J., Fan, Y., Lu, L., Jing, R., Li, P., 2024. Using normative modeling to assess pharmacological treatment effect on brain state in patients with schizophrenia. Cerebral Cortex 34, bhae003. [CrossRef]
- Lin, X., Jing, R., Chang, S., Liu, L., Wang, Q., Zhuo, C., Shi, J., Fan, Y., Lu, L., Li, P., 2023. Understanding the heterogeneity of dynamic functional connectivity patterns in first-episode drug naïve depression using normative models. Journal of Affective Disorders 327, 217–225. [CrossRef]
- Liu, L., Jia, D., He, Z., Wen, B., Zhang, X., Han, S., 2024. Individualized functional connectome abnormalities obtained using two normative model unveil neurophysiological subtypes of obsessive compulsive disorder. Progress in Neuro-Psychopharmacology and Biological Psychiatry 135, 111122. [CrossRef]
- Looden, T., Floris, D.L., Llera, A., Chauvin, R.J., Charman, T., Banaschewski, T., Murphy, D., Marquand, Andre.F., Buitelaar, J.K., Beckmann, C.F., Ahmad, J., Ambrosino, S., Auyeung, B., Banaschewski, T., Baron-Cohen, S., Baumeister, S., Beckmann, C.F., Bölte, S., Bourgeron, T., Bours, C., Brammer, M., Brandeis, D., Brogna, C., de Bruijn, Y., Buitelaar, J.K., Chakrabarti, B., Charman, T., Cornelissen, I., Crawley, D., Acqua, F.D., Dumas, G., Durston, S., Ecker, C., Faulkner, J., Frouin, V., Garcés, P., Goyard, D., Ham, L., Hayward, H., Hipp, J., Holt, R., Johnson, M.H., Jones, E.J.H., Kundu, P., Lai, M.-C., D’ardhuy, X.L., Lombardo, M.V., Loth, E., Lythgoe, D.J., Mandl, R., Marquand, A., Mason, L., Mennes, M., Meyer-Lindenberg, A., Moessnang, C., Mueller, N., Murphy, D.G.M., Oakley, B., O’Dwyer, L., Oldehinkel, M., Oranje, B., Pandina, G., Persico, A.M., Rausch, A., Ruggeri, B., Ruigrok, A., Sabet, J., Sacco, R., Cáceres, A.S.J., Simonoff, E., Spooren, W., Tillmann, J., Toro, R., Tost, H., Waldman, J., Williams, S.C.R., Wooldridge, C., Ilioska, I., Mei, T., Zwiers, M.P., the AIMS-2-TRIALS group, 2022. Patterns of connectome variability in autism across five functional activation tasks: findings from the LEAP project. Molecular Autism 13, 53. [CrossRef]
- Lopez Pinaya, W.H., Vieira, S., Garcia-Dias, R., Mechelli, A., 2020. Chapter 11 - Autoencoders, in: Mechelli, A., Vieira, S. (Eds.), Machine Learning. Academic Press, pp. 193–208. [CrossRef]
- Lotter, L.D., Saberi, A., Hansen, J.Y., Misic, B., Paquola, C., Barker, G.J., Bokde, A.L.W., Desrivières, S., Flor, H., Grigis, A., Garavan, H., Gowland, P., Heinz, A., Brühl, R., Martinot, J.-L., Paillère, M.-L., Artiges, E., Papadopoulos Orfanos, D., Paus, T., Poustka, L., Hohmann, S., Fröhner, J.H., Smolka, M.N., Vaidya, N., Walter, H., Whelan, R., Schumann, G., Nees, F., Banaschewski, T., Eickhoff, S.B., Dukart, J., 2024. Regional patterns of human cortex development correlate with underlying neurobiology. Nat Commun 15, 7987. [CrossRef]
- Lv, J., Di Biase, M., Cash, R.F.H., Cocchi, L., Cropley, V.L., Klauser, P., Tian, Y., Bayer, J., Schmaal, L., Cetin-Karayumak, S., Rathi, Y., Pasternak, O., Bousman, C., Pantelis, C., Calamante, F., Zalesky, A., 2021. Individual deviations from normative models of brain structure in a large cross-sectional schizophrenia cohort. Mol Psychiatry 26, 3512–3523. [CrossRef]
- Macleod, R., O’Muircheartaigh, J., Edwards, A.D., Carmichael, D., Rutherford, M., Counsell, S.J., 2020. Automatic Detection of Neonatal Brain Injury on MRI, in: Hu, Y., Licandro, R., Noble, J.A., Hutter, J., Aylward, S., Melbourne, A., Abaci Turk, E., Torrents Barrena, J. (Eds.), Medical Ultrasound, and Preterm, Perinatal and Paediatric Image Analysis, Lecture Notes in Computer Science. Springer International Publishing, Cham, pp. 324–333. [CrossRef]
- Marcus, D.S., Wang, T.H., Parker, J., Csernansky, J.G., Morris, J.C., Buckner, R.L., 2007. Open Access Series of Imaging Studies (OASIS): cross-sectional MRI data in young, middle aged, nondemented, and demented older adults. J Cogn Neurosci 19, 1498–1507. [CrossRef]
- Marquand, A.F., Kia, S.M., Zabihi, M., Wolfers, T., Buitelaar, J.K., Beckmann, C.F., 2019. Conceptualizing mental disorders as deviations from normative functioning. Mol Psychiatry 24, 1415–1424. [CrossRef]
- Marquand, A.F., Rezek, I., Buitelaar, J., Beckmann, C.F., 2016a. Understanding Heterogeneity in Clinical Cohorts Using Normative Models: Beyond Case-Control Studies. Biological Psychiatry 80, 552–561. [CrossRef]
- Marquand, A.F., Wolfers, T., Mennes, M., Buitelaar, J., Beckmann, C.F., 2016b. Beyond Lumping and Splitting: A Review of Computational Approaches for Stratifying Psychiatric Disorders. Biol Psychiatry Cogn Neurosci Neuroimaging 1, 433–447. [CrossRef]
- Marzi, C., Giannelli, M., Barucci, A., Tessa, C., Mascalchi, M., Diciotti, S., 2024. Efficacy of MRI data harmonization in the age of machine learning: a multicenter study across 36 datasets. Sci Data 11, 115. [CrossRef]
- Mechelli, A., Price, C.J., Friston, K.J., Ashburner, J., 2005. Voxel-based morphometry of the human brain: Methods and applications. CURRENT MEDICAL IMAGING REVIEWS 1, 105–113.
- Meijer, J., Hebling Vieira, B., Elleaume, C., Baranczuk-Turska, Z., Langer, N., Floris, D.L., 2024. Toward understanding autism heterogeneity: Identifying clinical subgroups and neuroanatomical deviations. Journal of Psychopathology and Clinical Science 133, 667–677. [CrossRef]
- Meyer-Lindenberg, A., 2023. The non-ergodic nature of mental health and psychiatric disorders: implications for biomarker and diagnostic research. World Psychiatry 22, 272–274. [CrossRef]
- Mishra, S.K., Singh, P., 2010. History of Neuroimaging: The Legacy of William Oldendorf. J Child Neurol 25, 508–517. [CrossRef]
- Mueller, S.G., Weiner, M.W., Thal, L.J., Petersen, R.C., Jack, C.R., Jagust, W., Trojanowski, J.Q., Toga, A.W., Beckett, L., 2005. Ways toward an early diagnosis in Alzheimer’s disease: the Alzheimer’s Disease Neuroimaging Initiative (ADNI). Alzheimers Dement 1, 55–66. [CrossRef]
- Muili, A.O., Olalekan, A.A., Kuol, P.P., Moradeyo, A., Phiri, E.C., Habibat, S., Adekemi, A.A., Mustapha, M.J., 2024. Advancing brain health: harnessing the centilebrain model for enhanced diagnosis of mental health disorders. Ann Med Surg (Lond) 86, 4944–4946. [CrossRef]
- Narang, K.S., Jha, A.N., 2017. Intraoperative Imaging in Neurosurgery. JP Medical Ltd.
- Niso, G., Gorgolewski, K.J., Bock, E., Brooks, T.L., Flandin, G., Gramfort, A., Henson, R.N., Jas, M., Litvak, V., T. Moreau, J., Oostenveld, R., Schoffelen, J.-M., Tadel, F., Wexler, J., Baillet, S., 2018. MEG-BIDS, the brain imaging data structure extended to magnetoencephalography. Sci Data 5, 180110. [CrossRef]
- Norgaard, M., Matheson, G.J., Hansen, H.D., Thomas, A., Searle, G., Rizzo, G., Veronese, M., Giacomel, A., Yaqub, M., Tonietto, M., Funck, T., Gillman, A., Boniface, H., Routier, A., Dalenberg, J.R., Betthauser, T., Feingold, F., Markiewicz, C.J., Gorgolewski, K.J., Blair, R.W., Appelhoff, S., Gau, R., Salo, T., Niso, G., Pernet, C., Phillips, C., Oostenveld, R., Gallezot, J.-D., Carson, R.E., Knudsen, G.M., Innis, R.B., Ganz, M., 2021. PET-BIDS, an extension to the brain imaging data structure for positron emission tomography. [CrossRef]
- Nunes, A., Trappenberg, T., Alda, M., 2020. Measuring heterogeneity in normative models as the effective number of deviation patterns. PLoS ONE 15, e0242320. [CrossRef]
- Oliveira-Saraiva, D., Ferreira, H.A., 2023. Normative model detects abnormal functional connectivity in psychiatric disorders. Front. Psychiatry 14, 1068397. [CrossRef]
- Pernet, C.R., Appelhoff, S., Gorgolewski, K.J., Flandin, G., Phillips, C., Delorme, A., Oostenveld, R., 2019. EEG-BIDS, an extension to the brain imaging data structure for electroencephalography. Sci Data 6, 103. [CrossRef]
- Petersen, R.C., Aisen, P.S., Beckett, L.A., Donohue, M.C., Gamst, A.C., Harvey, D.J., Jack, C.R., Jagust, W.J., Shaw, L.M., Toga, A.W., Trojanowski, J.Q., Weiner, M.W., 2010. Alzheimer’s Disease Neuroimaging Initiative (ADNI): clinical characterization. Neurology 74, 201–209. [CrossRef]
- Pinaya, W.H.L., Mechelli, A., Sato, J.R., 2019. Using deep autoencoders to identify abnormal brain structural patterns in neuropsychiatric disorders: A large-scale multi-sample study. Human Brain Mapping 40, 944–954. [CrossRef]
- Pinaya, W.H.L., Scarpazza, C., Garcia-Dias, R., Vieira, S., Baecker, L., F Da Costa, P., Redolfi, A., Frisoni, G.B., Pievani, M., Calhoun, V.D., Sato, J.R., Mechelli, A., 2021. Using normative modelling to detect disease progression in mild cognitive impairment and Alzheimer’s disease in a cross-sectional multi-cohort study. Sci Rep 11, 15746. [CrossRef]
- Pinto, M.S., Anania, V., Paolella, R., Smekens, C., Billiet, T., Janssens, T., den Dekker, A.J., Sijbers, J., Guns, P.-J., Van Dyck, P., 2025. Harmonization of diffusion MRI on healthy subjects using NeuroCombat and LongCombat: a B-Q MINDED brain intra- and inter-scanner study. Front Neurosci 19, 1591169. [CrossRef]
- Rasmussen, C.E., Williams, C.K.I., 2006. Gaussian processes for machine learning, Adaptive computation and machine learning. MIT Press, Cambridge, Mass.
- Reardon, P.K., Seidlitz, J., Vandekar, S., Liu, S., Patel, R., Park, M.T.M., Alexander-Bloch, A., Clasen, L.S., Blumenthal, J.D., Lalonde, F.M., Giedd, J.N., Gur, R.C., Gur, R.E., Lerch, J.P., Chakravarty, M.M., Satterthwaite, T.D., Shinohara, R.T., Raznahan, A., 2018. Normative brain size variation and brain shape diversity in humans. Science 360, 1222–1227. [CrossRef]
- Romascano, D., Rebsamen, M., Radojewski, P., Blattner, T., McKinley, R., Wiest, R., Rummel, C., 2024. Cortical thickness and grey-matter volume anomaly detection in individual MRI scans: Comparison of two methods. NeuroImage: Clinical 43, 103624. [CrossRef]
- Rutherford, S., Barkema, P., Tso, I.F., Sripada, C., Beckmann, C.F., Ruhe, H.G., Marquand, A.F., 2023. Evidence for embracing normative modeling. eLife 12, e85082. [CrossRef]
- Rutherford, S., Fraza, C., Dinga, R., Kia, S.M., Wolfers, T., Zabihi, M., Berthet, P., Worker, A., Verdi, S., Andrews, D., Han, L.K., Bayer, J.M., Dazzan, P., McGuire, P., Mocking, R.T., Schene, A., Sripada, C., Tso, I.F., Duval, E.R., Chang, S.-E., Penninx, B.W., Heitzeg, M.M., Burt, S.A., Hyde, L.W., Amaral, D., Wu Nordahl, C., Andreasssen, O.A., Westlye, L.T., Zahn, R., Ruhe, H.G., Beckmann, C., Marquand, A.F., 2022a. Charting brain growth and aging at high spatial precision. eLife 11, e72904. [CrossRef]
- Rutherford, S., Kia, S.M., Wolfers, T., Fraza, C., Zabihi, M., Dinga, R., Berthet, P., Worker, A., Verdi, S., Ruhe, H.G., Beckmann, C.F., Marquand, A.F., 2022b. The normative modeling framework for computational psychiatry. Nat Protoc 17, 1711–1734. [CrossRef]
- Sampaio, I.W., Tassi, E., Bellani, M., Benedetti, F., Nenadic, I., Phillips, M., Piras, F., Yatham, L., Bianchi, A.M., Brambilla, P., Maggioni, E., 2024. A generalizable normative deep autoencoder for brain morphological anomaly detection: application to the multi-site StratiBip dataset on bipolar disorder in an external validation framework. bioRxiv 2024.09.04.611239. [CrossRef]
- Savage, H.S., Mulders, P.C.R., van Eijndhoven, P.F.P., van Oort, J., Tendolkar, I., Vrijsen, J.N., Beckmann, C.F., Marquand, A.F., 2024. Dissecting task-based fMRI activity using normative modelling: an application to the Emotional Face Matching Task. Commun Biol 7, 1–14. [CrossRef]
- Schulz, E., Speekenbrink, M., Krause, A., 2018. A tutorial on Gaussian process regression: Modelling, exploring, and exploiting functions. Journal of Mathematical Psychology 85, 1–16. [CrossRef]
- Segal, A., Parkes, L., Aquino, K., Kia, S.M., Wolfers, T., Franke, B., Hoogman, M., Beckmann, C.F., Westlye, L.T., Andreassen, O.A., Zalesky, A., Harrison, B.J., Davey, C.G., Soriano-Mas, C., Cardoner, N., Tiego, J., Yücel, M., Braganza, L., Suo, C., Berk, M., Cotton, S., Bellgrove, M.A., Marquand, A.F., Fornito, A., 2023. Regional, circuit and network heterogeneity of brain abnormalities in psychiatric disorders. Nat Neurosci 26, 1613–1629. [CrossRef]
- Segal, A., Smith, R.E., Chopra, S., Oldham, S., Parkes, L., Aquino, K.M., Kia, S.M., Wolfers, T., Franke, B., Hoogman, M., Beckmann, C.F., Westlye, L.T., Andreassen, O.A., Zaleskey, A., Ben, H.J., Davey, C.G., Soriano-Mas, C., Cardoner, N., Tiego, J., Yucel, M., Braganza, L., Suo, C., Berk, M., Cotton, S., Bellgrove, M.A., Marquand, A.F., Fornito, A., 2024. Multiscale heterogeneity of white matter morphometry in psychiatric disorders. [CrossRef]
- Segal, A., Tiego, J., Parkes, L., Holmes, A.J., Marquand, A.F., Fornito, A., 2025. Embracing variability in the search for biological mechanisms of psychiatric illness. Trends Cogn Sci 29, 85–99. [CrossRef]
- Shan, X., Uddin, L.Q., Xiao, J., He, C., Ling, Z., Li, L., Huang, X., Chen, H., Duan, X., 2022. Mapping the Heterogeneous Brain Structural Phenotype of Autism Spectrum Disorder Using the Normative Model. Biological Psychiatry 91, 967–976. [CrossRef]
- Shao, J., Qin, J., Wang, H., Sun, Y., Zhang, W., Wang, X., Wang, T., Xue, L., Yao, Z., Lu, Q., 2024. Capturing the Individual Deviations From Normative Models of Brain Structure for Depression Diagnosis and Treatment. Biological Psychiatry 95, 403–413. [CrossRef]
- Shen, R.S., Osmanlıoğlu, Y., Parker, D., Aunapu, D., Yerys, B.E., Tunç, B., Verma, R., 2024. Parsing altered brain connectivity in neurodevelopmental disorders by integrating graph-based normative modeling and deep generative networks. [CrossRef]
- Sima, D., Phan, T.V., Van Eyndhoven, S., Vercruyssen, S., Magalhães, R., Maes, C., Khan, R., Guo, J., Hughes, R., Gabr, R., Saha-Chaudhuri, P., Curiale, G., Belachew, S., Van Hecke, W., Ribbens, A., Smeets, D., 2024. Validation of Icobrain Aria - An AI-based Software Tool for Automated Detection and Quantification of Amyloid-related Imaging Abnormalities (S1.005). Neurology 102, 6102. [CrossRef]
- Smola, A.J., Schölkopf, B., 2004. A tutorial on support vector regression. Statistics and Computing 14, 199–222. [CrossRef]
- Snyder, K., Whitehead, E.P., Theodore, W.H., Zaghloul, K.A., Inati, S.J., Inati, S.K., 2021. Distinguishing type II focal cortical dysplasias from normal cortex: A novel normative modeling approach. NeuroImage: Clinical 30, 102565. [CrossRef]
- Sokoloff, L., Reivich, M., Kennedy, C., Des Rosiers, M.H., Patlak, C.S., Pettigrew, K.D., Sakurada, O., Shinohara, M., 1977. The [14C]deoxyglucose method for the measurement of local cerebral glucose utilization: theory, procedure, and normal values in the conscious and anesthetized albino rat. J Neurochem 28, 897–916. [CrossRef]
- Sun, L., Zhao, T., Liang, X., Xia, M., Li, Q., Liao, X., Gong, G., Wang, Q., Pang, C., Yu, Q., Bi, Y., Chen, P., Chen, R., Chen, Y., Chen, T., Cheng, J., Cheng, Y., Cui, Z., Dai, Z., Deng, Y., Ding, Y., Dong, Q., Duan, D., Gao, J.-H., Gong, Q., Han, Y., Han, Z., Huang, C.-C., Huang, R., Huo, R., Li, L., Lin, C.-P., Lin, Q., Liu, B., Liu, C., Liu, N., Liu, Ying, Liu, Yong, Lu, J., Ma, L., Men, W., Qin, S., Qiu, J., Qiu, S., Si, T., Tan, S., Tang, Y., Tao, S., Wang, D., Wang, F., Wang, J., Wang, P., Wang, X., Wang, Y., Wei, D., Wu, Y., Xie, P., Xu, X., Xu, Y., Xu, Z., Yang, L., Yuan, H., Zeng, Z., Zhang, H., Zhang, X., Zhao, G., Zheng, Y., Zhong, S., Alzheimer’s Disease Neuroimaging Initiative, Cam-CAN, Developing Human Connectome Project, DIDA-MDD Working Group, MCADI, NSPN, He, Y., 2024. Functional connectome through the human life span. bioRxiv 2023.09.12.557193. [CrossRef]
- Sun, X., Sun, J., Lu, X., Dong, Q., Zhang, L., Wang, W., Liu, J., Ma, Q., Wang, X., Wei, D., Chen, Y., Liu, B., Huang, C.-C., Zheng, Y., Wu, Y., Chen, T., Cheng, Y., Xu, X., Gong, Q., Si, T., Qiu, S., Lin, C.-P., Cheng, J., Tang, Y., Wang, F., Qiu, J., Xie, P., Li, L., He, Y., Xia, M., He, Y., Li, L., Cheng, J., Gong, Q., Lin, C.-P., Qiu, J., Qiu, S., Si, T., Tang, Y., Wang, F., Xie, P., Xu, X., Xia, M., 2023. Mapping Neurophysiological Subtypes of Major Depressive Disorder Using Normative Models of the Functional Connectome. Biological Psychiatry 94, 936–947. [CrossRef]
- Thomas, M., Lemaitre, M., Wilson, M.L., Viboud, C., Yordanov, Y., Wackernagel, H., Carrat, F., 2016. Applications of Extreme Value Theory in Public Health. PLOS ONE 11, e0159312. [CrossRef]
- Thompson, P.M., Stein, J.L., Medland, S.E., Hibar, D.P., Vasquez, A.A., Renteria, M.E., Toro, R., Jahanshad, N., Schumann, G., Franke, B., Wright, M.J., Martin, N.G., Agartz, I., Alda, M., Alhusaini, S., Almasy, L., Almeida, J., Alpert, K., Andreasen, N.C., Andreassen, O.A., Apostolova, L.G., Appel, K., Armstrong, N.J., Aribisala, B., Bastin, M.E., Bauer, M., Bearden, C.E., Bergmann, Ø., Binder, E.B., Blangero, J., Bockholt, H.J., Bøen, E., Bois, C., Boomsma, D.I., Booth, T., Bowman, I.J., Bralten, J., Brouwer, R.M., Brunner, H.G., Brohawn, D.G., Buckner, R.L., Buitelaar, J., Bulayeva, K., Bustillo, J.R., Calhoun, V.D., Cannon, D.M., Cantor, R.M., Carless, M.A., Caseras, X., Cavalleri, G.L., Chakravarty, M.M., Chang, K.D., Ching, C.R.K., Christoforou, A., Cichon, S., Clark, V.P., Conrod, P., Coppola, G., Crespo-Facorro, B., Curran, J.E., Czisch, M., Deary, I.J., de Geus, E.J.C., den Braber, A., Delvecchio, G., Depondt, C., de Haan, L., de Zubicaray, G.I., Dima, D., Dimitrova, R., Djurovic, S., Dong, H., Donohoe, G., Duggirala, R., Dyer, T.D., Ehrlich, S., Ekman, C.J., Elvsåshagen, T., Emsell, L., Erk, S., Espeseth, T., Fagerness, J., Fears, S., Fedko, I., Fernández, G., Fisher, S.E., Foroud, T., Fox, P.T., Francks, C., Frangou, S., Frey, E.M., Frodl, T., Frouin, V., Garavan, H., Giddaluru, S., Glahn, D.C., Godlewska, B., Goldstein, R.Z., Gollub, R.L., Grabe, H.J., Grimm, O., Gruber, O., Guadalupe, T., Gur, R.E., Gur, R.C., Göring, H.H.H., Hagenaars, S., Hajek, T., Hall, G.B., Hall, J., Hardy, J., Hartman, C.A., Hass, J., Hatton, S.N., Haukvik, U.K., Hegenscheid, K., Heinz, A., Hickie, I.B., Ho, B.-C., Hoehn, D., Hoekstra, P.J., Hollinshead, M., Holmes, A.J., Homuth, G., Hoogman, M., Hong, L.E., Hosten, N., Hottenga, J.-J., Hulshoff Pol, H.E., Hwang, K.S., Jack, C.R., Jenkinson, M., Johnston, C., Jönsson, E.G., Kahn, R.S., Kasperaviciute, D., Kelly, S., Kim, S., Kochunov, P., Koenders, L., Krämer, B., Kwok, J.B.J., Lagopoulos, J., Laje, G., Landen, M., Landman, B.A., Lauriello, J., Lawrie, S.M., Lee, P.H., Le Hellard, S., Lemaître, H., Leonardo, C.D., Li, C., Liberg, B., Liewald, D.C., Liu, X., Lopez, L.M., Loth, E., Lourdusamy, A., Luciano, M., Macciardi, F., Machielsen, M.W.J., MacQueen, G.M., Malt, U.F., Mandl, R., Manoach, D.S., Martinot, J.-L., Matarin, M., Mather, K.A., Mattheisen, M., Mattingsdal, M., Meyer-Lindenberg, A., McDonald, C., McIntosh, A.M., McMahon, F.J., McMahon, K.L., Meisenzahl, E., Melle, I., Milaneschi, Y., Mohnke, S., Montgomery, G.W., Morris, D.W., Moses, E.K., Mueller, B.A., Muñoz Maniega, S., Mühleisen, T.W., Müller-Myhsok, B., Mwangi, B., Nauck, M., Nho, K., Nichols, T.E., Nilsson, L.-G., Nugent, A.C., Nyberg, L., Olvera, R.L., Oosterlaan, J., Ophoff, R.A., Pandolfo, M., Papalampropoulou-Tsiridou, M., Papmeyer, M., Paus, T., Pausova, Z., Pearlson, G.D., Penninx, B.W., Peterson, C.P., Pfennig, A., Phillips, M., Pike, G.B., Poline, J.-B., Potkin, S.G., Pütz, B., Ramasamy, A., Rasmussen, J., Rietschel, M., Rijpkema, M., Risacher, S.L., Roffman, J.L., Roiz-Santiañez, R., Romanczuk-Seiferth, N., Rose, E.J., Royle, N.A., Rujescu, D., Ryten, M., Sachdev, P.S., Salami, A., Satterthwaite, T.D., Savitz, J., Saykin, A.J., Scanlon, C., Schmaal, L., Schnack, H.G., Schork, A.J., Schulz, S.C., Schür, R., Seidman, L., Shen, L., Shoemaker, J.M., Simmons, A., Sisodiya, S.M., Smith, C., Smoller, J.W., Soares, J.C., Sponheim, S.R., Sprooten, E., Starr, J.M., Steen, V.M., Strakowski, S., Strike, L., Sussmann, J., Sämann, P.G., Teumer, A., Toga, A.W., Tordesillas-Gutierrez, D., Trabzuni, D., Trost, S., Turner, J., Van den Heuvel, M., van der Wee, N.J., van Eijk, K., van Erp, T.G.M., van Haren, N.E.M., van ‘t Ent, D., van Tol, M.-J., Valdés Hernández, M.C., Veltman, D.J., Versace, A., Völzke, H., Walker, R., Walter, H., Wang, L., Wardlaw, J.M., Weale, M.E., Weiner, M.W., Wen, W., Westlye, L.T., Whalley, H.C., Whelan, C.D., White, T., Winkler, A.M., Wittfeld, K., Woldehawariat, G., Wolf, C., Zilles, D., Zwiers, M.P., Thalamuthu, A., Schofield, P.R., Freimer, N.B., Lawrence, N.S., Drevets, W., the Alzheimer’s Disease Neuroimaging Initiative, E.C., IMAGEN Consortium, Saguenay Youth Study (SYS) Group, 2014. The ENIGMA Consortium: large-scale collaborative analyses of neuroimaging and genetic data. Brain Imaging and Behavior 8, 153–182. [CrossRef]
- Varrone, A., Dickson, J.C., Tossici-Bolt, L., Sera, T., Asenbaum, S., Booij, J., Kapucu, O.L., Kluge, A., Knudsen, G.M., Koulibaly, P.M., Nobili, F., Pagani, M., Sabri, O., Vander Borght, T., Van Laere, K., Tatsch, K., 2013. European multicentre database of healthy controls for [123I]FP-CIT SPECT (ENC-DAT): age-related effects, gender differences and evaluation of different methods of analysis. Eur J Nucl Med Mol Imaging 40, 213–227. [CrossRef]
- Verdi, S., Marquand, A.F., Schott, J.M., Cole, J.H., 2021. Beyond the average patient: how neuroimaging models can address heterogeneity in dementia. Brain 144, 2946–2953. [CrossRef]
- Villalón-Reina, J.E., Moreau, C.A., Nir, T.M., Jahanshad, N., Simons Variation in Individuals Project Consortium, Maillard, A., Romascano, D., Draganski, B., Lippé, S., Bearden, C.E., Kia, S.M., Marquand, A.F., Jacquemont, S., Thompson, P.M., 2022. Multi-site Normative Modeling of Diffusion Tensor Imaging Metrics Using Hierarchical Bayesian Regression, in: Wang, L., Dou, Q., Fletcher, P.T., Speidel, S., Li, S. (Eds.), Medical Image Computing and Computer Assisted Intervention – MICCAI 2022, Lecture Notes in Computer Science. Springer Nature Switzerland, Cham, pp. 207–217. [CrossRef]
- Villalón-Reina, J.E., Zhu, A.H., Nir, T.M., Thomopoulos, S.I., Laltoo, E., Kushan, L., Bearden, C.E., Jahanshad, N., Thompson, P.M., 2023. Large-scale Normative Modeling of Brain Microstructure, in: 2023 19th International Symposium on Medical Information Processing and Analysis (SIPAIM). Presented at the 2023 19th International Symposium on Medical Information Processing and Analysis (SIPAIM), IEEE, Mexico City, Mexico, pp. 1–5. [CrossRef]
- Wang, J., 2023. An Intuitive Tutorial to Gaussian Process Regression. Comput. Sci. Eng. 25, 4–11. [CrossRef]
- Wang, X., Zhao, K., Zhou, R., Leow, A., Osorio, R., Zhang, Y., He, L., 2022. Normative Modeling via Conditional Variational Autoencoder and Adversarial Learning to Identify Brain Dysfunction in Alzheimer’s Disease. [CrossRef]
- Williams, L.M., Whitfield Gabrieli, S., 2025. Neuroimaging for precision medicine in psychiatry. Neuropsychopharmacol. 50, 246–257. [CrossRef]
- Wolfers, T., Beckmann, C.F., Hoogman, M., Buitelaar, J.K., Franke, B., Marquand, A.F., 2020. Individual differences v. the average patient: mapping the heterogeneity in ADHD using normative models. Psychol. Med. 50, 314–323. [CrossRef]
- Wolfers, T., Doan, N.T., Kaufmann, T., Alnæs, D., Moberget, T., Agartz, I., Buitelaar, J.K., Ueland, T., Melle, I., Franke, B., Andreassen, O.A., Beckmann, C.F., Westlye, L.T., Marquand, A.F., 2018. Mapping the Heterogeneous Phenotype of Schizophrenia and Bipolar Disorder Using Normative Models. JAMA Psychiatry 75, 1146. [CrossRef]
- Wolfers, T., Rokicki, J., Alnæs, D., Berthet, P., Agartz, I., Kia, S.M., Kaufmann, T., Zabihi, M., Moberget, T., Melle, I., Beckmann, C.F., Andreassen, O.A., Marquand, A.F., Westlye, L.T., 2021. Replicating extensive brain structural heterogeneity in individuals with schizophrenia and bipolar disorder. Human Brain Mapping 42, 2546–2555. [CrossRef]
- Wong, T.Y., Moore, T.M., Seidlitz, J., Yuen, K.S.L., Ruparel, K., Barzilay, R., Calkins, M.E., Alexander-Bloch, A.F., Satterthwaite, T.D., Gur, R.E., Gur, R.C., 2023. Traumatic stress load and stressor reactivity score associated with accelerated gray matter maturation in youths indexed by normative models. Mol Psychiatry 28, 1137–1145. [CrossRef]
- Wüthrich, M.V., Merz, M., 2023. Generalized Linear Models, in: Wüthrich, M.V., Merz, M. (Eds.), Statistical Foundations of Actuarial Learning and Its Applications. Springer International Publishing, Cham, pp. 111–205. [CrossRef]
- Xu, B., Kuplicki, R., Sen, S., Paulus, M.P., 2021. The pitfalls of using Gaussian Process Regression for normative modeling.
- Yamashita, M., Yoshihara, Y., Hashimoto, R., Yahata, N., Ichikawa, N., Sakai, Y., Yamada, T., Matsukawa, N., Okada, G., Tanaka, S.C., Kasai, K., Kato, N., Okamoto, Y., Seymour, B., Takahashi, H., Kawato, M., Imamizu, H., 2018. A prediction model of working memory across health and psychiatric disease using whole-brain functional connectivity. eLife 7, e38844. [CrossRef]
- Yang, Z., Wu, J., Xu, L., Deng, Z., Tang, Y., Gao, J., Hu, Y., Zhang, Y., Qin, S., Li, C., Wang, J., 2020. Individualized psychiatric imaging based on inter-subject neural synchronization in movie watching. NeuroImage 216, 116227. [CrossRef]
- Zabihi, M., Floris, D.L., Kia, S.M., Wolfers, T., Tillmann, J., Arenas, A.L., Moessnang, C., Banaschewski, T., Holt, R., Baron-Cohen, S., Loth, E., Charman, T., Bourgeron, T., Murphy, D., Ecker, C., Buitelaar, J.K., Beckmann, C.F., Marquand, A., The EU-AIMS LEAP Group, 2020. Fractionating autism based on neuroanatomical normative modeling. Transl Psychiatry 10, 384. [CrossRef]
- Zabihi, M., Kia, S.M., Wolfers, T., De Boer, S., Fraza, C., Dinga, R., Arenas, A.L., Bzdok, D., Beckmann, C.F., Marquand, A., 2024. Nonlinear latent representations of high-dimensional task-fMRI data: Unveiling cognitive and behavioral insights in heterogeneous spatial maps. PLoS ONE 19, e0308329. [CrossRef]
- Zabihi, M., Oldehinkel, M., Wolfers, T., Frouin, V., Goyard, D., Loth, E., Charman, T., Tillmann, J., Banaschewski, T., Dumas, G., Holt, R., Baron-Cohen, S., Durston, S., Bölte, S., Murphy, D., Ecker, C., Buitelaar, J.K., Beckmann, C.F., Marquand, A.F., 2019. Dissecting the Heterogeneous Cortical Anatomy of Autism Spectrum Disorder Using Normative Models. Biological Psychiatry: Cognitive Neuroscience and Neuroimaging 4, 567–578. [CrossRef]
- Zhang, G., Zhang, X., Huang, H., Wang, Y., Li, H., Duan, Y., Chen, H., Liu, Y., Jing, B., Tie, Y., Lin, S., 2022. Probing individual-level structural atrophy in frontal glioma patients. Neurosurg Rev 45, 2845–2855. [CrossRef]
- Zhang, J., Fang, S., Yao, Y., Li, F., Luo, Q., 2023. Parsing the heterogeneity of brain-symptom associations in autism spectrum disorder via random forest with homogeneous canonical correlation. Journal of Affective Disorders 335, 36–43. [CrossRef]
Figure 1.
Steps of normative modelling in neuroimaging. The main steps of the NM framework application are presented. a) Study design: the reference cohort, the target cohort, and relevant covariates (demographics, anthropometrics, and potential clinical variables) are selected. b) Model estimation: potential models are estimated on the reference cohort at the desired level of granularity (voxel, vertex, or ROI level). c) Model validation: competing models are evaluated (in-sample and, ideally, out-of-sample) and the best model is selected. d) Application to target cohort: the best model is applied to individuals of the target cohort, and deviation scores (Z-scores) are calculated as the normalised difference between individual data and the prediction of the normative model. [Image reproduced from (Giacomel et al., 2025) under CC BY 4.0 license].
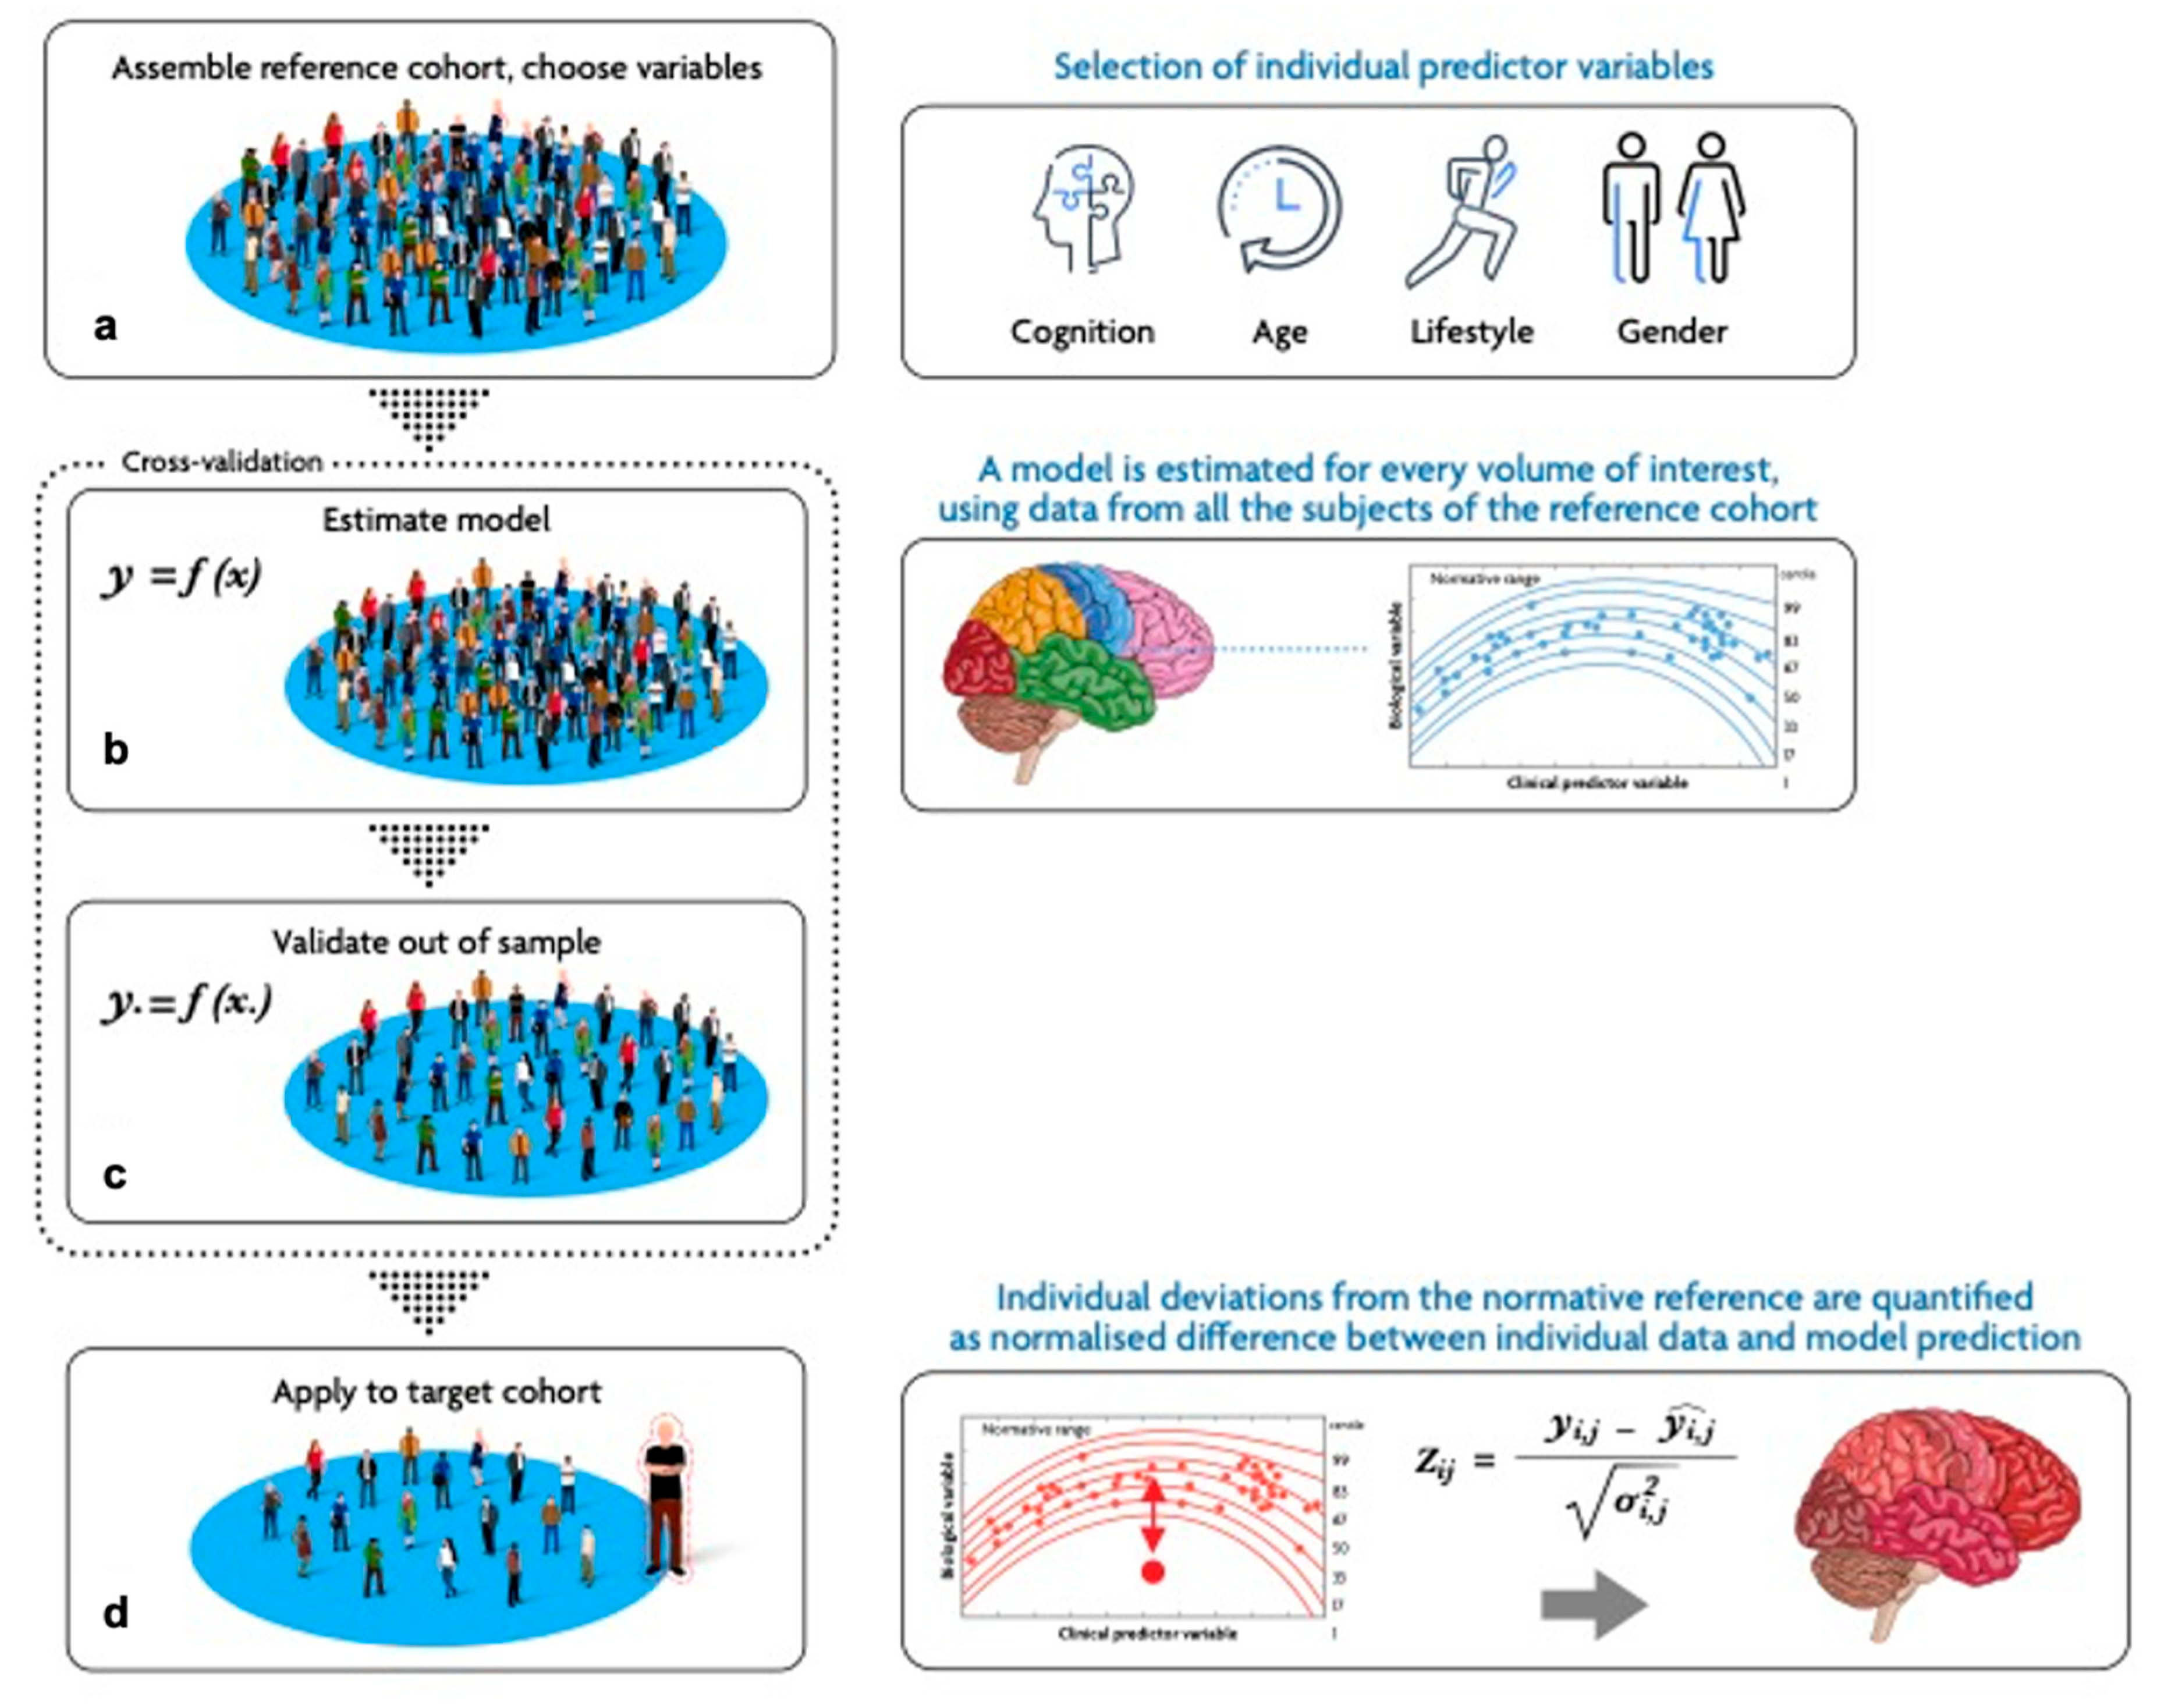
Figure 2.
Summary of Studies Characteristics. Figure shows: a) years of publication of selected NM studies; b) frequency of NM applications across physiological and clinical populations (for visualization purposes, clinical disorders have been grouped into clinical categories reported in Supplementary Materials); c) frequency of different modelling approaches; d) frequency of different NM predictors; e) frequency of different harmonization approaches. Acronyms: GAMLSS = Generalized Additive Model of Location, Scale and Shape; GPR = Gaussian Process Regression; HBGPM = Hierarchical Bayesian Gaussian Process Model; HBR = Hierarchical Bayesian Regression; LMS = parametric Lambda, Mu, Sigma method; LOESS = Local polynomial regression fitting; MFPR = Multivariate Fractional Polynomial Regression; OLSR = Ordinary Least Squares Regression; PCA = Principal Component Analysis; RBIG = Rotation-Based Iterative Gaussianization; BLR = Bayesian Linear Regression; RNN = Recurrent Neural Network; GLM = General linear model; FSIQ = Full Scale Intelligence Quotient; RAVLT = Rey Auditory Visual Learning Test.
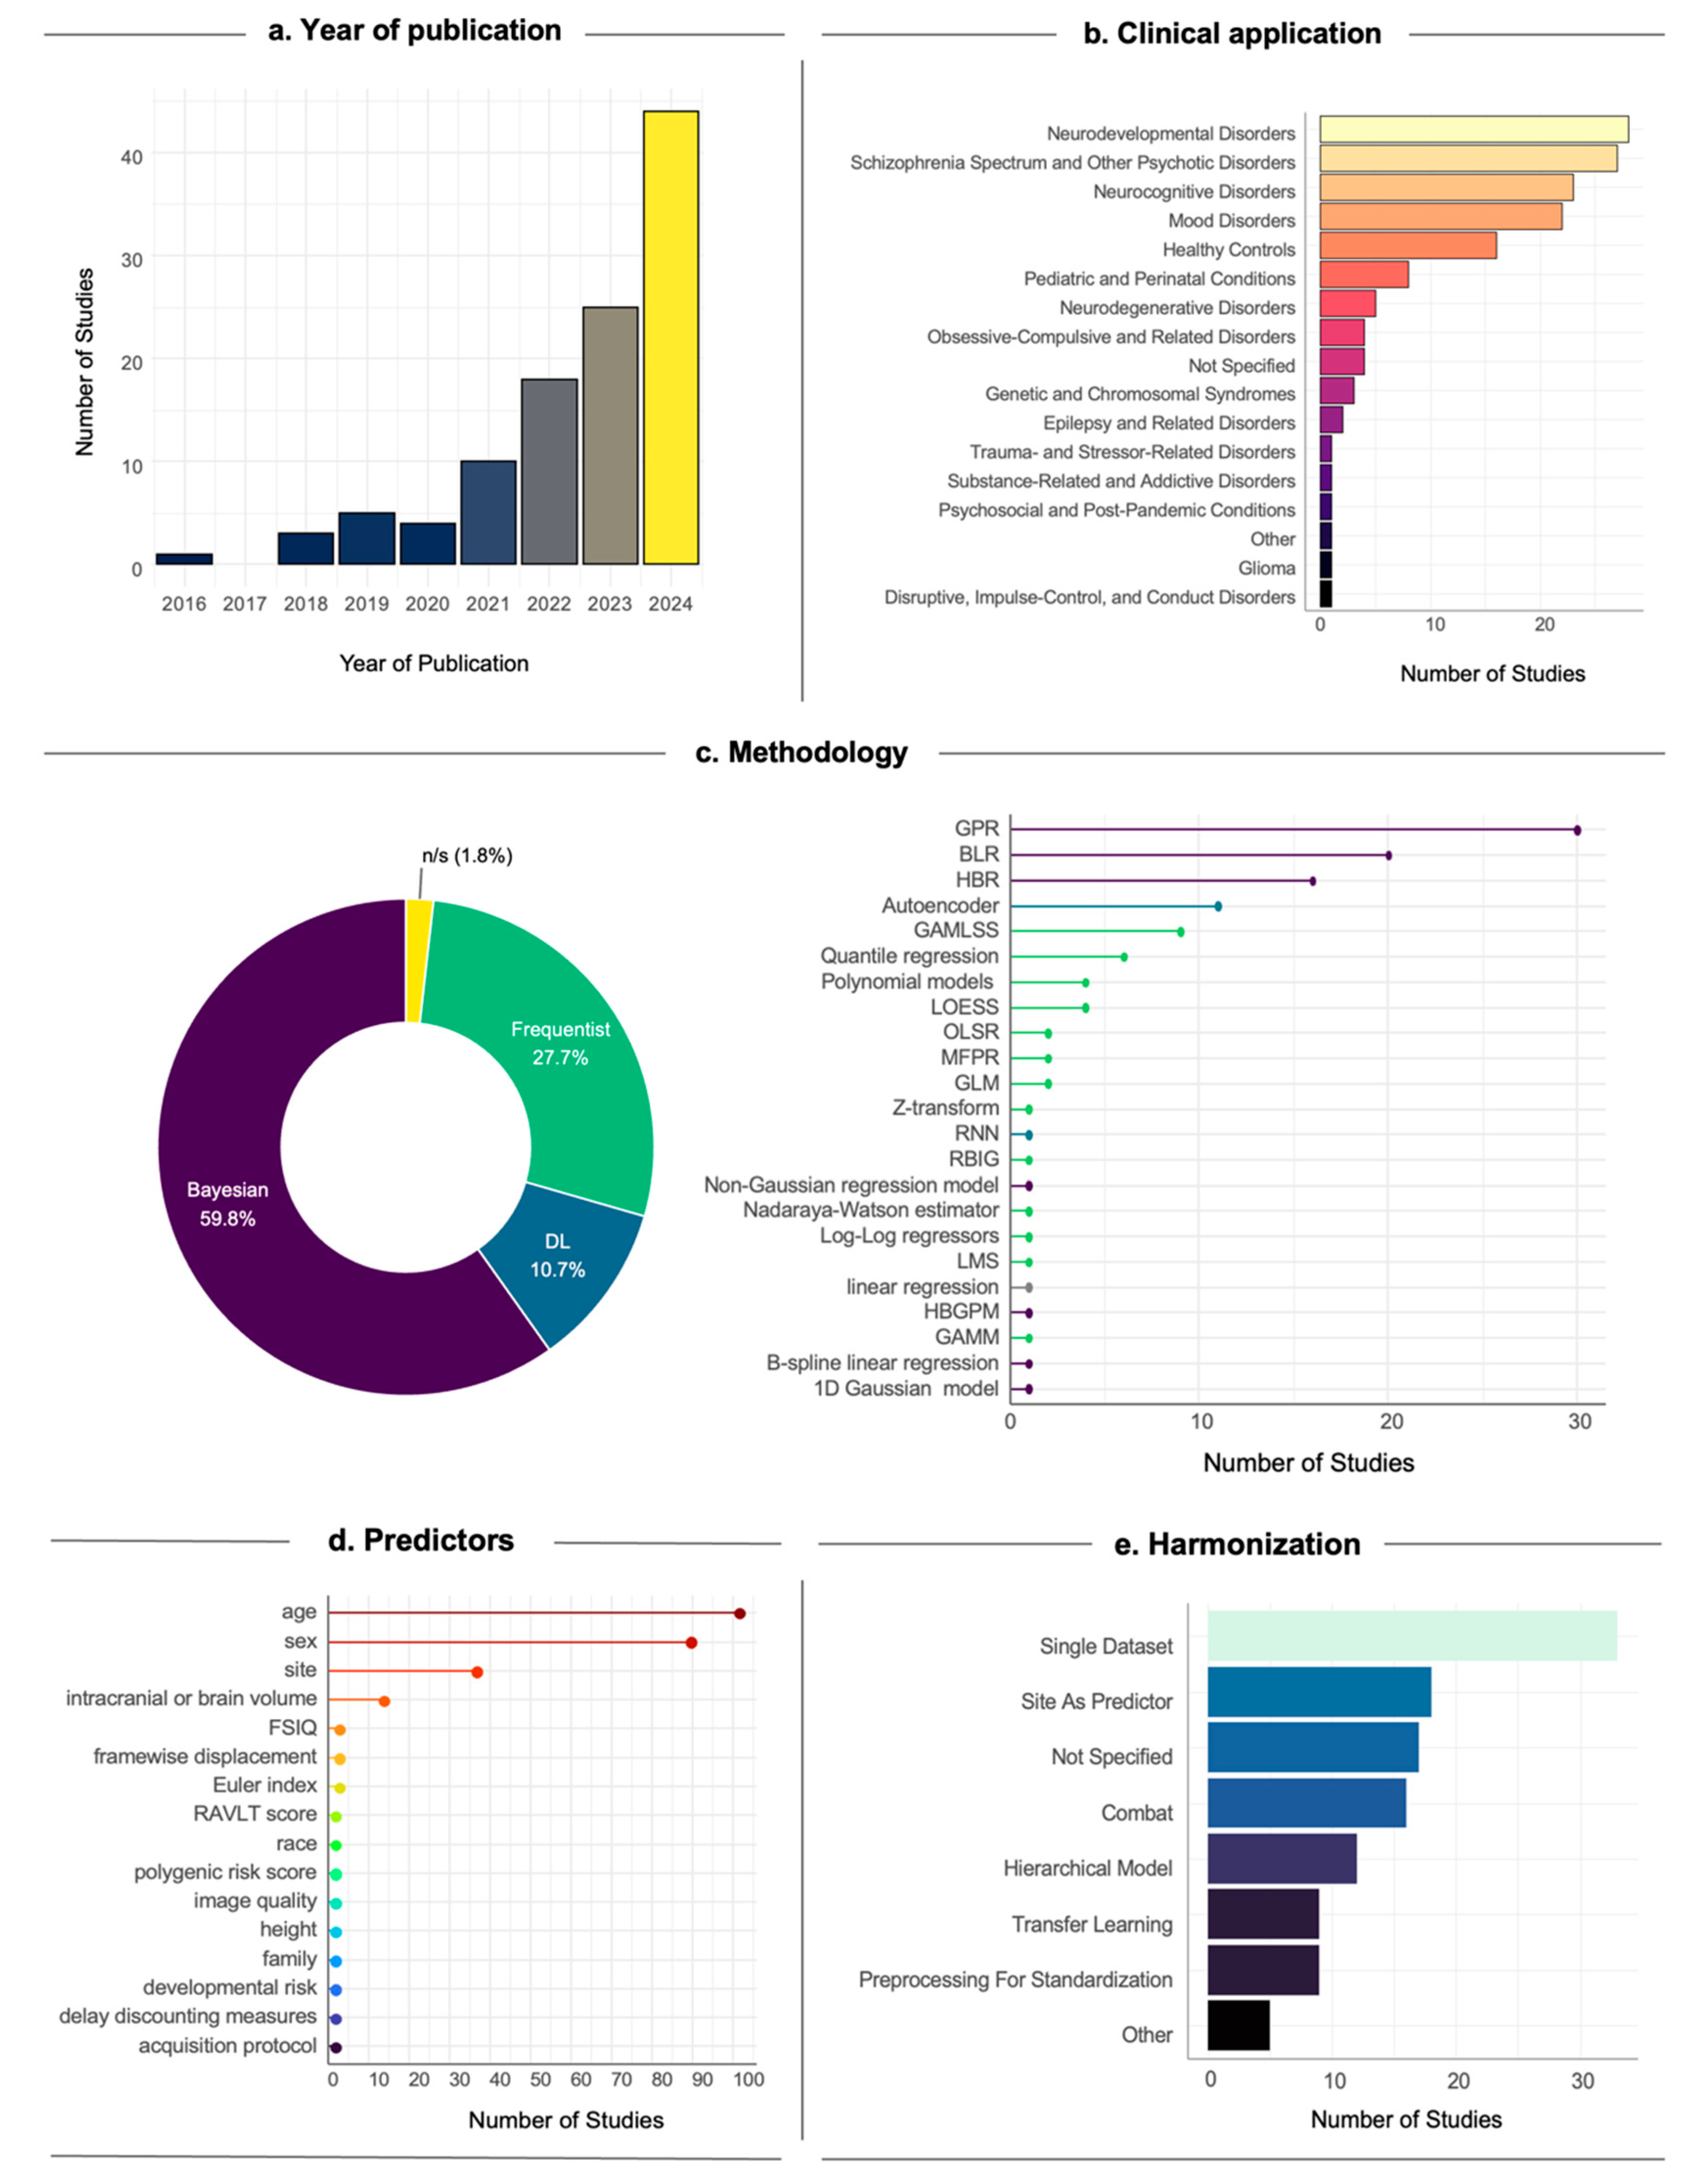
Figure 3.
Sample size of the reference cohort. The four panels show the sample size of reference cohorts used for model training in the reviewed neuroimaging studies across the four imaging modalities: structural Magnetic Resonance Imaging (sMRI) in red, functional Magnetic Resonance Imaging (fMRI) in green, diffusion Magnetic Resonance Imaging (dMRI) in blue, and Positron Emission Tomography (PET) in purple.
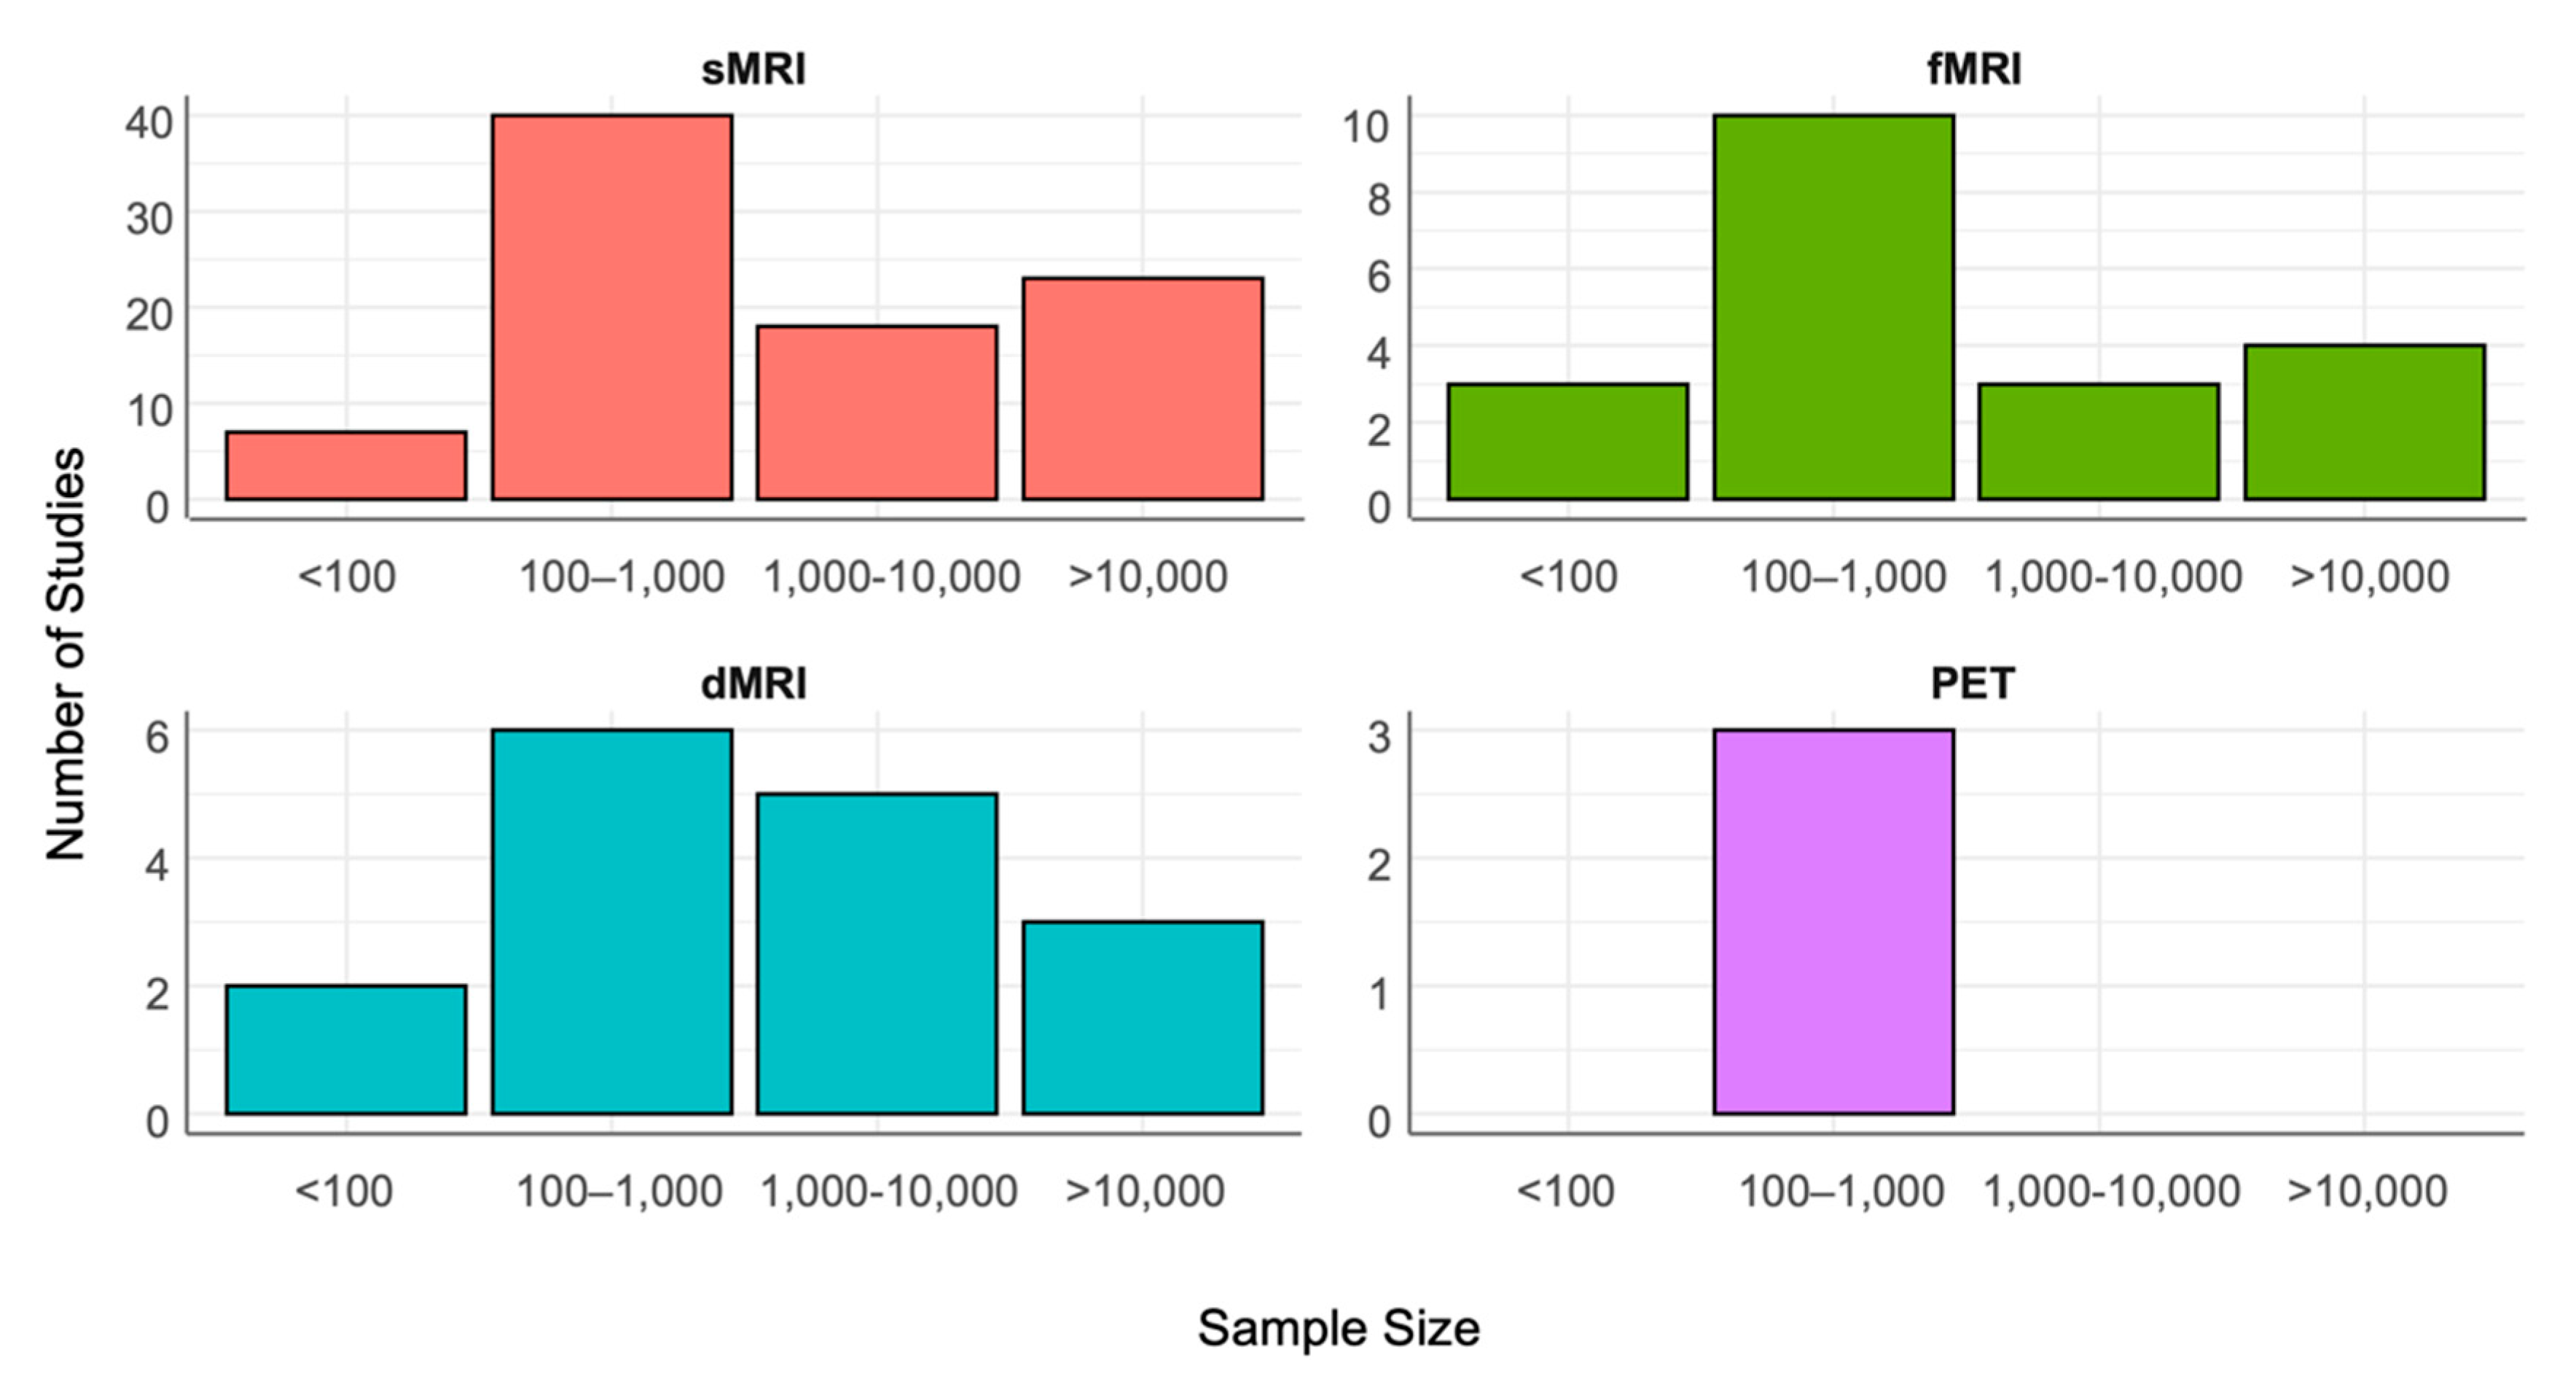
Figure 4.
NM response variables. The four panels show the frequency of imaging biomarkers adopted as NM response variables in the reviewed studies across the four imaging modalities: structural Magnetic Resonance Imaging (sMRI) in red, functional Magnetic Resonance Imaging (fMRI) in green, diffusion Magnetic Resonance Imaging (dMRI) in blue, and Positron Emission Tomography (PET) in purple. Acronyms: CT = Cortical Thickness; CV = Cortical Volume; SA = Surface Area; SV = Subcortical Volume; GM = Gray Matter; WM = White Matter; GMV = GM Volume; WMV = WM Volume; PBSI = Pearson’s Based Similarity Index; T1w = T1 weighted magnetic resonance image; FC = Functional Connectivity; rs-FC = resting state FC; NT = Neurotrasmitter; FA = Fractional Anisotropy; MD = Mean Diffusivity; RD = Radial Diffusivity; AD = Axial diffusivity; L1 = Principal diffusion tensor imaging eigen value; NDI = Neurite Density Index; ODI = Orientation Dispersion Index; SUVr = Standardized Uptake Value ratio; Ki = Net influx rate.
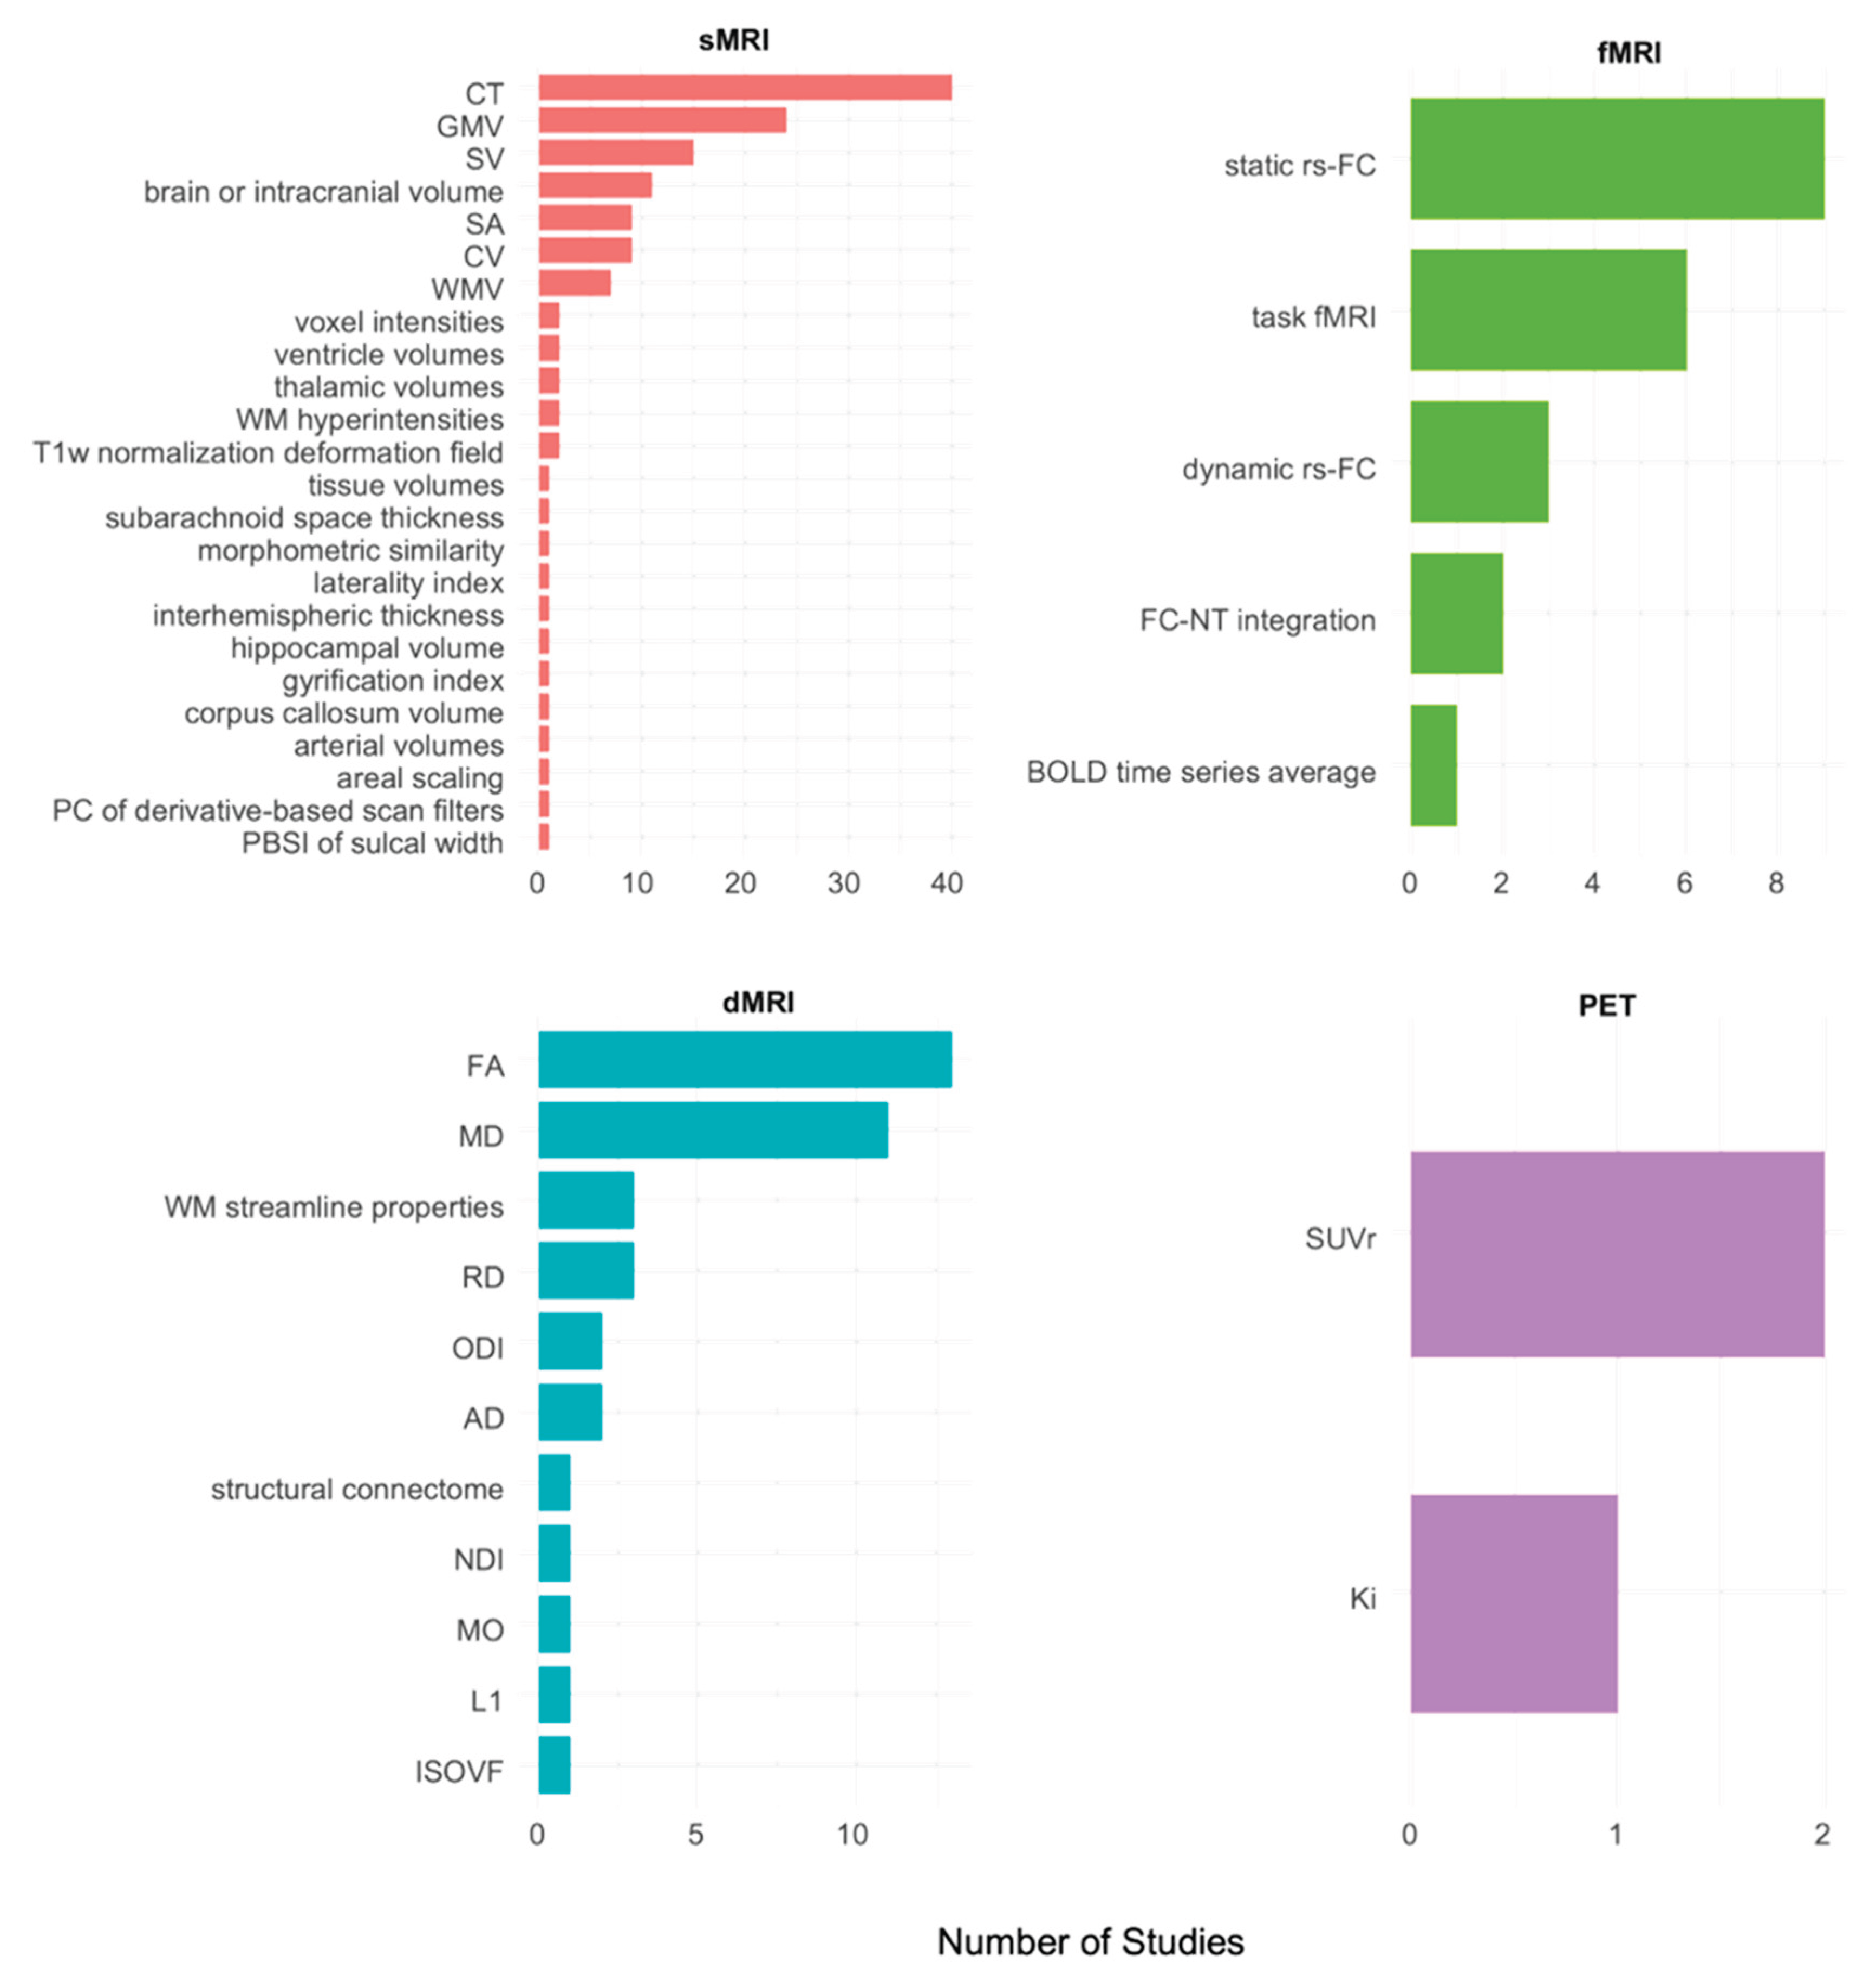
Disclaimer/Publisher’s Note: The statements, opinions and data contained in all publications are solely those of the individual author(s) and contributor(s) and not of MDPI and/or the editor(s). MDPI and/or the editor(s) disclaim responsibility for any injury to people or property resulting from any ideas, methods, instructions or products referred to in the content. |
© 2025 by the authors. Licensee MDPI, Basel, Switzerland. This article is an open access article distributed under the terms and conditions of the Creative Commons Attribution (CC BY) license (http://creativecommons.org/licenses/by/4.0/).
Copyright: This open access article is published under a Creative Commons CC BY 4.0 license, which permit the free download, distribution, and reuse, provided that the author and preprint are cited in any reuse.


