
Submitted:
25 September 2025
Posted:
29 September 2025
You are already at the latest version
Abstract
Accurate geospatial inventories of fruit orchards are essential for precision horticulture and food security, yet Pakistan lacks consistent datasets at district and tehsil levels. This study develops the first national-scale, ML-enabled framework for orchard delineation and yield estimation by integrating multi-temporal Sentinel-2 imagery on Google Earth Engine (GEE) with high-resolution Pakistan Remote Sensing Satellite-1(PRSS-1) data, advanced machine learning, and object-based image analysis (OBIA). Among tested classifiers, Random Forest (RF) achieved the highest performance on pixel-based Senti-nel-2 data (OA = 79.0%, κ = 0.78) outperforming Support Vector Machines (74.5%, κ = 0.74) and Gradient Boosting Decision Trees (73.8%, κ = 0.73), with improvements confirmed by McNemar’s test (p < 0.01). Integrating RF with OBIA on PRSS-1 imagery further enhanced delineation, increasing OA to 92.6% (κ = 0.89), with producer’s and user’s accuracies of 90.4% and 91.5%, and IoU improving from 0.71 to 0.86 (p < 0.01) in orchards. Yield modeling based on field-observed data showed mean- and median-based vegetation index aggregation performed best (R² = 0.77–0.79; error = 72–105 kg/tree), while extreme-value models performed poorly (R² = 0.46–0.56; error >560 kg/tree). The resulting validated geospatial inventory of citrus (Central Punjab) and mango (South Punjab) supports productivity forecasting, export planning, and resource allocation, demonstrating the transformative role of national space assets in advancing precision horticulture and strengthening food security in data-scarce regions
Keywords:
orchard delineation
; Sentinel‐2
; PRSS‐1
; google earth engine
; machine learning
; objectbased image analysis
; precision horticulture
; yield estimation
1. Introduction
Pakistan is among the world’s leading producers of citrus and mango, yet it lacks a validated national geospatial inventory of orchards — a critical gap that constrains yield forecasting, pest surveillance, and export competitiveness (Mani et al., 2022). This absence of spatially explicit orchard data hampers the transition from conventional farming to precision horticulture, where timely information on orchard extent, health, and productivity is essential for improving resilience against climate change and sustaining livelihoods (Das and Ansari, 2021).
Globally, remote sensing and machine learning have advanced significantly in mapping agricultural systems, enabling large-scale monitoring of croplands, plantations, and agroforestry. However, fruit orchards present unique challenges due to their irregular geometries, mixed cropping environments, and spectral similarity with other perennial vegetation (Messina and Modica, 2022). While studies from China, Europe, and the United States have demonstrated progress in orchard mapping and yield estimation (Giles et al., 2022; Guimarães et al., 2024) , most focus on localized scales with access to high-resolution commercial imagery. For countries like Pakistan, the high costs of such data and limited institutional capacity hinder operational deployment at national scale.
The availability of Sentinel-2 and Pakistan’s PRSS-1 satellite offers new opportunities to address this gap. Sentinel-2 provides global, free-access multispectral data at 10–20 m resolution (Segarra et al., 2020), while PRSS-1 (0.98-2.98m) offers locally acquired imagery at competitive costs compared to international commercial providers (Afsar et al., 2024). Leveraging these complementary datasets ensures cost-effective monitoring while maintaining sufficient spatial detail for delineating fragmented orchard landscapes.
In this study, we demonstrate the first national-scale framework for orchard monitoring in Pakistan by integrating machine learning with multisource satellite imagery. Our approach combines: (i) boundary delineation of citrus and mango orchards across major agro-ecological zones using pixel- and object-based classifiers, and (ii) non-destructive yield estimation (kg tree⁻¹) through field-calibrated modeling. This dual contribution—orchard boundary mapping and non-destructive yield forecasting—establishes a transferable framework for horticultural monitoring in data-scarce regions, offering both scientific novelty and direct policy relevance.
2. Materials and Methods
2.1. Study Area and Sampling Design
The study was conducted in Pakistan’s principal fruit-producing regions, encompassing citrus orchards in Central Punjab and mango orchards in South Punjab (Figure 1). Citrus orchards were distributed across multiple tehsils of Sargodha and Mandi Bahauddin, while mango orchards were delineated in Multan, Khanewal, and Rahim Yar Khan. Collectively, these districts constitute the country’s dominant citrus and mango export hubs and provide an ecologically representative testbed for Pakistan’s horticultural monitoring. Their inclusion ensured coverage of the largest contiguous orchard belts, thereby supporting the framework’s scalability to the national level. Importantly, the regions span distinct agro-climatic gradients—from arid to subtropical regimes—that strongly influence canopy structure, phenological cycles, and spectral response patterns (Rocha et al., 2021). This ecological heterogeneity created a rigorous environment for assessing the robustness, transferability, and scalability of the proposed orchard delineation–yield estimation framework, positioning it as a transferable tool for broader horticultural monitoring systems in data-scarce regions.
2.2. Data Sources and Preprocessing
This study integrated satellite observations with field data through a dual approach of orchard delineation and yield regression modeling. An overview of the methodological workflow is shown in Figure 2.
2.2.1. Satellite Data Acquisition
A multi-sensor strategy was adopted, integrating Sentinel-2 MSI (10–20 m, Level-2A) with Pakistan Remote Sensing Satellite-1 (PRSS-1, 0.98-2.89 m) imagery. Sentinel-2 data covering the 2019–2024 growing seasons were accessed via Google Earth Engine (GEE) platform. Bands from the visible, near-infrared (NIR), red-edge, and shortwave infrared (SWIR) regions were utilized due to their sensitivity to canopy vigor and structural attributes (Liu et al., 2021). Preprocessing in GEE involved Sen2Cor atmospheric correction, QA60-based cloud masking, and temporal median compositing to minimize atmospheric noise and seasonal variability (Flood, 2013) .
High-resolution PRSS-1 scenes, acquired during peak fruiting stages (December–February for citrus; June–August for mango) in 2022–2024 were employed for boundary refinement. Their fine spatial detail supports object-based segmentation and classification using spectral, geometric, and texture features, thus capturing orchard structure in fragmented landscapes (Fang et al., 2021).

Table 1.
Satellite datasets used for orchard delineation and yield estimation in Pakistan.
| Sensor / Platform | Spatial Resolution | Spectral Bands Used | Temporal Coverage | Purpose in Study |
| Sentinel-2 MSI (ESA, Level-2A) | 10–20 m | Visible, NIR, Red-Edge, SWIR | 2019–2024 growing seasons (multi-temporal composites) | Orchard classification, vegetation index derivation, yield modeling |
| PRSS-1 (Pakistan Remote Sensing Satellite-1) | 0.98-2.98 m | Panchromatic & Multispectral | 2022–2024 (peak fruiting stages) | Object-based boundary refinement, delineation in fragmented orchard landscapes |
2.2.2. Ground Truth and Validation Data
A stratified field sampling campaign was conducted across the study regions, yielding >1,500 GPS-referenced ground control points representing diverse orchard types, canopy architectures, age classes, and phenological stages. To ensure representativeness, sampling was distributed across ecological gradients and management regimes. The dataset was randomly partitioned into 70% for model training and 30% for independent validation, thereby preventing overfitting and ensuring objective accuracy assessment (Montesinos López et al., 2022). Geolocation accuracy of field points was rigorously cross-validated against PRSS-1 high-resolution imagery, reducing positional uncertainty and enabling precise alignment between ground observations and satellite-derived features.
2.2.3. Machine Learning Classifiers for Orchard Mapping
Three supervised machine learning classifiers—Random Forest (RF), Support Vector Machines (SVM), and Gradient Boosting Decision Trees (GBDT)—were comparatively evaluated within the GEE environment for orchard mapping. Model performance was quantified using Overall Accuracy and the Kappa coefficient (Verma et al., 2020b), based on independent validation datasets.
Among the tested algorithms, the RF classifier applied to Sentinel-2 imagery demonstrated the most robust and stable performance (OA = 78.9%, κ = 0.78), outperforming SVM and GBDT. Accordingly, RF was selected as the operational classifier for national-scale orchard delineation. The model was trained on 70% of stratified ground-truth data, while the remaining 30% was reserved for independent validation, ensuring reproducibility and unbiased accuracy assessment.
2.2.4. Object-Based Boundary Refinement
To overcome the limitations of pixel-based classification and enhance spatial fidelity, object-based image analysis (OBIA) was applied to high-resolution PRSS-1 imagery for boundary refinement. Multi-resolution segmentation was combined with rule-based classification, integrating spectral, textural, and geometric metrics to effectively distinguish orchard blocks from surrounding croplands and mixed-use mosaics (Kavzoglu and Tonbul, 2018). The resulting OBIA-derived orchard polygons were subsequently fused with the Sentinel-2 RF outputs, yielding a validated geospatial inventory with markedly improved boundary precision and classification reliability.
2.2.5. Accuracy Assessment
Accuracy assessment was conducted using an independent validation dataset. Standard classification metrics were computed, including Overall Accuracy (OA), Kappa coefficient (κ), Producer’s Accuracy (PA), and User’s Accuracy (UA). These metrics provide a comprehensive evaluation of model performance by quantifying both agreement with reference data and error distribution (Obi, 2023). Particular attention was given to minimizing commission and omission errors in fragmented orchard mosaics, ensuring that the assessment framework remained robust and transferable for large-scale horticultural monitoring.
2.2.6. Yield Regression Modeling
To translate spectral signals into productivity insights, orchard-level yields (kg/tree) were regressed against vegetation indices (NDVI, SAVI, NDRE, RENDVI, GNDVI, MCARI, NDMI, TNDVI) sensitive to canopy vigor, chlorophyll content, structural complexity, and water status (Sarvakar and Thakkar, 2024). For each orchard polygon, mean, median, maximum, and minimum VI aggregations were extracted as predictor variables to capture both central tendencies and extreme spectral responses.
Multiple linear regression models were developed with yield as the dependent variable and aggregated VI metrics as predictors. Model performance was assessed using R², adjusted R², and Standard Error of Estimate (SEE), supported by residual diagnostics and Variance Inflation Factor (VIF) analysis to control multicollinearity (Kim, 2019). ANOVA tests (p < 0.001) were also conducted to confirm statistical significance.
This integrated design—combining machine learning, object-based image analysis, and regression modeling—ensures both methodological reproducibility and operational transferability for large-scale horticultural monitoring.
3. Results
3.1. Classifier Performance for Orchard Delineation
The machine learning classifiers demonstrated strong potential for orchard delineation across agro-ecological zones. Among the tested classifiers, Random Forest (RF) consistently outperformed Support Vector Machines (SVM) and Gradient Boosting Decision Trees (GBDT) on pixel-based Sentinel-2 data. RF achieved an overall accuracy (OA) of 79.0% (95% CI: 77.2–80.7%) and κ = 0.78, compared with 74.5% (κ = 0.74) for SVM and 73.8% (κ = 0.73) for GBDT (Figure 3a). The performance gap was statistically significant (McNemar’s χ², p < 0.01).
The superior performance of RF is likely attributable to its ensemble-based architecture, which reduces overfitting relative to single decision trees and provides greater robustness to noise and spectral variability in heterogeneous orchard landscapes (Choi et al., 2025). RF’s ability to handle high-dimensional input features with minimal parameter tuning further enhanced its performance relative to GBDT and other parametric models (Yu et al., 2024).
Feature importance analysis (Figure 4) revealed that Red Edge (Bands 5 and 6), NIR (Band 8), and SWIR1 (Band 11) contributed most strongly to orchard–non-orchard discrimination, reflecting their sensitivity to canopy vigor, chlorophyll concentration, and structural water content. Temporal median compositing further improved robustness by suppressing phenological noise, in line with previous findings that red-edge and NIR bands are critical for perennial woody crop mapping, while SWIR1 enhances separation by capturing canopy moisture status (Savaliya and Raj, 2024).
3.2. Boundary Enhancement with OBIA and IoU Validation
The integration of RF outputs with OBIA substantially enhanced orchard boundary delineation, particularly in fragmented landscapes. Using PRSS-1 imagery for object-level refinement, the RF–OBIA increased OA from 79.0% to 92.6% (Δ = +13.6%, 95% CI: 10.1–13.9%) and κ from 0.78 to 0.89 (Figure 5a). Producer’s and User’s Accuracies also improved markedly reaching 90.3% and 89.6%, compared with 78.5% and 77.9% for baseline RF classifier. IoU scores rose from 0.71 to 0.86 (p < 0.01, paired t-test), with the greatest gains in orchards <5 ha.
Table 2.
Performance comparison of pixel-based RF and OBIA-enhanced classification.
| Classifier & Method | OA (%) | (κ) | PA (%) | UA (%) | Δ OA (%) | Δ κ | IoU |
| RF (Pixel-based, Sentinel-2) | 79.0 | 0.78 | 77.5 | 80.2 | – | – | 0.71 |
| SVM (Pixel-based, Sentinel-2) | 74.5 | 0.74 | 72.8 | 75.6 | –4.5 | –0.04 | 0.68 |
| GBDT (Pixel-based, Sentinel-2) | 73.8 | 0.73 | 71.9 | 74.1 | –5.2 | –0.05 | 0.67 |
| RF + OBIA (Sentinel-2 + PRSS-1) | 92.6 | 0.89 | 90.4 | 91.5 | +13.6 | +0.11 | 0.86 |
OBIA’s advantage to enhance orchard boundary refinement likely stems from its ability to exploit geometrical, textural, and contextual cues, suppressing spectral noise and reducing intra-class variability that often degrade per-pixel classifiers (Yang et al., 2022). High-resolution PRSS-1 imagery reinforced this benefit by retaining canopy-level detail, while temporal compositing reduced phenological misclassification, thereby improving class separability across growth stages (Fang et al., 2021). Together with RF’s ensemble robustness, these factors explain the superior performance of the RF–OBIA framework.
Visual comparisons of delineation outputs (Figure 5) confirmed its operational benefits: in both the citrus and mango belts, RF–OBIA boundaries exhibited smoother parcel edges, fewer omissions of small orchards, and closer alignment with IoU overlays than RF alone. The fusion of medium-resolution Sentinel-2 with high-resolution PRSS-1 delivered both landscape-level consistency and orchard-scale geometric fidelity.
3.3. Accuracy Assessment
Validation using 1,500 independent field samples confirmed the robustness of the RF + OBIA approach across districts. Overall Accuracy (OA) remained consistently above 91% (κ = 0.88–0.90), with misclassification rates below 9% (Table 3). Producer’s accuracy (PA) reached 96% for citrus and 94% for mango, while user’s accuracy (UA) exceeded 92% for both crops, highlighting the reliability of crop-specific delineation. Misclassifications were largely confined to fragmented parcels and mixed vegetation mosaics.
3.4. Benchmarking RF + OBIA
Benchmarking clearly demonstrates the added value of OBIA integration. RF–OBIA achieved OA = 92.6% and κ = 0.89, compared with OA = 79.0% and κ = 0.78 for pixel-based RF alone (Table 4; Figure 6a). Boundary precision improved from 65.0% to 85.3%, and temporal noise reduction tripled from 5.0% to 15.0%. A McNemar’s χ² test (χ² = 14.72, p < 0.001) confirmed these improvements were statistically significant.
Confusion matrices (Figure 6b) and orchard distribution maps (Figure 6c) further demonstrated that RF–OBIA yielded stronger class separation and more accurate spatial representation than RF alone. The approach consistently reduced boundary fragmentation and sensitivity to spectral noise, confirming its robustness for operational orchard monitoring in heterogeneous smallholder systems.
3.5. Yield Modeling Under Different Aggregation Strategies
Regression analysis revealed that aggregation strategy strongly influenced yield prediction accuracy. Mean- and median-based models explained up to 79% of yield variability (R² = 0.772–0.793) with low residual errors (72–105 kg/tree), whereas maximum- and minimum-based models performed poorly (R² = 0.46–0.56, residual errors >560 kg/tree) (Table 5).
Among vegetation indices, NDVI, SAVI, and TNDVI consistently emerged as the strongest
predictors under mean/median aggregation, reflecting their physiological linkage to canopy vigor
and fruit load. SAVI proved particularly robust in canopies with soil exposure or understory
vegetation (Guimarães et al., 2024) By contrast, MCARI and NDMI displayed unstable associations,
while red‐edge indices (NDRE, RENDVI) contributed moderately.
The superior performance of central tendency aggregation likely reflects its ability to suppress
localized anomalies (e.g., canopy gaps, edge effects, sensor noise), yielding stable and ecologically
representative signals of orchard vigor (Aravena, 2024). Scatterplots of observed versus predicted
yield (Figure 9) further confirmed this, with mean‐ and median‐based predictions clustering tightly
around the 1:1 line, while maximum/minimum models displayed flat slopes and wide scatter.
3.5.1. Correlation Analysis
Correlation matrices (Figure 7) confirmed NDVI, SAVI, and TNDVI as strong yield predictors (r ≈ 0.77–0.79) under mean/median aggregation. In contrast, maximum-based indices showed negligible correlations (r < 0.25) and minimum-based indices only moderate ones (r ≈ 0.40–0.48). MCARI and NDMI showed unstable relationships across strategies, while NDRE and RENDVI demonstrated moderate, but less direct, associations with yield.
3.5.2. Regression Modeling
Orchard-level yield maps derived from RF–OBIA delineation (Figure 8) captured pronounced spatial heterogeneity across the study area. Regression modeling confirmed that mean- and median-based indices provided the strongest predictive performance, explaining ~77–79% of variability with error margins <105 kg/tree. Maximum/minimum strategies remained unstable (R² = 0.41–0.51; errors >560 kg/tree). Together, Figure 8 and Figure 9 demonstrate that central tendency aggregations provide the most reliable foundation for operational yield forecasting frameworks.
3.5.3. Error Diagnostics
Residual diagnostics revealed no systematic bias for NDVI-, SAVI-, and TNDVI-based models, with most observations falling within ±2 standard errors of prediction and low-variance scatter around the regression line (Figure 10). By contrast, MCARI- and NDMI-driven models exhibited wider spreads and higher variance, reflecting sensitivity to localized moisture or structural effects that do not directly translate into yield outcomes. Slight underestimation occurred in high-yielding orchards, suggesting that unobserved factors such as tree age, density, or soil water availability influence yield ceilings.
Boxplot analysis (Figure 11) confirmed these findings: NDVI, SAVI, and TNDVI-based models exhibited narrow interquartile ranges and few outliers, while indices such as NDRE, MCARI, and NDMI produced broader, less reliable distributions. Together, these results establish central tendency aggregation of vegetation indices as the most stable and operationally reliable approach for yield modeling in orchards.
4. Discussion
The delineation of orchards using satellite imagery has long been hindered by fragmented planting patterns, canopy overlaps, and spectral confusion with surrounding vegetation. This study demonstrates that integrating Sentinel-2 with Pakistan’s high-resolution PRSS-1 imagery in an object-based Random Forest framework markedly improves boundary delineation across diverse agro-ecological zones, while vegetation index aggregation—particularly mean and median strategies—provides stable and accurate yield predictions. Collectively, these advances establish a nationally grounded geospatial approach for precision horticulture in a context where official orchard inventories have been absent.
Compared with earlier studies that relied primarily on Landsat or other single-source imagery (Tanveer et al., 2024; Verma et al., 2020a), our framework achieved higher IoU, underscoring the value of ensemble and object-based methods for handling mixed-pixel environments and smallholder-dominated systems. By reducing spectral noise and boundary fragmentation, RF–OBIA delivers both robustness and transferability. Beyond delineation, the workflow provides a scalable foundation for yield estimation, disease and stress monitoring, and integration into geospatial decision-support systems. Its implementation on Google Earth Engine enables near real-time monitoring at provincial and national levels, demonstrating operational feasibility.
The broader implications lie in direct benefits at multiple scales. At the farm level, accurate delineation and yield forecasting support optimized irrigation, canopy management, and targeted pest control (Celis et al., 2024). At regional and national scales, orchard inventories and forecasts inform supply-chain planning, export strategies, and subsidy allocation. Coupling satellite-derived vegetation metrics with agro-climatic datasets further enables dynamic early-warning systems for drought, heat stress, and pest outbreaks, enhancing resilience of perennial fruit systems and strengthening national food security (ğ atay NALÇAOĞLU et al., 2025).
Despite these advances, limitations highlight opportunities for further refinement. Reliance on aggregated spectral indices constrains sensitivity to within-canopy variability, while regression models may oversimplify the complex links between canopy condition and yield (Trentin et al., 2024). Incorporating phenology-specific metrics, hyperspectral or LiDAR data, and advanced deep learning frameworks (e.g., CNNs, transformers) could capture nonlinear relationships and structural dynamics more effectively. Future research should therefore prioritize: (i) multi-modal data fusion of optical, radar, and climatic variables; and (ii) multi-temporal analysis for forecasting yield and early detecting disease outbreaks.
Overall, synergizing multi-sensor imagery with machine learning provides a transferable pathway for cost-effective orchard monitoring in data-scarce regions. By bridging methodological innovation with practical utility, this study lays the foundation for next-generation geospatial support systems for precision horticulture in Pakistan.
5. Conclusions
This study demonstrates that combining multi-source satellite imagery with object-based Random Forest classification and vegetation index aggregation provides a robust, scalable approach for orchard monitoring in Pakistan. Three major contributions stand out: (i) improved orchard boundary delineation through object-based classification that effectively addresses intra-class variability and preserves canopy-level structure, (ii) stable and accurate yield prediction achieved using central tendency aggregation of vegetation indices—particularly NDVI, SAVI, and TNDVI—while minimizing noise from extreme-value strategies; and (iii) physiologically grounded predictions of orchard productivity. Together, these advances move beyond static mapping toward predictive, analytics-driven decision support.
The methodology’s validation across diverse orchard systems underscores its transferability to heterogeneous, smallholder-dominated systems, bridging a long-standing gap in Pakistan’s agricultural data infrastructure. By enabling reliable delineation and yield estimation at multiple scales, it offers clear pathways for adoption in precision management, supply chain planning, and national-level monitoring.
More broadly, this work highlights how synergizing national and international satellite assets with machine learning can operationalize geospatial data for perennial fruit systems in data-scarce regions. In doing so, it strengthens the scientific foundation for climate resilience, export competitiveness, and evidence-based agricultural policy, while laying the groundwork for next-generation horticultural monitoring platforms.
Author Contributions
Conceptualization, Ansar Ali and Amjad Ali; methodology, Ansar Ali and Ibrar ul Hassan Akhtar ; software and validation; Maisam Raza; formal analysis, Ibrar ul Hassan Akhtar and Maisam Raza; investigation and data curation, Ansar Ali; writing—original draft preparation, Ansar Ali; writing—review and editing, Ansar Ali and Ibrar ul Hassan Akhtar; visualization and project administration; Amjad Ali. All authors have read and agreed to the published version of the manuscript.
Funding
This research received no external funding.
Conflicts of Interest
The authors declare no conflicts of interest.
Abbreviations
The following abbreviations are used in this manuscript:
| OBIA | Object-Based Image Analysis |
| RF | Random Forest |
| SVM | Support Vector Machine |
| GBDT | Gradient Boosted Decision Trees |
| PRSS-1 | Pakistan Remote Sensing Satellite-1 |
| NDVI | Normalized Difference Vegetation Index |
| SAVI | Soil-Adjusted Vegetation Index |
| TNDVI | Transformed Normalized Difference Vegetation Index |
| NDRE | Normalized Difference Red Edge Index |
| RENDVI | Red Edge Normalized Difference Vegetation Index |
| MCARI | Modified Chlorophyll Absorption Ratio Index |
| NDMI | Normalized Difference Moisture Index |
| VI | Vegetation Index |
| CNN | Convolutional Neural Network |
| OBIA | Object-Based Image Analysis |
| AI | Artificial Intelligence |
| EO | Earth Observation |
| GEE | Google Earth Engine |
| GIS | Geographic Information System |
| IoU | Intersection over Union |
| ML | Machine Learning |
| PRSS-1 | Pakistan Remote Sensing Satellite-1 |
| RS | Remote Sensing |
| SUPARCO | Space and Upper Atmosphere Research Commission |
| UAV | Unmanned Aerial Vehicle |
References
- Afsar M.M., Bakhshi A.D., Hussain E., Iqbal J. (2024) A deep learning-based framework for object recognition in ecological environments with dense focal loss and occlusion. Neural Computing and Applications 36:9591-9604.
- Aravena R. (2024) Satellite Imagery Interpretation for Environmental Mapping and Monitoring, UNSW Sydney.
- Celis J., Xiao X., Wagle P., Adler P.R., White P. (2024) A review of yield forecasting techniques and their impact on sustainable agriculture. Transformation Towards Circular Food Systems:139-168.
- Choi J.W., Hidayat M.S., Cho S.B., Hwang W.-H., Lee H., Cho B.-K., Kim M.S., Baek I., Kim G. (2025) Recent Trends in Machine Learning, Deep Learning, Ensemble Learning, and Explainable Artificial Intelligence Techniques for Evaluating Crop Yields Under Abnormal Climate Conditions. Plants 14:2841.
- Das U., Ansari M. (2021) The nexus of climate change, sustainable agriculture and farm livelihood: contextualizing climate smart agriculture. Climate Research 84:23-40.
- Fang Z., Ji W., Wang X., Li L., Li Y. (2021) Automatic cloud and snow detection for GF-1 and PRSS-1 remote sensing images. Journal of Applied Remote Sensing 15:024516-024516.
- Flood N. (2013) Seasonal composite Landsat TM/ETM+ images using the medoid (a multi-dimensional median). Remote Sensing 5:6481-6500.
- ğ atay NALÇAOĞLU Ç., NALÇAOĞLU D.H., DOĞRU A., YAPRAK S. (2025) Predicting Olive Yield in Mediterranean Climate Zones of Türkiye Using Remote Sensing and Artificial Neural Networks: A Case Study of Muğla Province.
- Giles J., Mufti S., Khan M., Alarcon De Anton M., Chabot P. (2022) Climate-smart agriculture investment plan Punjab and Khyber Pakhtunkhwa.
- Guimarães N., Sousa J.J., Pádua L., Bento A., Couto P. (2024) Remote sensing applications in almond orchards: A comprehensive systematic review of current insights, research gaps, and future prospects. Applied Sciences 14:1749.
- Kavzoglu T., Tonbul H. (2018) An experimental comparison of multi-resolution segmentation, SLIC and K-means clustering for object-based classification of VHR imagery. International journal of remote sensing 39:6020-6036.
- Kim J.H. (2019) Multicollinearity and misleading statistical results. Korean journal of anesthesiology 72:558-569.
- Liu Y., Qian J., Yue H. (2021) Comprehensive evaluation of Sentinel-2 red edge and shortwave-infrared bands to estimate soil moisture. IEEE Journal of Selected Topics in Applied Earth Observations and Remote Sensing 14:7448-7465.
- Mani J.K., Varghese A., Sreenivasan G., Jha C. (2022) Management of Citrus Orchards in Central India using Geospatial Technology, Geospatial Technologies for Resources Planning and Management, Springer. pp. 297-314.
- Messina G., Modica G. (2022) The role of remote sensing in olive growing farm management: a research outlook from 2000 to the present in the framework of precision agriculture applications. Remote Sensing 14:5951.
- Montesinos López O.A., Montesinos López A., Crossa J. (2022) Overfitting, model tuning, and evaluation of prediction performance, Multivariate statistical machine learning methods for genomic prediction, Springer. pp. 109-139.
- Obi J.C. (2023) A comparative study of several classification metrics and their performances on data. World Journal of Advanced Engineering Technology and Sciences 8:308-314.
- Rocha G.A.O., Pichimata M.A., Villagran E. (2021) Research on the microclimate of protected agriculture structures using numerical simulation tools: a technical and bibliometric analysis as a contribution to the sustainability of under-cover cropping in tropical and subtropical countries. Sustainability 13:10433.
- Sarvakar K., Thakkar M. (2024) Different vegetation indices measurement using computer vision, Applications of computer vision and drone technology in agriculture 4.0, Springer. pp. 133-163.
- Savaliya M., Raj M. (2024) Advancement in multisensor remote sensing studies for assessing crop health, Vegetation Dynamics and Crop Stress, Elsevier. pp. 93-112.
- Segarra J., Buchaillot M.L., Araus J.L., Kefauver S.C. (2020) Remote sensing for precision agriculture: Sentinel-2 improved features and applications. Agronomy 10:641.
- Tanveer M.U., Munir K., Raza A., Almutairi M.S. (2024) Novel artificial intelligence assisted Landsat-8 imagery analysis for mango orchard detection and area mapping. Plos one 19:e0304450.
- Trentin C., Ampatzidis Y., Lacerda C., Shiratsuchi L. (2024) Tree crop yield estimation and prediction using remote sensing and machine learning: A systematic review. Smart Agricultural Technology 9:100556.
- Verma H.C., Ahmed T., Rajan S. (2020a) Mapping and area estimation of mango orchards of Lucknow region by applying knowledge based decision tree to Landsat 8 OLI Satellite Images. International Journal of Innovative Technology and Exploring Engineering (IJITEE) 9:3627-3635.
- Verma P., Raghubanshi A., Srivastava P.K., Raghubanshi A. (2020b) Appraisal of kappa-based metrics and disagreement indices of accuracy assessment for parametric and nonparametric techniques used in LULC classification and change detection. Modeling Earth Systems and Environment 6:1045-1059.
- Yang K., Zhang H., Wang F., Lai R. (2022) Extraction of Broad-Leaved tree crown based on UAV visible images and OBIA-RF model: A case study for Chinese Olive Trees. Remote Sensing 14:2469.
- Yu J., Zhang Y., Song Z., Jiang D., Guo Y., Liu Y., Chang Q. (2024) Estimating leaf area index in apple orchard by UAV multispectral images with spectral and texture information. Remote Sensing 16:3237.
Figure 1.
Geographic location of the study areas: (top) citrus -producing districts (Sargodha and Mandi Bahauddin) and (bottom) mango-producing districts (Multan, Khanewal, and Rahim Yar Khan).
Figure 1.
Geographic location of the study areas: (top) citrus -producing districts (Sargodha and Mandi Bahauddin) and (bottom) mango-producing districts (Multan, Khanewal, and Rahim Yar Khan).
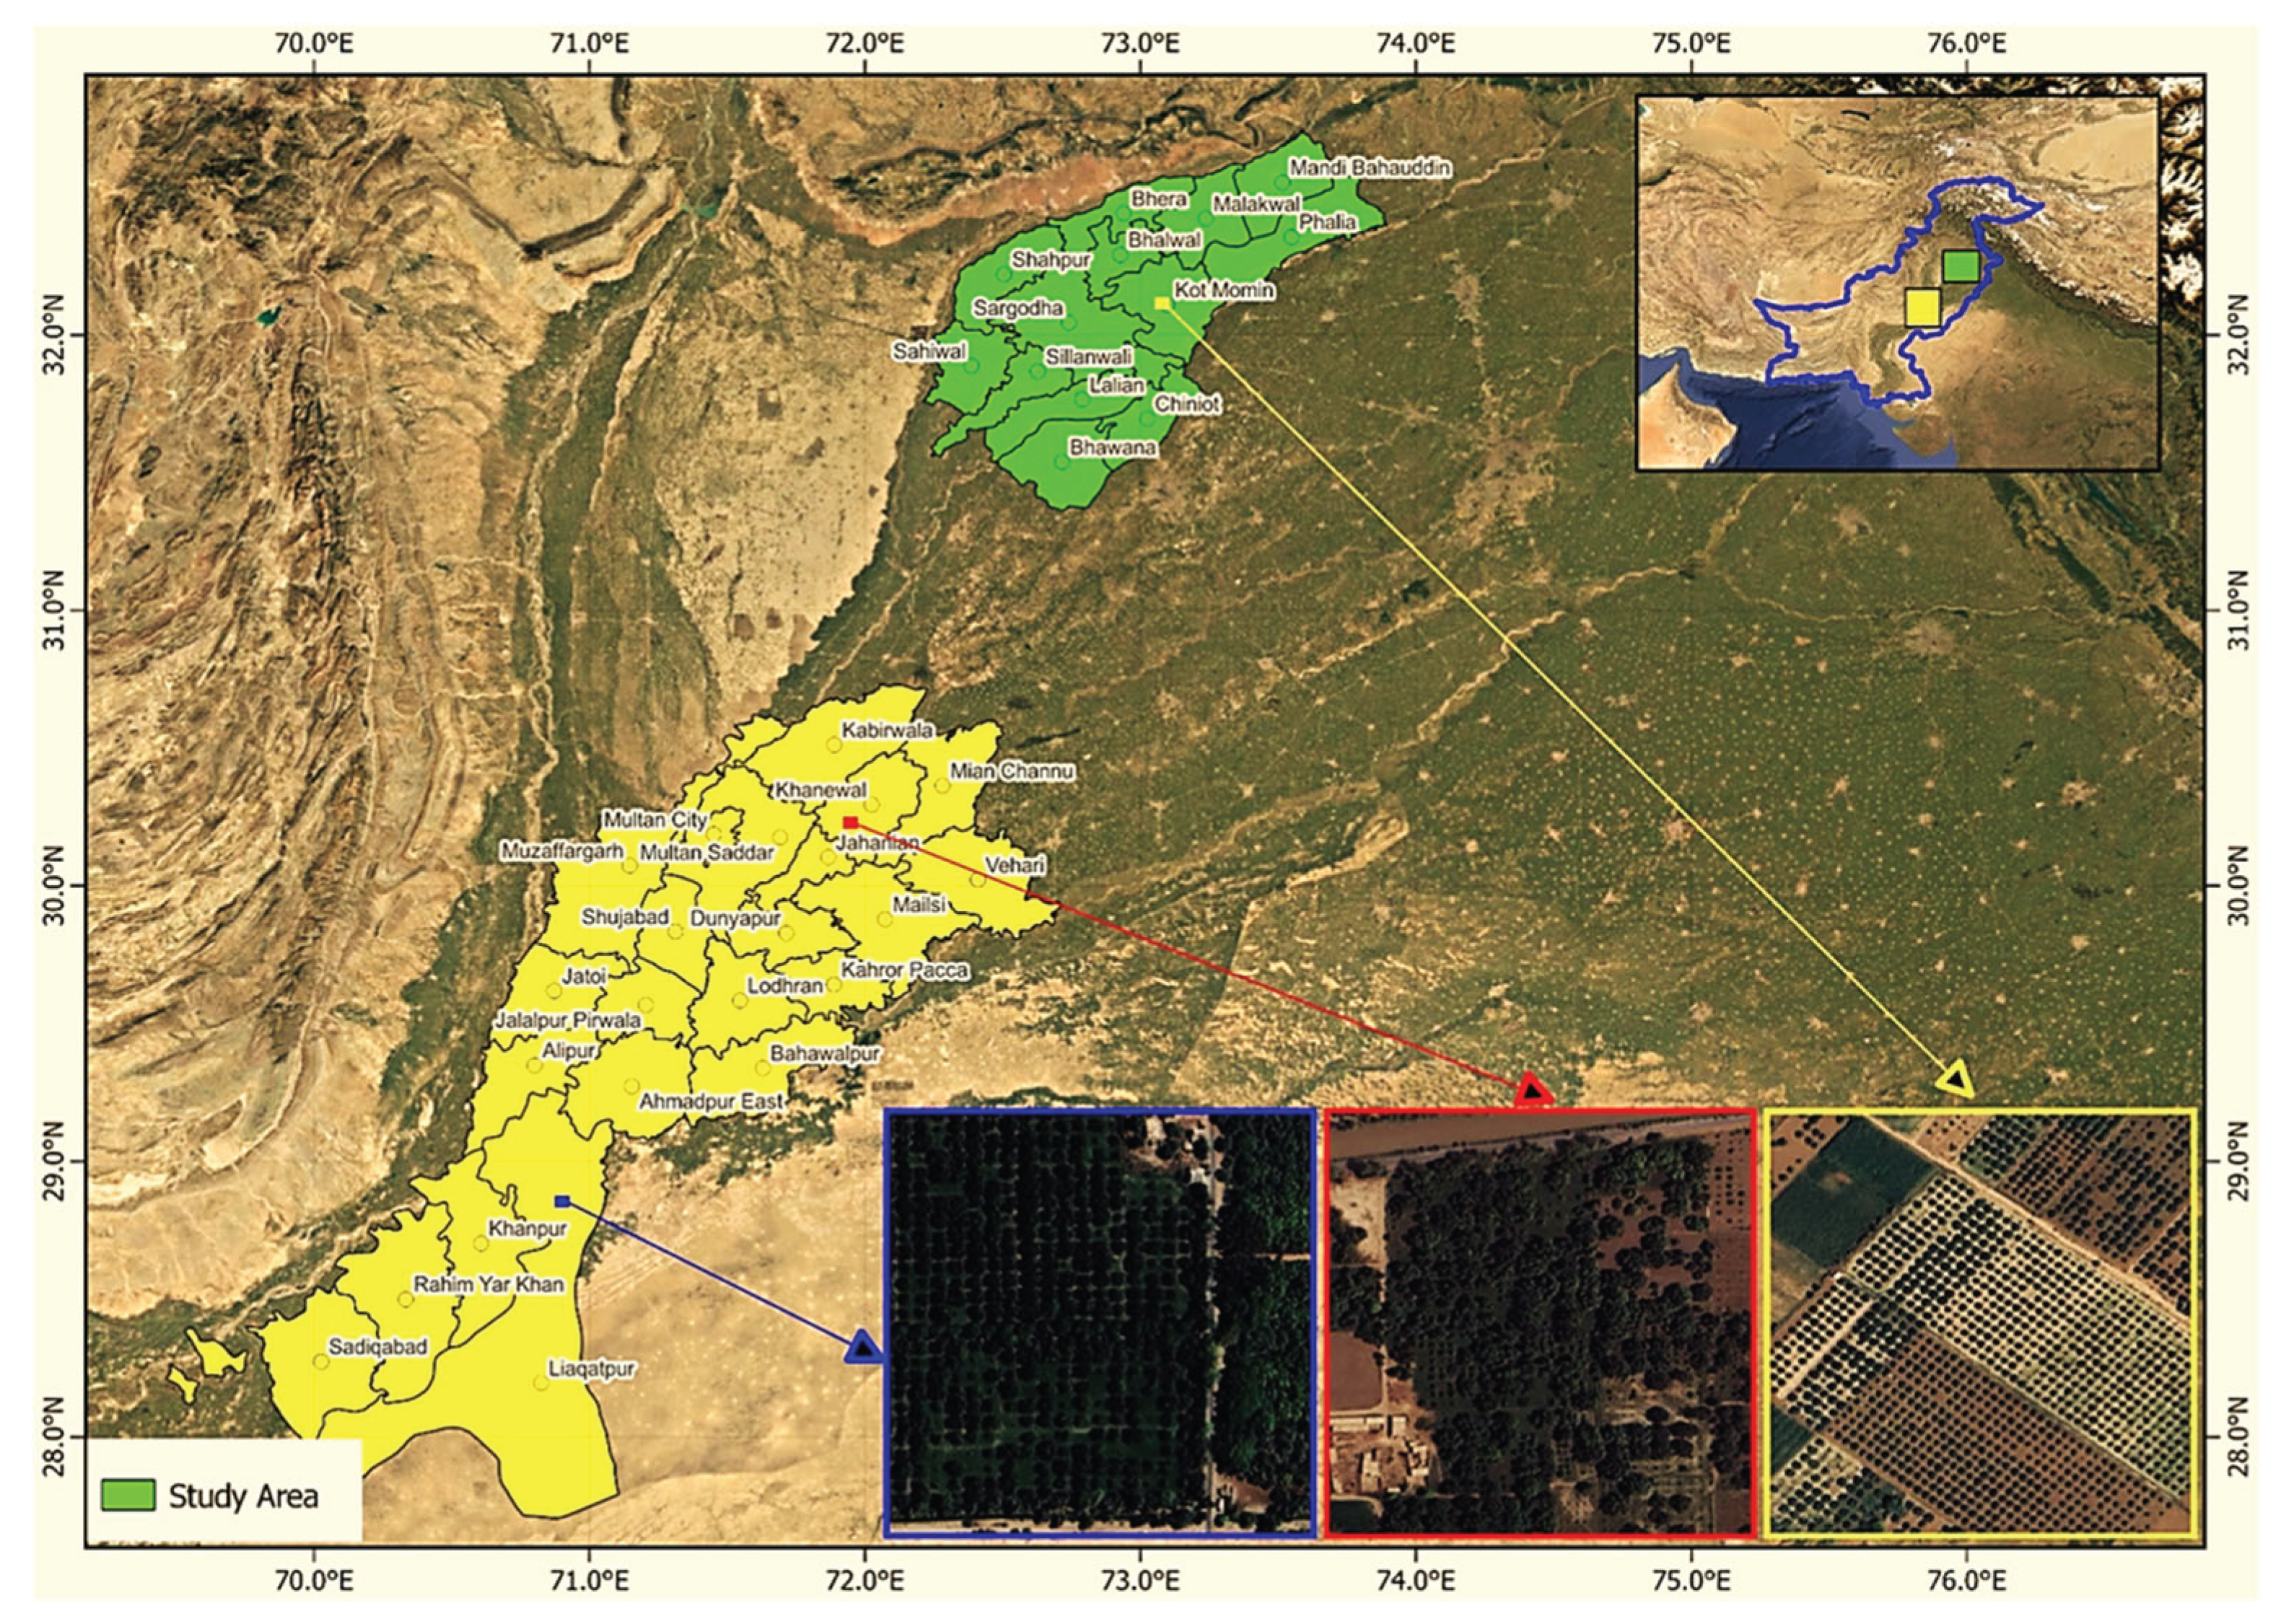
Figure 2.
Workflow of the study methodology, illustrating the dual components of fruit orchard delineation (left) and yield regression modeling (right).
Figure 2.
Workflow of the study methodology, illustrating the dual components of fruit orchard delineation (left) and yield regression modeling (right).
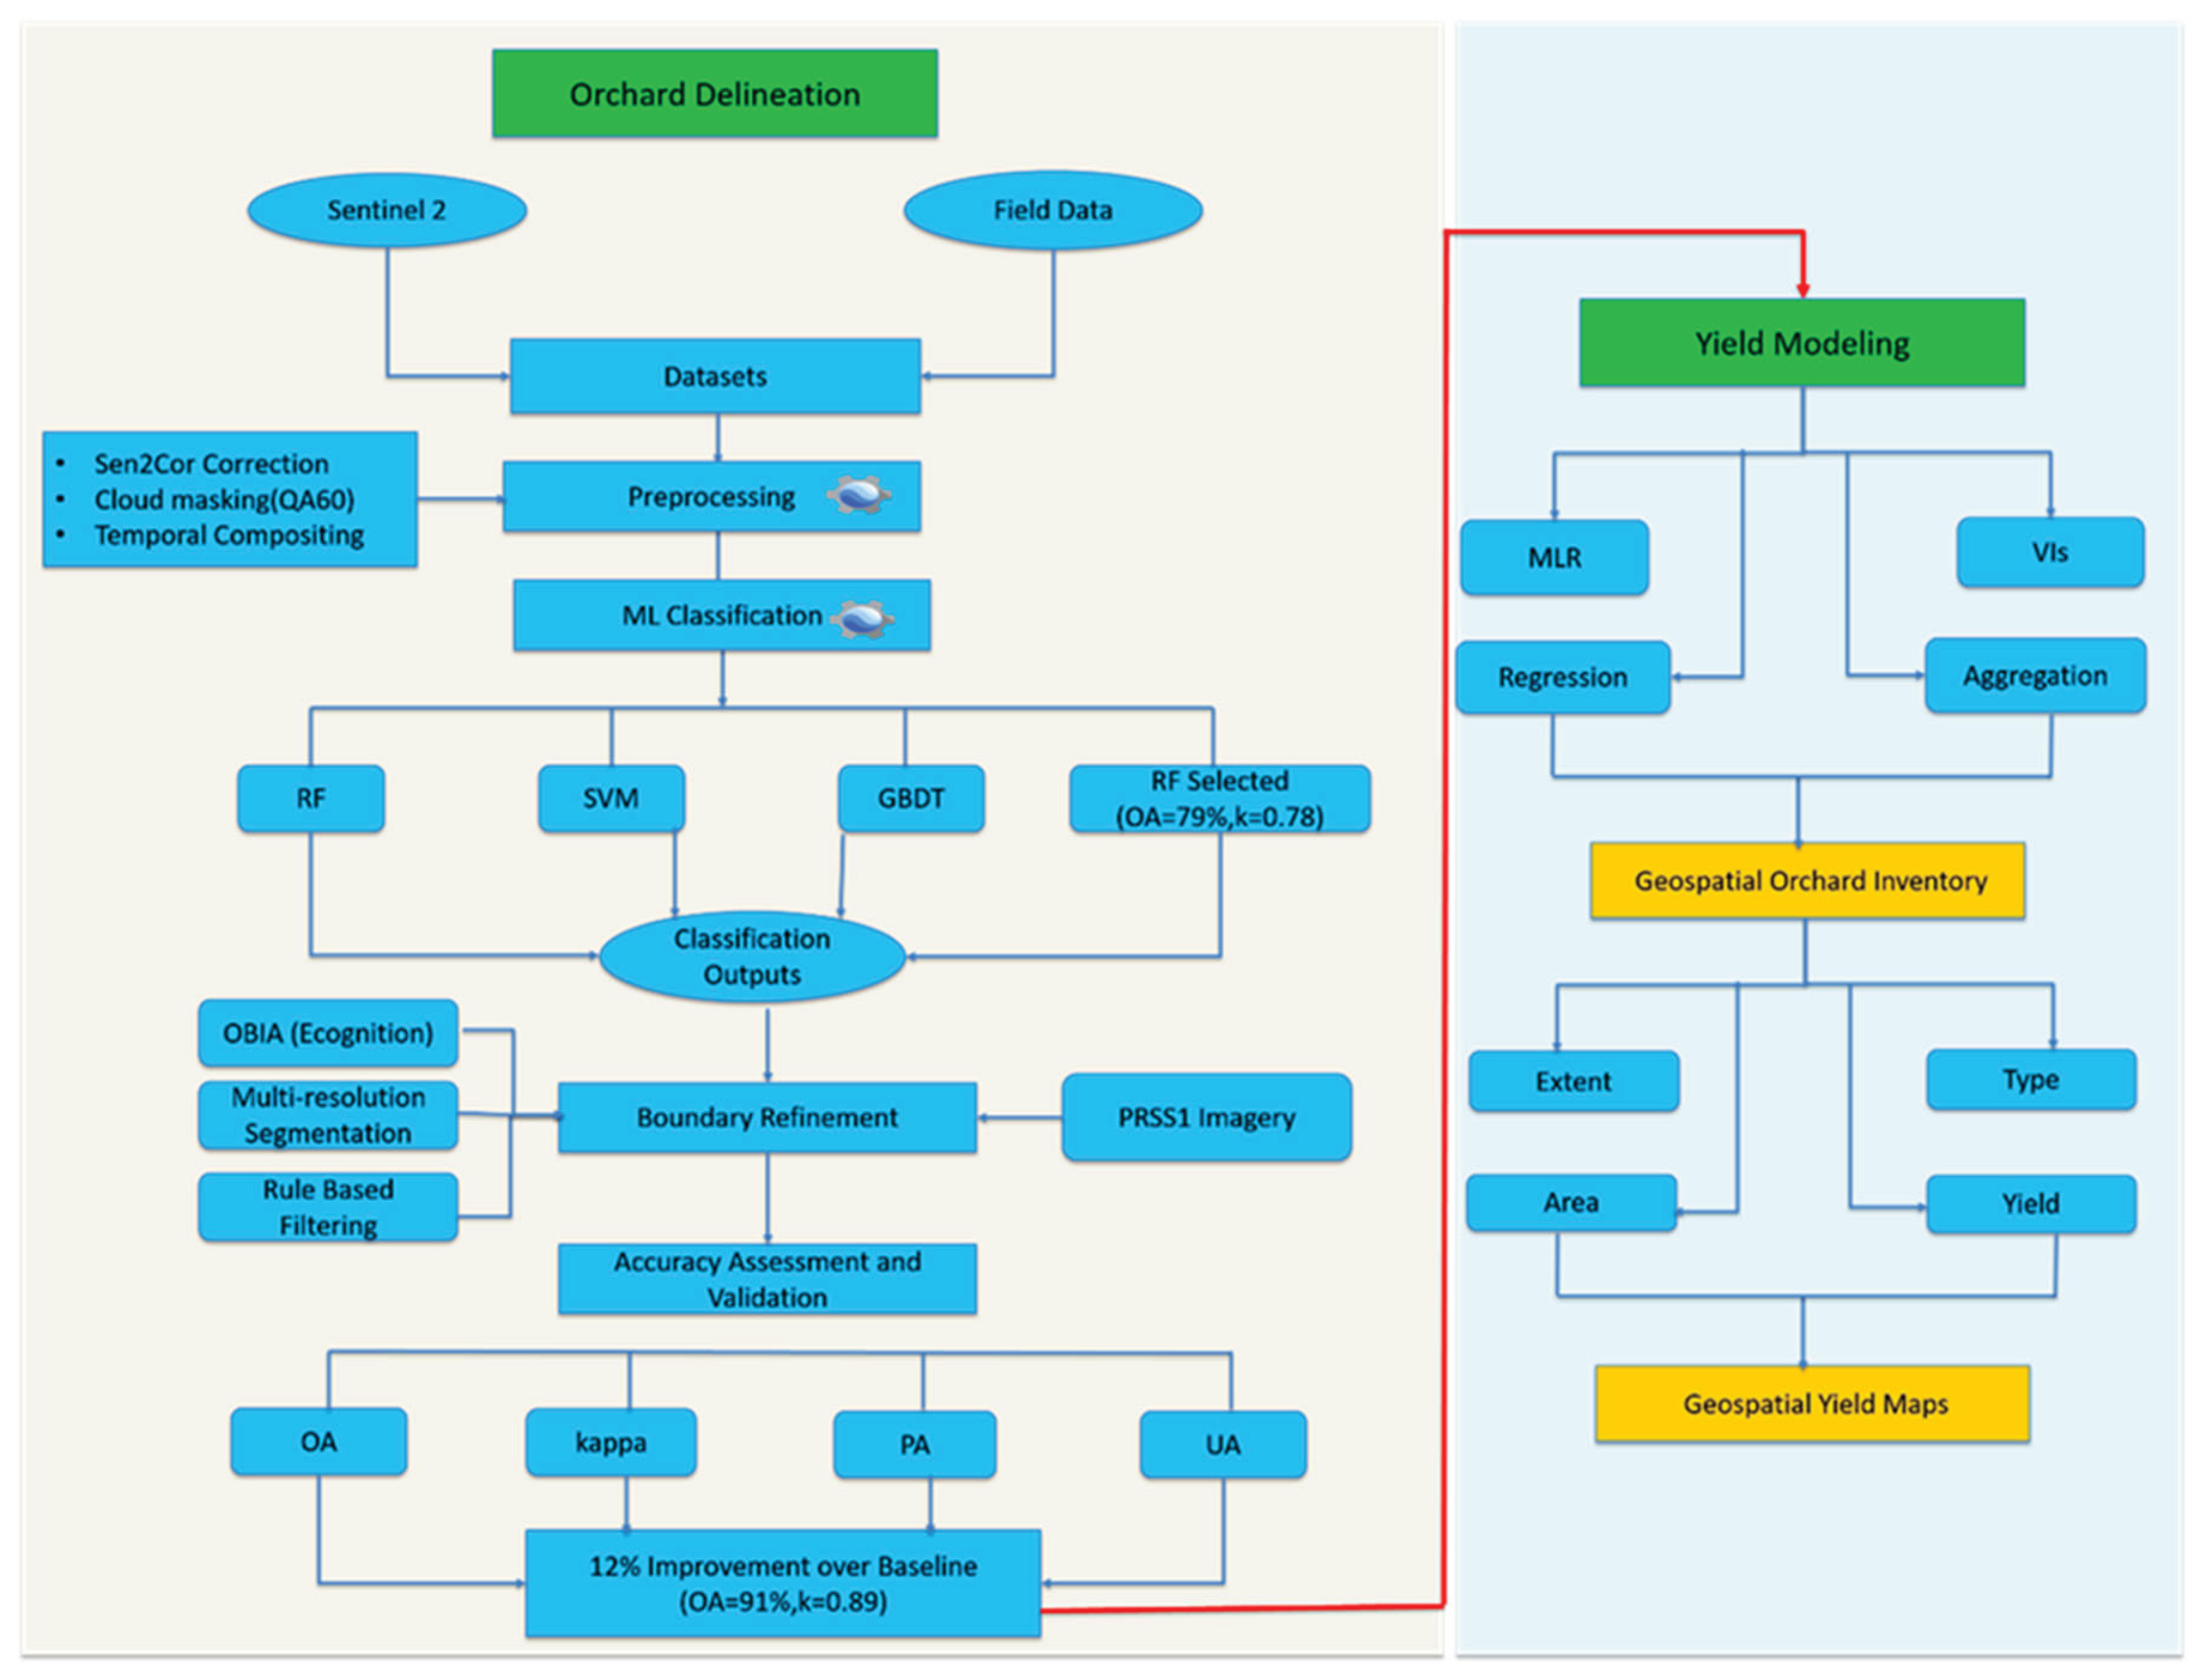
Figure 3.
Classifier performance for orchard delineation (a) and boundary precision gains with OBIA.
Figure 3.
Classifier performance for orchard delineation (a) and boundary precision gains with OBIA.
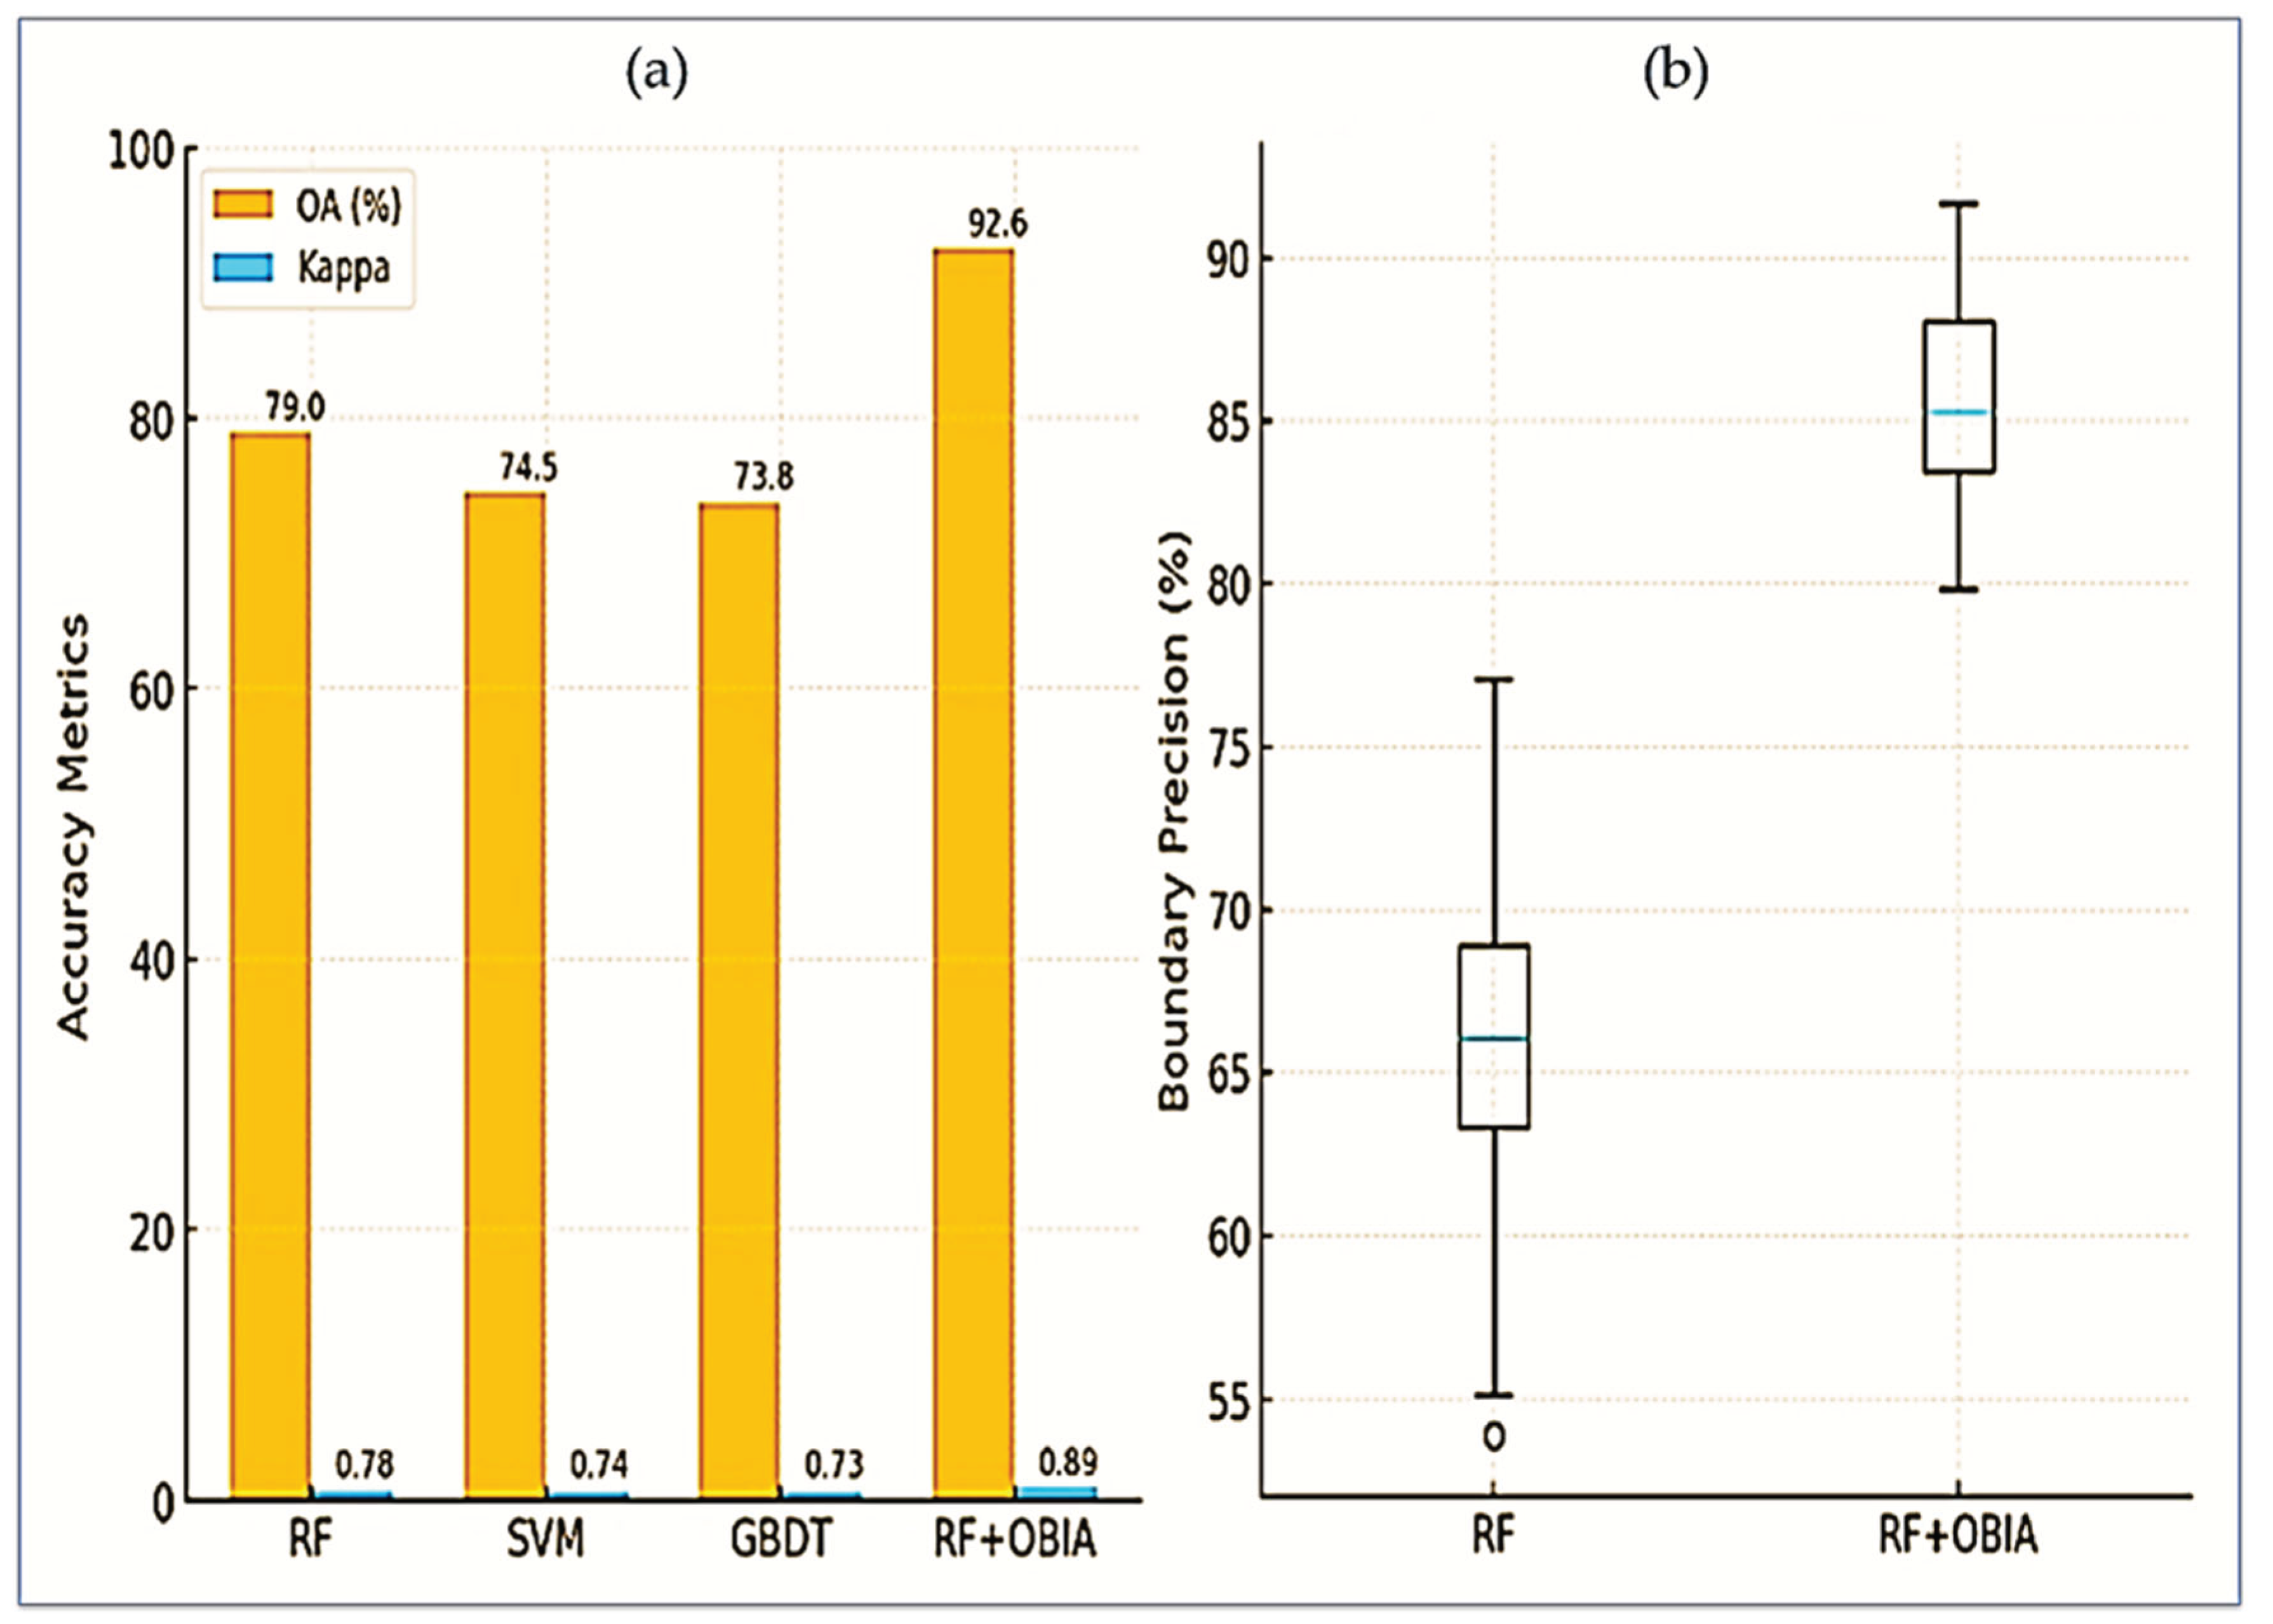
Figure 4.
Relative contribution of Sentinel-2 spectral bands for orchard delineation using the RF model.
Figure 4.
Relative contribution of Sentinel-2 spectral bands for orchard delineation using the RF model.
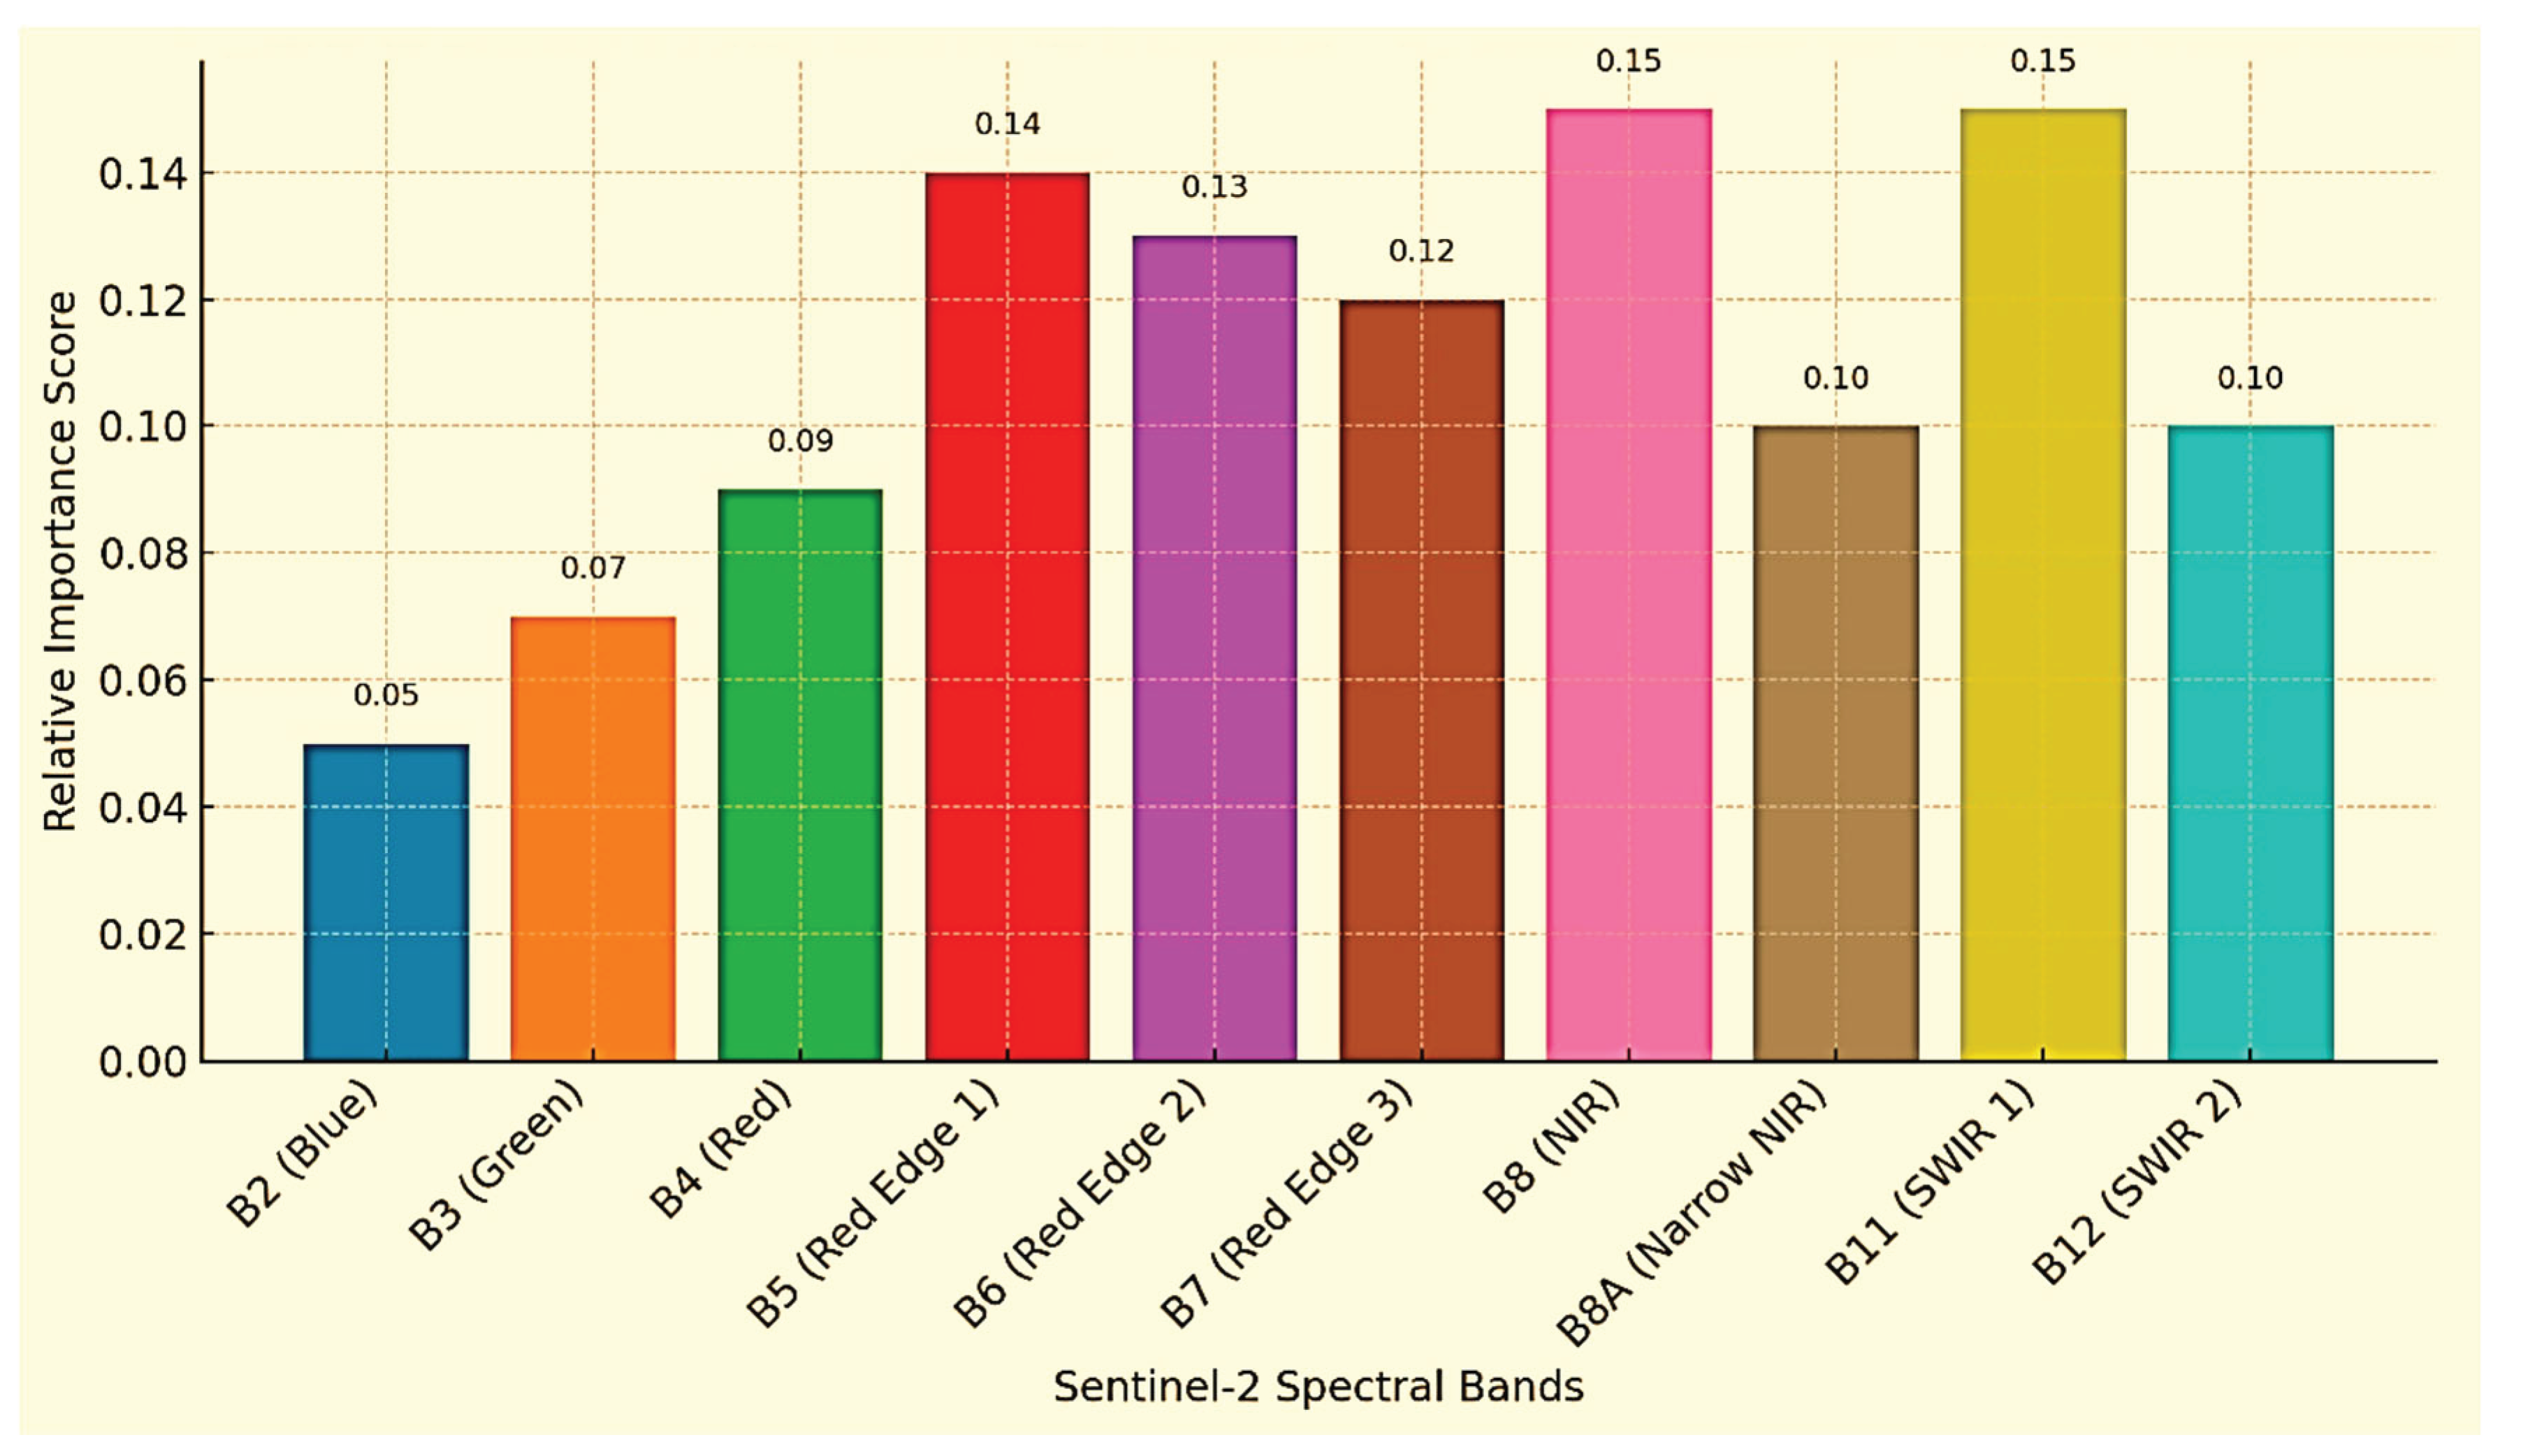
Figure 5.
Orchard delineation in (a) citrus belt (Central Punjab) and (b) mango belt (South Punjab), comparing RF (magenta), RF + OBIA (cyan), and IoU validation overlays.
Figure 5.
Orchard delineation in (a) citrus belt (Central Punjab) and (b) mango belt (South Punjab), comparing RF (magenta), RF + OBIA (cyan), and IoU validation overlays.
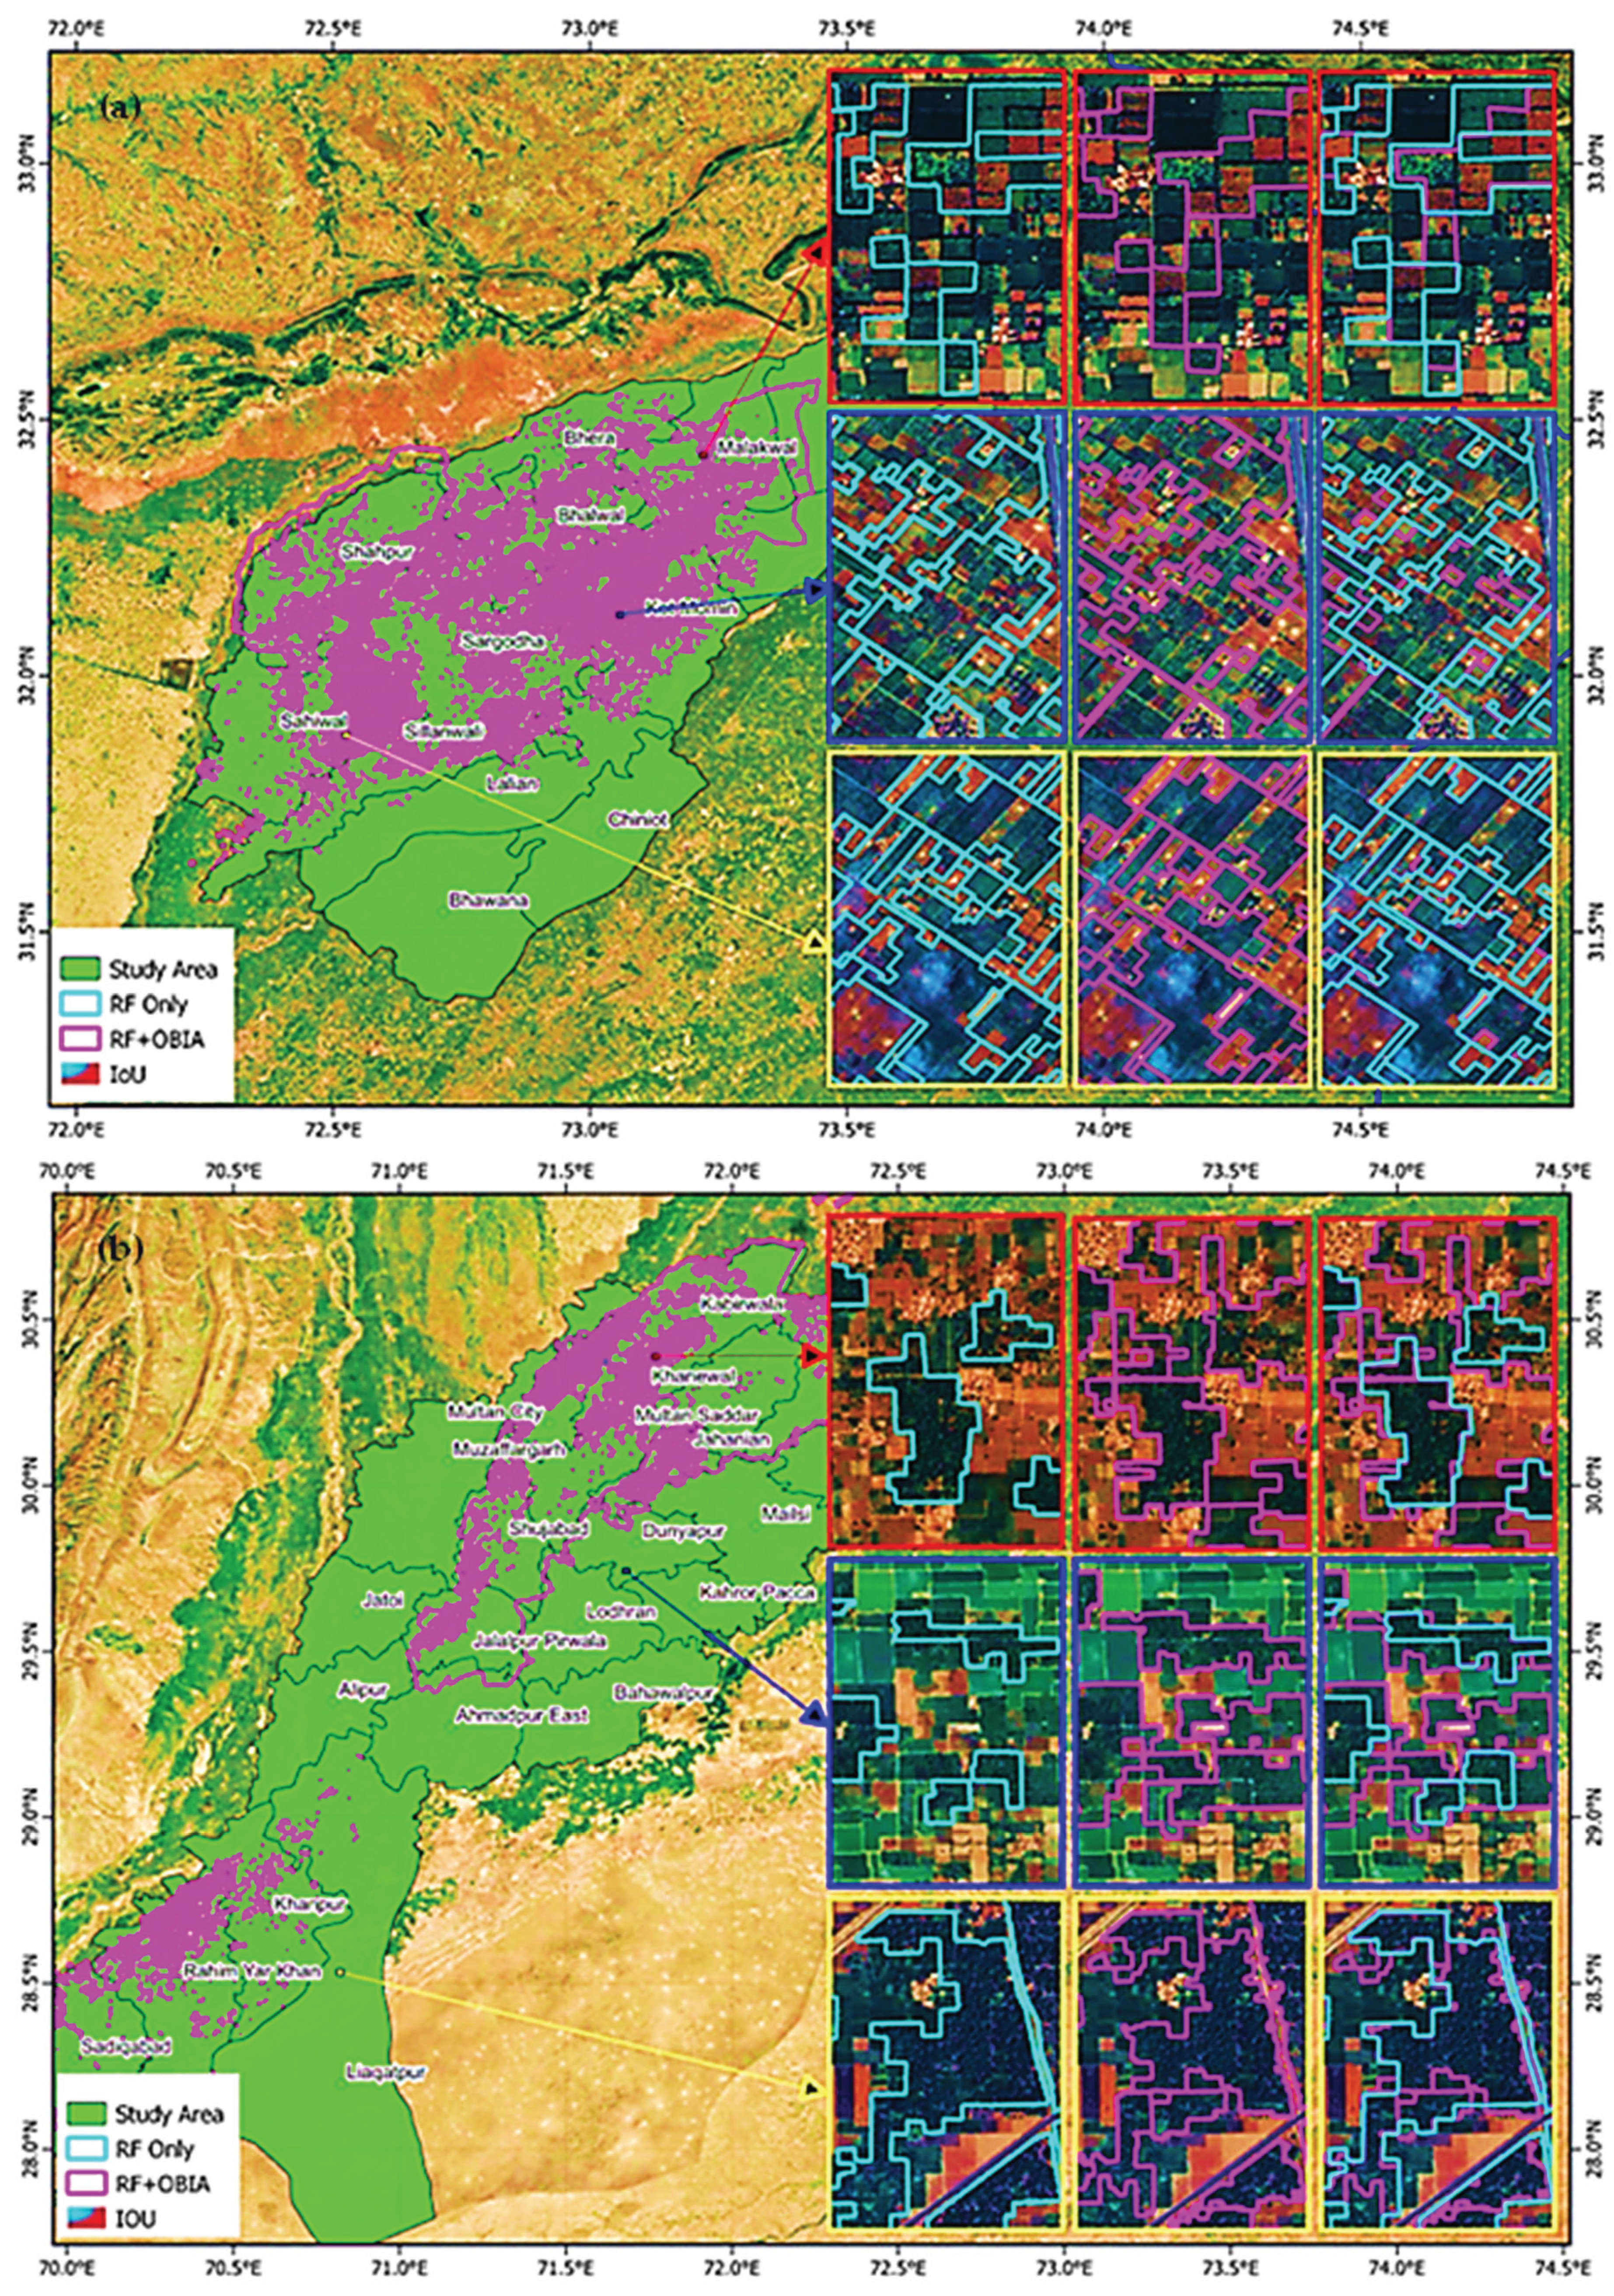
Figure 6.
Benchmarking RF + OBIA against pixel-based RF: (a) accuracy comparison, (b) confusion matrix of RF + OBIA, (c) orchard type distribution from validated inventory, and (d) IoU-based gains in accuracy and boundary precision across districts.
Figure 6.
Benchmarking RF + OBIA against pixel-based RF: (a) accuracy comparison, (b) confusion matrix of RF + OBIA, (c) orchard type distribution from validated inventory, and (d) IoU-based gains in accuracy and boundary precision across districts.
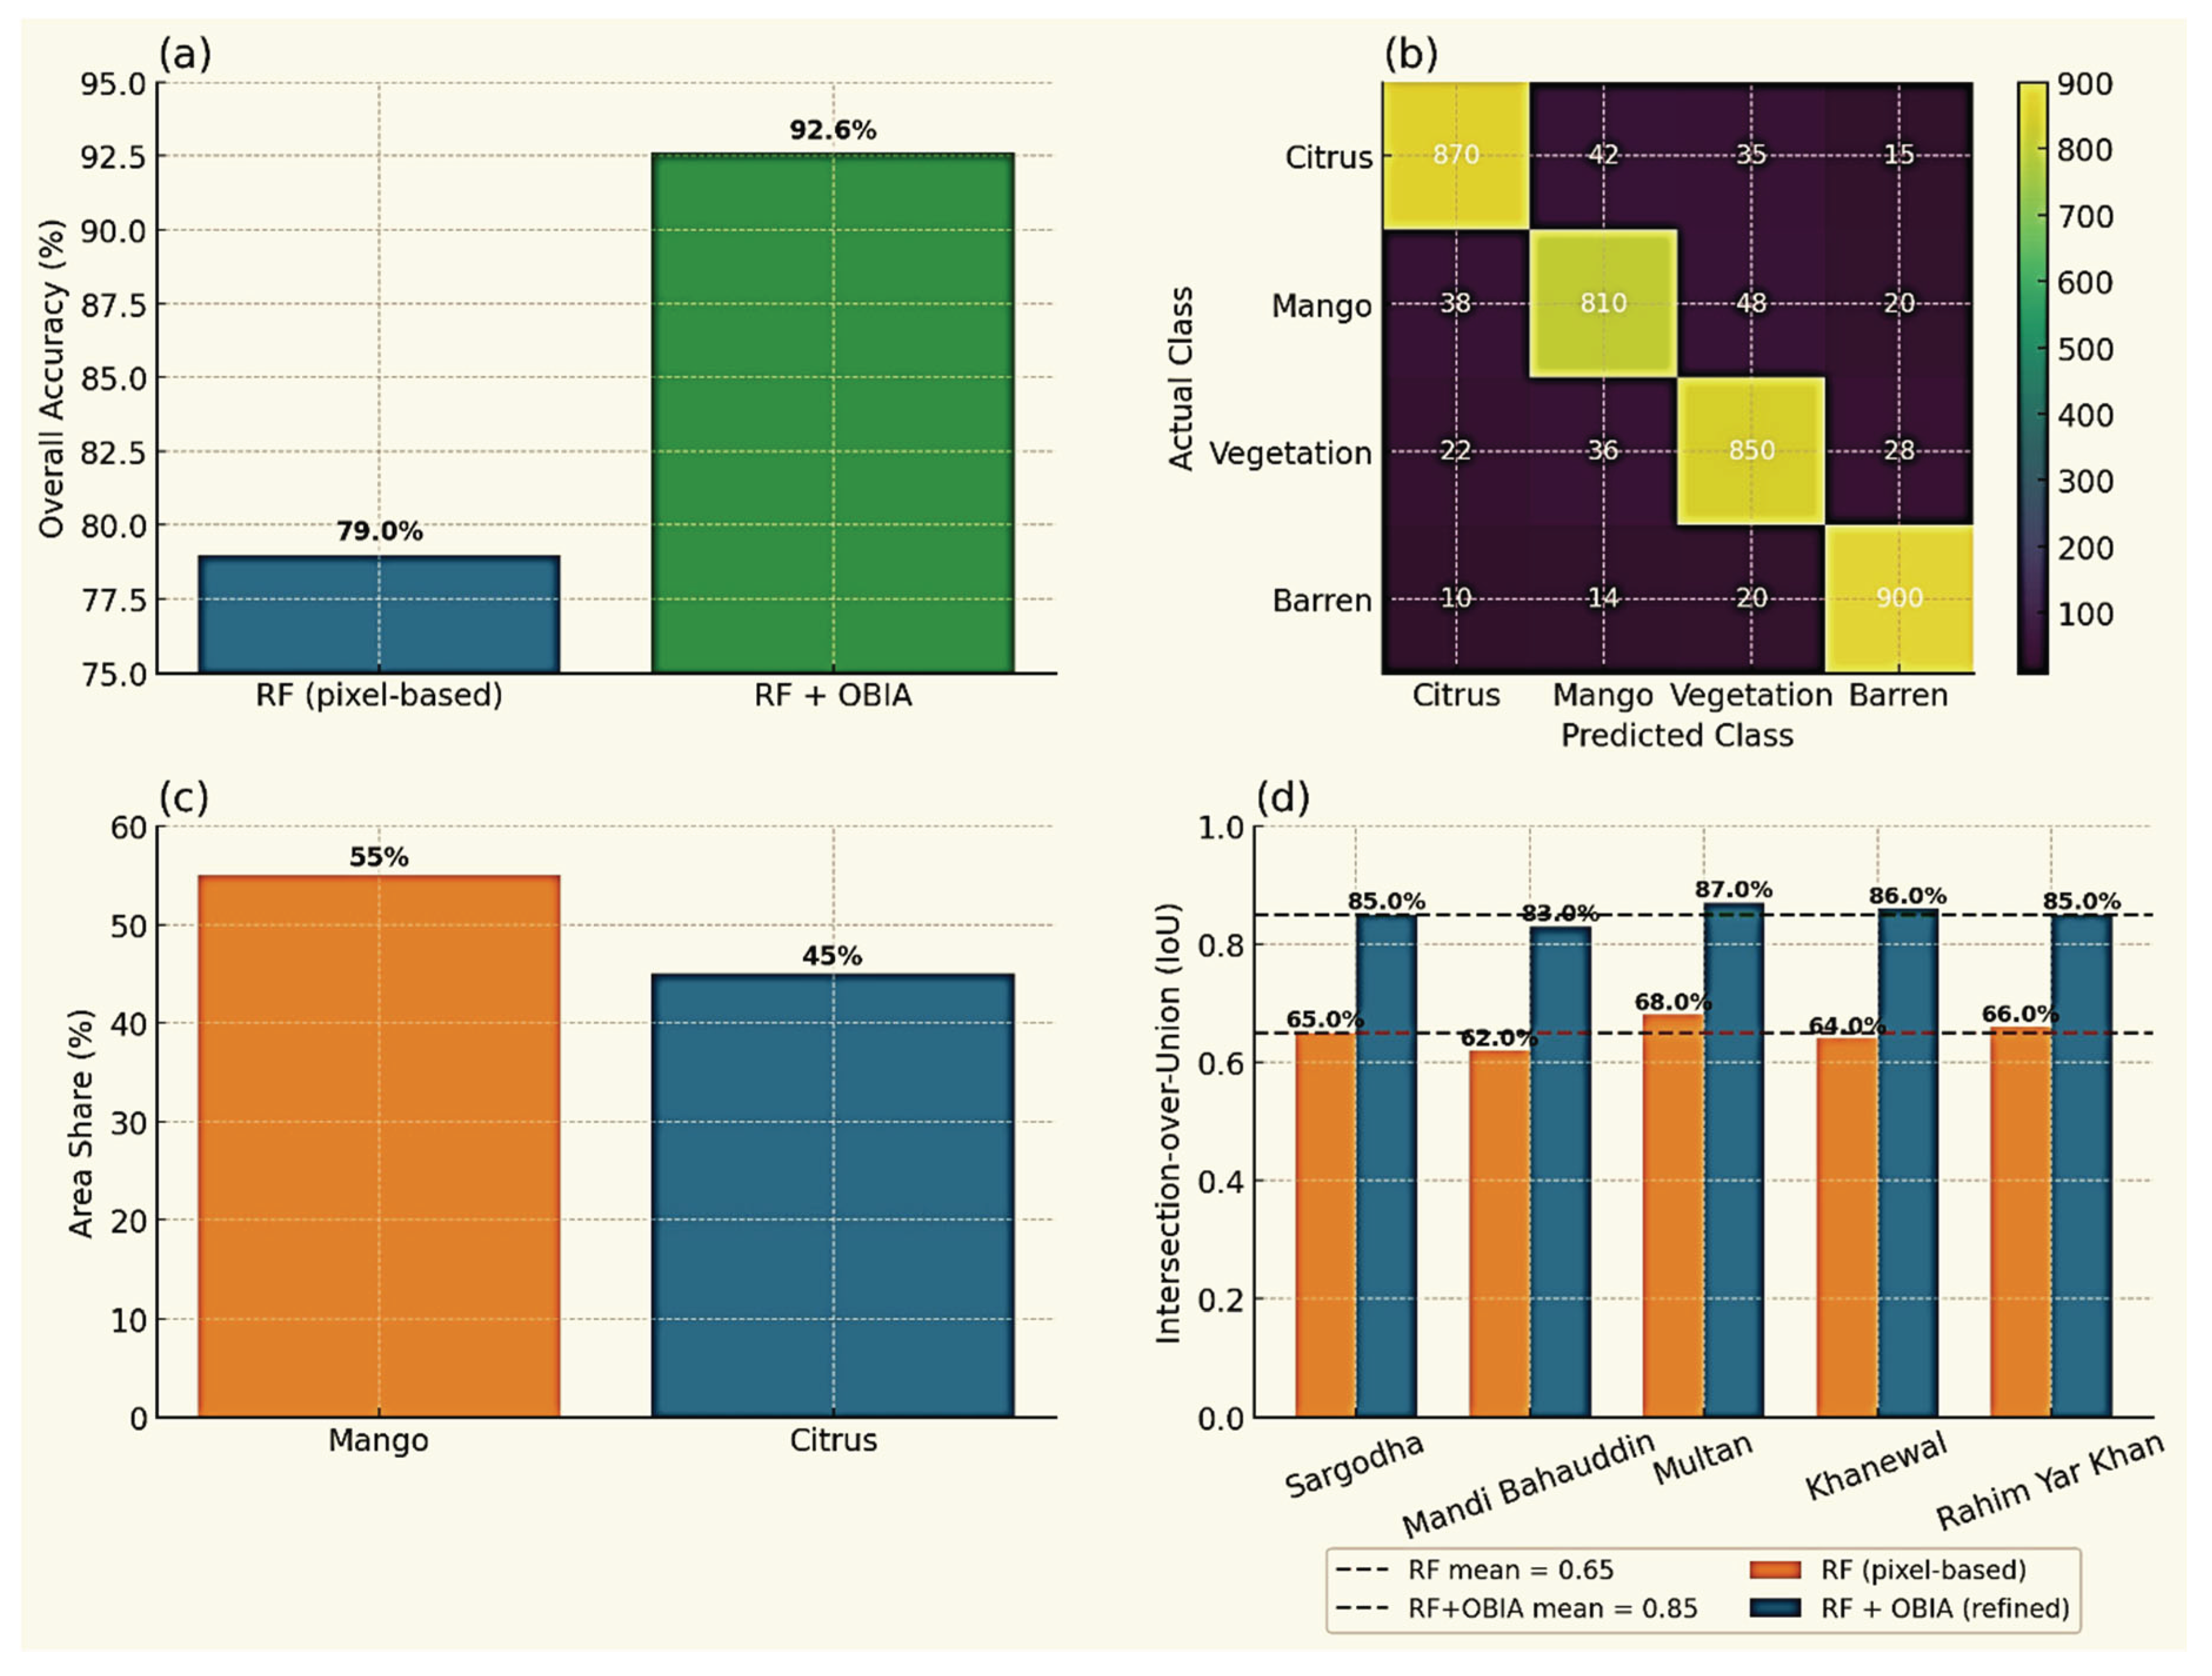
Figure 7.
Correlation matrix showing associations between vegetation indices and orchard yield. Yellow highlights indicate strong positive predictors (NDVI, SAVI, TNDVI under mean/median), while red highlights mark weaker or unstable relationships.
Figure 7.
Correlation matrix showing associations between vegetation indices and orchard yield. Yellow highlights indicate strong positive predictors (NDVI, SAVI, TNDVI under mean/median), while red highlights mark weaker or unstable relationships.
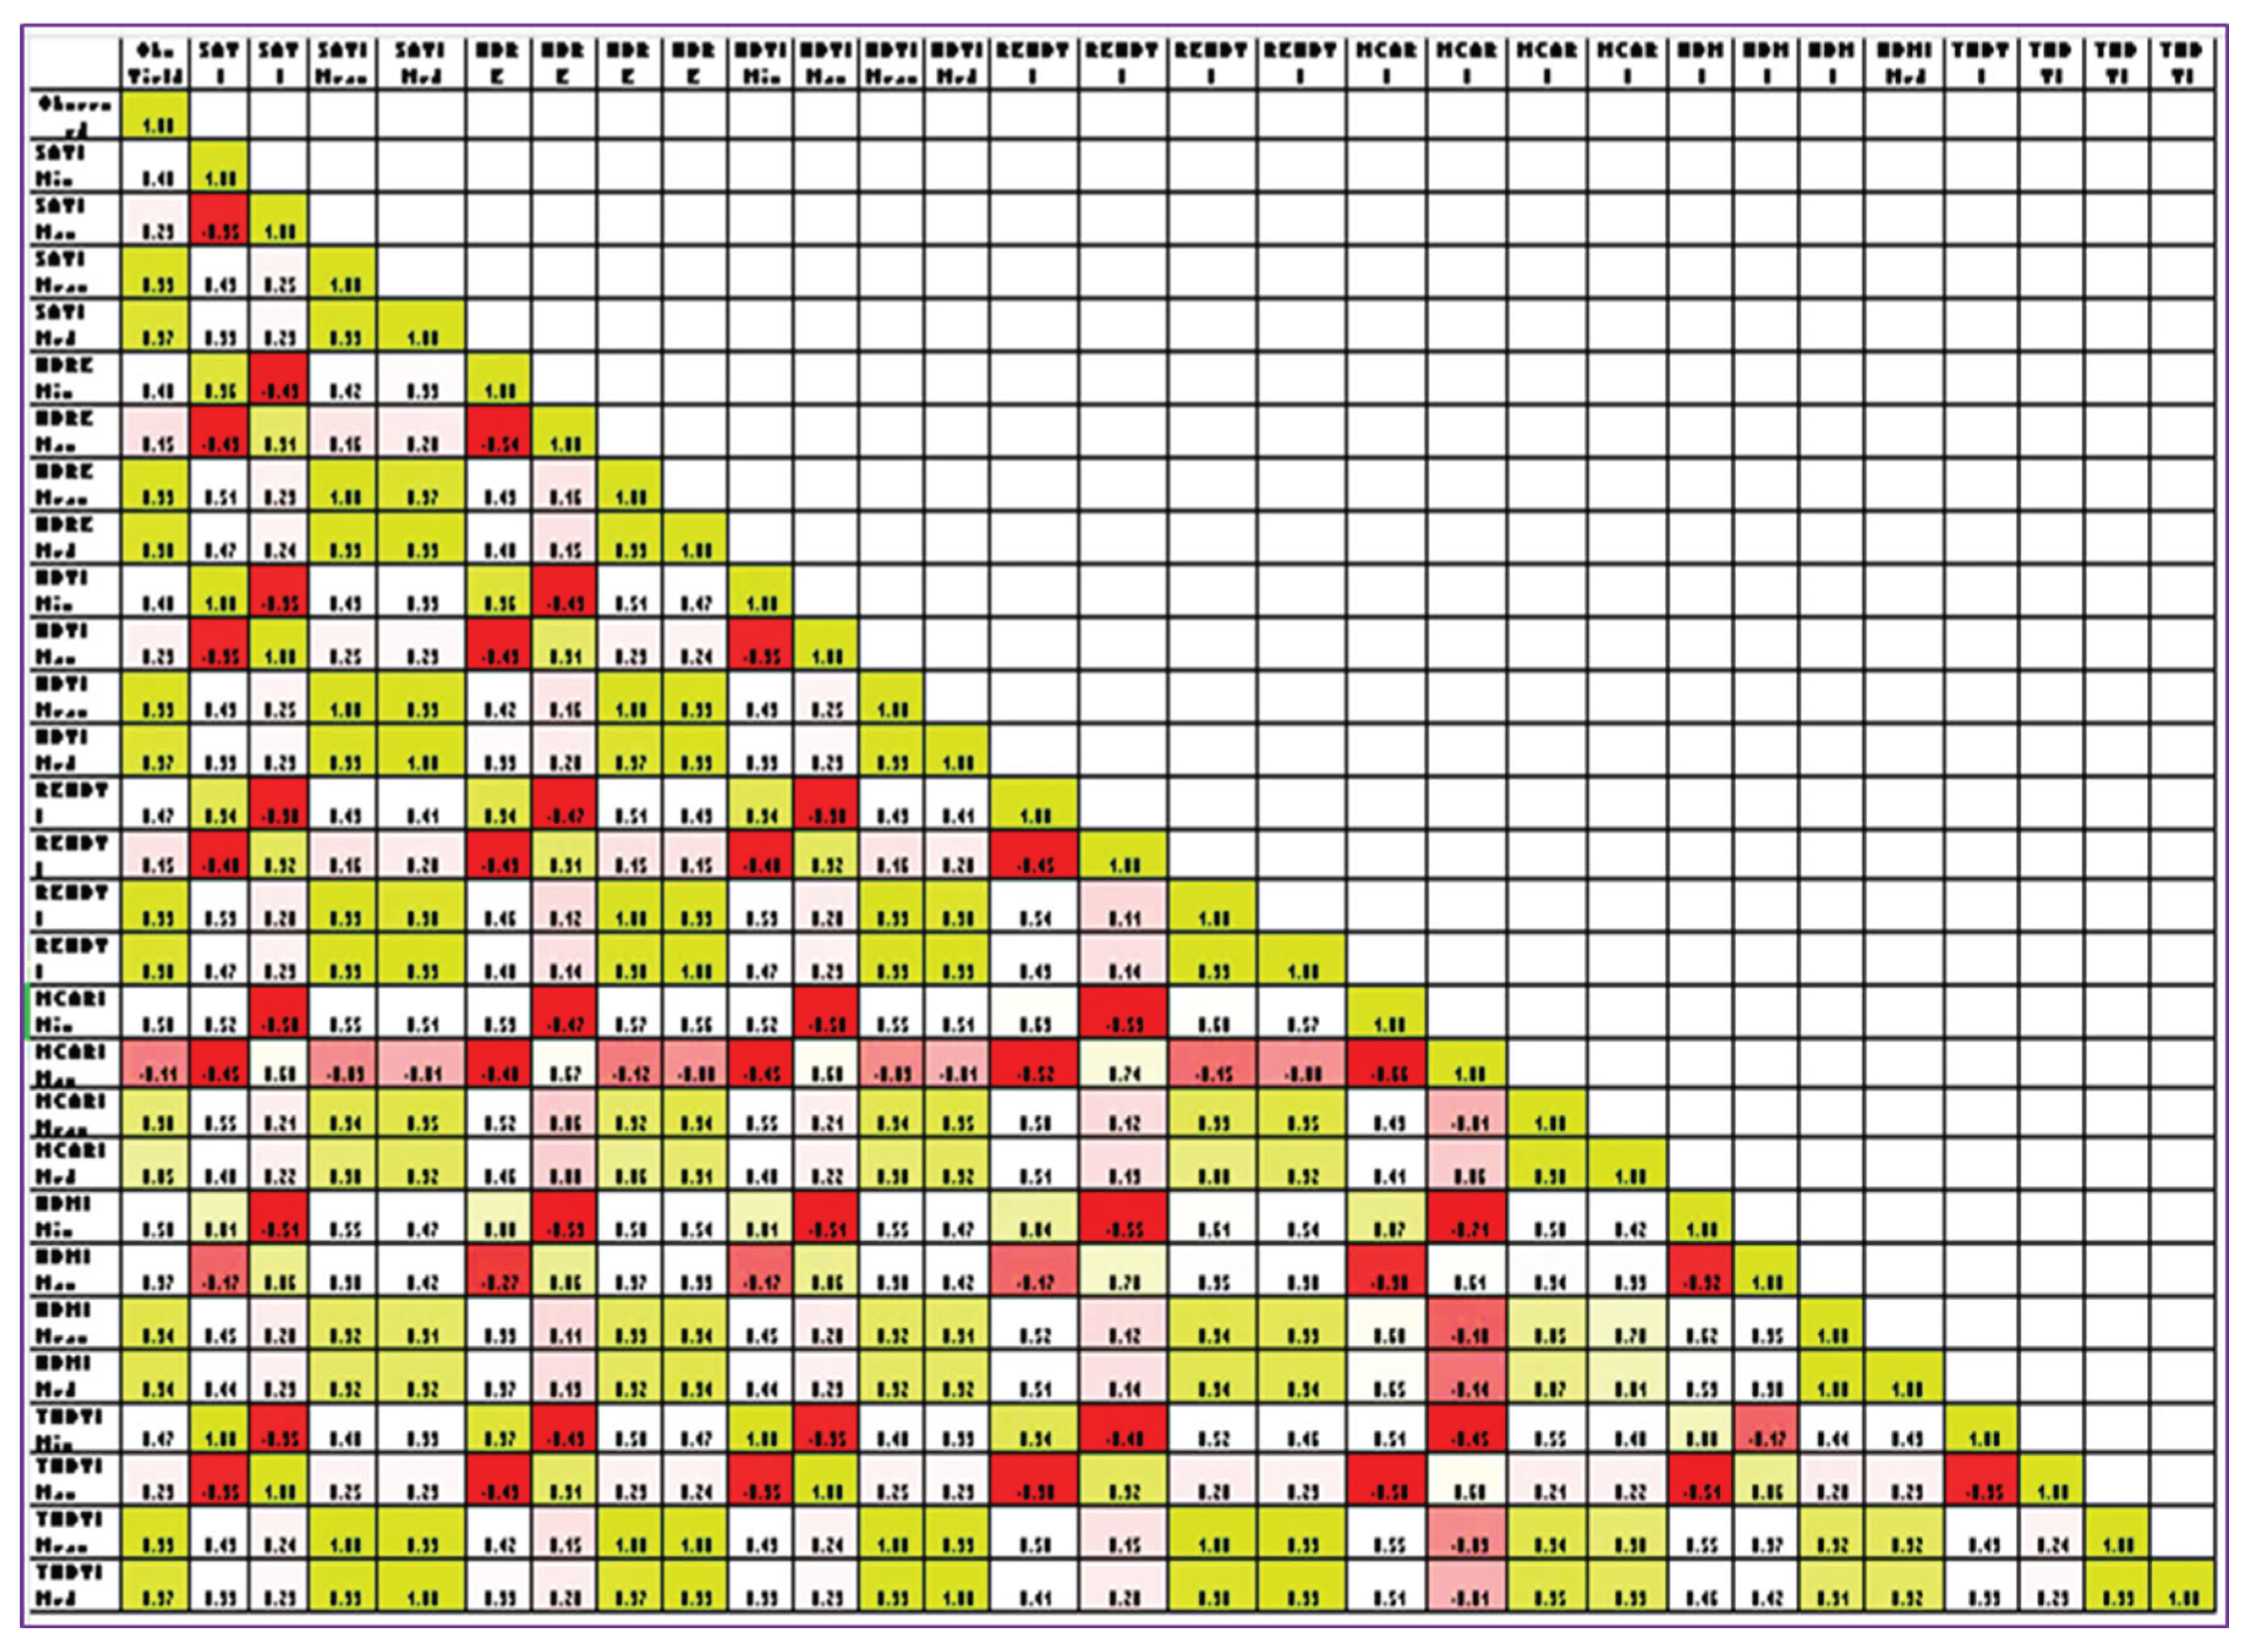
Figure 8.
Orchard-level yield estimates (kg/tree) derived from RF+OBIA delineation, highlighting spatial variability in productivity across the study area.
Figure 8.
Orchard-level yield estimates (kg/tree) derived from RF+OBIA delineation, highlighting spatial variability in productivity across the study area.
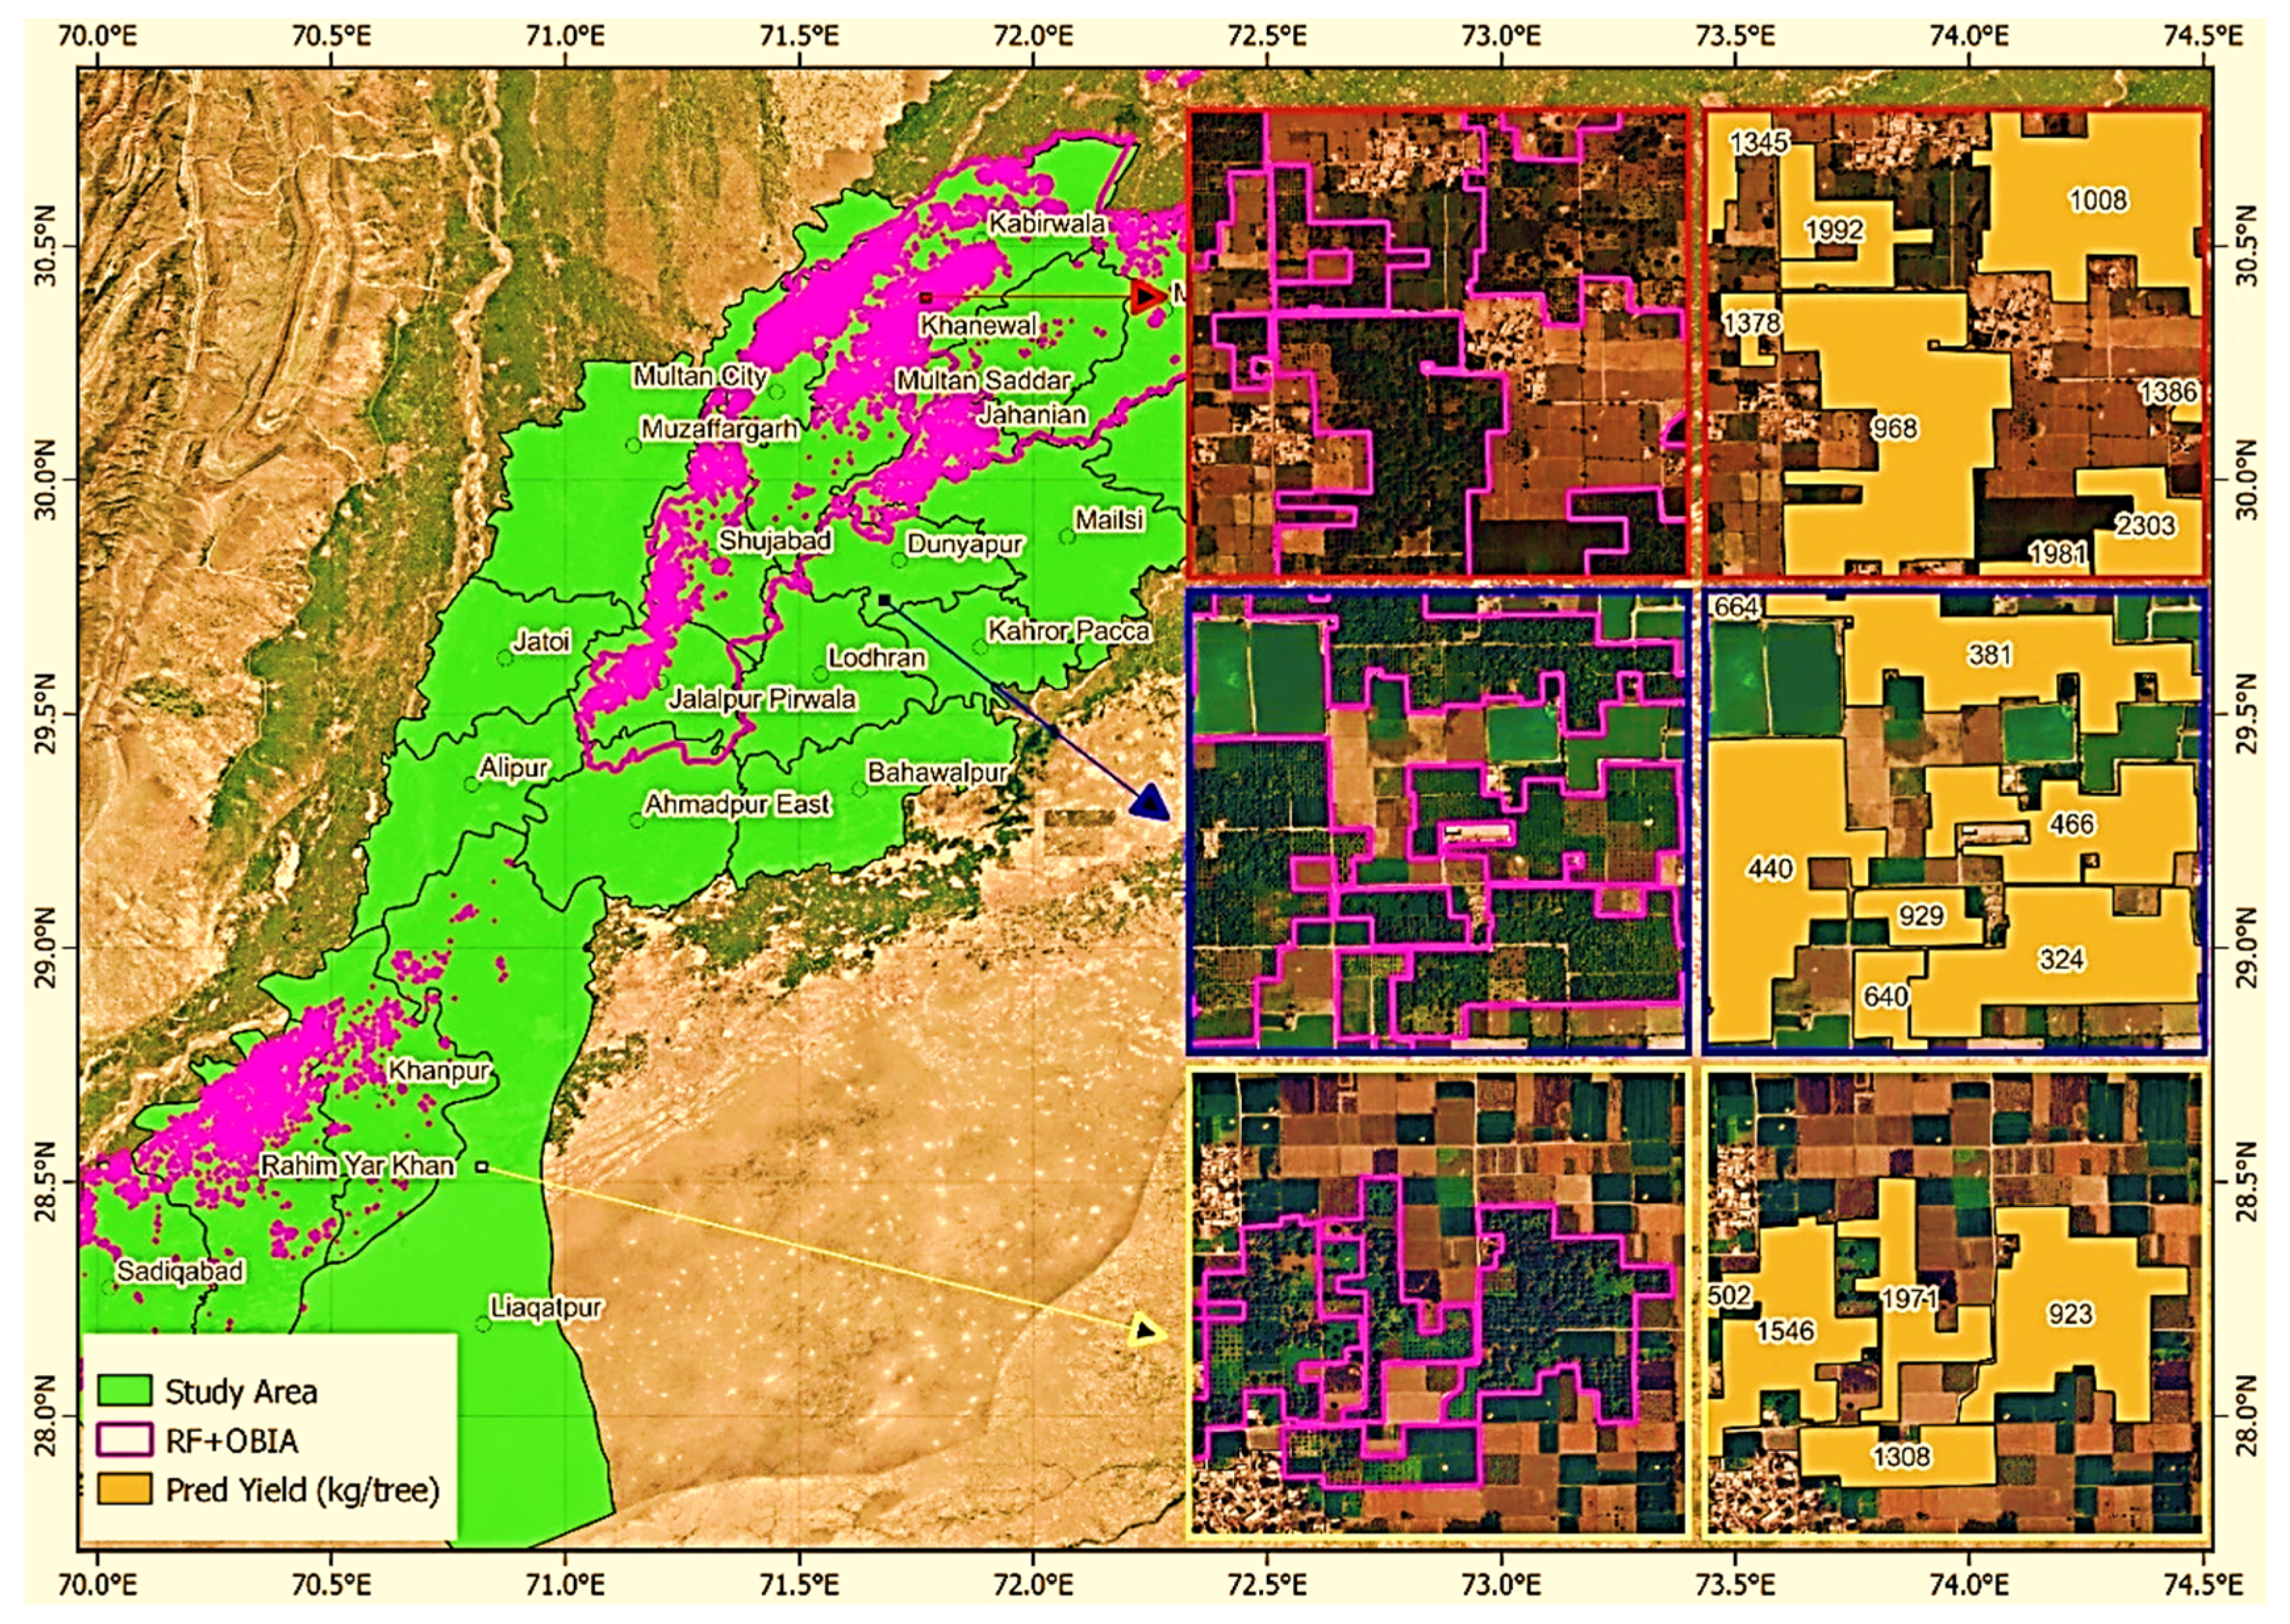
Figure 9.
Observed versus predicted fruit yield under different vegetation index aggregation strategies (mean, median, maximum, and minimum).
Figure 9.
Observed versus predicted fruit yield under different vegetation index aggregation strategies (mean, median, maximum, and minimum).
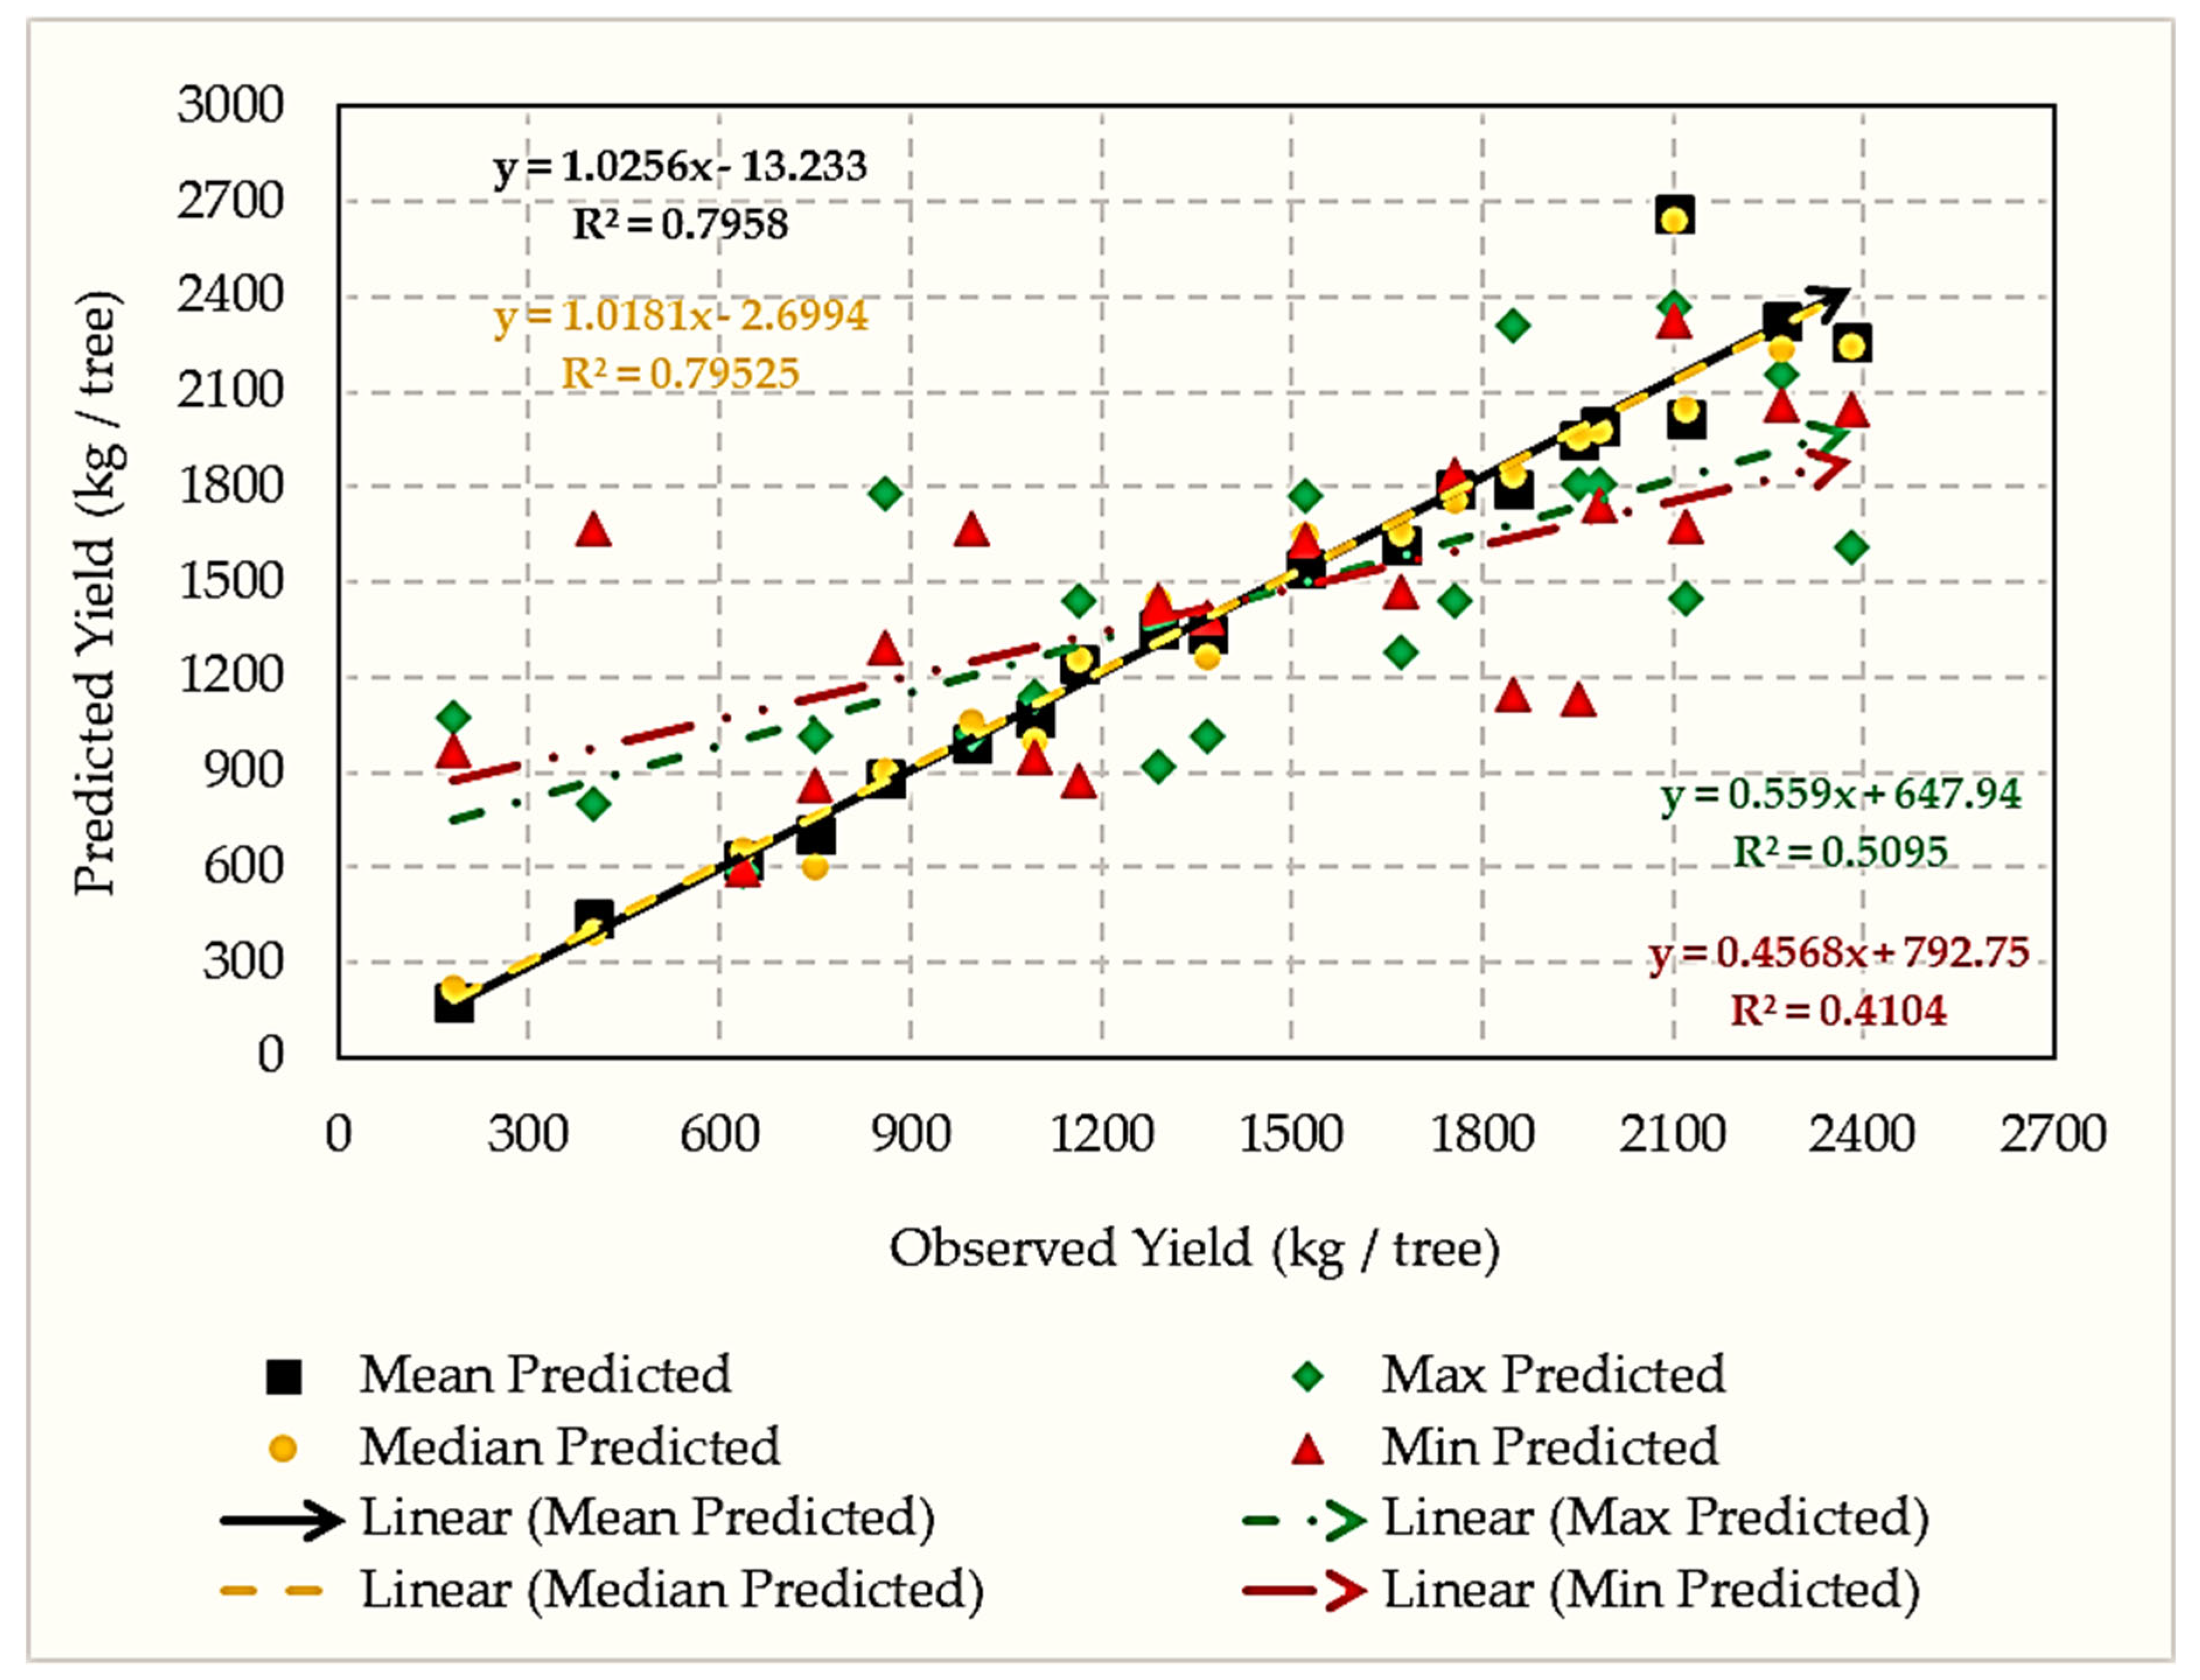
Figure 10.
Residual diagnostic plots of regression models for orchard yield prediction, showing low-variance scatter for NDVI-, SAVI-, and NDRE-based models, and wider spreads for MCARI- and NDMI-based models.
Figure 10.
Residual diagnostic plots of regression models for orchard yield prediction, showing low-variance scatter for NDVI-, SAVI-, and NDRE-based models, and wider spreads for MCARI- and NDMI-based models.
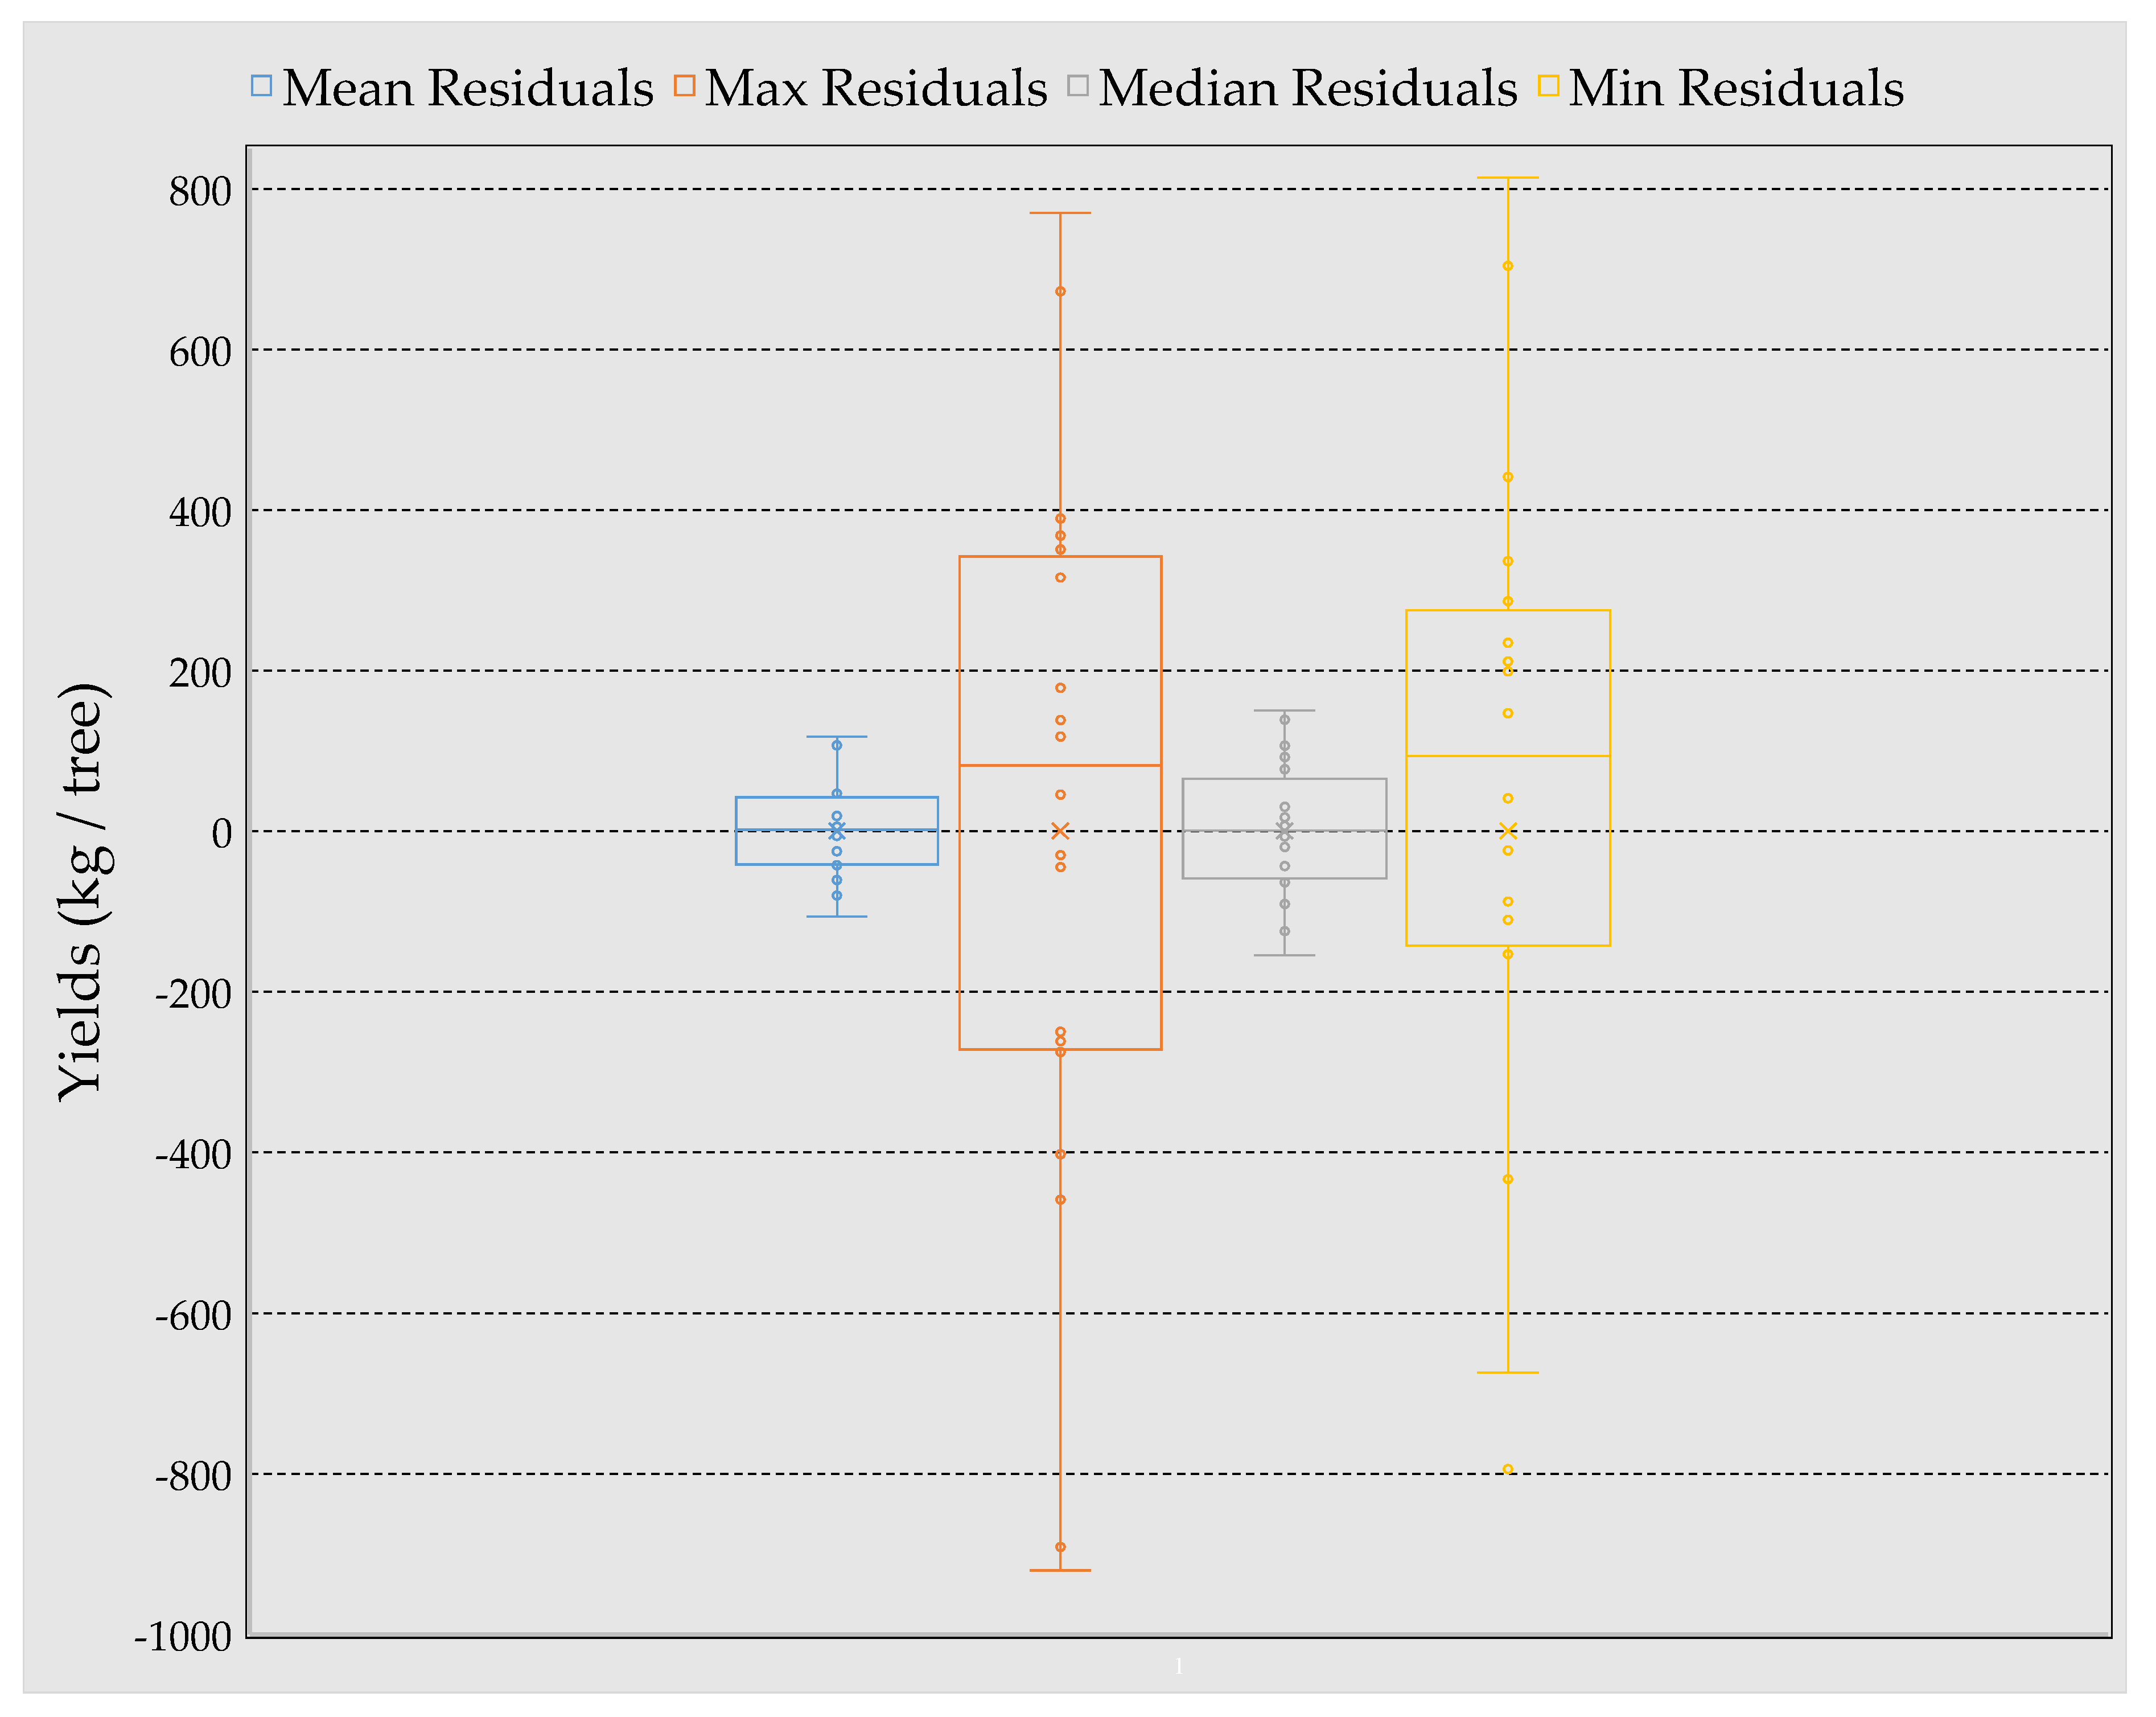
Figure 11.
Boxplots showing the distribution of mango orchard yields (Kg/tree) across regression models using different vegetation indices (SAVI, NDVI, NDRE, TNDVI, MCARI, and NDMI).
Figure 11.
Boxplots showing the distribution of mango orchard yields (Kg/tree) across regression models using different vegetation indices (SAVI, NDVI, NDRE, TNDVI, MCARI, and NDMI).
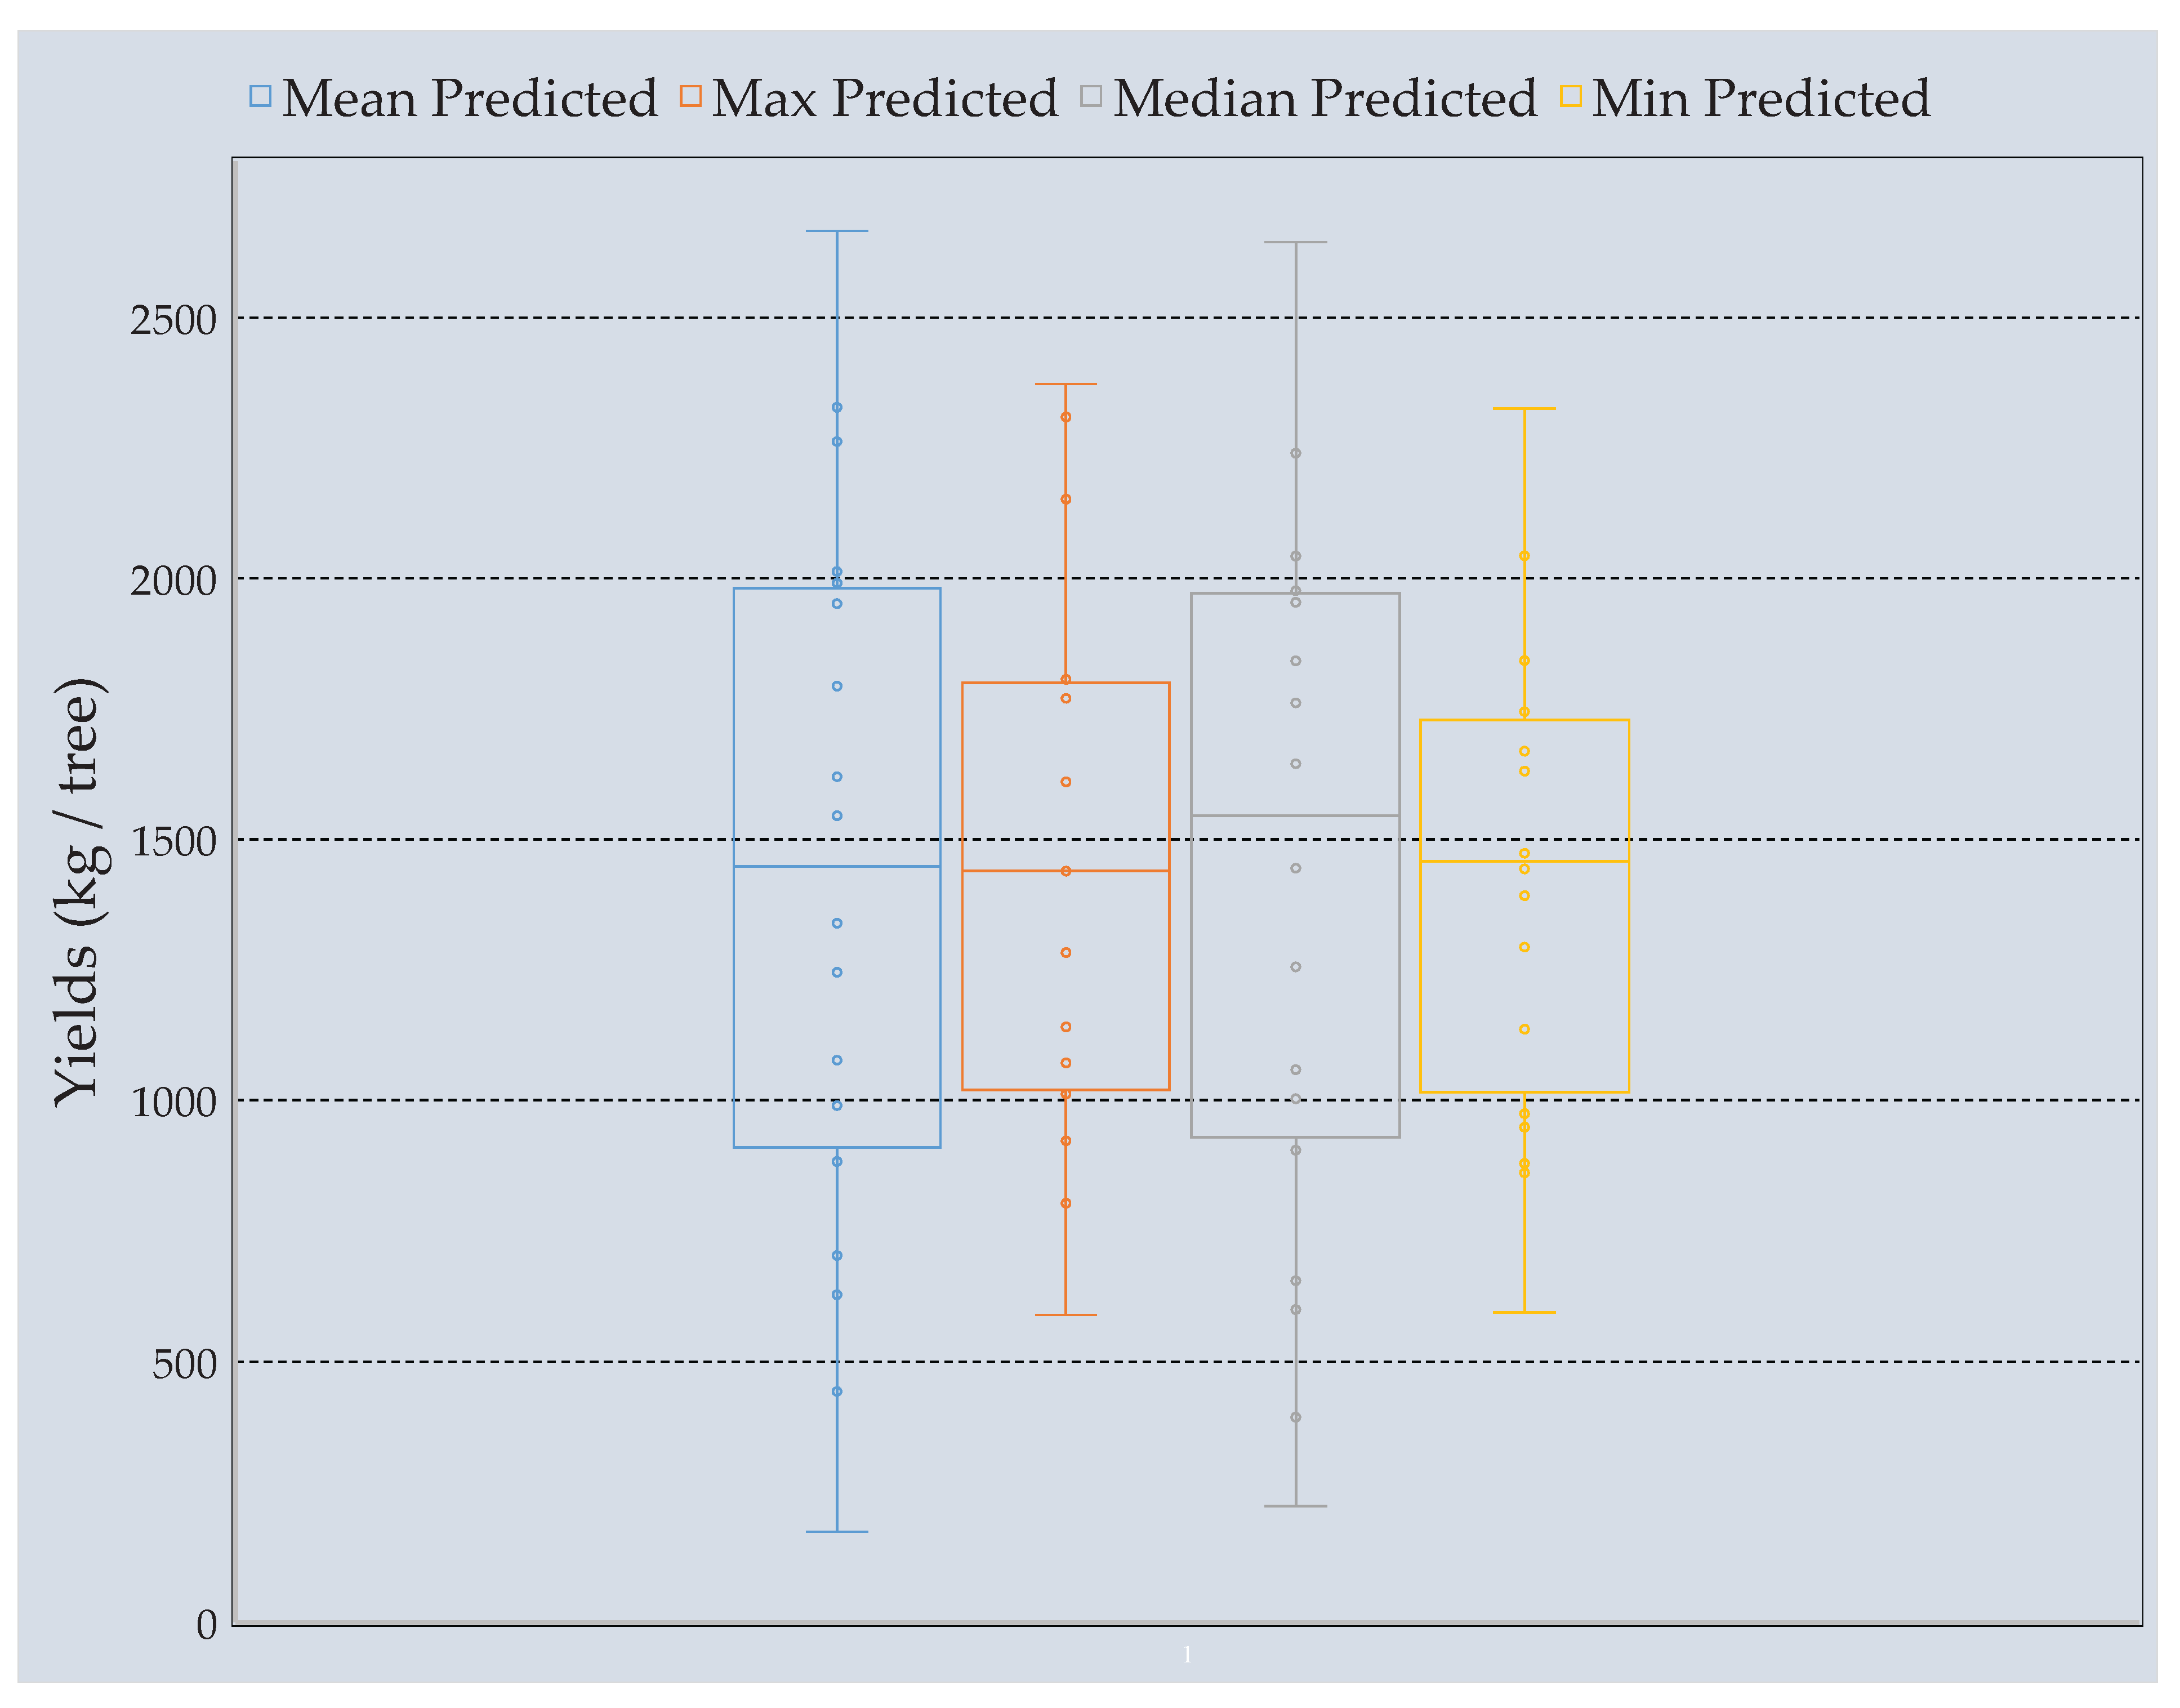
Table 3.
Regional performance of RF + OBIA classification.
| Region | Orchard Type | OA (%) | Kappa | Misclassification (%) | PA (%) | UA (%) |
| Sargodha | Citrus | 92.3 | 0.89 | 7.7 | 96 | 93 |
| Mandi Bahauddin | Citrus | 91.8 | 0.88 | 8.2 | 95 | 92 |
| Multan | Mango | 93.0 | 0.90 | 7.0 | 94 | 93 |
| Khanewal | Mango | 92.6 | 0.89 | 7.4 | 94 | 92 |
| Rahim Yar Khan | Mango | 91.9 | 0.88 | 8.1 | 93 | 92 |
Table 4.
Comparative benchmarking of Random Forest with Object-Based Image Analysis (RF + OBIA) against baseline pixel-based RF.
Table 4.
Comparative benchmarking of Random Forest with Object-Based Image Analysis (RF + OBIA) against baseline pixel-based RF.
| Method | OA (%) | Kappa | Boundary Precision (%) | Temporal Noise Reduction (%) |
| RF (Pixel-based) | 79.0 | 0.78 | 65.0 | 5.0 |
| RF + OBIA | 92.6 | 0.89 | 85.3 | 15.0 |
Table 5.
Performance of regression models under different vegetation index aggregation strategies for orchard yield prediction.
Table 5.
Performance of regression models under different vegetation index aggregation strategies for orchard yield prediction.
| Model | Equation | Vegetation Index (X) | R2 | Adjusted R2 | Error (kg/tree) |
| Mean | Yield = -400455.32 – 51260244.65(X1) – 106667.41(X2) + 72646033.28(X3) – 49843.98(X4) – 39.56(X5) + 7639.25(X6) + 548363.22(X7) | X1 = SAVI X2 = NDRE X3 = NDVI X4 = RENDVI X5 = MCARI X6 = NDMI X7 = TNDVI |
0.793 | 0.772 | 72.7 |
| Median | Yield = 803724.97 -53435438.35(X1) + 59650.096(X2) + 76573270.03(X3) – 54432.33(X4) + 0.786(X5) – 335.53(X6) – 1129871.49(X7) |
Same as above | 0.785 | 0.785 | 76.4 |
| Max | Yield = -1580278.01– 464954744.50(X1) – 22322.29(X2) + 659091364.50(X3) + 24020.61(X4) – 6.68(X5) + 29770.97(X6) + 2129721.04(X7) | Same as above | 0.555 | 0.295 | 568.8 |
| Min | Yield = 86411.37 + 3232543.97(X1) – 14721.81(X2) – 4481263.21(X3) – 789.89(X4) + 14.33(X5) – 1353.27(X6) – 120504.15(X7) | Same as above | 0.460 | 0.145 | 626.6 |
* Error = regression standard error (residual standard error) in kg/tree.
Disclaimer/Publisher’s Note: The statements, opinions and data contained in all publications are solely those of the individual author(s) and contributor(s) and not of MDPI and/or the editor(s). MDPI and/or the editor(s) disclaim responsibility for any injury to people or property resulting from any ideas, methods, instructions or products referred to in the content. |
© 2025 by the authors. Licensee MDPI, Basel, Switzerland. This article is an open access article distributed under the terms and conditions of the Creative Commons Attribution (CC BY) license (http://creativecommons.org/licenses/by/4.0/).
Copyright: This open access article is published under a Creative Commons CC BY 4.0 license, which permit the free download, distribution, and reuse, provided that the author and preprint are cited in any reuse.


