Submitted:
26 September 2025
Posted:
29 September 2025
You are already at the latest version
Abstract
The use of acoustic waves to detect the internal structure of non-transparent objects is a common technical approach, but the inherent defects of acoustic waves and the inad-equacy of imaging algorithms have led to unsatisfactory results of acoustic imaging for practical engineering applications. Digital holographic inspection techniques enable high-resolution imaging of the surface of objects, but hologram recording systems based on visible wavelength light sources do not provide direct access to the interior of non-transparent objects. Digital acousto-optic holography combines the advantages of good penetrability of acoustic waves, the high-resolution capability of optical holog-raphy, and digital imaging and processing technology, making it possible to image or detect the internal structure of non-transparent objects at high resolution. In this paper, the basic definition, key theories, experimental systems, and problem-solving of digital acousto-optic holography are fully elaborated, analyzed, and discussed. A review of the related technologies and their research development is presented.
Keywords:
digital acousto-optic holography
; digital holography
; shearography
; TV holography
; nondestructive testing
1. Introduction
The internal structure and composition of the object directly affect the physical and chemical properties of an object. How to obtain the information of the internal structure or composition of the object has always been a hot issue. Visualization is the most effective and intuitive way. However, most objects in nature are opaque to light, and only the surface of an object is usually visible therefore leading to significant difficulties for visualization of object internal structure. Sound is a wave and has good penetrability of opaque objects. When the sound waves propagate inside the object, they are affected by the object’s internal structure. The acoustic amplitude and phase distribution subsequently have a corresponding change, namely deformation and the acoustic signal can reflect the internal information of the object. Indeed, acoustic imaging is one of the earliest nondestructive testing technologies.
According to the method of acquisition of the deformation of acoustic signals, acoustic nondestructive testing techniques can be divided into two main categories. The first type is to directly collect acoustic signals and reconstruct the internal structure of the object by using acoustic parameters transmitted from the object to the surface, such as the traditional ultrasonic imaging [1,2,3,4] and acoustic tomography [5,6,7,8]. This type of technology uses acoustic sensors to obtain the distribution of the sound field containing the internal information of the object and then converts the obtained distribution into a visual image. However, the acoustic impedance mismatch between the acoustic sensor and the measured object may lead to distortion of the obtained sound field distribution, giving low accuracy. The second type is indirect acquisition of acoustic signals. The vibration or deformation of the signal caused by the acoustic wave transmitted to the surface of the object is detected by optical interference, thereby revealing the internal information of the non-transparent object. Because digital holography can simultaneously reconstruct the intensity and phase information of 3D objects with lateral resolution and longitudinal resolutions reaching the submicron level and the nanometer level, respectively, it is a hot technology in the quantitative detection research of microstructure, morphology and deformation [9,10,11,12,13,14,15,16,17,18,19,20]. In this paper, the techniques using acoustic excitation, and digital holography recording and numerical reconstruction are called digital acousto-optic holography. Digital sound-light holography technology is actually developed from traditional liquid surface acoustic holography [21,22]. With the development of digital imaging device CCD and digital processing technology, digital sound-light holography technology has been applied to the detection of internal defects of objects in manufacturing, aerospace and other fields [23,24,25,26]. Acoustic excitation is mainly through the use of a PZT vibrator with controllable and adjustable acoustic parameters [27]. Optical imaging modalities are mainly based on interference laser holographic speckle pattern recording [28,29,30,31,32,33,34,35,36,37,38,39,40,41,42,43,44,45], shear digital hologram recording [46,47,48,49,50,51,52,53,54,55,56,57,58,59,60,61,62,63] and conventional digital hologram recording. Numerical reconstruction methods include speckle hologram reconstruction algorithm, shear hologram reconstruction algorithm and sound wave diffraction algorithm.
To sum up, digital acousto-optic holography is an important technology to obtain internal defects or structural information of objects. The technology includes two core problems: 1) acquisition (or recording) of surface vibration or signal deformation caused by disturbed acoustic waves; 2) reconstruction (or demodulation) of information about internal defects or structures of objects. This paper provides a comprehensive review on the two core problems. In Section 2, commonly used laser holographic speckle interference recording and shear hologram recording are discussed and compared. In Section 3, we discuss internal defect detection and reconstruction algorithms including the speckle hologram reconstruction algorithm, shear hologram reconstruction algorithm and sound wave diffraction reconstruction algorithm. In Section 4, we discuss the important issues of digital acousto-optic holography, such as resolution, quantifiable reconstruction of internal information of objects. Finally, in Section 5, summary of the review is provided.
2. Deformation Acoustic Parameter Recording System
When acoustic waves are transmitted inside an object, the excitation signal causes a small deformation on the surface of the object, which reflects the internal defects or structure of the object. Usually, the surface of the object under test is diffusely reflective and laser holographic scattering interference systems and shear holographic interference systems can be used to record the small deformations on the surface of the object.
2.1. TV Holography
A schematic diagram of a laser TV holographic scattering interference system is shown in Figure 1. The same laser light source is divided into two light waves, one being the reference light wave and the other forming an object light wave after irradiating the surface of the object under test. Since the roughness of the surface of the object under test is random, the object and reference light waves converge and interfere to form a speckle pattern. When the object is deformed by a loading force, the speckle pattern changes slightly. Calculating the difference between the two scattergrams produces a stripe map depicting the surface displacement. There are two key design aspects here: 1) the use of a laser as a coherent light source and 2) the choice of an optical configuration where the illumination is almost parallel to the observation. This is because illuminating an object with a highly coherent laser makes the reflected light at every point on the object's surface coherent, creating interference conditions for scattered interference. The beam reflected by the object is almost parallel to the reference beam. The speckle pattern with low spatial frequency is generated, which provides conditions for grabbing the frames.
The Spanish research group of C. Trillo, A.F. Doval and others have had some success in using TV holography to detect defects inside objects. They proposed a method which allows the acoustic complex amplitude of the surface of an object to be obtained [64,65]. The propagation of acoustic waves inside a solid is extremely complex. To simplify the study, they assumed that 1) only longitudinal waves propagate inside the object, 2) the size of the defects inside the object is smaller than the wavelength of the acoustic wave, and 3) the thickness of the object is smaller than the width. When these conditions are met, the complex amplitudes of the acoustic wave at the surface of the object are obtained by the TV holography and the Fourier transform. The acquisition of the acoustic complex amplitude is carried out in several steps as follows.
- A sequence of speckle patterns on the surface of the object is achieved by a synchronous control circuit.
- Fourier transform of the scatter pattern sequence in time and spatial domains is carried out to obtain the spectral distribution.
- One of the conjugate terms is obtained by band-pass filtering.
- The inverse Fourier transform of the conjugate term is carried out, and the resulting mode and inverse tangent values are found respectively to obtain the complex amplitude.
The experimental TV Holography system is shown in Figure 2. The TV holography system is combined with a synchronous control system to achieve synchronous excitation of the acoustic wave and recording of a sequence of speckle patterns. The DRV drives the piezoelectric transducer (PZT), which excites the acoustic waves (AW). The laser beam from the pulsed laser is passed through a beam splitter to form an object beam (OB) and a reference beam (RB). The OB is expanded and shone through a mirror (M) onto the surface of the specimen. With the aid of the camera objective (OBJ) and aperture (AP), the OB, which carries information about the specimen surface, and the RB form a speckle pattern in the camera.
2.2. Shearography
As illustrated in Figure 3, the underlying principle of shearography is closely aligned with that of TV holography. A key distinction, however, lies in the fact that shearography eliminates the need for a reference surface; instead, its interference pattern is generated through mutual interference between adjacent points on the surface of the object under investigation. Analytical results indicate that shearography enables the direct measurement of the derivative of surface displacement. Given that strain is mathematically defined as a function of displacement derivatives, shearography can be employed to determine strain without relying on numerically differentiated displacement data. Conventional shearography systems utilize photographic film as the recording medium, an approach that is not only time-consuming but also associated with high operational costs. Moreover, interpreting fringe patterns necessitates subsequent Fourier filtering, which further delays the availability of test results. In common with TV holography, modern shearography implementations adopt video-based recording techniques. This computerized processing method is capable of generating fringe patterns at video rates, significantly enhancing operational efficiency.
With reference to Figure 3, the birefringent crystal serves as the key to the entire experimental system. The crystal makes the two non-parallel beams scattered from points adjacent to the surface of the object co-linear or approximately co-linear. As a result, the speckle pattern obtained by shearing holography has the same low spatial frequency contents as the speckle pattern obtained by scattering interference. In this process, the image-shearing video camera picks up two types of shearing scattergrams before and after the object is deformed. These scattergrams are digitized using a frame grabber into a computer.
A birefringent prism induces the interference of light rays scattered from two adjacent points, P (x, y) and Q (x + δx, y), on the image plane. The superposition of all such point pairs across the specimen yields a pair of images that are laterally displaced—or sheared—relative to each other along the x-direction. When the shear is applied along the x-axis, the resulting fringe pattern corresponds to the partial derivative of the displacement field with respect to x. Conversely, if the shear is oriented parallel to the y-axis, the image shearing occurs along the y-direction, wherein adjacent points separated in y interfere on the image plane. In this configuration, the fringe pattern characterizes the partial derivative of the displacement with respect to y.
For shearography, stress loading is required to detect defects, and the traditional loading methods are mechanical loading, thermal loading and vacuum loading. However, the effect of these loading methods is not obvious for metal objects. Acoustic waves have better penetration than the traditional loading method of shearography. This results in a larger detection area. An experimental setup is designed [45], which is used to detect and characterize the defects of complex shapes in metal plates. Figure 4 is a schematic diagram of the principle. This experimental setup is a combination of a shearography and an ultrasonic excitation device. The acoustic waves are loaded onto the tested object (TO). The wave surface shear is realized through a Wollaston prism (WP), and the low-frequency sound wave generated by the exciter is used for stress loading. Finally, the speckle pattern of the TO before and after deformation is recorded by the CMOS image collector.
Figure 5 shows another type of shearography using acoustic excitation. The results of this study show that surface fatigue cracks as short as 3 mm and subsurface fatigue cracks as long as 10 mm at a depth of 10 mm in aluminum plates were successfully detected using acoustic waves as a stress loading method. It is found that this stress loading method is more effective in practical industrial applications because one can determine the driving frequency according to the characteristics of the piezoelectric transducer instead of searching for the unknown resonant frequency of the defective structure.
In short, the method of using acoustic excitation as stress loading makes full use of the good penetration of acoustic wave, so that shearography can quickly detect defects on the surface of objects with high rigidity and fast heat conduction and at a certain depth below.
3. Digital Acousto-Optic Holography Defect Reconstruction
TV holography and shearography can be used to obtain information about surface or sub surface defects, while acoustic inverse diffraction can be used to obtain information about defects at arbitrary locations within the object.
3.1. TV Holography Reconstruction
The speckle pattern light intensity distribution can be expressed mathematically as
is the light intensity distribution of the object image and is a random phase angle. Since the roughness of the object surface is generally irregular, the value of can be assumed to be random. Equation (1) shows that the light intensity distribution of the speckle pattern is expressed as the object image modulated by , which represents a random interference pattern, which we call a speckle pattern.
When no external action is applied, we obtain a speckle a pattern of the objects I. when an external action is applied, the object is slightly deformed and the light range from the light source to the surface of the object and then to the sensor changes. However, the range of the reference beam remains the same, so the relative phase between the object beam and the reference beam also changes. The intensity distribution of the corresponding speckle pattern changes slightly and is expressed as
where is the light intensity distribution after deformation and is the phase change due to deformation of the object.
By subtracting the two scattered images before and after the deformation, the resulting difference Is can be described as
Using the properties of trigonometric functions, equation (3) can be expressed as
Equation (4) shows that there are dark fringes when
The orders of fringes are determined by the following equation.
where ±n=0, 1, 2, 3, …are fringe orders.
From the above derivation, it can be seen that the result obtained by subtracting the speckle interferogram before deformation from the speckle interferogram after deformation is a fringe pattern with a bright and dark distribution. This is the speckle interference fringe. The relationship between and the object surface displacement (u, v, w) in scattering interference can be expressed as
Here is the wavelength of the incident light and A, B, C are the sensitivity factors associated with the light source position S (xs, ys, zs) and the sensor position O (xo, yo, zo)
Here and , where z = z (x, y) represents the surface profile of the object. Consequently, z is not an independent variable over the surface. In non-destructive testing applications, the optical setup is typically configured such that both illumination and observation directions are approximately aligned with the z-axis. Under these conditions, the sensitivity factors A and B become negligible, while C is approximately equal to 2. Thus, as indicated by Equation (7), the measurement system is primarily sensitive to the out-of-plane displacement component w, that is, the displacement normal to the surface.
3.2. Shearography Reconstruction
The mechanism of fringe formation in shearography closely resembles that of laser holography. In both techniques, two scattered wavefronts—corresponding to the undeformed and deformed states of the object—are digitized. Subsequent subtraction of one image from the other yields an interference fringe pattern. The mathematical formalism presented in Equations (7) – (14), which describes the formation of laser holographic interference fringes, remains applicable to shearography, with the notable distinction that in shearography, the intensity is related to the derivative of surface displacement rather than to the displacement itself.
Since δu, δv, δw are small, we have
Equation (9) can be reduced to
Eqs. (9) and (11) illustrate that by pre-setting the desired direction, e.g., along any k-axis, then the resulting stripe pattern contains information related to the first order displacement derivatives about k, i.e., ∂u/∂k, ∂v/∂k, ∂w/∂k. Thus, with the aid of a multimodal image shearing interferometer, the stress field can be determined.
3.3. Acoustic Back-Propagation Algorithms
Both TV holography and shearography are limited to the characterization of superficial or near-surface defects within an object. These techniques exhibit considerable limitations in detecting internal flaws. In contrast, digital acousto-optic holography entails acquiring the complex optical amplitude on a designated plane, followed by numerical reconstruction of the complex amplitude on any arbitrary plane via the Rayleigh–Sommerfeld diffraction formula. This approach enables the detection of internal defects through a process known as the acoustic back-propagation algorithm, which has been demonstrated in prior research.
The complex amplitude of the wavefront is obtained through the following procedure. First, a three-dimensional spatiotemporal Fourier transform (two spatial dimensions and one temporal dimension) is applied to the sequence of N optical phase change maps. Subsequently, a three-dimensional band-pass filter is employed to isolate the spectral components corresponding to the acoustic waves. Finally, a set of N complex-valued maps—containing both the amplitude and phase information of the acoustic wavefront—are generated via a three-dimensional inverse Fourier transform.
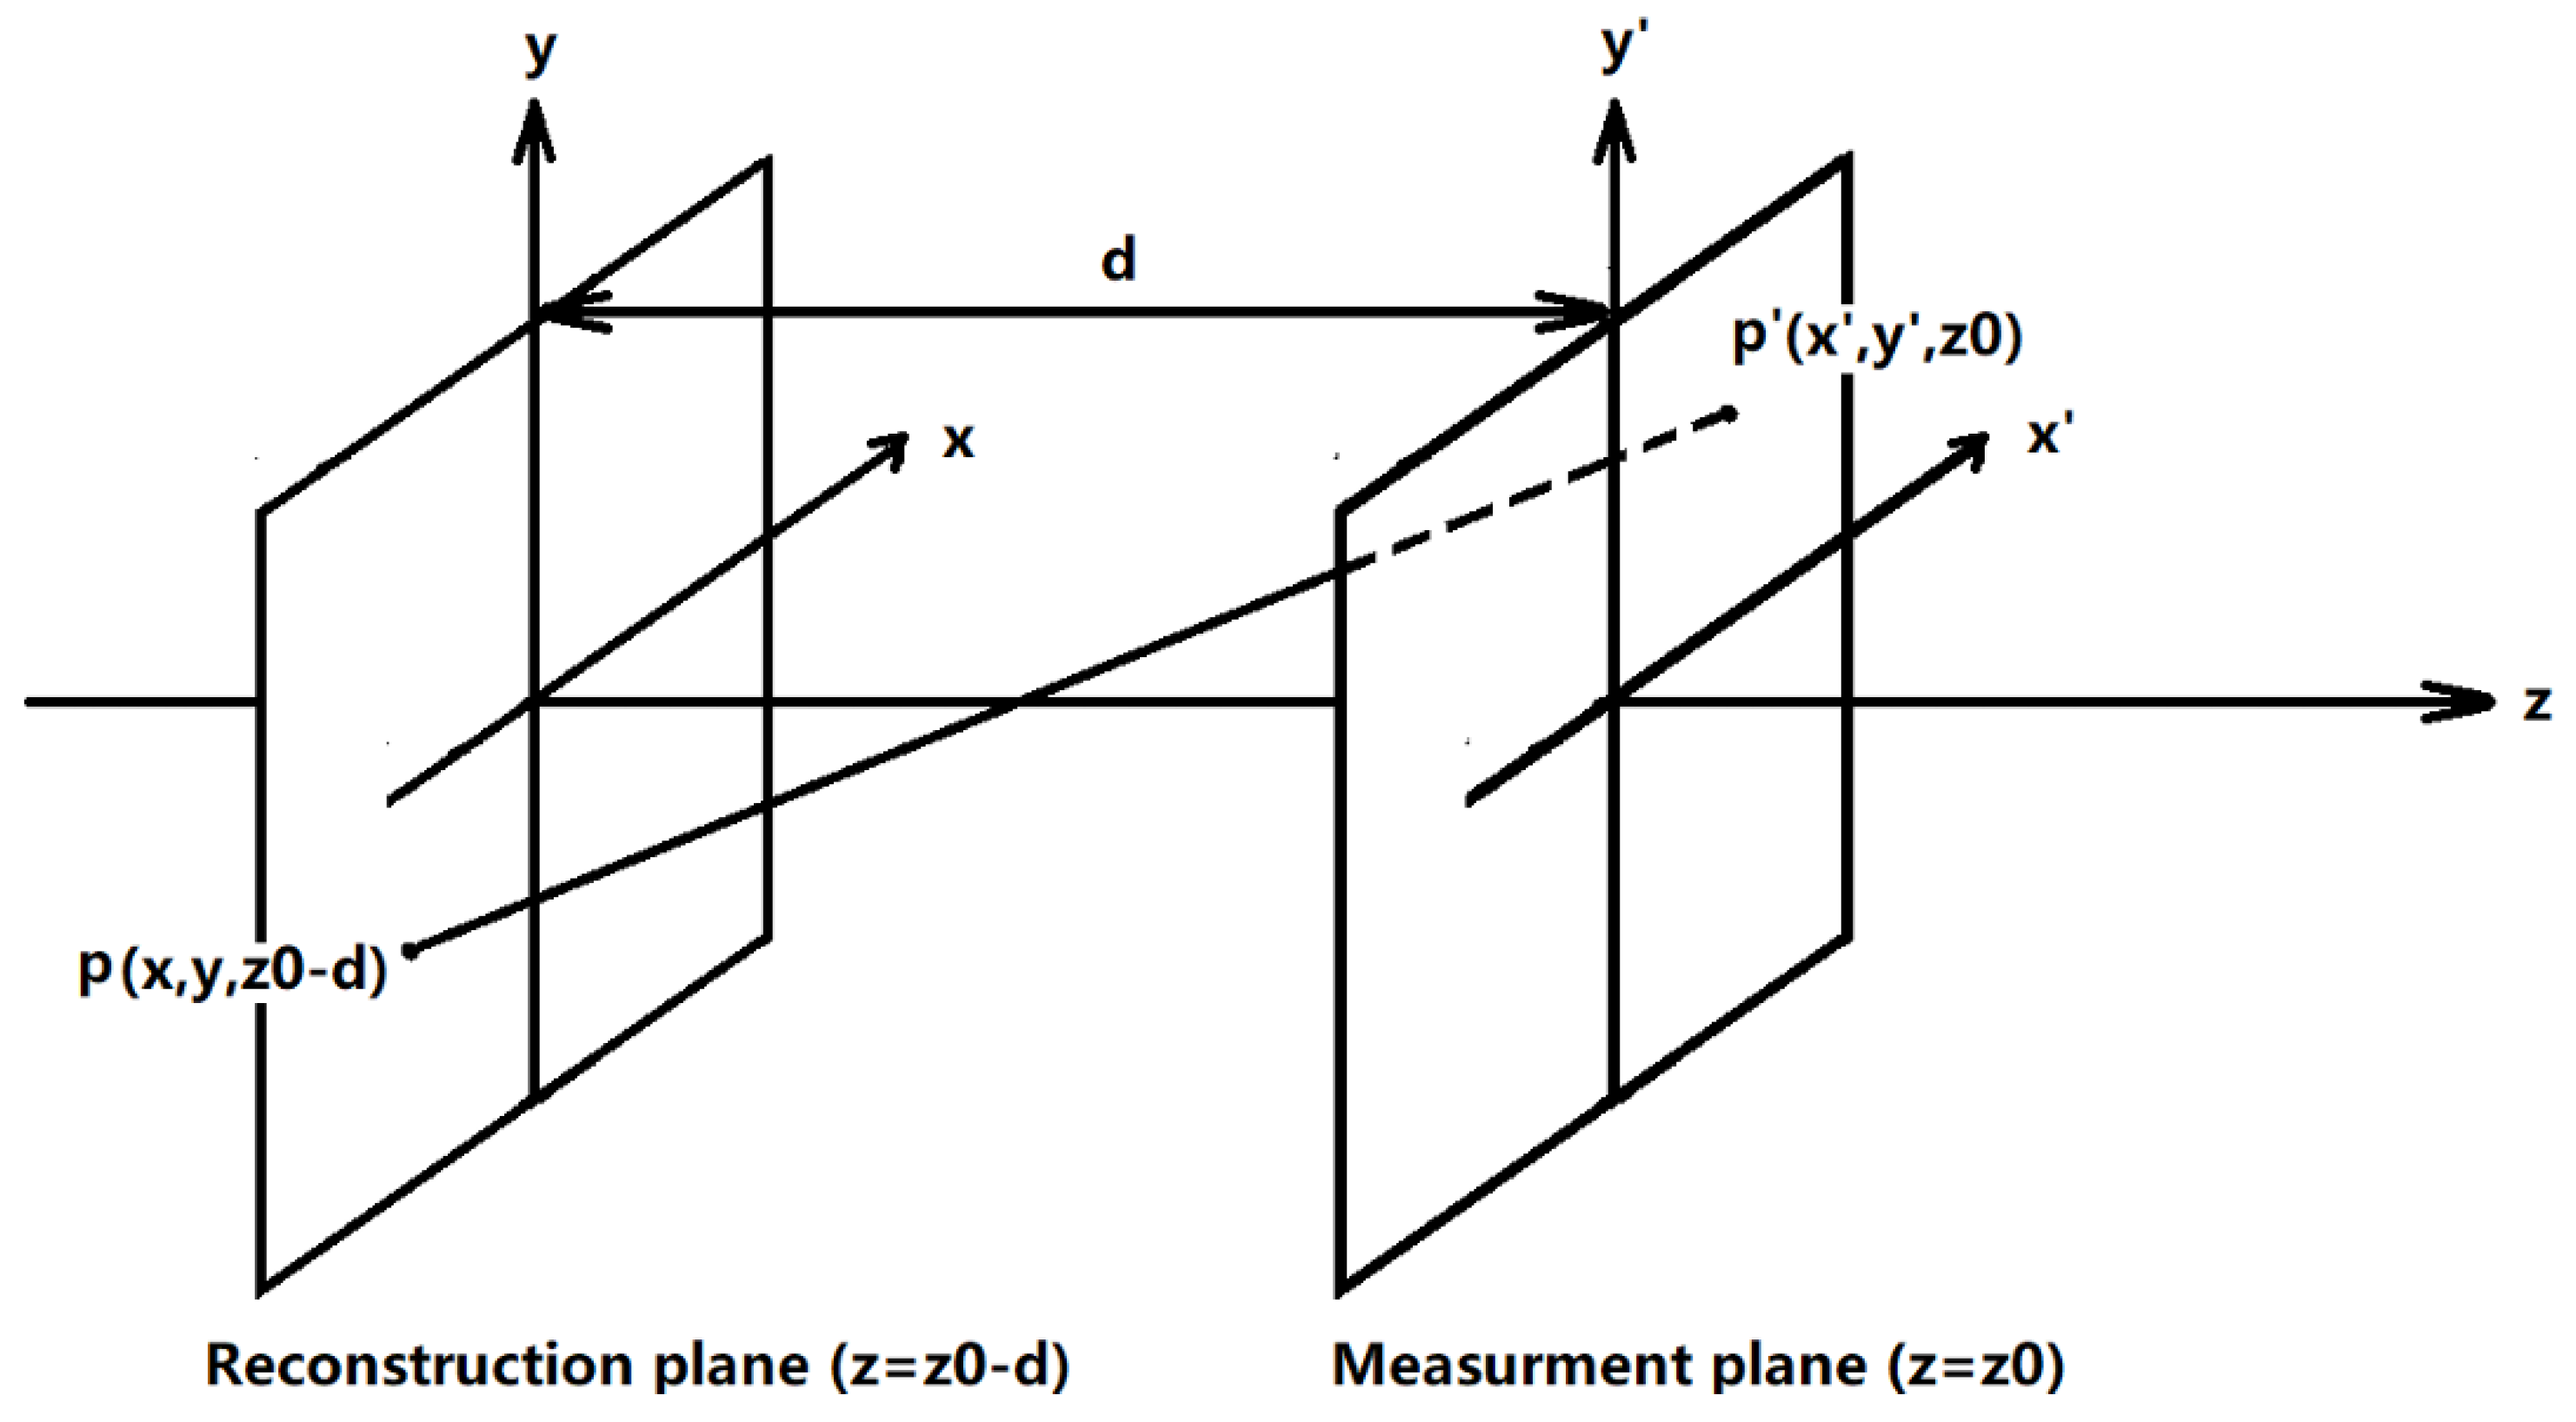
When the amplitude and phase of the wavefront are known or measured at the plane z0 = 0, the wave field at any parallel plane z can be analytically reconstructed using the Rayleigh–Sommerfeld diffraction formula.
Where ΔΦ is the complex amplitude, d is the distance between the plane z0 and z, λa is the wavelength of the acoustic wave, ka = 2π/λa is the wavenumber, and
Figure 6 illustrates the geometric configuration employed for numerical reconstruction. In this example, the measurement plane coincides with the surface of the sample, where the mechanical amplitude and phase are acquired prior to wave arrival. The reconstruction surface is situated within the material interior (where z < 0) through which the wave propagates.
Eq. (12) can be mathematically interpreted as the convolution operation between the measured phase field, , and a specific impulse response function.
If , Eq. (19) is approximated by
Corresponding to the approximate Rayleigh-Sommerfeld diffraction formula
By the convolution theorem, the field can be computed as a sequence of Fourier positive and inverse transforms
In this equation, the symbol ∗ signifies the convolution operation, while F represents the Fourier transform operator. The evaluation of this transform is performed numerically via the Fast Fourier Transform (FFT) algorithm, which provides computational efficiency.
4. Detection Performance and Outlook
4.1. Detection Performance
Single-pulse subtraction TV Holography has better fringe visibility, while double-pulse TV Holography can detect deformation of a larger area of the object without exceeding the resolvable fringe density. Multiwavelength microscopic TV Holography uses multiple wavelengths to measure deformation and shape in quantitative deformation and 3D surface profile analysis with variable measurement sensitivity [66]. High-speed TV Holography is not only able to analyze the multi-modal vibration of plate-like structures, but also obtain its complex amplitudes [67]. A pulsed TV holography system enables the acquisition of a two-dimensional map of the instantaneous out-of-plane displacement [68].
The visibility of fringes in shearography is not as good as that in TV Holography, but the application of shearography is suitable for both rough and smooth surfaces [69]. Applications of shearography also include delamination studies of composites, evaluation and characterization of mechanical properties of materials [70]. Especially, a polarization digital shearing system based on two Mach-Zehnder interferometers has been developed, which can generate two orthogonal shearing directions and record the shearing patterns of the two orthogonal directions simultaneously. This allows simultaneous bidirectional nondestructive testing during continuous loading [71].
Digital acousto-optic holography uses TV Holography or shearography as the underlying optical scheme to obtain the information of complex amplitude, and then combines the law of sound propagation and Rayleigh-Sommerfeld diffraction theorem to reconstruct the complex amplitude on an arbitrary plane and realize the imaging of the internal structure of the object which thus offers significant advantages in reconstructing structure information on an arbitrary plane.
4.2. Advantages of Digital Acousto-Optic Holography
Firstly, the shearography and laser holographic scattering interference techniques associated with digital acousto-optic holography can directly reflect the hazard of defects.
Secondly, shearography can measure strain directly, and the stress distribution is accordingly obtained, which makes shearography extremely practical. Since defects usually produce strain concentrations, it appears easier to relate defects to strain anomalies.
Thirdly, inadvertent rigid body movements during loaded external force testing do not generate strain and therefore the shearography technique is insensitive to such movements. This indicates that the shearography technique is less sensitive to interference.
Fourthly, shearography does not require a reference beam, which means that systems applying the technique do not have high requirements for vibration isolation. Fifthly, the surface deformation caused by loading acoustic excitation with digital acousto-optic holography is well reproducible.
4.3. Disadvantages of Digital Acousto-Optic Holography
Both TV holography and shearography detect flaws by comparing two deformation states of the test object. Ideally, the applied stress should replicate in-service conditions so that only defects within regions of high stress are highlighted, while superficial imperfections are disregarded. However, accurately reproducing real-world loading conditions is challenging due to difficulties in controlling the motion of the test object during loading. Both techniques exhibit very low tolerance to rigid-body movement, which induces speckle decorrelation and degrades fringe visibility.
Material defects typically induce localized strain concentrations under stress. TV holography identifies defects by detecting anomalies in displacement fields, whereas shearography reveals defects through strain anomalies. The sensitivity of both methods decreases when defects are located at considerable depths. Consequently, shearography and TV holography are particularly well-suited for inspecting plate-like and shell-like structures, where defects are typically situated near the surface.
There is no standardized interpretative framework for analyzing fringe patterns obtained via shearography. A major limitation of this technique is the considerable difficulty in characterizing defect types other than delamination.
4.4. Problems and Outlook
Although digital acousto-optic holography enables the detection of opaque objects, the shortcomings of the technique are also evident. From the current literature, the reconstruction resolution of the technique is generally in the millimeter range, and practical applications for reconstructing the internal structure of objects with high accuracy have not yet been achieved. Moreover, the propagation pattern of acoustic waves inside solids is extremely complex, and there are not only longitudinal and transverse acoustic wave modes in solids but also various modes of surface waves [72]. How the various modes of acoustic waves can be identified and how useful information can be extracted in the context of complex signals remains to be explored. Although the technique of collecting longitudinal wave information alone for defect and structure detection is relatively mature, the contrast of the images obtained is not satisfactory. In contrast, the collection and processing of transverse wave information that has emerged in recent years has brought better contrast and discrimination to acoustic imaging, which is a promising trend.
The resolution limit of acoustic imaging is largely limited by the wavelength of the acoustic wave and the complexity of acoustic wave propagation within a solid [73]. According to the classical Rayleigh criterion, the minimum angle of resolution satisfies the relationship:
where is the incident wavelength and D is the observation aperture diameter. From this criterion alone, it is easy to see that there are two paths to increasing resolution: either reduce the incident wavelength or increase the aperture diameter. As sound waves travel faster in solids and liquids, the wavelengths are longer at less high frequencies. Assuming a sound wave frequency of 1 MHz and a speed of sound of approximately 1000 m/s, this corresponds to a wavelength of 0.001 m, which is approximately 103 times the wavelength of visible light. The resolution of the resulting image is comparable to that obtained by several of the techniques described earlier. From the perspective of near-field acoustic holography [74,75], however, it is possible to break the classical Rayleigh criterion by collecting swiftly passing waves with a high-frequency spatial component without changing the incident wavelength. The limitations of the classical Rayleigh criterion are well illustrated by the fact that scanning near-field ultrasonic holography can achieve a resolution of about 10 nm at a frequency of 2.2 MHz
Fourier chromatography microscopy and synthetic aperture techniques can improve spatial resolution. Fourier chromatography microscopy repeatedly stitches together many low-resolution intensity images of variable illumination in Fourier space to produce wide-field, high-resolution images of complex samples. While Fourier chromatography microscopy improves the resolution by varying the angle of illumination, synthetic aperture technique improves the resolution by collecting signals from different distances in different directions, both in a sense of increasing the effective viewing aperture [76,77,78]. The above super-resolution imaging techniques show that the richer the information obtained from the tested object, the higher the resolution of the resulting reconstructed image.
5. Summary
Digital acousto-optic holography fully utilizes the penetrating nature of acoustic waves and the high precision recording and flexible reconstruction of TV holography, shearography, and digital holography, which can be used for the non-destructive detection of the internal structure of objects. Its main ideas are: 1) acoustic waves are affected by the internal structure of an object, and so the acoustic waves on the surface of the object must contain the information about the internal structure of the object; 2) The recording of acoustic complex amplitudes was achieved by holography, and the complex amplitudes in arbitrary planes were reconstructed by the Rayleigh-Sommerfeld diffraction formula. The development of digital acousto-optic holography has promoted the cross integration of acoustics, optics, and information disciplines, deepening the links between them.
Author Contributions
Writing—original draft preparation, Guangcai Huang; writing—review and editing, Guangcai Huang; supervision, Wenjing Zhou; project administration, Wenjing Zhou, Yingjie Yu. All authors have read and agreed to the published version of the manuscript.
Funding
This research received no external funding.
Data Availability Statement
The data supporting the findings of this review are derived from publicly available articles and sources, all of which are cited in the reference list. No new data were created or analyzed in this study.
Acknowledgments
This work was guided and assisted by Ting-Chung Poon of Virginia Tech, to whom we would like to express our sincere gratitude.
Conflicts of Interest
The authors declare no conflicts of interest.
References
- Chen, Y. et al. Ultra-fast laser ultrasonic imaging method for online inspection of metal additive manufacturing. Optics and Lasers in Engineering 2023, 160, 107244. [CrossRef]
- Xu, W. et al. Intelligent denoise laser ultrasonic imaging for inspection of selective laser melting components with rough surface. NDT & E International 2022, 125, 102548. [CrossRef]
- Yusefi, H.; Helfield, B. Ultrasound contrast imaging: Fundamentals and emerging technology. Frontiers in Physics 2022, 10, 791145. [CrossRef]
- Yang, H. et al. Ultrasonic imaging of delamination in thick CFRP laminates using an energy-compensation reverse time migration method. Ultrasonics 2024, 138, 107253. [CrossRef]
- Othmani, C. et al. Acoustic tomographic reconstruction of temperature and flow fields with focus on atmosphere and enclosed spaces: A review. Applied Thermal Engineering 2023, 223, 119953. [CrossRef]
- Zhang, L.; Dong, X. Acoustic tomography temperature distribution reconstruction based on dual-domain feature fusion network. International Journal of Heat and Mass Transfer 2024, 235, 126232. [CrossRef]
- Zhang, J.; Khoshelham, K. 3D Reconstruction of Internal Wood Decay Using Photogrammetry and Sonic Tomography. Photogrammetric Record 2020, 35(171),357-374. [CrossRef]
- Liu, H.; Tan, C.; Ren, S.; Dong, F. Real-Time Reconstruction for Low Contrast Ultrasonic Tomography Using Continuous-Wave Excitation, IEEE Transactions on Instrumentation and Measurement 2020, 69(4),1632-1642. [CrossRef]
- Zou, Tongfei, et al. "Effect of temperature on tensile behavior, fracture morphology, and deformation mechanisms of Nickel-based additive manufacturing 939 superalloy. Journal of Alloys and Compounds 2023, 959, 170559. [CrossRef]
- Ji, R.; et al. Microstructure evolution, mechanical response and strengthening models for TA15 titanium alloy during thermal processes: A brief review. Journal of Materials Research and Technology 2024, 28, 1644-1656. [CrossRef]
- Wang, K. et al. Dislocation slip and crack nucleation mechanism in dual-phase microstructure of titanium alloys: a review. Acta Metallurgica Sinica 2023, 36, 353-36. [CrossRef]
- Chen, S. et al. Imaging of MEMS morphology and deformation based on digital holography. Holography, Diffractive Optics, and Applications XIII 2023, 12768.
- Kang, W.; Zheng, Z.; Huang, H. Advancements in digital holography for crystalline material characterization: a review. Crystal Research and Technology 2025, 60(4), 2400264. [CrossRef]
- Hou, R.; Guevara, J.A.; Inoue, J. In-situ observation of variant pair formation in bainite of low carbon steel by digital holographic microscopy. Acta Materialia 2024, 277, 120212. [CrossRef]
- Kim, J. et al. Single-shot reconstruction of three-dimensional morphology of biological cells in digital holographic microscopy using a physics-driven neural network. Nature Communications 2025, 16, 4840. [CrossRef]
- Pan, Y.; Wang, K. Dynamic measurement of 3D displacements using dual-camera lensless Fourier transform digital holography. Applied Optics 2023, 62.19, 5115-5125. [CrossRef]
- Feng, L. et al. Digital holographic phase aberration compensation using bilinear interpolation for background phase supplementation. Laser Physics 2025, 35, 065401. [CrossRef]
- Januariyasa, I.K. et al. Molding three-dimensional azopolymer microstructures with holographically structured light. RSC Applied Interfaces 2024, 1(6), 1198-120. [CrossRef]
- Barroso, V.S. et al., Multiplexed digital holography for fluid surface profilometry. Applied Optics 2023, 62(27), 7175-7184. [CrossRef]
- Chen, Z. et al. Quantitative analysis of cancer cell morphology using digital holography technology under high temperature stimulation. Histochemistry and Cell Biology 2025, 163(1), 63. [CrossRef]
- Li, P. et al. Holographic surface-acoustic-wave tweezers for functional manipulation of solid or liquid objects. Physical Review Applied 2023, 20(6), 064003. [CrossRef]
- Zhang, R. et al., Parallel droplet ejection with artificial-structure-based holographic acoustic fields. Physical Review Applied 2024, 22(6), 064010. [CrossRef]
- Varriale, V. et al. Critical analysis of the impact of artificial intelligence integration with cutting-edge technologies for production systems. Journal of Intelligent Manufacturing 2025, 36, 61-93. [CrossRef]
- Yu, D.; Wang Y. Research on holographic display and technology application of art museum based on immersive design. Journal of Physics: Conference Series 2023, 2425, 012048. [CrossRef]
- Wang, Q. Application of Digital Art Display Technique in Exhibition Space Under Information Background. In Proceedings of Innovative Computing 2024, Vol. 2. IC 2024. Lecture Notes in Electrical Engineering, vol 1215. Springer, Singapore. [CrossRef]
- Fu, Y.; Jiang, Y. Research on the Application of Multimedia Interactive Technology in the Design of Intelligent Exhibition Halls. 3rd International Conference on Internet, Education and Information Technology (IEIT 2023). 2023. [CrossRef]
- Pickering, SG.; Almond, D.P. Comparison of the defect detection capabilities of flash thermography and vibration excitation shearography, Insight 2010, 52(2), 78-83.
- Wang, H. Development of an Electronic Speckle Pattern Interferometry System for Non-Contact Nanoscale Surface Measurement and Its Application to Acoustic Wave Detection. Diss. 2024.
- Vijay, A. et al. An integrated portable system for laser speckle contrast imaging and digital holographic microscopy. Optics Communications 2025, 575, 131240. [CrossRef]
- Yildiz, I. Alternative to laser vibrometers: a non-contact vibration measurement based on enhanced laser speckle pattern and stroboscopic sampling. Metrology and Measurement Systems 2024, 31(4). [CrossRef]
- Puig Vilardell, E. et al. Spatio-spectral correlations in interferenceless coded aperture correlation holography with vortex speckles. Applied Physics B 2025, 131, 142. [CrossRef]
- Zhang, W. et al. Computational incoherent edge enhancement imaging based on self-interference digital holography. Optics & Laser Technology 2024, 168, 109888. [CrossRef]
- Kim, Y. et al. Recent research on self-interference incoherent digital holography. Current Optics and Photonics 2024, 8(1), 1-15. [CrossRef]
- Xu, R, Ou, H.; Lam, E.Y. Defocus and speckle noise suppression in optical scanning holography. Optics & Laser Technology 2025, 190, 113246. [CrossRef]
- Smolovich, A.M. et al. Identification of a replicable optical security element using laser speckle. Optics & Laser Technology 2024, 175, 110725. [CrossRef]
- Kim, K. et al. AI-driven pseudo-light source for achieving high coherence and low speckle noise simultaneously in dual-wavelength digital holographic microscopy. Optics & Laser Technology 2025, 181, 111572. [CrossRef]
- Behal, J., et al. On the optical performance of incoherent digital holography for extended 3D objects. Optics & Laser Technology 2024, 170, 110286. [CrossRef]
- Wang, W. et al. High-fidelity light-field holographic display via spatiotemporal spectrum expansion and speckle noise suppression. Optics Express 2025, 33(16), 34358-34374. [CrossRef]
- Chao, X. et al. Measurement of spatial coherence of partially coherent light by spatial averaging of speckle pattern. Optics & Laser Technology 2024, 176, 110915. [CrossRef]
- Keene, L.T. et al. Laser Speckle Pattern Stability in Hypersonic Regimes for Experimental Mechanics and Metrological Studies. Experimental Techniques 2024, 48, 101-113. [CrossRef]
- Fang, S. et al. Simultaneous measurement of temperature by Background-oriented Schlieren and speckle interferometry: Comparison and validation. Optics & Laser Technology 2025, 182, 112161. [CrossRef]
- Nazarchuk, Z.; Muravsky L; Kuryliak, D. Digital speckle pattern interferometry for studying surface deformation and fracture of materials. In Optical Metrology and Optoacoustics in Nondestructive Evaluation of Materials. Springer Series in Optical Sciences, vol 242. Springer, Singapore. [CrossRef]
- Lapchuk, A. et al. Speckle-and interference fringes-free illumination system with a multi-retarder plate. Optics Express 2023, 31(12), 19173-19188. [CrossRef]
- Zhang, Y. et al. Angular spectrum method for simulation and analysis of ground glass produced laser speckle pattern. Optics Communications 2024, 557, 130299. [CrossRef]
- Rao, J.; Dong, J.; Wang, J.; Rank, E. Application of common-path speckle interferometer with unlimited minimal shearing amount to characterization of irregularly shaped notch. NDT&E International 2020, 20116,102326. [CrossRef]
- Běhal, J.; Ježek M. Incoherent lateral shearing digital holographic microscopy. Optica 2025, 12(5), 620-625. [CrossRef]
- Chaudhari, H. et al. Lateral shearing common-path digital holographic microscopy with iterative reconstruction. Applied Optics 2025, 64(22), 6285-6291. [CrossRef]
- Cabrera, H., et al. Self-referencing photothermal digital holographic microscope for characterization of low-loss liquids. Applied Physics Letters 2023, 123(4). [CrossRef]
- Chaudhari, H. et al. Common path off-axis digital holographic flow cytometry based on lateral shearing using beam splitter. Optical Methods for Inspection, Characterization, and Imaging of Biomaterials VII. 2025,13571. [CrossRef]
- Celik Bayar, C. et al. Imaging of foam concrete air bubbles with an alternative method of combined digital holographic microscopy. Journal of Materials Science 2024, 59, 8706-8720. [CrossRef]
- Deng, L. et al. Lateral-shearing short-coherence digital holographic microscopy based on dual-plate beam splitters. Applied Optics 2025, 64(6), 1408-1412. [CrossRef]
- Gupta, G.; O'Connor, T.; Javidi, B. Overview of digital holographic deep learning of red blood cells for field-portable, rapid disease screening. Three-Dimensional Imaging, Visualization, and Display 2024 2024, 13041. [CrossRef]
- Yuan, X. et al. High-precision gaseous flame temperature field measurement based on quadriwave-lateral shearing interferometry. Optics and Lasers in Engineering 2023, 162, 107430. [CrossRef]
- Shanmugam, P.; Falaggis, K. Effective selection of shears in variable lateral shearing holography. Applied Optics 2023, 62(33) 8716-8723. [CrossRef]
- Kaya, G.U. Development of hybrid optical sensor based on deep learning to detect and classify the micro-size defects in printed circuit board. Measurement 2023, 206, 112247. [CrossRef]
- Kumar, R.; Dwivedi, G. Emerging scientific and industrial applications of digital holography: an overview. Engineering Research Express 2023, 5(3), 032005. [CrossRef]
- Kikuchi, Y. et al. Feasibility Study on Shearing Digital Holography Using Functionally Integrated Waveguide Illuminator. In 2025 30th OptoElectronics and Communications Conference (OECC) and 2025 International Conference on Photonics in Switching and Computing (PSC), Sapporo, Japan, 2025, pp. 1-3. [CrossRef]
- Gautam, A. et al. Recording of incoherent vector holograms using elements of the spatial cross-spectral density matrix. Optics and Lasers in Engineering 2023, 169, 107687. [CrossRef]
- Tsai, C.; Vyas, S.; Luo, Y. Common-path digital holographic microscopy based on a volume holographic grating for quantitative phase imaging. Optics Express 2024, 32(5), 7919-7930. [CrossRef]
- Sun, T. et al. Coupling Michelson-like lateral shear interferometric microscopy with self-referencing numerical phase calibration for quantitative measurement of 3D surface morphology of biological cells. Journal of Laser Applications 2024, 36(2). [CrossRef]
- Pant, L.M. et al. Investigations on the measurement of freeform optical wavefront using a holo-shear lens. Applied Optics 2025, 64(8), 1775-1782. [CrossRef]
- Yan, P.; Liu, X.; Wu, S.; Sun, F.; Zhao, Q.; Wang, Y. Pixelated Carrier Phase-Shifting Shearography Using Spatiotemporal Low-Pass Filtering Algorithm Sensors 2019, 19(23), 5185. [CrossRef]
- Yan, P.; Wang, Y.; Sun, F.; Lu, Y.; Liu, L.; Zhao, Q. Shearography for non-destructive testing of specular reflecting objects using scattered light illumination. Optics and Laser Technology 2019, 112, 452-457. [CrossRef]
- Trillo, C. et al. Multimode vibration analysis with high-speed TV holography and a spatiotemporal 3D Fourier transform method. Optics express 2009, 17(20), 18014-18025. [CrossRef]
- Trillo, C., Doval, A.F. Spatiotemporal Fourier transform method for the measurement of narrowband ultrasonic surface acoustic waves with TV holography. Proc. of SPIE 2006, 6341, 63410M-(1-6). [CrossRef]
- Kumar, U.P.; Mohan, N.K.; Kothiya, M.P.; Asundi, A. K. Deformation and shape measurement using multiple wavelength microscopic TV holography. Optical Engineering 2009, 48(2), 023601. [CrossRef]
- Trillo, C.; Doval, Á. F.; Mendoza-Santoyo, F.; Pérez-López, C.; de la Torre-Ibarra, M.; Deán, J.L. Multimode vibration analysis with high-speed TV holography and a spatiotemporal 3D Fourier transform method. Optics Express 2009, 17(20), 18014-18025. [CrossRef]
- López-Vázquez, J.C.; Deán-Ben, X.L.; Trillo, C.; Doval, A.F.; Fernández, J.L. Numerical modeling and measurement by pulsed television holography of ultrasonic displacement maps in plates with through-thickness defects. Optical Engineering 2010, 49(9), 095802. [CrossRef]
- Yan, P.; Wang, Y.; Sun, F.; Lu, Y.; Liu, L.; Zhao, Q.H. Shearography for non-destructive testing of specular reflecting objects using scattered light illumination. Optics & Laser Technology, 2019, 112(15), 452-457. [CrossRef]
- Rojas-Vargas, F.; Pascual-Francisco, J.B.; Hernández-Cortés, T. Applications of Shearography for Non-Destructive Testing and Strain measurement. International Journal of Combinatorial Optimization Problems and Informatics 2020, 11(3), 21-36. [CrossRef]
- Xie, X.; Lee, C.; Li, J.; Zhang, B.; Yang, L. Polarized digital shearography for simultaneous dual shearing directions measurements. Review of Scientific Instruments 2016, 87, 083110. [CrossRef]
- Sarvazyan, A.P.; Urban, M.W.; Greenleaf, J.F. Acoustic Waves in Medical Imaging and Diagnostics. Ultrasound in Med. & Biol. 2013, 39(7), 1133-1146. [CrossRef]
- Harris, R.A.; Follett, D.H.; Halliwell, M.; Wells, P.N. Ultimate limits in ultrasonic imaging resolution. Ultrasound in medicine & biology 1991, 17(6), 547-558. [CrossRef]
- Williams, E.G.; Maynard, J.D. Holographic Imaging without the Wavelength Resolution Limit. Physical Review Letters 1980, 45(7), 554-557. [CrossRef]
- Diebold, A.C. Subsurface Imaging with Scanning Ultrasound Holography. Science 2005, 310(5745), 61-62. [CrossRef]
- Berger, M.; Bruck, D.; Fischer, M.; Langenberg, K.J.; Oberst, J.; Schmitz, V. Potential and Limits of Holographic Reconstruction Algorithms. Journal of Nondestructive Evaluation 1981, 2(2), 85-111. [CrossRef]
- Zheng, G.; Horstmeyer, R.; Yang, C. Wide-field, high-resolution Fourier ptychographic microscopy. NATURE PHOTONICS 2013, 7(9), 739-746. [CrossRef]
- Zuo, C.; Sun, J.; Li, J.; Asundi, A.; Chen, Q. Wide-field high-resolution 3D microscopy with Fourier ptychographic diffraction tomography. Optics and Lasers in Engineering 2020, 128,106003. [CrossRef]
Figure 1.
Schematic diagram of TV holography.
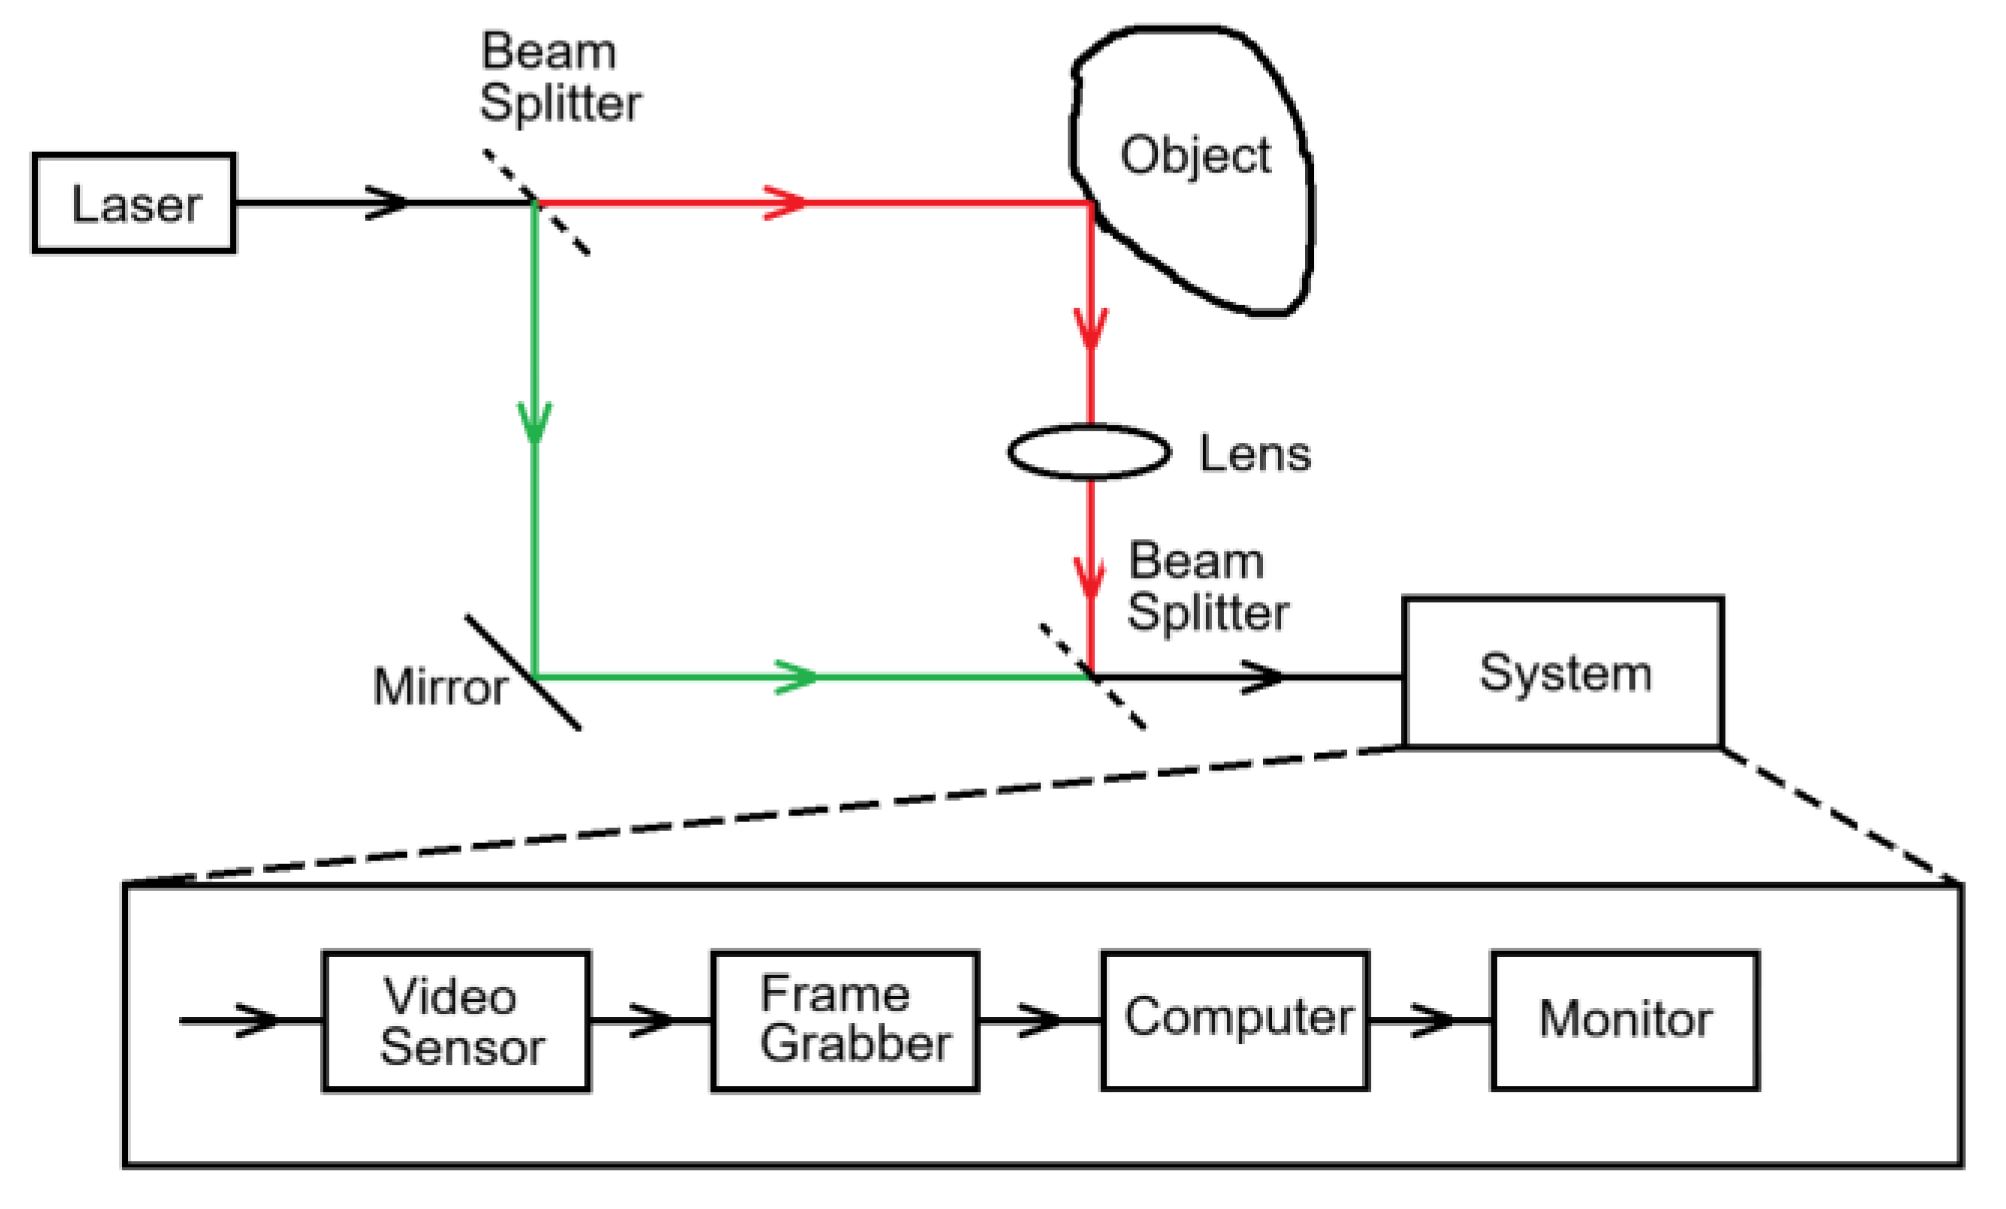
Figure 2.
Experimental TV Holography setup.
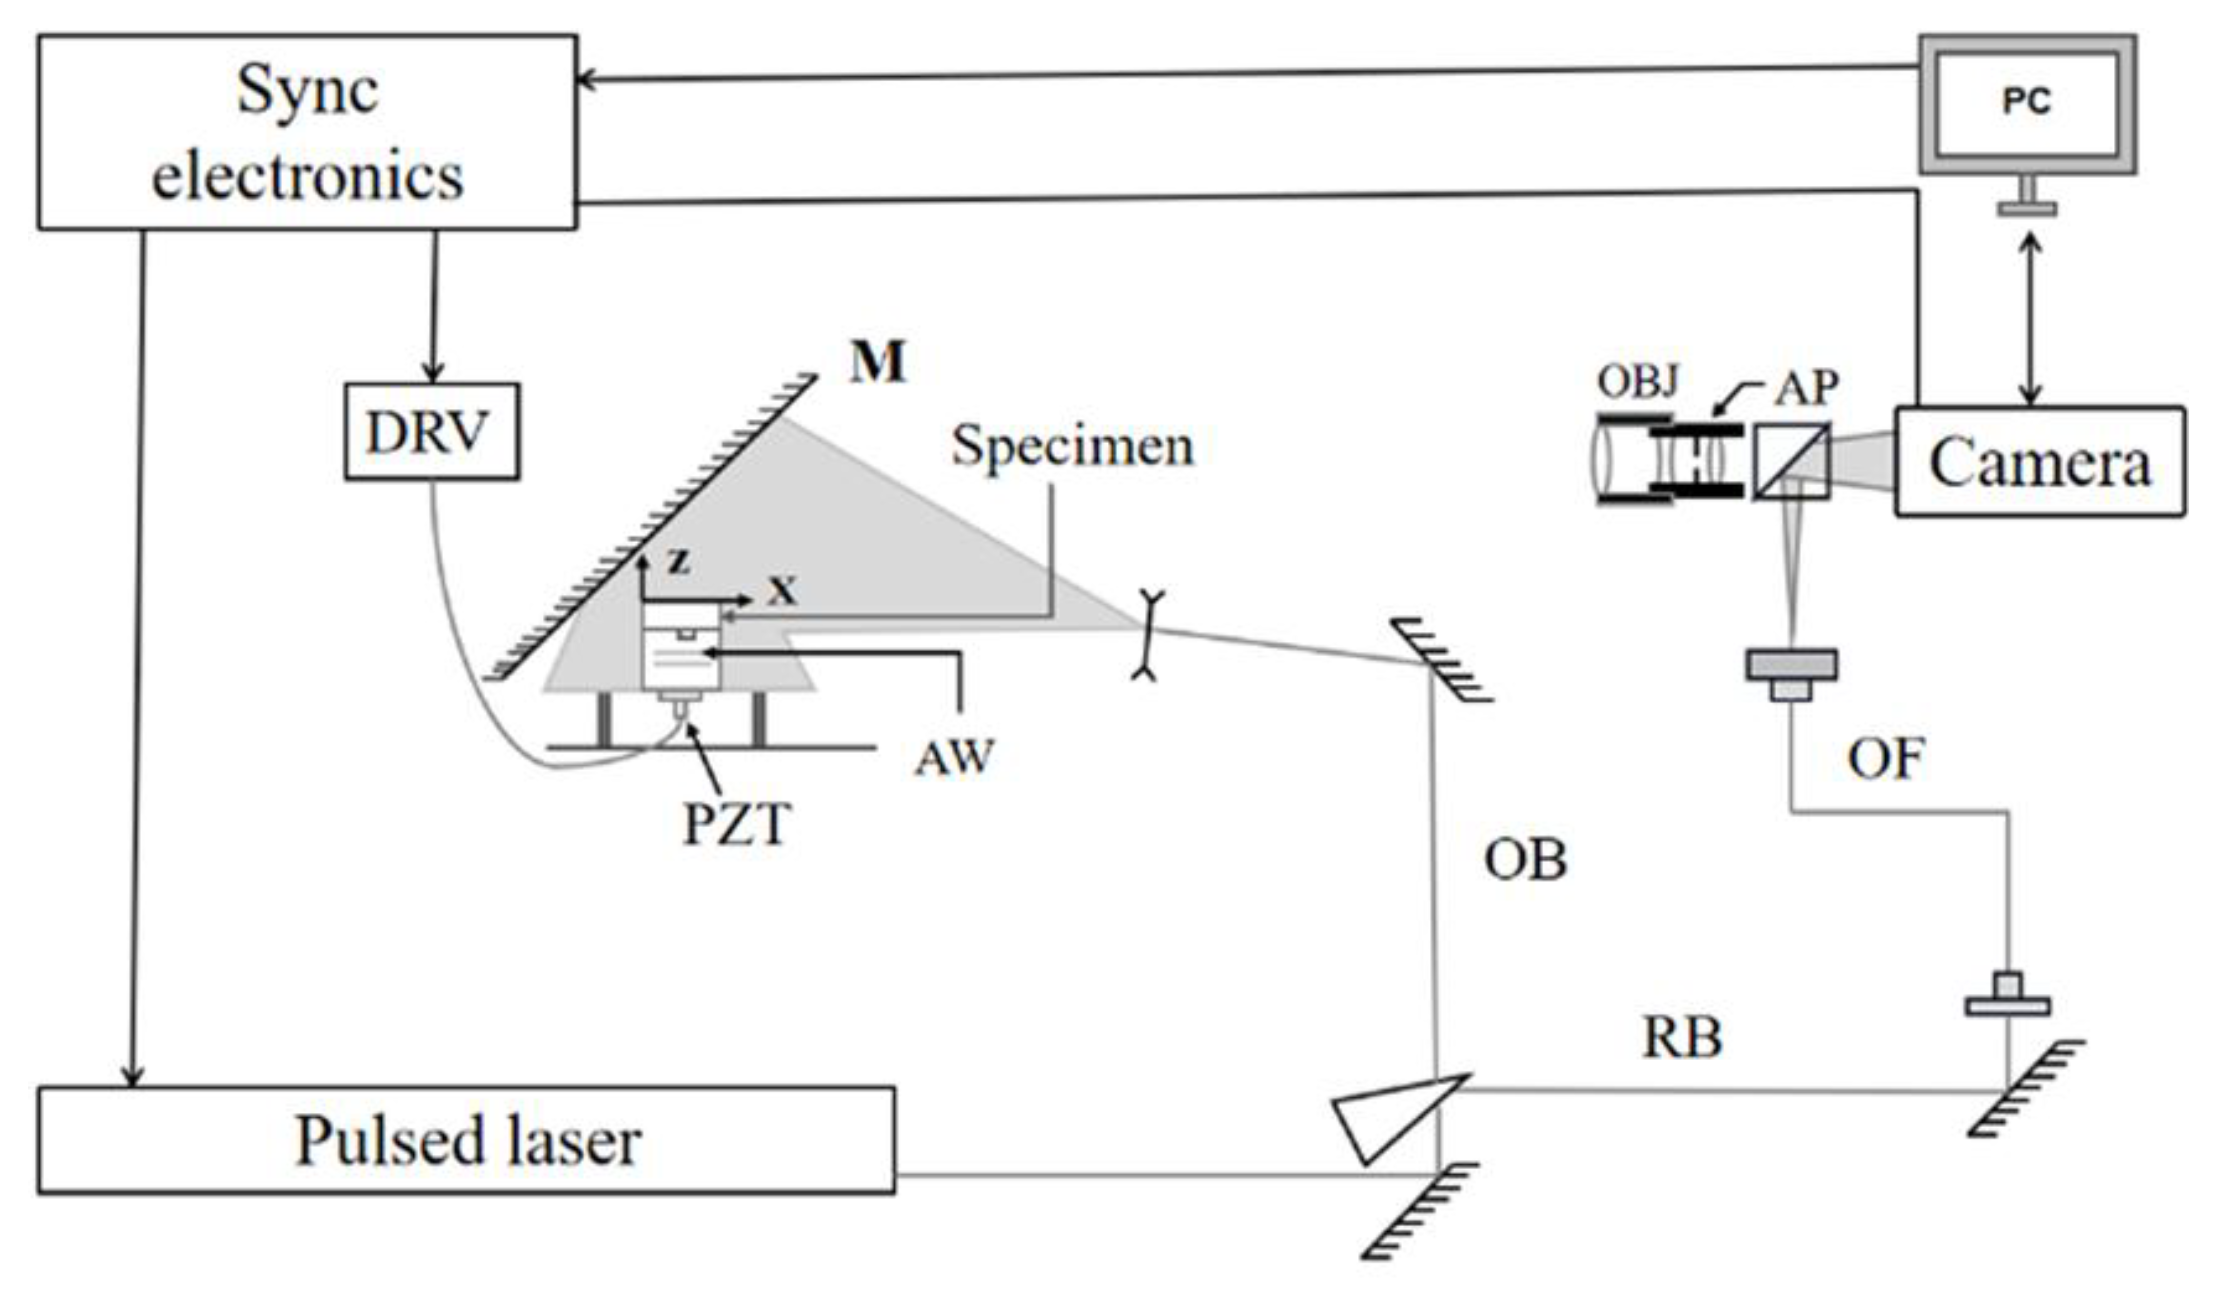
Figure 3.
Schematic diagram of shearography.
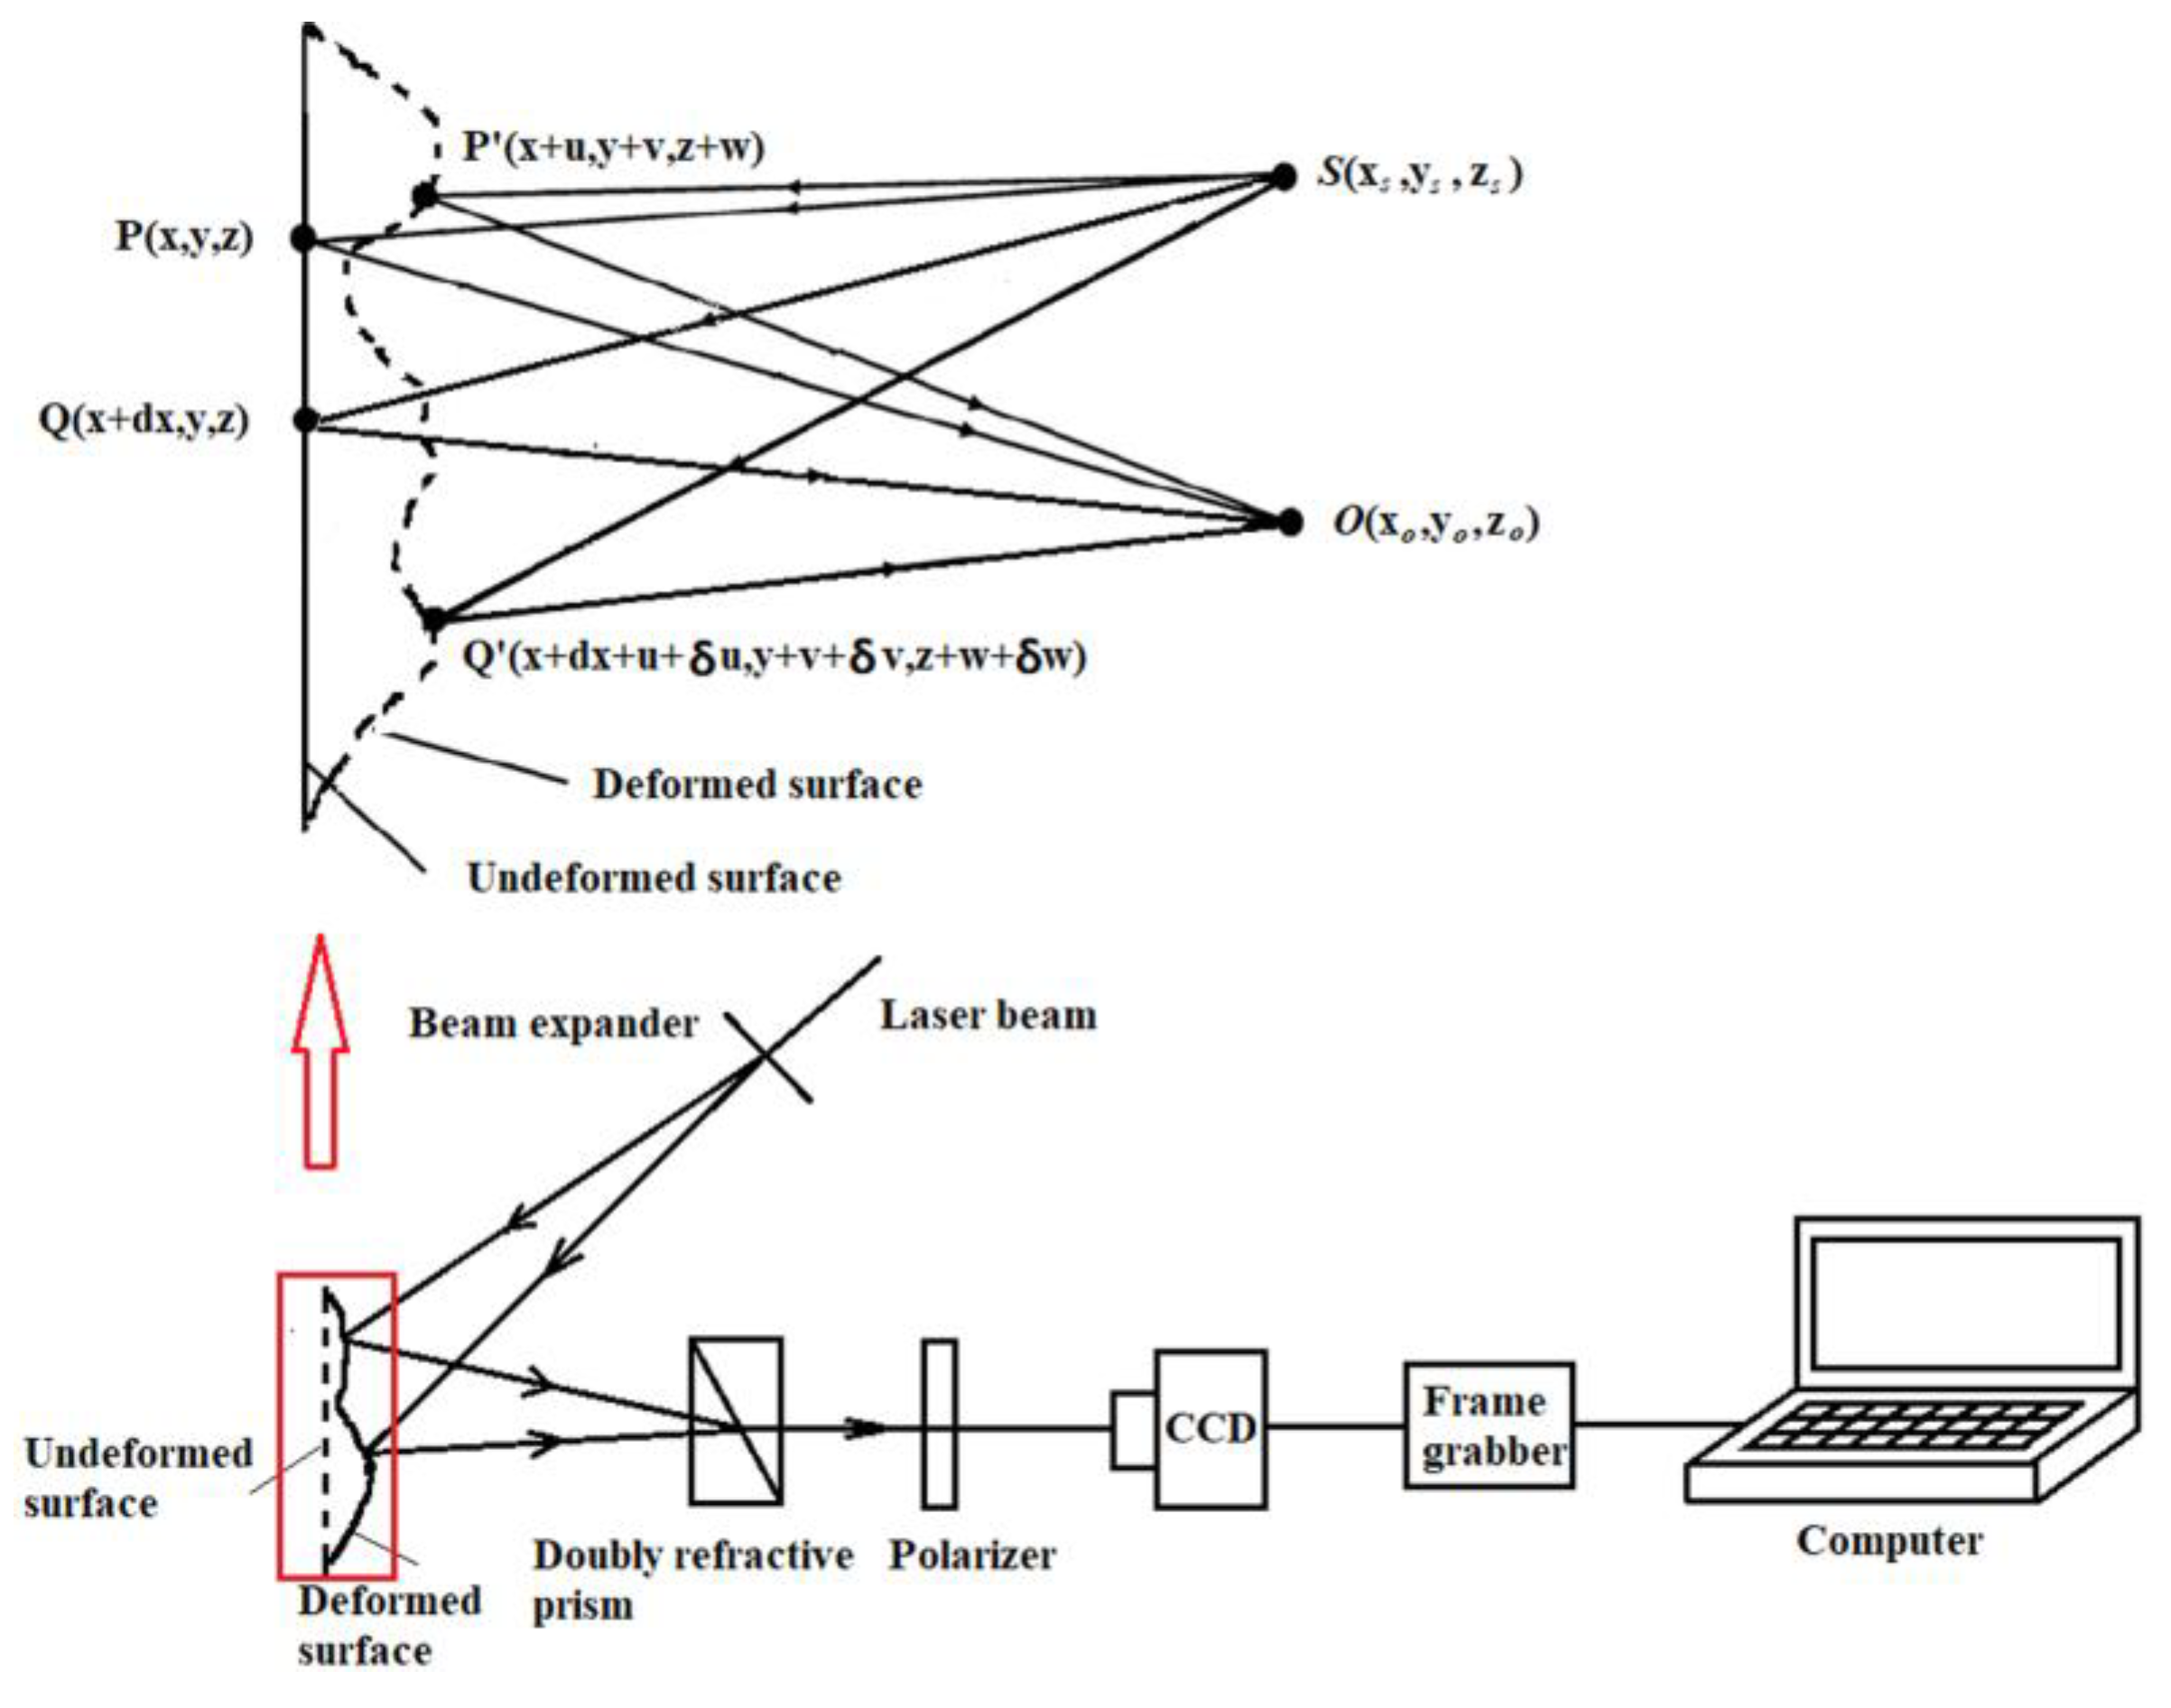
Figure 4.
Arrangement of a single-aperture common-path speckle interferometer with unlimited minimal shearing amount.
Figure 4.
Arrangement of a single-aperture common-path speckle interferometer with unlimited minimal shearing amount.
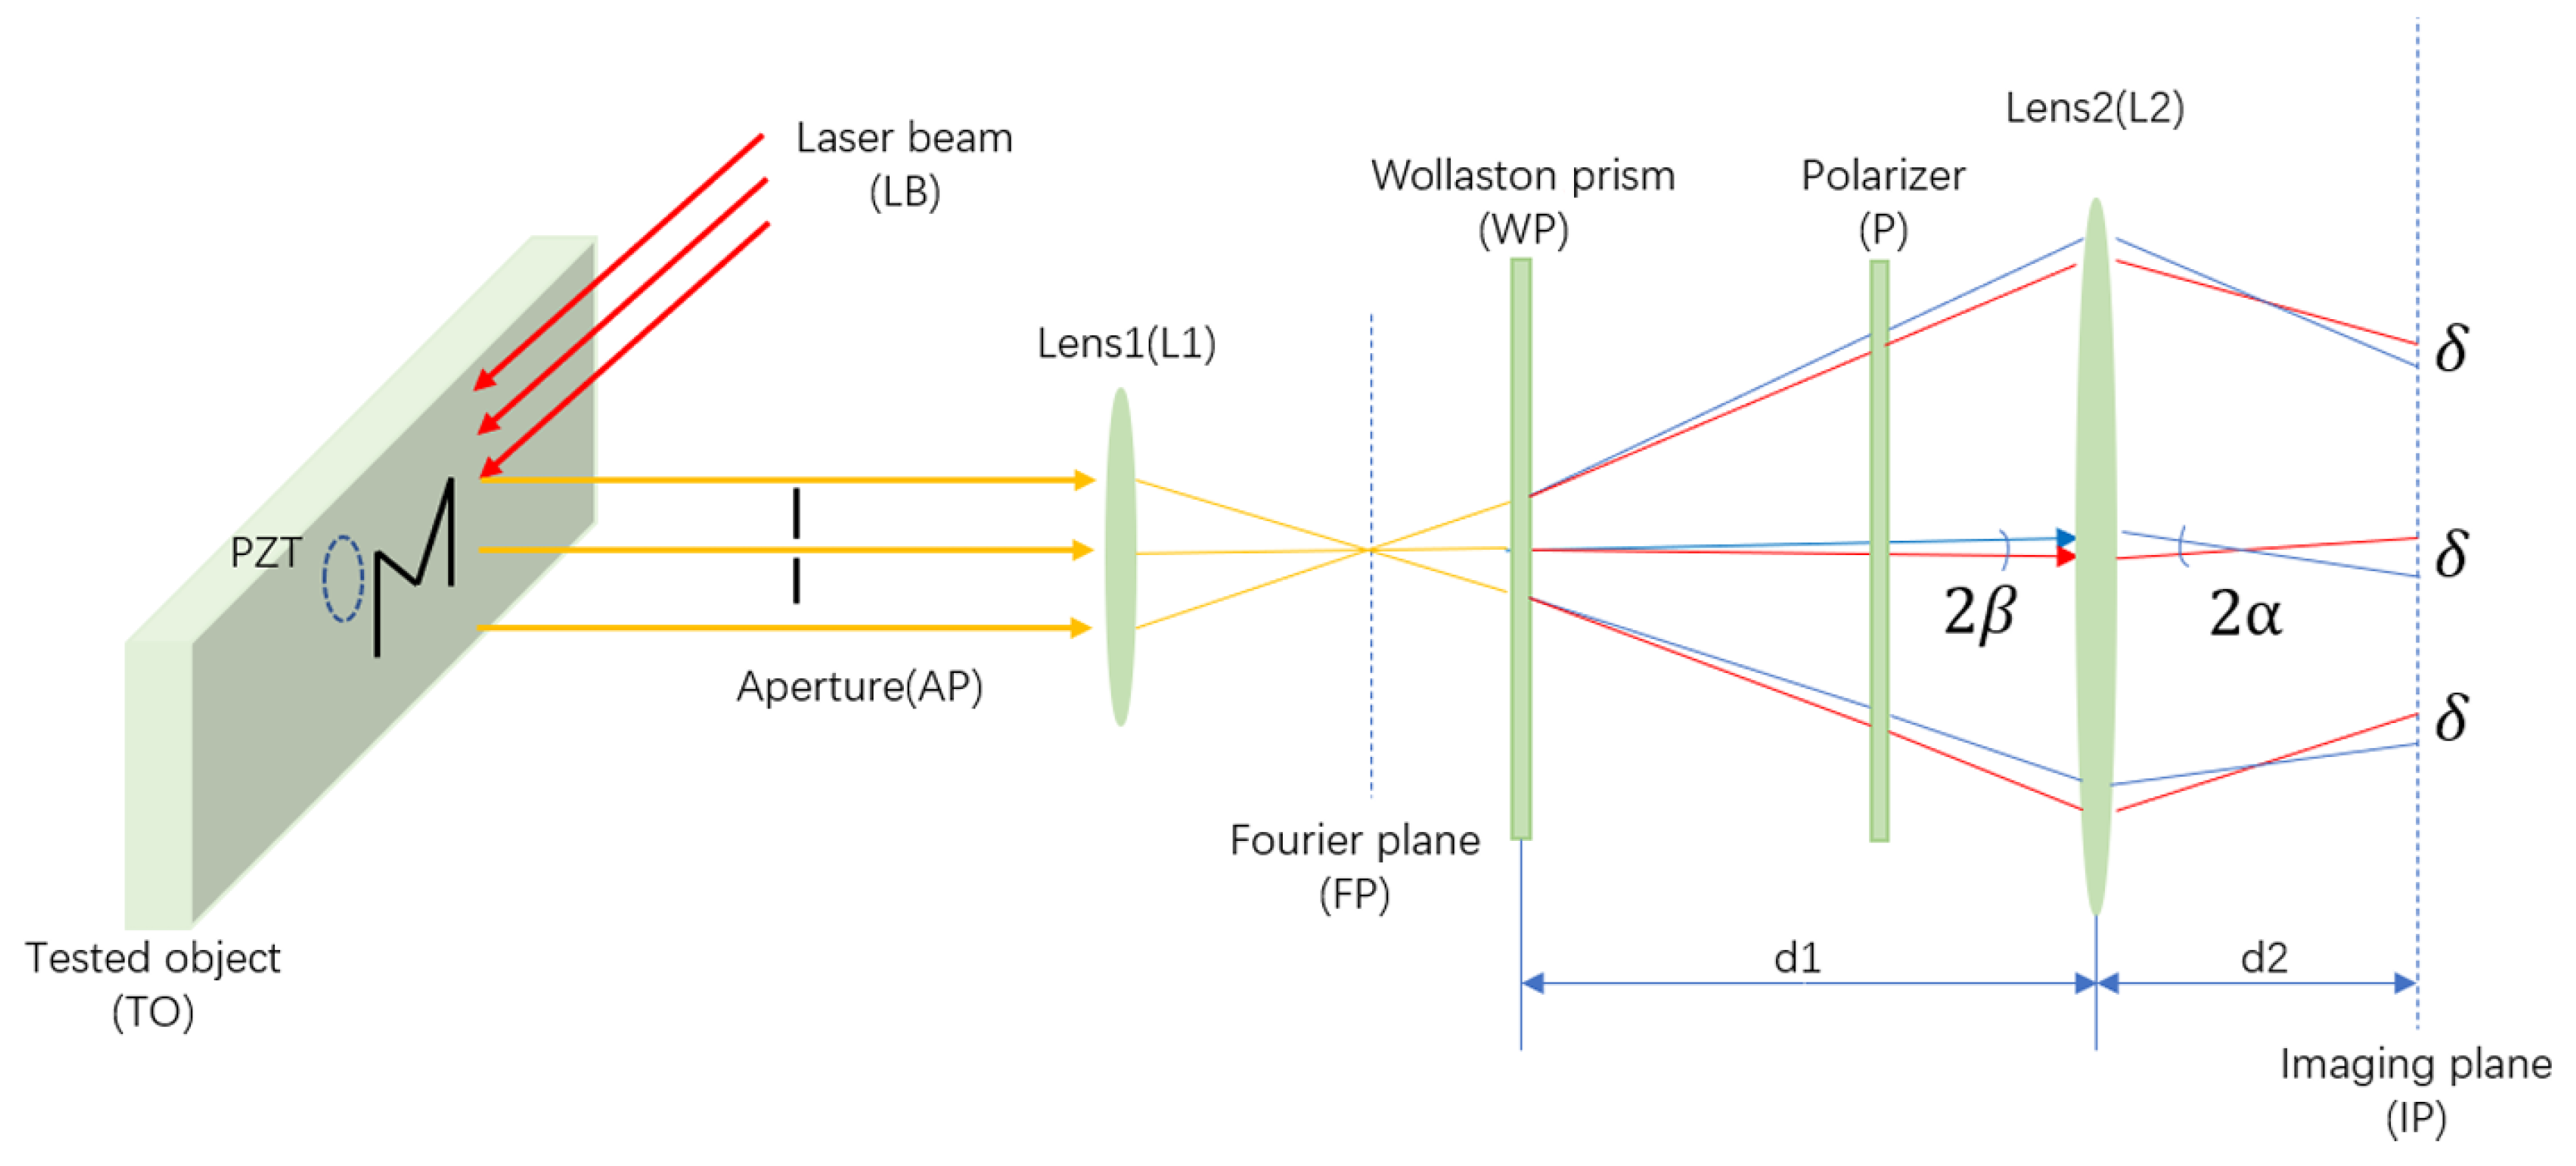
Figure 5.
Schematic drawing of shearography setup using acoustic wave as stress loading.
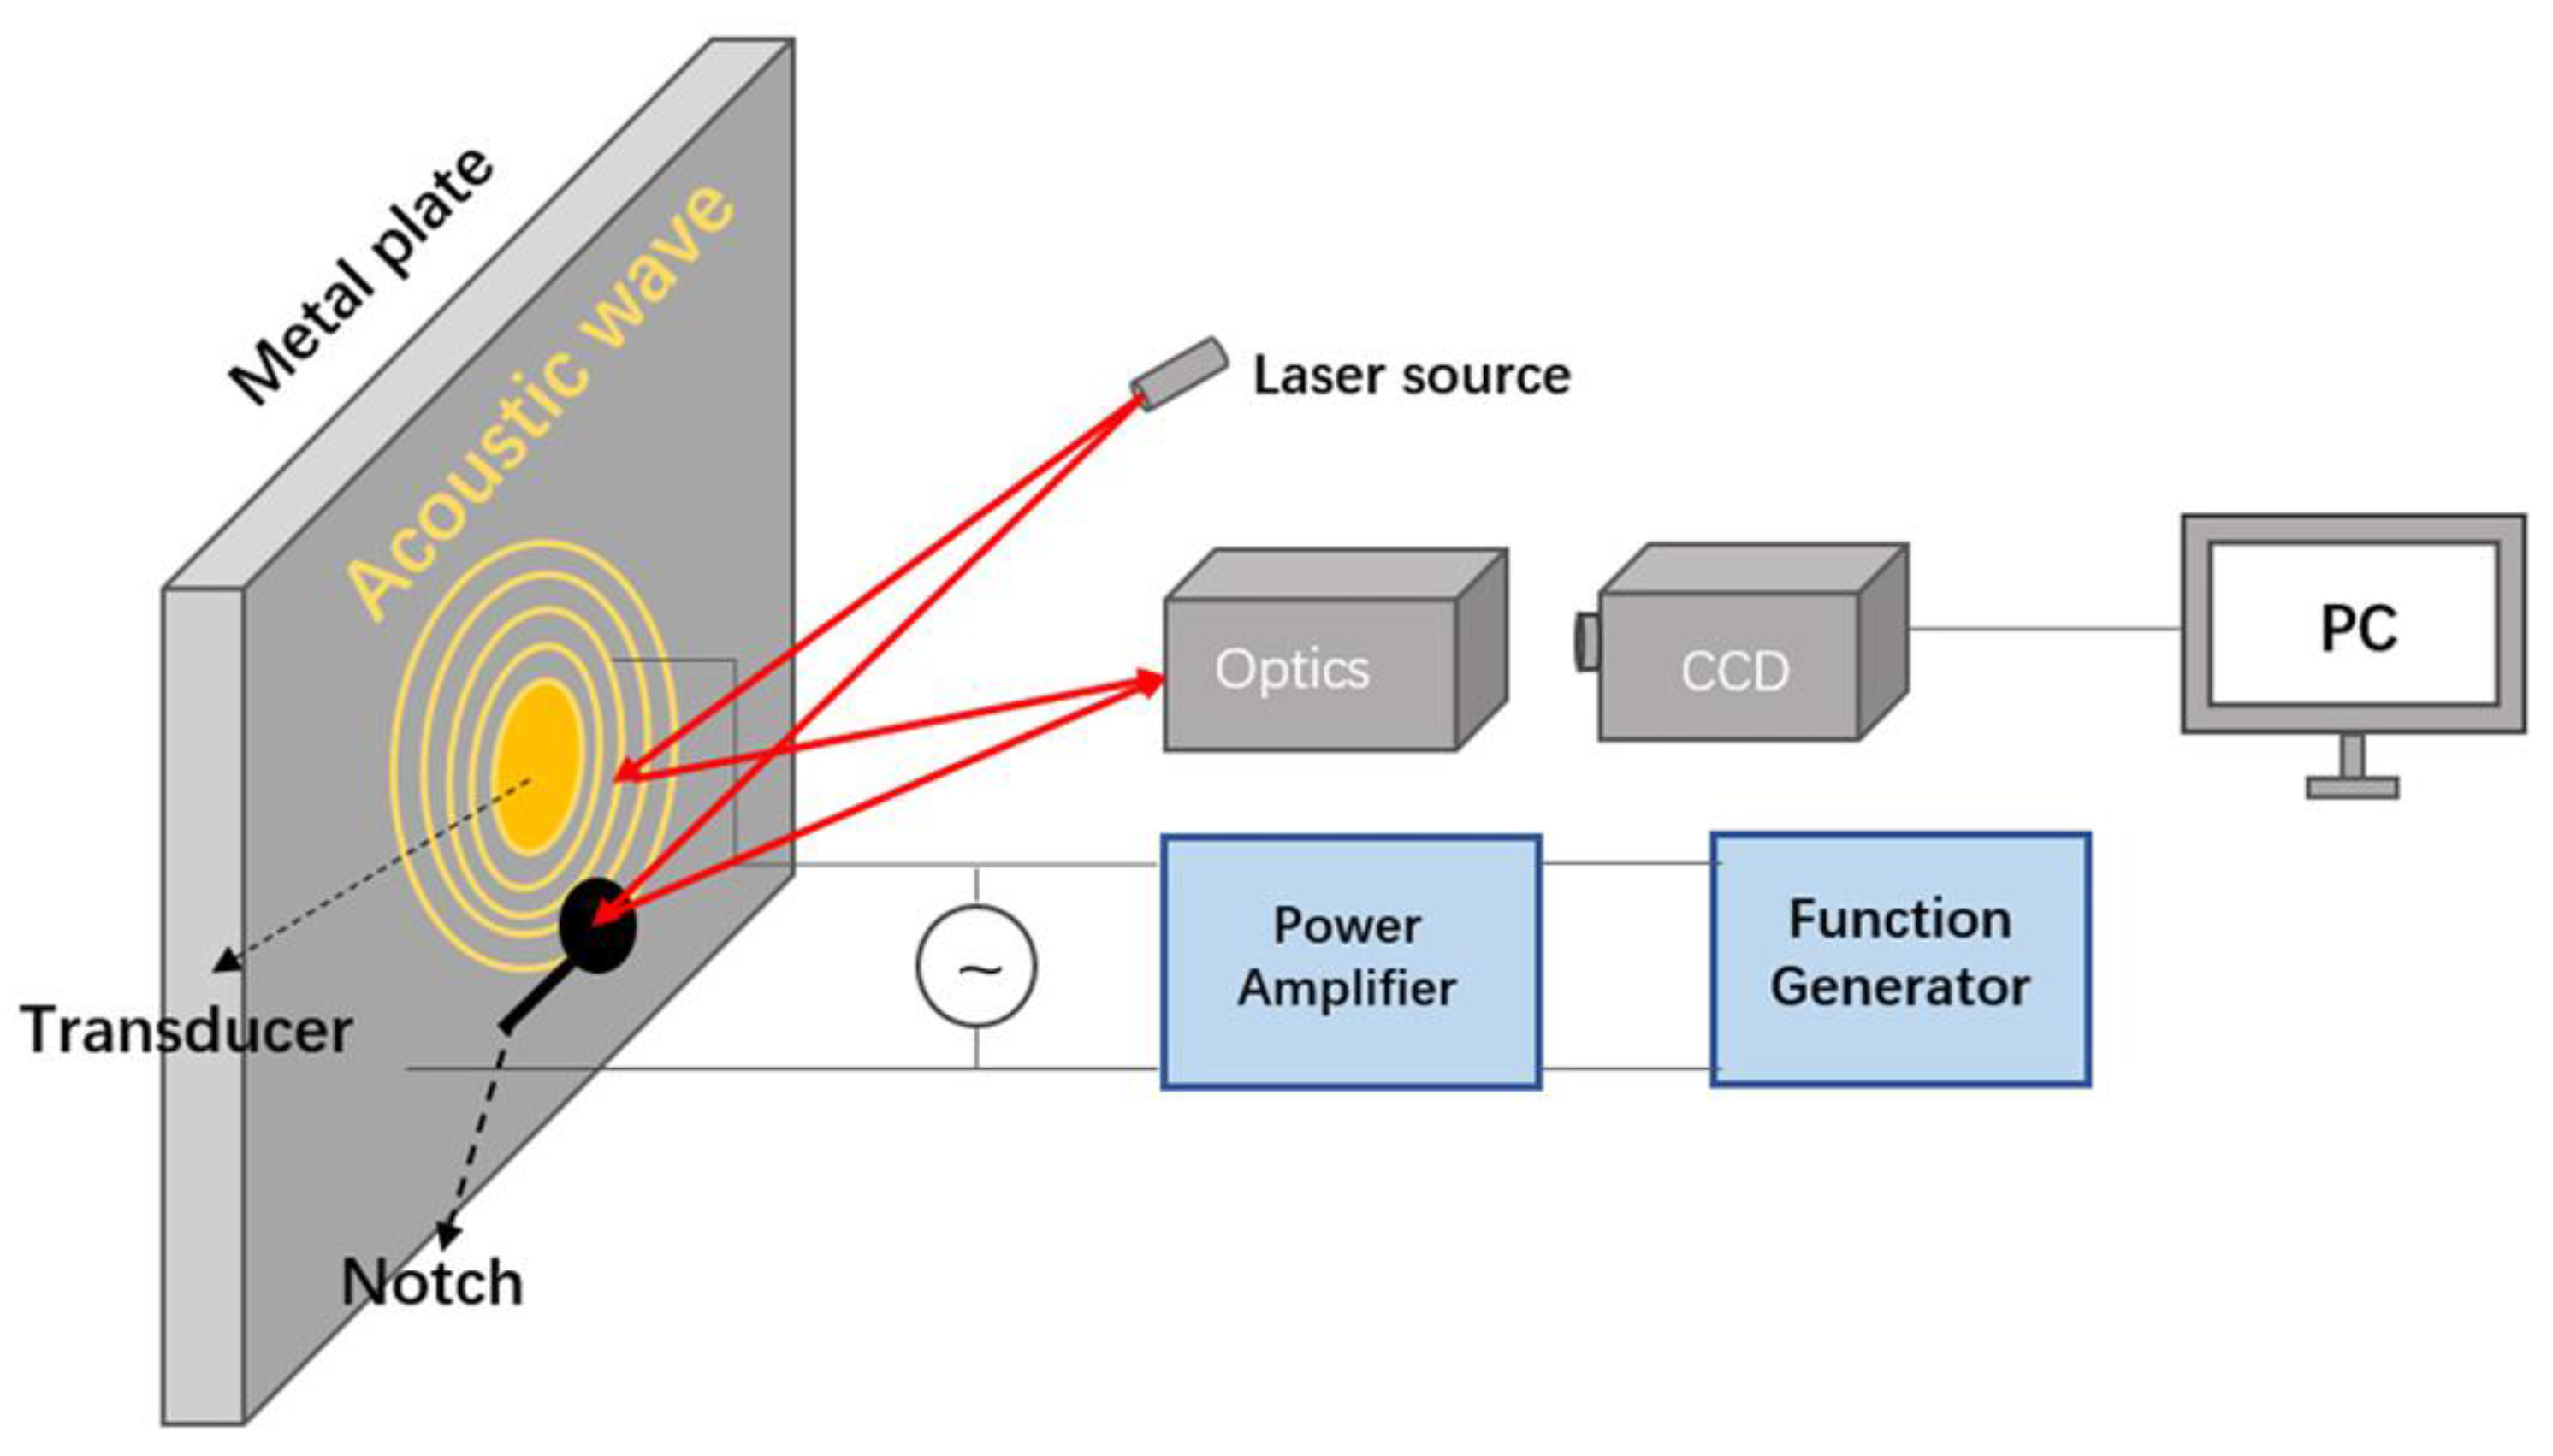
Figure 6.
Geometry of the numerical reconstruction process with digital holography.
Disclaimer/Publisher’s Note: The statements, opinions and data contained in all publications are solely those of the individual author(s) and contributor(s) and not of MDPI and/or the editor(s). MDPI and/or the editor(s) disclaim responsibility for any injury to people or property resulting from any ideas, methods, instructions or products referred to in the content. |
© 2025 by the authors. Licensee MDPI, Basel, Switzerland. This article is an open access article distributed under the terms and conditions of the Creative Commons Attribution (CC BY) license (http://creativecommons.org/licenses/by/4.0/).
Copyright: This open access article is published under a Creative Commons CC BY 4.0 license, which permit the free download, distribution, and reuse, provided that the author and preprint are cited in any reuse.


