
Submitted:
25 September 2025
Posted:
26 September 2025
You are already at the latest version
Abstract
Voltage-sensing phosphatases (VSPs) provide a conserved framework for dissecting the mechanics of voltage sensing and for engineering genetically encoded voltage indicators (GEVIs). To evaluate how natural sequence diversity shapes function, we compared VSP voltage-sensing domains (VSDs) from multiple species. Every construct that reached the plasma membrane produced a voltage-dependent optical signal, underscoring the deep conservation of voltage sensing across the family. Yet lineage-specific substitutions generated strikingly different phenotypes. A plankton ortholog exhibited a strongly left-shifted activation range, producing robust signals at modest depolarizations. The human VSD yielded weak, sluggish responses with poor recovery, but reintroduction of a conserved arginine in S1 (G95R) partially restored reversibility, implicating lipid-facing residues in conformational stability. The hamster VSD, with atypical S4 sensing charges (RWIR), generated a slow fluorescence increase during depolarization, while reverting to the consensus arginine (RRIR) inverted the polarity to a decrease. These contrasting behaviors demonstrate that even single residue changes can reorient the coupling between VSD motion and the fused fluorescent protein, revealing the fine mechanistic resolution accessible through GEVI readouts. Together, these results show that voltage-dependent signaling is deeply conserved across VSPs but shaped by lineage-specific sequence variation, establishing VSPs as powerful models for probing voltage sensing and guiding GEVI design.
Keywords:
voltage-sensing phosphatase (VSP)
; voltage-sensing domain (VSD)
; genetically encoded voltage indicator (GEVI)
1. Introduction
Genetically encoded voltage indicators (GEVIs) provide a means to optically monitor membrane potential changes in living cells [1,2]. Among them, the ArcLight family [3,4,5] and its derivatives use the voltage-sensing domain (VSD) from Ciona intestinalis [6] fused to a fluorescent protein producing robust voltage-dependent changes in fluorescence. While initially developed as reporters of electrical activity, these constructs also provide a powerful framework for investigating how sequence variation in VSDs influences conformational dynamics and their coupling to optical signals [7]. Because different neuronal processes operate across distinct voltage ranges, the ability to tune the voltage dependence of GEVI responses is an important goal for extending their utility [8].
The voltage-sensing phosphatase (VSP) family displays remarkable sequence diversity across species, particularly in the distribution of positively charged residues within the S4 helix [7,9]. These sensing charges drive transmembrane movement of S4 in response to changes in voltage, and their number and positioning vary across orthologs. Despite this diversity, little is known about how naturally occurring VSP sequences map onto the voltage dependence and fluorescence responses of ArcLight-type GEVI constructs.
Here, we demonstrate that multiple VSP orthologs and variants can produce voltage-dependent optical signals when expressed in the ArcLight framework. Human VSP (hVSP2 [10]) trafficks efficiently to the plasma membrane and yields responses within the physiological voltage range as does mouse though with poorer membrane expression. Tick and horseshoe crab orthologs also generate a clear voltage-dependent signal. Remarkably, the Chinese hamster variant, which retains only two potential sensing charges in S4 (positive charges in S4 responsible for voltage-dependent conformational changes), still supports detectable movement in response to 100 mV depolarization. Finally, introducing an additional sensing charge by mutating the hamster W→R at position R2 inverts the voltage-dependent fluorescence response, indicating that the fluorescent protein environment has shifted. This suggests that altered S4 interactions with countercharges in S1–S3 reorient the cytoplasmic fluorescent domain, producing a fundamentally different optical output.
Together, these results establish that natural variation in VSP sequences can be exploited to reveal how sensing charge number and distribution shape VSD movement and FP coupling. Beyond demonstrating that human and other orthologs function in the physiological range, this comparative approach shows that even unusual variants, such as hamster, uncover new principles of ArcLight-type GEVI design and mechanism.
2. Results
2.1. Exploring Sequence Diversity in the VSD of the VSP Gene Family.
The first GEVI to function in mammalian cells was VSFP2 [11], which incorporated the volt-age-sensing domain (VSD) from Ciona intestinalis (Sea squirt) VSP. Although these initial con-structs trafficked efficiently to the plasma membrane, they required strong depolarizations of the membrane to elicit optical signals. A single substitution in the S4 helix (R217Q - numbering is based on the Ciona sequence unless otherwise stated) shifted the voltage dependence into the physiological range [12], a breakthrough that enabled crystallographic determination of the Ciona VSD in both the resting ‘down’ (R217) and activated ‘up’ (R217E) states [13]. These structures form the foundation for comparative analysis of VSP sequence diversity (Figure 1A).
To investigate how natural sequence variation influences voltage sensing, we aligned 377 unique VSP VSD sequences spanning plankton, fish, reptiles, birds, arachnids, and mammals. Sequence logos of the four transmembrane helices revealed clusters of conserved residues, often positioned along one face of the helix, consistent with stabilizing electrostatic interactions within the VSD (Figure 1B). Notably, Ciona contains several deviations from consensus resi-dues (e.g., S154A in S2 – the consensus sequence is serine, the Ciona sequence is alanine), high-lighting sites where evolutionary substitutions may alter voltage-dependent function.
Previous mutagenesis studies at some of these conserved positions modified GEVI response am-plitudes, kinetics, or voltage ranges [7]. However, targeted mutations cannot fully reproduce the broader stabilizing context encoded by naturally evolved variants. To directly test how evolu-tionary diversity shapes VSD behavior, we synthesized 16 representative ortholog constructs (Appendix A.2).
For experimental characterization, the catalytic phosphatase domain of each VSP was replaced with the fluorescent protein SuperEcliptic pHluorin A227D, leaving the intact VSD and its linker region. This design (Figure 1C) allowed us to evaluate plasma membrane localization and to measure voltage-dependent optical responses across orthologs.
2.2. Expression and Trafficking of VSP–FP Chimeras Were Highly Variable Across Species
We next examined the cellular distribution of the 16 ortholog constructs in HEK293 cells. Constructs showed striking differences in their ability to reach the plasma membrane. Several orthologs, including Ciona, human, and zebrafish, displayed obvious plasma membrane localization with minimal intracellular accumulation (Figure 2A). In contrast, others, such as hamster, tick, and mouse showed poor membrane targeting and instead accumulated within intracellular compartments (Figure 2B).
These results highlight that not all VSP orthologs are well expressed in this mammalian system. In particular, the poor expression of tick, and even the reduced membrane targeting of mouse, may reflect limitations of using HEK 293 cells rather than strict evolutionary differences in trafficking regulation. Thus, while some orthologs readily localize to the plasma membrane in this system, others may require more compatible host environments to reveal their true trafficking potential.
All constructs that trafficked efficiently to the plasma membrane yielded a voltage-dependent optical signal, although several required strong depolarizations to elicit responses (Appendix A.1). The plankton VSD exhibited the most left-shifted response, producing a clear signal with only a 100 mV depolarization. By contrast, Takifugu, finch, sea hare, rice fish, and sea turtle required very strong depolarization of the plasma membrane to generate detectable responses. (Note: the membrane resistance of HEK cells may not allow whole-cell recordings to clamp accurately at +230 mV; these steps were applied simply to depolarize the membrane as much as possible.)
Two constructs stood out as exceptions. The plankton VSD generated robust signals at relatively modest depolarization, and the human VSD, despite its weak overall response, produced a reproducible voltage-dependent signal at 100 mV. Unlike other orthologs, the human VSD displayed a unique kinetic profile: its initial fluorescence change was very slow, with a τon exceeding 100 ms, and the response failed to recover when the membrane potential was repolarized, precluding calculation of τoff. Comparison of signal size and kinetics across functional constructs is summarized in Appendix A,1.
Together, these results establish that while many VSP orthologs can generate voltage-dependent signals when expressed in HEK 293 cells, the human VSD represents a surprising outlier, motivating a closer investigation of its unusual sequence features and biophysical behavior.
2.3. The VSD Is Responsible for the Voltage-Dependent Optical Signal
These new species-derived GEVIs contain both the N-terminal cytoplasmic sequence and the VSD, raising the possibility that the unusual response of the human construct could be influenced by its N-terminal region rather than by the VSD itself. Notably, AlphaFold [11] predictions suggested that the human sequence contains an elongated S0 helix, whereas the finch sequence has a substantially shorter S0 (Figure 3). To test whether differences in this region contributed to the altered optical responses, we generated two chimeras with the fusion site located within the S0 helix.
The Finch/Human chimera, which contains the human VSD, produced a voltage-dependent signal highly similar to that of the original human construct (Figure 3). The signal amplitude was slightly larger, possibly reflecting more efficient trafficking to the plasma membrane and thus an increased number of responsive proteins. Conversely, the Human/Finch chimera, which contains the finch VSD, displayed a response pattern closely matching that of the original finch construct.
Together, these results demonstrate that the distinct response of the human GEVI is determined primarily by its VSD, with little to no contribution from the N-terminal or S0 sequences. If the S0 helix influences voltage-dependent signaling, its effect is minimal.
2.4. Reverting a Primate-Specific Mutation in S1 Partially Recovers the Repolarization Signal in the Human VSD
The voltage-dependent signal of the human VSD is unusual in that fluorescence does not return to baseline upon repolarization. One potential explanation is a primate-specific mutation in the S1 helix (Figure 4A). In the consensus sequence, position 119 is occupied by an arginine, whereas in primates—including human—this position is a glycine (G95 in the human sequence).
To test whether this substitution contributes to the atypical response, we reverted the human S1 sequence to the consensus by introducing the G95R mutation. This change improved both the signal size and onset speed of the human VSD voltage response (Figure 4B). For a 50 mV depolarization, the response increased to 1.1% ΔF/F with a τon of 82.5 ± 3.0 ms. At 100 mV, the signal reached 1.4% ΔF/F with a faster τon of 41.0 ± 0.7 ms. Although the signal size did not increase further at 150 mV and 200 mV depolarizations, the kinetics improved substantially, with τon values of 21.5 ± 1.0 ms and 6.3 ± 0.7 ms, respectively.
The G95R mutant also showed partial recovery during repolarization, unlike the wildtype human construct. The τoff was 45.0 ± 1.1 ms for the 50 mV step, slowing to 62.8 ± 2.5 ms at 100 mV and 64.5 ± 6.5 ms at 150 mV. Remarkably, the mutant even produced a detectable response to a 50 mV hyperpolarization step. However, the fluorescence never fully returned to baseline upon return to the holding potential, suggesting that the conformational change is not entirely reversible. Given the position of this residue in S1 (Figure 1B), this behavior may reflect altered interactions with plasma membrane lipids that stabilize different conformational states.
2.5. A divergent S4 Sequence with Only Two Sensing Charges Was Still Capable of Yielding a Voltage-Dependent Signal
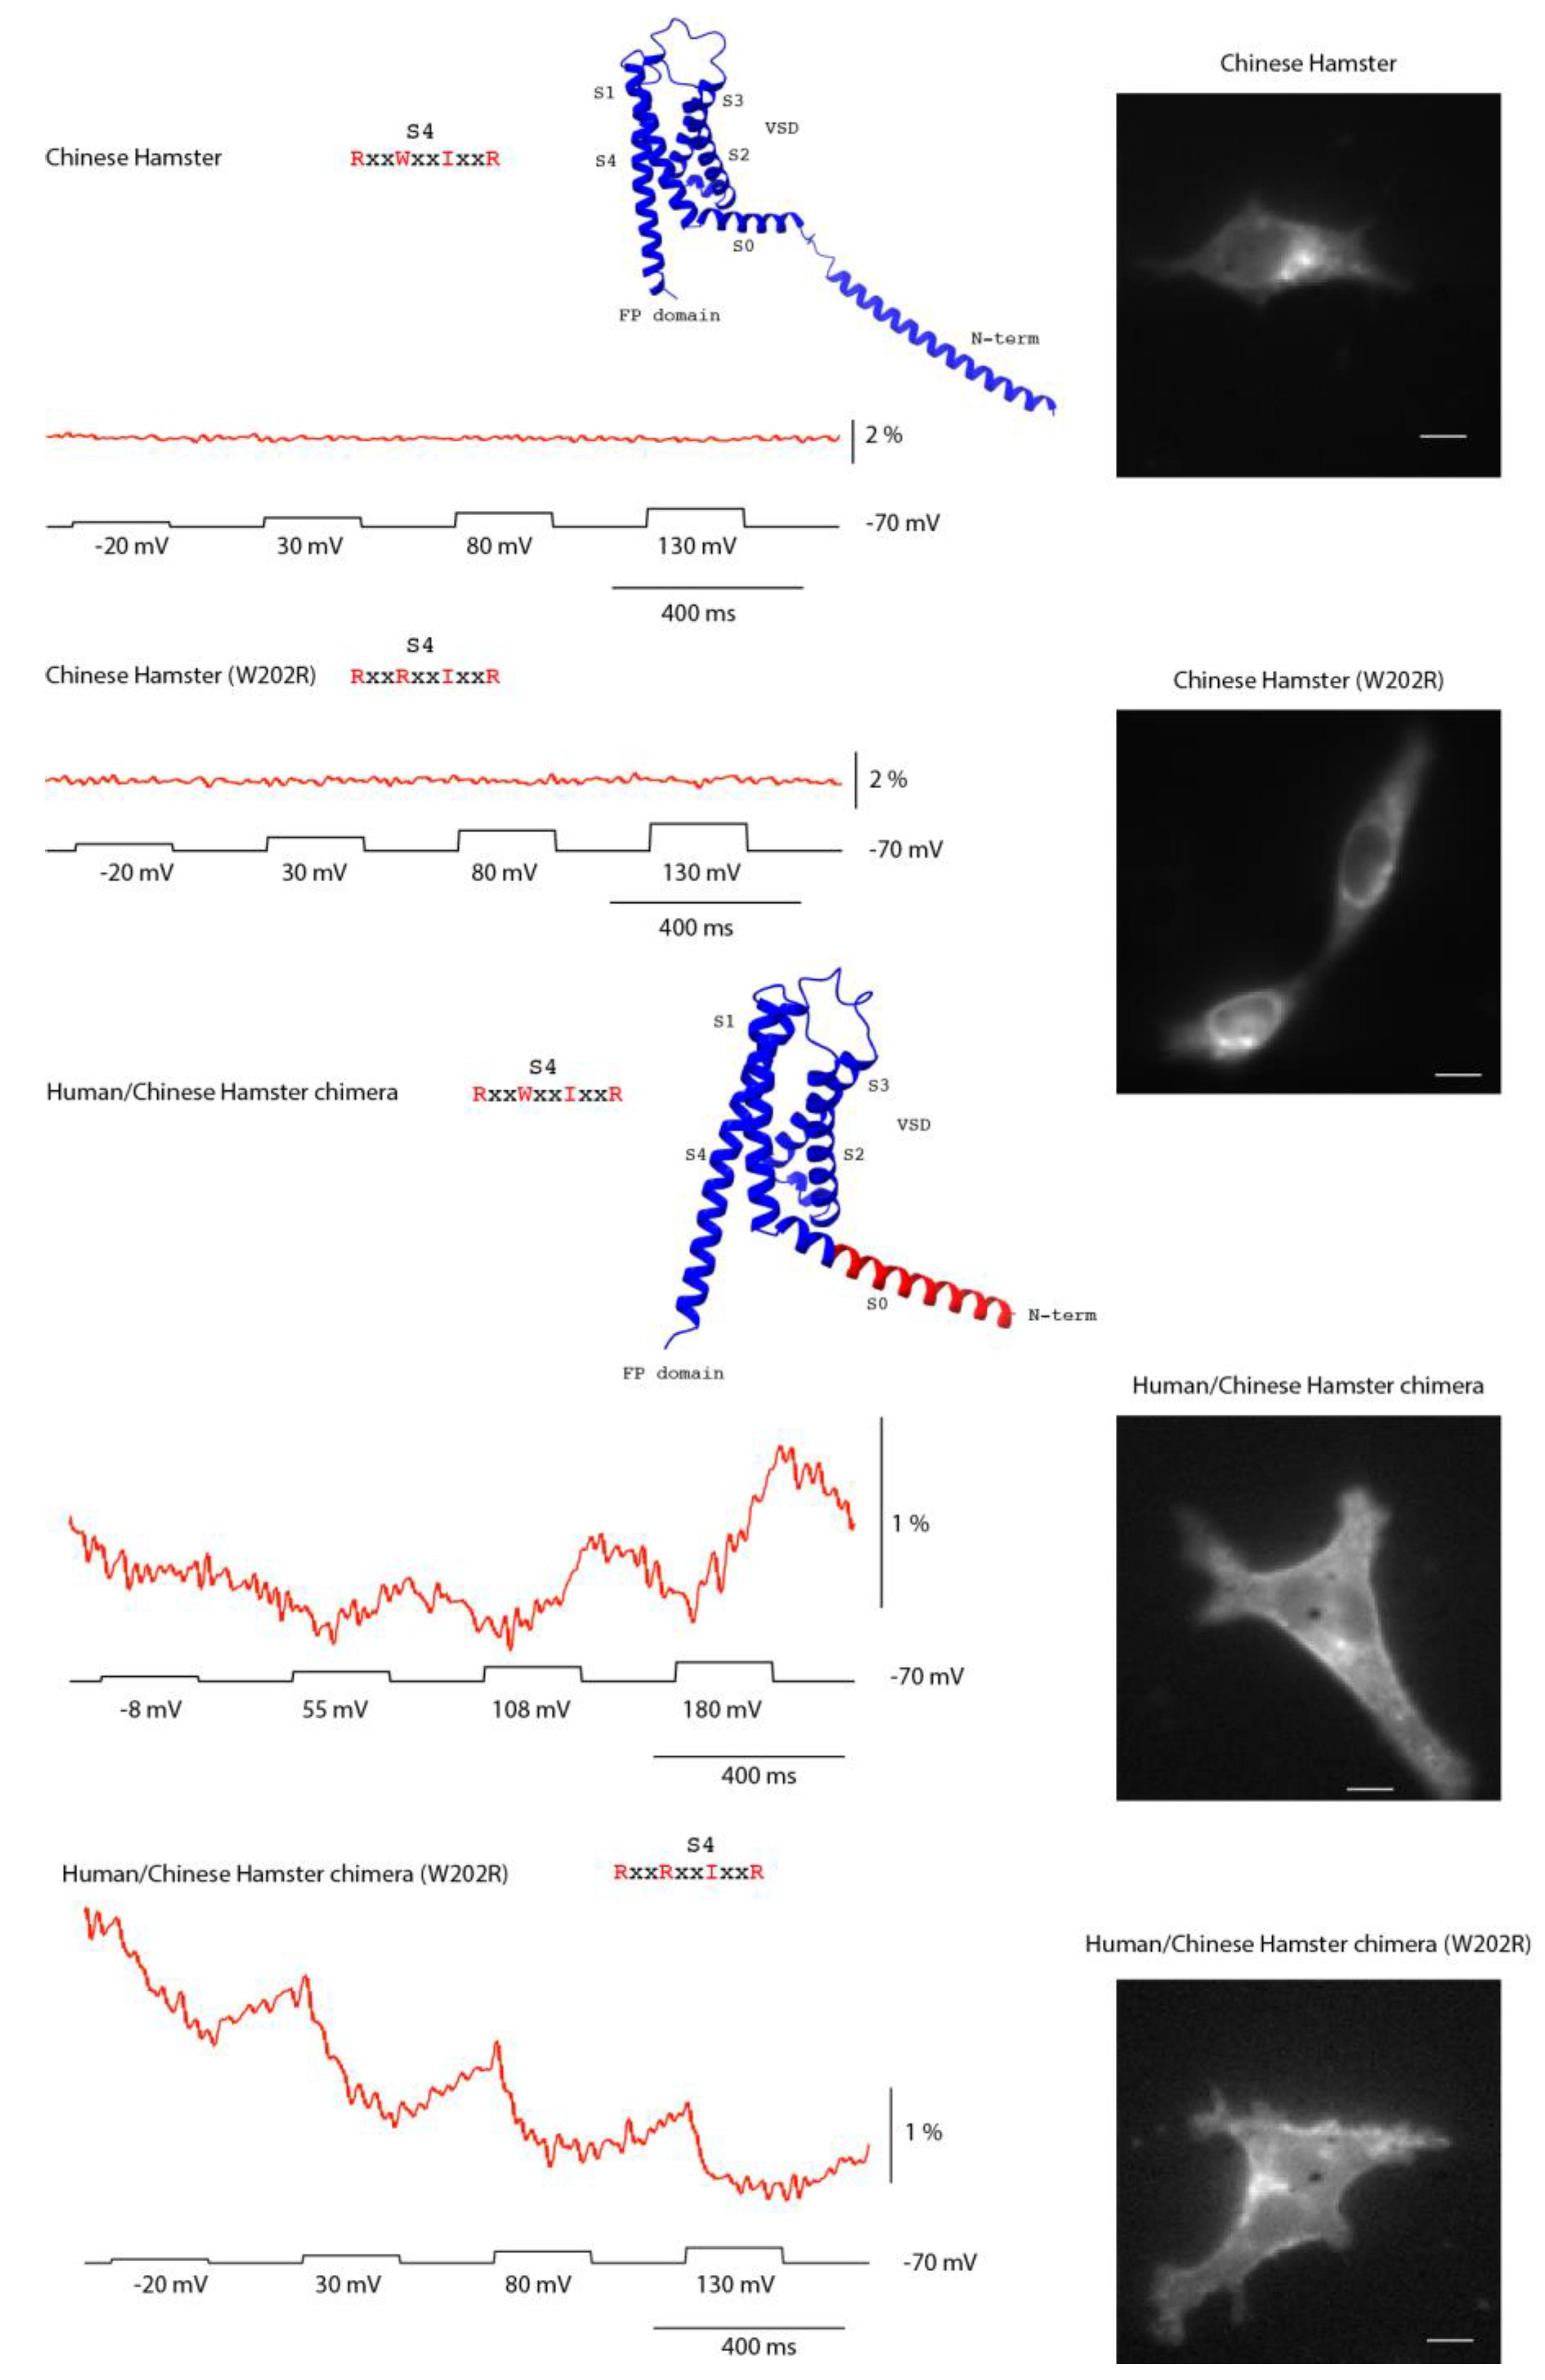
All of the non-responding constructs exhibited high internal fluorescence, consistent with poor trafficking to the plasma membrane. To test whether a voltage response could be rescued, we replaced the N-terminus of the hamster construct with the human sequence, which traffics efficiently. Hamster was chosen for this experiment because it represented the strongest predicted non-responder, owing to its unusual S4 composition.
In most VSP orthologs, the S4 helix contains a positively charged residue every third position, enabling voltage-driven transmembrane movement. While the canonical Ciona sequence retains four arginines, most family members follow an R–R–I–R pattern. Hamster is an outlier, with an S4 sequence of R–W–I–R that replaces the second arginine with tryptophan, leaving only two potential sensing charges spaced widely apart. This substitution was expected to both reduce electrostatic drive and sterically hinder S4 movement, and thus we initially hypothesized that the lack of a signal reflected a nonfunctional S4. However, its poor membrane expression needed to be addressed before this prediction could be tested rigorously.
Improved trafficking revealed that the hamster VSD is still capable of generating a voltage-dependent signal. The wildtype hamster construct displayed predominantly intracellular fluorescence and no optical response (Figure 5A). By contrast, when its N-terminus was replaced with the human sequence, surface expression, though still poor, improved sufficiently to unmask a voltage-dependent fluorescence signal (Figure 5B–C). Further, introducing a W→R substitution at the second S4 position in this human/hamster chimera altered the polarity of the optical response, demonstrating that S4 composition modulates how VSD movements are transduced to the fused fluorescent protein.
Together, these results show that the absence of activity in the wildtype hamster construct was due to poor membrane trafficking rather than an immobile S4. They also support the idea that the unusual hamster S4 sequence influences the positioning and/or movement of the cytosolic FP domain, which underlies the observed optical signal.
3. Discussion
This study expands the functional analysis of voltage-sensing phosphatase (VSP) family VSDs by comparing constructs from diverse species. Sequence alignment of 377 orthologs revealed strongly conserved charge–charge interaction patterns across helices S1–S4, yet also highlighted lineage-specific substitutions that alter voltage sensing (Figure 1). Our results show that while the capacity to generate voltage-dependent optical signals is broadly conserved, differences in expression, kinetics, and voltage range are shaped by both evolutionary divergence and host cell context (Figure 2).
A recurring challenge in this survey was trafficking efficiency in HEK 293 cells. Several orthologs accumulated intracellularly and failed to yield signals, consistent with earlier reports of poor expression for certain VSP family members in mammalian systems [18]. Rescue experiments via N-terminal chimeras confirmed that absence of a signal does not necessarily reflect a nonfunctional VSD (Figure 5). For example, the hamster construct failed in its wildtype form, but replacement of the N-terminal region with the human sequence improved membrane localization and unmasked a voltage-dependent optical response. Thus, species-specific differences in trafficking can obscure otherwise functional voltage sensors when expressed in heterologous systems. Indeed, a recent report demonstrated improved membrane expression of mouse VSP via co-expression of basigin [12].
Once expressed at the plasma membrane, the hamster construct revealed an unusual optical phenotype distinct from all other species. Depolarization produced a slow, modest fluorescence increase, in contrast to the rapid decreases seen in most other orthologs. Reversion of the atypical tryptophan in the S4 sequence (RWIR → RRIR) inverted the optical polarity, producing a small but clear decrease in fluorescence. This divergence underscores that even a single side-chain substitution can alter how S4 motion is coupled to the fused fluorescent protein. The contrasting responses of hamster wildtype and W→R mutant therefore illustrate the fine resolution of GEVI readouts: they not only detect whether S4 moves but also reveal differences in the orientation and/or trajectory of the FP domain during conformational changes. Such insights highlight the unique ability of GEVIs to probe the mechanics of voltage-dependent protein motion beyond what electrical recordings alone can resolve.
Among the responsive constructs, three stood out. The plankton VSD exhibited a strongly left-shifted voltage dependence, producing clear responses at relatively modest depolarizations (Figure 2). This suggests that environmental pressures in plankton may have selected for different voltage ranges, and highlights the potential of nonvertebrate orthologs other than Ciona as sources of novel GEVI properties. By contrast, the human VSD produced weak, sluggish signals that failed to recover after repolarization. This finding is notable because a previous report demonstrated membrane expression for hVSP2 but could not detect sensing charges [10]. Whether the presence of the phosphatase domain prevents S4 movement, or whether the unusual motion of the human VSD’s S4 helix does not involve charges traversing the voltage field, remains unclear. Reverting a primate-specific S1 mutation (G95R) partially restored signal size and repolarization recovery, while also accelerating onset, suggesting that the glycine substitution destabilized conformational reversibility (Figure 4). Because this residue lies near the membrane-cytosol interface, these results raise the possibility that primate VSPs have adapted altered interactions with membrane lipids, with consequences for VSD conformational dynamics.
The third standout was the unusually strong depolarization required for the sea hare construct. This is notable because of the amino acid at position 217 in S4. In Ciona phosphatase and several GEVI constructs, the R217Q mutation shifts the voltage response toward negative potentials, enabling detection of hyperpolarization steps [7,13,15]. Although sea hare also retains four sensing charges in S4, like Ciona, its requirement for extreme depolarization suggests that additional VSD interactions can counteract the voltage-shifting influence of 217Q.
Together, these findings underscore the modularity and tunability of VSP VSDs [9]. Chimeric swaps showed that the N-terminal region has little influence on voltage sensing itself, whereas the S4 composition and S1 lipid-facing residues [14] strongly impact kinetics and recovery (Figure 3, Figure 4 and Figure 5). Natural variants thus provide a complementary approach to mutagenesis for uncovering biophysical principles of voltage sensing. For GEVI design, this comparative strategy offers a way to identify and harness favorable combinations of residues, linkers, and domains to achieve desired response properties.
A caveat of this study is that the native phosphatase domain was replaced with a fluorescent protein (Figure 1). While this design allowed us to directly monitor VSD motion through optical signals, it necessarily removed the ability to assess how voltage sensing is coupled to phosphatase activity. As a result, the conclusions here apply specifically to VSD conformational dynamics and their optical readouts, rather than to the full enzymatic cycle of VSPs.
This limitation can be addressed with complementary strategies that preserve enzymatic coupling. One approach is voltage-clamp fluorometry of full-length VSPs, in which an environmentally sensitive dye attached to a cysteine near S4 reports conformational changes while the native phosphatase domain remains intact [14]. Another is to use VSD-only ASAP scaffolds, where cpGFP is inserted into the S3–S4 loop to monitor VSD motion independent of the enzyme [15].
In conclusion, our cross-species analysis demonstrates that the capacity for voltage-dependent optical signals is deeply conserved across the VSP family, though its expression varies depending on host compatibility and evolutionary sequence differences. These results establish GEVIs as a powerful model not only for dissecting voltage sensing but also for revealing potential cellular influences on protein activity. For instance, the addition of a trafficking motif altered GEVI activity, suggesting that interaction of the trafficking partner may persist at the plasma membrane [16]. GEVI utilization may now expand into probing protein–lipid interactions, providing new opportunities for engineering GEVIs with tailored kinetics and voltage ranges.
4. Materials and Methods
4.1. In Silico Search Strategy
The amino acid sequence from the voltage-sensing domain (S1-S4) of the Monsigia brevicollis VSP (XP_001743274.1) was used as a bait sequence in a PHI BLAST search (National Center for Biotechnology Information (NCBI). Basic Local Alignment Search Tool (BLAST). Available from: https://blast.ncbi.nlm.nih.gov/) requiring the presence of the following amino acid pattern: [FYW]xx[E,D]xxx[R,K], where x is any amino acid [17]. Alignments were performed by Clustal Omega [18] using the percent identity matrix to remove redundant sequences. Logo consensus plots were generated by the Weblogo (https://weblogo.berkeley.edu) [19].
4.2. Plasmid Design and Construction.
Synthesized DNA (Integrated DNA Technologies) was cloned into a pcDNA 3.1 (Invitrogen) containing the fluorescent protein Super Ecliptic pHlourin A227D. For chimera generation, primers were designed to introduce point mutations to the S0 domain as required. Conventional one-step and two-step PCR were used to generate the target inserts. The inserts were cloned into the vector using NEB restriction enzymes. Two-step PCR was also used to generate point mutations as well as chimeric cobstructs.
4.3. Cell Culture and Transfection.
HEK 293 cells were cultured in Dulbecco’s Modified Eagle Medium (DMEM; Gibco) supplemented with 10% Fetal Bovine Serum (FBS; Gibco). For transfection, HEK 293 cells were suspended using 0.25% Trypsin-EDTA (Gibco) then plated onto poly-L-lysine (Sigma-Aldrich) coated #0 coverslips (Ted Pella). Transient transfection was carried out with Lipofectamine 2000 (Invitrogen) according to the manufacturer’s protocol.
4.4. Electrophysiology.
Coverslips with transiently transfected cells were placed into a patch chamber (Warner instruments) sealed with a #0 thickness cover glass for simultaneous voltage clamp and fluorescence imaging. The chamber was kept at 34 °C throughout the experiment and perfused with extracellular solution (150 mM NaCl, 4 mM KCl, 1 mM MgCl2, 2 mM CaCl2, 5 mM D-glucose and 5 mM HEPES, pH = 7.4). Filamented glass capillary tubes (1.5 mm/0.84 mm; World Precision Instruments) were pulled by a micropipette puller prior to each experiment to resistances of 3–5 MΩ for HEK 293 cells. The pipettes were filled with intracellular solution (120 mM K-aspartate, 4 mM NaCl, 4 mM MgCl2, 1 mM CaCl2, 10 mM EGTA, 3 mM Na2ATP and 5 mM HEPES, pH = 7.2) and held by a pipette holder (HEKA) mounted on a micromanipulator (Scientifica). Whole cell voltage clamp of transfected cells were conducted using a patch clamp amplifier (HEKA).
4.5. Fluorescence Microscopy of Cultured Cells.
An inverted microscope (IX71; Olympus) equipped with a 60X oil-immersion lens, 1.35-numerical aperture (NA), was used for epifluorescence imaging. The light source was a 75 W Xenon arc lamp (Osram) placed in a lamp housing (Cairn). GFP was imaged using a filter cube consisting of an excitation filter (FF02-472/30-25), a dichroic mirror (FF495-Di03) and an emission filter (FF01-496) for the 470 nm wavelength excitation all from Semrock. Two cameras were mounted on the microscope through a dual port camera adapter (Olympus). A color CCD camera (Hitachi) was used to visualize cells during patch clamp experiments. Fluorescence of the voltage indicators were recorded at 1 kHz frame rate by a high-speed CCD camera (RedShirtImaging). All optical devices were placed on a vibration isolation platform (Kinetic systems) to avoid any vibrational noise during patch clamp fluorometry experiments.
4.6. Confocal Microscopy.
Before imaging, the DMEM present in the confocal dishes was replaced with 200 µL of 1x Phosphate Buffered Saline (Tech & Innovation). Confocal images were then acquired using a A1R laser scanning confocal microscope (Nikon) and a 60x objective oil lens (Plan Apo λ 60x; Nikon). A 488 nm laser (Sapphire; Coherent) was used for excitation and a 525/50 nm dichroic mirror was used for detection.
4.7. Molecular Structure Models.
Crystal structures or Alphafold predictions were visualized using the UCSF Chimera program [20]. Overlays of structures were obtained using the Matchmaker function.
Supplementary Materials
The following supporting information can be downloaded at the website of this paper posted on Preprints.org.
Author Contributions
For research articles with several authors, a short paragraph specifying their individual contributions must be provided. The following statements should be used “Conceptualization, B.J.B..; methodology, L.M.L, Y.K., B.J.B..; formal analysis, L.M.L., B.J.B..; investigation, L.M.L., Y.K., B.J.B.;. writing—original draft preparation, B.J.B..; writing—review and editing, L.M.L., B.J.B..
Funding
This study was funded by the Korea Institute of Science and Technology grant 2E31523.
Institutional Review Board Statement
Not applicable.
Data Availability Statement
The raw data supporting the conclusions of this article will be made available by the authors on request.
Acknowledgments
Molecular graphics and analyses performed with UCSF Chimera, developed by the Resource for Biocomputing, Visualization, and Informatics at the University of California, San Francisco, with support from NIH P41-GM103311.
Conflicts of Interest
The authors declare no conflicts of interest.
Abbreviations
The following abbreviations are used in this manuscript:
| VSP | Voltage-sensing phosphatase |
| VSD | Voltage-sensing domain |
| FP | Fluorescent protein |
| GEVI | Genetically encoded voltage indicator |
References
- Rhee, J.K., Y. Iwamoto, and B.J. Baker, Visualizing Oscillations in Brain Slices With Genetically Encoded Voltage Indicators. Front Neuroanat, 2021. 15: p. 741711. [CrossRef]
- Bando, Y., et al., Comparative Evaluation of Genetically Encoded Voltage Indicators. Cell Rep, 2019. 26(3): p. 802-813 e4. [CrossRef]
- Jin, L., et al., Single action potentials and subthreshold electrical events imaged in neurons with a fluorescent protein voltage probe. Neuron, 2012. 75(5): p. 779-85. [CrossRef]
- Platisa, J., et al., Directed Evolution of Key Residues in Fluorescent Protein Inverses the Polarity of Voltage Sensitivity in the Genetically Encoded Indicator ArcLight. ACS Chem Neurosci, 2017. 8(3): p. 513-523. [CrossRef]
- Lee, S., et al., Improving a genetically encoded voltage indicator by modifying the cytoplasmic charge composition. Sci Rep, 2017. 7(1): p. 8286. [CrossRef]
- Murata, Y., et al., Phosphoinositide phosphatase activity coupled to an intrinsic voltage sensor. Nature, 2005. 435(7046): p. 1239-43. [CrossRef]
- Piao, H.H., et al., Combinatorial mutagenesis of the voltage-sensing domain enables the optical resolution of action potentials firing at 60 Hz by a genetically encoded fluorescent sensor of membrane potential. J Neurosci, 2015. 35(1): p. 372-85. [CrossRef]
- Rhee, J.K., et al., Biophysical Parameters of GEVIs: Considerations for Imaging Voltage. Biophys J, 2020. [CrossRef]
- Okamura, Y., A. Kawanabe, and T. Kawai, Voltage-Sensing Phosphatases: Biophysics, Physiology, and Molecular Engineering. Physiol Rev, 2018. 98(4): p. 2097-2131. [CrossRef]
- Halaszovich, C.R., et al., A human phospholipid phosphatase activated by a transmembrane control module. J Lipid Res, 2012. 53(11): p. 2266-74. [CrossRef]
- Abramson, J., et al., Accurate structure prediction of biomolecular interactions with AlphaFold 3. Nature, 2024. 630(8016): p. 493-500. [CrossRef]
- Shaikh, I.G., et al., Electrochemical coupling at the plasma membrane by mouse voltage-sensitive phosphatase requires association with basigin. Cell Rep, 2025. 44(9): p. 116200. [CrossRef]
- Kohout, S.C., et al., Electrochemical coupling in the voltage-dependent phosphatase Ci-VSP. Nat Chem Biol, 2010. 6(5): p. 369-75.
- Rayaprolu, V., et al., Hydrophobic residues in S1 modulate enzymatic function and voltage sensing in voltage-sensing phosphatase. J Gen Physiol, 2024. 156(7). [CrossRef]
- Hao, Y.A., et al., A fast and responsive voltage indicator with enhanced sensitivity for unitary synaptic events. Neuron, 2024. 112(22): p. 3680-3696 e8. [CrossRef]
- Lee, S., et al., A trafficking motif alters GEVI activity implicating persistent protein interactions at the membrane. Biophysical Reports, 2022. 2(2): p. 100047. [CrossRef]
- Altschul, S.F., et al., Gapped BLAST and PSI-BLAST: a new generation of protein database search programs. Nucleic Acids Res, 1997. 25(17): p. 3389-402. [CrossRef]
- Madeira, F., et al., The EMBL-EBI Job Dispatcher sequence analysis tools framework in 2024. Nucleic Acids Res, 2024. 52(W1): p. W521-W525. [CrossRef]
- Crooks, G.E., et al., WebLogo: a sequence logo generator. Genome Res, 2004. 14(6): p. 1188-90. [CrossRef]
- Pettersen, E.F., et al., UCSF Chimera--a visualization system for exploratory research and analysis. J Comput Chem, 2004. 25(13): p. 1605-12. [CrossRef]
Figure 1.
Exploring sequence variation in voltage-sensing proteins. (A) Structural overlay of the down state (brown, PDB 4g7v) and up state (blue, PDB 4g80) of the Ciona intestinalis VSD [13]. Trans-membrane segments are labeled S1, S2, and S4 (S3 not labelled for clarity). S0 is a cytosolic α-helix immediately preceding S1. (B) Amino acid conservation logos for S1–S4. The relative size of each residue indicates conservation; red denotes negatively charged, blue positively charged, green and purple polar, and black nonpolar amino acids. Highly conserved residues are mapped onto the structures in matching colors. Where Ciona differs from the consensus, labels indicate the consensus residue, its position, and the amino acid present in Ciona (e.g., S154A). (C) Experimental design schematic. The phosphatase domain of each VSP ortholog was replaced with a fluorescent protein, leaving the VSD intact to monitor plasma membrane localization and voltage-dependent fluorescence changes. At right, an Al-phaFold3 model shows a representative construct, with the N-terminal random coil omitted for clarity.
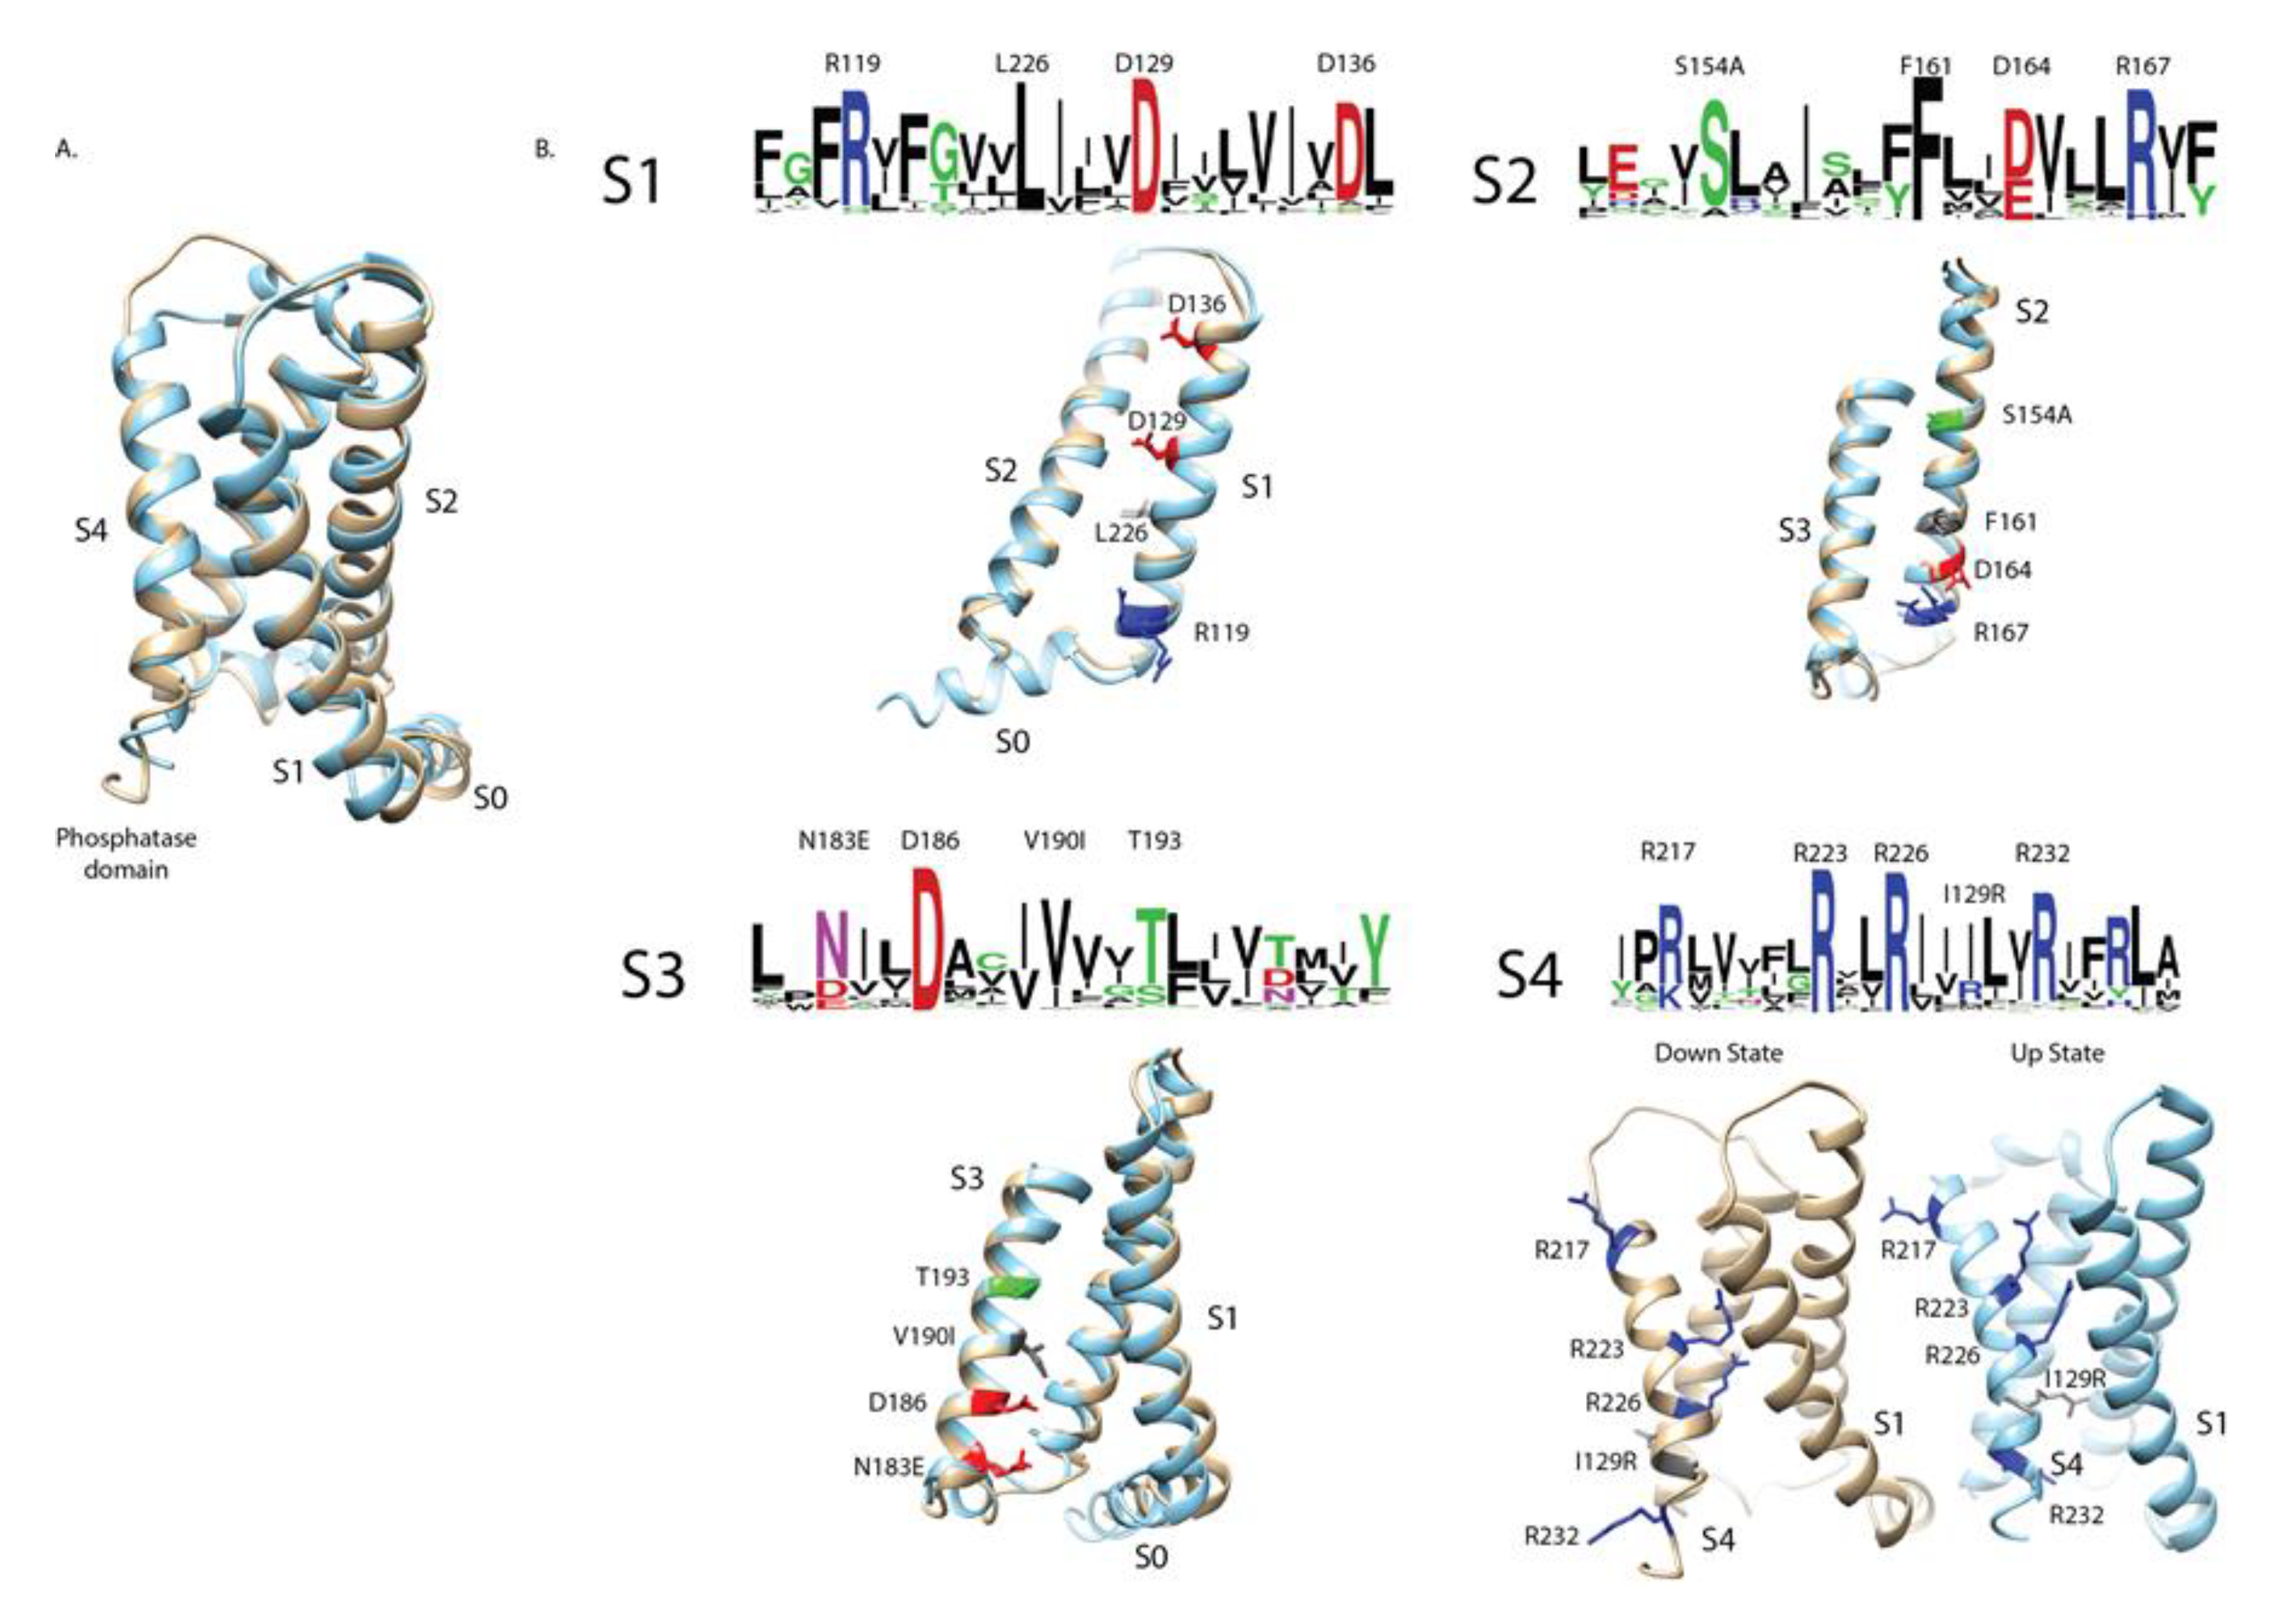
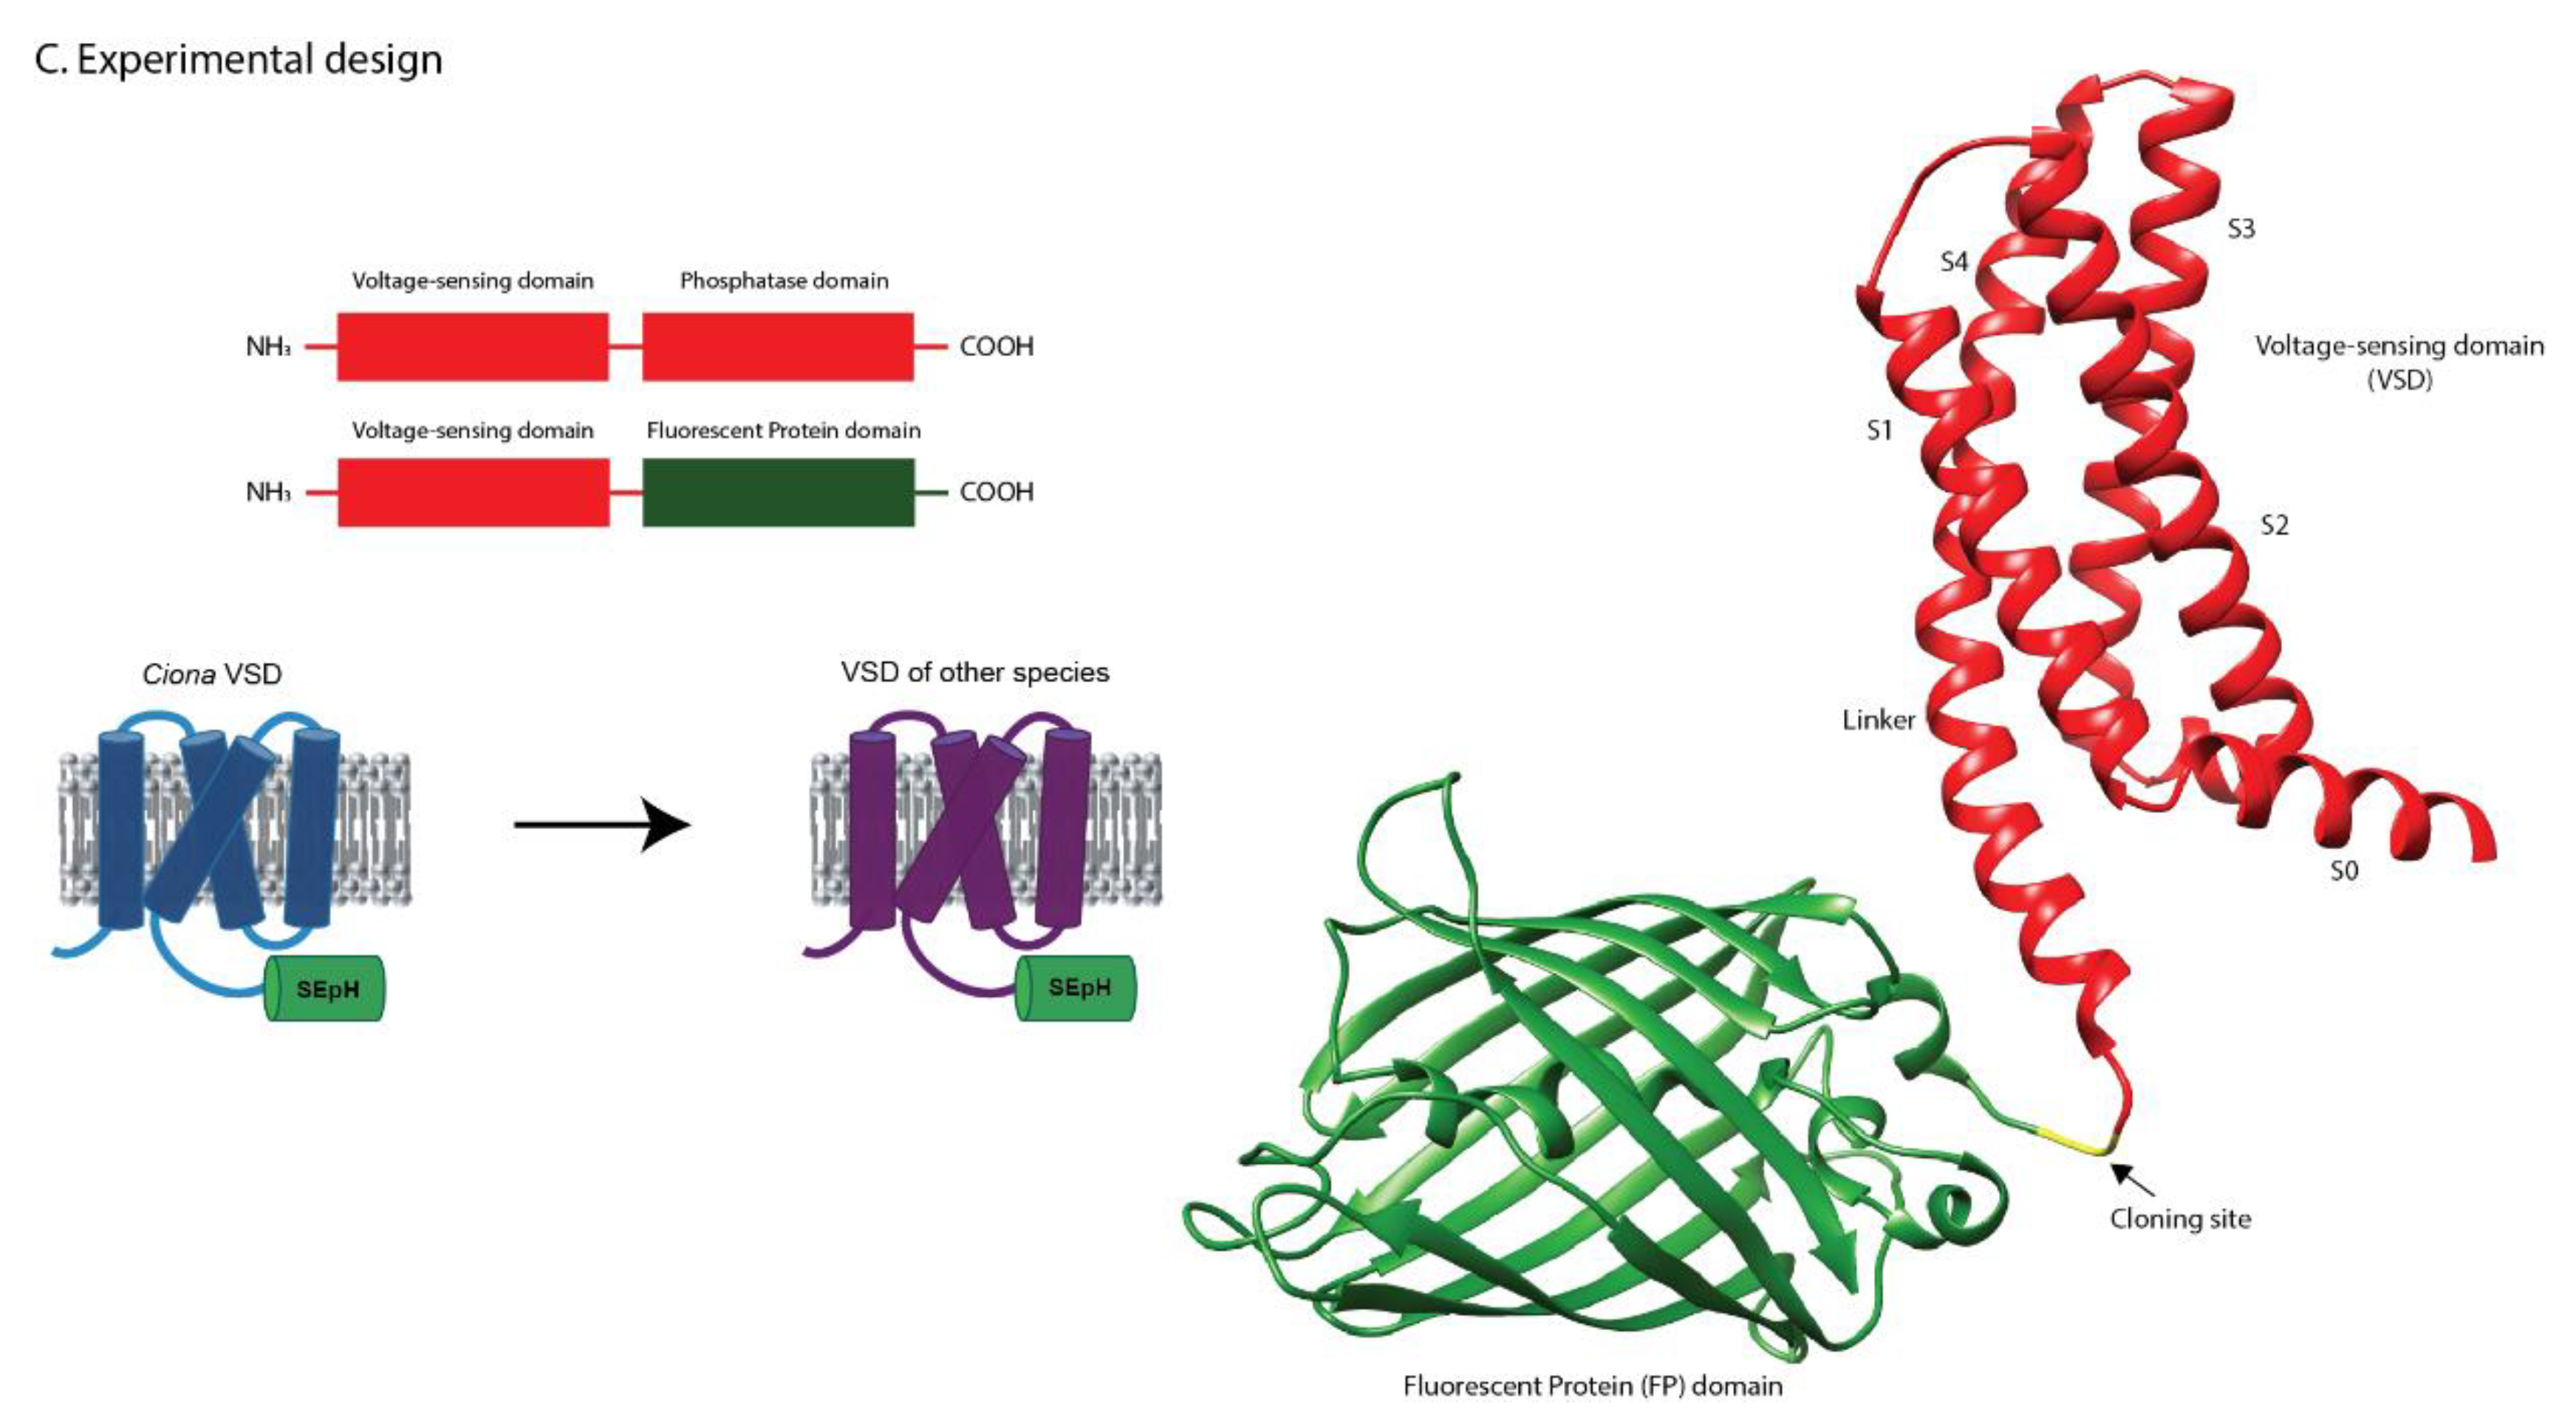
Figure 2.
Expression and voltage-dependent responses of VSP–FP chimeras across species. (A) Voltage-dependent optical signals from HEK cells expressing VSP constructs that trafficked efficiently to the plasma membrane. The center traces display mean responses (dark line) with standard error (shaded area) during voltage steps (black trace shown below). Voltage step protocols were adjusted to optimize signal size. Resting light images (scale bars, 10 µm) and frame subtraction images highlight the spatial origin of voltage-dependent signals. (B) Constructs with limited plasma membrane expression. Resting light images (scale bars, 10 µm) reveal substantial intracellular accumulation; however, tick, mouse, and horseshoe crab constructs were still capable of generating voltage-dependent responses.
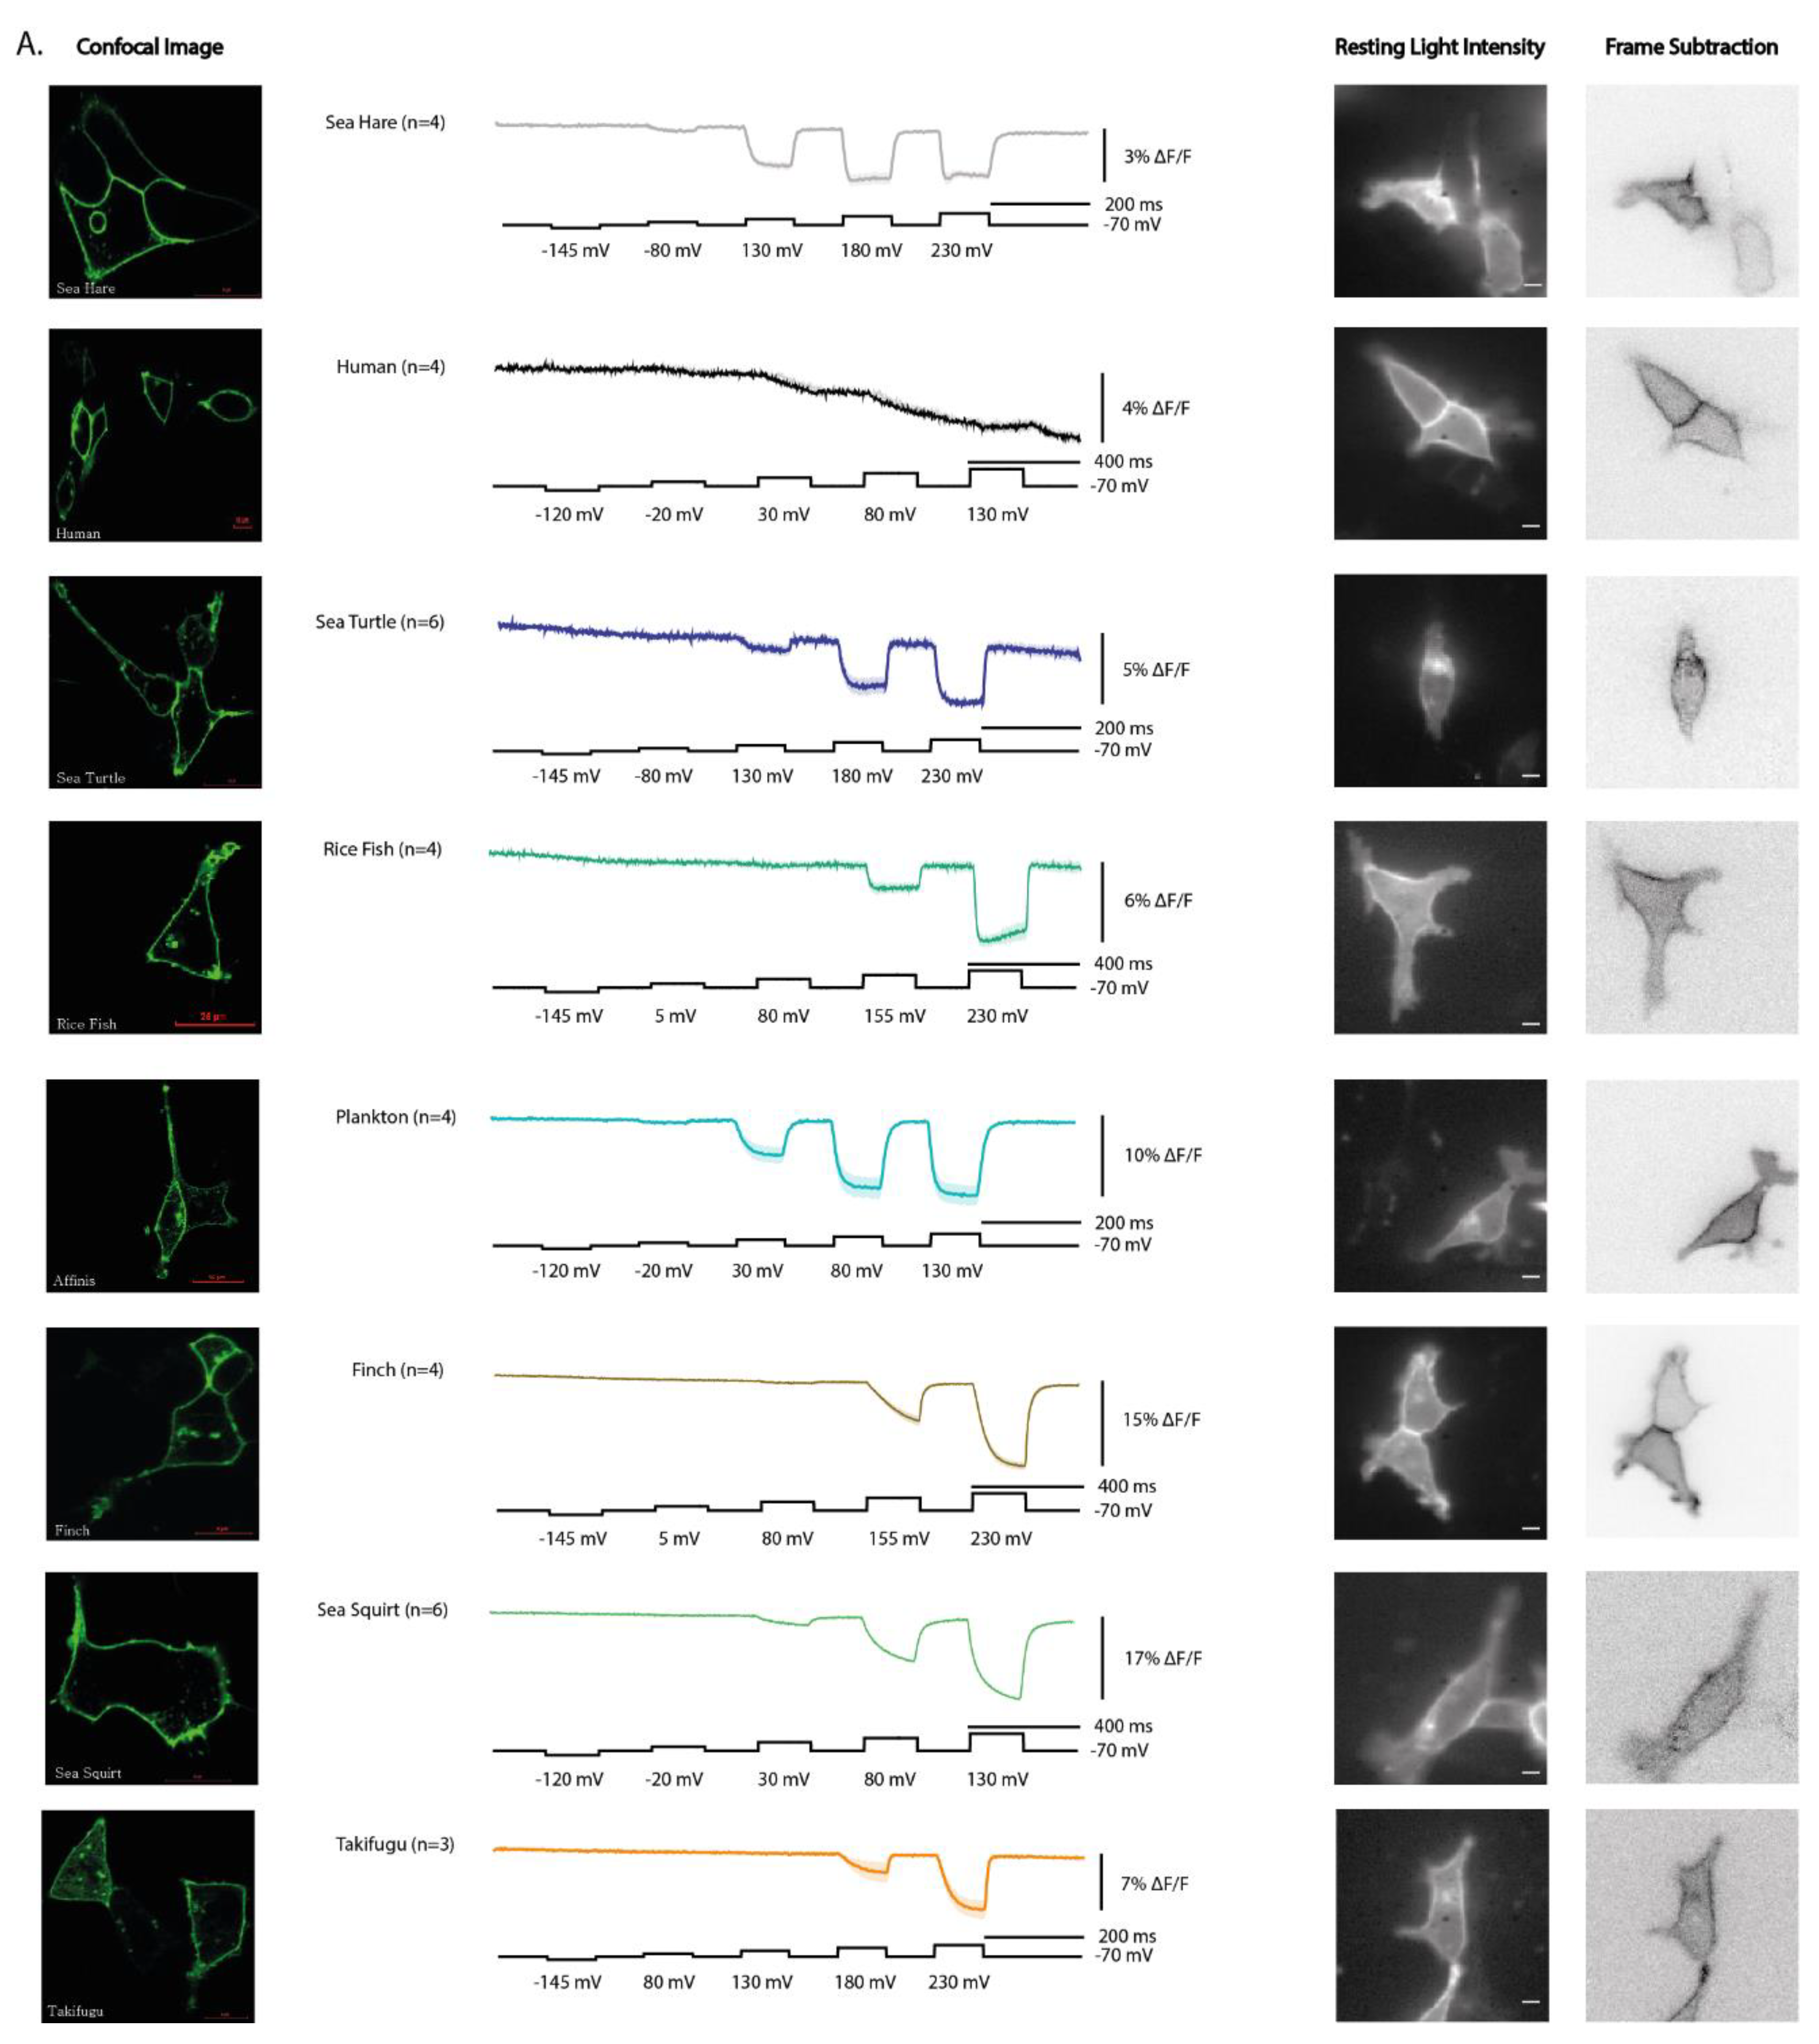
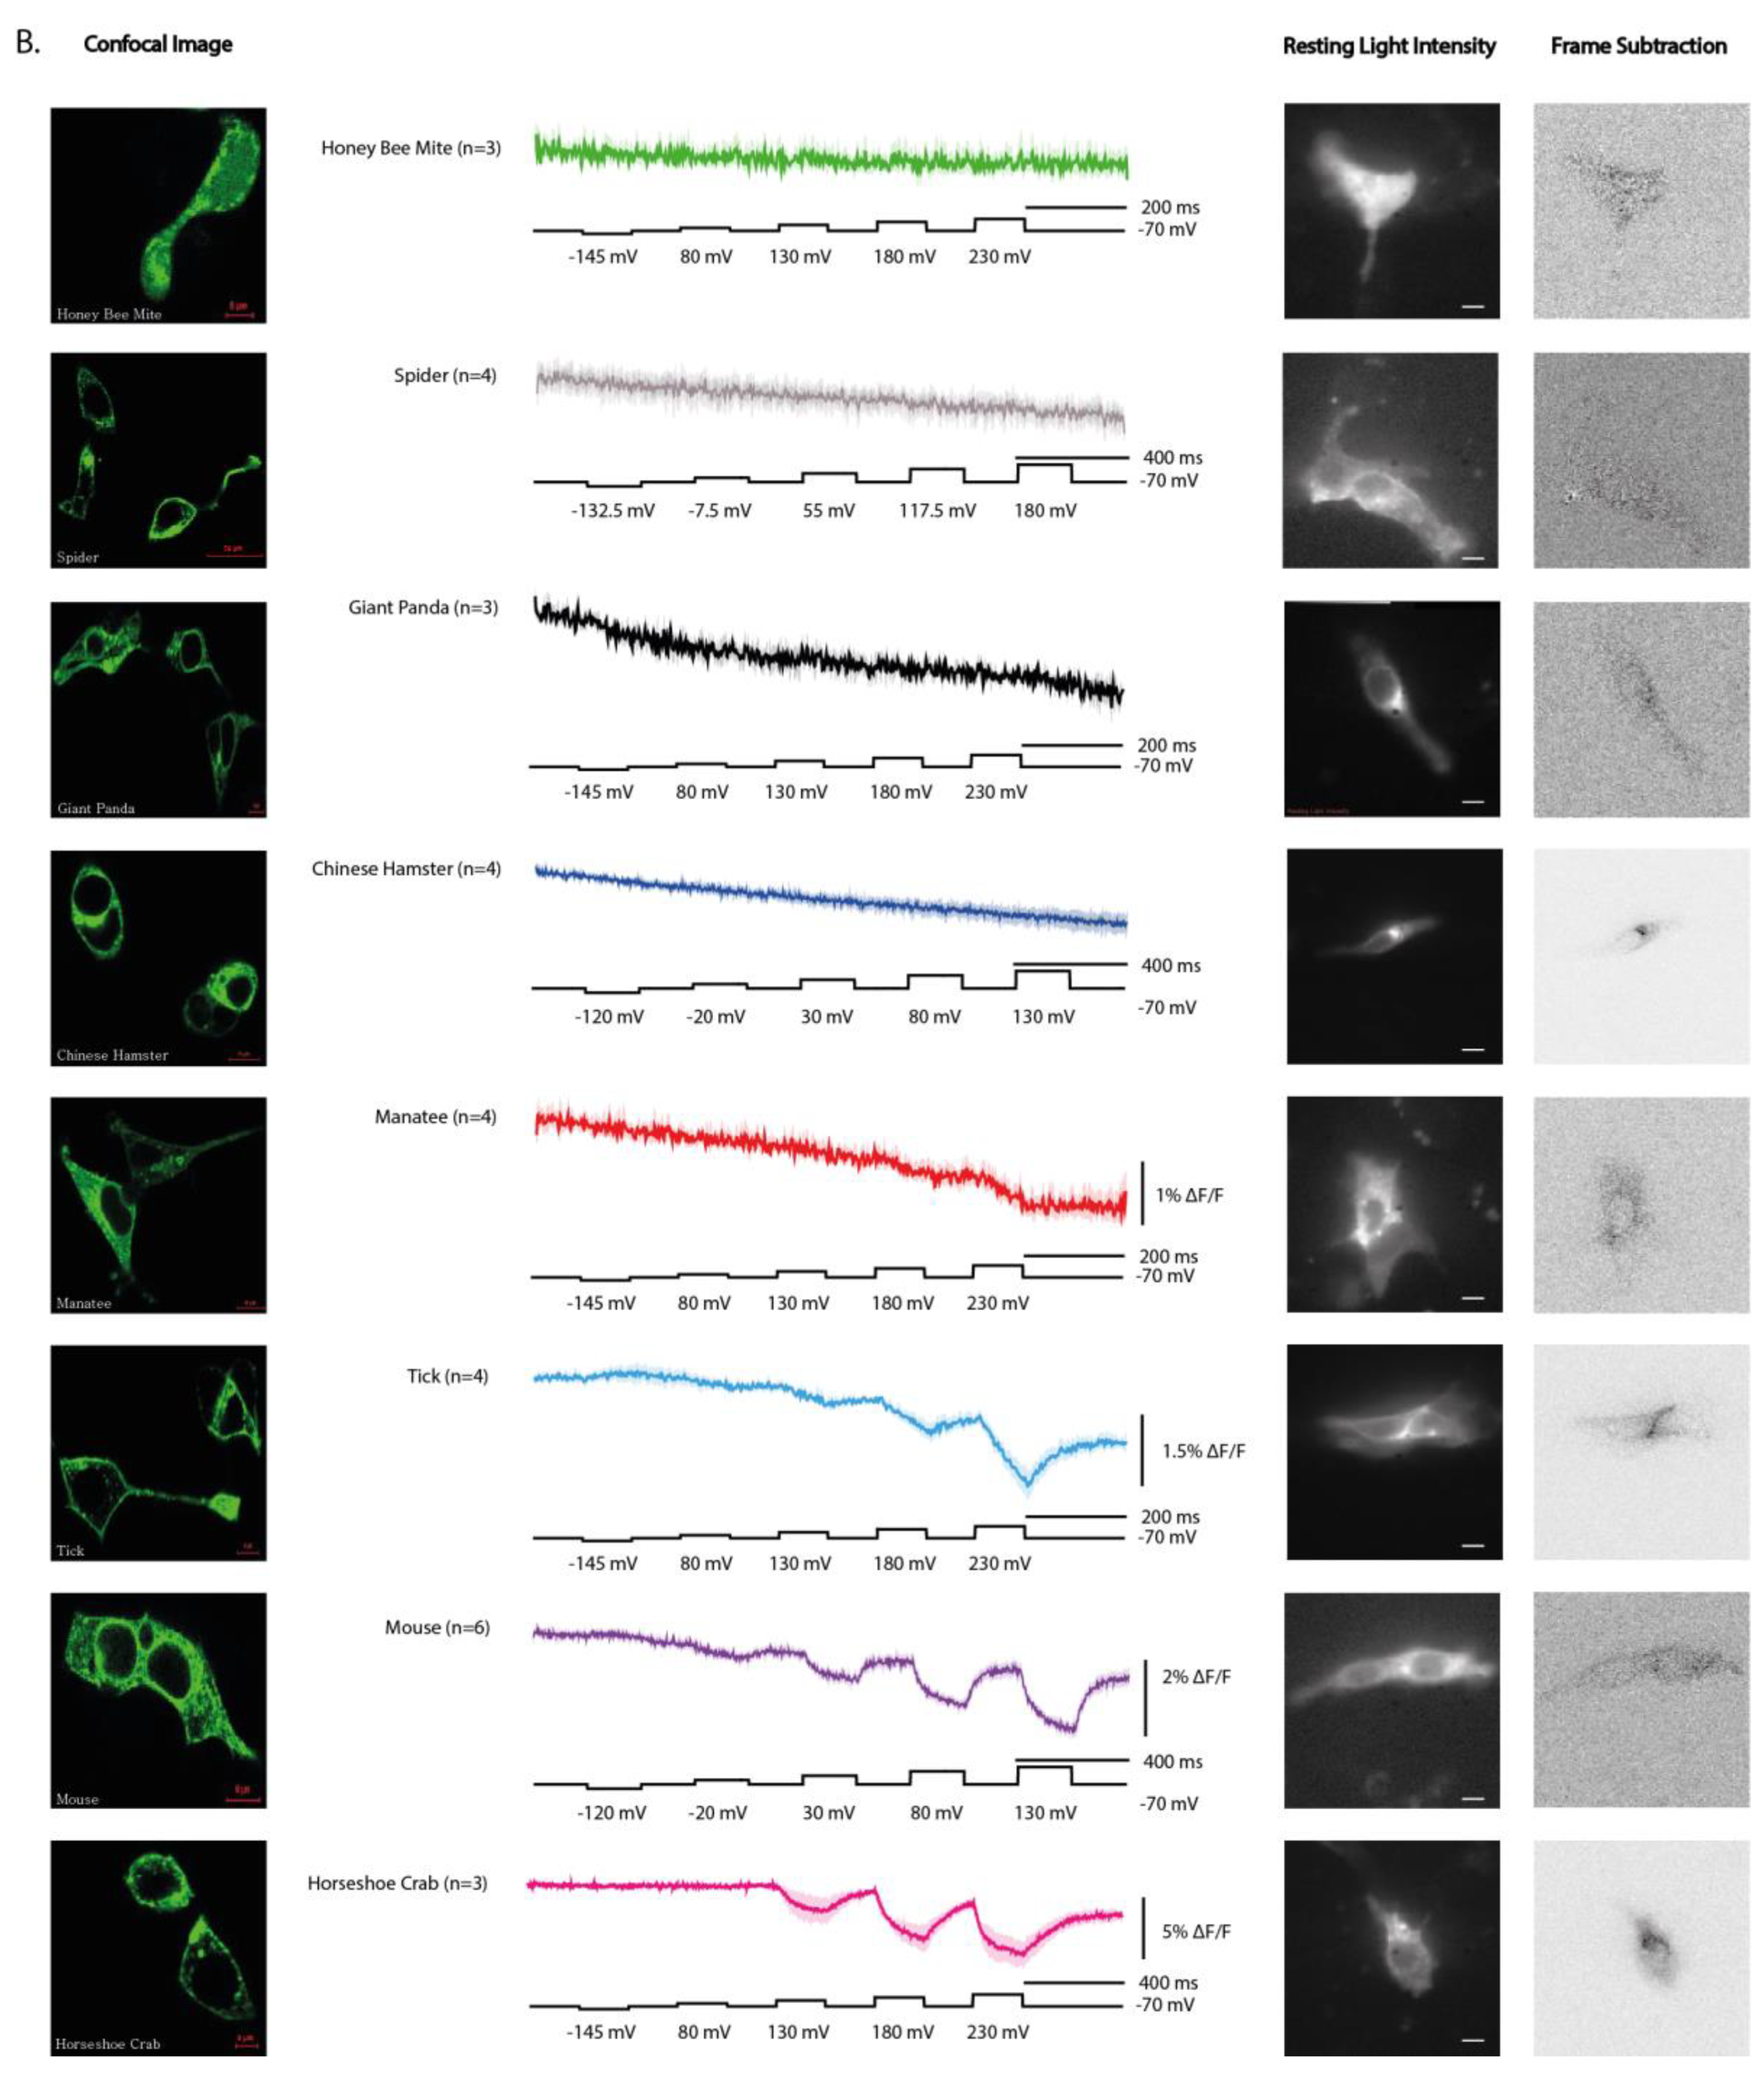
Figure 3.
The voltage-sensing domain determines species-specific optical responses. Representative data from Human VSD, Finch VSD, and reciprocal Human/Finch chimeras. Both chimeras were generated with the N-terminus fused in the S0 helix. Resting light images (RLI) show robust plasma membrane localization across constructs (scale bars, 10 µm). Frame subtraction images highlight regions of stimulus-dependent optical change, calculated as the difference between baseline (50 frames after hyperpolarization) and the response to the strongest depolarization step (50 frames). Fluorescence traces are shown for each construct during voltage steps (black trace, −70 to +130 mV for Human, extended to stronger depolarizations for Finch). The Human VSD produces a sluggish depolarization response with poor recovery, whereas the Finch VSD produces a rapid biphasic response but requires much stronger depolarization to activate. Importantly, both chimeras containing the Human VSD resembled each other, while both chimeras containing the Finch VSD resembled each other, demonstrating that the VSD sequence is responsible for the polarity and kinetics of the optical signal. AlphaFold-predicted structures of the chimeras are shown, with Human sequence segments in red and Finch segments in purple. For clarity, the models omit the N-terminus and the fused fluorescent protein domain.
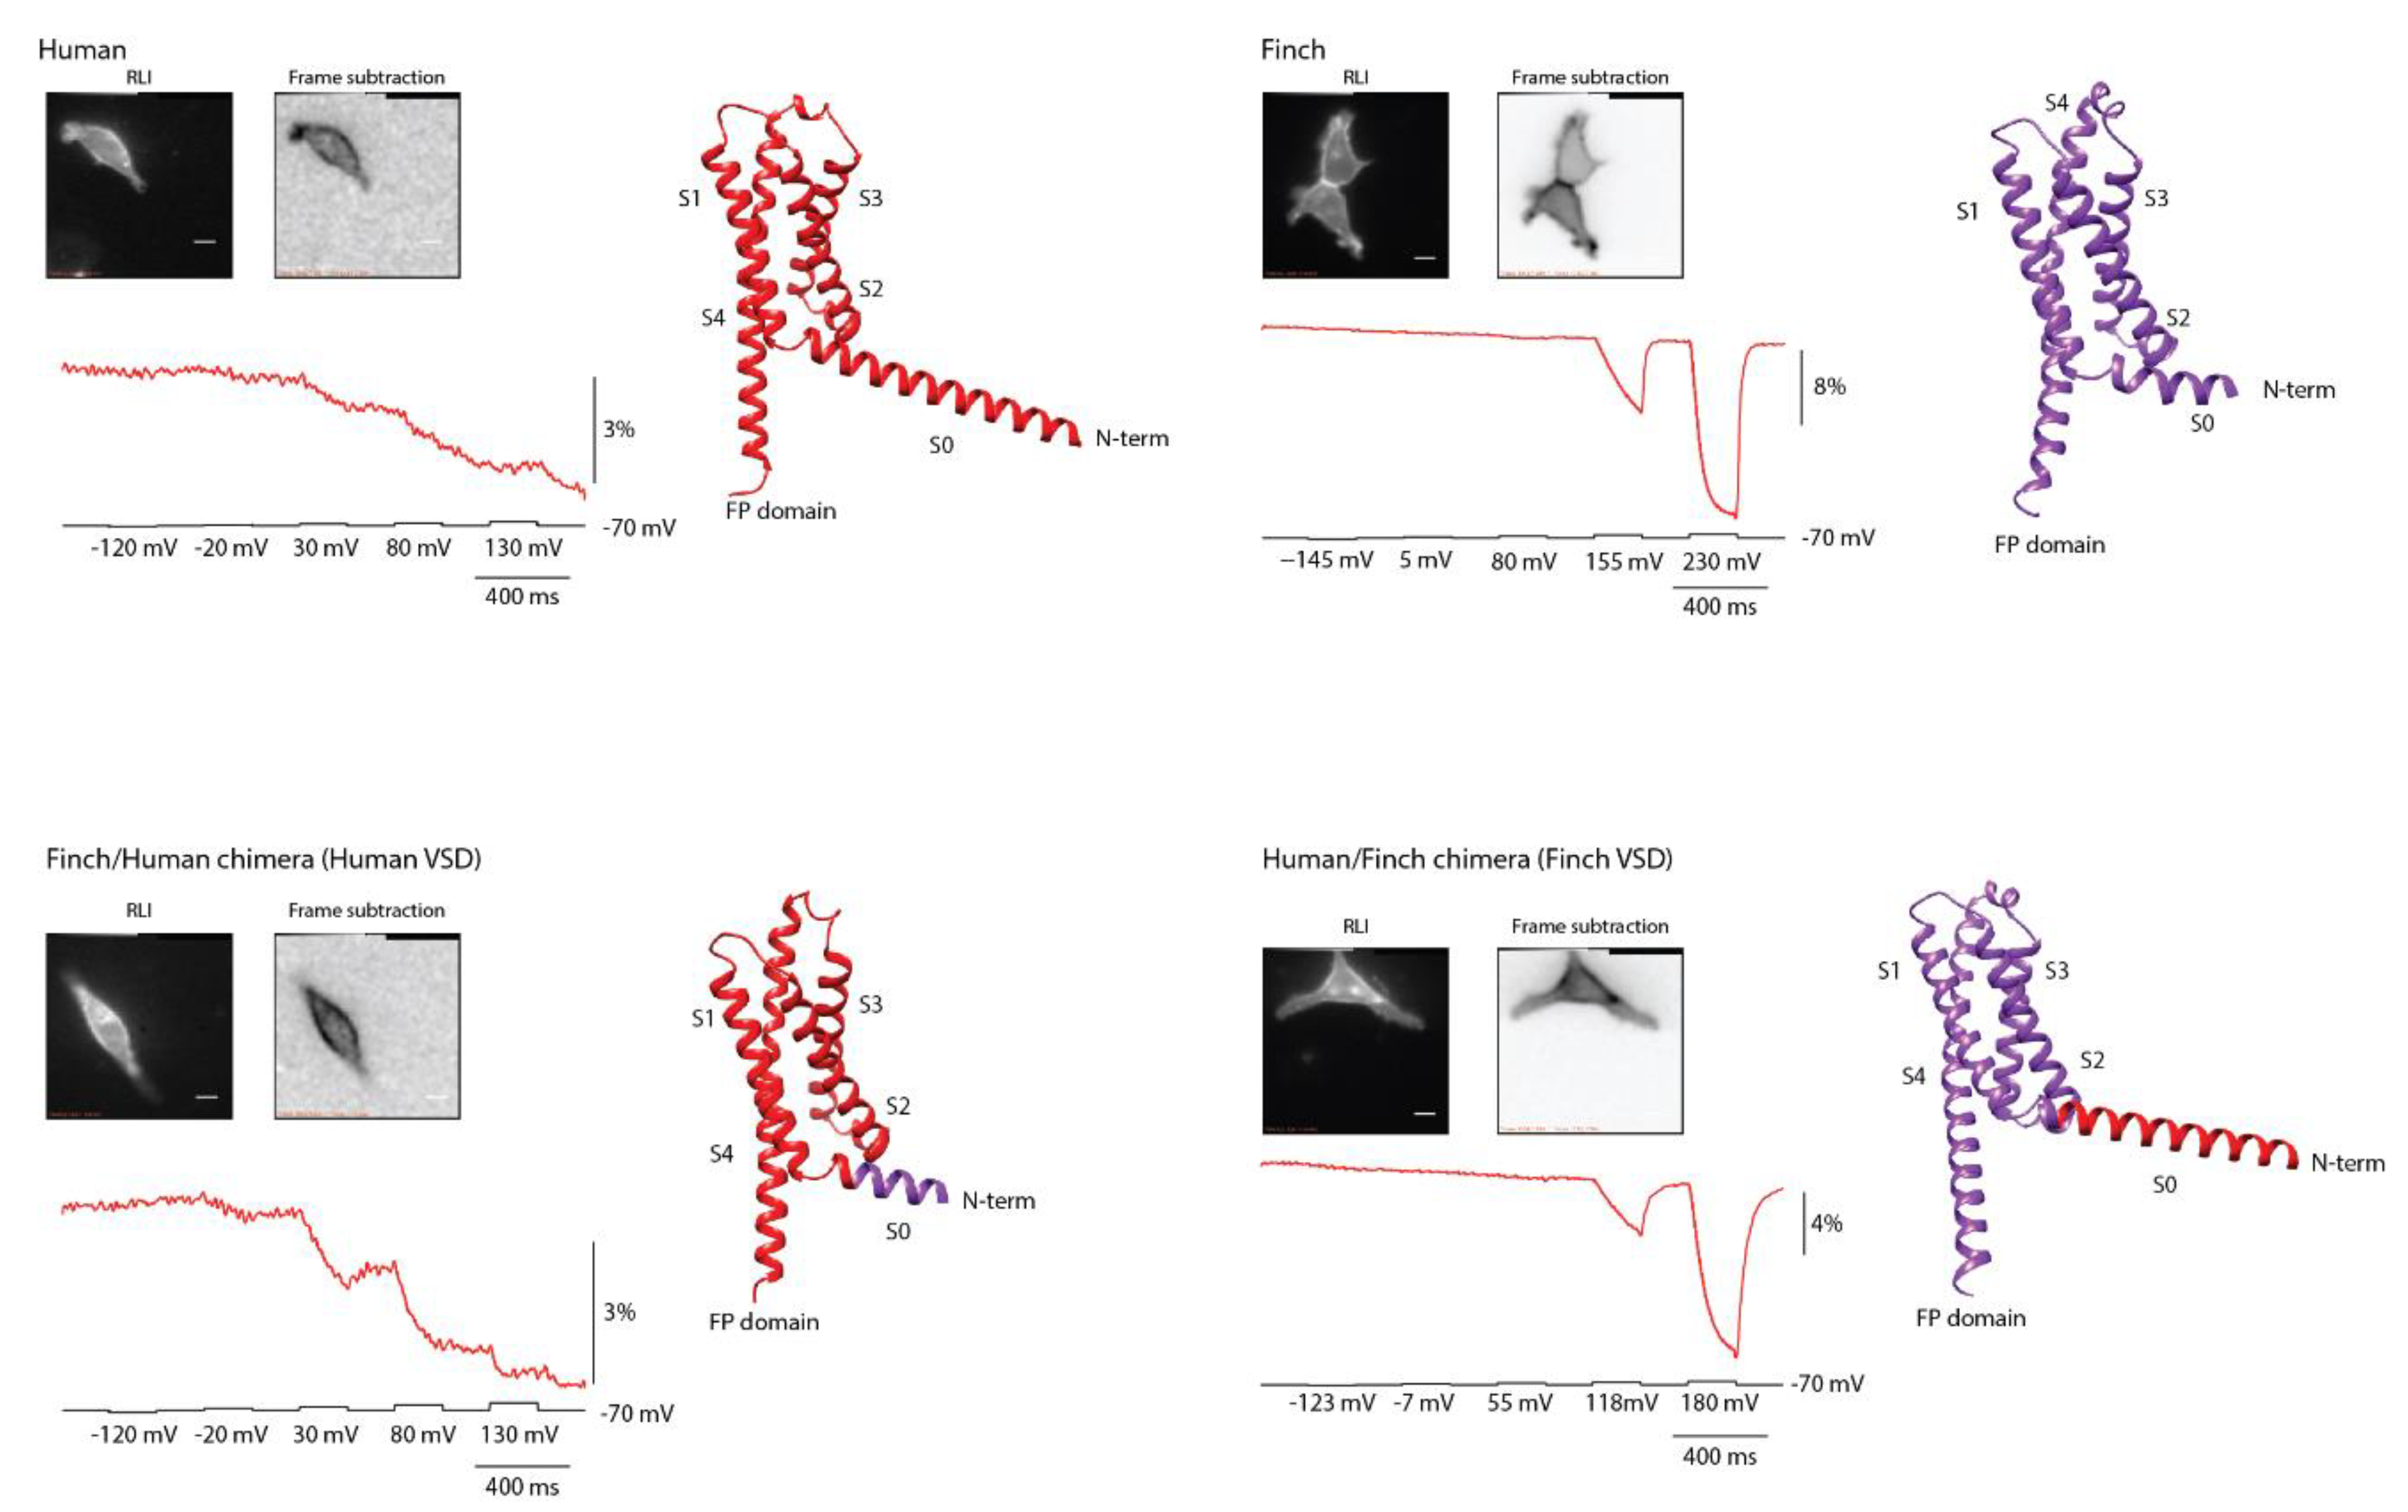
Figure 4.
A primate-specific mutation in human VSP alters voltage-dependent responses. (A) Sequence alignment of VSP orthologs highlights position 95 in S1 (red), with top numbering based on the human sequence and bottom numbering based on the Ciona sequence. Most species retain an arginine at this position, whereas human and other primates have glycine. Resting light fluorescence images of wildtype human VSD–FP and the G95R mutant show robust plasma membrane localization with minimal intracellular accumulation (scale bars, 10 µm). (B) Representative fluorescence traces recorded during depolarizing voltage steps (−120 mV to +130 mV; black trace shown below). The wildtype human construct produces a sluggish depolarization response with poor recovery, whereas the G95R mutant shows partial restoration of the repolarization phase along with improved signal size and faster kinetics.
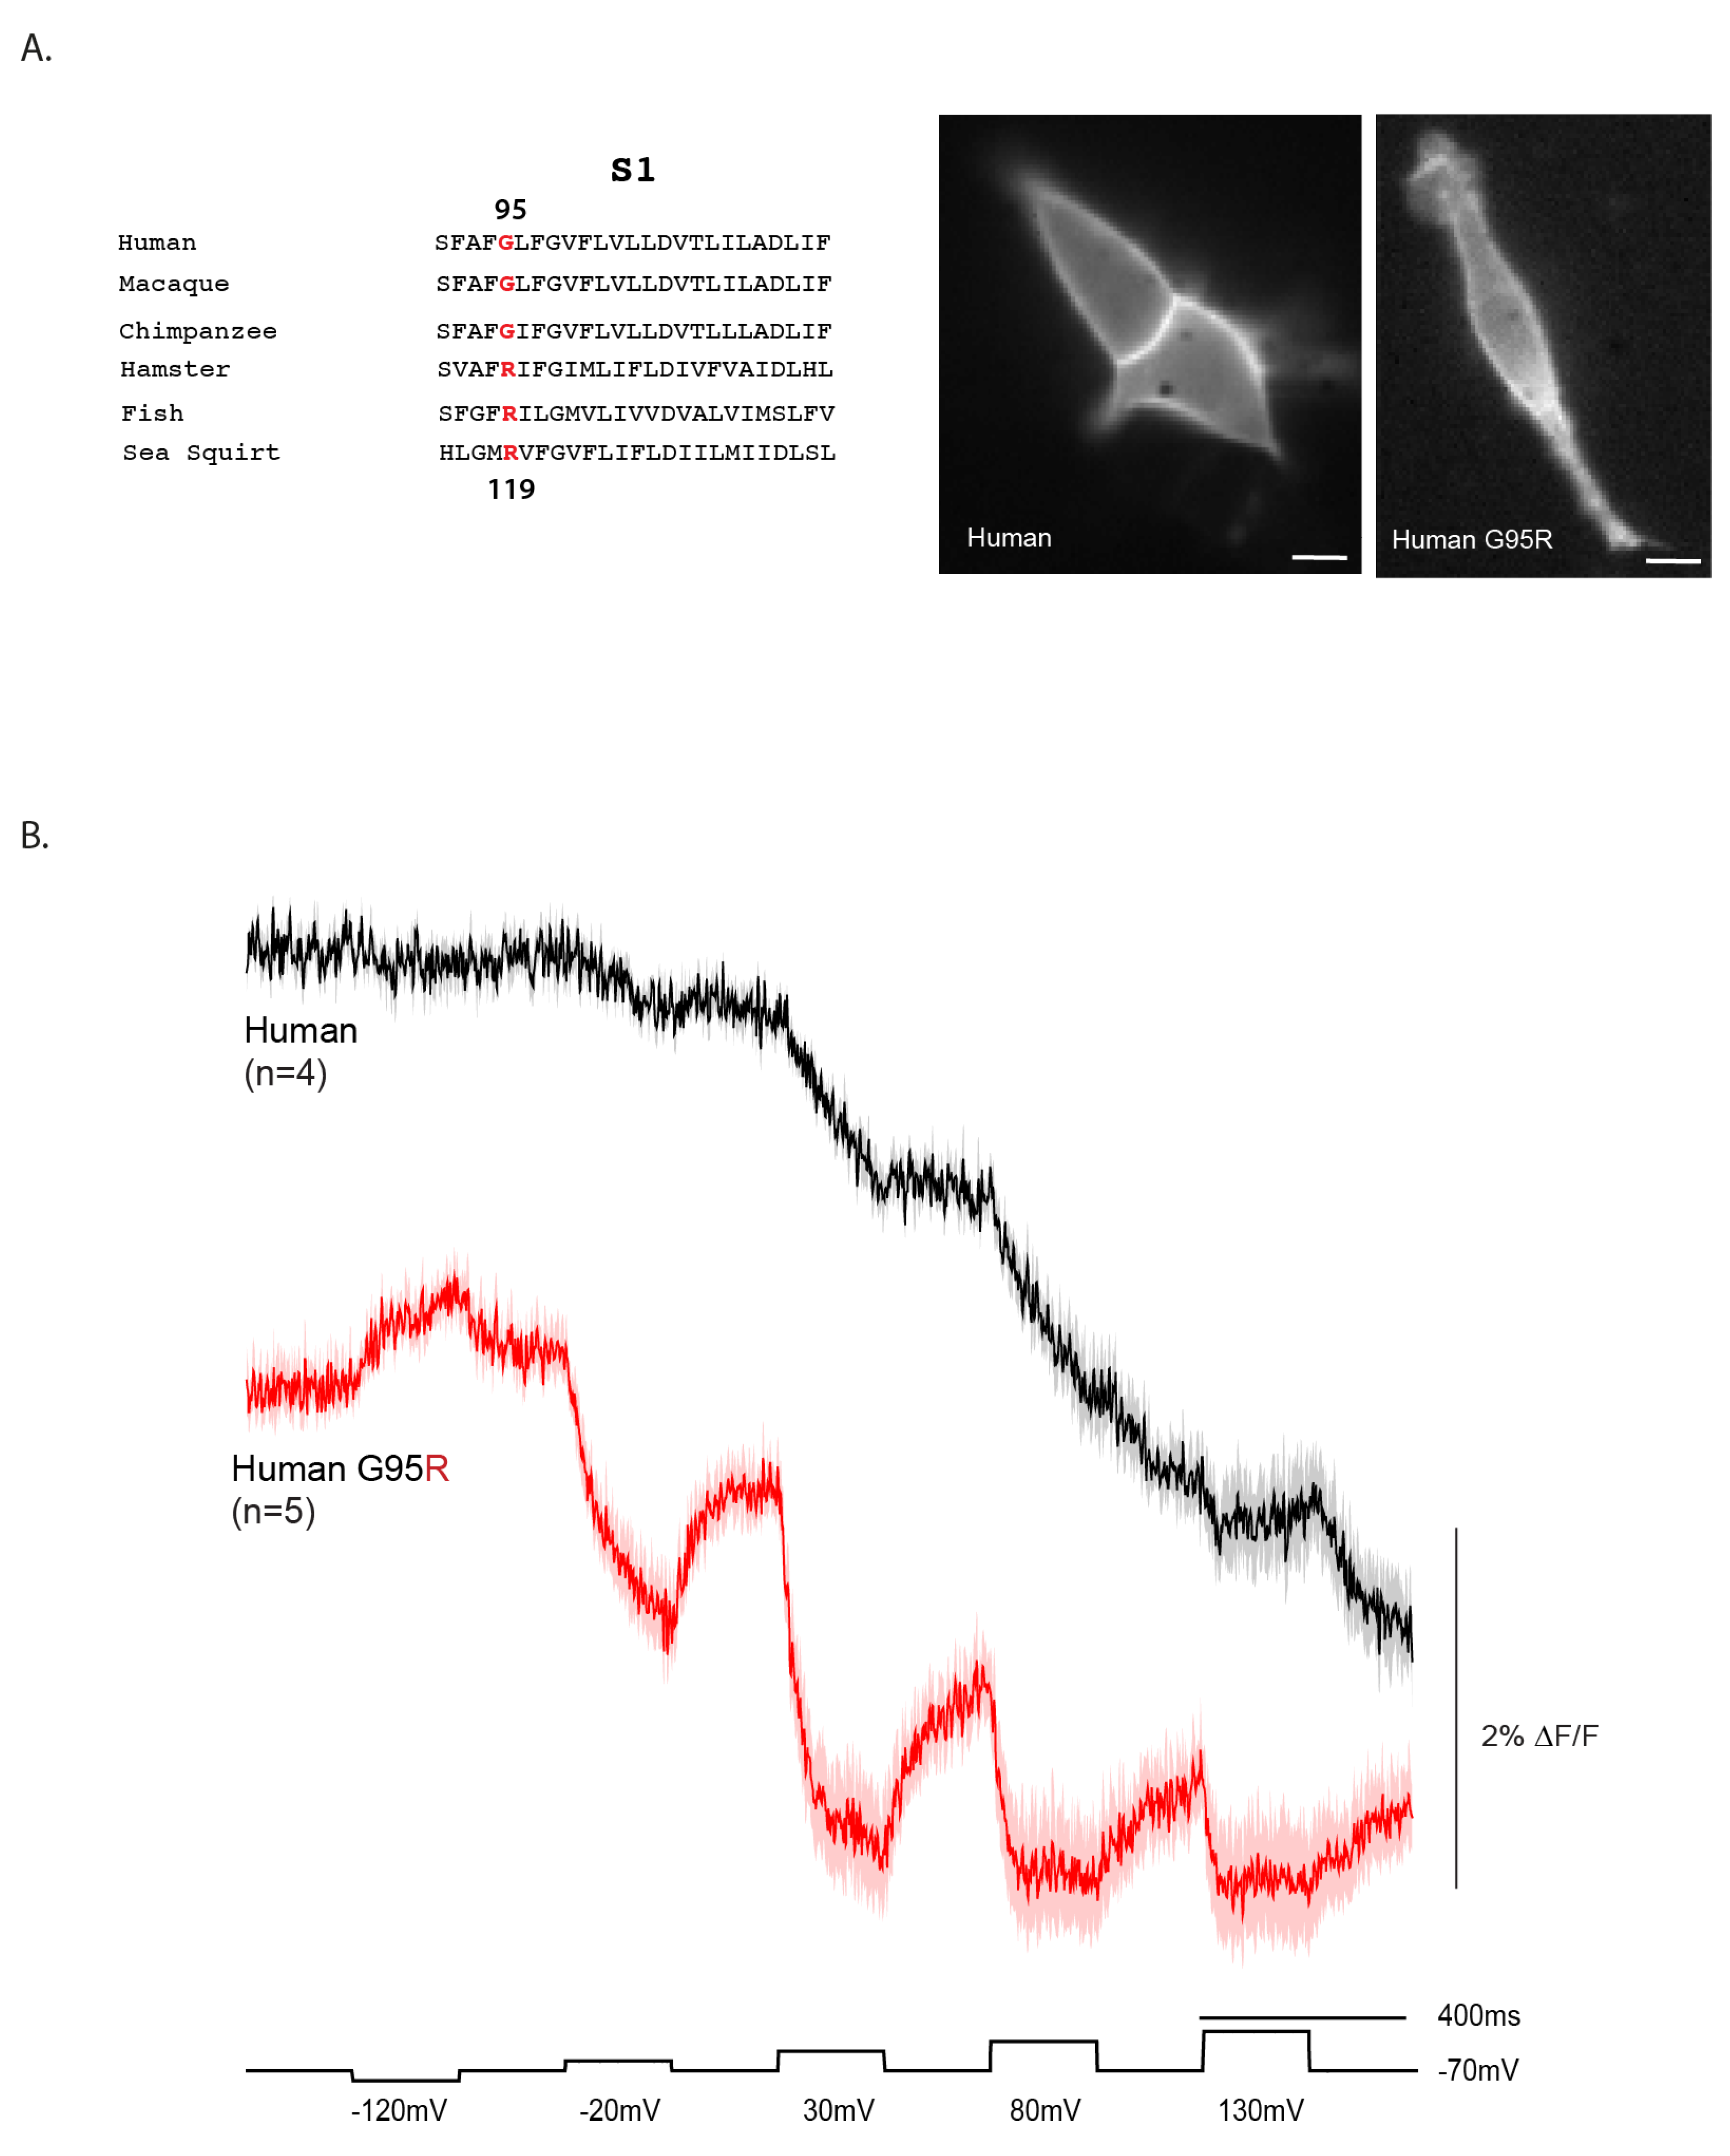
Figure 5.
Human–hamster chimeras reveal how S4 composition shapes the optical signal. Representative fluorescence traces are shown for wildtype hamster VSD–FP, the hamster W202R mutant (numbering based on the hamster sequence), and the corresponding human/hamster chimeras. The wildtype hamster construct produces little or no signal, whereas the human/hamster chimera with the native hamster S4 sequence (RWIR) shows a small increase in fluorescence upon depolarization. Introducing the W202R substitution in this chimera inverts the polarity of the voltage-dependent signal, indicating that the second position of S4 critically influences how conformational changes couple to the fluorescent protein. Structural models predicted by AlphaFold are shown, with hamster sequence in blue and human sequence in red. Scale bar is 10 m.
Disclaimer/Publisher’s Note: The statements, opinions and data contained in all publications are solely those of the individual author(s) and contributor(s) and not of MDPI and/or the editor(s). MDPI and/or the editor(s) disclaim responsibility for any injury to people or property resulting from any ideas, methods, instructions or products referred to in the content. |
© 2025 by the authors. Licensee MDPI, Basel, Switzerland. This article is an open access article distributed under the terms and conditions of the Creative Commons Attribution (CC BY) license (https://creativecommons.org/licenses/by/4.0/).
Copyright: This open access article is published under a Creative Commons CC BY 4.0 license, which permit the free download, distribution, and reuse, provided that the author and preprint are cited in any reuse.


