
Submitted:
26 September 2025
Posted:
26 September 2025
You are already at the latest version
Abstract
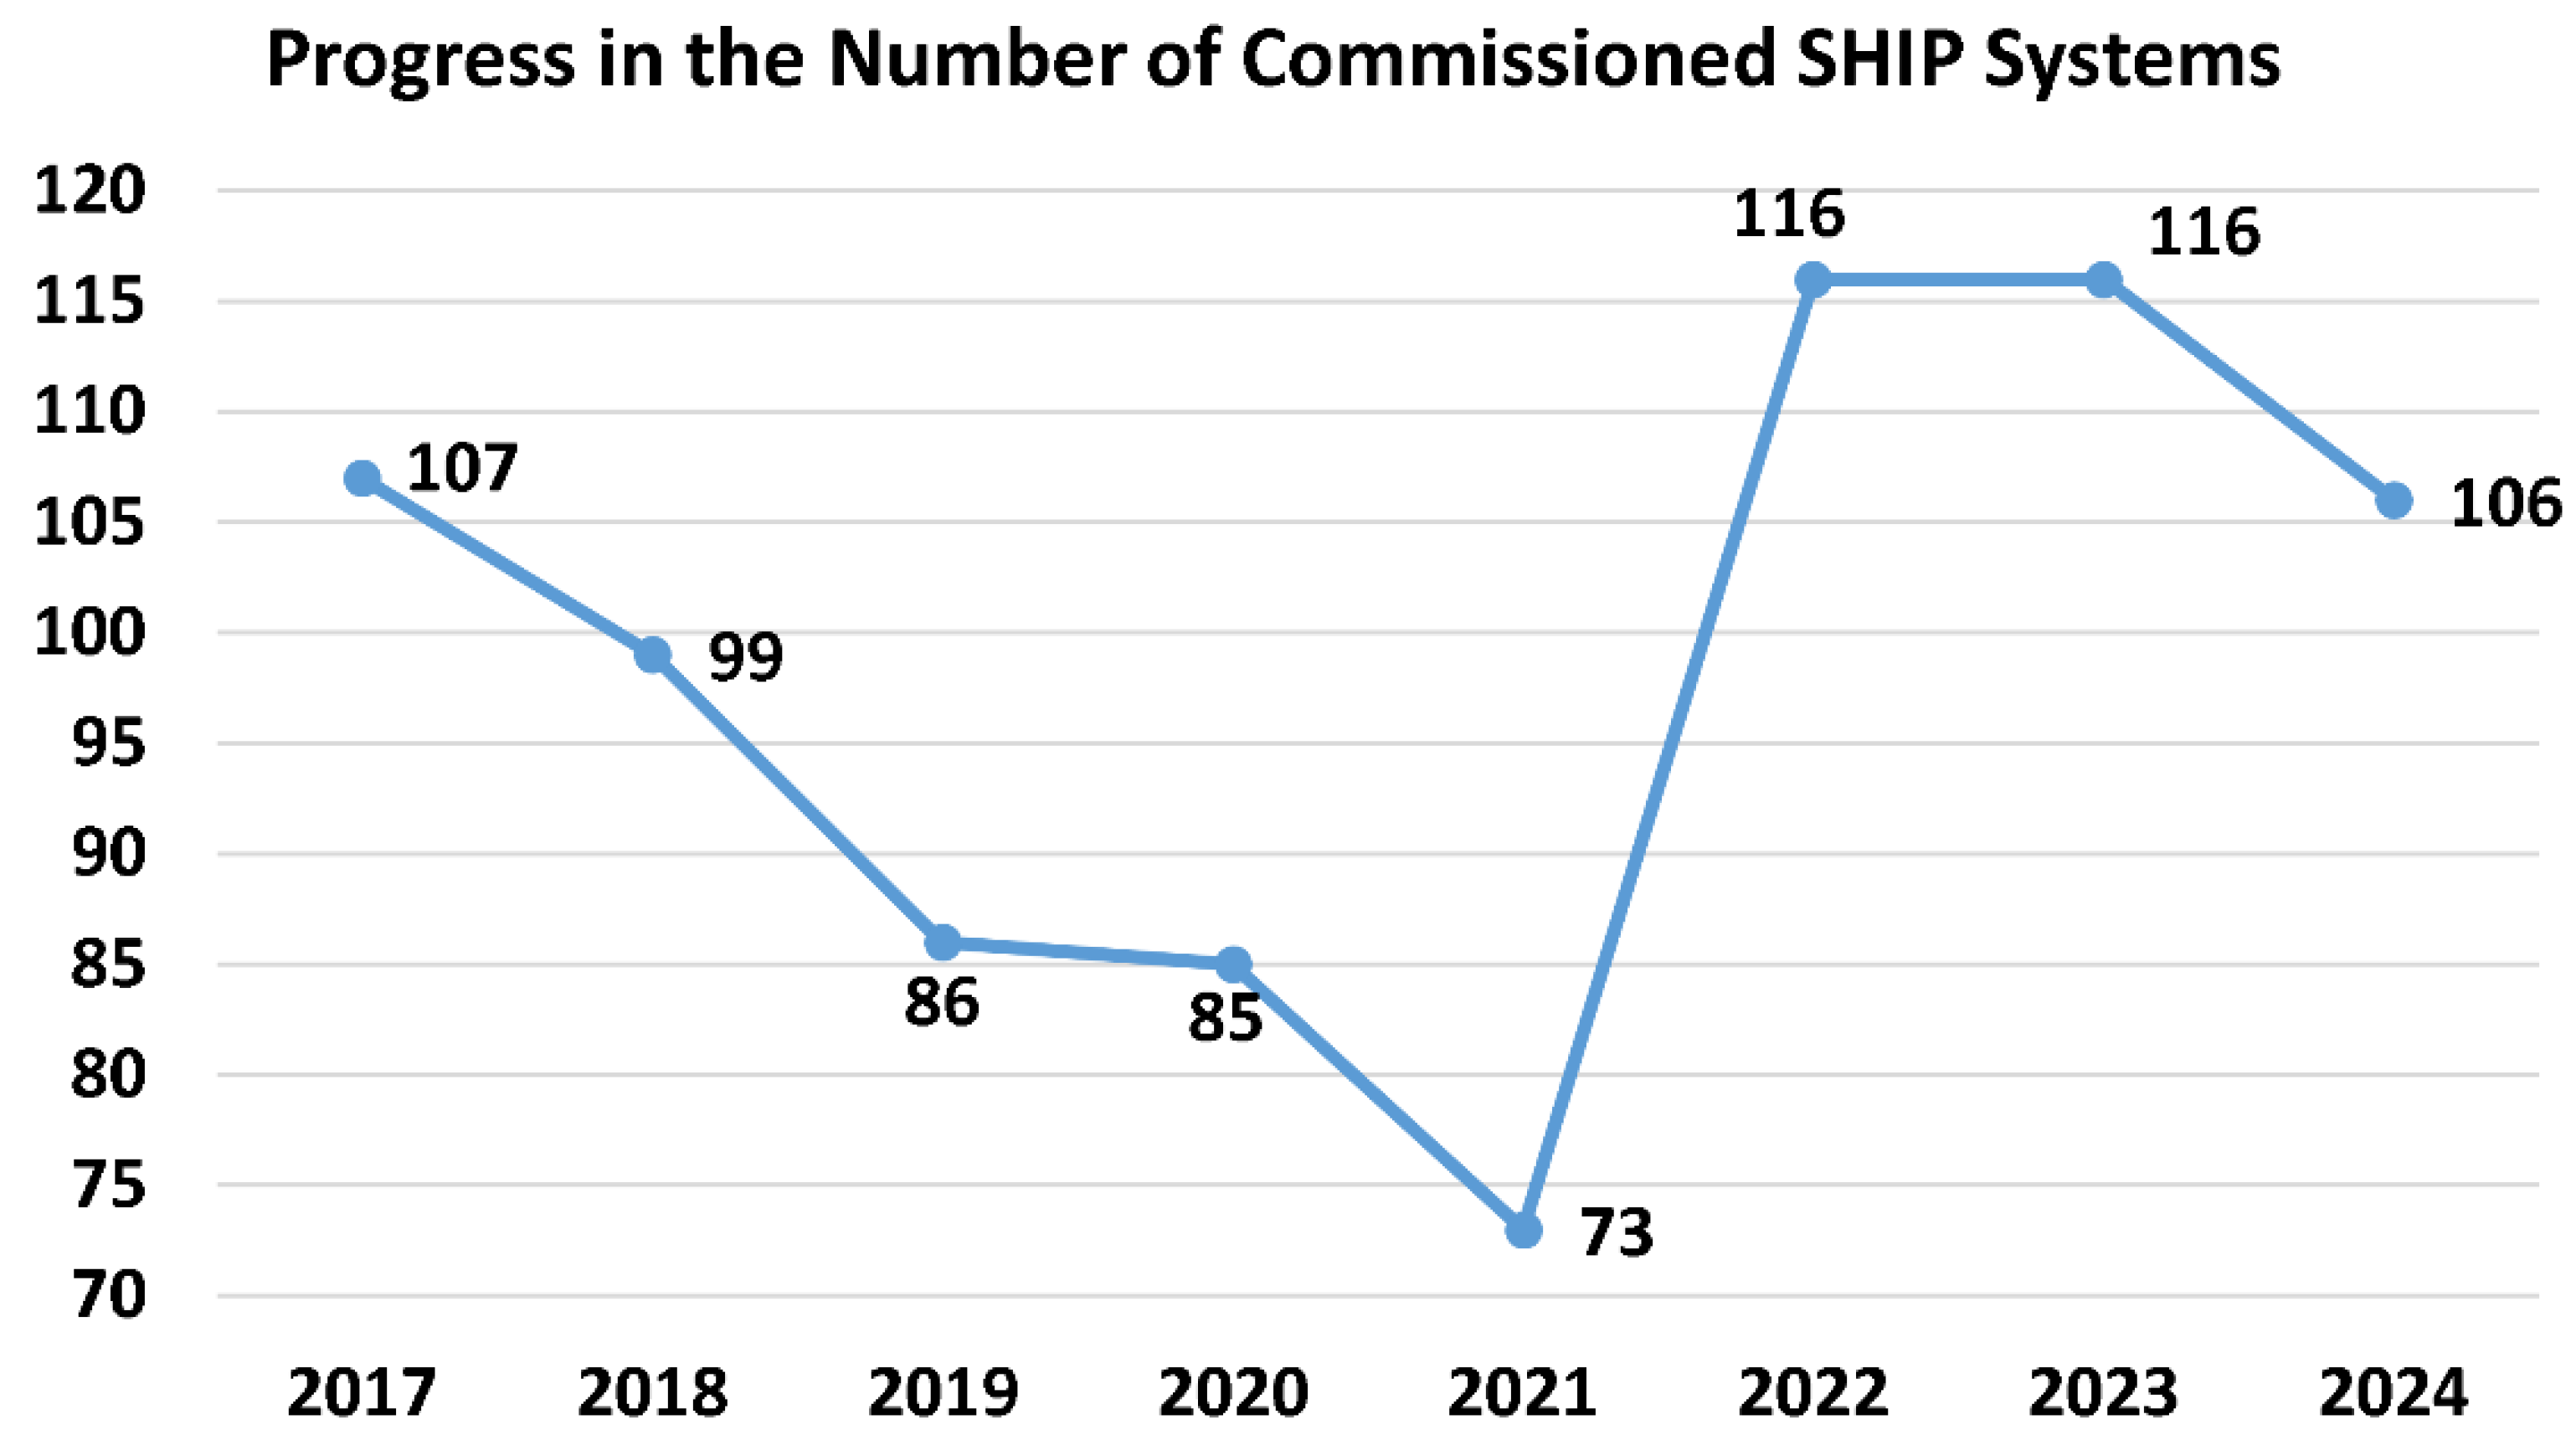
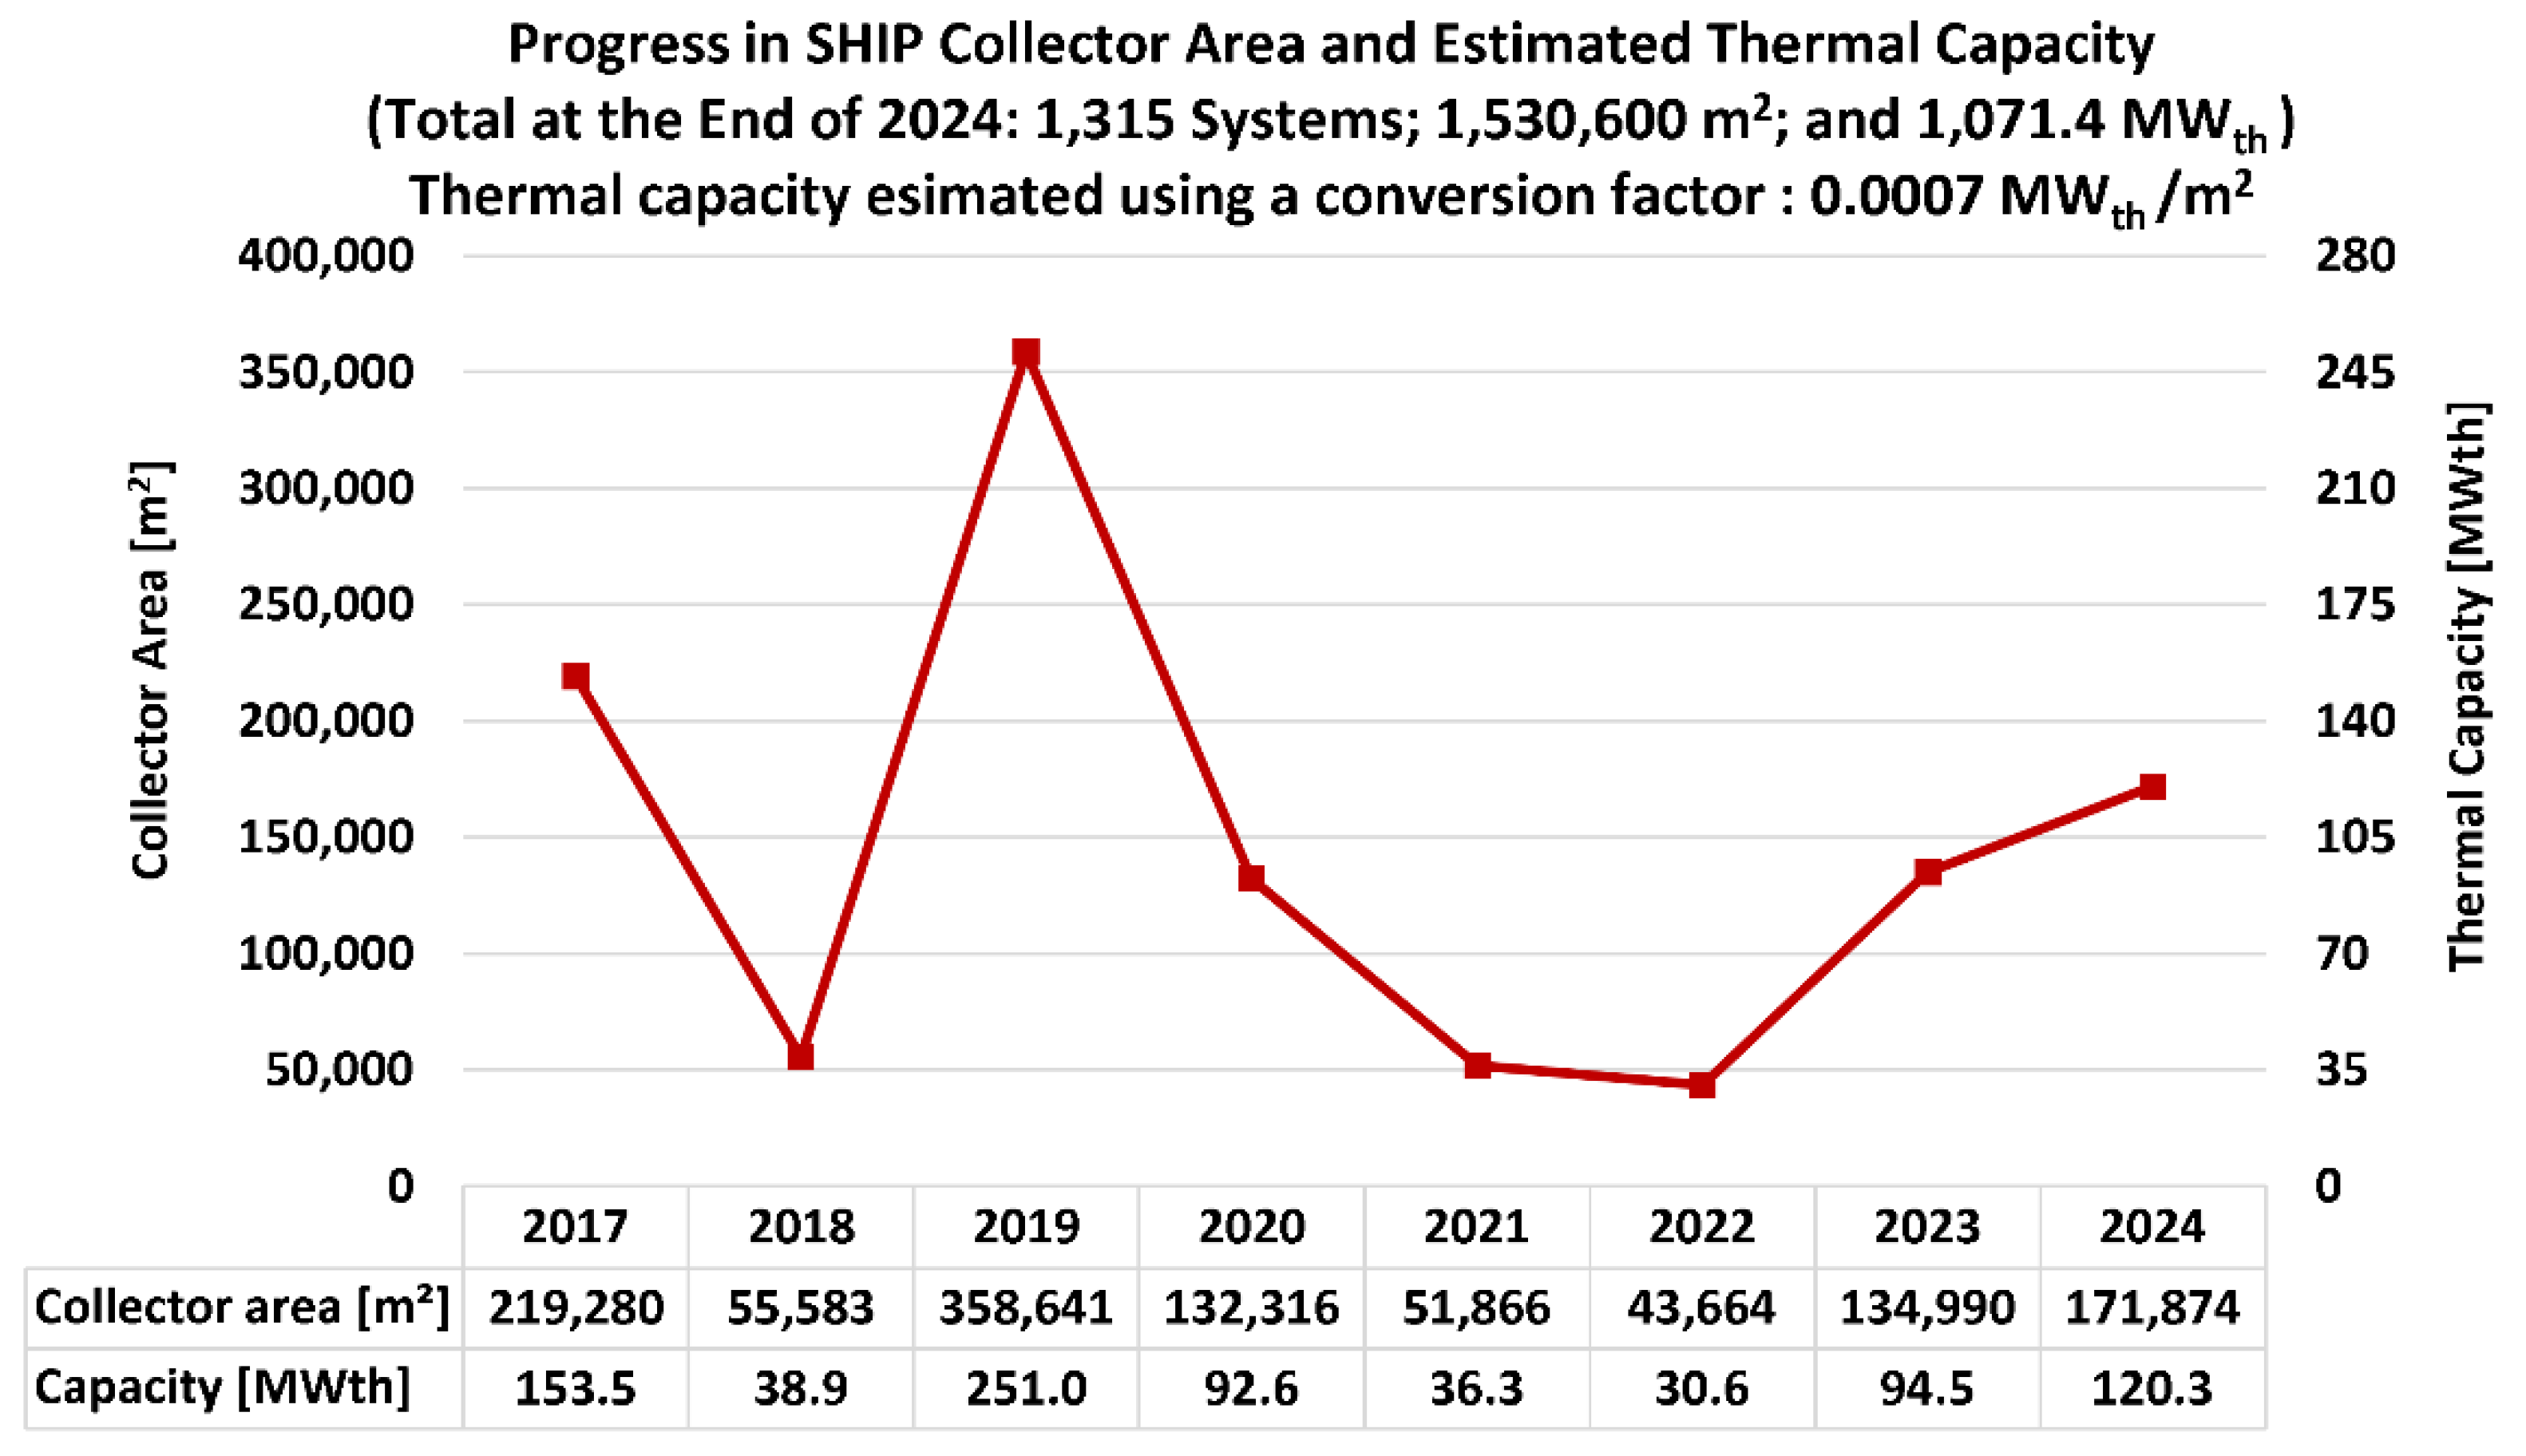
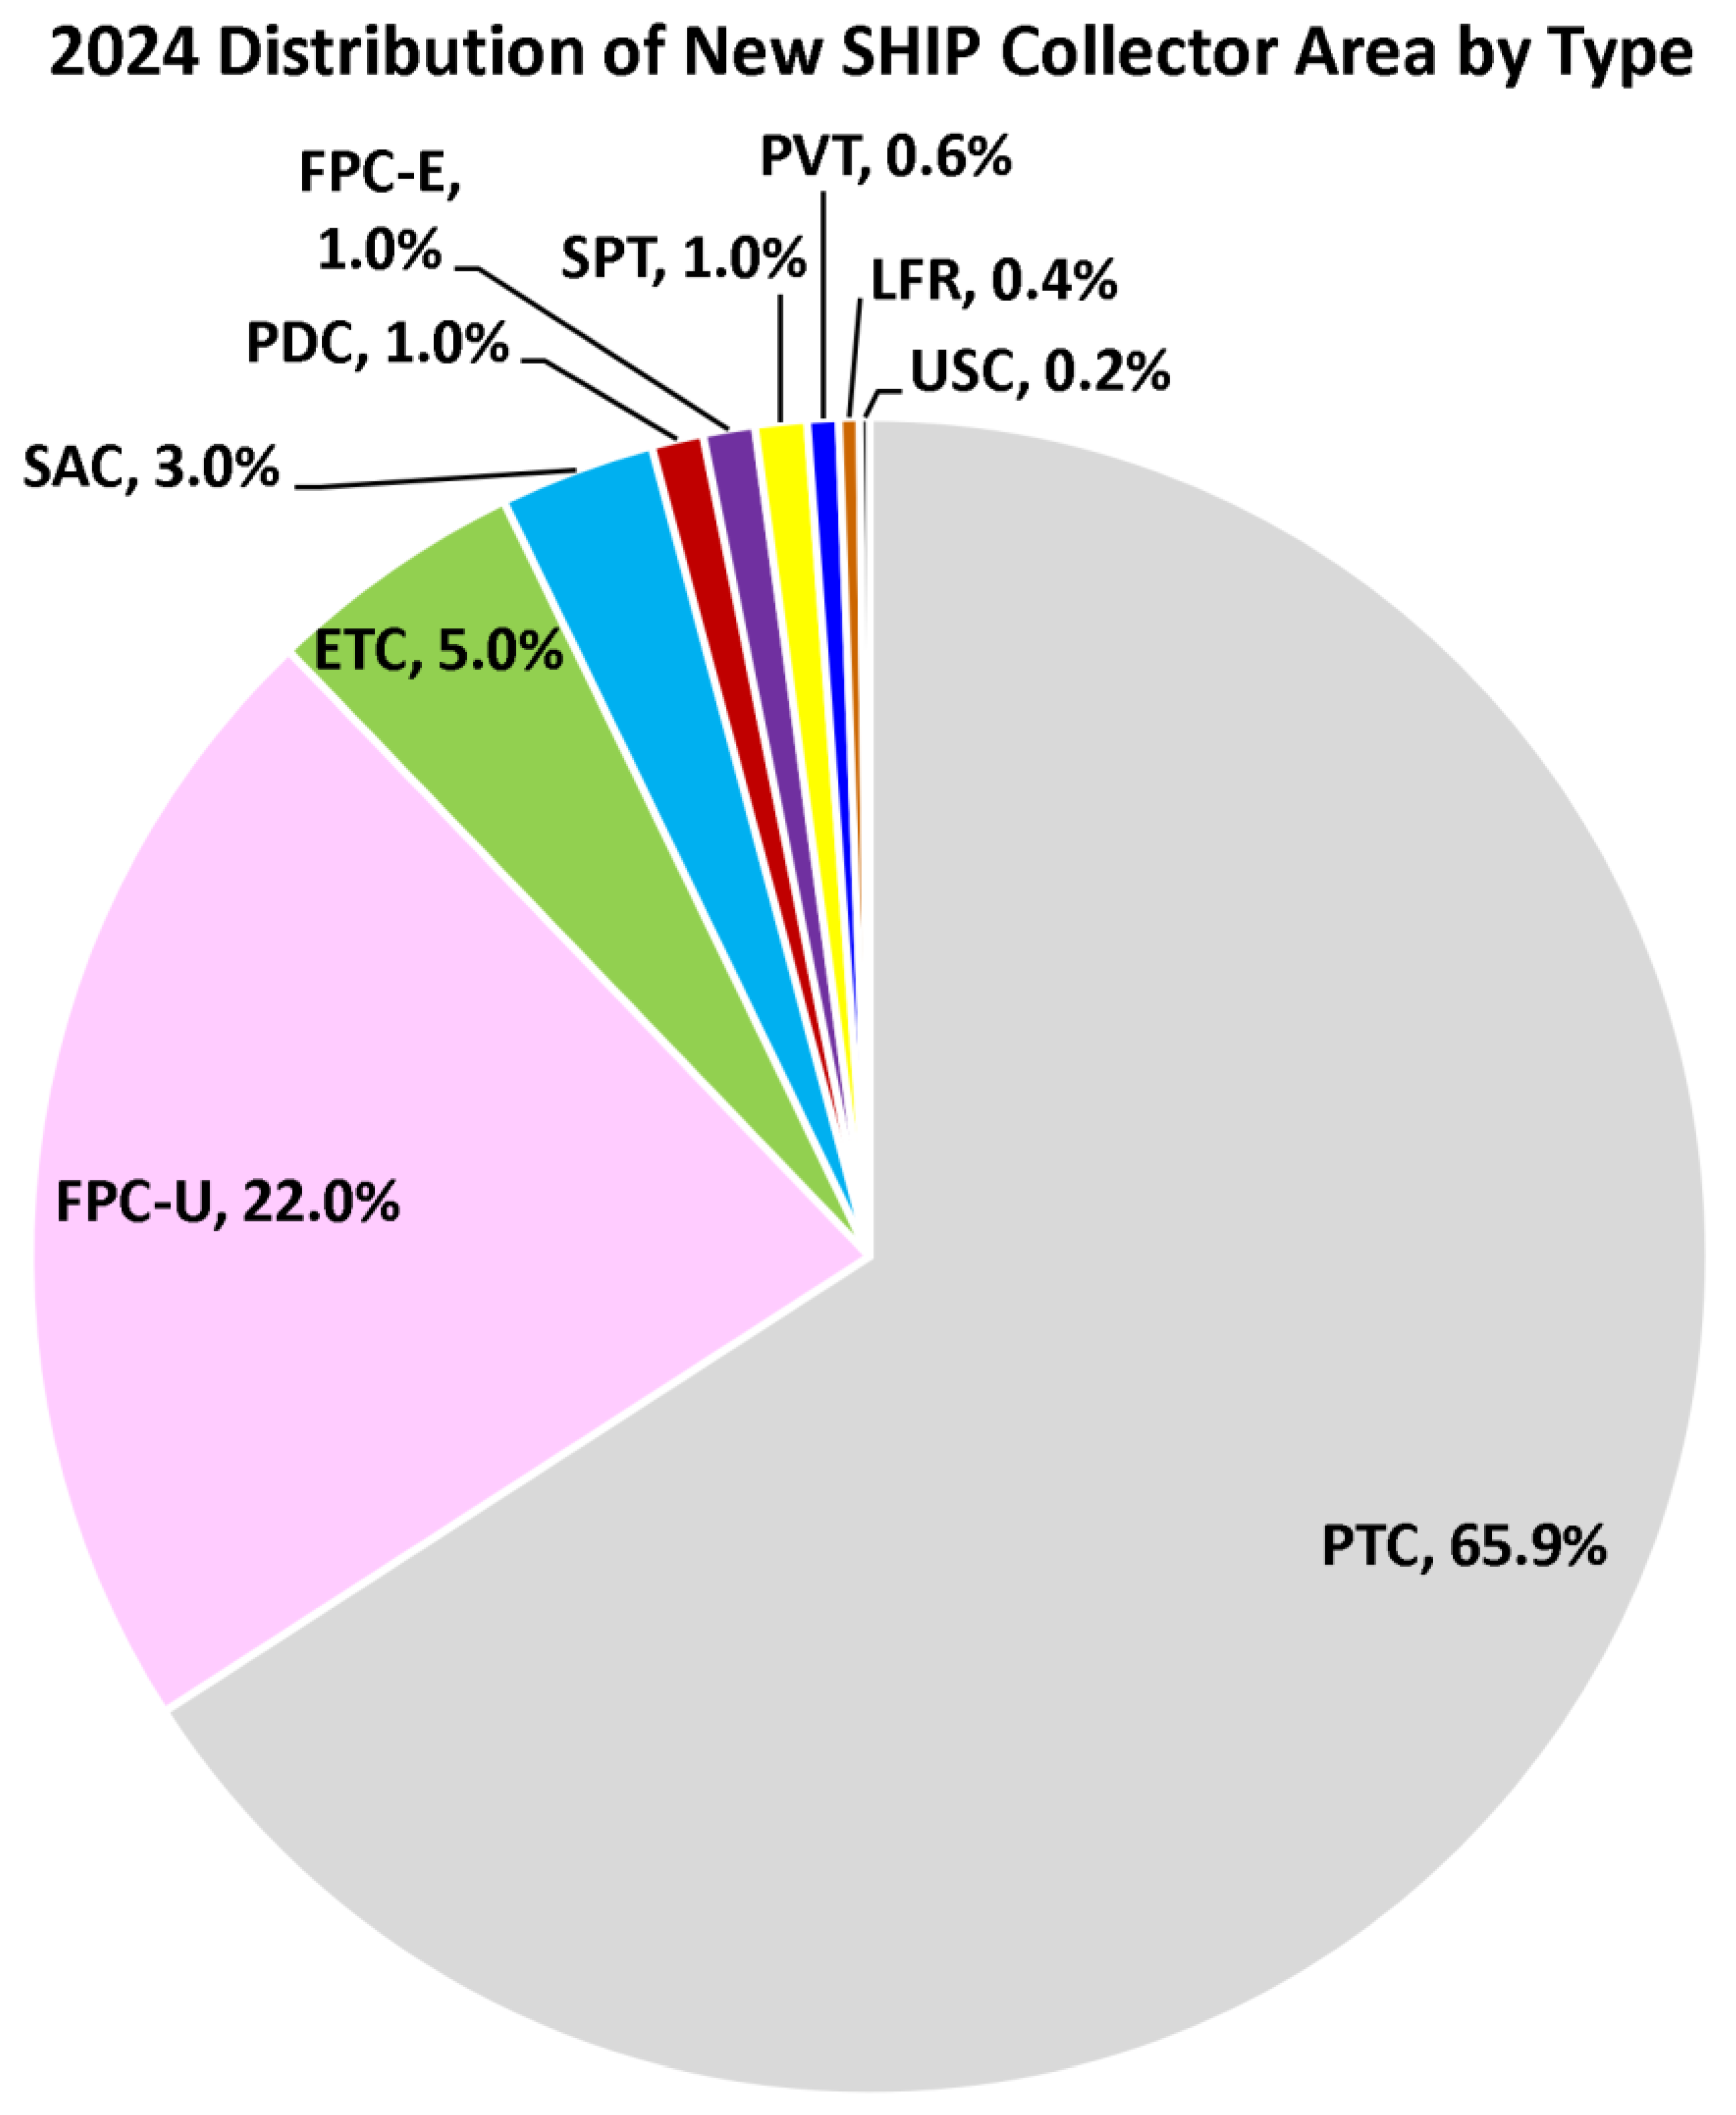
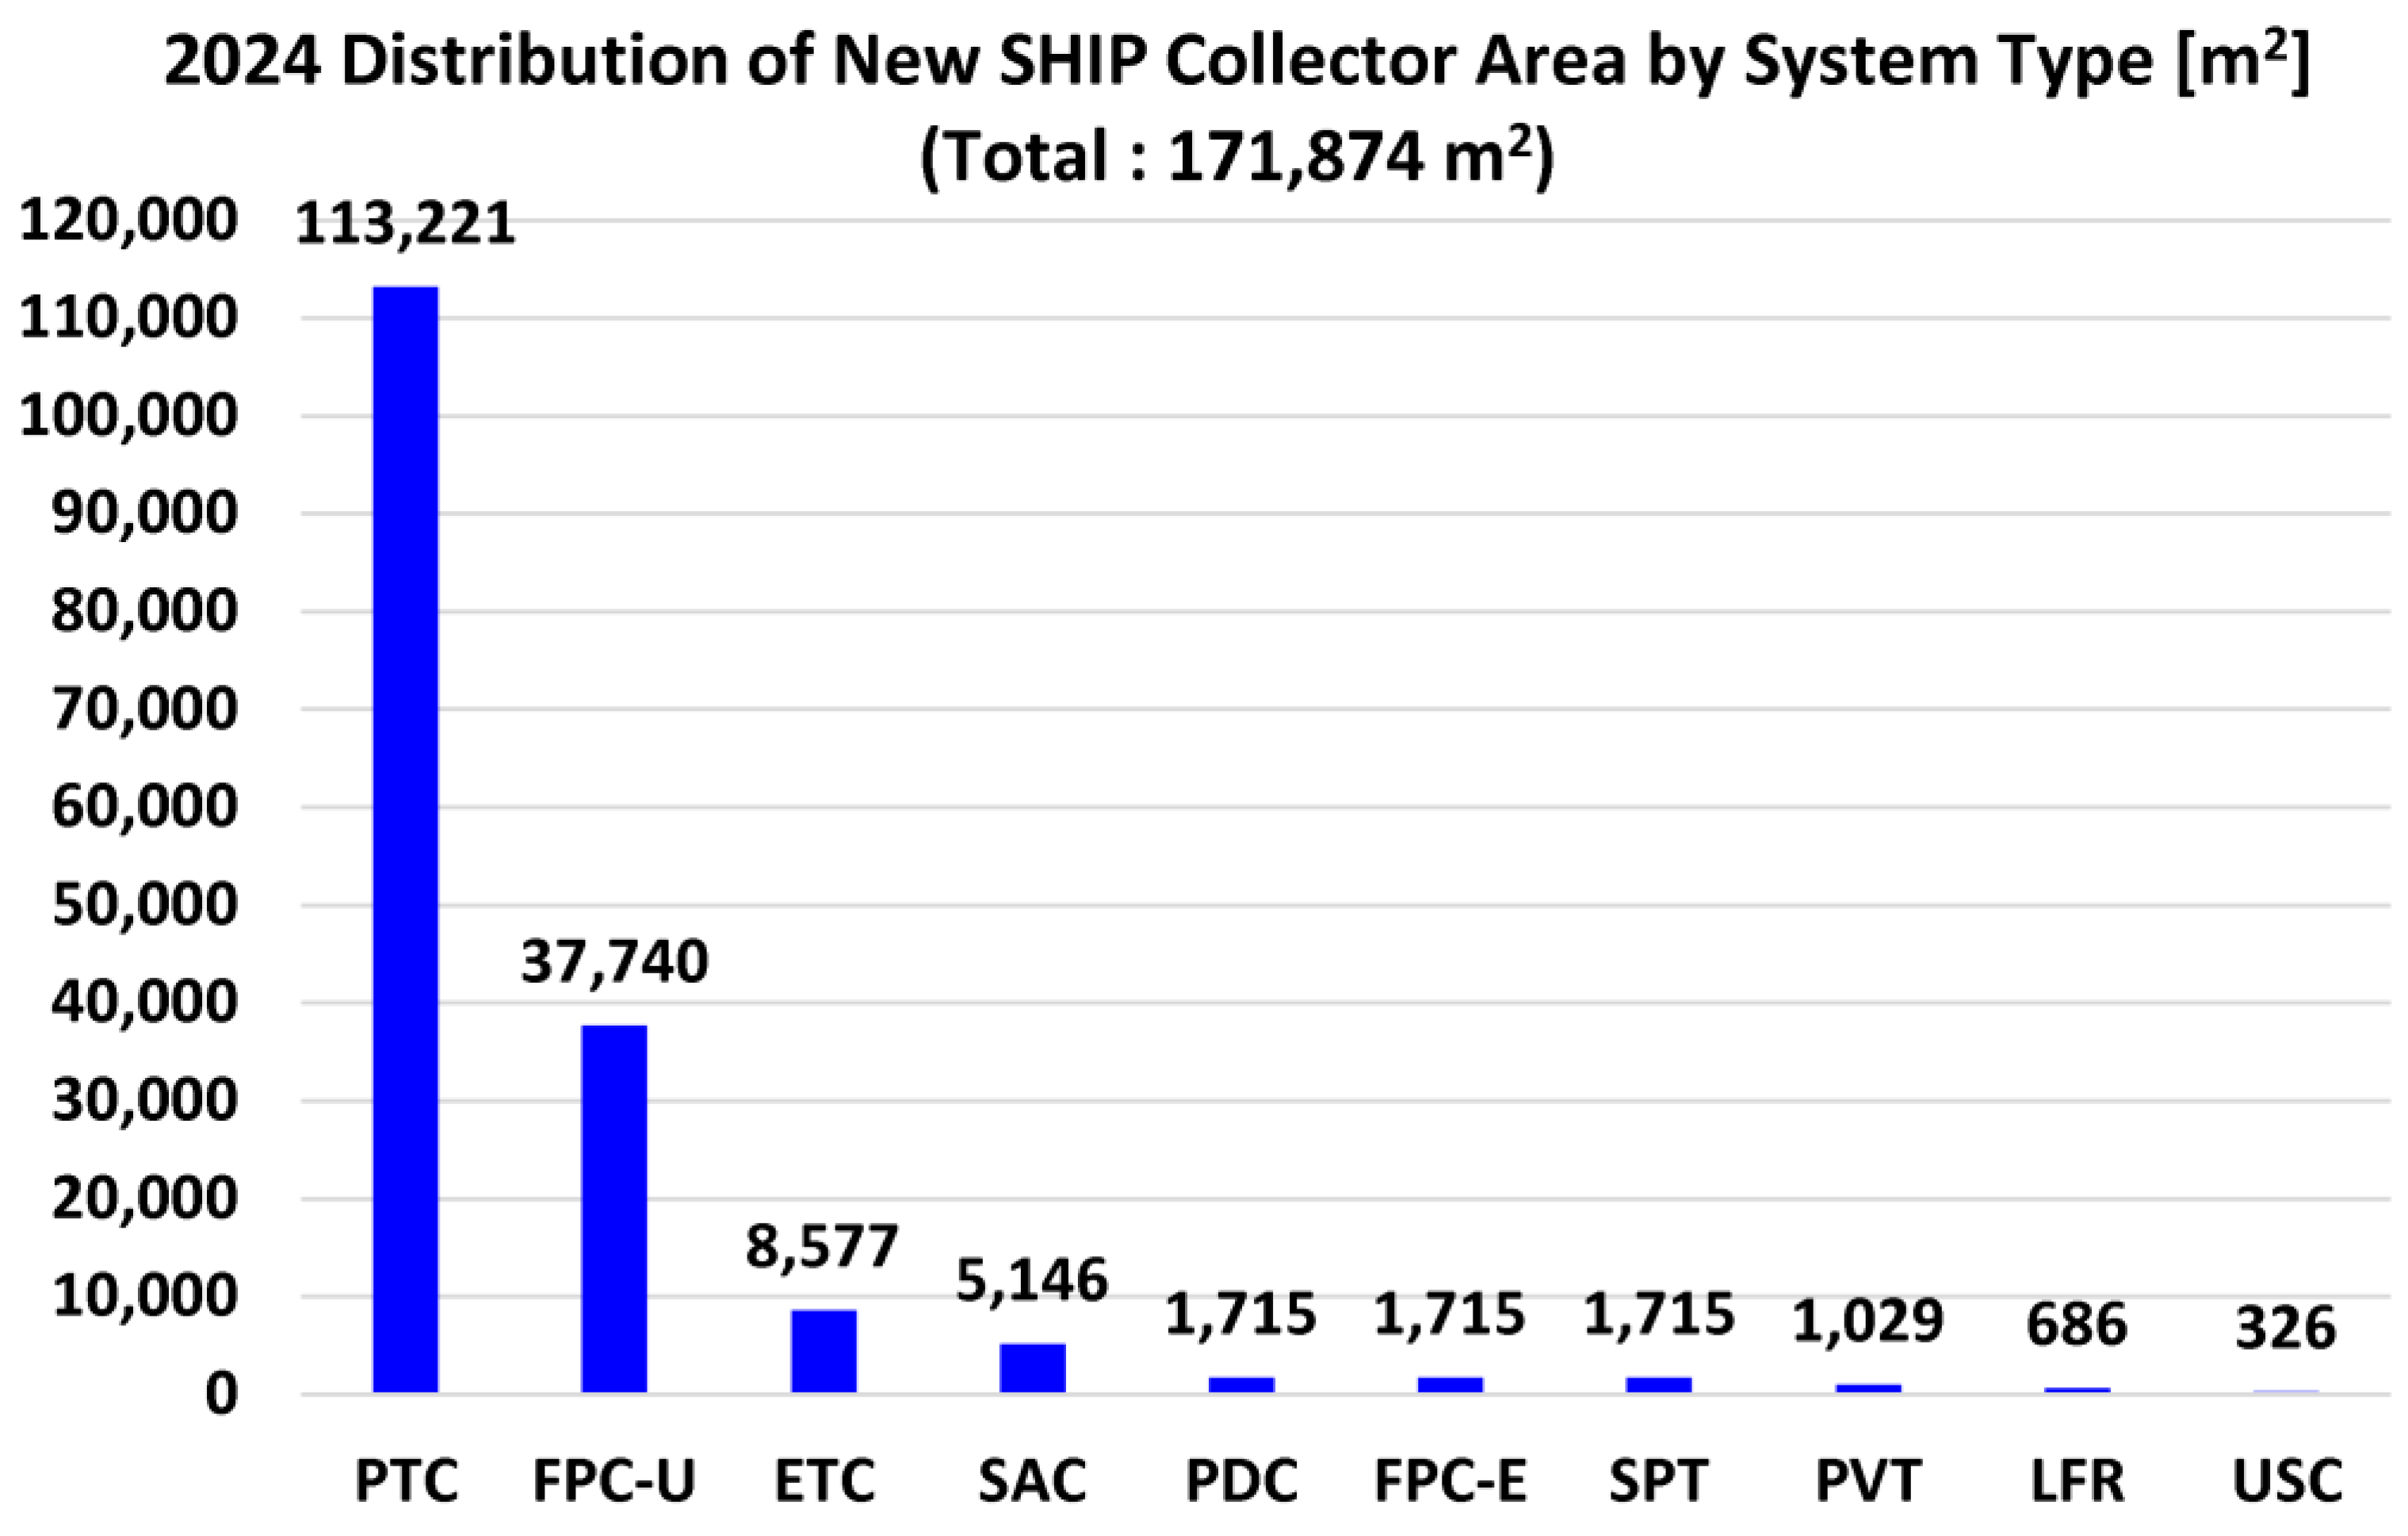
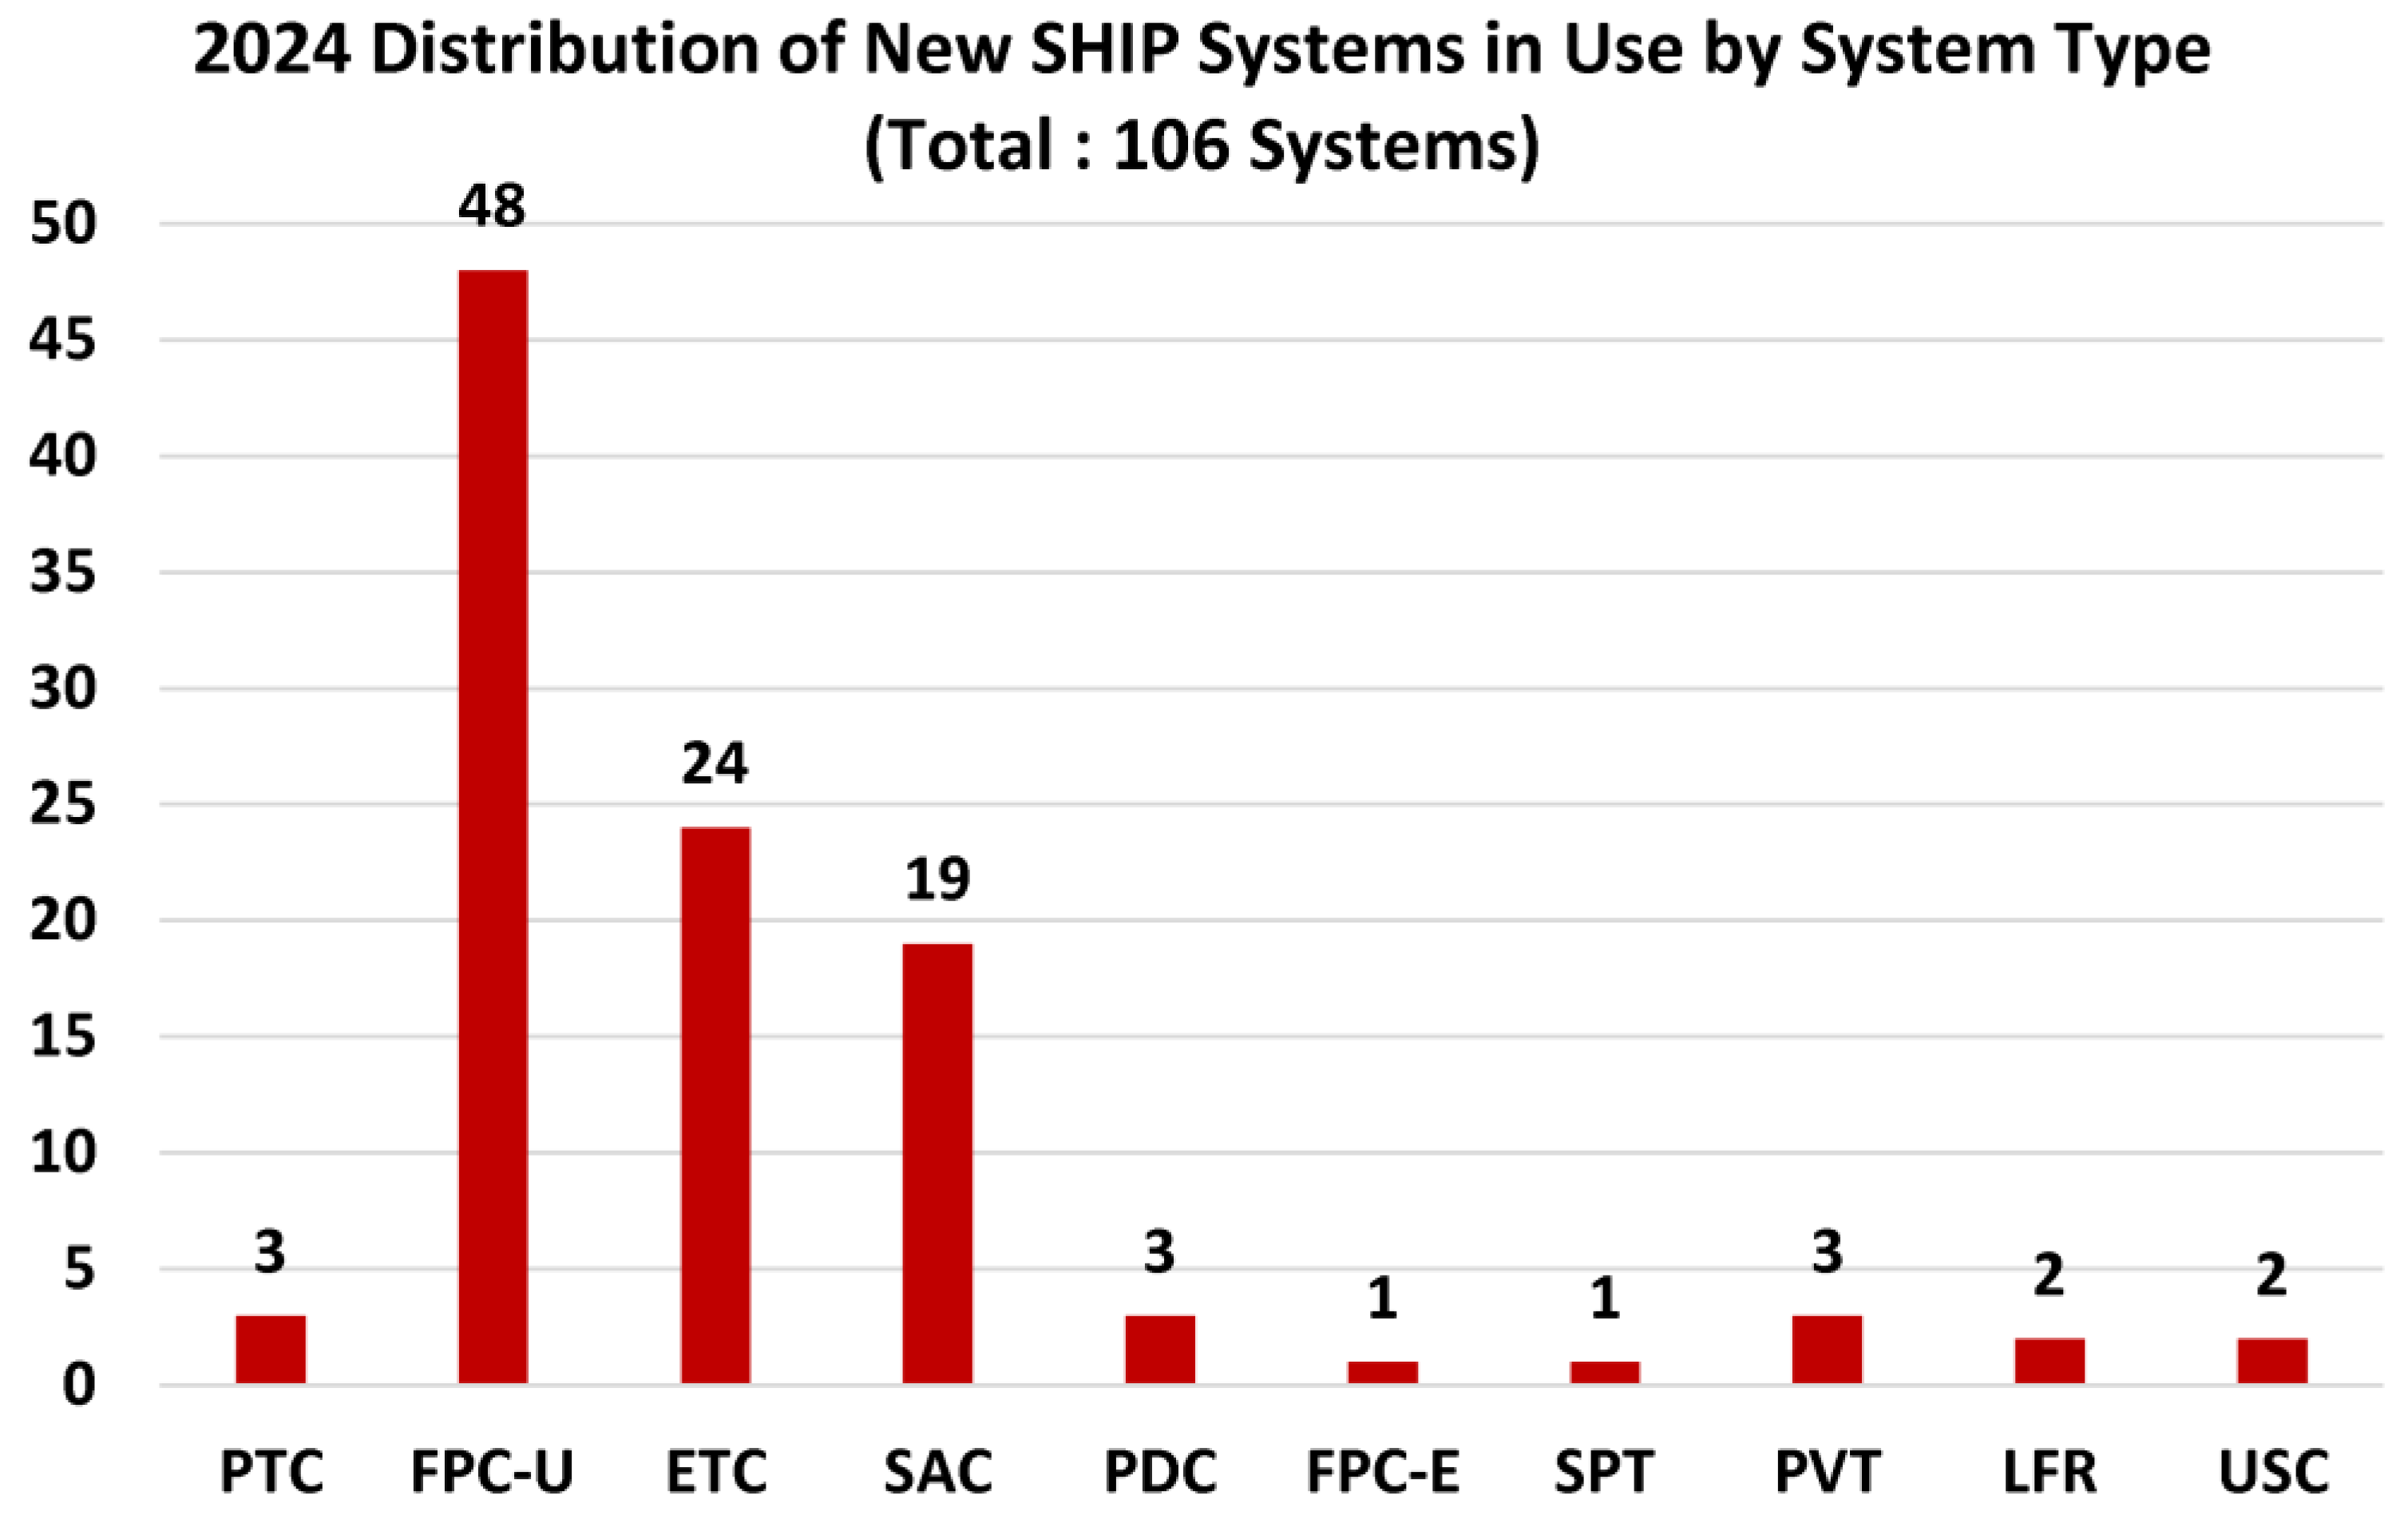
SHIP (solar heat for industrial processes) refers to the use of collected solar radiation for meeting industrial heat demands, rather than for electricity generation. The global thermal capacity of SHIP systems at the end of 2024 stood slightly above 1 GWth, which is comparable to the electric power capacity of a single power station. Despite this relatively small presence, SHIP systems play an important role in rendering industrial processes sustainable. There are two aims in the current study. The first aim is to cover various types of SHIP systems based on the variety of their collector designs, operational temperatures, applications, radiation concentration options, and solar tracking options. SHIP designs can be as simple as unglazed solar collectors (USC), having a stationary structure without any radiation concentration. On the other hand, SHIP designs can be as complicated as solar power towers (SPT), having a two-axis solar tracking mechanism with point-focused concentration of the solar radiation. The second aim is to shed some light on the status of SHIP deployment globally, particularly in 2024. This includes a drop during the COVID-19 pandemic. The findings of the current study show that more than 1,300 SHIP systems were commissioned worldwide by the end of 2024 (cumulative number), constituting a cumulative thermal capacity of 1,071.4 MWth, with a total collector area of 1,531,600 m2. In 2024 alone, 120.3 MWth of thermal capacity was introduced in 106 SHIP systems having a total collector area of 171,874 m2. In 2024, 65.9% of the installed global thermal capacity of SHIP systems belonged to the parabolic trough collectors (PTC), and another 22% of this installed global thermal capacity was attributed to the unevacuated flat plate collectors (FPC-U). Considering the 106 SHIP systems installed in 2024, the average collector area per system was 1,621.4 m2/project. However, this area largely depends on the SHIP category, where it is much higher for parabolic trough collectors (37,740.5 m2/project), but lower for flat plate collectors (805.2 m2/project), and it is lowest for unglazed solar collectors (163.0 m2/project). The study anticipates large deployment in SHIP systems (particularly the PTC type) in 2026 in alignment with giga-scale solar-steam utilization in alumina production. Several recommendations are provided with regard to the SHIP sector.
Keywords:
1. Introduction
1.1. Classifications of SHIP Systems
- (1)
- Stationary: no sun tracking, no moving parts
- (2)
- (3)
1.2. Objectives
2. Method
2.1. SHIP Capacity Relative to Other Power Sources
2.2. Estimated Solar Radiation Power
2.3. Outline of the Study
2.4. Use of Third-Party Illustrations
2.5. Contribution of the Current Study
- What was the SHIP installation in 2024?
- What was the SHIP type with the largest installation capacity in 2024?
- Was the SHIP installation affected by the COVID-19 pandemic?
- What is the historical progress in SHIP between 2017 and 2024?
- What are the top 10 countries in terms of installed SHIP capacity in 2024?
- What are the different types of SHIP systems?
- How are SHIP systems classified?
- Can SHIP systems replace natural gas combustion for enhanced oil recovery (EOR)?
- What is the anticipated size of the SHIP installation for steam installation in mining?
- What are the challenges of small-scale non-SHIP solar thermal systems?
- What are the recommendations for SHIP systems for improved deployment?
- What are the nine main categories of SHIP designs?
- Can the photovoltaic-thermal (PVT) technology be used with bifacial photovoltaic systems?
- What was the average capacity for a parabolic trough collector (PTC) system in 2024?
- What SHIP designs are also used for CSP (concentrated solar power) applications, and why?
- What is the significance of tube evacuation in SHIP systems?
- What are the approaches and tools suitable for modeling SHIP systems?
- Can SHIP systems be used for retrofitting an existing steam generation system, and is there a successful case like this?
- What is the meaning of PV-to-heat configuration (PVH)?
- What is the expected contribution of the (Maaden Solar I) to the SHIP sector, and when?
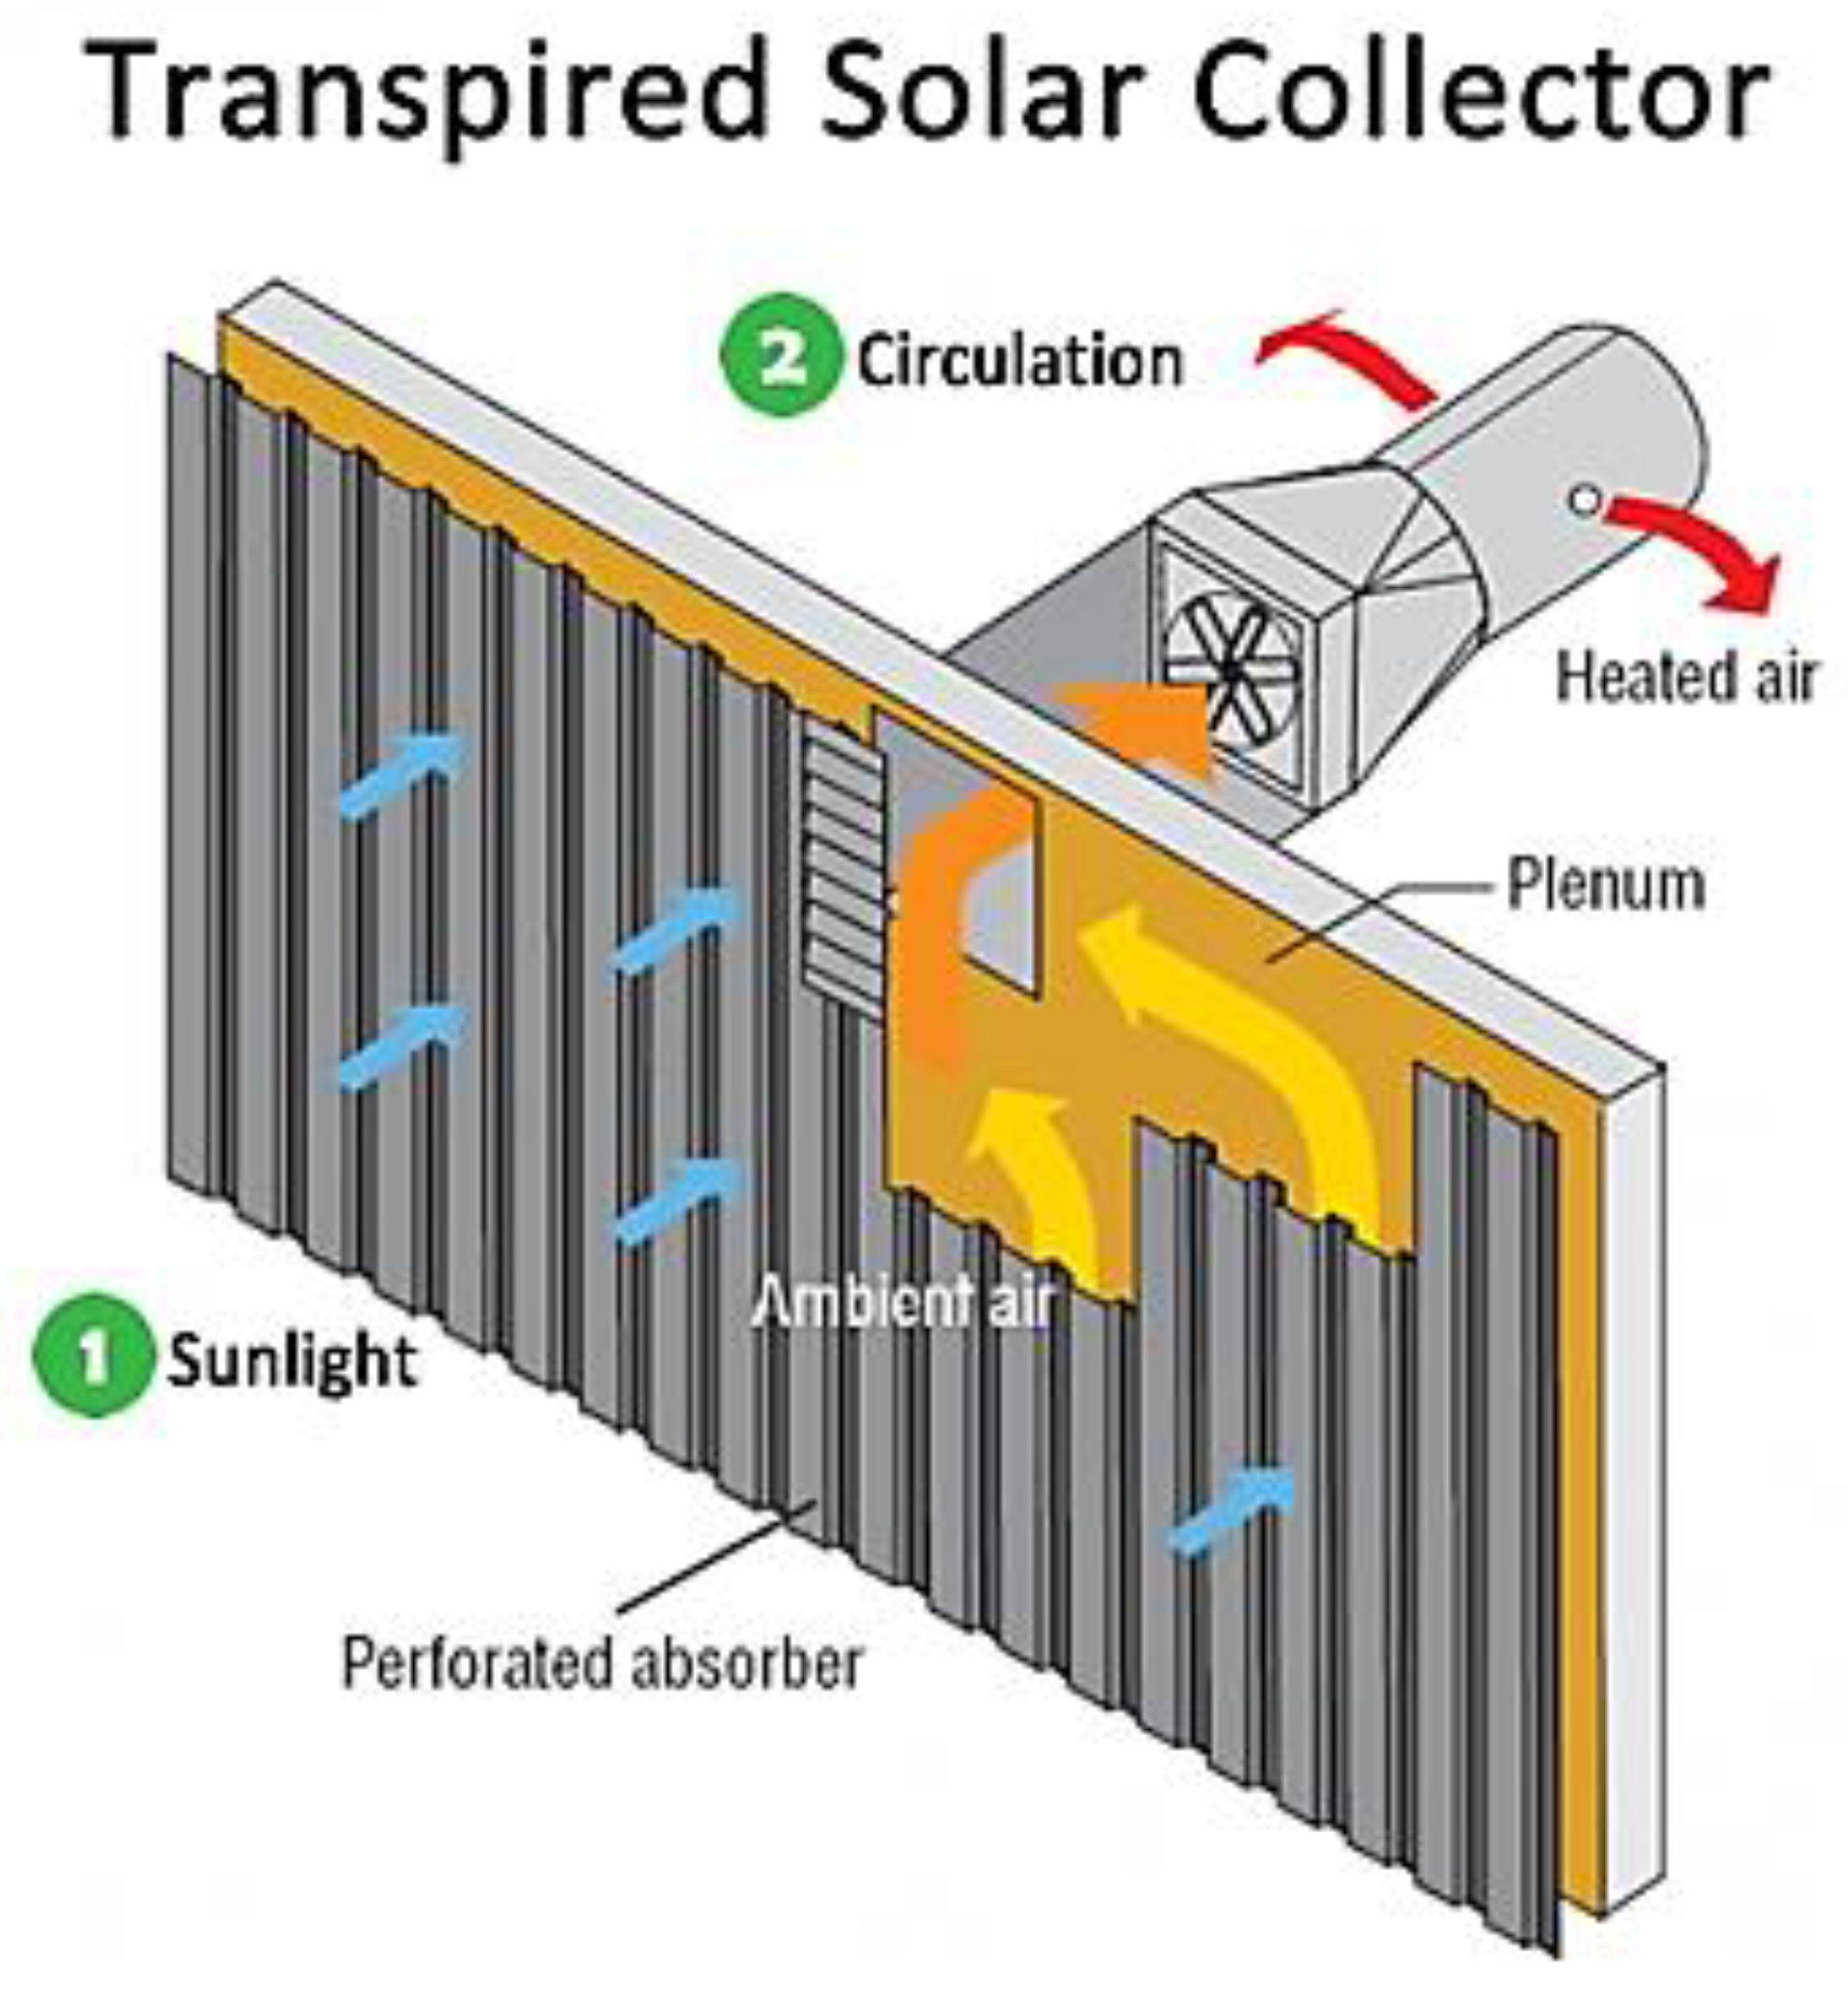
- What is the technological difference between a transpired solar air collector SHIP system and a plate solar air collector SHIP system?
- What does (Low Temperature) SHIP system mean?
- What are the applications for SHIP systems at high temperatures?
- How does the global SHIP capacity compare to the global capacity of renewable energy technologies as power sources?
- Was evacuation a commonly adopted feature in flat plate collectors in 2024?
- What was the average collector area of an unglazed solar collector in 2024?
- What was the total number of SHIP projects in 2024?
- How big is the disparity in terms of project size among SHIP designs?
- What was the 2024 distribution of new SHIP collector areas by type?
- What was the total collector area of SHIP systems in 2024?
3. Results (Part 1: SHIP Designs)
3.1. Overview of Solar Collectors
3.2. SHIP Applications
3.3. Some Published Works
3.4. SAC (Solar Air Collector)
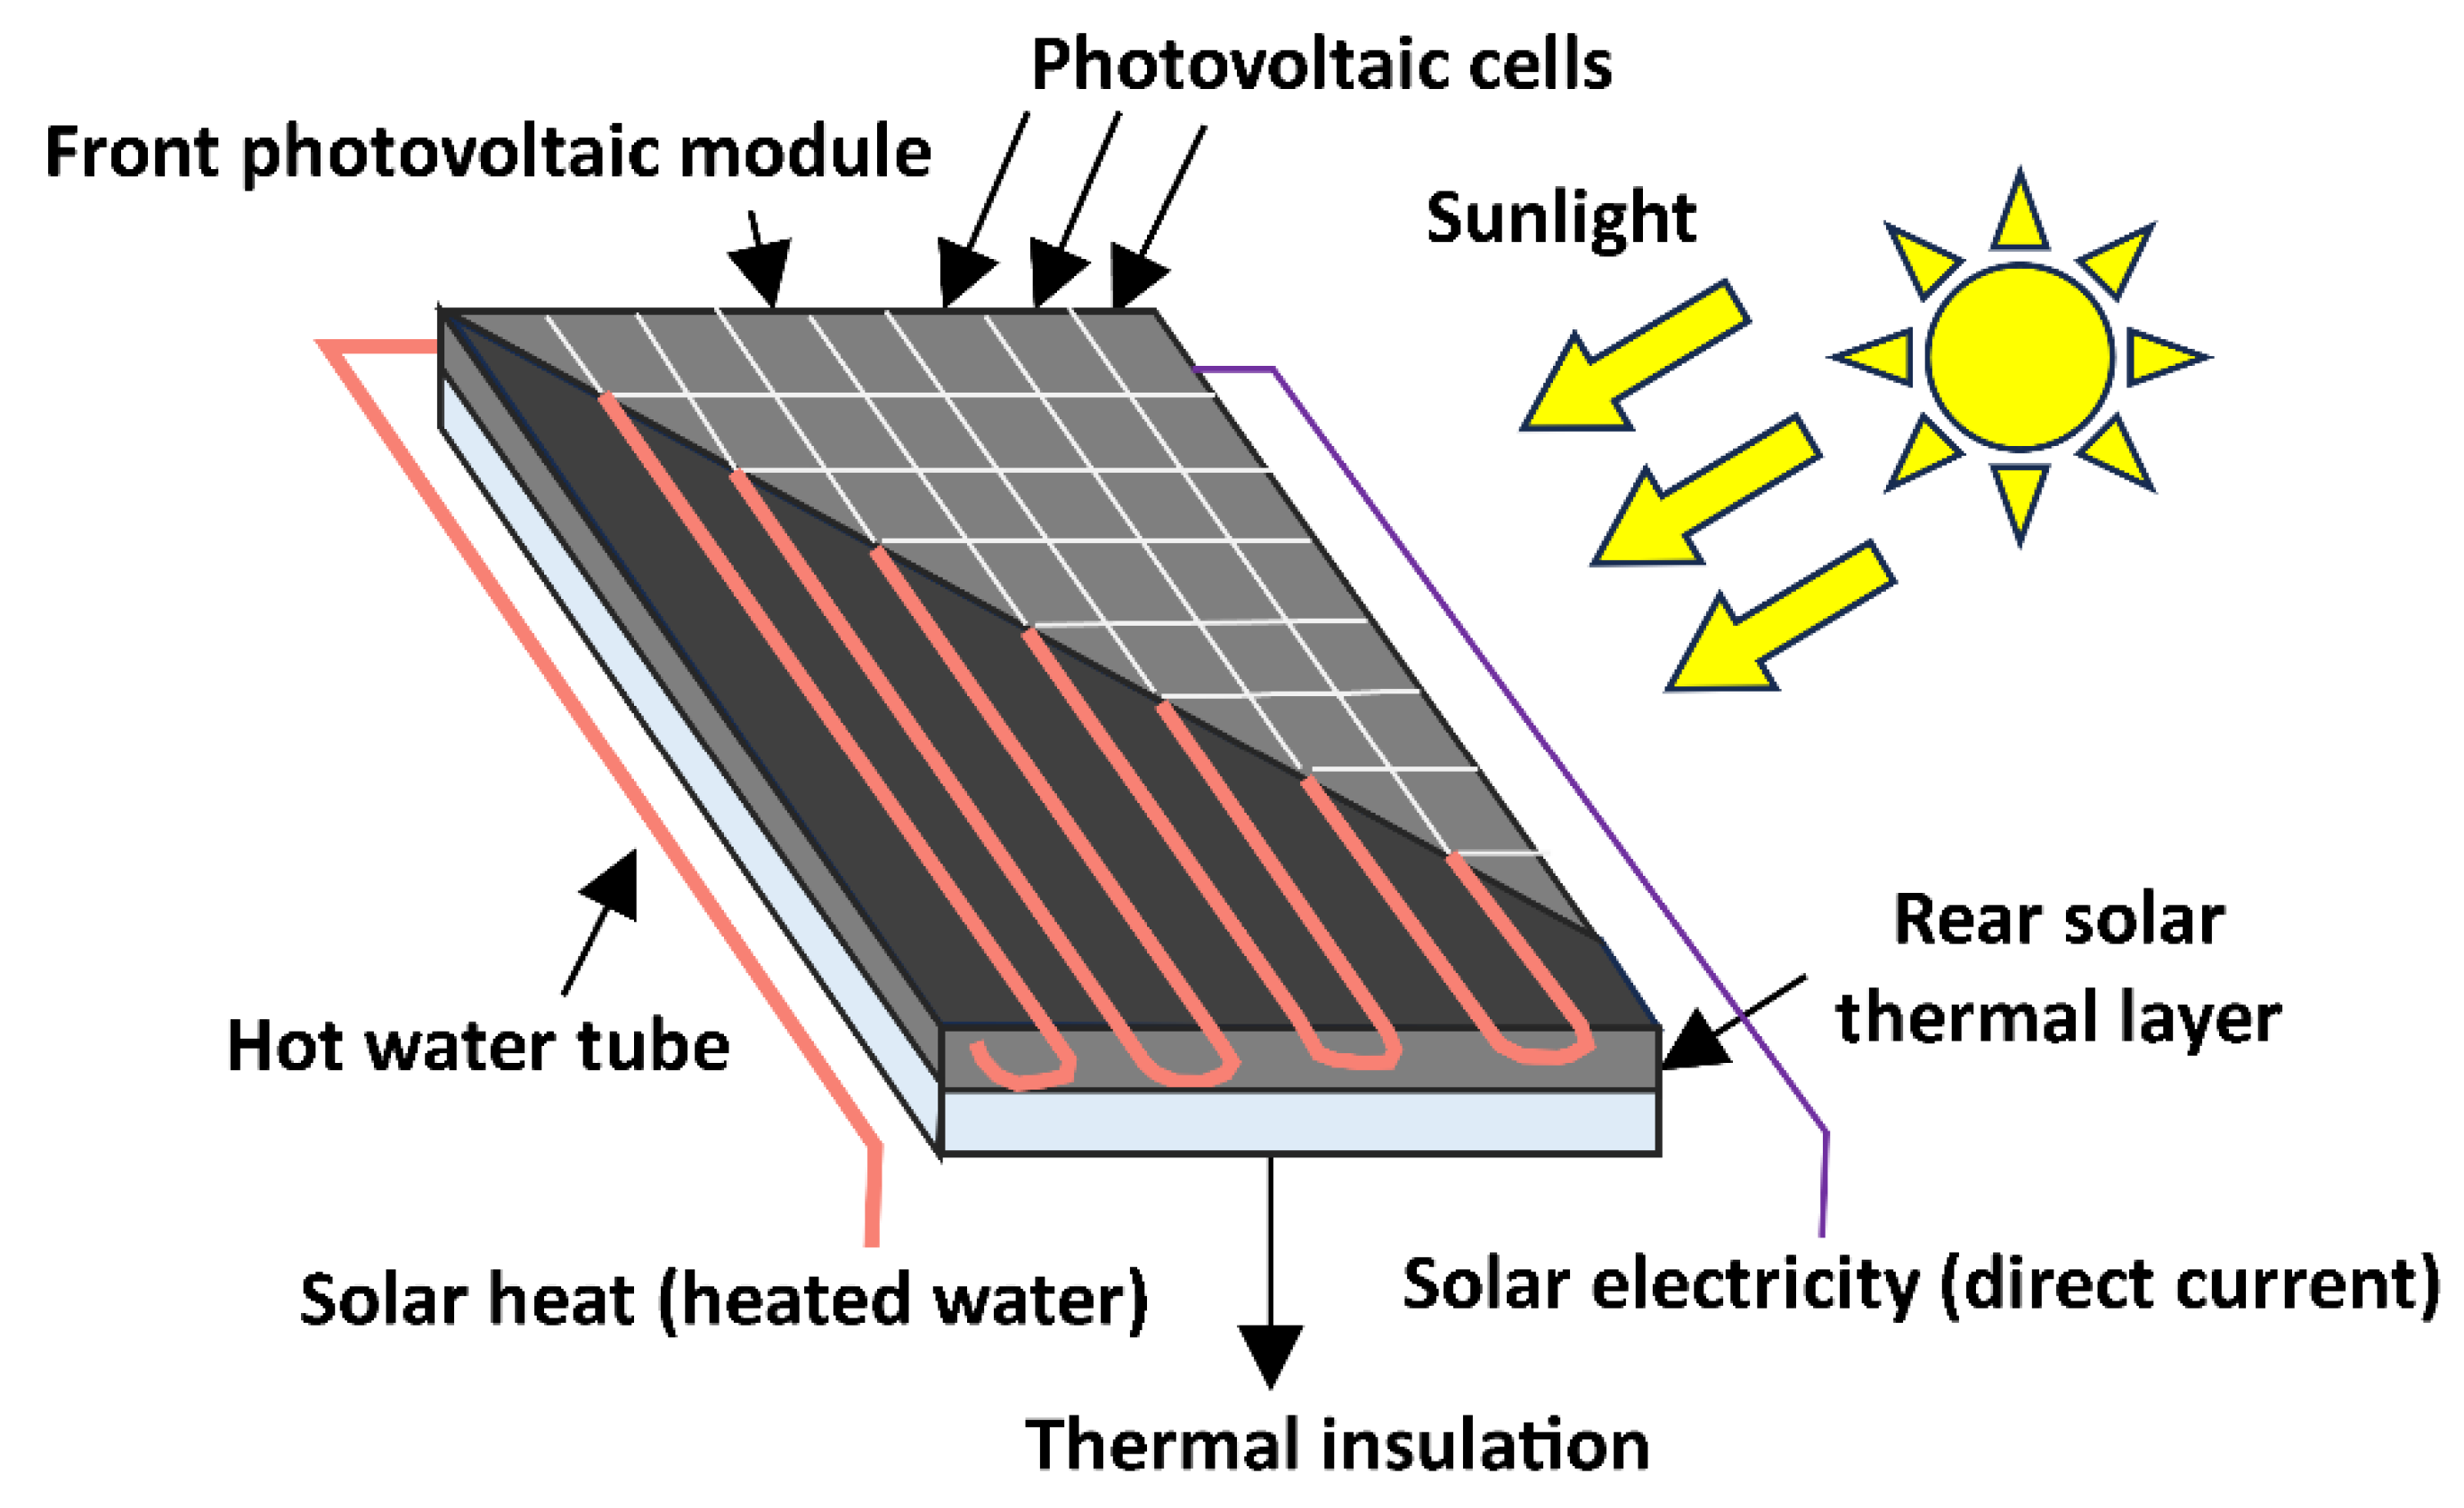
3.5. PVT (Photovoltaic-Thermal)
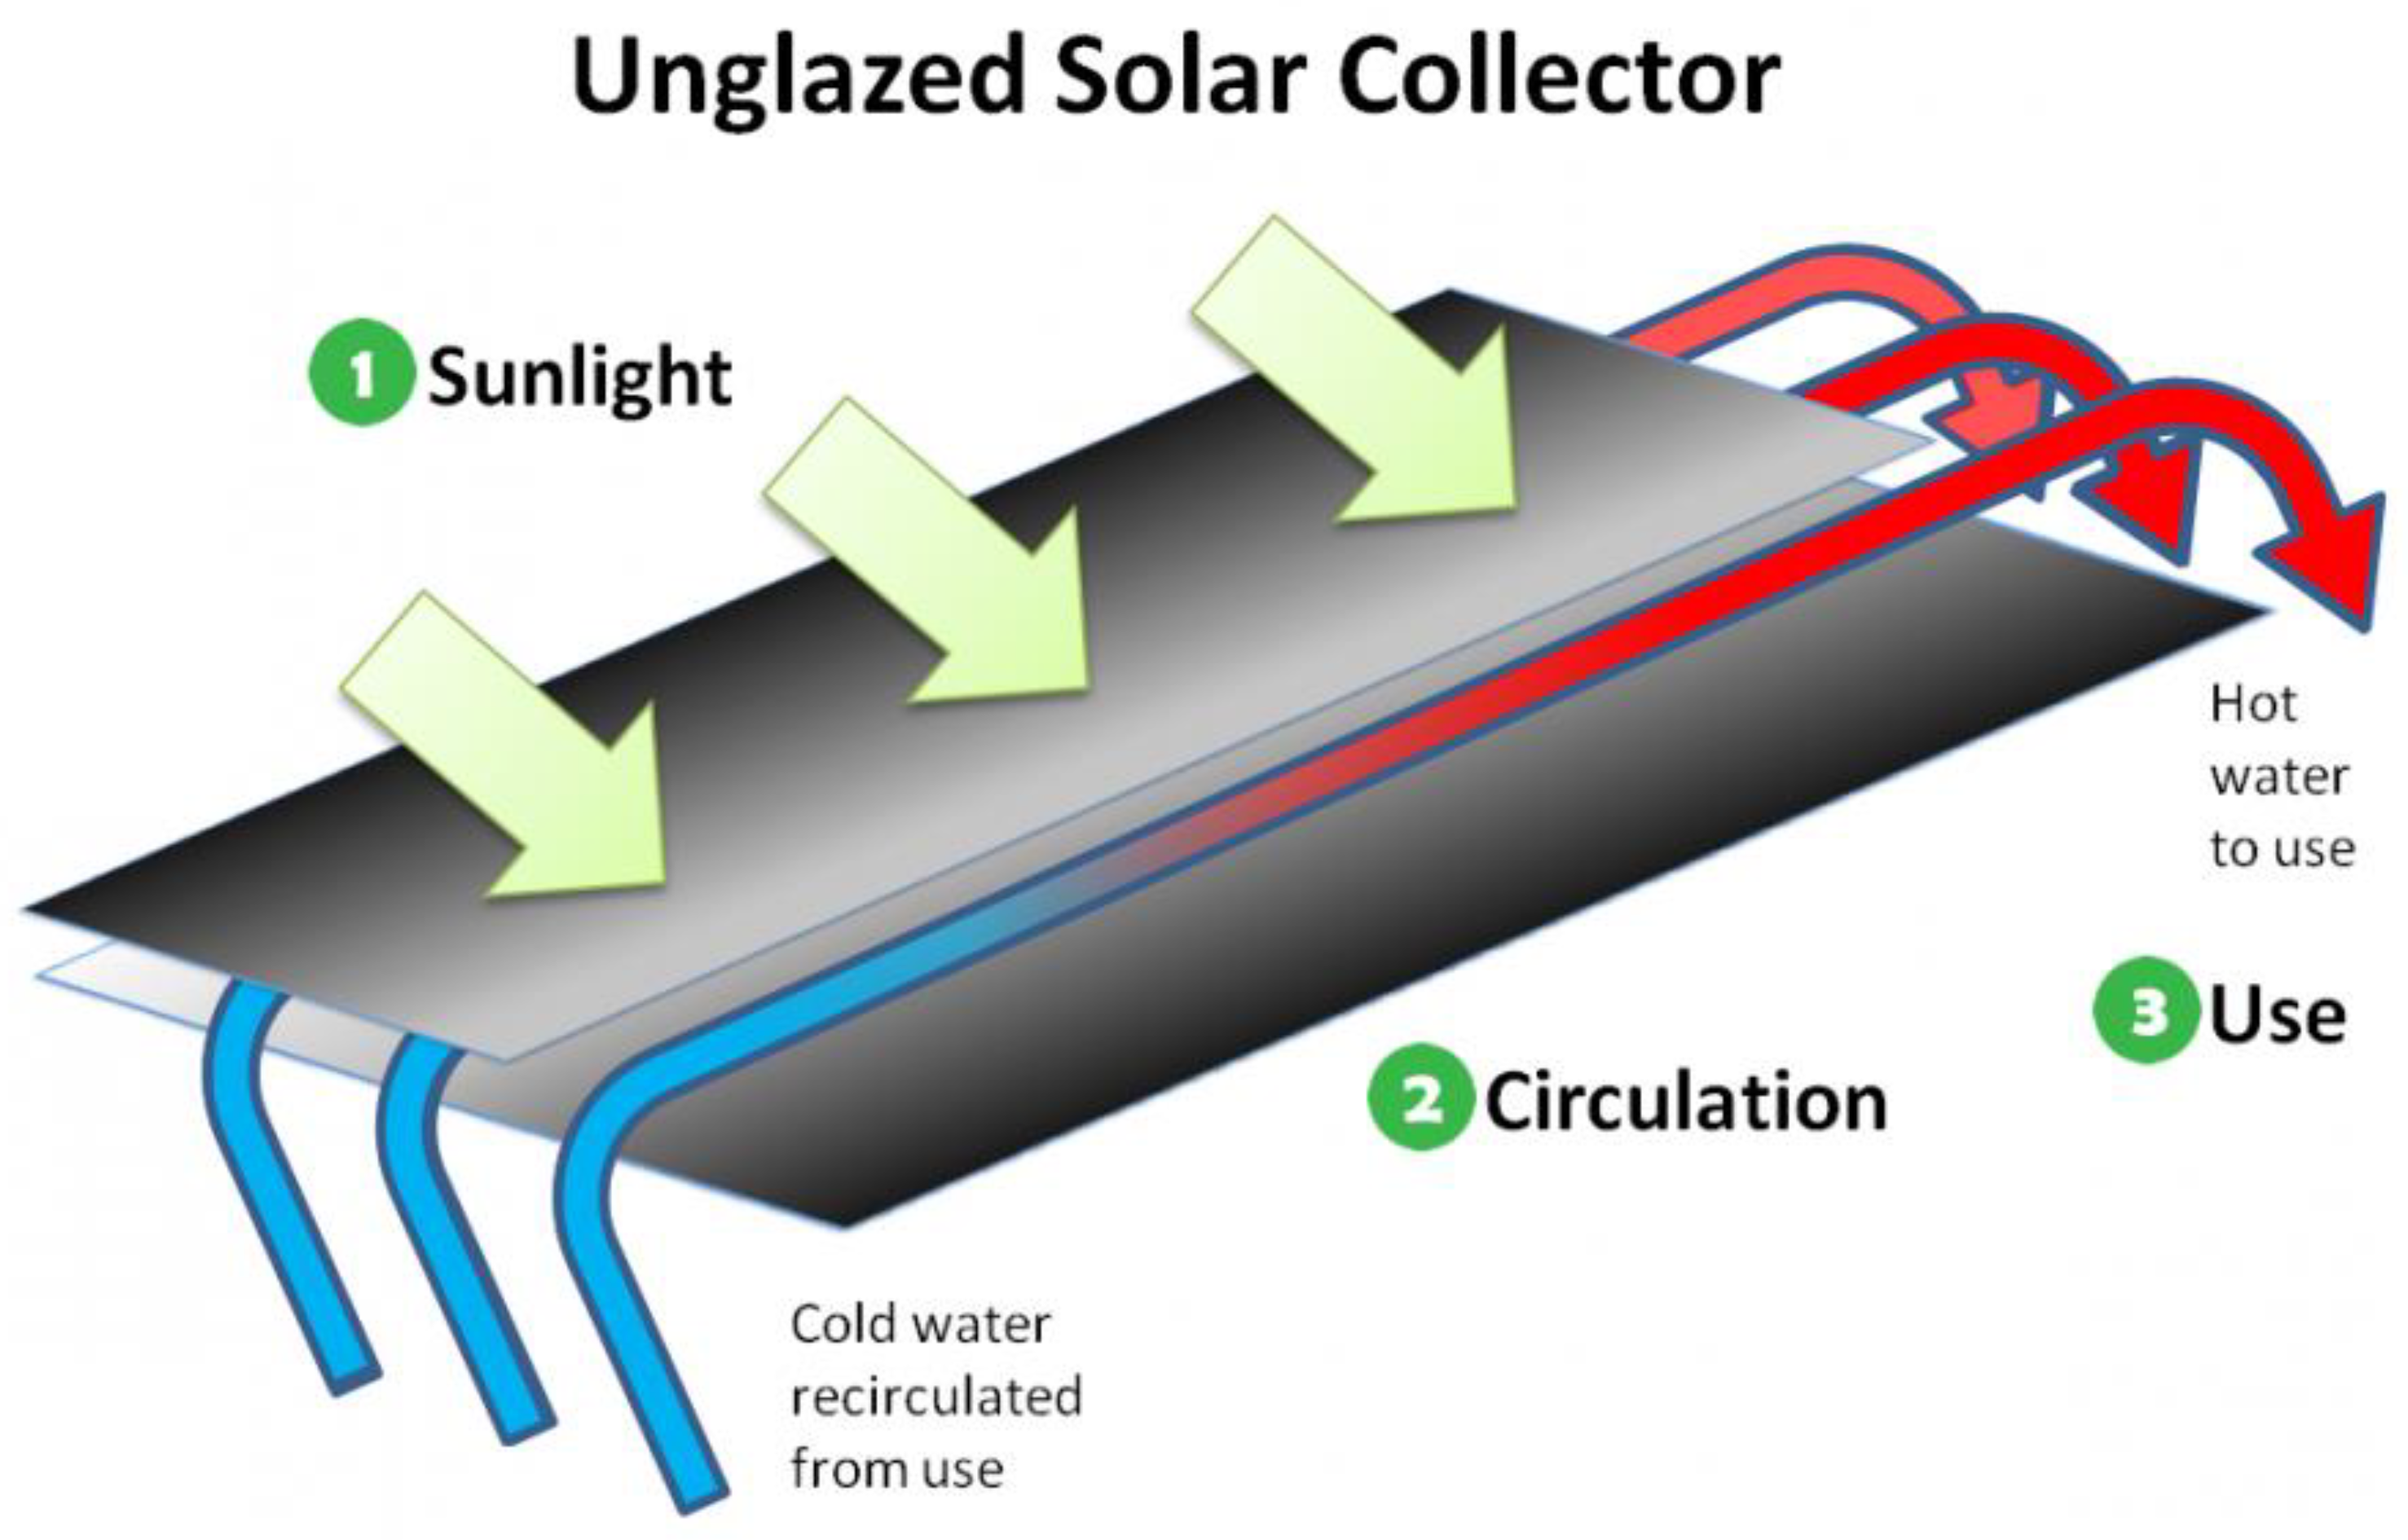
3.6. USC (Unglazed Solar Collector)
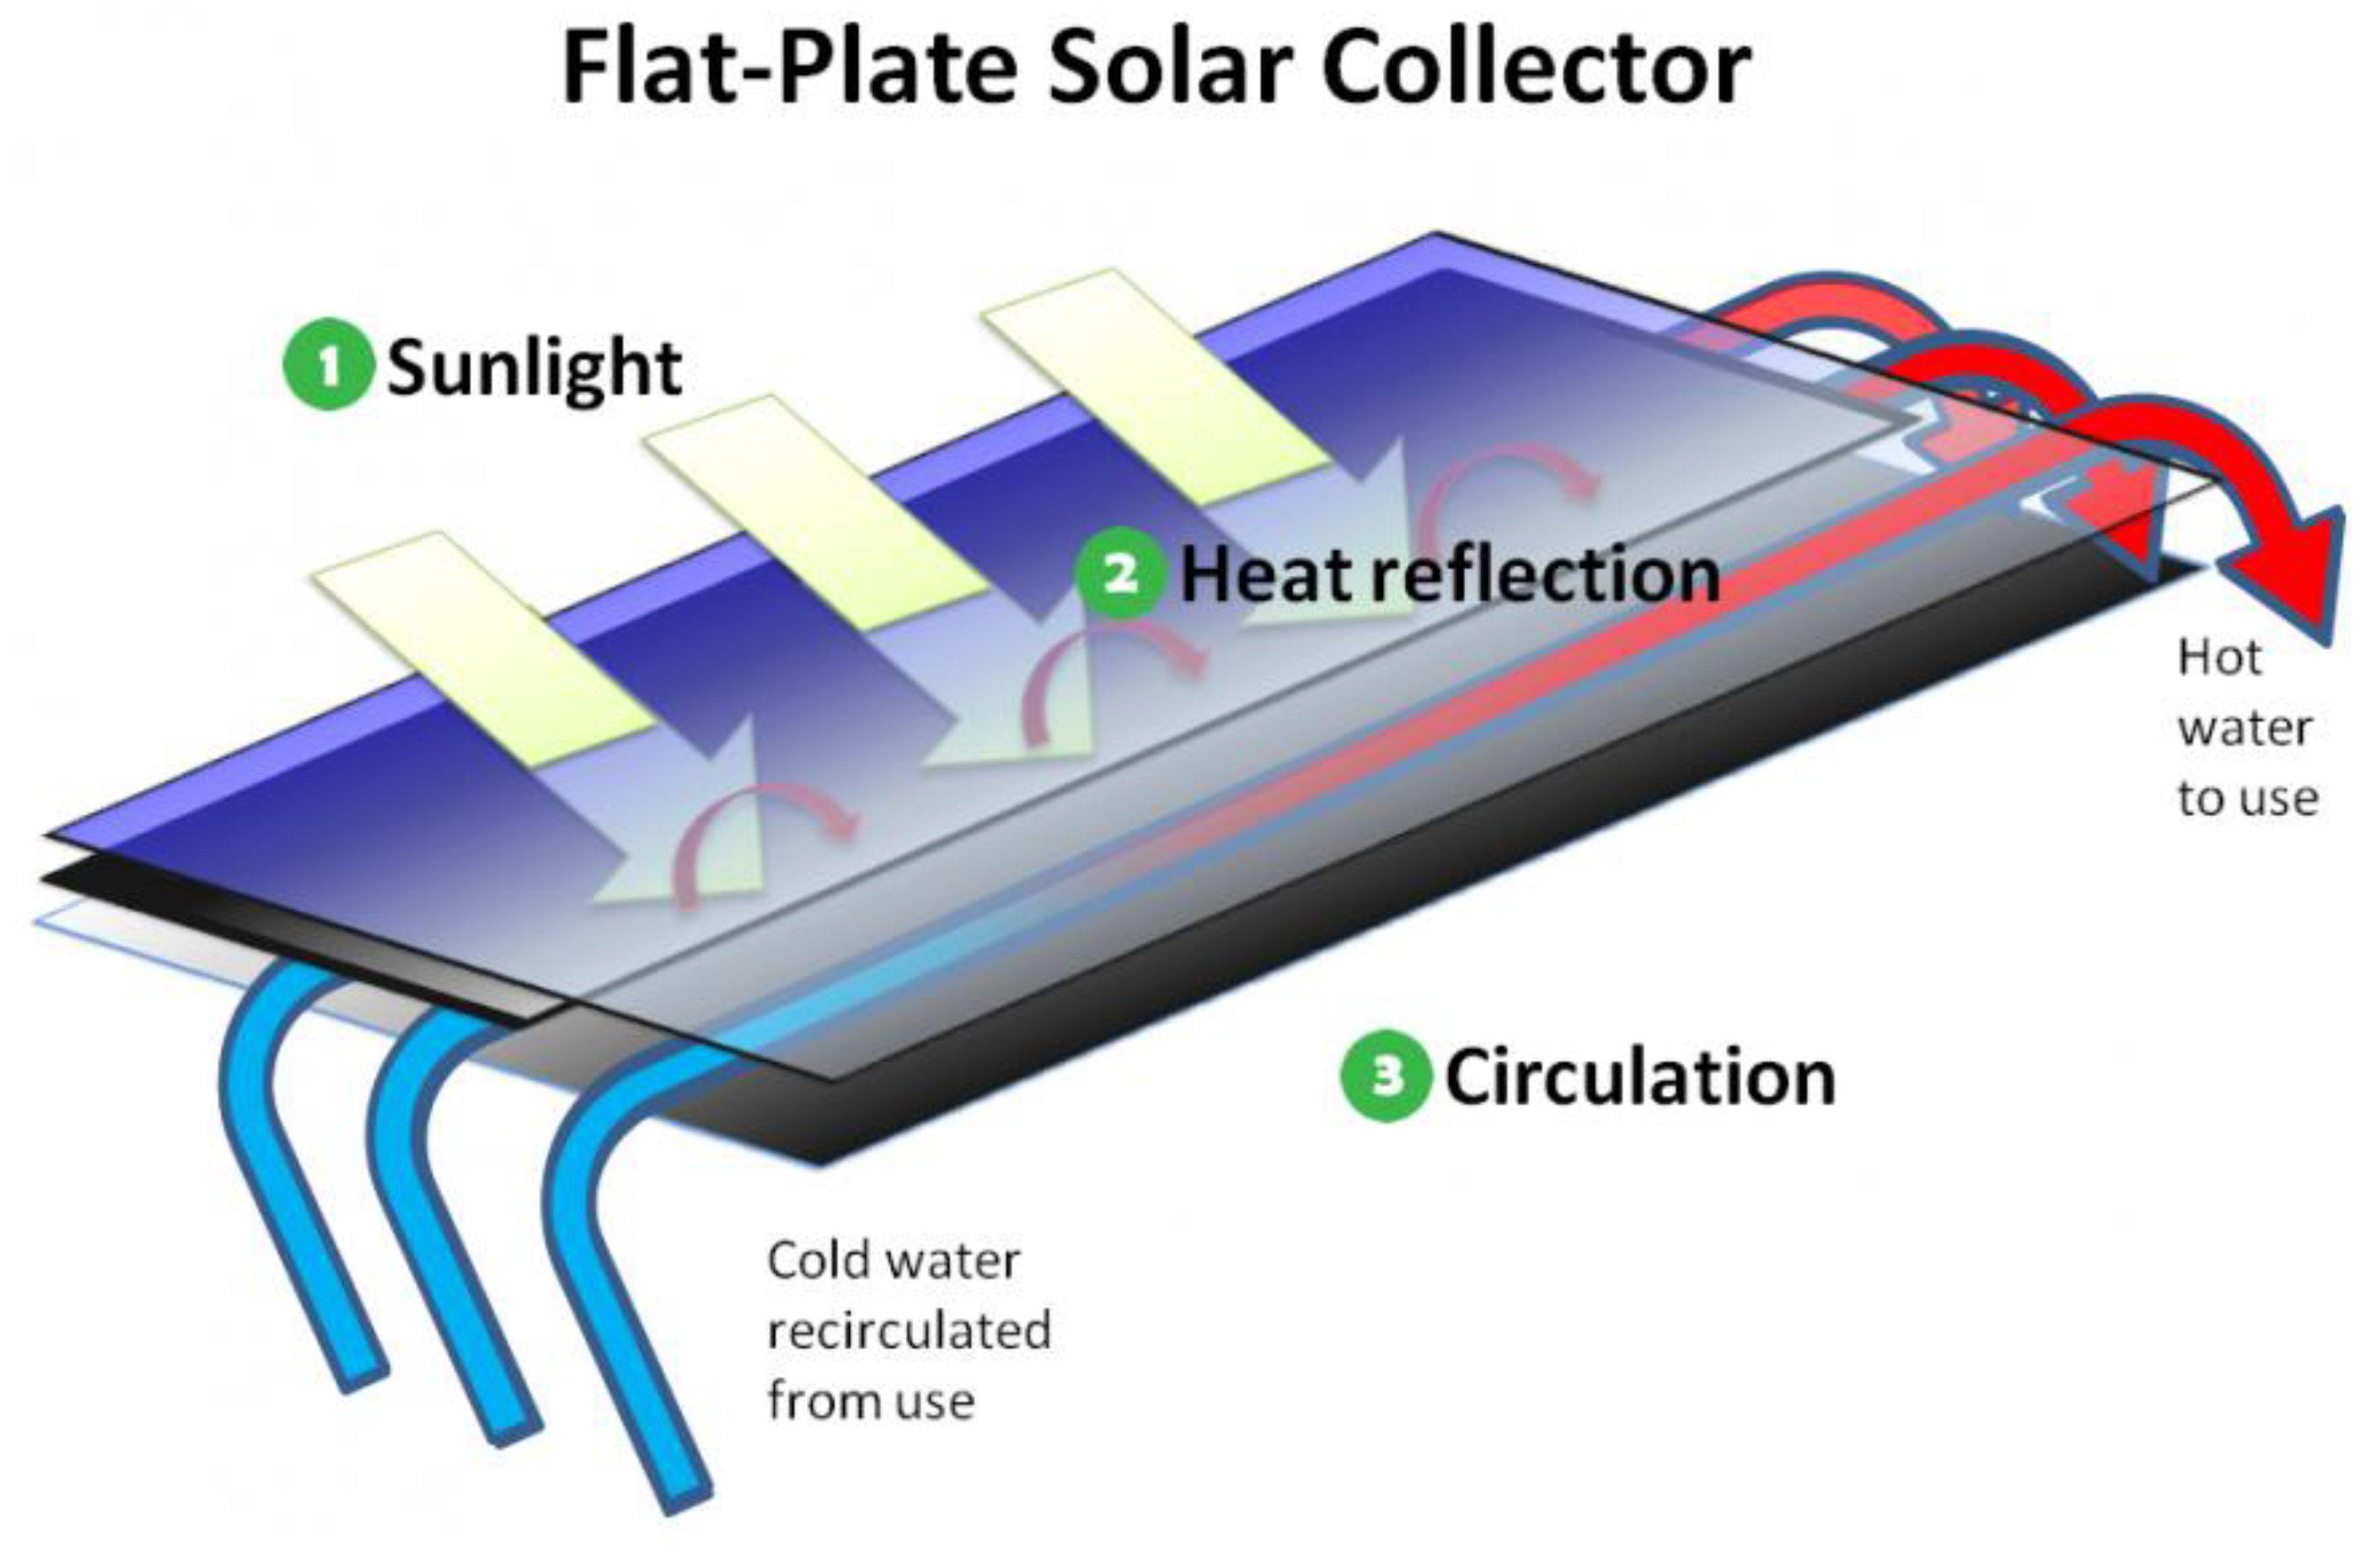
3.7. FPC (Flat Plate Collector)
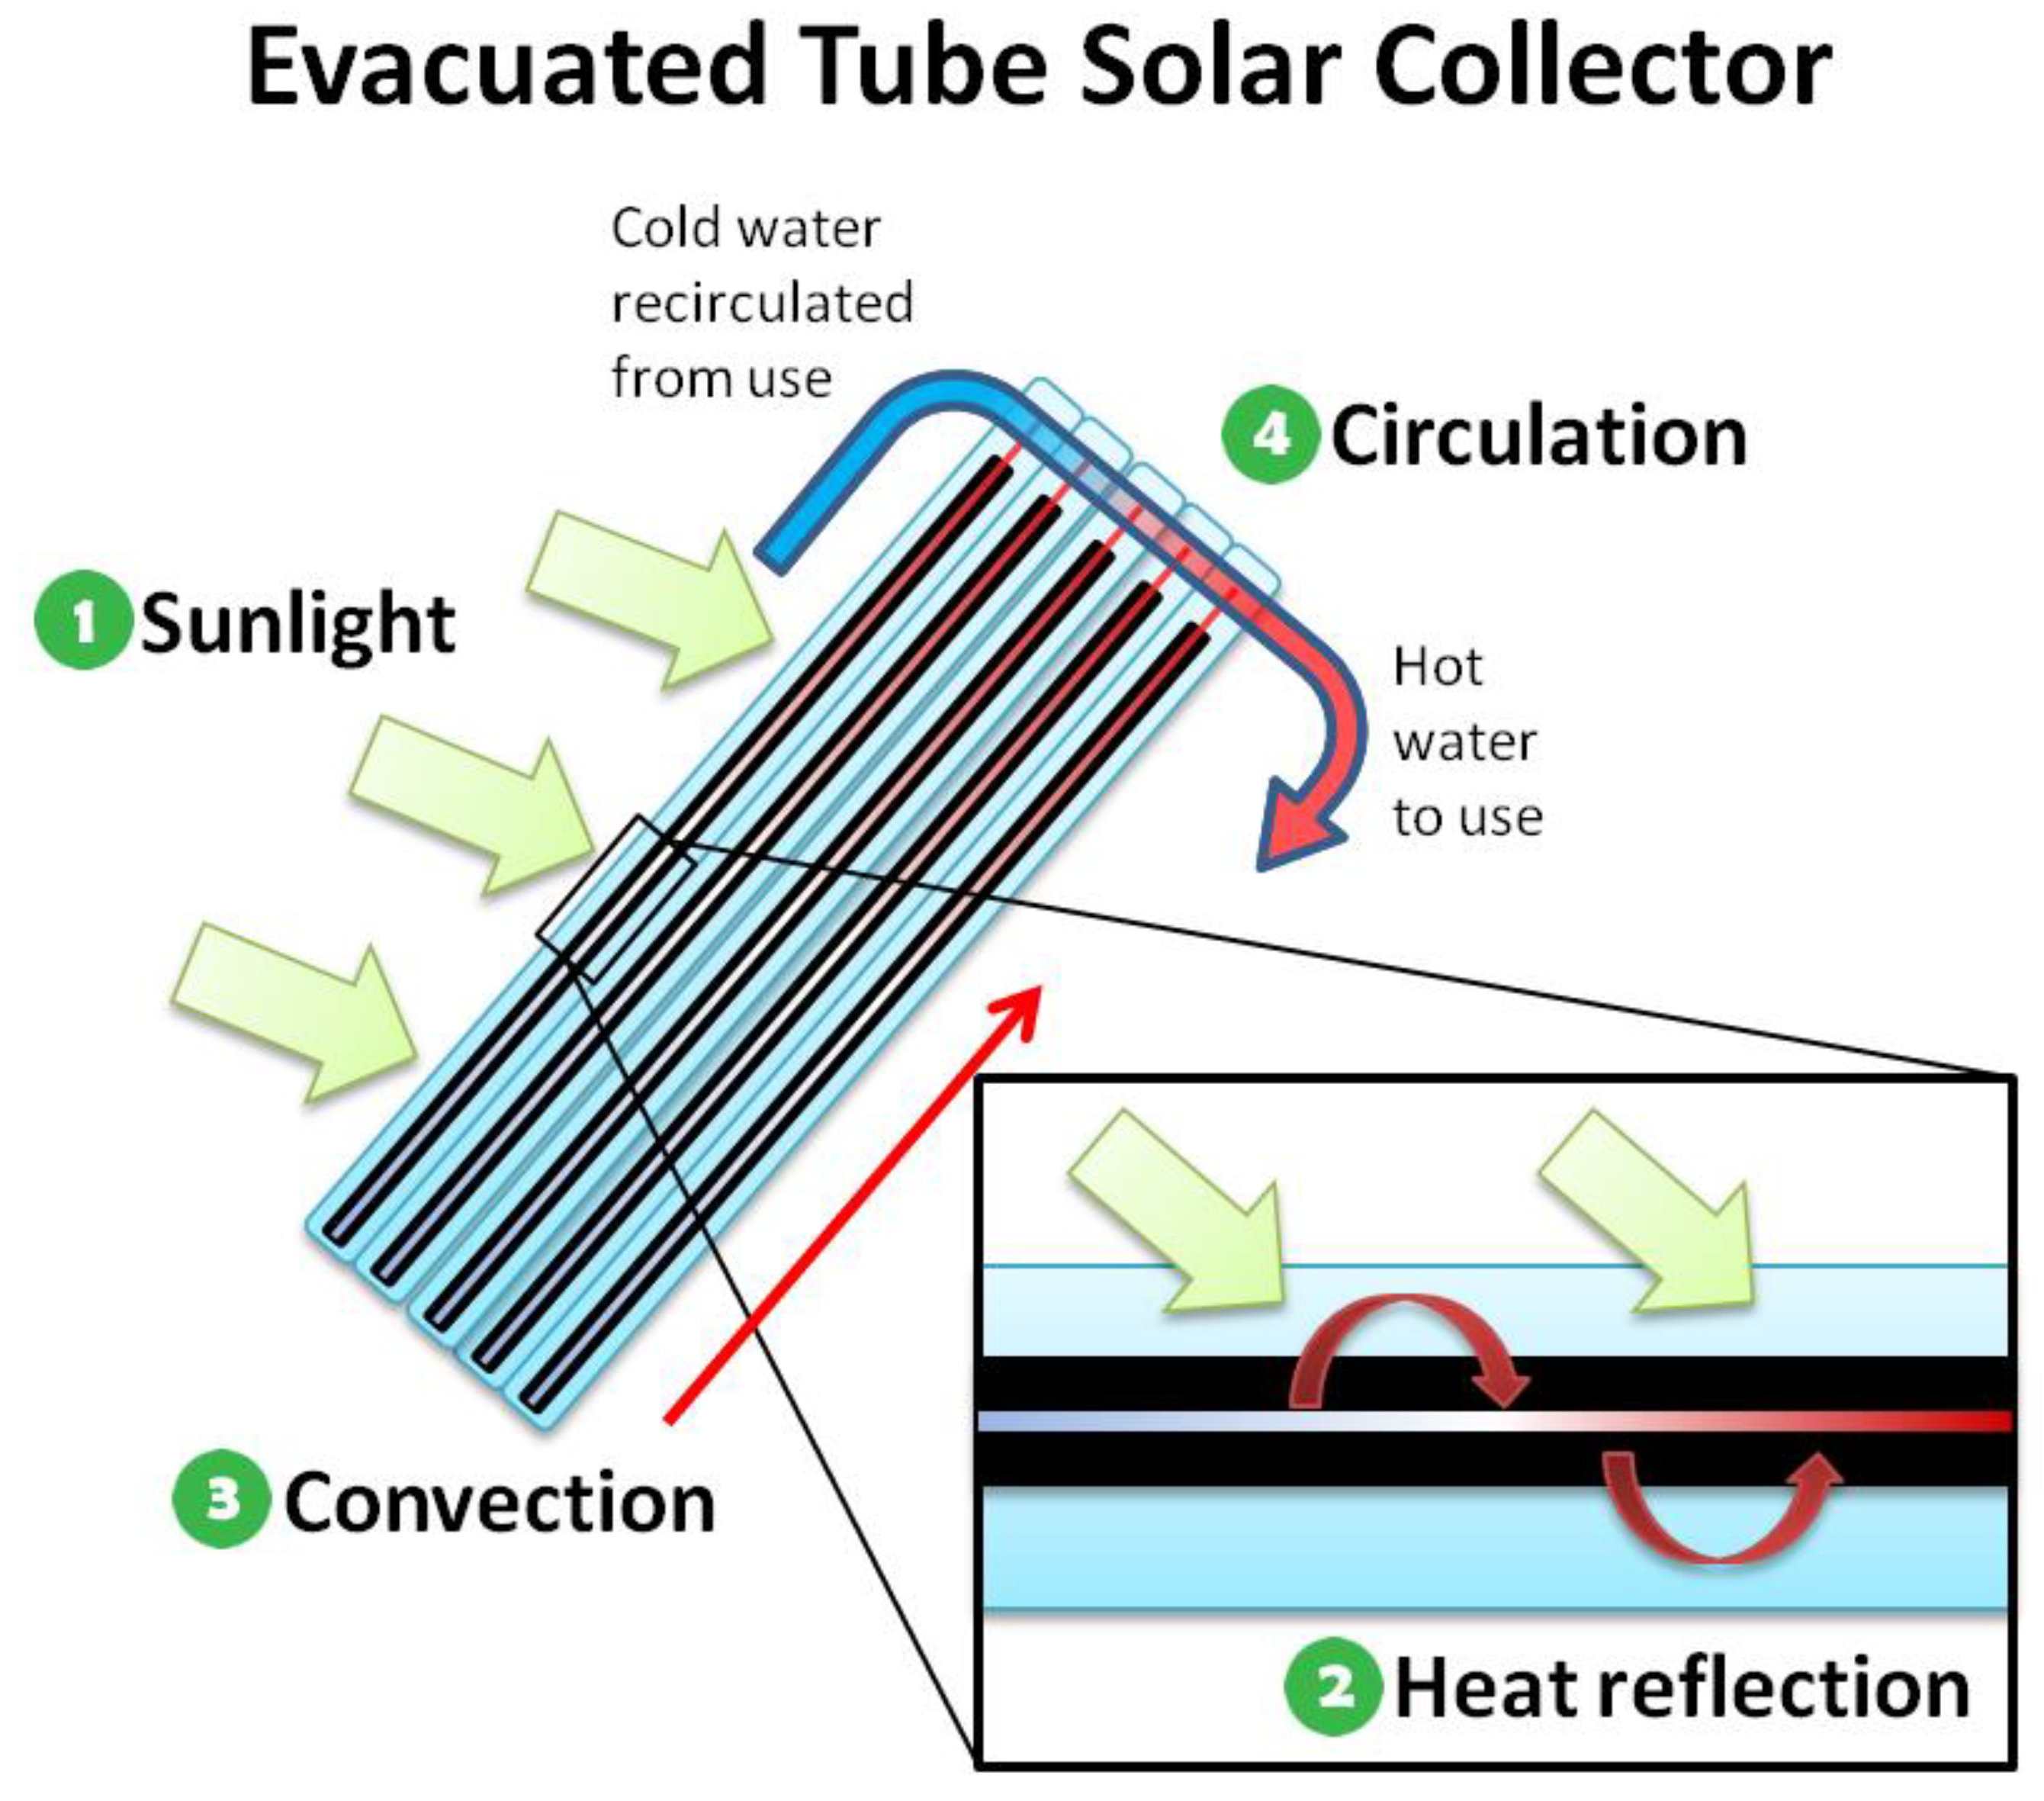
3.8. ETC (Evacuated Tube Collectors)
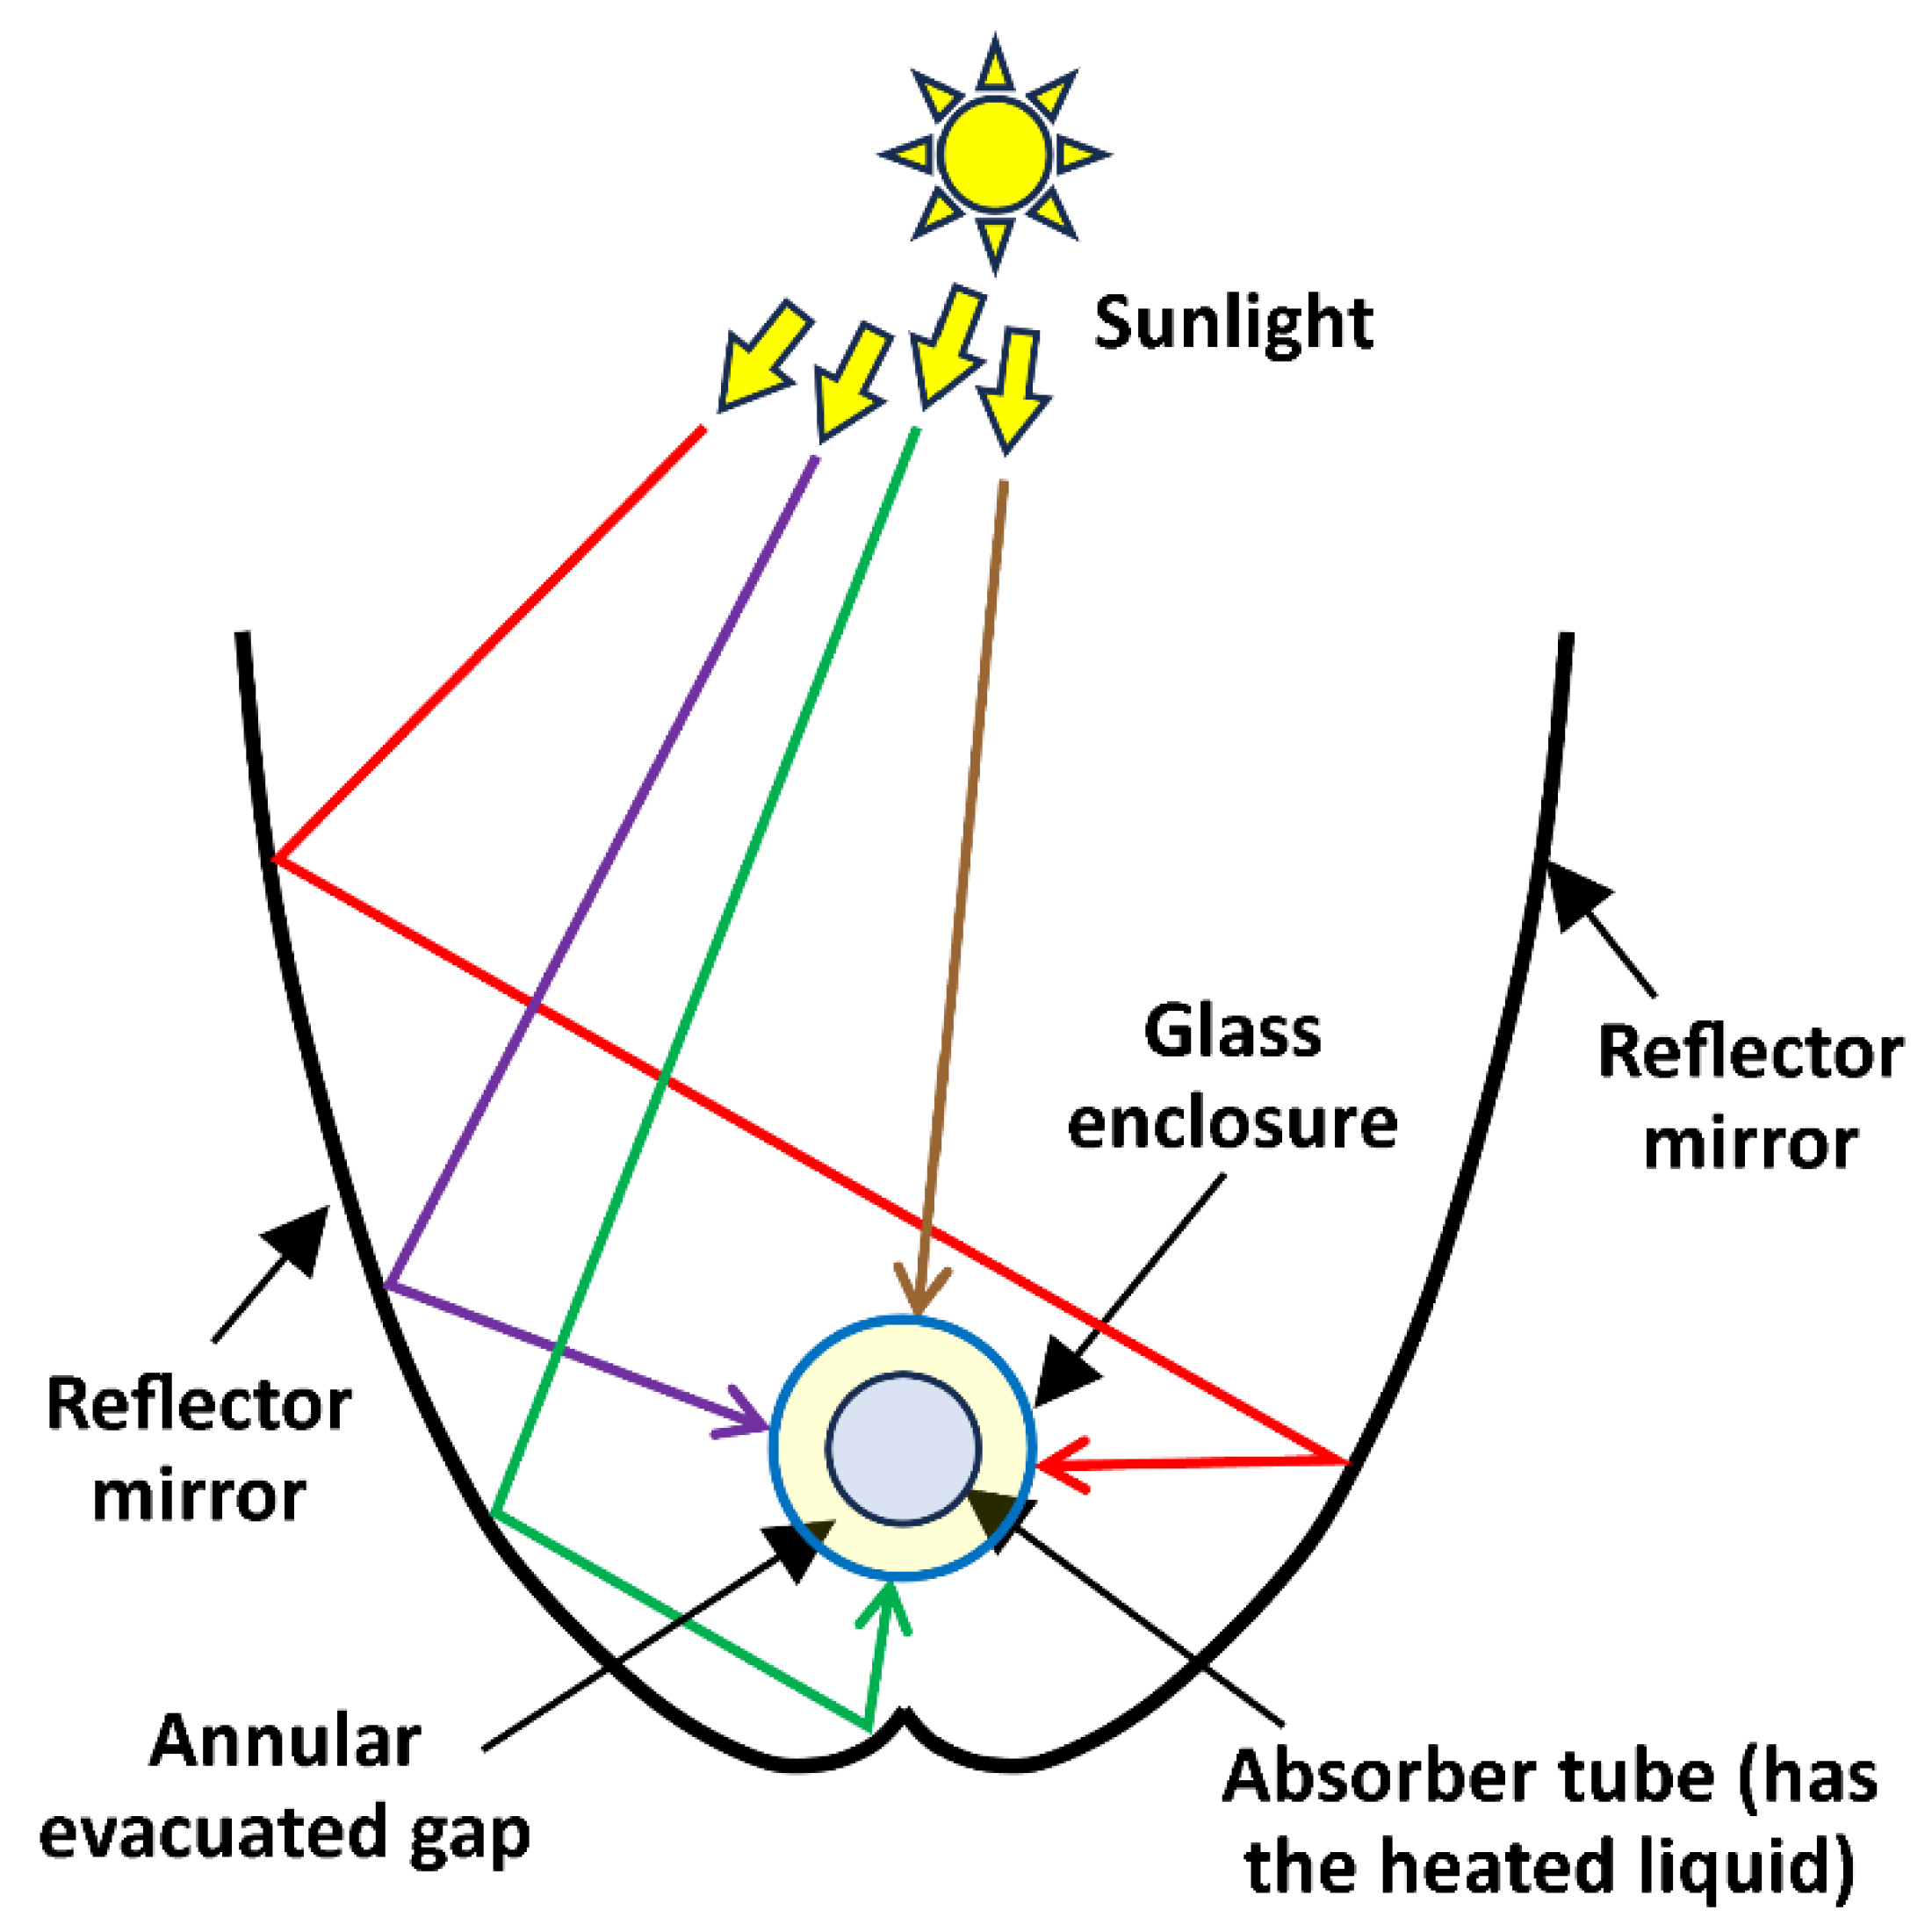
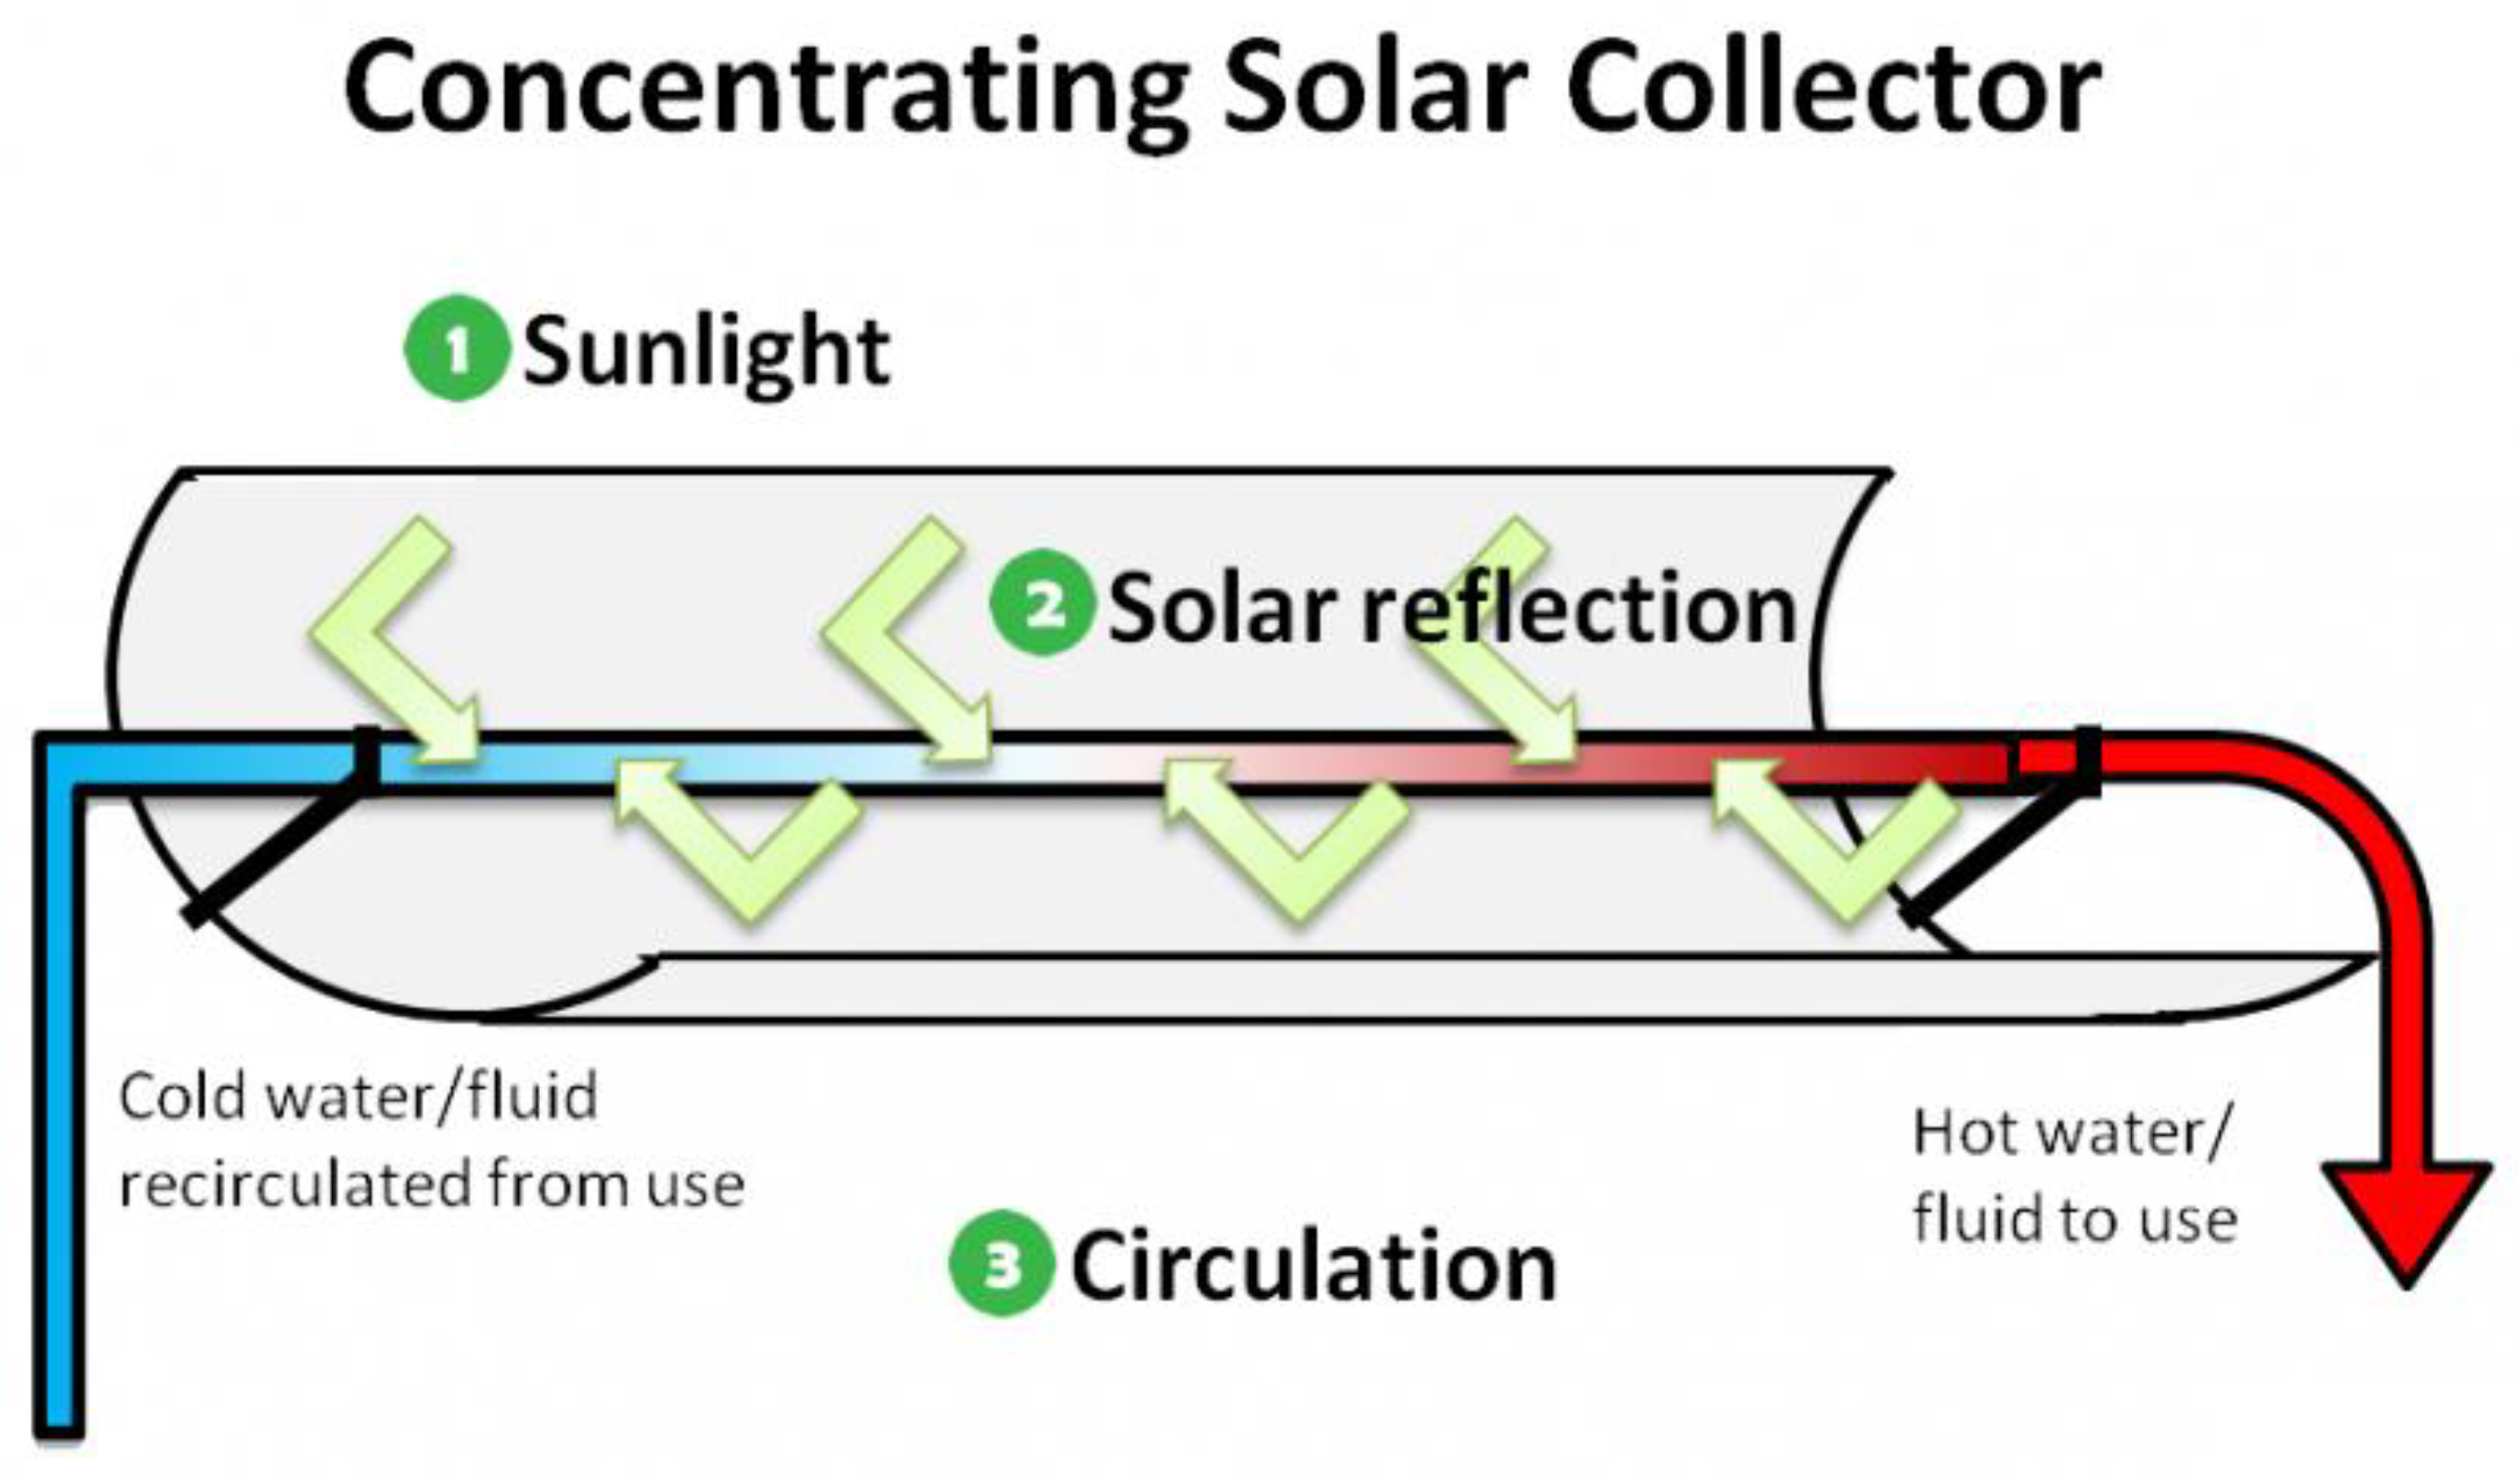
3.9. PTC (Parabolic Trough Collector)
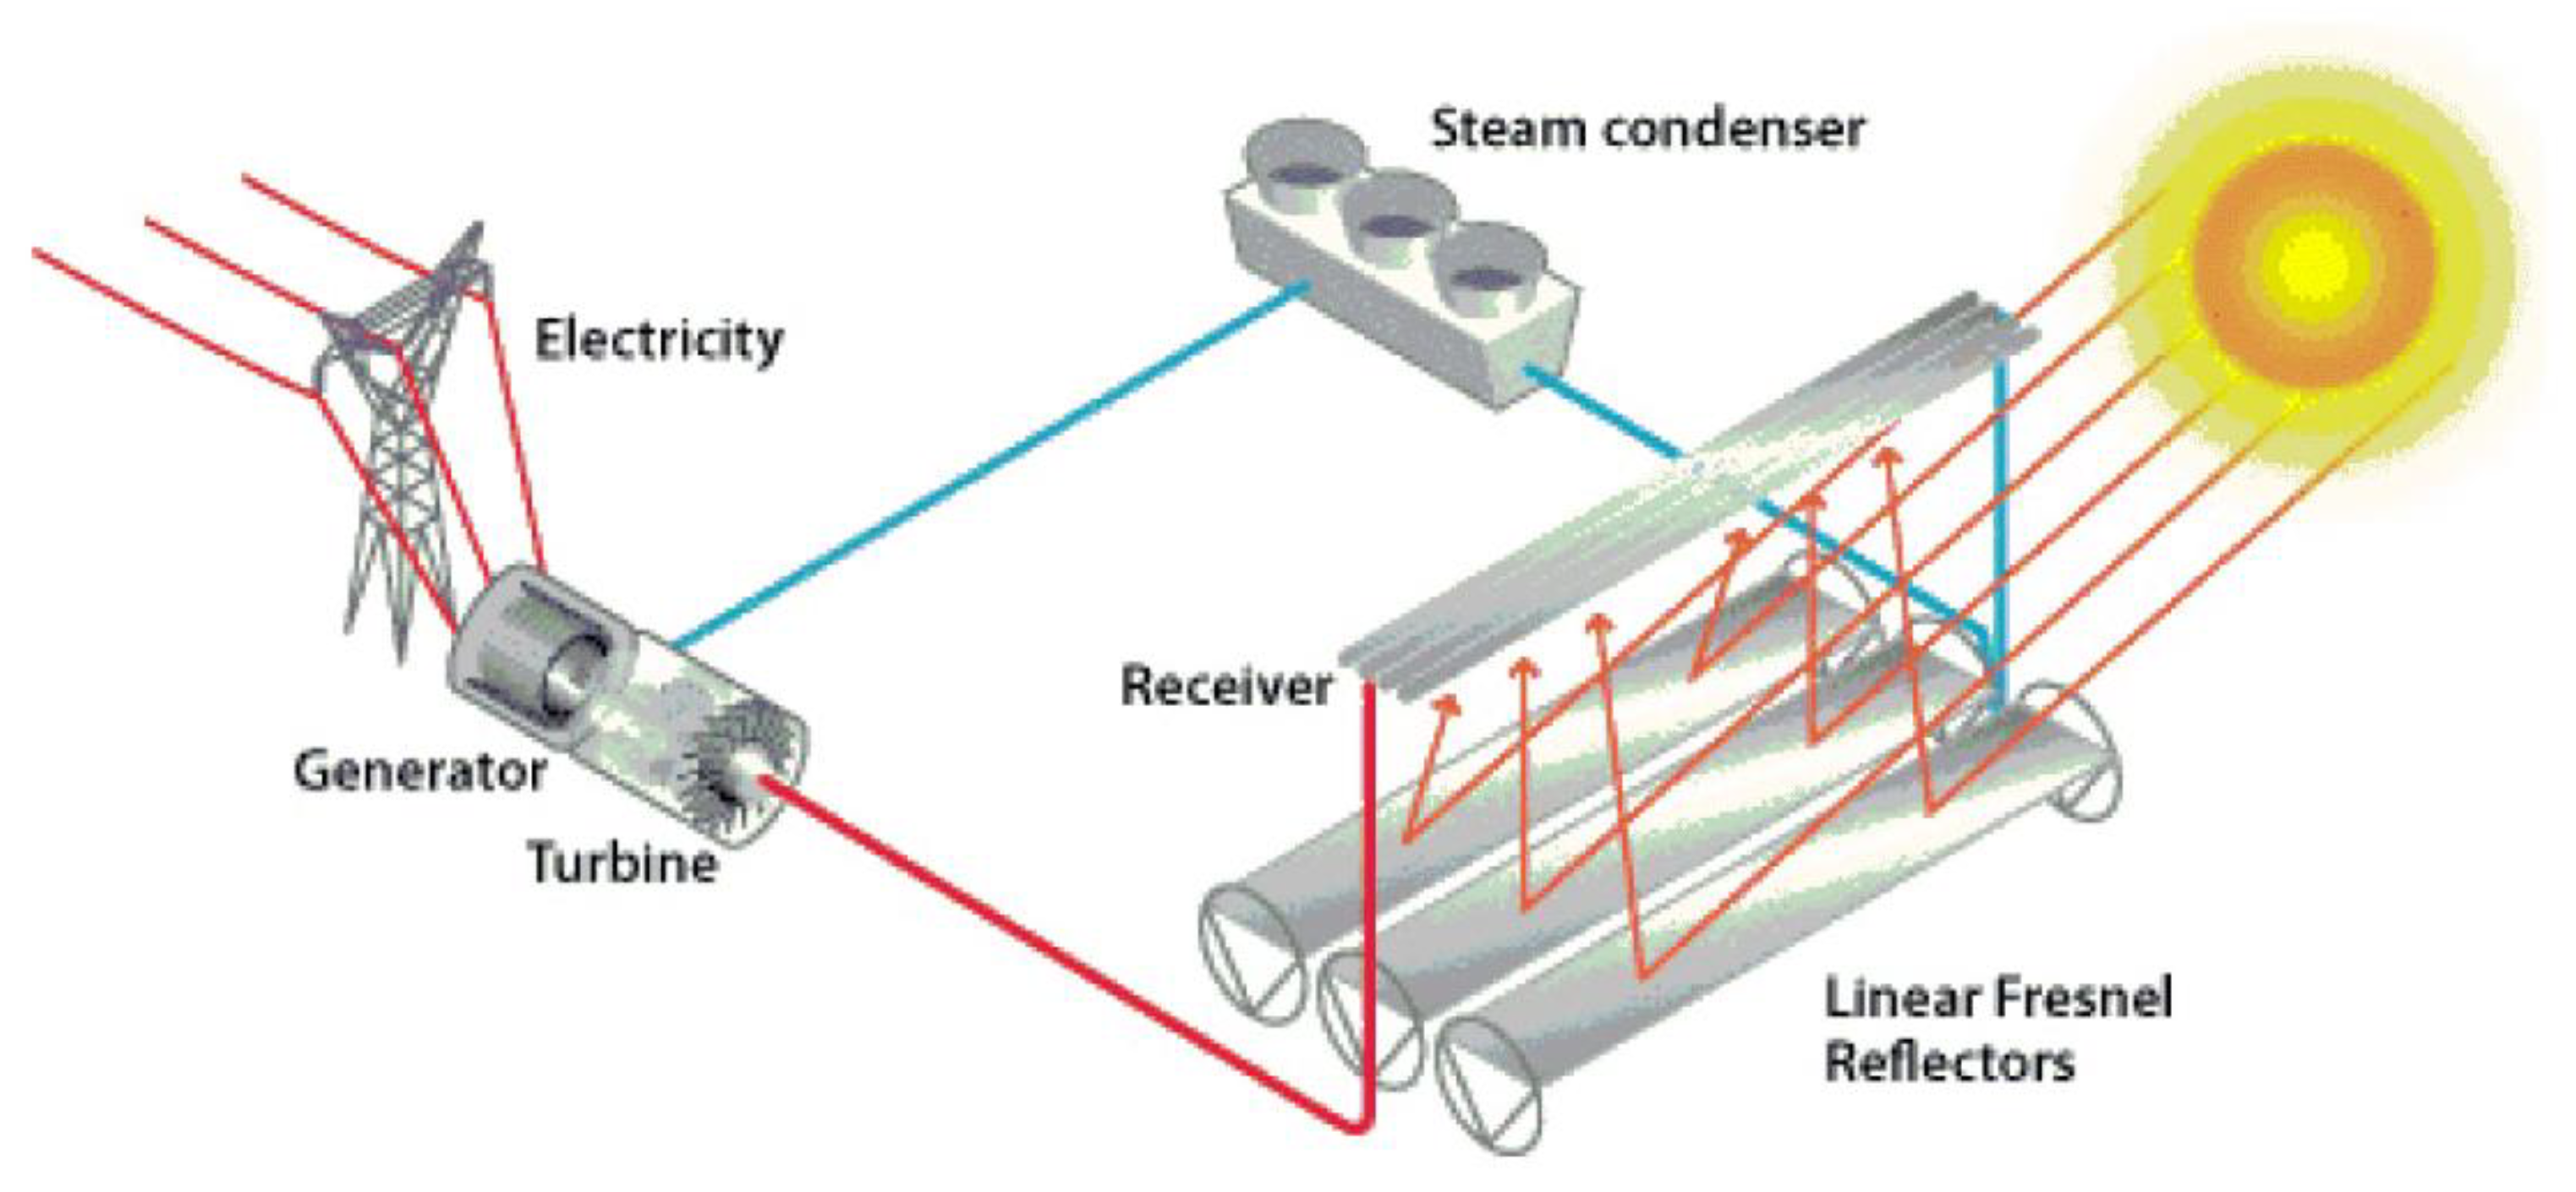
3.10. LFR (Linear Fresnel Reflector)
3.11. PDC (Parabolic Dish Collector)
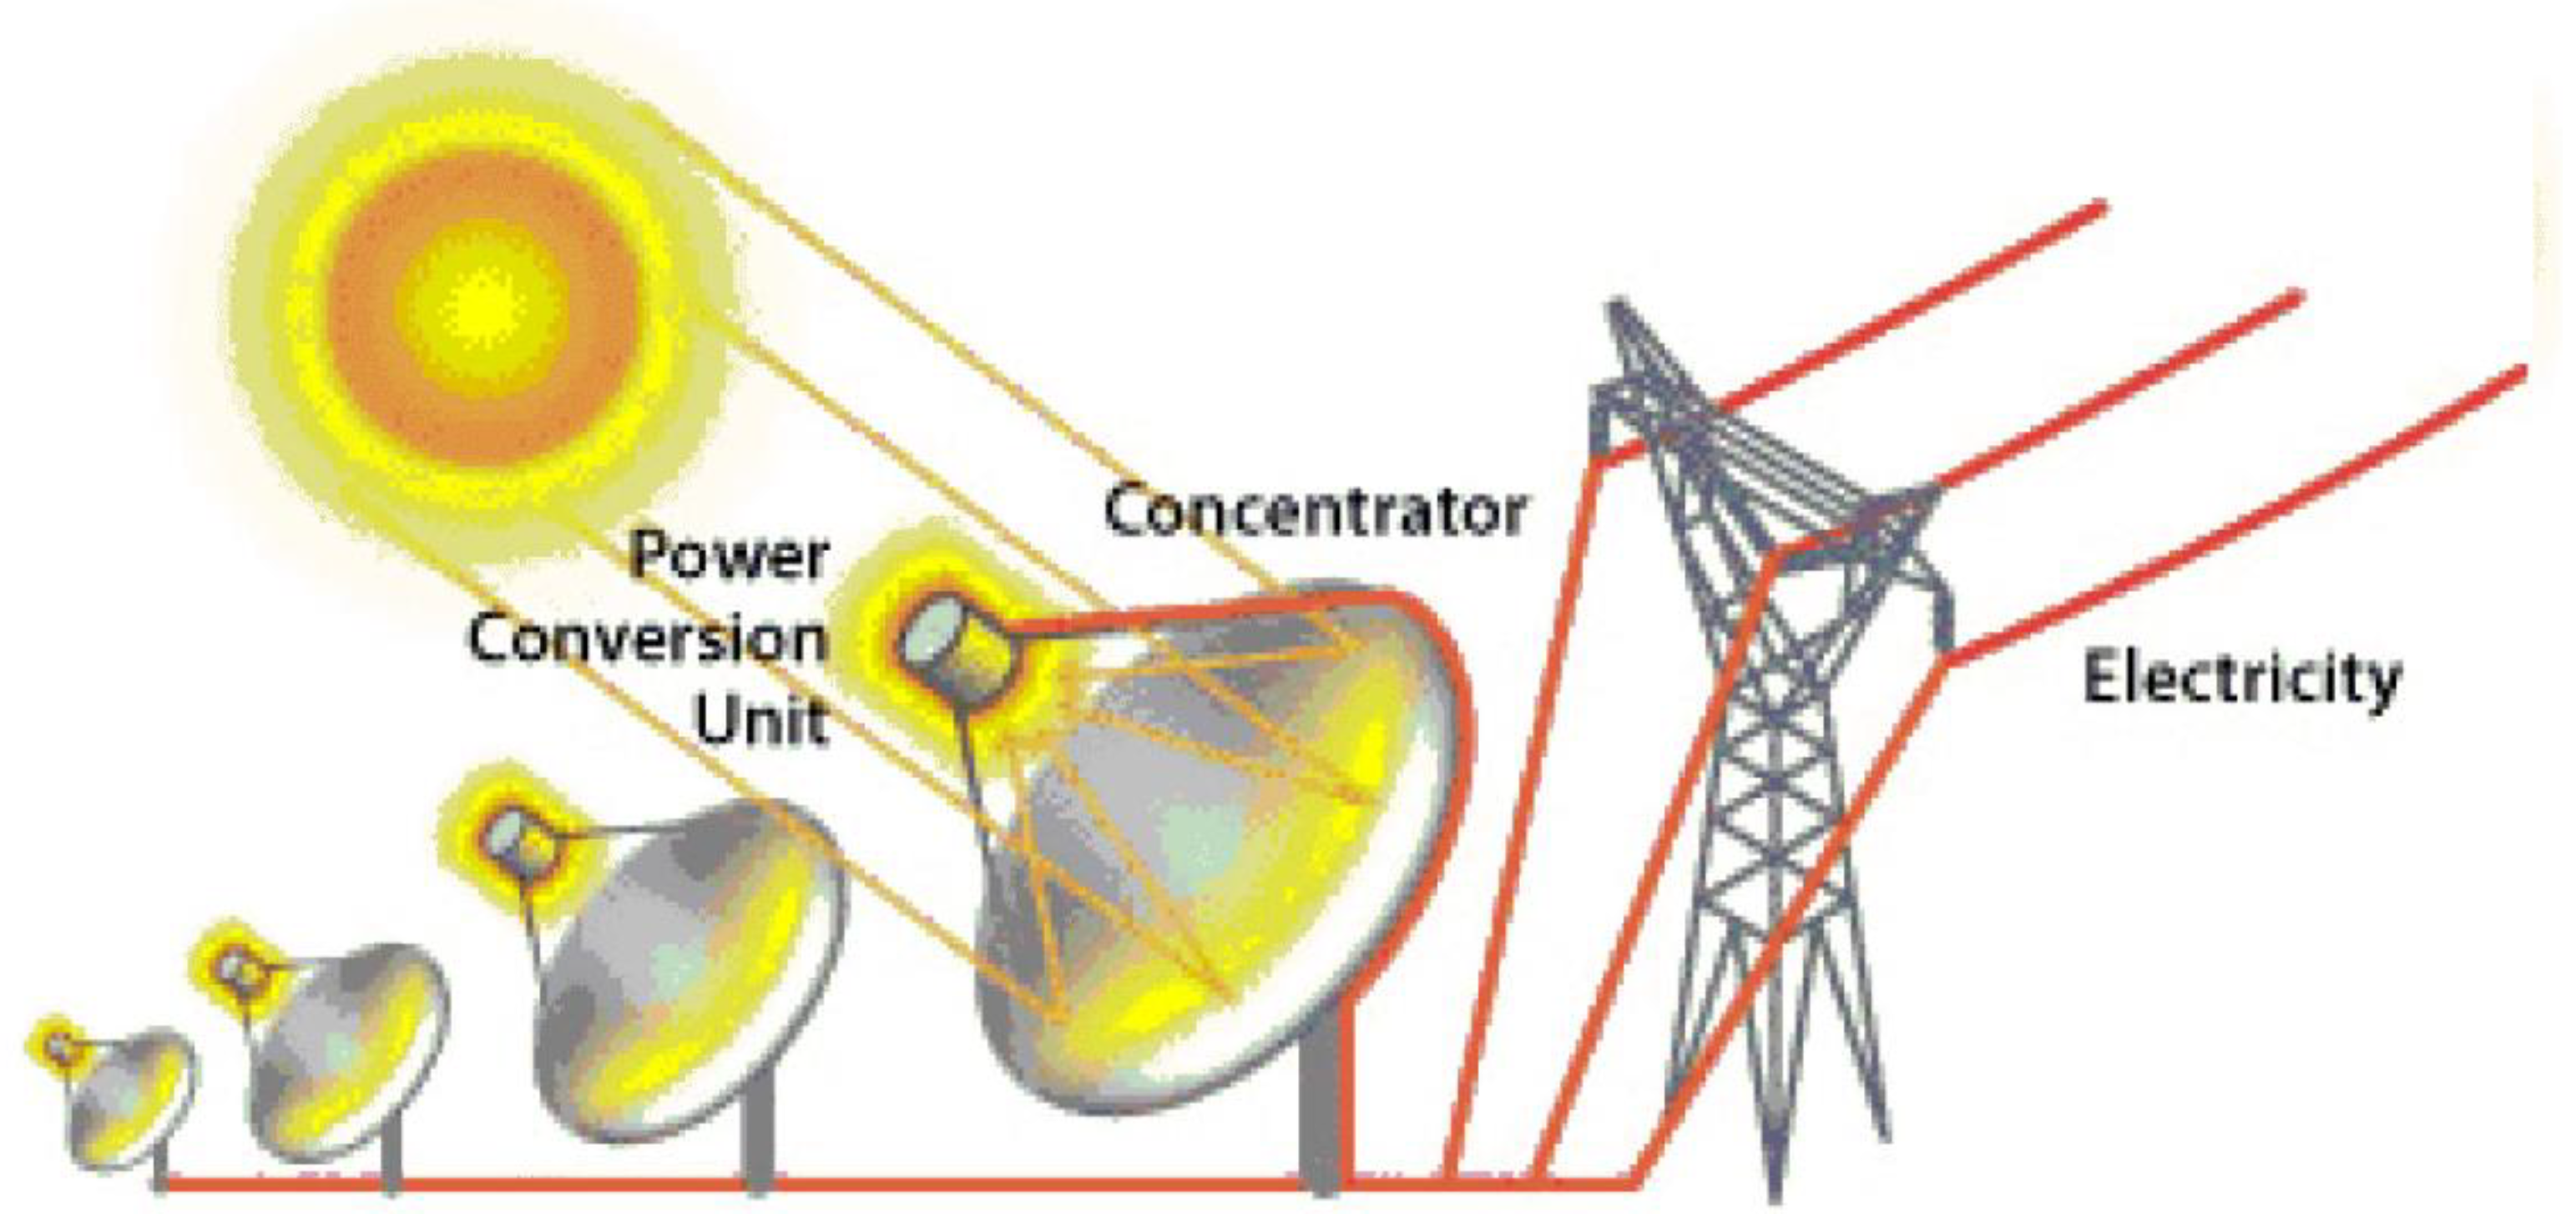
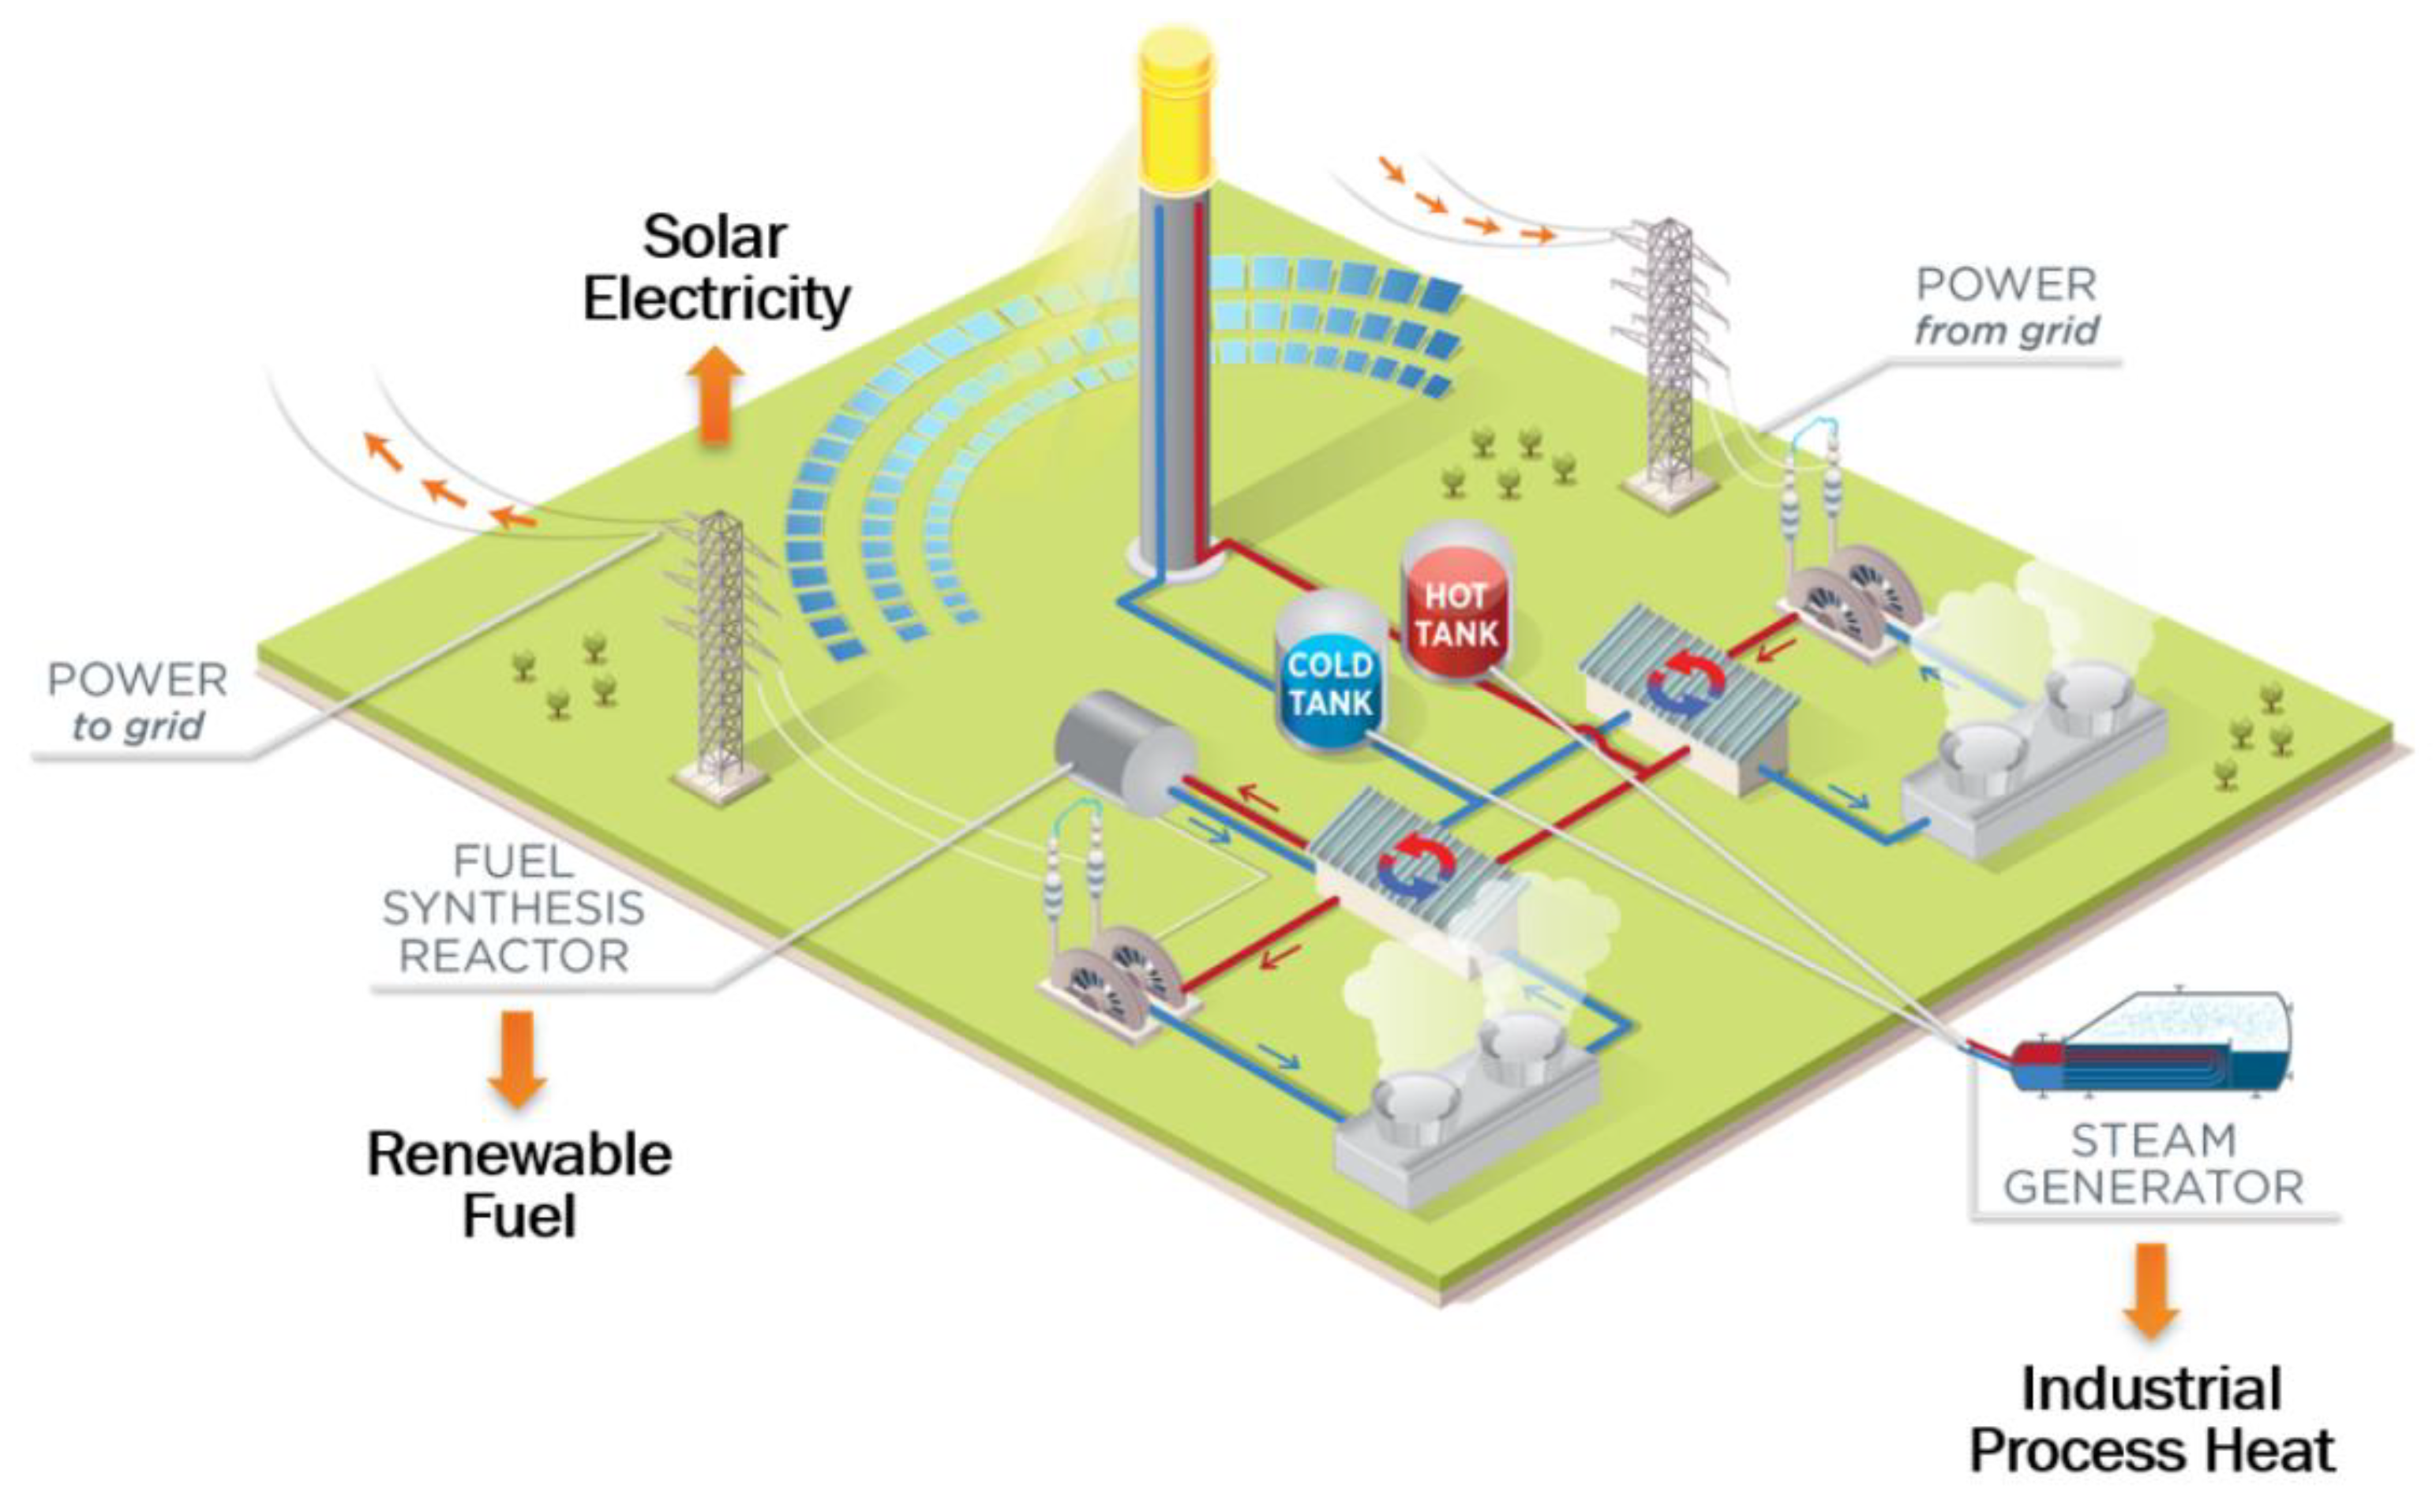
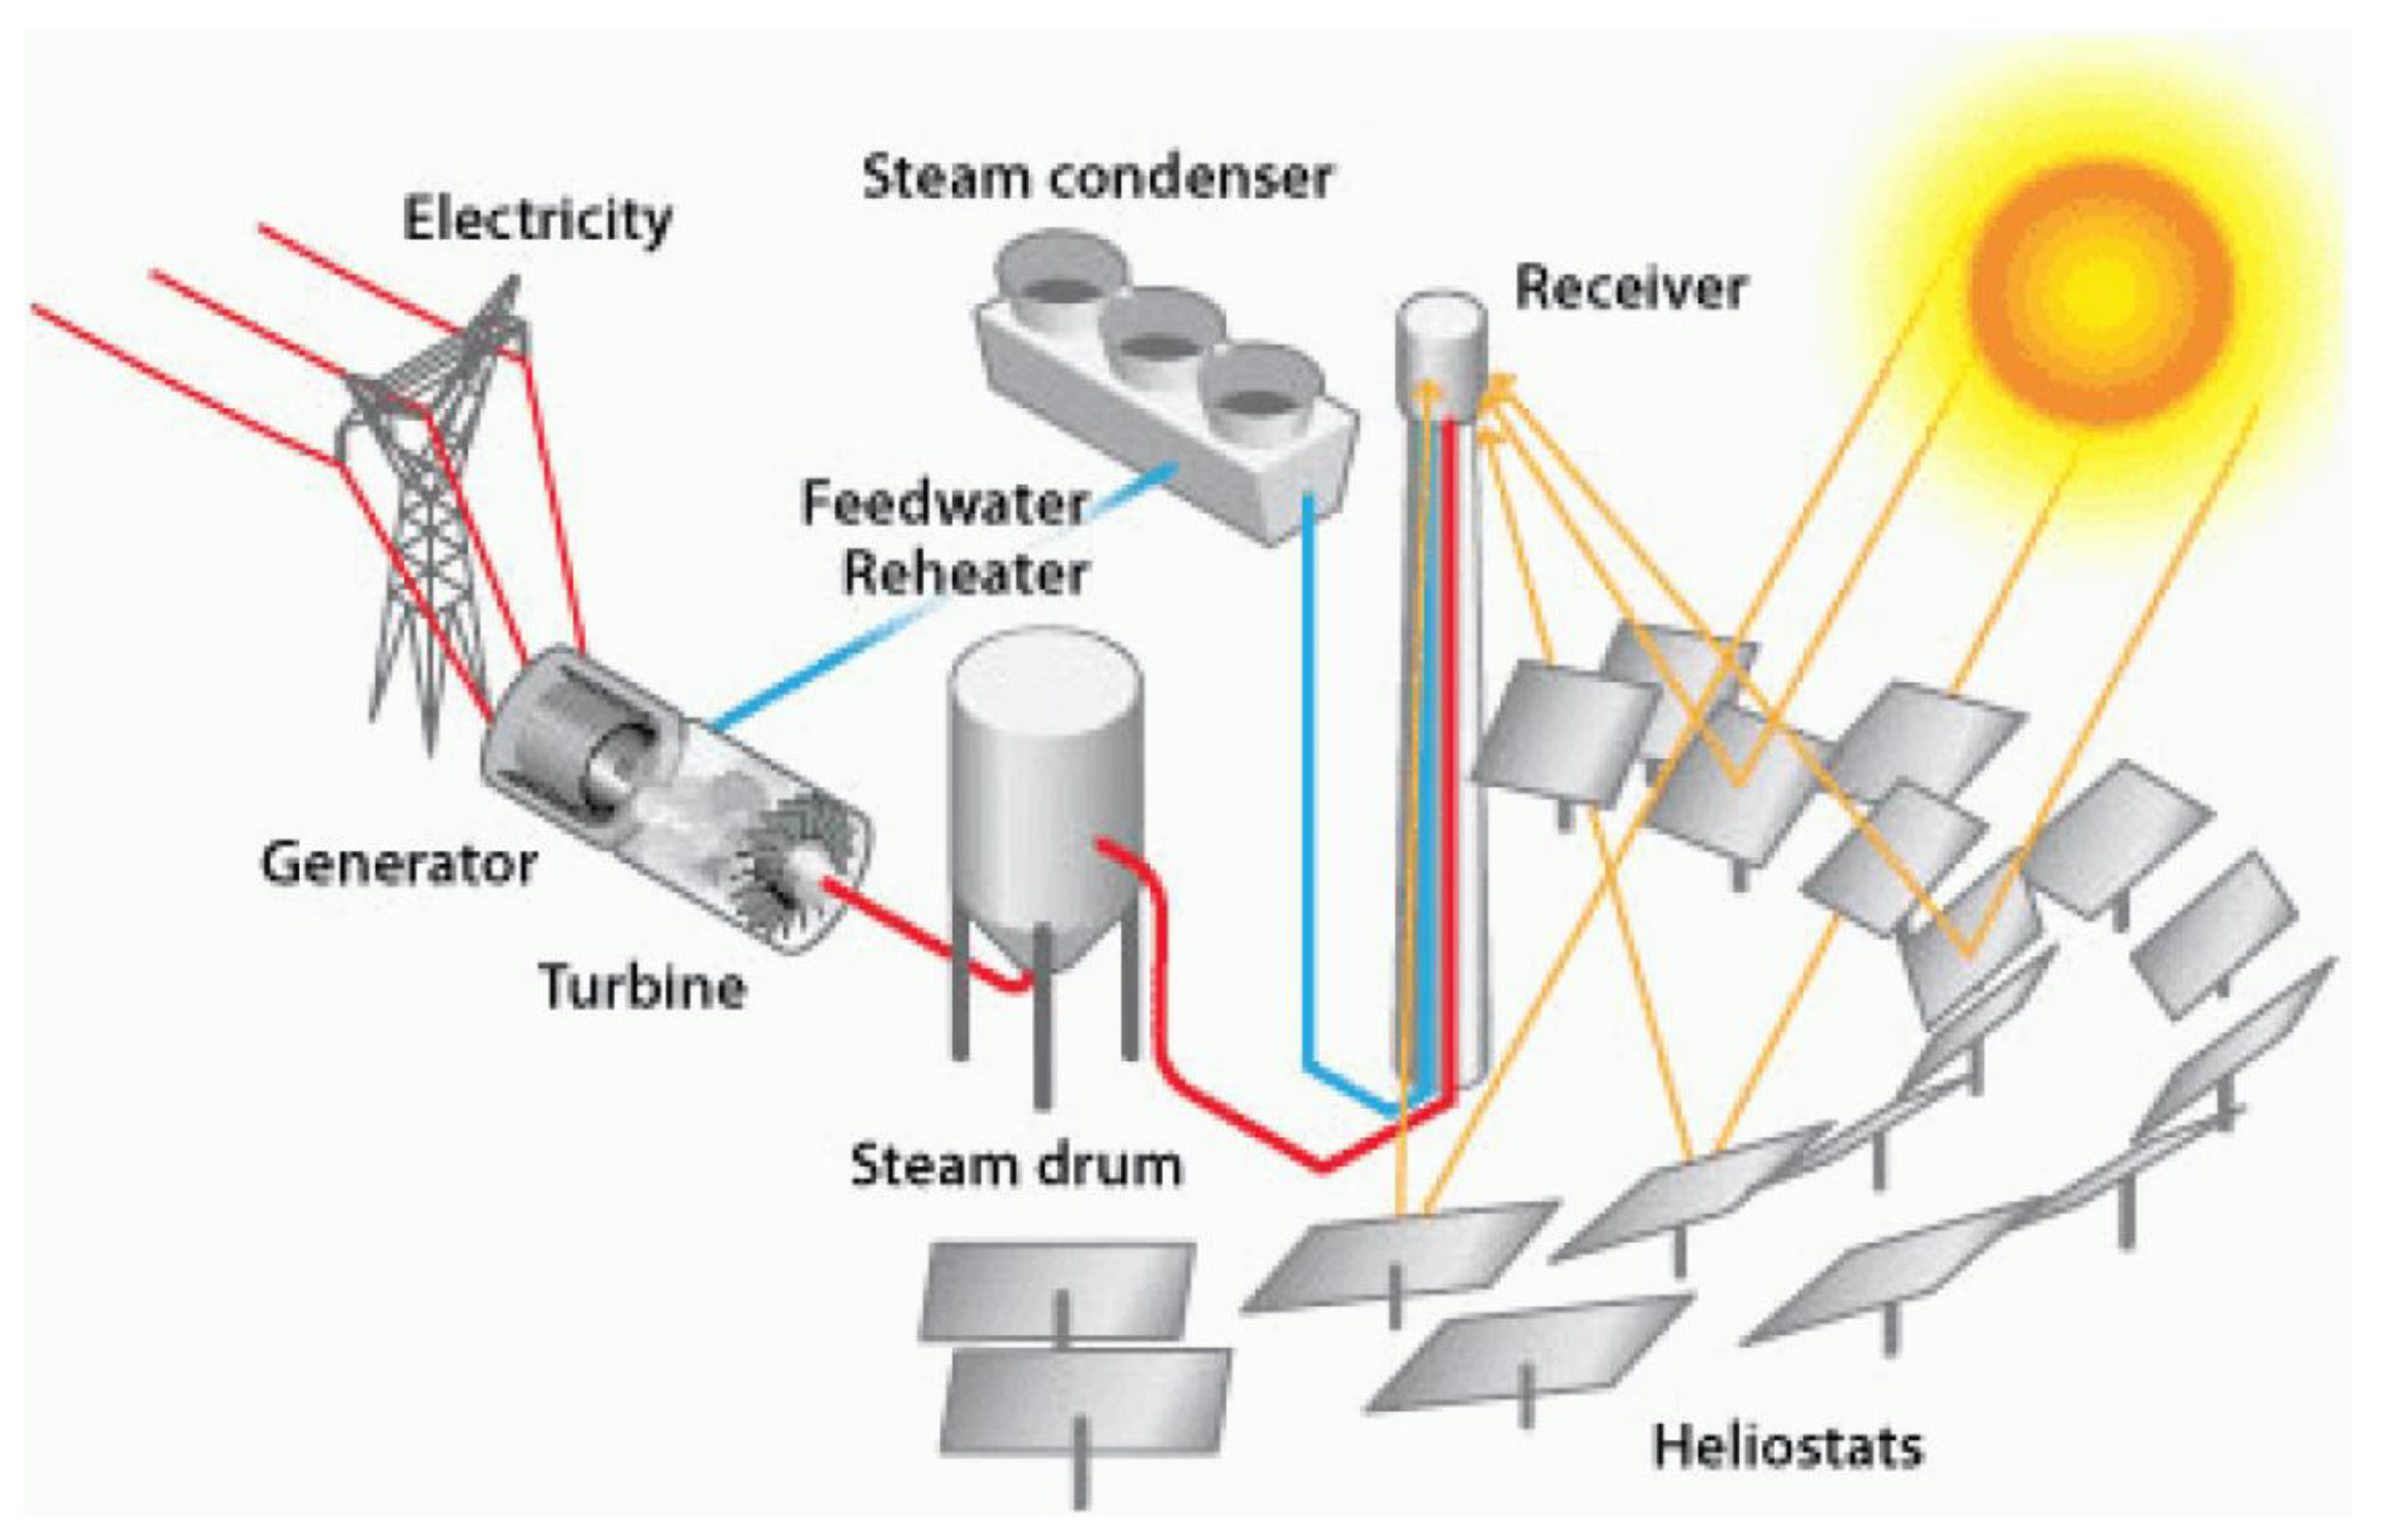
3.12. SPT (Solar Power Tower)
4. Results (Part 2: SHIP Progress)
4.1. SHIP Historical Growth
4.2. SHIP Additions in 2024
- China
- Germany
- Netherlands
- Austria
- Mexico
- India
- Italy
- Brazil
- USA
- France
- Panama
- Jordan
- Serbia
- Spain
- Kenya
- Ecuador
- Finland
- Morocco
- Colombia
- Cuba
4.3. Small-Scale Non-Industrial Solar Thermal Applications
4.4. PV-to-Heat Configuration (PVH)
4.5. Thermal Modeling Tools
4.6. Perspectives and Recommendations
5. Discussion and Conclusions
Funding
Author Contributions (Author Statement)
Institutional Review Board Statement
Informed Consent Statement
Data Availability Statement
Declaration of Competing Interests (Conflicts of Interest)
References
- Modest, M.F. Radiative Heat Transfer, 2nd ed.; Academic Press: Amsterdam Boston, 2003; ISBN 978-0-12-503163-9. [Google Scholar]
- Howell, J.R.; Mengüc, M.P.; Daun, K.; Siegel, R. Thermal Radiation Heat Transfer, 7th ed.; CRC Press: Boca Raton, 2020; ISBN 978-0-429-32730-8. [Google Scholar]
- Peuser, D.F.A.; Remmers, K.-H.; Schnauss, M. Solar Thermal Systems: Successful Planning and Construction; Routledge: London, 2013; ISBN 978-1-315-06724-7. [Google Scholar]
- Romero, M.; González-Aguilar, J. Solar Thermal CSP Technology. WIREs Energy and Environment 2014, 3, 42–59. [Google Scholar] [CrossRef]
- Smith, G.A.; Barnes, S.A. Electrical Power Generation from Heat Engines. In Proceedings of the IEE Colloquium on Power Electronics for Renewable Energy (Digest No: 1997/170), June 1997; p. 5/1-5/6. [Google Scholar]
- Marzouk, O.A. Radiant Heat Transfer in Nitrogen-Free Combustion Environments. International Journal of Nonlinear Sciences and Numerical Simulation 2018, 19, 175–188. [Google Scholar] [CrossRef]
- Fernández-Arias, P.; Vergara, D.; Orosa, J.A. A Global Review of PWR Nuclear Power Plants. Applied Sciences 2020, 10, 4434. [Google Scholar] [CrossRef]
- Hashemian, H.M. On-Line Monitoring Applications in Nuclear Power Plants. Progress in Nuclear Energy 2011, 53, 167–181. [Google Scholar] [CrossRef]
- Marzouk, O.A. Subcritical and Supercritical Rankine Steam Cycles, under Elevated Temperatures up to 900°C and Absolute Pressures up to 400 Bara. Advances in Mechanical Engineering 2024, 16, 16878132231221065. [Google Scholar] [CrossRef]
- Marzouk, O.A. Technical Review of Radiative-Property Modeling Approaches for Gray and Nongray Radiation, and a Recommended Optimized WSGGM for CO2/H2O-Enriched Gases. Results in Engineering 2025, 25, 103923. [Google Scholar] [CrossRef]
- Gallo, A.; Marzo, A.; Fuentealba, E.; Alonso, E. High Flux Solar Simulators for Concentrated Solar Thermal Research: A Review. Renewable and Sustainable Energy Reviews 2017, 77, 1385–1402. [Google Scholar] [CrossRef]
- Mir-Artigues, P. The Economics and Policy of Concentrating Solar Power Generation; Green Energy and Technology Ser; Springer International Publishing AG: Cham, 2019; ISBN 978-3-030-11937-9. [Google Scholar]
- Chien, J.C.-L. Concentrating Solar Thermal Power: A Viable Alternative in China’s Energy Supply. Masters of Arts in International Studies, Lauder Institute of International Studies, University of Pennsylvania: Philadelphia, Pennsylvania, USA, 2009.
- EASAC, [European Academies Science Advisory Council] Concentrating Solar Power: Its Potential Contribution to a Sustainable Energy Future; EASAC [European Academies Science Advisory Council]: Halle (Saale), Germany, 2011; pp. 1–67.
- Zhu, J.; Chen, Z. Optical Design of Compact Linear Fresnel Reflector Systems. Solar Energy Materials and Solar Cells 2018, 176, 239–250. [Google Scholar] [CrossRef]
- Rungasamy, A.E.; Craig, K.J.; Meyer, J.P. Comparative Study of the Optical and Economic Performance of Etendue-Conserving Compact Linear Fresnel Reflector Concepts. Solar Energy 2019, 181, 95–107. [Google Scholar] [CrossRef]
- Khan, M.I.; Gutiérrez-Alvarez, R.; Asfand, F.; Bicer, Y.; Sgouridis, S.; Al-Ghamdi, S.G.; Jouhara, H.; Asif, M.; Kurniawan, T.A.; Abid, M.; et al. The Economics of Concentrating Solar Power (CSP): Assessing Cost Competitiveness and Deployment Potential. Renewable and Sustainable Energy Reviews 2024, 200, 114551. [Google Scholar] [CrossRef]
- Palacios, A.; Calderón, A.; Barreneche, C.; Bertomeu, J.; Segarra, M.; Fernández, A.I. Study on Solar Absorptance and Thermal Stability of Solid Particles Materials Used as TES at High Temperature on Different Aging Stages for CSP Applications. Solar Energy Materials and Solar Cells 2019, 201, 110088. [Google Scholar] [CrossRef]
- Giostri, A.; Macchi, E. An Advanced Solution to Boost Sun-to-Electricity Efficiency of Parabolic Dish. Solar Energy 2016, 139, 337–354. [Google Scholar] [CrossRef]
- Zhai, H.; Wang, S.; An, B.; Dai, X. Performance and Parameter Sensitivity Comparison of CSP Power Cycles under Wide Solar Energy Temperature Ranges and Multiple Working Conditions. Energy Conversion and Management 2020, 218, 112996. [Google Scholar] [CrossRef]
- Giostri, A. Preliminary Analysis of Solarized Micro Gas Turbine Application to CSP Parabolic Dish Plants. Energy Procedia 2017, 142, 768–773. [Google Scholar] [CrossRef]
- García-Ferrero, J.; Merchán, R.P.; Santos, M.J.; Medina, A.; Calvo Hernández, A. Brayton Technology for Concentrated Solar Power Plants: Comparative Analysis of Central Tower Plants and Parabolic Dish Farms. Energy Conversion and Management 2022, 271, 116312. [Google Scholar] [CrossRef]
- Giaconia, A.; Iaquaniello, G.; Metwally, A.A.; Caputo, G.; Balog, I. Experimental Demonstration and Analysis of a CSP Plant with Molten Salt Heat Transfer Fluid in Parabolic Troughs. Solar Energy 2020, 211, 622–632. [Google Scholar] [CrossRef]
- Cipollone, R.; Cinocca, A.; Gualtieri, A. Gases as Working Fluid in Parabolic Trough CSP Plants. Procedia Computer Science 2013, 19, 702–711. [Google Scholar] [CrossRef]
- Abbas, R.; Muñoz, J.; Martínez-Val, J.M. Steady-State Thermal Analysis of an Innovative Receiver for Linear Fresnel Reflectors. Applied Energy 2012, 92, 503–515. [Google Scholar] [CrossRef]
- Hofer, A.; Cuevas, F.; Heimsath, A.; Nitz, P.; Platzer, W.J.; Scholl, S. Extended Heat Loss and Temperature Analysis of Three Linear Fresnel Receiver Designs. Energy Procedia 2015, 69, 424–433. [Google Scholar] [CrossRef]
- He, Y.-L.; Qiu, Y.; Wang, K.; Yuan, F.; Wang, W.-Q.; Li, M.-J.; Guo, J.-Q. Perspective of Concentrating Solar Power. Energy 2020, 198, 117373. [Google Scholar] [CrossRef]
- Al-Sulaiman, F.A. Exergy Analysis of Parabolic Trough Solar Collectors Integrated with Combined Steam and Organic Rankine Cycles. Energy Conversion and Management 2014, 77, 441–449. [Google Scholar] [CrossRef]
- Al-Sulaiman, F.A. Energy and Sizing Analyses of Parabolic Trough Solar Collector Integrated with Steam and Binary Vapor Cycles. Energy 2013, 58, 561–570. [Google Scholar] [CrossRef]
- Struchtrup, H. Thermodynamics and Energy Conversion; Thermodynamics and Energy Conversion, 1st ed.; Springer-Verlag: Berlin, Germany, 2014; ISBN 978-3-662-43715-5. [Google Scholar]
- Marzouk, O.A. Direct Numerical Simulations of the Flow Past a Cylinder Moving With Sinusoidal and Nonsinusoidal Profiles. Journal of Fluids Engineering 2009, 131, 121201. [Google Scholar] [CrossRef]
- Marzouk, O.A. A Two-Step Computational Aeroacoustics Method Applied to High-Speed Flows. Noise Control Engineering Journal 2008, 56, 396. [Google Scholar] [CrossRef]
- Mehrpooya, M.; Ghadimi, N.; Marefati, M.; Ghorbanian, S.A. Numerical Investigation of a New Combined Energy System Includes Parabolic Dish Solar Collector, Stirling Engine and Thermoelectric Device. International Journal of Energy Research 2021, 45, 16436–16455. [Google Scholar] [CrossRef]
- Marzouk, O.A. The Sod Gasdynamics Problem as a Tool for Benchmarking Face Flux Construction in the Finite Volume Method. Scientific African 2020, 10, e00573. [Google Scholar] [CrossRef]
- Barreto, G.; Canhoto, P. Modelling of a Stirling Engine with Parabolic Dish for Thermal to Electric Conversion of Solar Energy. Energy Conversion and Management 2017, 132, 119–135. [Google Scholar] [CrossRef]
- Marzouk, O.A. Reduced-Order Modeling (ROM) of a Segmented Plug-Flow Reactor (PFR) for Hydrogen Separation in Integrated Gasification Combined Cycles (IGCC). Processes 2025, 13, 1455. [Google Scholar] [CrossRef]
- Backes, J.G.; D’Amico, A.; Pauliks, N.; Guarino, S.; Traverso, M.; Lo Brano, V. Life Cycle Sustainability Assessment of a Dish-Stirling Concentrating Solar Power Plant in the Mediterranean Area. Sustainable Energy Technologies and Assessments 2021, 47, 101444. [Google Scholar] [CrossRef]
- Adeoti, O.; Oyewole, B.A.; Adegboyega, T.D. Solar Photovoltaic-Based Home Electrification System for Rural Development in Nigeria: Domestic Load Assessment. Renewable Energy 2001, 24, 155–161. [Google Scholar] [CrossRef]
- Marzouk, O.A. Adiabatic Flame Temperatures for Oxy-Methane, Oxy-Hydrogen, Air-Methane, and Air-Hydrogen Stoichiometric Combustion Using the NASA CEARUN Tool, GRI-Mech 3.0 Reaction Mechanism, and Cantera Python Package. Engineering, Technology & Applied Science Research 2023, 13, 11437–11444. [Google Scholar] [CrossRef]
- Chatzimouratidis, A.I.; Pilavachi, P.A. Objective and Subjective Evaluation of Power Plants and Their Non-Radioactive Emissions Using the Analytic Hierarchy Process. Energy Policy 2007, 35, 4027–4038. [Google Scholar] [CrossRef]
- Patel, A.; Soni, A.; Baredar, P. Green Buildings Integrated with Solar Thermal Energy Systems in India– Concepts, Utilization and Potential. In Proceedings of the 2024 IEEE 3rd International Conference on Electrical Power and Energy Systems (ICEPES), June 2024; pp. 1–5. [Google Scholar]
- Marzouk, O.A. Compilation of Smart Cities Attributes and Quantitative Identification of Mismatch in Rankings. Journal of Engineering 2022, 2022, 5981551. [Google Scholar] [CrossRef]
- Yousef, B.A.A.; Obaideen, K.; AlMallahi, M.N.; Alajmi, N.; Radwan, A.; Al-Shihabi, S.; Elgendi, M. On the Contribution of Concentrated Solar Power (CSP) to the Sustainable Development Goals (SDGs): A Bibliometric Analysis. Energy Strategy Reviews 2024, 52, 101356. [Google Scholar] [CrossRef]
- Jia, L.; Ma, J.; Cheng, P.; Liu, Y. A Perspective on Solar Energy-Powered Road and Rail Transportation in China. CSEE Journal of Power and Energy Systems 2020, 6, 760–771. [Google Scholar] [CrossRef]
- Marzouk, O.A. Urban Air Mobility and Flying Cars: Overview, Examples, Prospects, Drawbacks, and Solutions. Open Engineering 2022, 12, 662–679. [Google Scholar] [CrossRef]
- Al-Ghussain, L.; Darwish Ahmad, A.; Abubaker, A.M.; Mohamed, M.A.; Hassan, M.A.; Akafuah, N.K. Optimal Sizing of Country-Scale Renewable Energy Systems towards Green Transportation Sector in Developing Countries. Case Studies in Thermal Engineering 2022, 39, 102442. [Google Scholar] [CrossRef]
- Bartłomiejczyk, M. Potential Application of Solar Energy Systems for Electrified Urban Transportation Systems. Energies 2018, 11, 954. [Google Scholar] [CrossRef]
- Aprà, F.M.; Smit, S.; Sterling, R.; Loureiro, T. Overview of the Enablers and Barriers for a Wider Deployment of CSP Tower Technology in Europe. Clean Technologies 2021, 3, 377–394. [Google Scholar] [CrossRef]
- Marzouk, O.A. Performance Analysis of Shell-and-Tube Dehydrogenation Module. International Journal of Energy Research 2017, 41, 604–610. [Google Scholar] [CrossRef]
- Ziuku, S.; Seyitini, L.; Mapurisa, B.; Chikodzi, D.; van Kuijk, K. Potential of Concentrated Solar Power (CSP) in Zimbabwe. Energy for Sustainable Development 2014, 23, 220–227. [Google Scholar] [CrossRef]
- Bijarniya, J.P.; Sudhakar, K.; Baredar, P. Concentrated Solar Power Technology in India: A Review. Renewable and Sustainable Energy Reviews 2016, 63, 593–603. [Google Scholar] [CrossRef]
- Marzouk, O.A. Detailed Derivation of the Scalar Explicit Expressions Governing the Electric Field, Current Density, and Volumetric Power Density in the Four Types of Linear Divergent MHD Channels Under a Unidirectional Applied Magnetic Field. Contemporary Mathematics 2025, 6, 4060–4100. [Google Scholar] [CrossRef]
- Rodat, S.; Thonig, R. Status of Concentrated Solar Power Plants Installed Worldwide: Past and Present Data. Clean Technologies 2024, 6, 365–378. [Google Scholar] [CrossRef]
- Marzouk, O.A. Detailed and Simplified Plasma Models in Combined-Cycle Magnetohydrodynamic Power Systems. International Journal of Advanced and Applied Sciences 2023, 10, 96–108. [Google Scholar] [CrossRef]
- Furlan, G.; You, F. Robust Design of Hybrid Solar Power Systems: Sustainable Integration of Concentrated Solar Power and Photovoltaic Technologies. Advances in Applied Energy 2024, 13, 100164. [Google Scholar] [CrossRef]
- Marzouk, O.A. Estimated Electric Conductivities of Thermal Plasma for Air-Fuel Combustion and Oxy-Fuel Combustion with Potassium or Cesium Seeding. Heliyon 2024, 10, e31697. [Google Scholar] [CrossRef] [PubMed]
- Marzouk, O.A. Power Density and Thermochemical Properties of Hydrogen Magnetohydrodynamic (H2MHD) Generators at Different Pressures, Seed Types, Seed Levels, and Oxidizers. Hydrogen 2025, 6, 31. [Google Scholar] [CrossRef]
- Soni, N.; Reddy, K.S. Techno-Economic Assessment of Concentrated Solar Power Technologies Integrated with Thermal Energy Storage System for Green Hydrogen Production. International Journal of Hydrogen Energy 2024, 72, 1184–1203. [Google Scholar] [CrossRef]
- Muhammad, H.A.; Naseem, M.; Kim, J.; Kim, S.; Choi, Y.; Lee, Y.D. Solar Hydrogen Production: Technoeconomic Analysis of a Concentrated Solar-Powered High-Temperature Electrolysis System. Energy 2024, 298, 131284. [Google Scholar] [CrossRef]
- Reddy, V.J.; Hariram, N.P.; Maity, R.; Ghazali, M.F.; Kumarasamy, S. Sustainable E-Fuels: Green Hydrogen, Methanol and Ammonia for Carbon-Neutral Transportation. World Electric Vehicle Journal 2023, 14, 349. [Google Scholar] [CrossRef]
- Marzouk, O.A. Hydrogen Utilization as a Plasma Source for Magnetohydrodynamic Direct Power Extraction (MHD-DPE). IEEE Access 2024, 12, 167088–167107. [Google Scholar] [CrossRef]
- Bellotti, D.; Rivarolo, M.; Magistri, L. Clean Fuels Synthesis from Green Hydrogen: A Techno-Economic Comparative Analysis. E3S Web Conf. 2021, 238, 03001. [Google Scholar] [CrossRef]
- Meda, U.S.; Rajyaguru, Y.V.; Pandey, A. Generation of Green Hydrogen Using Self-Sustained Regenerative Fuel Cells: Opportunities and Challenges. International Journal of Hydrogen Energy 2023, 48, 28289–28314. [Google Scholar] [CrossRef]
- Tasmin, N.; Farjana, S.H.; Hossain, M.R.; Golder, S.; Mahmud, M.A.P. Integration of Solar Process Heat in Industries: A Review. Clean Technologies 2022, 4, 97–131. [Google Scholar] [CrossRef]
- Gil, J.D.; Topa, A.; Álvarez, J.D.; Torres, J.L.; Pérez, M. A Review from Design to Control of Solar Systems for Supplying Heat in Industrial Process Applications. Renewable and Sustainable Energy Reviews 2022, 163, 112461. [Google Scholar] [CrossRef]
- jia, T.; Huang, J.; Li, R.; He, P.; Dai, Y. Status and Prospect of Solar Heat for Industrial Processes in China. Renewable and Sustainable Energy Reviews 2018, 90, 475–489. [Google Scholar] [CrossRef]
- Solar Payback Market Segments. Available online: https://www.solar-payback.com/markets (accessed on 18 April 2025).
- Marzouk, O.A. Zero Carbon Ready Metrics for a Single-Family Home in the Sultanate of Oman Based on EDGE Certification System for Green Buildings. Sustainability 2023, 15, 13856. [Google Scholar] [CrossRef]
- SHE, [Solar Heat Europe] Solar Energy for Heating and Cooling. Available online: https://solarheateurope.eu/wp-content/uploads/2024/11/2-graphs_2023_sector_heat.png (accessed on 18 April 2025).
- Sarbu, I.; Sebarchievici, C. Review of Solar Refrigeration and Cooling Systems. Energy and Buildings 2013, 67, 286–297. [Google Scholar] [CrossRef]
- SHC, [Solar Heating and Cooling Programme] Solar Heat for Industrial Processes (SHIP); IEA [International Energy Agency]: Paris, France, 2024; pp. 1–9.
- Kalogirou, S.A. Solar Thermal Collectors and Applications. Progress in Energy and Combustion Science 2004, 30, 231–295. [Google Scholar] [CrossRef]
- Barone, G.; Buonomano, A.; Forzano, C.; Palombo, A. Chapter 6 - Solar Thermal Collectors. In Solar Hydrogen Production; Calise, F., D’Accadia, M.D., Santarelli, M., Lanzini, A., Ferrero, D., Eds.; Academic Press, 2019; pp. 151–178 ISBN 978-0-12-814853-2.
- Goswami, D.Y. Principles of Solar Engineering, 4th ed.; CRC Press: Boca Raton, Florida, USA, 2022; ISBN 978-1-00-324438-7. [Google Scholar]
- Sheikholeslami, M. Solar Thermal Systems and Applications: New Design Techniques for Improved Thermal Performance; Elsevier: London, UK, 2024; ISBN 978-0-443-15839-1. [Google Scholar]
- Lei, Z.; Li, C.; Chen, B. Extractive Distillation: A Review. Separation & Purification Reviews 2003, 32, 121–213. [Google Scholar] [CrossRef]
- Chan, Y.H.; Loh, S.K.; Chin, B.L.F.; Yiin, C.L.; How, B.S.; Cheah, K.W.; Wong, M.K.; Loy, A.C.M.; Gwee, Y.L.; Lo, S.L.Y.; et al. Fractionation and Extraction of Bio-Oil for Production of Greener Fuel and Value-Added Chemicals: Recent Advances and Future Prospects. Chemical Engineering Journal 2020, 397, 125406. [Google Scholar] [CrossRef]
- KROHNE KROHNE │ Distillation in the Chemical Industry - Atmospheric and Vacuum Distillation Measuring. Available online: https://www.krohne.com/en-us/industries/chemical-industry/distillation (accessed on 10 August 2025).
- Gu, W.; Huang, Y.; Wang, K.; Zhang, B.; Chen, Q.; Hui, C.-W. Comparative Analysis and Evaluation of Three Crude Oil Vacuum Distillation Processes for Process Selection. Energy 2014, 76, 559–571. [Google Scholar] [CrossRef]
- Atta, M.S.; Khan, H.; Ali, M.; Tariq, R.; Yasir, A.U.; Iqbal, M.M.; Din, S.U.; Krzywanski, J. Simulation of Vacuum Distillation Unit in Oil Refinery: Operational Strategies for Optimal Yield Efficiency. Energies 2024, 17, 3806. [Google Scholar] [CrossRef]
- Hafez, A.Z.; Yousef, A.M.; Harag, N.M. Solar Tracking Systems: Technologies and Trackers Drive Types – A Review. Renewable and Sustainable Energy Reviews 2018, 91, 754–782. [Google Scholar] [CrossRef]
- Marzouk, O.A. Coupled Differential-Algebraic Equations Framework for Modeling Six-Degree-of-Freedom Flight Dynamics of Asymmetric Fixed-Wing Aircraft. International Journal of Applied and Advanced Sciences 2025, 12, 30–51. [Google Scholar] [CrossRef]
- Marzouk, O.A. Tilt Sensitivity for a Scalable One-Hectare Photovoltaic Power Plant Composed of Parallel Racks in Muscat. Cogent Engineering 2022, 9, 2029243. [Google Scholar] [CrossRef]
- Beily, M.D.E.; Sinaga, R.; Syarif, Z.; Pae, M.G.; Rochani, R. Design and Construction of a Low Cost of Solar Tracker Two Degree of Freedom (DOF) Based On Arduino. In Proceedings of the 2020 International Conference on Applied Science and Technology (iCAST), October 2020; pp. 384–388. [Google Scholar]
- Marzouk, O.A. Characteristics of the Flow-Induced Vibration and Forces With 1- and 2-DOF Vibrations and Limiting Solid-to-Fluid Density Ratios. Journal of Vibration and Acoustics 2010, 132, 041013. [Google Scholar] [CrossRef]
- Safari, A.; Saidur, R.; Sulaiman, F.A.; Xu, Y.; Dong, J. A Review on Supercooling of Phase Change Materials in Thermal Energy Storage Systems. Renewable and Sustainable Energy Reviews 2017, 70, 905–919. [Google Scholar] [CrossRef]
- Zheng, H. Chapter 2 - Solar Energy Utilization and Its Collection Devices. In Solar Energy Desalination Technology; Zheng, H., Ed.; Elsevier: Amsterdam, 2017; pp. 47–171. ISBN 978-0-12-805411-6. [Google Scholar]
- SINTEF Solar Heat in Industrial Processes (SHIP). Available online: https://www.sintef.no/en/expert-list/sintef-energy-research/solar-heat-in-industrial-processes-ship (accessed on 20 April 2025).
- Bees Group Solar Heat for Industrial Process - SHIP. Available online: https://www.beesgroup.energy/en/services/solar-heat-for-industrial-process-ship (accessed on 20 April 2025).
- Marzouk, O.A. Globalization and Diversity Requirement in Higher Education. In Proceedings of the The 11th World Multi-Conference on Systemics, Cybernetics and Informatics (WMSCI 2007) - The 13th International Conference on Information Systems Analysis and Synthesis (ISAS 2007); IIIS [International Institute of Informatics and Systemics]: Orlando, Florida, USA, 2007; Vol. III (3), pp. 101–106.
- Korkut, T.B.; Rachid, A. EduSolar: A Remote-Controlled Photovoltaic/Thermal Educational Lab with Integrated Daylight Simulation. Solar 2024, 4, 440–454. [Google Scholar] [CrossRef]
- Marzouk, O.A. Benchmarks for the Omani Higher Education Students-Faculty Ratio (SFR) Based on World Bank Data, QS Rankings, and THE Rankings. Cogent Education 2024, 11, 2317117. [Google Scholar] [CrossRef]
- Ciriminna, R.; Meneguzzo, F.; Pecoraino, M.; Pagliaro, M. Rethinking Solar Energy Education on the Dawn of the Solar Economy. Renewable and Sustainable Energy Reviews 2016, 63, 13–18. [Google Scholar] [CrossRef]
- Marzouk, O.A. Benchmarking Retention, Progression, and Graduation Rates in Undergraduate Higher Education Across Different Time Windows. Cogent Education 2025, 12, 2498170. [Google Scholar] [CrossRef]
- Ghomshei, M.; Villecco, F. Energy Metrics and Sustainability. In Proceedings of the Computational Science and Its Applications – ICCSA 2009; Gervasi, O., Taniar, D., Murgante, B., Laganà, A., Mun, Y., Gavrilova, M.L., Eds.; Springer: Berlin, Heidelberg, 2009; pp. 693–698. [Google Scholar]
- Marzouk, O.A. Temperature-Dependent Functions of the Electron–Neutral Momentum Transfer Collision Cross Sections of Selected Combustion Plasma Species. Applied Sciences 2023, 13, 11282. [Google Scholar] [CrossRef]
- Lima, M.A.; Mendes, L.F.R.; Mothé, G.A.; Linhares, F.G.; de Castro, M.P.P.; da Silva, M.G.; Sthel, M.S. Renewable Energy in Reducing Greenhouse Gas Emissions: Reaching the Goals of the Paris Agreement in Brazil. Environmental Development 2020, 33, 100504. [Google Scholar] [CrossRef]
- Marzouk, O.A. Assessment of Global Warming in Al Buraimi, Sultanate of Oman Based on Statistical Analysis of NASA POWER Data over 39 Years, and Testing the Reliability of NASA POWER against Meteorological Measurements. Heliyon 2021, 7, e06625. [Google Scholar] [CrossRef] [PubMed]
- Philander, S.G. Encyclopedia of Global Warming and Climate Change: A-E.; SAGE: London, UK, 2008; ISBN 978-1-4129-5878-3. [Google Scholar]
- Marzouk, O.A. Portrait of the Decarbonization and Renewables Penetration in Oman’s Energy Mix, Motivated by Oman’s National Green Hydrogen Plan. Energies 2024, 17, 4769. [Google Scholar] [CrossRef]
- RMG, [Royal Museums Greenwich] Calculating the Energy Output of the Sun; RMG [Royal Museums Greenwich]: London, UK, 2017; pp. 1–2.
- SWS, [Australian Space Weather Forecasting System] The Solar Constant. Available online: https://www.sws.bom.gov.au/Educational/2/1/12 (accessed on 18 April 2025).
- Adel, M.M. Religion-Scientific Study of Solar Resting Phase and Solar-Lunar Finality: Solar Resting Phase and Solar-Lunar Finality. AL-IKHSAN: Interdisciplinary Journal of Islamic Studies 2023, 1, 82–100. [Google Scholar] [CrossRef]
- Thirugnanasambandam, M.; Iniyan, S.; Goic, R. A Review of Solar Thermal Technologies. Renewable and Sustainable Energy Reviews 2010, 14, 312–322. [Google Scholar] [CrossRef]
- Marzouk, O.A. Land-Use Competitiveness of Photovoltaic and Concentrated Solar Power Technologies near the Tropic of Cancer. Solar Energy 2022, 243, 103–119. [Google Scholar] [CrossRef]
- WEC, [World Energy Council] World Energy Resources: 2013 Survey; WEC [World Energy Council]: London, UK, 2013; pp. 1–468.
- Mathew, S. Analysis of Wind Regimes. In Wind Energy: Fundamentals, Resource Analysis and Economics; Mathew, S., Ed.; Springer: Berlin, Heidelberg, 2006; pp. 45–88. ISBN 978-3-540-30906-2. [Google Scholar]
- Eni World Energy Review (WER), 23rd Edition; Eni S.p.A.: Rome, Italy, 2024; pp. 1–328.
- Marzouk, O.A. Expectations for the Role of Hydrogen and Its Derivatives in Different Sectors through Analysis of the Four Energy Scenarios: IEA-STEPS, IEA-NZE, IRENA-PES, and IRENA-1.5°C. Energies 2024, 17, 646. [Google Scholar] [CrossRef]
- IEA, [International Energy Agency] World Energy Outlook (WEO) 2023 (26th Edition); IEA [International Energy Agency]: Paris, 2023; pp. 1–355.
- IRENA, [International Renewable Energy Agency] World Energy Transitions Outlook (WETO) 2023: 1.5°C Pathway, Volume 1 (Third Edition); IRENA [International Renewable Energy Agency]: Abu Dhabi, UAE, 2023; pp. 1–258.
- WEF, [World Economic Forum] Fostering Effective Energy Transition - INSIGHT REPORT.; WEF [World Economic Forum]: Geneva, Switzerland, 2024; pp. 1–58.
- IRENA, [International Renewable Energy Agency] Renewable Capacity Statistics 2025; IRENA [International Renewable Energy Agency]: Abu Dhabi, UAE, 2025; pp. 1–75.
- Ember Global Electricity Review 2025; Eni S.p.A.: London, UK, 2025; pp. 1–118.
- Kennedy, R. Solar Supplied over 10% of Global Electricity Consumption in 2024. Available online: https://pv-magazine-usa.com/2025/04/15/solar-supplied-over-10-of-global-electricity-consumption-in-2024 (accessed on 16 April 2025).
- IEA, [International Energy Agency] Global Energy Review 2025; IEA [International Energy Agency]: Paris, France, 2025; pp. 1–43.
- Casey, J.P. IEA: World Reaches 2.2TW of Cumulative Installed Solar Capacity . Available online: https://www.pv-tech.org/iea-world-reaches-2-2tw-cumulative-installed-solar-capacity (accessed on 16 April 2025).
- Siemens Gamesa Siemens Gamesa │ Onshore Business. Available online: https://www.siemensgamesa.com/global/en/home/products-and-services/onshore.html (accessed on 28 July 2025).
- Marzouk, O.A. Wind Speed Weibull Model Identification in Oman, and Computed Normalized Annual Energy Production (NAEP) From Wind Turbines Based on Data From Weather Stations. Engineering Reports 2025, 7, e70089. [Google Scholar] [CrossRef]
- IRENA, [International Renewable Energy Agency] Renewable Capacity Highlights 2025; IRENA [International Renewable Energy Agency]: Abu Dhabi, UAE, 2025; pp. 1–4.
- REN21 Market and Industry Trends │ CSP. Available online: https://www.ren21.net/gsr-2024/modules/energy_supply/02_market_and_industry_trends/02_csp (accessed on 18 April 2025).
- IRENA, [International Renewable Energy Agency] Renewable Energy Benefits: Leveraging Local Capacity for Concentrated Solar Power; IRENA [International Renewable Energy Agency]: Abu Dhabi, UAE, 2025; pp. 1–56.
- Pag, F.; Jesper, M.; Vajen, K.; Jordan, U. Oversizing Solar Heating Plants in Industry: A Cost-Effective Solution to Increase Solar Fractions. Solar Energy Advances 2024, 4, 100071. [Google Scholar] [CrossRef]
- REN21 Market and Industry Trends │ Solar Thermal Heating. Available online: https://www.ren21.net/gsr-2024/modules/energy_supply/02_market_and_industry_trends/08_solarthermal (accessed on 18 April 2025).
- REN21 Market and Industry Trends │ Ocean Power. Available online: https://www.ren21.net/gsr-2024/modules/energy_supply/02_market_and_industry_trends/06_oceanpower (accessed on 18 April 2025).
- Melikoglu, M. Current Status and Future of Ocean Energy Sources: A Global Review. Ocean Engineering 2018, 148, 563–573. [Google Scholar] [CrossRef]
- Marzouk, O.A.; Nayfeh, A.H. Characterization of the Flow over a Cylinder Moving Harmonically in the Cross-Flow Direction. International Journal of Non-Linear Mechanics 2010, 45, 821–833. [Google Scholar] [CrossRef]
- Martínez, M.L.; Vázquez, G.; Pérez-Maqueo, O.; Silva, R.; Moreno-Casasola, P.; Mendoza-González, G.; López-Portillo, J.; MacGregor-Fors, I.; Heckel, G.; Hernández-Santana, J.R.; et al. A Systemic View of Potential Environmental Impacts of Ocean Energy Production. Renewable and Sustainable Energy Reviews 2021, 149, 111332. [Google Scholar] [CrossRef]
- Fernández-García, A.; Zarza, E.; Valenzuela, L.; Pérez, M. Parabolic-Trough Solar Collectors and Their Applications. Renewable and Sustainable Energy Reviews 2010, 14, 1695–1721. [Google Scholar] [CrossRef]
- OTT HydroMet Kipp & Zonen │ Introduction (Solar Radiation). Available online: https://www.kippzonen.com/Knowledge-Center/Theoretical-info/Solar-Radiation/Introduction (accessed on 18 April 2025).
- Korevaar, M.A.N. Measuring Solar Irradiance for Photovoltaics. In Solar Radiation - Measurement, Modeling and Forecasting Techniques for Photovoltaic Solar Energy Applications; IntechOpen, 2022 ISBN 978-1-83968-859-1.
- Marzouk, O.A. Lookup Tables for Power Generation Performance of Photovoltaic Systems Covering 40 Geographic Locations (Wilayats) in the Sultanate of Oman, with and without Solar Tracking, and General Perspectives about Solar Irradiation. Sustainability 2021, 13, 13209. [Google Scholar] [CrossRef]
- Golive, Y.R.; Singh, H.K.; Kottantharayil, A.; Vasi, J.; Shiradkar, N. Investigation of Accuracy of Various STC Correction Procedures for I-V Characteristics of PV Modules Measured at Different Temperature and Irradiances. In Proceedings of the 2019 IEEE 46th Photovoltaic Specialists Conference (PVSC), June 2019; pp. 2743–2748. [Google Scholar]
- Zhu, Y.; Zhu, H.; Zhu, R.; Zhou, Y.; Qiu, M.; Li, Q. Photon-Engineered All-Day Radiative Warming Utilizing Solar and Atmospheric Energy. Advanced Optical Materials 2025, 13, 2402432. [Google Scholar] [CrossRef]
- Marzouk, O.A.; Nayfeh, A.H. New Wake Models With Capability of Capturing Nonlinear Physics. In Proceedings of the ASME 2008 27th International Conference on Offshore Mechanics and Arctic Engineering (OMAE 2008); ASME [American Society of Mechanical Engineers]: Estoril, Portugal, July 27 2009; pp. 901–912.
- Lawson, D. A Closer Look at Planck’s Blackbody Equation. Phys. Educ. 1997, 32, 321. [Google Scholar] [CrossRef]
- Lévesque, L. Law of Cooling, Heat Conduction and Stefan-Boltzmann Radiation Laws Fitted to Experimental Data for Bones Irradiated by CO2 Laser. Biomed. Opt. Express, BOE 2014, 5, 701–712. [Google Scholar] [CrossRef] [PubMed]
- Crepeau, J. Josef Stefan and His Contributions to Heat Transfer.; American Society of Mechanical Engineers Digital Collection, July 7 2009; pp. 669–676.
- Hoyt, D.V.; Schatten, K.H. The Role of the Sun in Climate Change; Oxford University Press: New York City, New York, USA, 1997; ISBN 978-0-19-535748-6. [Google Scholar]
- Boyd, C.E. Solar Radiation and Water Temperature. In Water Quality: An Introduction; Boyd, C.E., Ed.; Springer International Publishing: Cham, 2020; pp. 21–39. ISBN 978-3-030-23335-8. [Google Scholar]
- Miroshnichenko, L. Main Characteristics of the Sun. In Solar-Terrestrial Relations: From Solar Activity to Heliobiology; Miroshnichenko, L., Ed.; Springer International Publishing: Cham, 2023; pp. 7–20. ISBN 978-3-031-22548-2. [Google Scholar]
- Lapenta, G. Chapter 8 - Space Weather: Variability in the Sun-Earth Connection. In The Dynamical Ionosphere; Materassi, M., Forte, B., Coster, A.J., Skone, S., Eds.; Elsevier, 2020; pp. 61–85 ISBN 978-0-12-814782-5.
- Menezes, F.; Selhorst, C.L.; Valio, A. The Subterahertz Sun. Boletim da Sociedade Astronômica Brasileira 2020, 31, 57–61. [Google Scholar]
- del Burgo, C.; Allende Prieto, C. Accurate Parameters for HD 209458 and Its Planet from HST Spectrophotometry. Monthly Notices of the Royal Astronomical Society 2016, 463, 1400–1408. [Google Scholar] [CrossRef]
- CENDI, [United States Commerce, Energy, NASA, and Defense Information] Frequently Asked Questions about Copyright; CENDI [United States Commerce, Energy, NASA, and Defense Information]: USA, 2017.
- Tasmin, N.; Farjana, S.H.; Hossain, M.R.; Golder, S.; Mahmud, M.A.P. Integration of Solar Process Heat in Industries: A Review. Clean Technologies 2022, 4, 97–131. [Google Scholar] [CrossRef]
- Masera, K.; Tannous, H.; Stojceska, V.; Tassou, S. An Investigation of the Recent Advances of the Integration of Solar Thermal Energy Systems to the Dairy Processes. Renewable and Sustainable Energy Reviews 2023, 172, 113028. [Google Scholar] [CrossRef]
- Mohammadi, K.; Khanmohammadi, S.; Immonen, J.; Powell, K. Techno-Economic Analysis and Environmental Benefits of Solar Industrial Process Heating Based on Parabolic Trough Collectors. Sustainable Energy Technologies and Assessments 2021, 47, 101412. [Google Scholar] [CrossRef]
- Ismail, M.I.; Yunus, N.A.; Hashim, H. Integration of Solar Heating Systems for Low-Temperature Heat Demand in Food Processing Industry – A Review. Renewable and Sustainable Energy Reviews 2021, 147, 111192. [Google Scholar] [CrossRef]
- Said, Z.; Ghodbane, M.; Tiwari, A.K.; Ali, H.M.; Boumeddane, B.; Ali, Z.M. 4E (Energy, Exergy, Economic, and Environment) Examination of a Small LFR Solar Water Heater: An Experimental and Numerical Study. Case Studies in Thermal Engineering 2021, 27, 101277. [Google Scholar] [CrossRef]
- EPA, [United States Environmental Protection Agency] Solar Heating and Cooling Technologies. Available online: https://19january2017snapshot.epa.gov/rhc/solar-heating-and-cooling-technologies (accessed on 19 April 2025).
- OpenLearn, [The Open University] Can Renewable Energy Sources Power the World? Available online: https://www.open.edu/openlearn/mod/oucontent/view.php?id=73759§ion=7 (accessed on 19 April 2025).
- Vengadesan, E.; Senthil, R. A Review on Recent Developments in Thermal Performance Enhancement Methods of Flat Plate Solar Air Collector. Renewable and Sustainable Energy Reviews 2020, 134, 110315. [Google Scholar] [CrossRef]
- Ramani, B.M.; Gupta, A.; Kumar, R. Performance of a Double Pass Solar Air Collector. Solar Energy 2010, 84, 1929–1937. [Google Scholar] [CrossRef]
- Tripanagnostopoulos, Y.; Souliotis, M.; Nousia, T. Solar Collectors with Colored Absorbers. Solar Energy 2000, 68, 343–356. [Google Scholar] [CrossRef]
- Marzouk, O.A. Dataset of Total Emissivity for CO2, H2O, and H2O-CO2 Mixtures; over a Temperature Range of 300-2900 K and a Pressure-Pathlength Range of 0.01-50 Atm.m. Data in Brief 2025, 59, 111428. [Google Scholar] [CrossRef]
- Badache, M.; Rousse, D.R.; Hallé, S.; Quesada, G. Experimental and Numerical Simulation of a Two-Dimensional Unglazed Transpired Solar Air Collector. Solar Energy 2013, 93, 209–219. [Google Scholar] [CrossRef]
- Karim, M.A.; Hawlader, M.N.A. Development of Solar Air Collectors for Drying Applications. Energy Conversion and Management 2004, 45, 329–344. [Google Scholar] [CrossRef]
- Myroniuk, K.; Furdas, Y.; Zhelykh, V.; Adamski, M.; Gumen, O.; Savin, V.; Mitoulis, S.-A. Passive Ventilation of Residential Buildings Using the Trombe Wall. Buildings 2024, 14, 3154. [Google Scholar] [CrossRef]
- EPA, [United States Environmental Protection Agency] EPA Sketch │ Transpired Solar Air Collectors. Available online: https://19january2017snapshot.epa.gov/sites/production/files/styles/medium/public/2014-11/transpired.png (accessed on 12 April 2025).
- García, J.; Socolovsky, H.; Plá, J. On the Spectral Response Measurement of Multijunction Solar Cells. Meas. Sci. Technol. 2017, 28, 055203. [Google Scholar] [CrossRef]
- Simon, M.; Meyer, E.L. The Effects of Spectral Evaluation of C-Si Modules. Progress in Photovoltaics: Research and Applications 2011, 19, 1–10. [Google Scholar] [CrossRef]
- Zhang, G.; Liu, C.; Wang, J.; Kuang, X.; Su, Q. A Dual-Mode Solar Spectral Converter CaLaGa3S6O:Ce3+,Pr3+: UV-Vis-NIR Luminescence Properties and Solar Spectral Converting Mechanism. J. Mater. Chem. 2012, 22, 2226–2232. [Google Scholar] [CrossRef]
- Farina, A.; Carlotto, A.; Varas, S.; Chiasera, A.; Pietralunga, S.M. An Asymmetric Low Concentrator and Spectral Splitting Approach to Bifacial Four-Terminal Photovoltaic Modules. Progress in Photovoltaics: Research and Applications 2023, 31, 1299–1314. [Google Scholar] [CrossRef]
- Ferrada, P.; Marzo, A.; Cabrera, E.; Chu, H.; del Campo, V.; Rabanal, J.; Diaz-Almeida, D.; Schneider, A.; Kopecek, R. Potential for Photogenerated Current for Silicon Based Photovoltaic Modules in the Atacama Desert. Solar Energy 2017, 144, 580–593. [Google Scholar] [CrossRef]
- Zhao, J.; Song, Y.; Lam, W.-H.; Liu, W.; Liu, Y.; Zhang, Y.; Wang, D. Solar Radiation Transfer and Performance Analysis of an Optimum Photovoltaic/Thermal System. Energy Conversion and Management 2011, 52, 1343–1353. [Google Scholar] [CrossRef]
- Law, A.M.; Jones, L.O.; Walls, J.M. The Performance and Durability of Anti-Reflection Coatings for Solar Module Cover Glass – a Review. Solar Energy 2023, 261, 85–95. [Google Scholar] [CrossRef]
- Sjerps-Koomen, E.A.; Alsema, E.A.; Turkenburg, W.C. A Simple Model for PV Module Reflection Losses under Field Conditions. Solar Energy 1996, 57, 421–432. [Google Scholar] [CrossRef]
- Herrando, M.; Pantaleo, A.M.; Wang, K.; Markides, C.N. Solar Combined Cooling, Heating and Power Systems Based on Hybrid PVT, PV or Solar-Thermal Collectors for Building Applications. Renewable Energy 2019, 143, 637–647. [Google Scholar] [CrossRef]
- Lorestani, A.; Ardehali, M.M. Optimization of Autonomous Combined Heat and Power System Including PVT, WT, Storages, and Electric Heat Utilizing Novel Evolutionary Particle Swarm Optimization Algorithm. Renewable Energy 2018, 119, 490–503. [Google Scholar] [CrossRef]
- Ishak, M.A.A.B.; Ibrahim, A.; Fazlizan, A.; Fauzan, M.F.; Sopian, K.; Rahmat, A.A. Exergy Performance of a Reversed Circular Flow Jet Impingement Bifacial Photovoltaic Thermal (PVT) Solar Collector. Case Studies in Thermal Engineering 2023, 49, 103322. [Google Scholar] [CrossRef]
- Rajani, A.; Said, D.M.; Noorden, Z.A.; Ahmad, N.; Atmaja, T.D.; Fudholi, A. Performance Evaluation of Bifacial Photovoltaic Thermal Systems in Environmental Condition. In Proceedings of the 2024 IEEE International Conference on Advanced Power Engineering and Energy (APEE), September 2024; pp. 53–58. [Google Scholar]
- Mahmood, A.J. Experimental Study for Improving Unglazed Solar System. Cogent Engineering 2021, 8, 1961564. [Google Scholar] [CrossRef]
- Medved, S.; Arkar, C.; Černe, B. A Large-Panel Unglazed Roof-Integrated Liquid Solar Collector––Energy and Economic Evaluation. Solar Energy 2003, 75, 455–467. [Google Scholar] [CrossRef]
- Shemelin, V.; Matuska, T. Unglazed Solar Thermal Collector for Building Facades. Energy Reports 2022, 8, 605–617. [Google Scholar] [CrossRef]
- EPA, [United States Environmental Protection Agency] EPA Sketch │ Unglazed Solar Collector. Available online: https://19january2017snapshot.epa.gov/sites/production/files/styles/large/public/2014-11/unglazed.png (accessed on 12 April 2025).
- Dagdougui, H.; Ouammi, A.; Robba, M.; Sacile, R. Thermal Analysis and Performance Optimization of a Solar Water Heater Flat Plate Collector: Application to Tétouan (Morocco). Renewable and Sustainable Energy Reviews 2011, 15, 630–638. [Google Scholar] [CrossRef]
- Klein, S.A. Calculation of Flat-Plate Collector Utilizability. Solar Energy 1978, 21, 393–402. [Google Scholar] [CrossRef]
- Pandey, K.M.; Chaurasiya, R. A Review on Analysis and Development of Solar Flat Plate Collector. Renewable and Sustainable Energy Reviews 2017, 67, 641–650. [Google Scholar] [CrossRef]
- EPA, [United States Environmental Protection Agency] EPA Sketch │ Flat-Plate Solar Collectors. Available online: https://19january2017snapshot.epa.gov/sites/production/files/styles/large/public/2014-11/flat-plate.png (accessed on 12 April 2025).
- Griffiths, P.W.; di Leo, M.; Cartwright, P.; Eames, P.C.; Yianoulis, P.; Leftheriotis, G.; Norton, B. Fabrication of Evacuated Glazing at Low Temperature. Solar Energy 1998, 63, 243–249. [Google Scholar] [CrossRef]
- Marzouk, O.A. InvSim Algorithm for Pre-Computing Airplane Flight Controls in Limited-Range Autonomous Missions, and Demonstration via Double-Roll Maneuver of Mirage III Fighters. Scientific Reports 2025, 15, 23382. [Google Scholar] [CrossRef]
- Ghosh, A.; Norton, B.; Duffy, A. Measured Thermal Performance of a Combined Suspended Particle Switchable Device Evacuated Glazing. Applied Energy 2016, 169, 469–480. [Google Scholar] [CrossRef]
- Collins, R.E.; Robinson, S.J. Evacuated Glazing. Solar Energy 1991, 47, 27–38. [Google Scholar] [CrossRef]
- Ghosh, A.; Norton, B.; Duffy, A. Effect of Sky Clearness Index on Transmission of Evacuated (Vacuum) Glazing. Renewable Energy 2017, 105, 160–166. [Google Scholar] [CrossRef]
- Sampathkumar, K.; Arjunan, T.V.; Senthilkumar, P. The Experimental Investigation of a Solar Still Coupled with an Evacuated Tube Collector. Energy Sources, Part A: Recovery, Utilization, and Environmental Effects 2013, 35, 261–270. [Google Scholar] [CrossRef]
- Chopra, K.; Tyagi, V.V.; Pandey, A.K.; Sari, A. Global Advancement on Experimental and Thermal Analysis of Evacuated Tube Collector with and without Heat Pipe Systems and Possible Applications. Applied Energy 2018, 228, 351–389. [Google Scholar] [CrossRef]
- Sabiha, M.A.; Saidur, R.; Mekhilef, S.; Mahian, O. Progress and Latest Developments of Evacuated Tube Solar Collectors. Renewable and Sustainable Energy Reviews 2015, 51, 1038–1054. [Google Scholar] [CrossRef]
- Chai, S.; Yao, J.; Liang, J.-D.; Chiang, Y.-C.; Zhao, Y.; Chen, S.-L.; Dai, Y. Heat Transfer Analysis and Thermal Performance Investigation on an Evacuated Tube Solar Collector with Inner Concentrating by Reflective Coating. Solar Energy 2021, 220, 175–186. [Google Scholar] [CrossRef]
- Sobhansarbandi, S.; Martinez, P.M.; Papadimitratos, A.; Zakhidov, A.; Hassanipour, F. Evacuated Tube Solar Collector with Multifunctional Absorber Layers. Solar Energy 2017, 146, 342–350. [Google Scholar] [CrossRef]
- Chen, X.; Yang, X. Heat Transfer Enhancement for U-Pipe Evacuated Tube Solar Absorber by High-Emissivity Coating on Metal Fin. Journal of Building Engineering 2022, 50, 104213. [Google Scholar] [CrossRef]
- EPA, [United States Environmental Protection Agency] EPA Sketch │ Evacuated Tube Solar Collectors. Available online: https://19january2017snapshot.epa.gov/sites/production/files/styles/large/public/2014-11/evacuated-tube.png (accessed on 12 April 2025).
- AET, [Alternative Energy Tutorials] Evacuated Tube Collector for Solar Hot Water System. Available online: https://www.alternative-energy-tutorials.com/solar-hot-water/evacuated-tube-collector.html (accessed on 19 April 2025).
- Marzouk, O.A.; Huckaby, E.D. Simulation of a Swirling Gas-Particle Flow Using Different k-Epsilon Models and Particle-Parcel Relationships. Engineering Letters 2010, 18. [Google Scholar]
- Jafari Mosleh, H.; Jahangiri Mamouri, S.; Shafii, M.B.; Hakim Sima, A. A New Desalination System Using a Combination of Heat Pipe, Evacuated Tube and Parabolic Trough Collector. Energy Conversion and Management 2015, 99, 141–150. [Google Scholar] [CrossRef]
- Elsheniti, M.B.; Kotb, A.; Elsamni, O. Thermal Performance of a Heat-Pipe Evacuated-Tube Solar Collector at High Inlet Temperatures. Applied Thermal Engineering 2019, 154, 315–325. [Google Scholar] [CrossRef]
- Ayompe, L.M.; Duffy, A. Thermal Performance Analysis of a Solar Water Heating System with Heat Pipe Evacuated Tube Collector Using Data from a Field Trial. Solar Energy 2013, 90, 17–28. [Google Scholar] [CrossRef]
- Tauquir, A.; Singh, S.K. Analysis of Evacuated Tube Heatpipe Collectors Using Oil and Foamed Metals: - A Review. International Journal of Engineering Technology and Applied Science 2022, 8, 1–6. [Google Scholar]
- Marzouk, O.A. Evolutionary Computing Applied to Design Optimization. In Proceedings of the ASME 2007 International Design Engineering Technical Conferences and Computers and Information in Engineering Conference (IDETC-CIE 2007), (4–7 September 2007); ASME [American Society of Mechanical Engineers]: Las Vegas, Nevada, USA, May 20 2009; Vol. 2, pp. 995–1003.
- Rybár, R.; Beer, M. The Comparative Field Performance Study of Heat Pipe Evacuated Tube Collectors with Standard Design Manifold Header and Parallel Flow Manifold Header Based on the Metal Foam Structural Element. Solar Energy 2015, 122, 359–367. [Google Scholar] [CrossRef]
- Ratismith, W.; Favre, Y. Novel Non-Tracking Solar Collector with Metal-to-Water Contact. In Proceedings of the 2015 IEEE 15th International Conference on Environment and Electrical Engineering (EEEIC), June 2015; pp. 347–351. [Google Scholar]
- Marzouk, O.A.; Nayfeh, A.H. A Study of the Forces on an Oscillating Cylinder. In Proceedings of the ASME 2007 26th International Conference on Offshore Mechanics and Arctic Engineering (OMAE 2007); ASME [American Society of Mechanical Engineers]: San Diego, California, USA, May 20 2009; pp. 741–752.
- Lim, C.S.L.; Sobhansarbandi, S. CFD Modeling of an Evacuated U-Tube Solar Collector Integrated with a Novel Heat Transfer Fluid. Sustainable Energy Technologies and Assessments 2022, 52, 102051. [Google Scholar] [CrossRef]
- Marzouk, O.A. One-Way and Two-Way Couplings of CFD and Structural Models and Application to the Wake-Body Interaction. Applied Mathematical Modelling 2011, 35, 1036–1053. [Google Scholar] [CrossRef]
- Marzouk, O.A. Contrasting the Cartesian and Polar Forms of the Shedding-Induced Force Vector in Response to 12 Subharmonic and Superharmonic Mechanical Excitations. Fluid Dynamics Research 2010, 42, 035507. [Google Scholar] [CrossRef]
- Fok, S. c.; Tan, F. l.; Leow, K. k. CAD Modelling of Solidification Phase Front around a Vertical Finned Tube. International Journal of Computer Aided Engineering and Technology 2012, 4, 420–431. [Google Scholar] [CrossRef]
- Marzouk, O.A. Flow Control Using Bifrequency Motion. Theoretical and Computational Fluid Dynamics 2011, 25, 381–405. [Google Scholar] [CrossRef]
- Rosa, C.; Panagiotis, T.; Vassiliki, D. Optical Analysis of an Evacuated Tube Collector with Built-in Compound Parabolic Concentrator for Process Heat Applications. IOP Conf. Ser.: Earth Environ. Sci. 2020, 410, 012040. [Google Scholar] [CrossRef]
- Jebasingh, V.K.; Herbert, G.M.J. A Review of Solar Parabolic Trough Collector. Renewable and Sustainable Energy Reviews 2016, 54, 1085–1091. [Google Scholar] [CrossRef]
- Manikandan, G.K.; Iniyan, S.; Goic, R. Enhancing the Optical and Thermal Efficiency of a Parabolic Trough Collector – A Review. Applied Energy 2019, 235, 1524–1540. [Google Scholar] [CrossRef]
- Naveenkumar, R.; Ravichandran, M.; Stalin, B.; Ghosh, A.; Karthick, A.; Aswin, L.S.R.L.; Priyanka, S.S.H.; Kumar, S.P.; Kumar, S.K. Comprehensive Review on Various Parameters That Influence the Performance of Parabolic Trough Collector. Environ Sci Pollut Res 2021, 28, 22310–22333. [Google Scholar] [CrossRef]
- Kalogirou, S.A. A Detailed Thermal Model of a Parabolic Trough Collector Receiver. Energy 2012, 48, 298–306. [Google Scholar] [CrossRef]
- EPA, [United States Environmental Protection Agency] EPA Sketch │ Concentrating Solar Systems (Parabolic Trough Collector). Available online: https://19january2017snapshot.epa.gov/sites/production/files/styles/large/public/2014-11/concentrating-solar.png (accessed on 12 April 2025).
- Gharat, P.V.; Bhalekar, S.S.; Dalvi, V.H.; Panse, S.V.; Deshmukh, S.P.; Joshi, J.B. Chronological Development of Innovations in Reflector Systems of Parabolic Trough Solar Collector (PTC) - A Review. Renewable and Sustainable Energy Reviews 2021, 145, 111002. [Google Scholar] [CrossRef]
- Upadhyay, B.H.; Patel, A.J.; Ramana, P.V. A Detailed Review on Solar Parabolic Trough Collector. International Journal of Ambient Energy 2022, 43, 176–196. [Google Scholar] [CrossRef]
- Goel, A.; Manik, G.; Mahadeva, R. A Review of Parabolic Trough Collector and Its Modeling. In Proceedings of the Soft Computing: Theories and Applications; Pant, M., Sharma, T.K., Verma, O.P., Singla, R., Sikander, A., Eds.; Springer: Singapore, 2020; pp. 803–813. [Google Scholar]
- Mokhtar, G.; Boussad, B.; Noureddine, S. A Linear Fresnel Reflector as a Solar System for Heating Water: Theoretical and Experimental Study. Case Studies in Thermal Engineering 2016, 8, 176–186. [Google Scholar] [CrossRef]
- Abbas, R.; Montes, M.J.; Piera, M.; Martínez-Val, J.M. Solar Radiation Concentration Features in Linear Fresnel Reflector Arrays. Energy Conversion and Management 2012, 54, 133–144. [Google Scholar] [CrossRef]
- Wang, G.; Wang, F.; Shen, F.; Jiang, T.; Chen, Z.; Hu, P. Experimental and Optical Performances of a Solar CPV Device Using a Linear Fresnel Reflector Concentrator. Renewable Energy 2020, 146, 2351–2361. [Google Scholar] [CrossRef]
- DOE, [United States Department of Energy] DOE Sketch │ Linear Fresnel Reflector Systems. Available online: https://www.energy.gov/sites/default/files/styles/full_article_width/public/linear_frisnel.gif (accessed on 12 April 2025).
- Wang, G.; Ge, Z.; Lin, J. Design and Performance Analysis of a Novel Solar Photovoltaic/Thermal System Using Compact Linear Fresnel Reflector and Nanofluids Beam Splitting Device. Case Studies in Thermal Engineering 2022, 35, 102167. [Google Scholar] [CrossRef]
- Wang, G.; Wang, F.; Shen, F.; Chen, Z.; Hu, P. Novel Design and Thermodynamic Analysis of a Solar Concentration PV and Thermal Combined System Based on Compact Linear Fresnel Reflector. Energy 2019, 180, 133–148. [Google Scholar] [CrossRef]
- Babu, M.; Sekhar Babu, P.; Raj, S.S.; Saravanan, S. Theoretical Design, Material Study and Material Selection for Compact Linear Fresnel Reflector Concentrating System. Materials Today: Proceedings 2021, 45, 1671–1678. [Google Scholar] [CrossRef]
- Kumar, K.H.; Daabo, A.M.; Karmakar, M.K.; Hirani, H. Solar Parabolic Dish Collector for Concentrated Solar Thermal Systems: A Review and Recommendations. Environ Sci Pollut Res 2022, 29, 32335–32367. [Google Scholar] [CrossRef]
- Maurya, A.; Kumar, A.; Sharma, D. A Comprehensive Review on Performance Assessment of Solar Cavity Receiver with Parabolic Dish Collector. Energy Sources, Part A: Recovery, Utilization, and Environmental Effects 2022, 44, 4808–4845. [Google Scholar] [CrossRef]
- Vishnu, S.K.; Senthil, R. Experimental Performance Evaluation of a Solar Parabolic Dish Collector Using Spiral Flow Path Receiver. Applied Thermal Engineering 2023, 231, 120979. [Google Scholar] [CrossRef]
- DOE, [United States Department of Energy] DOE Sketch │ Dish/Engine System. Available online: https://www.energy.gov/sites/default/files/styles/full_article_width/public/dish_receivers.gif (accessed on 12 April 2025).
- Srilakshmi, G.; Venkatesh, V.; Thirumalai, N.C.; Suresh, N.S. Challenges and Opportunities for Solar Tower Technology in India. Renewable and Sustainable Energy Reviews 2015, 45, 698–709. [Google Scholar] [CrossRef]
- Segal, A.; Epstein, M. The Optics of the Solar Tower Reflector. Solar Energy 2001, 69, 229–241. [Google Scholar] [CrossRef]
- Milidonis, K.; Blanco, M.J.; Grigoriev, V.; Panagiotou, C.F.; Bonanos, A.M.; Constantinou, M.; Pye, J.; Asselineau, C.-A. Review of Application of AI Techniques to Solar Tower Systems. Solar Energy 2021, 224, 500–515. [Google Scholar] [CrossRef]
- Zhou, X.; Yang, J.; Xiao, B.; Hou, G.; Xing, F. Analysis of Chimney Height for Solar Chimney Power Plant. Applied Thermal Engineering 2009, 29, 178–185. [Google Scholar] [CrossRef]
- Zhou, X.; Wang, F.; Ochieng, R.M. A Review of Solar Chimney Power Technology. Renewable and Sustainable Energy Reviews 2010, 14, 2315–2338. [Google Scholar] [CrossRef]
- Marzouk, O.A. Energy Generation Intensity (EGI) of Solar Updraft Tower (SUT) Power Plants Relative to CSP Plants and PV Power Plants Using the New Energy Simulator “Aladdin. ” Energies 2024, 17, 405. [Google Scholar] [CrossRef]
- Shi, L.; Zhang, G.; Yang, W.; Huang, D.; Cheng, X.; Setunge, S. Determining the Influencing Factors on the Performance of Solar Chimney in Buildings. Renewable and Sustainable Energy Reviews 2018, 88, 223–238. [Google Scholar] [CrossRef]
- Ong, K.S. A Mathematical Model of a Solar Chimney. Renewable Energy 2003, 28, 1047–1060. [Google Scholar] [CrossRef]
- Ong, K.S.; Chow, C.C. Performance of a Solar Chimney. Solar Energy 2003, 74, 1–17. [Google Scholar] [CrossRef]
- Afonso, C.; Oliveira, A. Solar Chimneys: Simulation and Experiment. Energy and Buildings 2000, 32, 71–79. [Google Scholar] [CrossRef]
- DOE, [United States Department of Energy] DOE Sketch │ Power Tower System (Solar Electricity and Industrial Process Heat). Available online: https://www.energy.gov/sites/default/files/styles/full_article_width/public/2023-05/Concentrating-Solar-Thermal-Power-Applications.PNG (accessed on 12 April 2025).
- DOE, [United States Department of Energy] DOE Sketch │ Power Tower System. Available online: https://www.energy.gov/sites/default/files/styles/full_article_width/public/power_tower.gif (accessed on 12 April 2025).
- Mubarrat, M.; Mashfy, M.M.; Farhan, T.; Ehsan, M.M. Research Advancement and Potential Prospects of Thermal Energy Storage in Concentrated Solar Power Application. International Journal of Thermofluids 2023, 20, 100431. [Google Scholar] [CrossRef]
- Alexopoulos, S.; Hoffschmidt, B. Concentrating Receiver Systems (Solar Power Tower). In Solar Thermal Energy; Alexopoulos, S., Kalogirou, S.A., Eds.; Springer US: New York, NY, 2022; pp. 63–110. ISBN 978-1-07-161422-8. [Google Scholar]
- Okoroigwe, E.; Madhlopa, A. An Integrated Combined Cycle System Driven by a Solar Tower: A Review. Renewable and Sustainable Energy Reviews 2016, 57, 337–350. [Google Scholar] [CrossRef]
- Collado, F.J.; Guallar, J. A Review of Optimized Design Layouts for Solar Power Tower Plants with Campo Code. Renewable and Sustainable Energy Reviews 2013, 20, 142–154. [Google Scholar] [CrossRef]
- Boretti, A.; Castelletto, S.; Al-Zubaidy, S. Concentrating Solar Power Tower Technology: Present Status and Outlook. Nonlinear Engineering 2019, 8, 10–31. [Google Scholar] [CrossRef]
- Reddy, K.S.; Ravi Kumar, K.; Devaraj, V.A. Feasibility Analysis of Megawatt Scale Solar Thermal Power Plants. Journal of Renewable and Sustainable Energy 2012, 4, 063111. [Google Scholar] [CrossRef]
- Pavlović, T.M.; Radonjić, I.S.; Milosavljević, D.D.; Pantić, L.S. A Review of Concentrating Solar Power Plants in the World and Their Potential Use in Serbia. Renewable and Sustainable Energy Reviews 2012, 16, 3891–3902. [Google Scholar] [CrossRef]
- Poullikkas, A. Economic Analysis of Power Generation from Parabolic Trough Solar Thermal Plants for the Mediterranean Region—A Case Study for the Island of Cyprus. Renewable and Sustainable Energy Reviews 2009, 13, 2474–2484. [Google Scholar] [CrossRef]
- Kaltschmitt, M.; Streicher, W.; Wiese, A. Solar Thermal Power Plants. In Renewable Energy: Technology, and Environment Economics; Kaltschmitt, M., Streicher, W., Wiese, A., Eds.; Springer: Berlin, Heidelberg, 2007; pp. 171–228. ISBN 978-3-540-70949-7. [Google Scholar]
- Ahmed, M.H.; Rady, M.; Amin, A.M.A.; Montagnino, F.M.; Paredes, F. Comparison of Thermal and Optical Performance of Linear Fresnel and Parabolic Trough Concentrator. In Proceedings of the 2015 International Conference on Renewable Energy Research and Applications (ICRERA), November 2015; pp. 626–629. [Google Scholar]
- Abu-Bakar, S.H.; Muhammad-Sukki, F.; Ramirez-Iniguez, R.; Burek, S.; Mallick, T.K.; McLennan, C.; Munir, A.B.; Yasin, S.H.M. Renewable Heat Incentive for Solar Thermal Systems in the United Kingdom: The next Big Thing? In Proceedings of the 2012 IEEE International Conference on Power and Energy (PECon), December 2012; pp. 626–631. [Google Scholar]
- Grubler, A.; Wilson, C. Energy Technology Innovation: Learning from Historical Successes and Failures; Cambridge University Press: New York City, New York, USA, 2013; ISBN 978-1-107-72918-6. [Google Scholar]
- Lizárraga-Morazán, J.-R.; Picón-Núñez, M. Optimal Determination of the Q/A Factor for Parabolic Concentrator Solar Collector Networks. Chemical Engineering Transactions 2024, 114, 319–324. [Google Scholar] [CrossRef]
- SSC WG, [Small-Scale Working Group] Annex 3 Analysis and Explanation of the Conversion Factor for Solar Thermal Collectors; UNFCCC [United Nations Framework Convention on Climate Change]: Bonn, Germany, 2007; pp. 1–3.
- Reddy, K.S.; Kumar, K.R. Solar Collector Field Design and Viability Analysis of Stand-Alone Parabolic Trough Power Plants for Indian Conditions. Energy for Sustainable Development 2012, 16, 456–470. [Google Scholar] [CrossRef]
- Perers, B.; Karlsson, B. External Reflectors for Large Solar Collector Arrays, Simulation Model and Experimental Results. Solar Energy 1993, 51, 327–337. [Google Scholar] [CrossRef]
- Obstawski, P.; Bakoń, T.; Czekalski, D. Comparison of Solar Collector Testing Methods—Theory and Practice. Processes 2020, 8, 1340. [Google Scholar] [CrossRef]
- Cau, G.; Cocco, D. Comparison of Medium-Size Concentrating Solar Power Plants Based on Parabolic Trough and Linear Fresnel Collectors. Energy Procedia 2014, 45, 101–110. [Google Scholar] [CrossRef]
- Solarthermalworld Solarthermalworld │ About Us. Available online: https://solarthermalworld.org/about-us (accessed on 20 April 2025).
- EEF, [European Energy Forum] ICA Europe. Available online: https://www.europeanenergyforum.eu/associate-member/european-copper-institute (accessed on 20 April 2025).
- Solar Payback Solar Payback │ Suppliers. Available online: https://www.solar-payback.com/suppliers (accessed on 20 April 2025).
- Solrico Solrico │ Contact Us. Available online: https://www.solrico.com/index.php?id=12 (accessed on 20 April 2025).
- Fairlie, R.; Fossen, F.M. The Early Impacts of the COVID-19 Pandemic on Business Sales. Small Bus Econ 2022, 58, 1853–1864. [Google Scholar] [CrossRef] [PubMed]
- Meyer, B.H.; Prescott, B.; Sheng, X.S. The Impact of the COVID-19 Pandemic on Business Expectations. International Journal of Forecasting 2022, 38, 529–544. [Google Scholar] [CrossRef] [PubMed]
- Szczygielski, J.J.; Brzeszczyński, J.; Charteris, A.; Bwanya, P.R. The COVID-19 Storm and the Energy Sector: The Impact and Role of Uncertainty. Energy Economics 2022, 109, 105258. [Google Scholar] [CrossRef]
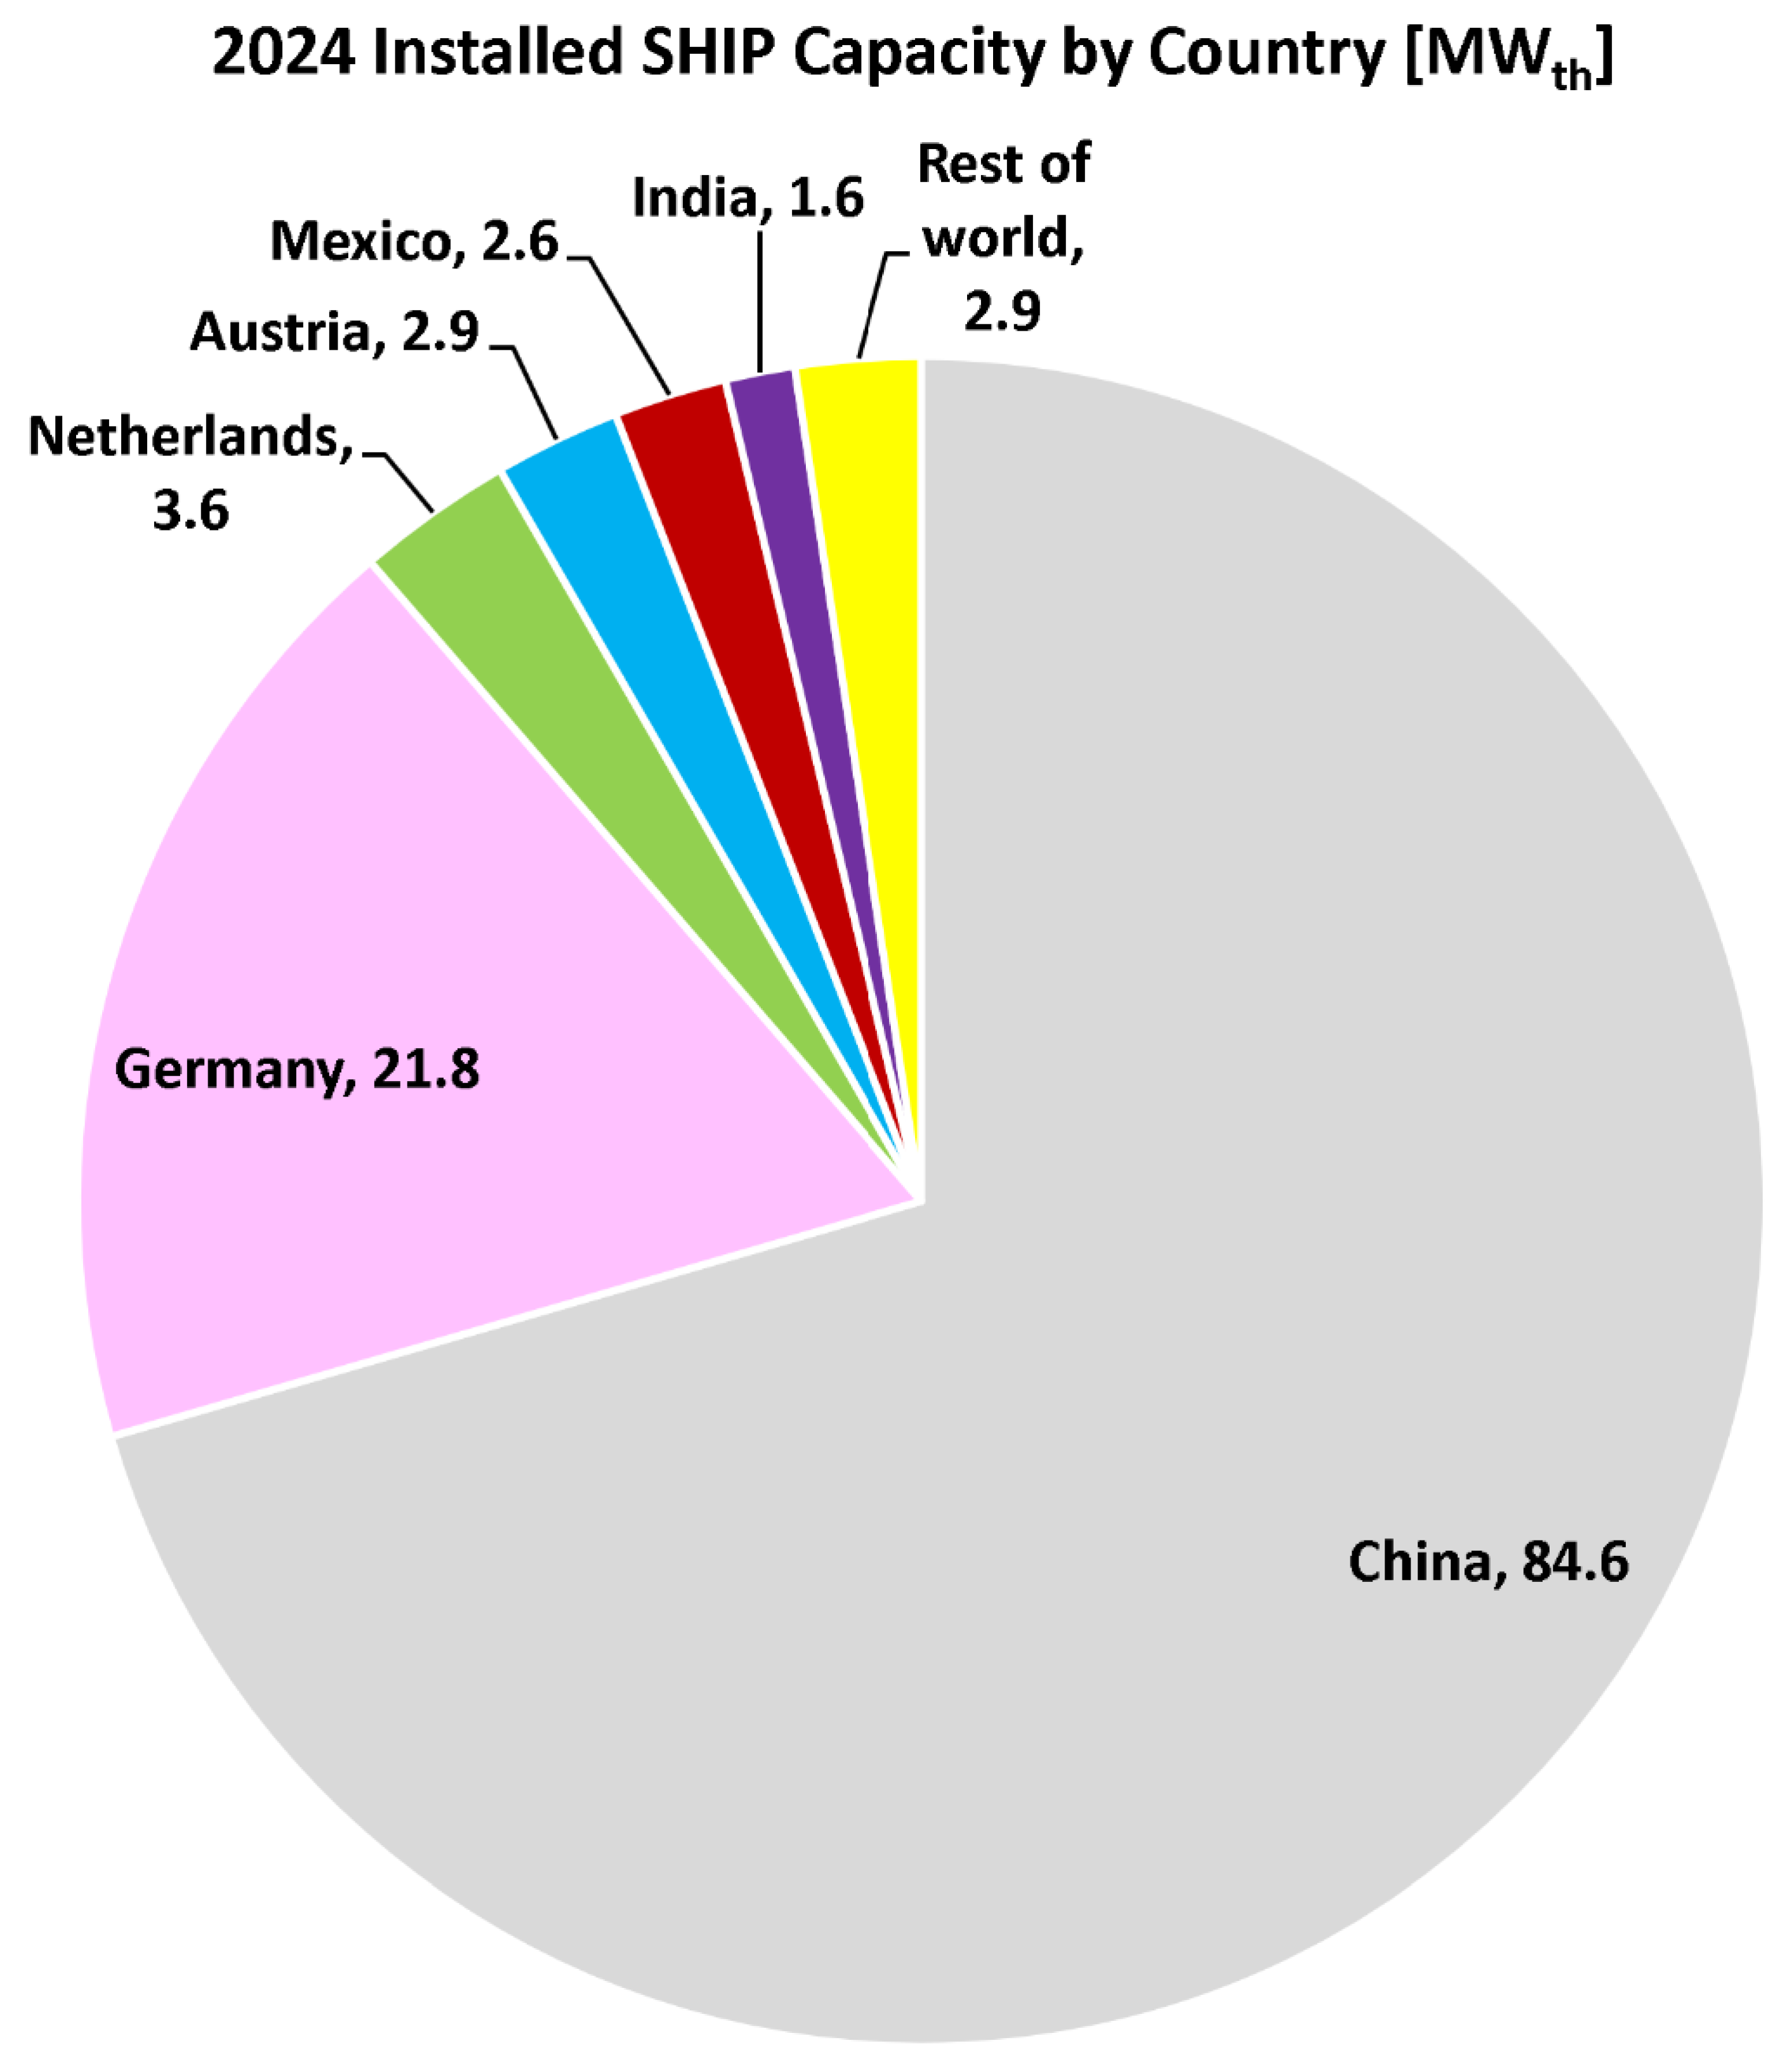
- Solarthermalworld Solarthermalworld │ 2024 Global SHIP Market According to New Capacity per Country. Available online: https://solarthermalworld.org/wp-content/uploads/2025/03/2024-Global-SHIP-market-according-to-new-capacity-per-country.png (accessed on 21 April 2025).
- Solarthermalworld Solarthermalworld │ 2024 Global SHIP Market According to Collector Type. Available online: https://solarthermalworld.org/wp-content/uploads/2025/03/2024-Global-SHIP-market-according-to-collector-type.png (accessed on 21 April 2025).
- Otte, P.P. Solar Cookers in Developing Countries—What Is Their Key to Success? Energy Policy 2013, 63, 375–381. [Google Scholar] [CrossRef]
- Cuce, E.; Cuce, P.M. A Comprehensive Review on Solar Cookers. Applied Energy 2013, 102, 1399–1421. [Google Scholar] [CrossRef]
- Arunachala, U.C.; Kundapur, A. Cost-Effective Solar Cookers: A Global Review. Solar Energy 2020, 207, 903–916. [Google Scholar] [CrossRef]
- Padonou, E.A.; Akabassi, G.C.; Akakpo, B.A.; Sinsin, B. Importance of Solar Cookers in Women’s Daily Lives: A Review. Energy for Sustainable Development 2022, 70, 466–474. [Google Scholar] [CrossRef]
- Wentzel, M.; Pouris, A. The Development Impact of Solar Cookers: A Review of Solar Cooking Impact Research in South Africa. Energy Policy 2007, 35, 1909–1919. [Google Scholar] [CrossRef]
- Xiaowu, W.; Ben, H. Exergy Analysis of Domestic-Scale Solar Water Heaters. Renewable and Sustainable Energy Reviews 2005, 9, 638–645. [Google Scholar] [CrossRef]
- Buckles, W.E.; Klein, S.A. Analysis of Solar Domestic Hot Water Heaters. Solar Energy 1980, 25, 417–424. [Google Scholar] [CrossRef]
- Nanda, I.R.; Pambudi, N.A.; Aziz, M. Review on the Progress of Solar Water Heaters and Their Future Perspectives. Energy Technology 2023, 11, 2300191. [Google Scholar] [CrossRef]
- Jaisankar, S.; Ananth, J.; Thulasi, S.; Jayasuthakar, S.T.; Sheeba, K.N. A Comprehensive Review on Solar Water Heaters. Renewable and Sustainable Energy Reviews 2011, 15, 3045–3050. [Google Scholar] [CrossRef]
- Al-Badi, A.H.; Albadi, M.H. Domestic Solar Water Heating System in Oman: Current Status and Future Prospects. Renewable and Sustainable Energy Reviews 2012, 16, 5727–5731. [Google Scholar] [CrossRef]
- Kalogirou, S.A. Environmental Benefits of Domestic Solar Energy Systems. Energy Conversion and Management 2004, 45, 3075–3092. [Google Scholar] [CrossRef]
- Ayadi, O.; Al-Dahidi, S. Comparison of Solar Thermal and Solar Electric Space Heating and Cooling Systems for Buildings in Different Climatic Regions. Solar Energy 2019, 188, 545–560. [Google Scholar] [CrossRef]
- Artur, C.; Neves, D.; Cuamba, B.C.; Leão, A.J. Comparison of Two Dynamic Approaches to Modelling Solar Thermal Systems for Domestic Hot Water. Sustainable Energy Technologies and Assessments 2018, 30, 292–303. [Google Scholar] [CrossRef]
- Nafey, A.S. Simulation of Solar Heating Systems—an Overview. Renewable and Sustainable Energy Reviews 2005, 9, 576–591. [Google Scholar] [CrossRef]
- Oliveira, M.C.; Iten, M. Modelling of A Solar Thermal Energy System For Energy Efficiency Improvement In A Ceramic Plant. Renew. Energy Environ. Sustain. 2021, 6, 31. [Google Scholar] [CrossRef]
- Modelica Association Modelica │ Modelica Language. Available online: https://modelica.org/language (accessed on 11 August 2025).
- OSMC, [Open Source Modelica Consortium] OpenModelica │ Projects. Available online: https://openmodelica.org/research/projects (accessed on 11 August 2025).
- OSMC, [Open Source Modelica Consortium] OpenModelica │ Modelica.Thermal. Available online: https://build.openmodelica.org/Documentation/Modelica.Thermal.html (accessed on 11 August 2025).
- Ferhatbegović, T.; Zucker, G.; Palensky, P. Model Based Predictive Control for a Solar-Thermal System. In Proceedings of the IEEE Africon ’11, September 2011; pp. 1–6. [Google Scholar]
- Marzouk, O.A.; Nayfeh, A.H. Mitigation of Ship Motion Using Passive and Active Anti-Roll Tanks. In Proceedings of the ASME 2007 International Design Engineering Technical Conferences and Computers and Information in Engineering Conference (IDETC-CIE 2007); ASME [American Society of Mechanical Engineers]: Las Vegas, Nevada, USA, May 20 2009; pp. 215–229.
- da Silva, R.M.; Fernandes, J.L.M. Hybrid Photovoltaic/Thermal (PV/T) Solar Systems Simulation with Simulink/Matlab. Solar Energy 2010, 84, 1985–1996. [Google Scholar] [CrossRef]
- Marzouk, O.A.; Nayfeh, A.H. Control of Ship Roll Using Passive and Active Anti-Roll Tanks. Ocean Engineering 2009, 36, 661–671. [Google Scholar] [CrossRef]
- Marzouk, O.A.; Nayfeh, A.H. Fluid Forces and Structure-Induced Damping of Obliquely-Oscillating Offshore Structures. In Proceedings of the The Eighteenth International Offshore and Polar Engineering Conference (ISOPE-2008); ISOPE [International Society of Offshore and Polar Engineers]: Vancouver, British Columbia, Canada, July 6 2008; Vol. 3, pp. 460–468.
- Marzouk, O.A.; Nayfeh, A.H. Reduction of the Loads on a Cylinder Undergoing Harmonic In-Line Motion. Physics of Fluids 2009, 21, 083103. [Google Scholar] [CrossRef]
- Malvi, C.S.; Dixon-Hardy, D.W.; Crook, R. Energy Balance Model of Combined Photovoltaic Solar-Thermal System Incorporating Phase Change Material. Solar Energy 2011, 85, 1440–1446. [Google Scholar] [CrossRef]
- Marzouk, O.A.; Nayfeh, A.H. Loads on a Harmonically Oscillating Cylinder. In Proceedings of the ASME 2007 International Design Engineering Technical Conferences and Computers and Information in Engineering Conference (IDETC-CIE 2007); ASME [American Society of Mechanical Engineers]: Las Vegas, Nevada, USA, May 20 2009; pp. 1755–1774.
- Lamnatou, C.; Mondol, J.D.; Chemisana, D.; Maurer, C. Modelling and Simulation of Building-Integrated Solar Thermal Systems: Behaviour of the System. Renewable and Sustainable Energy Reviews 2015, 45, 36–51. [Google Scholar] [CrossRef]
- Tijani, A.S.; Roslan, A.M.S.B. Simulation Analysis of Thermal Losses of Parabolic Trough Solar Collector in Malaysia Using Computational Fluid Dynamics. Procedia Technology 2014, 15, 841–848. [Google Scholar] [CrossRef]
- Bierman, B.; Al-Lawatia, H.; DiFilippo, M.; O’Donnell, J. Deploying Enclosed Trough for Thermal EOR at Commercial Scale. AIP Conference Proceedings 2018, 2033, 030002. [Google Scholar] [CrossRef]
- Vajpayee, S.; Rawat, T.; Bhalala, V. Mathematical Modeling of Thermal Enhanced Oil Recovery Method. JME 2023, 13, 9. [Google Scholar] [CrossRef]
- EPCM EPCM │ An Overview and History of Oil Recovery from On-Shore Oil Reserves. Available online: https://epcmholdings.com/an-overview-and-history-of-oil-recovery-from-on-shore-oil-reserves (accessed on 11 August 2025).
- GlassPoint GlassPoint │ Maaden Solar I. Available online: https://www.glasspoint.com/projects/maaden-solar (accessed on 11 August 2025).
- Kar, M.K.; Ӧnal, M.A.R.; Borra, C.R. Alumina Recovery from Bauxite Residue: A Concise Review. Resources, Conservation and Recycling 2023, 198, 107158. [Google Scholar] [CrossRef]
- Donoghue, A.M.; Frisch, N.; Olney, D. Bauxite Mining and Alumina Refining: Process Description and Occupational Health Risks. Journal of Occupational and Environmental Medicine 2014, 56, S12. [Google Scholar] [CrossRef]
- Mahadevan, H.; Ramachandran, T.R. Recent Trends in Alumina and Aluminium Production Technology. Bull. Mater. Sci. 1996, 19, 905–920. [Google Scholar] [CrossRef]
- Metson, J. 2 - Production of Alumina. In Fundamentals of Aluminium Metallurgy; Lumley, R., Ed.; Woodhead Publishing Series in Metals and Surface Engineering; Woodhead Publishing, 2011; pp. 23–48 ISBN 978-1-84569-654-2.
- Maaden, [Saudi Arabian Mining Company] Maaden │ About Maaden. Available online: https://maaden.com/discover-us/about-maaden (accessed on 11 August 2025).
- Huang, J.; Fan, J.; Furbo, S. Feasibility Study on Solar District Heating in China. Renewable and Sustainable Energy Reviews 2019, 108, 53–64. [Google Scholar] [CrossRef]
- Perez-Mora, N.; Bava, F.; Andersen, M.; Bales, C.; Lennermo, G.; Nielsen, C.; Furbo, S.; Martínez-Moll, V. Solar District Heating and Cooling: A Review. International Journal of Energy Research 2018, 42, 1419–1441. [Google Scholar] [CrossRef]
- de Vega, M.; Almendros-Ibañez, J.A.; Ruiz, G. Performance of a LiBr–Water Absorption Chiller Operating with Plate Heat Exchangers. Energy Conversion and Management 2006, 47, 3393–3407. [Google Scholar] [CrossRef]
- Yu, F.W.; Chan, K.T.; Sit, R.K.Y.; Yang, J. Review of Standards for Energy Performance of Chiller Systems Serving Commercial Buildings. Energy Procedia 2014, 61, 2778–2782. [Google Scholar] [CrossRef]


| Line-Focused (Line-Concentrator) | Point-Focused (Point-Concentrator) | |
|---|---|---|
| Type 1 | LFR (linear Fresnel reflector) CLFR (compact linear Fresnel reflector) |
PDC (parabolic dish collector) |
| Type 2 | PTC (parabolic trough collector) | SPT (solar power tower) or heliostats |
| Collector type | Low temperature rise (below 75 °C) |
Medium temperature rise (75–150 °C) |
High temperature rise (150–400 °C) |
|---|---|---|---|
| SAC (solar air collector) | ✓ | ||
| PVT (photovoltaic-thermal) | ✓ | ||
| USC (unglazed solar collector) | ✓ | ||
| FPC-U (flat plate collector, unevacuated) | ✓ | ✓ | ✓ |
| FPC-E (flat plate collector, evacuated) | ✓ | ✓ | ✓ |
| ETC (evacuated tube collector) | ✓ | ✓ | ✓ |
| ETC-CPC (evacuated tube collector, with compound parabolic concentrator) | ✓ | ✓ | |
| PTC-U (parabolic trough collector, unevacuated absorber) | ✓ | ✓ | |
| PTC-E (parabolic trough collector, evacuated absorber) | ✓ | ✓ | |
| LFR-U (linear Fresnel reflector, unevacuated absorber); also, CLFR-U (compact linear Fresnel reflector, unevacuated) | ✓ | ✓ | |
| LFR-E (linear Fresnel reflector, evacuated absorber); also, CLFR-E (compact linear Fresnel reflector, evacuated) | ✓ | ✓ | |
| PDC (parabolic dish collector) | ✓ | ✓ | |
| SPT (solar power tower) or heliostats | ✓ |
| Collector type | Stationary | single-axis tracking | two-axis tracking |
|---|---|---|---|
| SAC (solar air collector) |
✓ | ||
| PVT (photovoltaic-thermal) | ✓ | ||
| USC (unglazed solar collector) | ✓ | ||
| FPC (flat plate collector) | ✓ | ||
| ETC (evacuated tube collector) | ✓ | ||
| PTC (parabolic trough collector) | ✓ | ||
| LFR (linear Fresnel reflector) | ✓ | ||
| PDC (parabolic dish collector) | ✓ | ||
| SPT (solar power tower) or heliostats | ✓ |
| Power Capacity Type | Value | Reference(s) |
|---|---|---|
| Power radiated from the sun | 3.849 × 10¹⁷ GW | [101,102,103] |
| Solar power reaching the Earth | 1.8 × 10⁸ GW | [104,105,106,107] |
| Global electricity, 2023 | 8,900 GW | [108] |
| Global electricity, 2022 | 8,643 GW | [109] |
| Global electricity, 2021 | 8,230 GW | [110] |
| Global electricity, 2020 | 7,694 GW | [111] |
| Global renewable power, 2024 | 4,448 GW | [112] |
| Global renewable power, 2023 | 3,863 GW | [113] |
| Global solar power, 2024 | 2,200 GW (almost entirely photovoltaic “PV”) |
[114,115,116,117] |
| Global hydropower, 2024 | 1,283 GW | [118,119,120] |
| Global wind power, 2024 | 1,133 GW | |
| Global bio power, 2024 | 151 GW | |
| Global geothermal power, 2024 | 15 GW | |
| Global CSP power, 2023 | 6.7 GW | [121] |
| Global CSP power, 2020 | 6.4 GW | [122] |
| SHIP, 2023 | 0.951 GW | [123] |
| SHIP, 2022 | 0.857 GW | [124] |
| Global marine (ocean) power, 2023 | 0.513 GW | [125,126,127,128] |
| Power radiated from 1 m2 of the sun | 0.0633 GW | [129,130,131] |
| Standard test condition (STC) of solar radiative power to 1 m2 of the Earth | 10–6 GW | [132,133] |
| Application Process | |||
|---|---|---|---|
| Application Sector | Low temperature rise (below 75 °C) |
Medium temperature rise (75–150 °C) |
High temperature rise (150–400 °C) |
| Agriculture | Greenhouse heating Drying |
||
| Buildings | Space heating Showering Washing Cleaning |
Cooking | |
| District heating | Feeding into heat networks | Feeding into heat networks | |
| Industry | Heat treatment Drying |
Distilling Pulping Drying of paint |
|
| Chemical | Distilling | Distilling | Distilling |
| Food and beverage | Drying | Boiling Pasteurizing Sterilizing |
|
| Mining | Copper electrolytic refining Mineral drying processes |
Copper electrolytic refining Mineral drying processes |
Nitrate melting Alumina production |
| Textile | Washing | Bleaching Dyeing |
Dyeing |
| Wood | Steaming (steam bending) | Steaming (steam bending) | Drying |
| Main aim | System type | Main findings | Reference |
|---|---|---|---|
| Integrating solar process heat in industries | Flat Plate, Parabolic Trough, Air Collector | In the (food, beverage, and agriculture) sector, 51% of the solar process heat integration takes place at the supply level, while 27.3% takes place at the process level. | [146] |
| Integration of solar thermal energy systems into the dairy processes | Parabolic trough, linear Fresnel | The dairy industry has a big potential to utilize solar energy for heating. Parabolic trough collectors and linear Fresnel reflectors are the most suitable solar collectors for this sector. Solar-powered cooling through the use of solar absorption chillers can be implemented. | [147] |
| Techno-economic-environmental analysis for using a 5 MWth system | Parabolic trough collector | A SHIP plant in Salt Lake City, Utah, USA, can deliver an annual thermal energy of 15,389.24 MWth/year. Compared to a natural gas plant, the SHIP plant was found to be able to avoid annual emissions of CO2 at the level of 3,582.4 tonnes/year | [148] |
| Integration of SHIP systems for meeting low-temperature heat demands in the food processing industry | Flat plate collector | Flat plate collector systems were the most adopted SHIP type in the food industry, with a share of 38%. The most frequent heating applications are pre-heating, cleaning, and pasteurization. | [149] |
| 4E (Energy, Exergy, Economic, and Environment) examination of a small LFR solar water heater | Linear Fresnel reflector | The study was performed in the Blida area in Algeria during the winter season. The optical efficiency was found to exceed 42%. The thermal efficiency was found to exceed 29%. | [150] |
| Quantity | 2024 Addition | Cumulative (end of 2024) | Percentage of the 2024 addition (relative to the cumulative value at the end of 2024) |
|---|---|---|---|
| Number of SHIP systems | 106 | 1,315 | 8.06% |
| Collector area [m2] | 171,874 | 1,530,600 | 11.23% |
| Thermal power [MWth] | 120.3 | 1,071.4 | 11.23% |
| Category number | SHIP category | 2024 Added systems | 2024 Added collector area [m2] | Average collector area per system for new systems in 2024 [m2/project] |
|---|---|---|---|---|
| 1 | Parabolic trough (PT) | 3 | 113,221 | 37,740.5 |
| 2 | Unevacuated flat plate (FP-U) | 48 | 37,740 | 786.3 |
| 3 | Evacuated tube (ET) | 24 | 8,577 | 357.4 |
| 4 | Solar air collector (Air) | 19 | 5,146 | 270.9 |
| 5 | Parabolic dish (PD) | 3 | 1,715 | 571.8 |
| 6 | Evacuated flat plate (FP-E) | 1 | 1,715 | 1,715.5 |
| 7 | Solar power tower / Heliostats (SPT) | 1 | 1,715 | 1,715.5 |
| 8 | Photovoltaic-thermal (PVT) | 3 | 1,029 | 343.1 |
| 9 | Linear Fresnel (LF) | 2 | 686 | 343.1 |
| 10 | Unglazed (Ung) | 2 | 326 | 163.0 |
| Total (Overall) | 106 | 171,874 | 1,621.4 | |
| 11 | flat plate (FP) | 49 | 39,456 | 805.2 |
Disclaimer/Publisher’s Note: The statements, opinions and data contained in all publications are solely those of the individual author(s) and contributor(s) and not of MDPI and/or the editor(s). MDPI and/or the editor(s) disclaim responsibility for any injury to people or property resulting from any ideas, methods, instructions or products referred to in the content. |
© 2025 by the authors. Licensee MDPI, Basel, Switzerland. This article is an open access article distributed under the terms and conditions of the Creative Commons Attribution (CC BY) license (http://creativecommons.org/licenses/by/4.0/).


