
Submitted:
25 September 2025
Posted:
26 September 2025
You are already at the latest version
Abstract
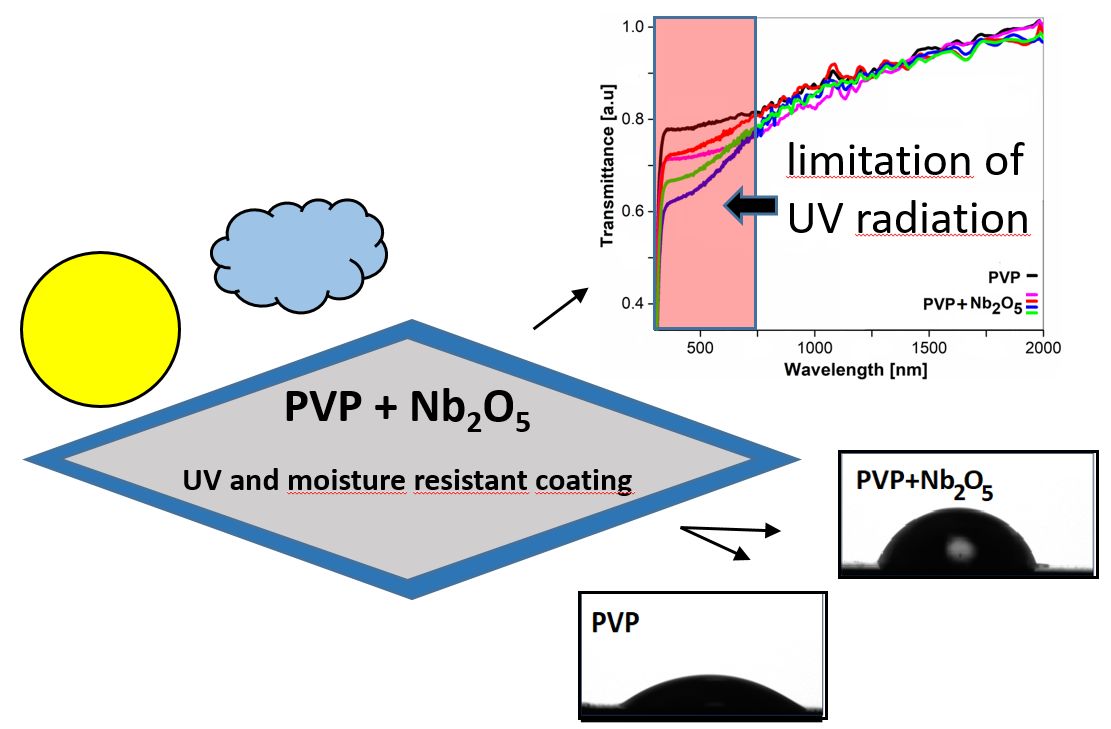
The subject of this study are thin films of poly(N-vinylpyrrolidone) (PVP) and its composites with niobium pentoxide nanoparticles (Nb₂O₅/NPs), with varying nanoparticle concentrations. The obtained results indicate that the addition of nanoparticles significantly affects the physical properties of the investigated materials, limiting their optical UV transmittance in the range of 300-500 nm and increasing the material's resistance to moisture, which is present in the surrounding environment. Based on our thermal measurements, performed using differential scanning calorimetry (DSC) and variable temperature spectroscopic ellipsometry (VASE), as well as the results obtained using scanning electron microscopy (SEM), we can indicate that an interfacial surface with a changed polymer chain mobility is formed between the Nb₂O₅ nanoparticles and the polymer matrix, as evidenced by the appearance of an additional, intermediate glass transition temperature, visible in the ellipsometric temperature cycles. This is closely related to the formation of surface clusters resulting from the agglomeration of Nb2O5 nanoparticles. The results indicate that the investigated composite coatings could be employed as surface coverings to protect against external, environmental influences, like the moisture and UV radiation.
Keywords:
PVP-Nb2O5 composites
; thin films
; physical properties
; variable temperature spectroscopic ellipsometry
1. Introduction
Nanocomposites in form of polymer matrices included incorporate organic or inorganic nanoadditives with a uniform nanoscale distribution (10 - 100 nm), created through physical mixing processes present unique chemical and physical characteristics, which improve the material performance, and generate uninterrupted attention of researchers around the world for many years [1]. The combination of a filler in the form of a nanostructured material and a “massive” matrix material causes the newly developed material to have a possible anisotropic and non-homogeneous characteristics, which gives it better properties than micro and monolithic composites. Modern composites reinforced with nanostructures have significantly improved mechanical qualities, chemical resistance, thermal stability, permeability reduction, flame resistance, electrical conductivity, and optical performance [2]. The nanofillers used are, depending on the application, particles, fibers, or even agglomerates embedded in a variety of natural or synthetic polymers. Hence, these materials have a lot of perspective for usage especially in aeronautics, automotive electronics, medicine dye to its exceptional qualities [3].
From a production and application perspective, polymer nanocomposites (PNCs) take advantage of the lightweight, flexible nature of polymers as well as the simplicity of their production and shaping through economical processes. The challenge is to create uniform dispersion of the nanofiller, during polymer matrix polymerization processes in situ and sol-gel processes of PNCs’ production. The resulting PNCs material can be modified depending on the nanoadditive particle shape, size, specific surface area and chemical nature. Selection of nanofiller properties as well as its homogeneous distribution in the PNC structure generates phase compatibility, which determines applicability across technology [4,5] The analysis of scientific reports leads to the conclusion that, depending on the conditions of their synthesis and surface chemistry, the nanoparticles presented a strong tendency to form agglomerates. These agglomerates are divided into hard agglomerates (created by smaller particles connected by sinter necks) and soft agglomerates (created by accumulations of particles connected by attractive physical interactions like van-der-Waals or hydrogen bridges). The formation of agglomerates is determined by the interactions between nanofiller particles, i.e., their surface chemistry, particle shape, its ratio and dimensionality and the interparticle distance and polydispersity [6]. The problem of nanoadditive agglomeration in the structure of PNCs arises in virtually every case of developing new materials and is therefore addressed in many research centers. Hence, a general procedure for breaking up agglomerates was developed. The hard agglomerates can be crushed by high energy milling. Soft agglomerates are dispersed by shear forces generating gradients of the mechanical stress.
A particularly interesting application of PNCs is the combination of the functional properties of the matrix polymer and the specific properties of the nanofiller in the structure of a protective coating. The simplicity and economy of producing PNC coatings makes it an ideal material for e.g., UV blocking applications. Generally, UV light protection coating is created by UV blocking inhibitors or light protection components [7]. Currently, UV blockers are used in the form of inorganic fillers such as metal oxides - TiO2, ZnO, SiO2, CeO2, Fe2O3, minerals - CaCO3, clays, semiconductors - CdSe, CdS, CdTe, PbS, metals and their alloys - Ag, Cu, Au, Fe, Ge, which are dispersed in polymer matrices [8]. Especially nanostructured fillers, achieving maximum absorption in the UV region (200–400 nm) and are capable to efficiently absorb UV radiations [9]. The challenge, however, is to use the unique optical properties and chemical stability, environmentally friendly nature and low cost of the inorganic fillers [10] in combination with organic molecules of the matrix. This is the driving force of activities focused on the search for innovative materials designed to take advantage of the high properties of the nanofillers with their high content and dispersion in nanocomposites structure [11]. The matrix material is also crucial from the perspective of the coating’s application. Due to their physical, mechanical, chemical, and thermal properties, polyvinyl alcohol (PVA) [12,13] and polyvinyl pyrrolidone (PVP) are considered as the matrix for UV protective layers. Amorphous PVP is a biocompatible material with high environmental stability [13,14]. However, PVP tends to oxidize when exposed to UV radiation [15,16,17].
It should be also noted that thermal stability of PNCs in low-cost, large-area protective structures are essential. In polymer film fabrication, scientists try to increase the crystallinity of films, by controlling the evaporation rate or using external physical force [18,19,20,21,22,23]. The application of external stress (shearing force, centrifugal force or capillary force) contributes to the formation of directional structures in spin-coating, drop-casting, bar-coating or solution shear process.
Hence, the need to select an appropriate nanoadditive to protect the polymer matrix from radiation. However, the nanofiller materials must ensure high physical and thermal properties of the resulting composite. To date, there is no detailed study on the effect of one of the most promising metal oxide semiconductors, Nb2O5, on the photoelectric properties (high refractive index, wide bandgap, good optical quality, and negligible scattering), chemical stability, and thermal stability of PVP/NPs structures [16,17].
An extremely important application aspect for polymer and polymer-based composite layers, especially in applications as protective layers, is the determination of their surface wettability, which provides information about its surface energy and interactions with the liquids. Many well-researched and traditionally used polymers, despite their excellent performance properties, such as low weight, transparency, and processability, are limited in their use as protective layers due to their hydrophilic nature [24]. In such cases, structural modifications of polymers or their combination with hydrophobic polymers are used, e.g., when modifying membranes, which allows obtaining specific surface properties, including hydrophobicity. In the work of Jebali et al., a two-step process was used, including polymer transformation and coating structuring at the nanometric and micrometric scale, to obtain hydrophobic behavior of PVP polymer layers [25]. In citied work, crosslinking with benzophenone and UV irradiation was used, which led to obtaining water-insoluble PVP, and additionally the surface of the layer was modified with the addition of silica nanoparticles (NPs). The modification of PVC/PVP composites using BiVO4 nanoparticles was proposed in the work by Yousef et al. In their research, they used the addition of BiVO4 to decrease in the water contact angle [26].
Considering the above studies, the authors focus on manufacturing and investigation of PNCs coatings with a polymer PVP matrix reinforced by Nb2O5 nanoparticles. The aim of the proposed solution has been to research the effect of the inorganic nanostructure material on the physical properties and thermal resistance of the final PNCs layers.
A novelty in the article is the use of a unique combination of a polymer matrix and inorganic semiconductor nanoparticles. This combination allows for the achievement of exceptional physical properties of the layers as well as thermal resistance of the resulting composites, which in turn can have a significant impact on their potential applications in fields such as electronics, automotive, and aviation.
In addition, the work presents a method applicable for the rapid and economic production of large-scale coatings with high dimensional and structural repeatability.
2. Experimental
2.1. Materials and Samples Preparation
The materials we have used are poly(N-vinylpyrrolidone) (PVP) [27,28] with a molecular weight of 40000 g/mol, and niobium pentoxide Nb2O5 (purity 99.9%) [29,30]. PVP and Nb2O5 were supplied by Sigma-Aldrich. The chemical structures of these materials are presented in Figure 1 a-b).
Thin films of PVP and its composites were obtained from a chloroform solution at a constant concentration of 20 mg/ml. Table 1 provides the percentage concentrations of each component. Prior to applying the thin films using the spin-coating technique, the solutions were homogenized (in pulse mode) at 15.1 kJ, for 10 min using a Bandelin Sonoplus homogenizer. The films were coated from solutions with spinning time t=60 seconds, and the spin speed s=1200 rpm.
2.2. Methods
To perform the ellipsometric studies we have used the SENTECH SE850E spectroscopic ellipsometer, operated by the Spectra Ray 3 software, working in the spectral range of 240 to 2500 nm. Three ellipsometric modes were applied – the transmission mode (using a specific sample holder), variable angle mode (using a regular automated table), and variable temperature mode (using a temperature-controlled cell, INSTEC mK1000, operating under decreased pressure). Measurements of transmission modes were performed across the whole UV–Vis/NIR spectrum. For incidence angles between 40° and 70°, ellipsometric angles Ψ and Δ were recorded in 5° increments. The protocol described in our earlier studies was followed in the variable temperature experiments [31,32,33,34]. For five minutes, each sample was heated separately to 250 °C while being compressed at 10−3 Torr. The films were then quickly chilled to -100 °C in under three minutes. After, every temperature cycle was provided with a heating rate 2 °C/min. The temperature table and a liquid nitrogen pump were used to control the temperature.
The transmission mode of ellipsometer was used for the optical transmission measurements, the variable angle spectroscopic ellipsometry (VASE) was used for film and roughness thickness measurements and for determining the refractive indices, using the VTSE we have determined the thermal transitions temperatures.
The DSC analysis was performed on TA DSC 25 Discovery instruments with a heating and cooling rate of 20 °C/min in a constant stream of nitrogen (20 ml/min) atmosphere to 250˚C in the aluminium pads.
SEM imaging was performed using a Phenom XL microscope (Thermo Fisher Scientific) with backscattered electron detection (BSD). The analysis was conducted at accelerating voltages of 5 kV and 10 kV, after sputter-coating the sample with a layer of gold to improve surface conductivity.
Contact angle measurements were performed at room temperature by applying a drop of distilled water with a volume of V = 2-4 µL on the tested surface using a glass syringe. Contact angle measurement results are the arithmetic mean calculated from 30 images taken at 1 image/sec. Measurements were performed using a CAM101 goniometer (KSV Instruments) equipped with a camera (resolution 640x480 pixels) and an external temperature adapter (Intelligent Digital Controller OMRON5EGN). CAM2008 software was used for data analysis and calculations.
X-ray diffraction (XRD) scans were provided out on polymer and composite films deposited on cover microscopic glass substrates using a D8 Advance diffractometer (Bruker, Karlsruhe, Germany) with a Cu-Kα cathode (λ = 1.54 Å) in coupled Two-Theta/Theta mode. The scan rate was 1.2°/min with a step size of 0.02° in the 2θ range of 2° to 60° (dwell time 1 s). The analysis was performed with DIFFRAC.EVA software V5.1.
3. Results and Discussion
3.1. XRD Analysis
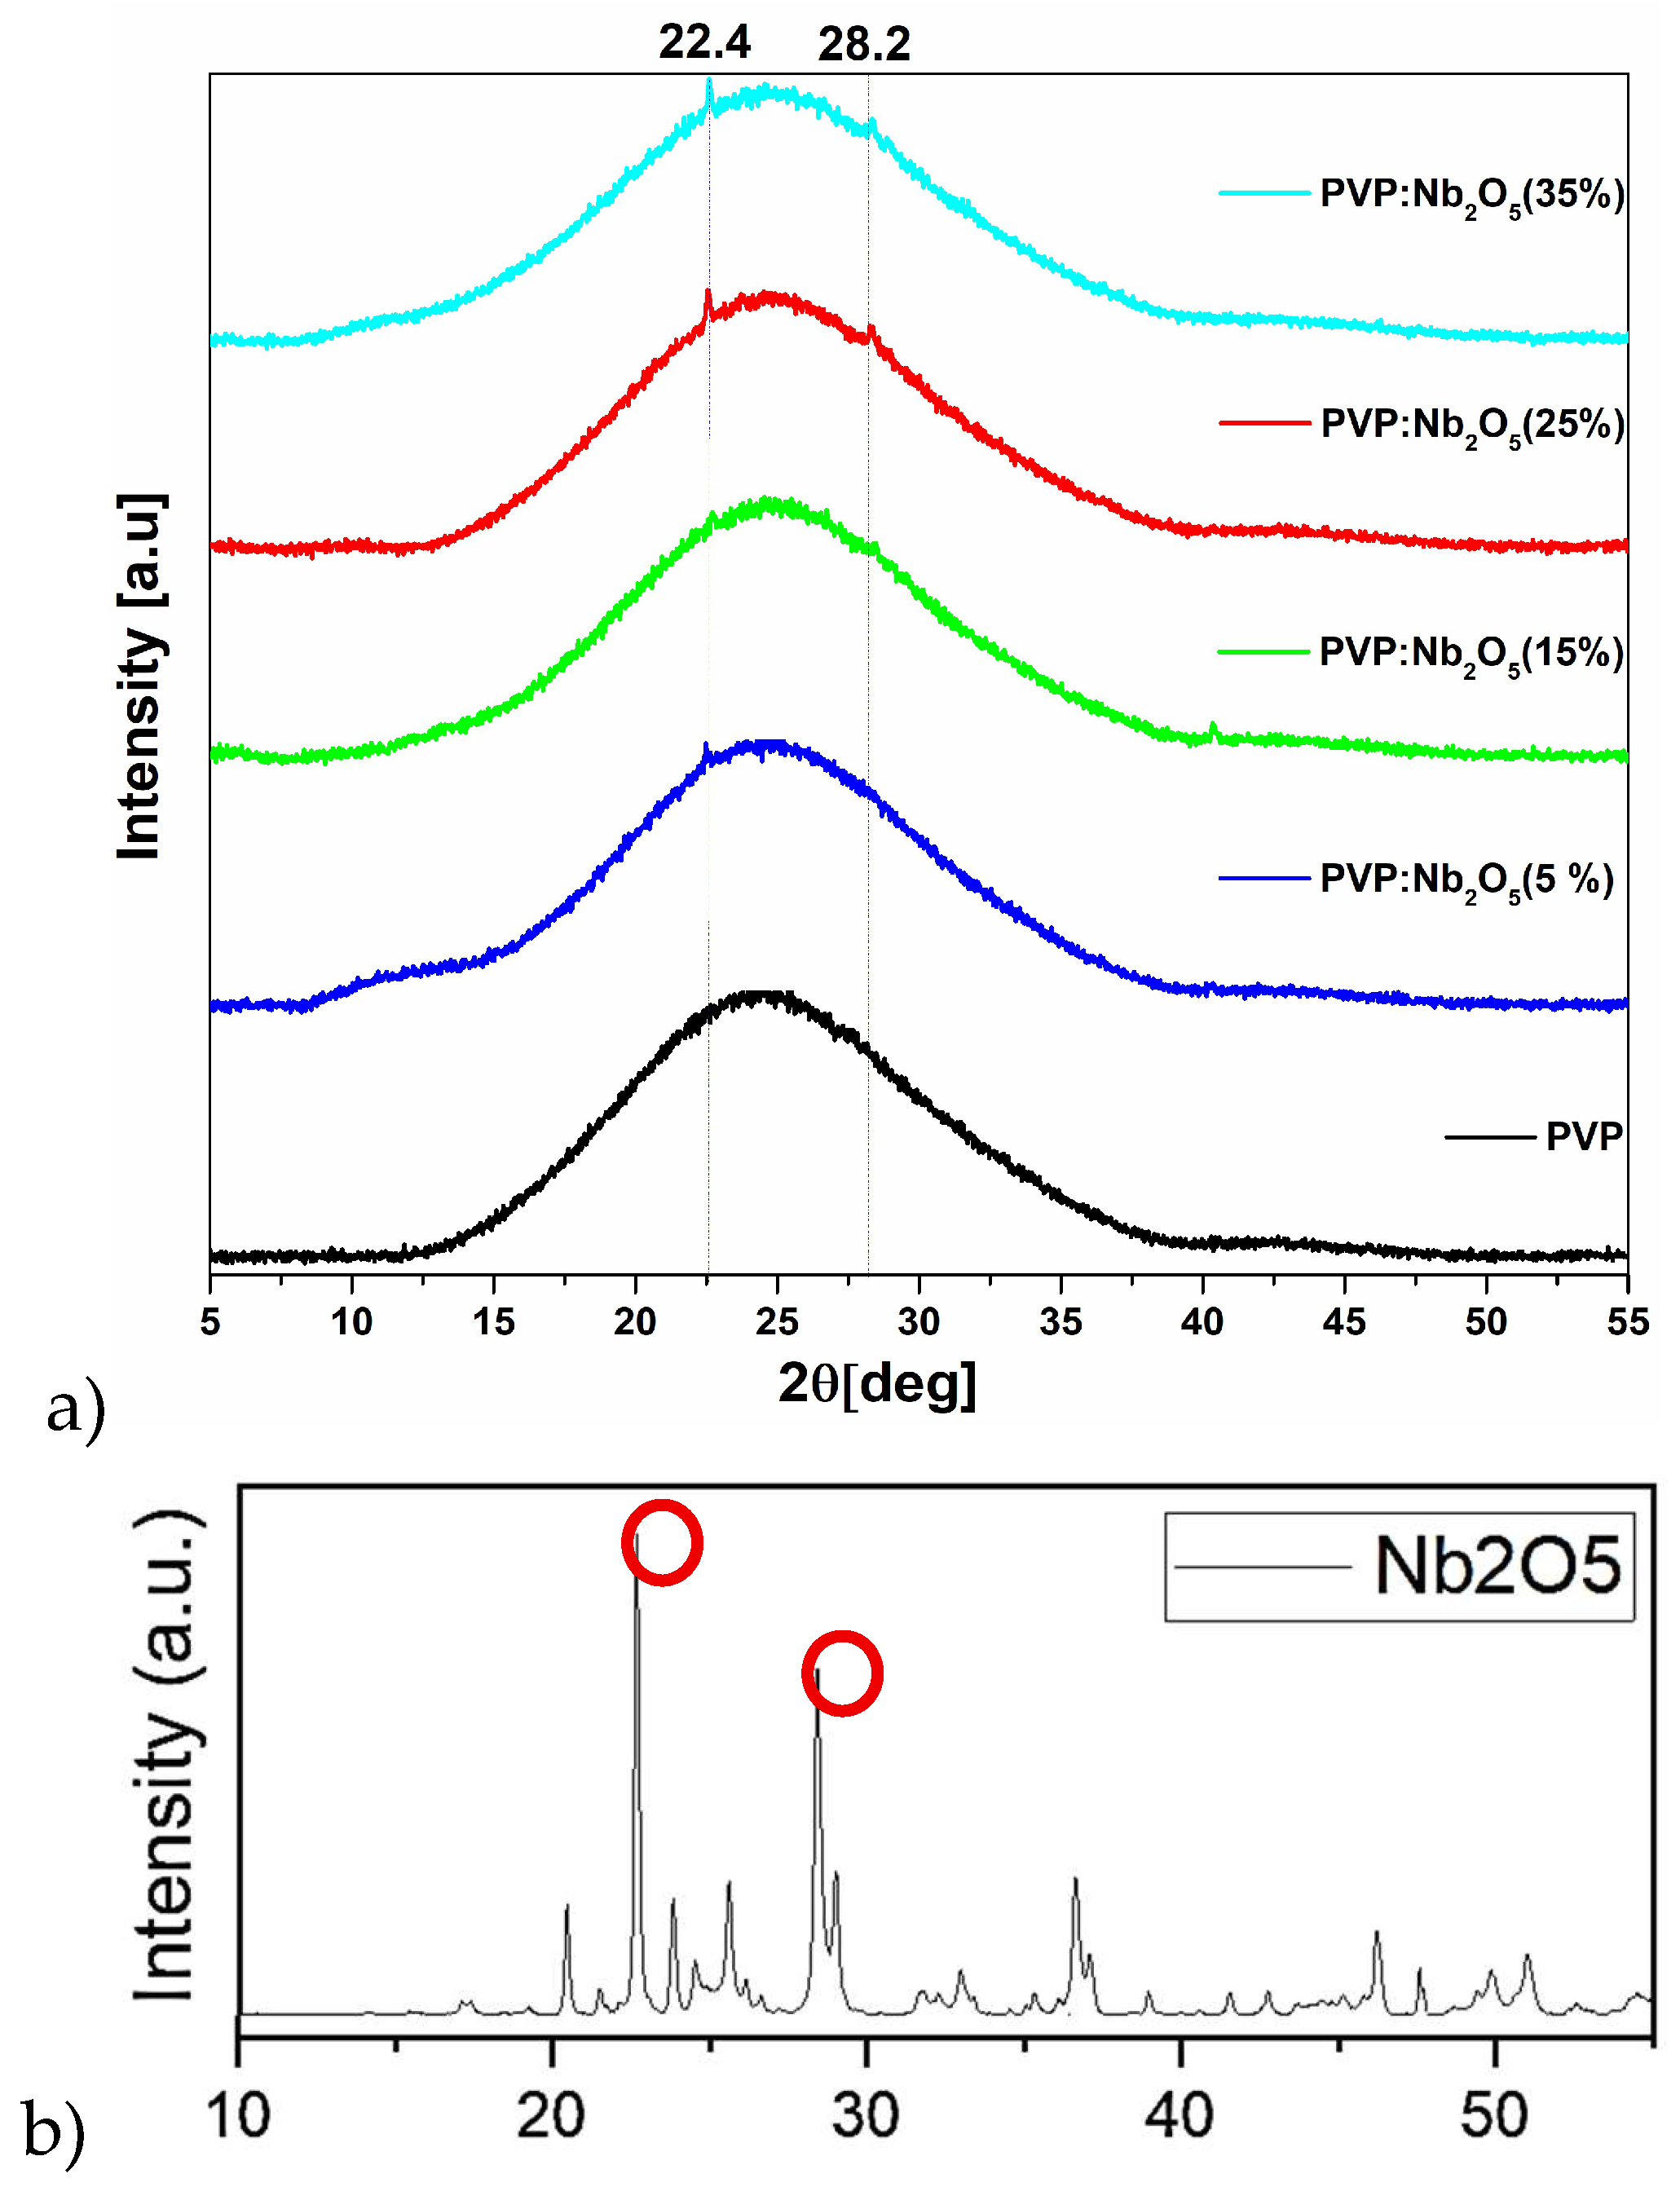
X-ray diffraction (XRD) patterns of the PVP and its Nb2O5 composite films, with 5, 15, 25 and 35% NPs concentrations, deposited onto microscopic cover glass substrates are presented in Figure 1a).
For reference, the XRD pattern of pure Nb2O5 nanoparticle powder has been added (Figure 1b). Two peaks, located at 2θ = 22.4 and 28.2 deg, which are characteristic for this material and are included in DIFFRAC.EVA software materials data base are marked with red circles.
The diffraction spectrum of the pure polyvinylpyrrolidone (PVP) film exhibits a broad, featureless hump, which is characteristic of its amorphous nature. In case of sample with 5% NPs content we have noticed one, weak peak at 2θ = 22.4 deg, coming from Nb2O5, what is connected with low NPs content and with formation of sparse NPs clusters. In contrast, the rest of XRD patterns of the composite films, prepared with Nb2O5, concentrations of 15, 25 and 35% display two distinct diffraction peaks. At the 15% concentration, more agglomerated clusters appear, likely smaller in size. However, due to their higher number, a second peak appears compared to the 5% sample. This result partially indicates a fairly even distribution of nanoparticles in the PVP matrix. At the remaining concentrations - 25% and 35% we note that the peaks are slightly more pronounced. This indicates that the Nb2O5 concentration in these samples is higher, and that a larger number of agglomerates have likely formed, which may also have a larger diameter.
Figure 2.
XRD pattern of PVP and its Nb2O5 composites (a), compared to NPs pattern (b).
3.2. Ellipsometric Analysis
The transmission spectra of pure PVP films and its composites with Nb2O5 nanoparticles, deposited on microscopic cover-glass, are presented in Figure 3. These measurements were taken using the ellipsometer transmission mode. The range of obtained spectra was limited to 2000 nm due to the big spectra fluctuations in the range of 2000-2500 nm.
All the curves were normalized to a wavelength of λ=2000 nm, due to the difference in the thickness of the prepared films (see Table 2). It can be seen the spectrum of pure polymer PVP film is highly transparent, providing light transmission of at least 80% across the entire measured range. In the case of composites spectra, a significant decrease of the light transmission in the UV range (320-700 nm) can be observed, where its reduction is strongest in the wavelength range of λ = 320 to 500 nm. These results may be significant from the point of view of potential applications of the investigated materials.
Variable-angle ellipsometry (VASE) was used to determine the refractive index dispersion of the prepared samples. Measurements in the 240-2500 nm wavelength range were performed on PVP polymer films and their Nb2O5 composites, deposited onto silicon substrates coated with 300 nm of SiO2. The ellipsometric model, which was used for fitting the theoretical curve to the obtained experimental data (for the Ψ and Δ ellipsometric angles and the degree of polarization), consisted of five component layers: air, a roughness layer, a polymer/composite layer, and two substrate layers, presented in Figure 4. A roughness layer (modelled using the effective medium approximation model (EMA) of the composite layer and the air file layer, where air was treated as a non-dispersive environment), a polymer/composite layer (where the pure polymer was modelled using a Cauchy model [35,36,37] and the composite was modelled using an EMA-type model, fitted for PVP and a Cauchy model of Nb2O5 material layer, taken from the database of ellipsometric models available in SpectraRay 3 software), and finally an air layer with a refractive index of 1 were among these layers. The so-called volume fraction coefficient was used to determine the Nb2O5 nanoparticles content in the PVP matrix. This coefficient corresponds to the volume fraction of nanoparticles relative to the volume of polymer and is not identical to the weight percentage ratio of nanoparticles to polymer. The formula for the volume fraction coefficient f is given in equation (1) and the obtained values are presented in Table 2.
The Bruggeman formula yielded the volume fraction coefficient [38], used for polymer or composite layer:
where f is the volume fraction coefficient of nanoparticles, εi- nanoparticles dielectric coefficient (inclusion material), εm – polymer dielectric coefficient (host material) and εff is an effective dielectric coefficient of the investigated material (composite). Based on this formula, it was possible to derive the dependence relation on the coefficient of volumetric fraction:
The obtained volume values of the fraction coefficient, along with the values of thickness, inequalities and the refractive index for the wavelength λ= 2000 nm, are shown in Table 2. Also, the dispersions of refractive indices, generated for PVP, Nb2O5 (Sentech ellipsometric data base) and for composites with different Nb2O5 percentage content, deposited onto silicon substrates, are presented in Figure 5. It is noticeable, the dispersions are presented in the range of 500 to 2500 nm. The reason for this approach is the degree of polarization of light in the 240-500 nm region, the deviation of which significantly exceeds 10%. Also, in the case of measurements, the number of spectra used in the theoretical fit was limited to angles of 40-50°, because for angles of 60-70° the degree of polarization significantly deviated from 1 over the entire measured wavelength range. The refractive index n of pure PVP is around 1.521, while that n of Nb2O5 nanoparticles is around the 2.097. With respect to the weight percentage of nanoparticles, the n value for Nb2O5 should significantly affect the refractive index of the composite. However, ellipsometric fits indicate otherwise. The n values for the individual NPs percentages—5, 15, 25, and 35 percent—are 1.522, 1.525, 1.528, and 1.531, respectively, and thus do not differ significantly from the refractive index of the polymer matrix. This is due to the low values of the volume fraction coefficients which for the composites are f = 0.004, 0.010, 0.017, and 0.024, respectively. Note that f is the factor determined from the optical model with the best possible fit (for the lowest mean square error (MSE) value obtained). Being dimensionless, the volume factor differs from the weight factor. Because the f values are low, this means that only a small percentage of nanoparticles contained in the polymer matrix have an active influence on the composite’s refractive index. Another reason for such low f values may be the relatively high surface roughness, which is reflected in the determined surface roughness coefficient values (see Table 2).
Based on the obtained results, we can assume that the nanoparticles contained in the polymer form aggregates, which causes light scattering in the 300-500 nm range. However, this has no significant effect on light transmittance in the remaining spectral range, where the wavelength is longer, and therefore the nanoparticle aggregates become “invisible to the beam.” The low refractive index values measured at a wavelength of 2500 nm also confirms this fact. The formation of agglomerates is confirmed by the results obtained using SEM microscopy (see Figure 8) and may also affect the thermal properties of the resulting composite films.
3.3. Thermal Analysis
Thermal analysis of pure PVP and its composites was performed using two methods: DSC and VTSE, and the obtained results were then compared. The DSC analysis included measurements on the starting materials in powder form after solvent evaporation. The obtained DSC plots for PVP and composites are presented in Figure 6 and the individual, detected temperatures of thermal transitions are showed in Table. 3. The results indicate the presence of two glass transition temperatures -Tg. For both pure PVP and its composites, the first temperature, Tg1, is equal to 88 and 89 °C, and is therefore practically constant. All results also indicate a second glass transition temperature Tg2, with values, detected for pure PVP and its composites with Nb2O5 (5, 15, 25, and 35%) of 188, 181, 180, 183, and 204 °C, respectively. The typical Tg temperature of PVP is included in the temperatures range of 150-180 °C [39,40,41,42]. In the case of plot, obtained for the pure material, we have recorded the temperatures of 88 and 188 °C. Two explanations for the obtained results are possible. The first approach suggests that Tg1 = 88 °C is a temperature derived from secondary β-segmental relaxation, which was very well described by Vyazovkin and Dranc [43]. The pyrrolidone ring’s rocking motions as it revolves around the C-N bond are the cause of this phenomenon, which is independent of molar mass. Compared to the glass transition energy of the polymer backbone, this kind of motion has a lower energy barrier.
The second possible explanation is the presence of a PVP fraction with a very low molar mass, which could indicate that the investigated material is a mixture of these two phases (40000 and much lower one). Using the Flory-Fox law (eq. 3) for the amorphous polymers [44], the molar mass of the second fraction can be determined to be approximately 3000 g/mol. The Flory-Fox relation is described with well know equation:
Where: is the glass transition for polymer with high molecular mass (in our case it is around180 ºC), the M is the average molecular mass and C is the constant, characteristic for the individual polymer. In the case of the second Tg2 temperature, the largest shift is observed for the highest nanoparticle concentration. Since this Tg2 value is typical for PVP, the changes of its value can be explained by the presence of nanoparticles. Nb2O5 nanoparticles, present in the polymer matrix reduces the vibrations of the polymer backbone, stiffening it. This interaction is a reason of increasing of the energy barrier, beyond which, the glass transitions could occur.
Referring to our previous studies of thermal transitions of composite films [45,46] using variable-temperature ellipsometry, it should be noted that it is quite convenient and quick to use raw ellipsometric data for a selected wavelength [47,48,49]. In this paper, we present thermal studies conducted using differential scanning calorimetry and compare them with the results obtained using the VTSE method. Here, we have selected the Ψ with a wavelength of λ = 900 nm. The restricted spectral range in temperature monitoring and the high transmission in this range are the reasons for selecting this wavelength. The ellipsometric temperature cycles, recorded for films of PVP and its composites, deposited onto silicon substrates are presented in Figure 7 and the obtained temperatures are presented in Table 3 also. For pure PVP, we have detected two temperature values: 92 and 197 ºC, which correspond with two Tg values, obtained using the DSC method. This is typically, the case when the differences between the DSC and VTSE scans range from 10 to a dozen Celsius degrees, due to the form of the material being tested (film, not the powder in case of VTSE) [32]. Observations of ellipsometric temperature scans has brought very interesting conclusions. For the composites, which content of Nb2O5 nanoparticles is equal to 5 and 15%, we have noticed an increase of the first TgV1 value, from 92ºC (recorded for pure PVP film) to 104 and 105 ºC, respectively. For the concentrations of 25 and 35%, the temperature values were shifted again to values closer to those for pure PVP: 95 and 91 ºC, respectively. For TgV3, which corresponds to the Tg2 (second glass transition temperature observed in DSC plot), we have observed shifts in the temperature range of 198-207 ºC. It can be easily noticed that, unlike the results obtained using DSC method for the powdered material, each the ellipsometric graph shows an intermediate temperature, which is absent in the case of the PVP matrix layer without the addition of nanoparticles. The value of this intermediate temperature TgV2 changes quite dynamically due to the NPs concentrations, being the highest for a concentration of 15% Nb2O5, and the lowest for its concentration of 35%. Changes in TgV1 and TgV3 can be easily explained by the stiffening of the PVP polymer chains. The most important temperature appears to be the TgV2 (Figure 7a), which can be related to the nanoparticles agglomeration. Because the spectroscopic ellipsometry is an extremely sensitive method for changes of the physical parameters (e.g., the thickness), it must be related to the interaction of the Nb2O5 naoparticles with the polymer. In the work of Ali et al. [50] it was shown the C=O···HO–Nb hydrogen bonds are formed between Nb2O5 nanoparticles and the PVP/PVA polymer matrix, where C=O comes from the PVP pyrrolidone ring, the -OH group from PVA, and Nb-OH are hydroxyl groups on the niobium pentoxide surface, which can act as donors or acceptors of hydrogen bonds. We believe that a similar problem exists in our composite films. When nanoparticle concentrations are lower and better disstributed in the polymer matrix, more such linkages can be formed, resulting in a bigger amount of this “third” intermediate phase. The glass transition temperature TgV2 appears as a result of the increased interfacial surface formed by the Nb2O5 nanoparticles and the PVP polymer, resulting in the production of a PVP phase with altered chain mobility (Figure 7b). At greater nanoparticle concentrations (25% and 35%), a large quantity of nanoparticle aggregates are present, causing the TgV2 temperature is shifted to 151 °C and 135 °C, respectively. Fewer hydrogen bonds develop around bigger aggregates, pushing the polymer chains apart (Figure 7c). Furthermore, the so-called dilution effect applies here: when the weight concentration of the solutions from which the films were derived remains constant, the sample includes less polymeric material and much more nanoparticles than samples with lower concentrations. These two variables lead TgV2 to be lower at highest Nb2O5 concentrations.
3.4. Microscopic and Contact Angle Analysis
The pieces of the same PVP film and its composites with Nb2O5 were tested using SEM microscopy. Figure 8 a-e) presents morphology images at 400x (a-b) and 1000x (c-e) magnification. Nb2O5 nanoparticles are visible on the surface of the images as bright spots. Picture 8a) shows the surface of pure PVP matrix, without addition of nanoparticles, and picture 8b) presents the morphology of the PVP film with 5% Nb2O5 content. Few agglomerates of nanoparticles are visible in the field of view. Pictures 8 c-e), which correspond to concentrations of 15, 25, and 35% Nb2O5 content, show larger and more numerous agglomerates of nanoparticles. Based on the obtained results, we can conclude the PVP/Nb2O5 films reveal significant changes in the composite’s morphology compared to materials with a lower NPs concentration. The polymer matrix shows pronounced heterogeneity, and the presence of numerous highly contrasting bright regions indicates the presence of well-dispersed Nb2O5 nanoparticles. The high content of the inorganic phase promotes the formation of particle clusters, suggesting ongoing agglomeration. The increased number and size of the bright regions reflect the intensifying influence of niobium oxide on the composite’s microstructure.
The obtained contact angle measurement results (Figure 9) are consistent with previously obtained results. In Figure 9 (a-d), the hydrophobicity of the films increases with the nanoparticles concentration. In case of pure PVP film, the surface is smooth and moderately hydrophilic. For a concentration of 5% of Nb2O5, the hydrophilicity decreases slightly with the appearance of individual nanoparticle clusters compared to the pure material. Hydrophobicity increases up to a concentration of 25% and then decreases rapidly when it reaches 35% (Figure 9e). This phenomenon can be explained by the supersaturation of the polymer matrix with the added Nb2O5 NPs. Larger and more numerous agglomerates are formed; thus the sample surface becomes more tensile, i.e., the exposure of hydrophilic Nb2O5 increases. Furthermore, the increased number of nanoparticle aggregates increases the porosity of the film and its capillarity, thus increasing the sample’s hydrophilicity.
4. Conclusions
In this paper, we have investigated the PVP and its composites with Nb2O5 nanoparticles thin films, where the nanoparticle content varied in the range of 5% to 35%. The study compared the physical properties of the samples, depending on the nanoparticle content. PVP is an amorphous polymer, as it was evidenced by XRD studies. Peaks, which were detected for the composite samples XRD patterns at frequencies characteristic of Nb2O5 are confirming the presence of nanoparticles in the polymer matrix. The composites’ transmission spectra revealed increased UV absorption in the 320-700 nm range, with higher nanoparticle content associated with a greater reduction in optical transmittance in this region, while the material remained transparent in the rest of the spectrum. According to VASE experiments, the active contribution to the change in refractive index varied very little (1.521-1.531 at a wavelength of λ = 2000 nm). The low volume fraction coefficient values obtained clearly indicate that only a small proportion of Nb2O5 nanoparticles are responsible for the change in its value, confirming the presence of particles and aggregates on the surface of the examined composite samples. Furthermore, the decrease in optical transmittance is mostly due to light scattering on the sample surface. Thermal experiments utilizing DSC and VTSE methodologies clearly show the presence of two glass transitions, both in pure PVP and in composites. For the powdered material, Tg1 is constant and originates from the pyrrolidone moiety. The second temperature Tg2 is variable and results from the fact that the nanoparticles present in the polymer matrix stiffen its polymer chain. More sensitive VTSE studies conducted for thin films revealed the presence of the additional glass transition temperature TgV2, which simply cannot be present in powdered material. The presence of T gV2 in thermal ellipsometric studies indicates the formation of an interfacial surface between the PVP matrix and nanoparticles, resulting from hydrogen bonds formed at the interface between these phases. Because of the changing number of these bonds, we related variations in Tg2 temperature to an increase in Nb2O5 allomers. Microscopic examination and wetting angle measurements provided complete confirmation of the acquired results. SEM results revealed a homogeneous distribution of nanoparticles throughout the matrix, as well as an increase in the quantity and size of agglomerates. Measurements of the contact angle of the test samples revealed additional useful information, suggesting that the most suitable concentrations appear to be 15% and 25%, at which the composite becomes relatively hydrophobic. The article’s results demonstrate that the investigated composites can be employed as prospective coatings to protect surfaces from UV radiation while maintaining the coating’s relative hydrophobicity.
Author Contributions
Conceptualization, B.H., P.J. and M.M.; methodology, B.H., P.J; validation, B.H., P.J.; formal analysis, B.H., P.J.; investigation, B.H., P.J., P.K., M.G., M. B., S. K., M. Ł., Ł. H.; data curation, B.H. and P.J.; writing—original draft preparation, B.H., P.J.; writing—review & editing, B.H., P.J.; visualization, B.H., P.J. and Ł.H.; supervision, B.H. and M.M. All authors have read and agreed to the published version of the manuscript.
Funding
This research received no external funding.
Institutional Review Board Statement
Not applicable.
Data Availability Statement
The original contributions presented in this study are included in the article. Further inquiries can be directed to the corresponding authors.
Conflicts of Interest
The authors declare no conflicts of interest.
References
- Manias, E. The full potential of nanoparticles in imparting new functionalities in polymer nanocomposites remains largely untapped. A widely applicable, two-solvent processing approach provides a hierarchical structure, affording unparalleled composite performance enhancement. Nanocomposites: Stiffer by design. Nat. Mater. 2007, 6, 9–11. [Google Scholar] [CrossRef]
- Yeh, J.M.; Liou, S.J.; Lin, C.Y.; Cheng, C.Y.; Chang, Y.W.; Tsai, T.Y.; Wu, C.Y. Anticorrosively Enhanced PMMA−Clay Nanocomposite Materials with Quaternary Alkylphosphonium Salt as an Intercalating Agent. Chem. Mater. 2002, 14, 154–161. [Google Scholar] [CrossRef]
- Mathai, S.; Shaji, P.S. Polymer-Based Nanocomposite Coating Methods: A Review. J. Sci. Res. 2022, 14, 973–1002. [Google Scholar] [CrossRef]
- Bhat, A.; Budholiya, S.; Raj, S.A.; Sultan, M.; Hui, D.; Shah, A.M.; Safri, S. Review on nanocomposites based on aerospace applications. Nanotechnol. Rev. 2021, 10, 237–253. [Google Scholar] [CrossRef]
- Rahman, M.M.; Khan, K.H.; Parvez, M.M.H.; Irizarry, N.; Uddin, M.N. Polymer Nanocomposites with Optimized Nanoparticle Dispersion and Enhanced Functionalities for Industrial Applications. Processes 2025, 13, 994. [Google Scholar] [CrossRef]
- Uddin, M.N.; Gandy, H.T.N.; Rahman, M.M.; Asmatulu, R. Adhesiveless honeycomb sandwich structures of prepreg carbon fiber composites for primary structural applications. Adv. Compos. Hybrid Mater. 2019, 2, 339–350. [Google Scholar] [CrossRef]
- You, Y.; Zhang, H.; Liu, Y.; Lei, B. Transparent sunlight conversion film based on carboxymethyl cellulose and carbon dots. Carbohydr. Polym. 2016, 151, 245–250. [Google Scholar] [CrossRef]
- Li, S.; Lin, M.M.; Toprak, M.S.; Kim, D.K.; Muhammed, M. Nanocomposites of polymer and inorganic nanoparticles for optical and magnetic applications. Nano Rev. 2010, 1, 5214. [Google Scholar] [CrossRef]
- Blanchard, V.; Blanchet, P. Color stability for wood products during use: Effects of inorganic nanoparticles. BioResources 2011, 6, 1219–1229. [Google Scholar] [CrossRef]
- Look, D.C. Recent advances in ZnO materials and devices. Mater. Sci. Eng. B 2001, 80, 383–387. [Google Scholar] [CrossRef]
- Gore, A.H.; Prajapat, A.L. Biopolymer Nanocomposites for Sustainable UV Protective Packaging. Front. Mater. 2022, 9, 855727. [Google Scholar] [CrossRef]
- Khairy, Y.; Mohammed, M.I.; Elsaeedy, H.I.; Yahia, I.S. Optical and electrical properties of SnBr2-doped polyvinyl alcohol (PVA) polymeric solid electrolyte for electronic and optoelectronic applications. Optik 2021, 228, 166129. [Google Scholar] [CrossRef]
- H. S. Tarazona, M. Tafur, J. Quispe-Marcatoma, C.V. Landauro, E. Baggio-Saitovitch, D.S. Schmool. Thickness effect on the easy axis distribution in exchange biased Co/IrMn bilayers. Phys. B Condens. Matter 2019, 570, 41–46. [Google Scholar] [CrossRef]
- Badawi, A. Engineering the optical properties of PVA/PVP polymeric blend in situ using tin sulfide for optoelectronics. Appl. Phys. A Mater. Sci. Process. 2020, 126, 335. [Google Scholar] [CrossRef]
- Louie, S.M.; Gorham, J.M.; Tana, J.; Hackley, V.A. Ultraviolet photo-oxidation of polyvinylpyrrolidone (PVP) coatings on gold nanoparticles. Environ. Sci. Nano 2017, 4, 1866–1875. [Google Scholar] [CrossRef]
- Hwang, J.M.; Kim, N.Y.; Shin, S.; Lee, J.H.; Ryu, J.Y.; Eom, T.; Park, B.K.; Kim, C.G.; Chung, T.-M. Synthesis of novel volatile niobium precursors containing carboxamide for Nb2O5 thin films. Polyhedron 2021, 200, 115134. [Google Scholar] [CrossRef]
- Basuvalingam, S.B.; Macco, B.; Knoops, H.C.M.; Melskens, J.; Kessels, W.M.M.; Bol, A.A. Comparison of thermal and plasma-enhanced atomic layer deposition of niobium oxide thin films. J. Vac. Sci. Technol. A 2018, 36, 041503. [Google Scholar] [CrossRef]
- de Sousa Pereira, M.; de Sousa Lima, F.A.; de Almeida, R.Q.; da Silva Martins, J.L.; Bagnis, D.; Barros, E.B.; Sombra, A.S.B.; de Vasconcelos, I.F. Flexible, large-area organic solar cells with improved performance through incorporation of CoFe2O4 nanoparticles in the active layer. Mater. Res. 2019, 22, e20180640. [Google Scholar] [CrossRef]
- Wang, T.-C.; Su, Y.-H.; Hung, Y.-K.; Yeh, C.-S.; Huang, L.-W.; Gomulya, W.; Lai, L.-H.; Loi, M.A.; Yang, J.-S.; Wu, J.-J. Charge collection enhancement by incorporation of gold–silica core–shell nanoparticles into P3HT:PCBM/ZnO nanorod array hybrid solar cells. Phys. Chem. Chem. Phys. 2015, 17, 19854–19861. [Google Scholar] [CrossRef]
- Lu, Y.-M.; Chiang, C.-H.; Hsu, S.L.-C. The performance of polymer solar cells based on P3HT:PCBM after post-annealing and adding titanium dioxide nanoparticles. Mater. Res. Innov. 2014, 18, 102–105. [Google Scholar] [CrossRef]
- Aleshin, A.N. Organic optoelectronics based on polymer—inorganic nanoparticle composite materials. Phys. Usp. 2013, 56, 667–674. [Google Scholar] [CrossRef]
- Aleshin, A.N.; Shcherbakov, I.P. A light-emitting field-effect transistor based on a polyfluorene–ZnO nanoparticles film. J. Phys. D Appl. Phys. 2010, 43, 315104. [Google Scholar] [CrossRef]
- Aleshin, A.N.; Kim, D.W.; Park, S.H.; Lee, C.; Lee, S. Solution-processed polyfluorene-ZnO nanoparticles ambipolar light-emitting field-effect transistor. Org. Electron. 2011, 12, 1285–1290. [Google Scholar] [CrossRef]
- Song, J.E.; Phenrat, T.; Marinakos, S.; Xiao, Y.; Liu, J.; Wiesner, M.R.; Tilton, R.D.; Lowry, G.V. Hydrophobic interactions increase attachment of gum arabic- and PVP-coated Ag nanoparticles to hydrophobic surfaces. Environ. Sci. Technol. 2011, 45, 5988–5995. [Google Scholar] [CrossRef]
- Jebali, S.; Vayer, M.; Belal, K.; Sinturel, C. Engineered nanocomposite coatings: From water-soluble polymer to advanced hydrophobic performances. Materials 2024, 17, 574. [Google Scholar] [CrossRef] [PubMed]
- Yousef, E.; Ali, M.K.M.; Allam, N.K. Tuning the optical properties and hydrophobicity of BiVO4/PVC/PVP composites as potential candidates for optoelectronics applications. Opt. Mater. 2024, 150, 115193. [Google Scholar] [CrossRef]
- Haaf, F.; Sanner, A.; Straub, F. Polymers of N-vinylpyrrolidone: Synthesis, characterization and uses. Polym. J. 1985, 17, 143–152. [Google Scholar] [CrossRef]
- Kurakula, M.; Rao, G.S.N.K. Pharmaceutical assessment of polyvinylpyrrolidone (PVP): As excipient from conventional to controlled delivery systems with a spotlight on COVID-19 inhibition. J. Drug Deliv. Sci. Technol. 2020, 60, 102046. [Google Scholar] [CrossRef]
- Khalid, M.U.; Rudokaite, A.; da Silva, A.M.H.; Kirsnyte-Snioke, M.; Stirke, A.; Melo, W.C.M.A. A comprehensive review of niobium nanoparticles: Synthesis, characterization, applications in health sciences, and future challenges. Nanomaterials 2025, 15, 106. [Google Scholar] [CrossRef]
- Lopes, O.F.; Paris, E.C.; Ribeiro, C. Synthesis of Nb2O5 nanoparticles through the oxidant peroxide method applied to organic pollutant photodegradation: A mechanistic study. Appl. Catal. B Environ. 2014, 144, 800–808. [Google Scholar] [CrossRef]
- Hajduk, B.; Bednarski, H.; Jarząbek, B.; Janeczek, H.; Nitschke, P. Optical and thermal properties of Nb2O5 nanocomposites. Beilstein J. Nanotechnol. 2018, 9, 1108–1115. [Google Scholar] [CrossRef]
- Hajduk, B.; Bednarski, H.; Jarząbek, B.; Nitschke, P.; Janeczek, H. Phase diagram of P3HT:PC70BM thin films based on variable-temperature spectroscopic ellipsometry. Polym. Test. 2020, 84, 106383. [Google Scholar] [CrossRef]
- Hajduk, B.; Bednarski, H.; Jarka, P.; et al. Thermal and optical properties of PMMA films reinforced with Nb2O5 nanoparticles. Sci. Rep. 2021, 11, 22531. [Google Scholar] [CrossRef]
- Hajduk, B.; Jarka, P.; Tański, T.; Bednarski, H.; Janeczek, H.; Gnida, P.; Fijalkowski, M. An investigation of the thermal transitions and physical properties of semiconducting PDPP4T:PDBPyBT blend films. Materials 2022, 15, 8392. [Google Scholar] [CrossRef]
- Hajduk, B.; Bednarski, H.; Domański, M.; Jarząbek, B.; Trzebicka, B. Thermal transitions in P3HT: PC60BM films based on electrical resistance measurements. Polymers 2020, 12, 1458. [Google Scholar] [CrossRef]
- Richter, U. SpectraRay/3 Software Manual; Sentech Instruments GmbH: Berlin, Germany, 2011. [Google Scholar]
- Stoumbou, E.; Stavrakas, I.; Hloupis, G.; Alexandridis, A.; et al. , A comparative study on the use of the extended-Cauchy dispersion equation for fitting refractive index data in crystals. Opt. Quantum Electron. 2013, 45. [Google Scholar] [CrossRef]
- Johnson, D.I.; Gadd, G.E.; Town, G.E. Total differential optical properties of polymer nanocomposite materials. In Proceedings of the 2006 International Conference on Nanoscience and Nanotechnology, ICONN 2006; IEEE: Piscataway, NJ, USA; 2006; pp. 423–426. [Google Scholar] [CrossRef]
- Buera, M.D.P.; Levi, G.; Karel, M. Glass transition in poly(vinylpyrrolidone): Effect of molecular weight and diluents. Biotechnol. Prog. 1992, 8, 144–148. [Google Scholar] [CrossRef]
- Maidannyk, V.A.; Mishra, V.S.N.; Miao, S.; Djali, M.; McCarthy, N.; Nurhadi, B. The effect of polyvinylpyrrolidone addition on microstructure, surface aspects, the glass transition temperature and structural strength of honey and coconut sugar powders. J. Future Foods 2022, 2, 338–345. [Google Scholar] [CrossRef]
- Gatica, N.; Soto, L.; Moraga, C.; Vergara, L. Blends of poly(N-vinyl-2-pyrrolidone) and dihydric phenols: Thermal and infrared spectroscopic studies. Part IV. J. Chil. Chem. Soc. 2013, 58, 1978–1983. [Google Scholar] [CrossRef]
- Restrepo, I.; Velásquez, E.; Galotto, M.; Guarda, A. Influence of the molar mass and concentration of polyvinylpyrrolidone on the physical–mechanical properties of polylactic acid for food packaging. Polymers 2025, 17, 2218. [Google Scholar] [CrossRef]
- Vyazovkin, S.; Dranca, I. Probing beta relaxation in pharmaceutically relevant glasses by using DSC. Pharm. Res. 2006, 23, 422–428. [Google Scholar] [CrossRef] [PubMed]
- Fox, T.G.; Flory, P.J. The glass temperature and related properties of polystyrene. Influence of molecular weight. J. Polym. Sci. 1954, 14, 315–319. [Google Scholar] [CrossRef]
- Jarka, P.; Hajduk, B.; Kumari, P.; Janeczek, H.; Godzierz, M.; Tsekpo, Y.M.; Tański, T. Investigations on thermal transitions in PDPP4T/PCPDTBT/AuNPs composite films using variable temperature ellipsometry. Polymers 2025, 17, 704. [Google Scholar] [CrossRef]
- Hajduk, B.; Jarka, P.; Bednarski, H.; et al. Thermal and optical properties of P3HT:PC70BM: ZnO nanoparticles composite films. Sci. Rep. 2024, 14, 66. [Google Scholar] [CrossRef]
- White, R.P.; Lipson, J.E.G.; Keddie, J.L. Spectroscopic ellipsometry as a route to thermodynamic characterization. Soft Matter 2022, 18, 6660–6673. [Google Scholar] [CrossRef]
- Wang, T.; Hu, S.; Zhang, S.; Peera, A.; Reffner, J.; Torkelson, J. M. Eliminating the Tg-Confinement Effect in Polystyrene Films: Extraordinary Impact of a 2 mol % 2-Ethylhexyl Acrylate Comonomer. Macromolecules 2022, 55, 9601–9611. [Google Scholar] [CrossRef]
- Serna, S.; Wang, T.; Torkelson, J.M. Eliminating the Tg-confinement and fragility-confinement effects in poly(4-methylstyrene) films by incorporation of 3 mol % 2-ethylhexyl acrylate comonomer. J. Chem. Phys. 2024, 160, 034903. [Google Scholar] [CrossRef]
- Ali, H.E.; Sayed, M.A.; Algarni, H.; Khairy, Y.; Abdel-Aziz, M.M. Use of niobium oxide nanoparticles as nanofillers in PVP/PVA blends to enhance UV–visible absorption, opto-linear, and nonlinear optical properties. J. Vinyl Addit. Technol. 2022, 28, 444–452. [Google Scholar] [CrossRef]
Figure 1.
Chemical structure of PVP and Nb2O5.
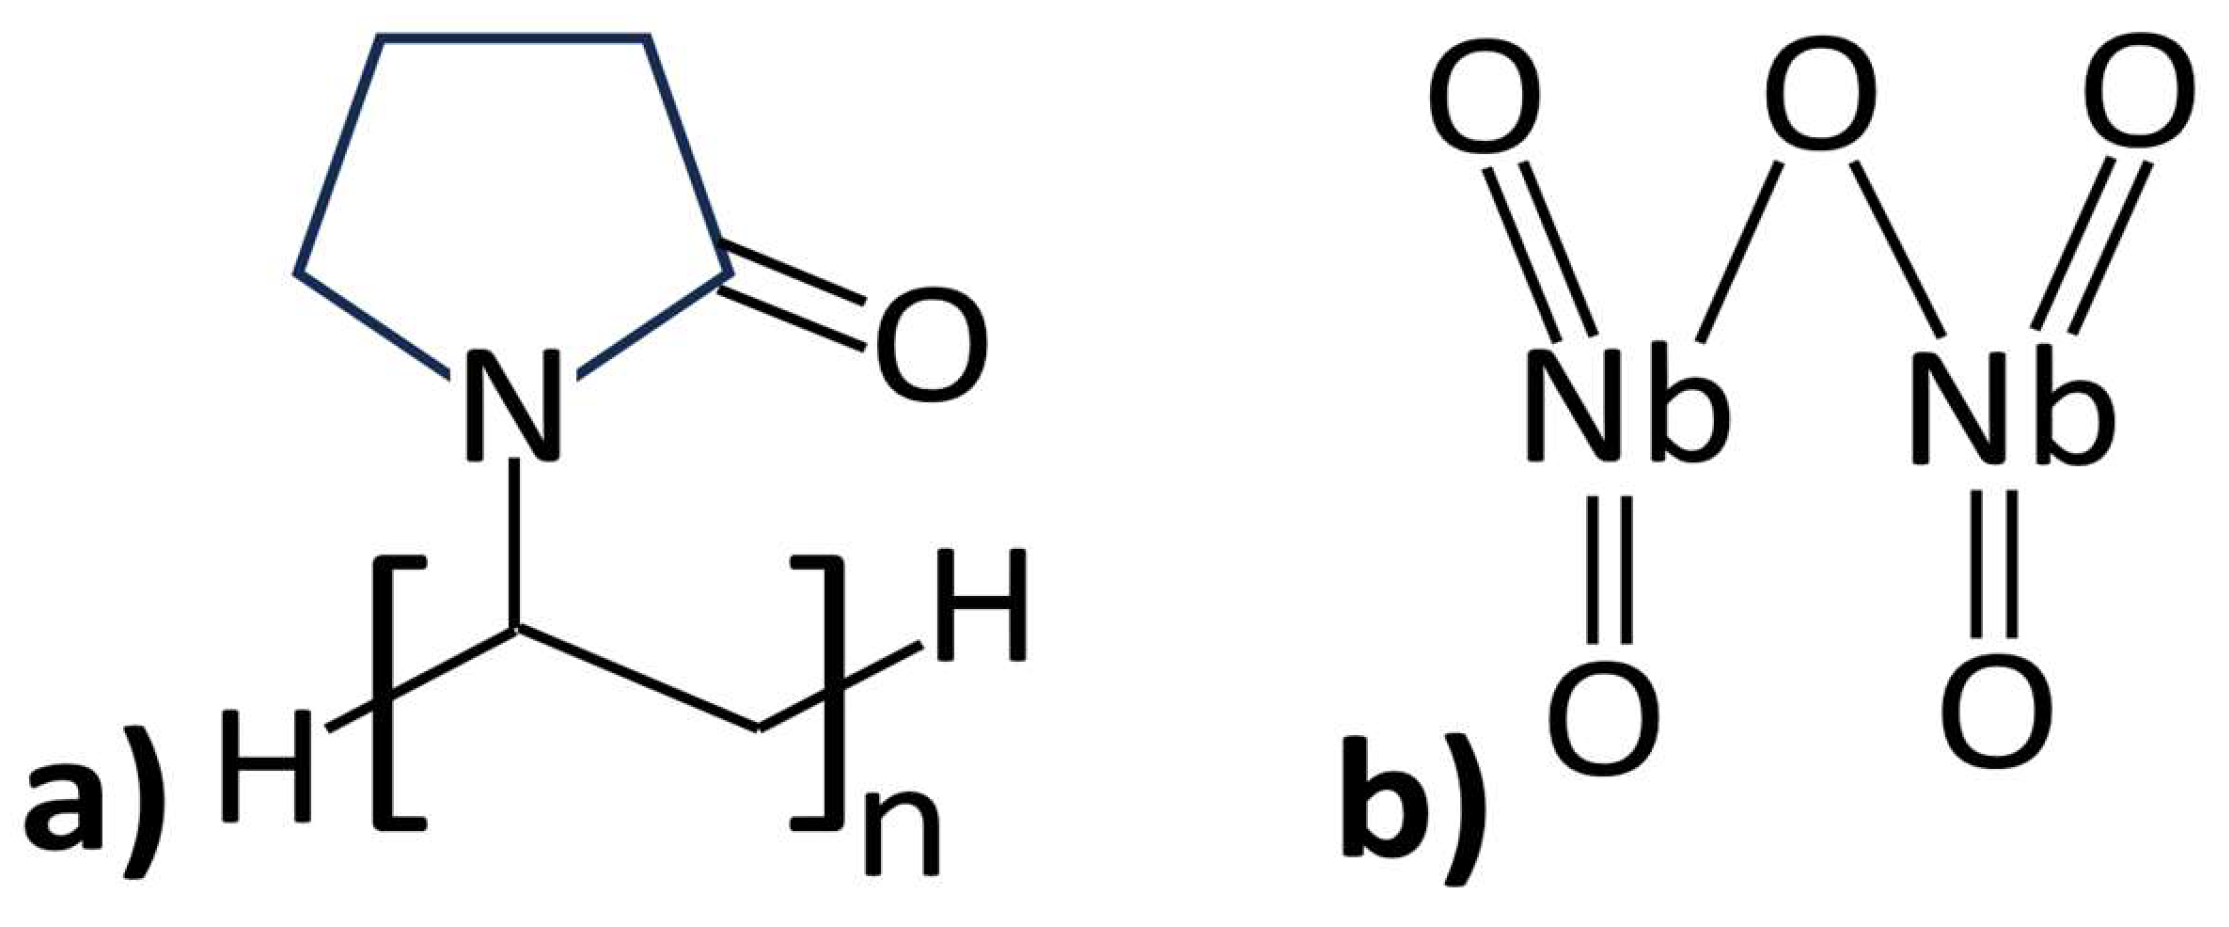
Figure 3.
Transmittance of PVP and its Nb2O5 composites.
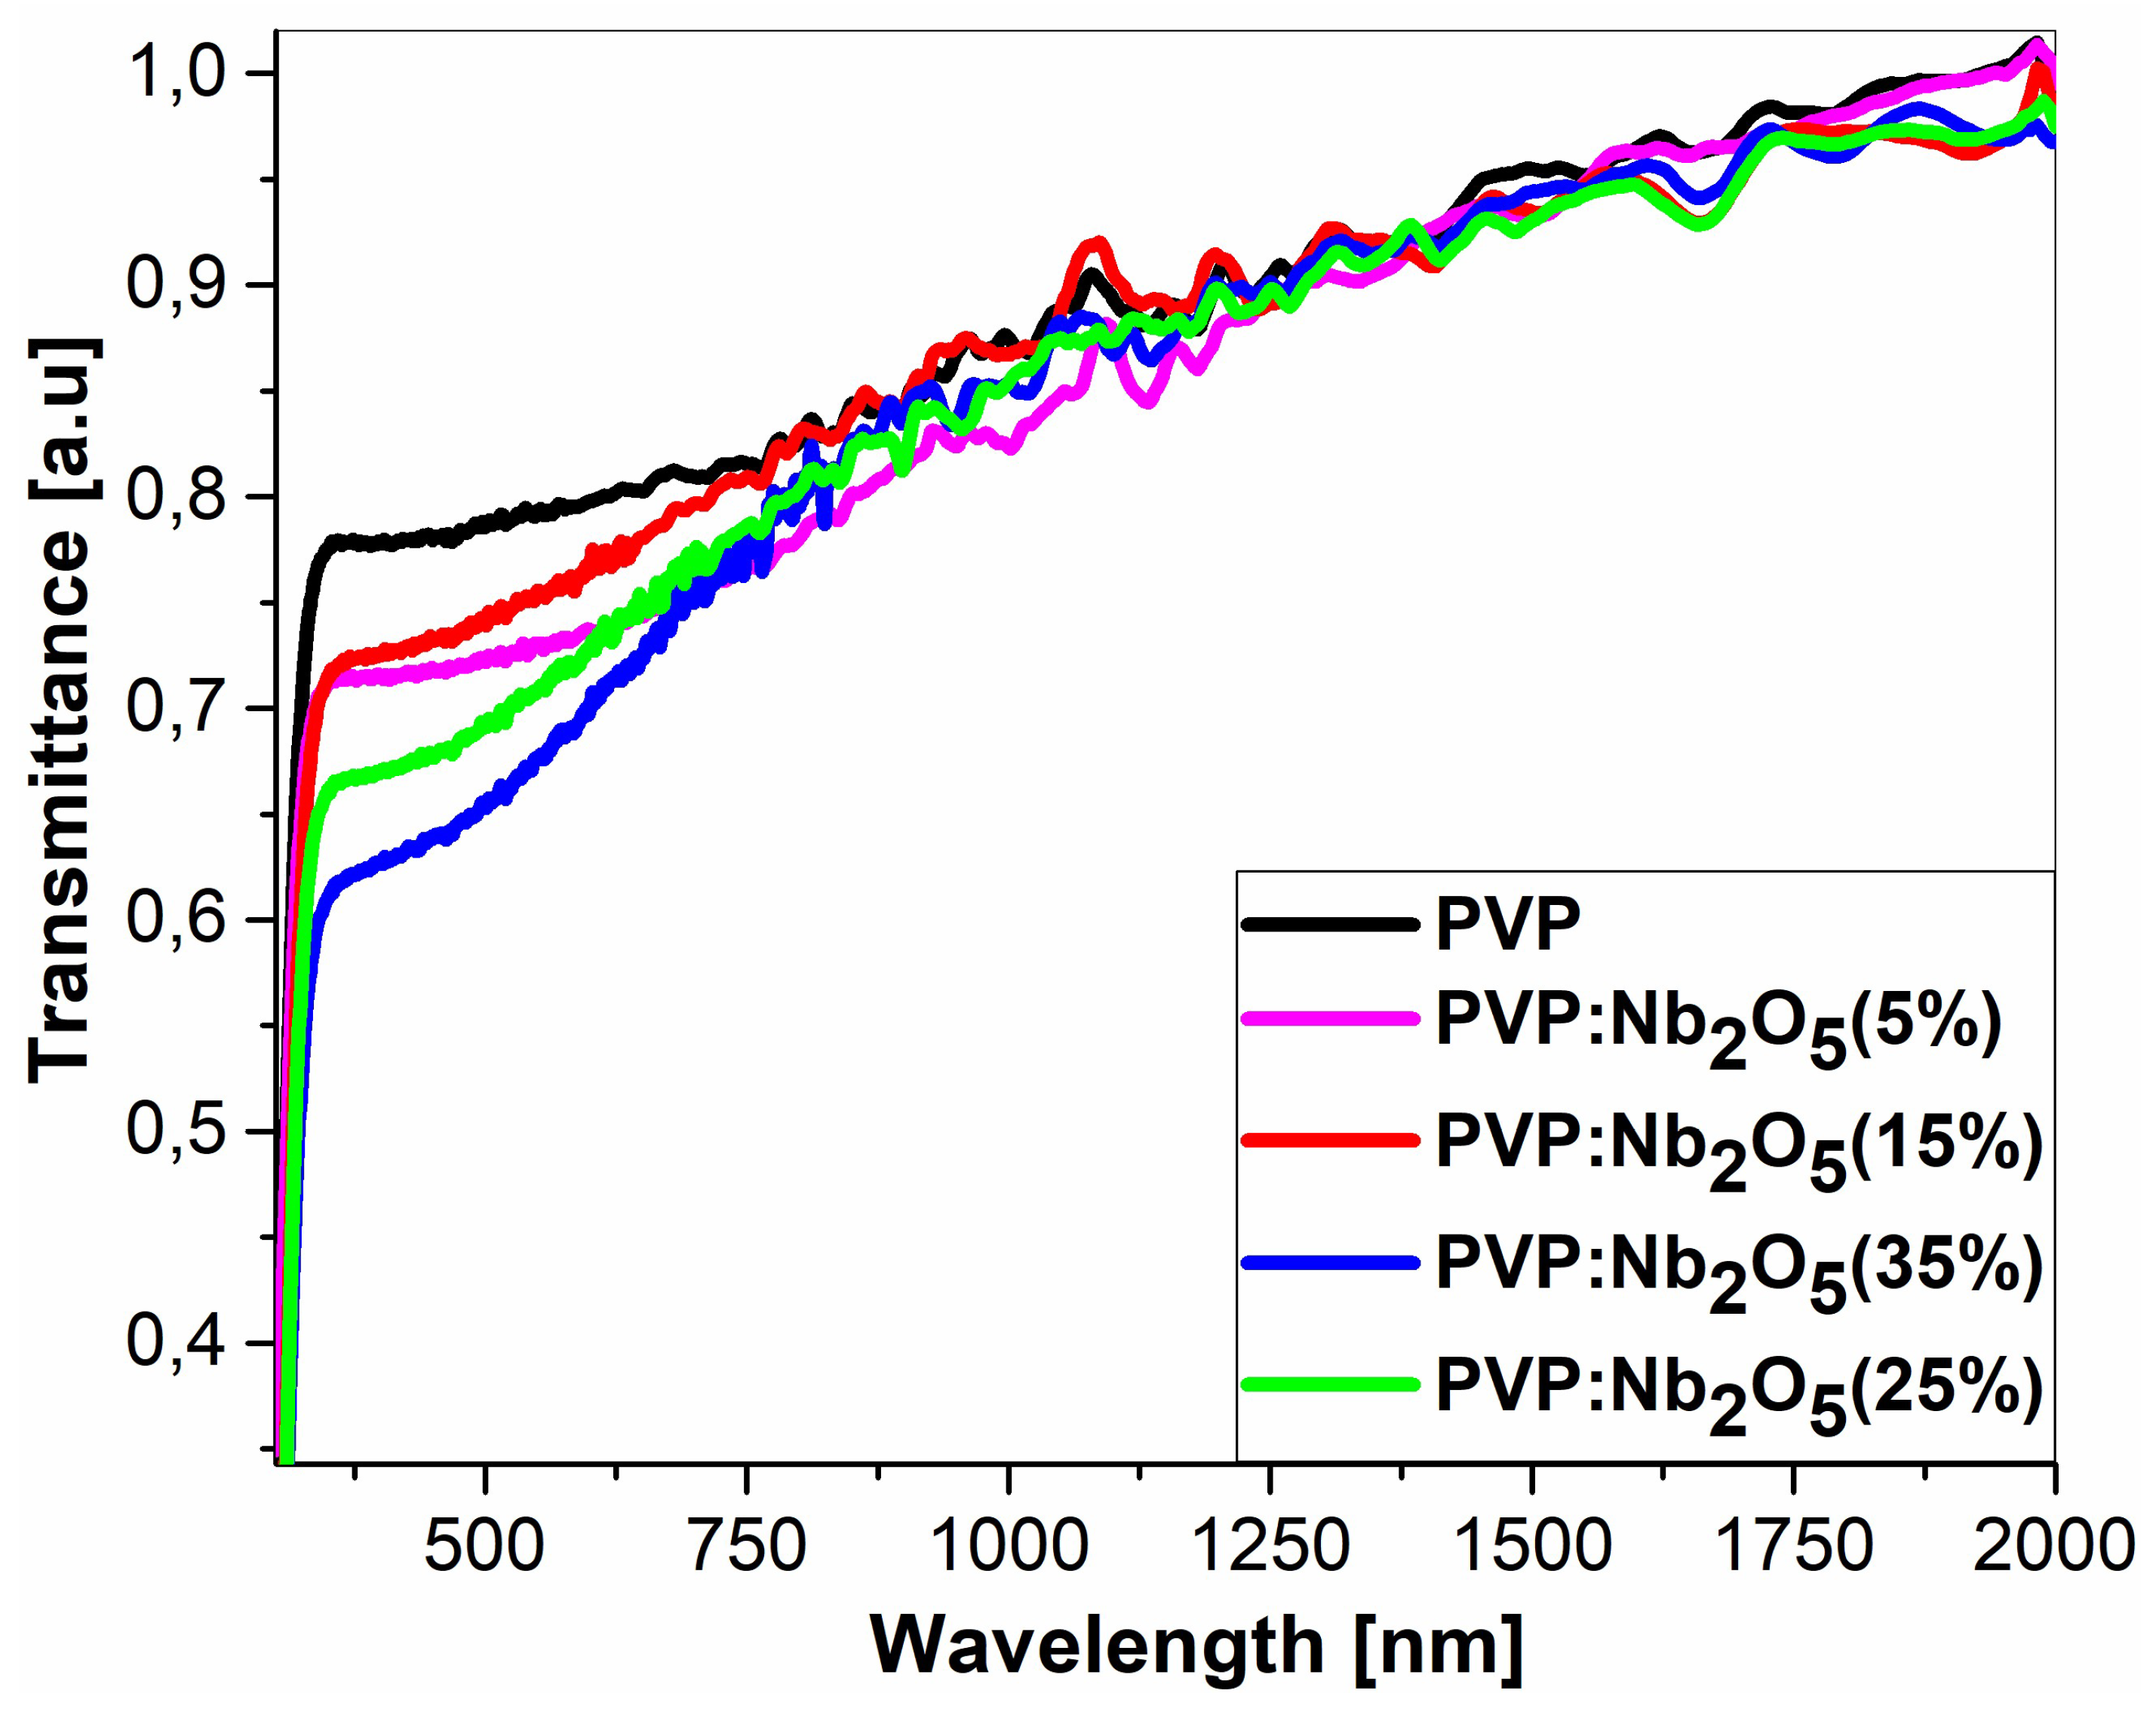
Figure 4.
The ellipsometric model, used for PVP and its NPs composites spectra fitting.
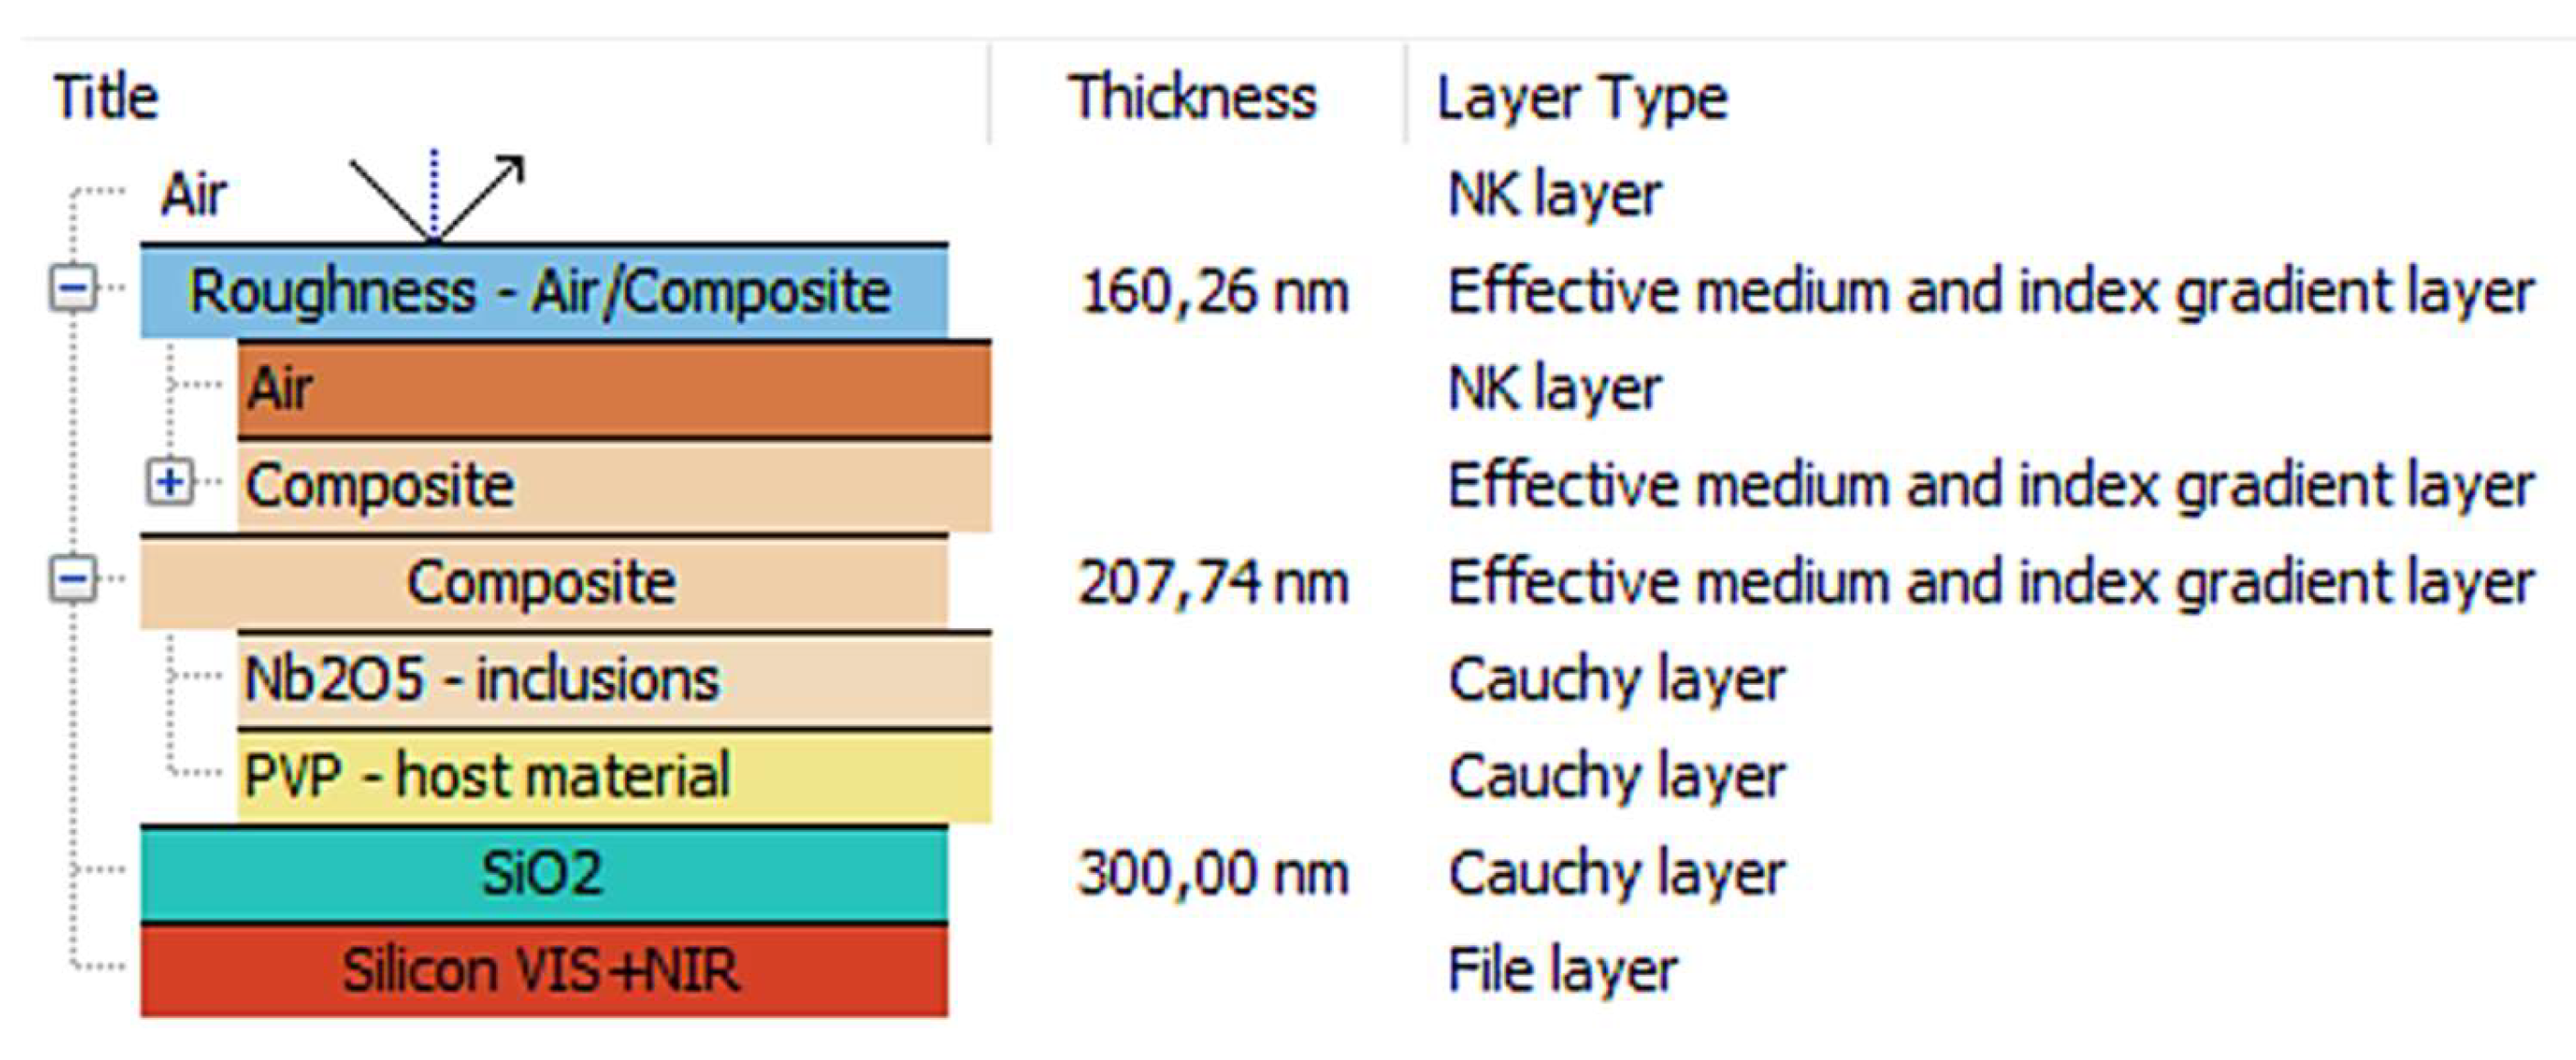
Figure 5.
Values of refractive indices of PVP and their composites with Nb2O5. The refractive index of Nb2O5 has been added as the inset for comparison.
Figure 5.
Values of refractive indices of PVP and their composites with Nb2O5. The refractive index of Nb2O5 has been added as the inset for comparison.
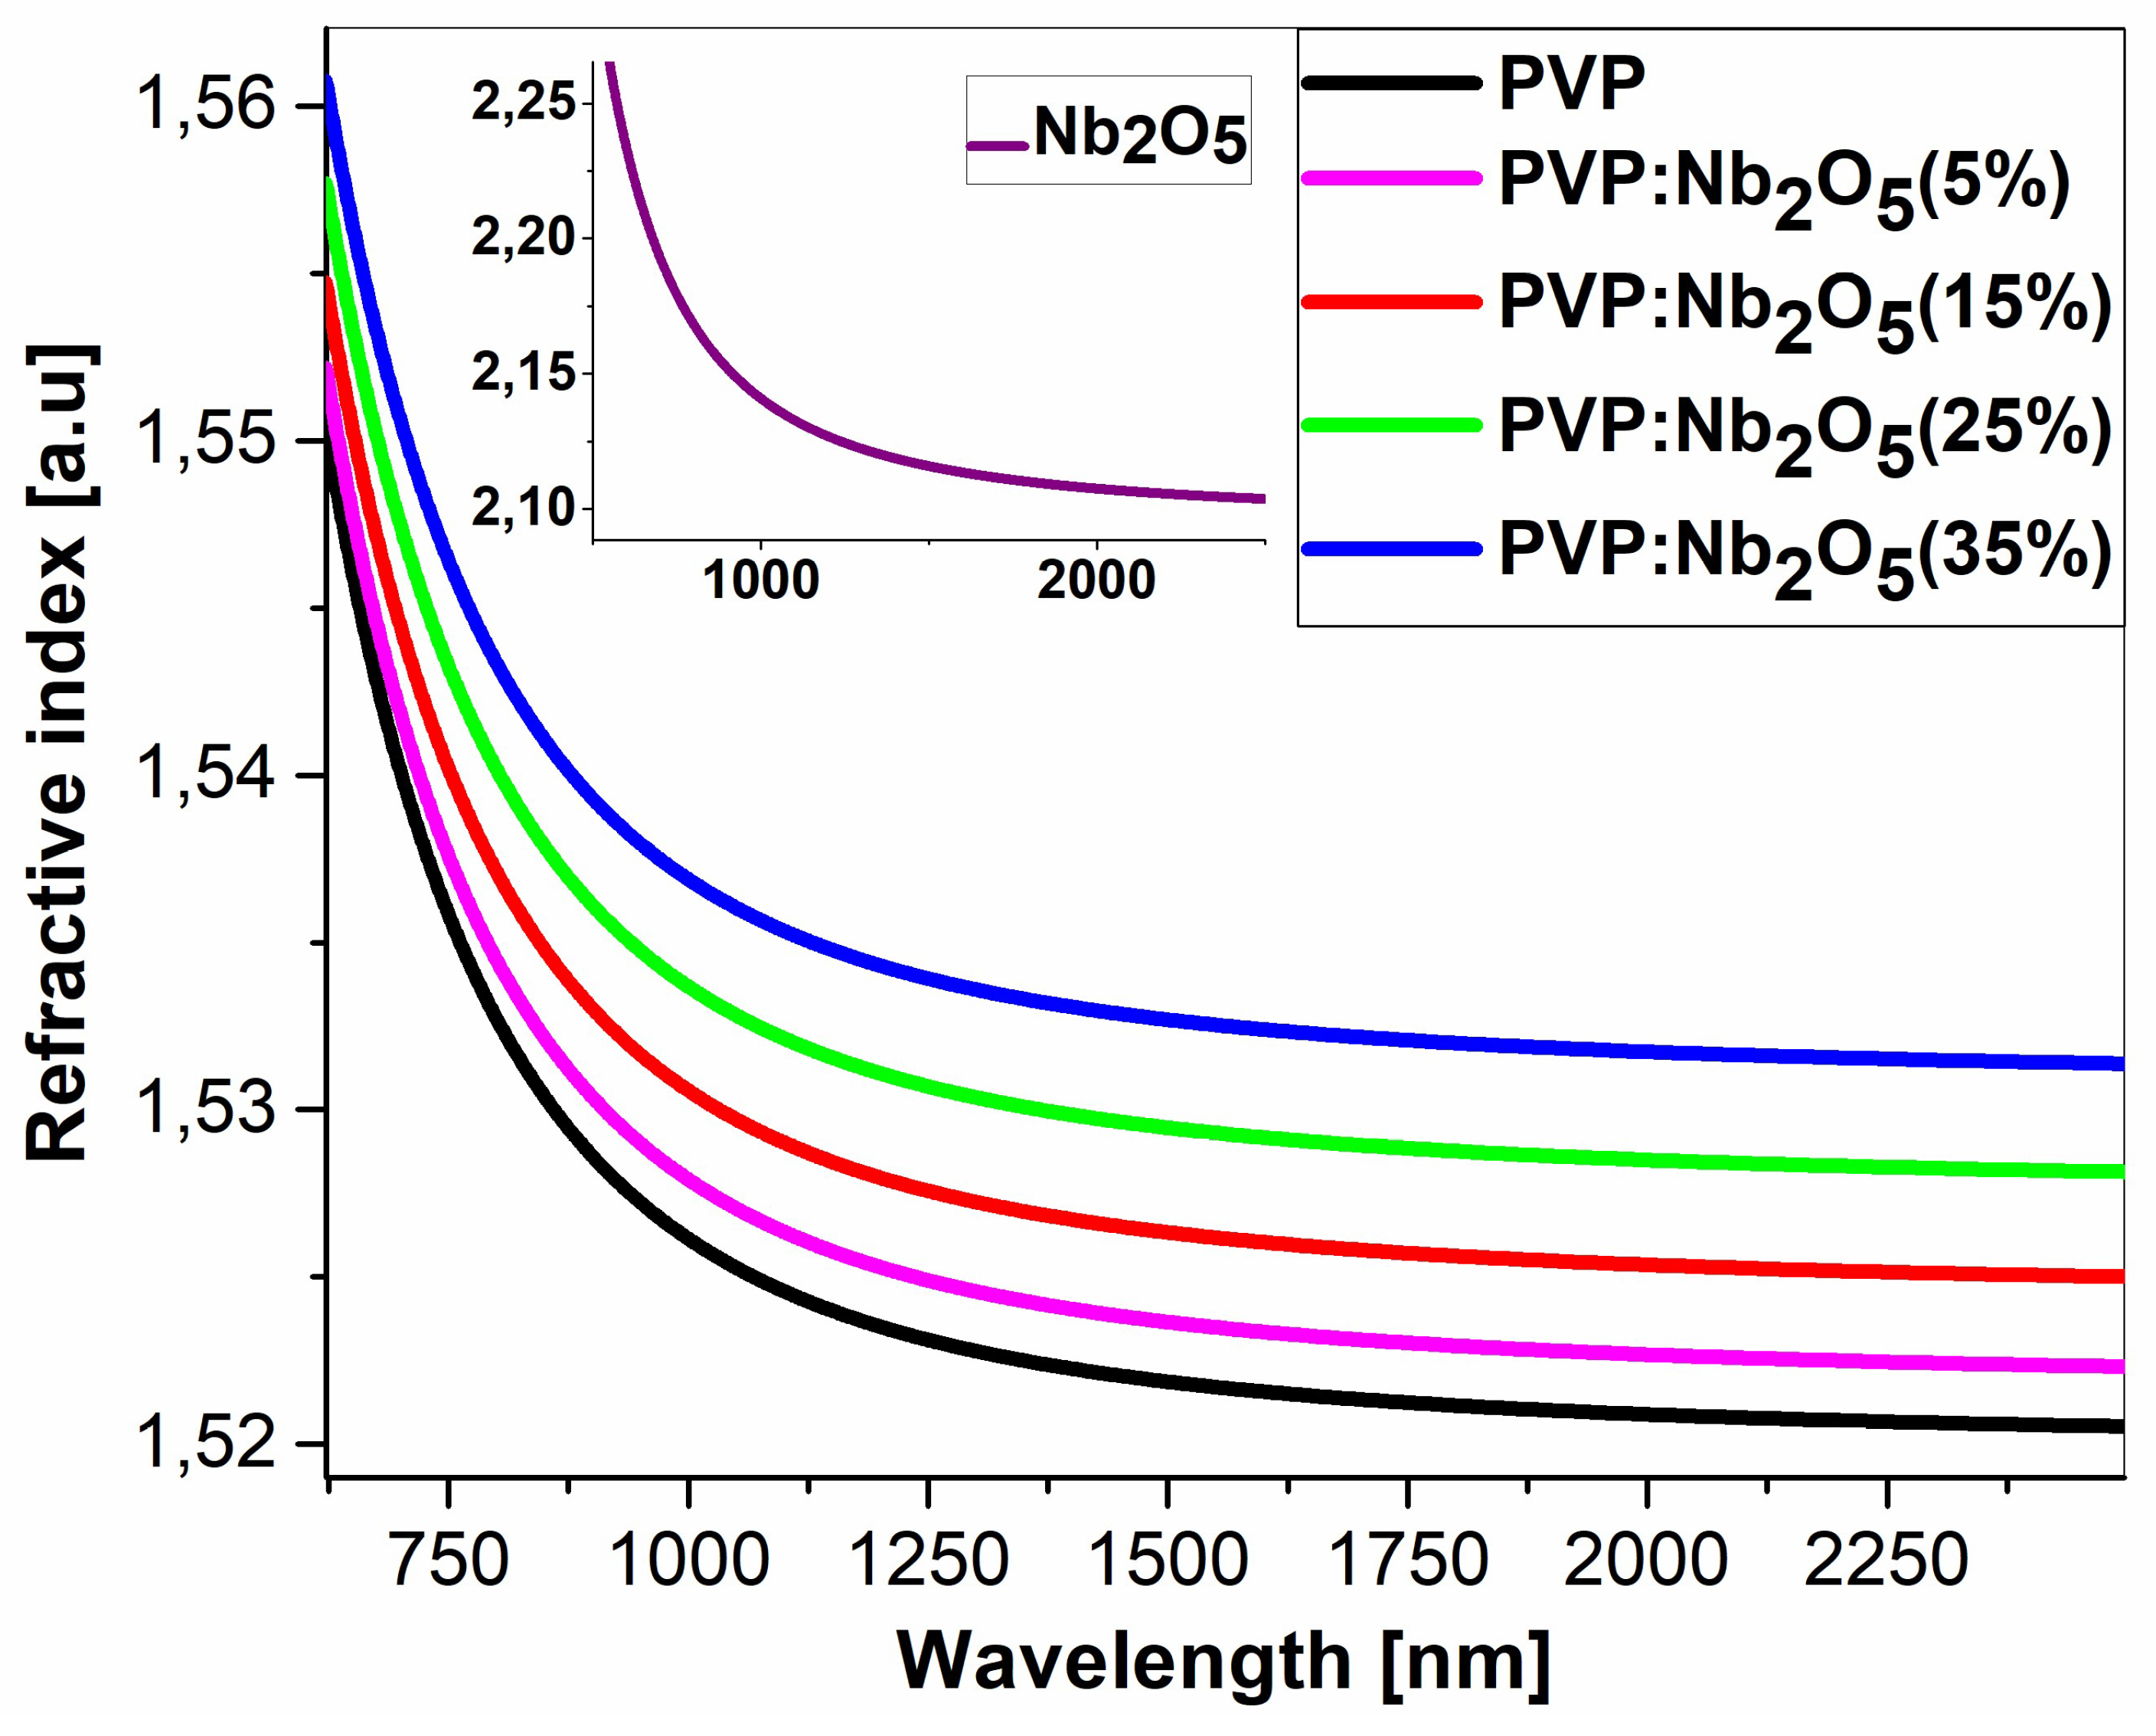
Figure 8.
SEM pictures of the morphology of PVP (a) and its Nb2O5 composites at concentrations 5% (b), 15% (c), 25%(d) and 35%(e).
Figure 8.
SEM pictures of the morphology of PVP (a) and its Nb2O5 composites at concentrations 5% (b), 15% (c), 25%(d) and 35%(e).
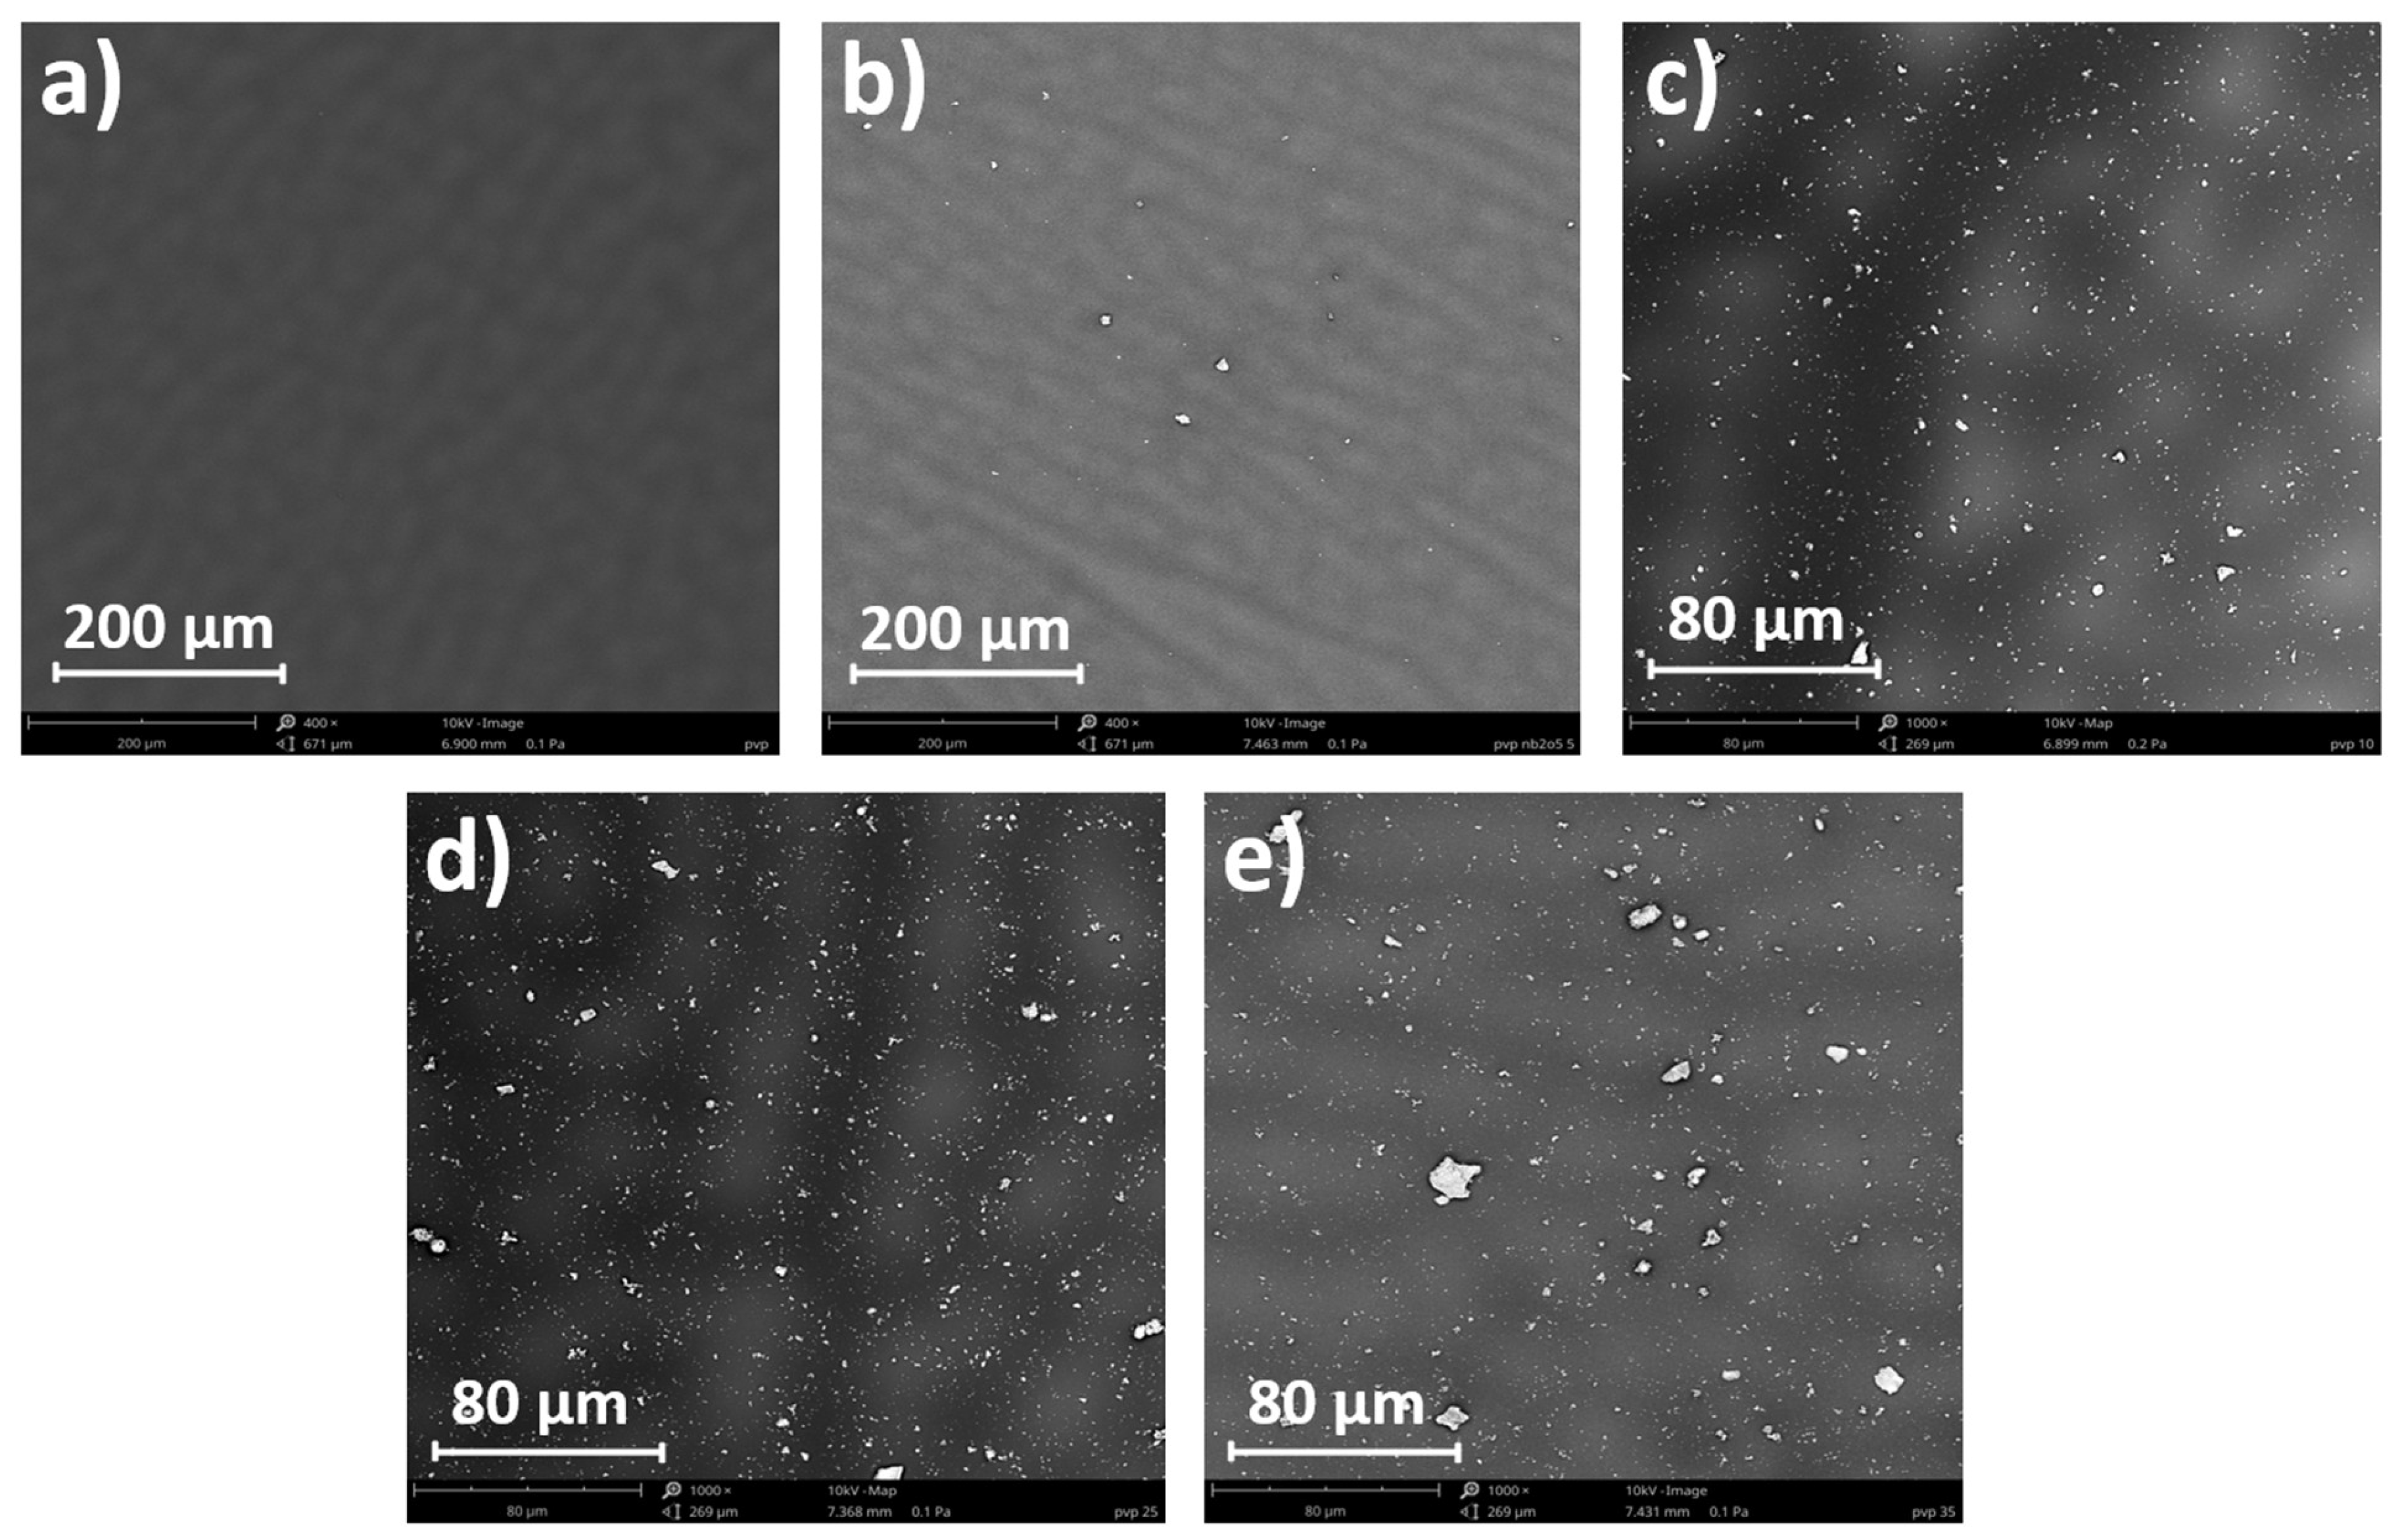
Figure 6.
The DSC plots, obtained with a heating rate of 20 °C/min, for pure PVP, and its Nb2O5 composites (5, 15, 25, and 35%). The red line represents the Tg deviation for the highest nanoparticle concentration compared to pure PVP.
Figure 6.
The DSC plots, obtained with a heating rate of 20 °C/min, for pure PVP, and its Nb2O5 composites (5, 15, 25, and 35%). The red line represents the Tg deviation for the highest nanoparticle concentration compared to pure PVP.
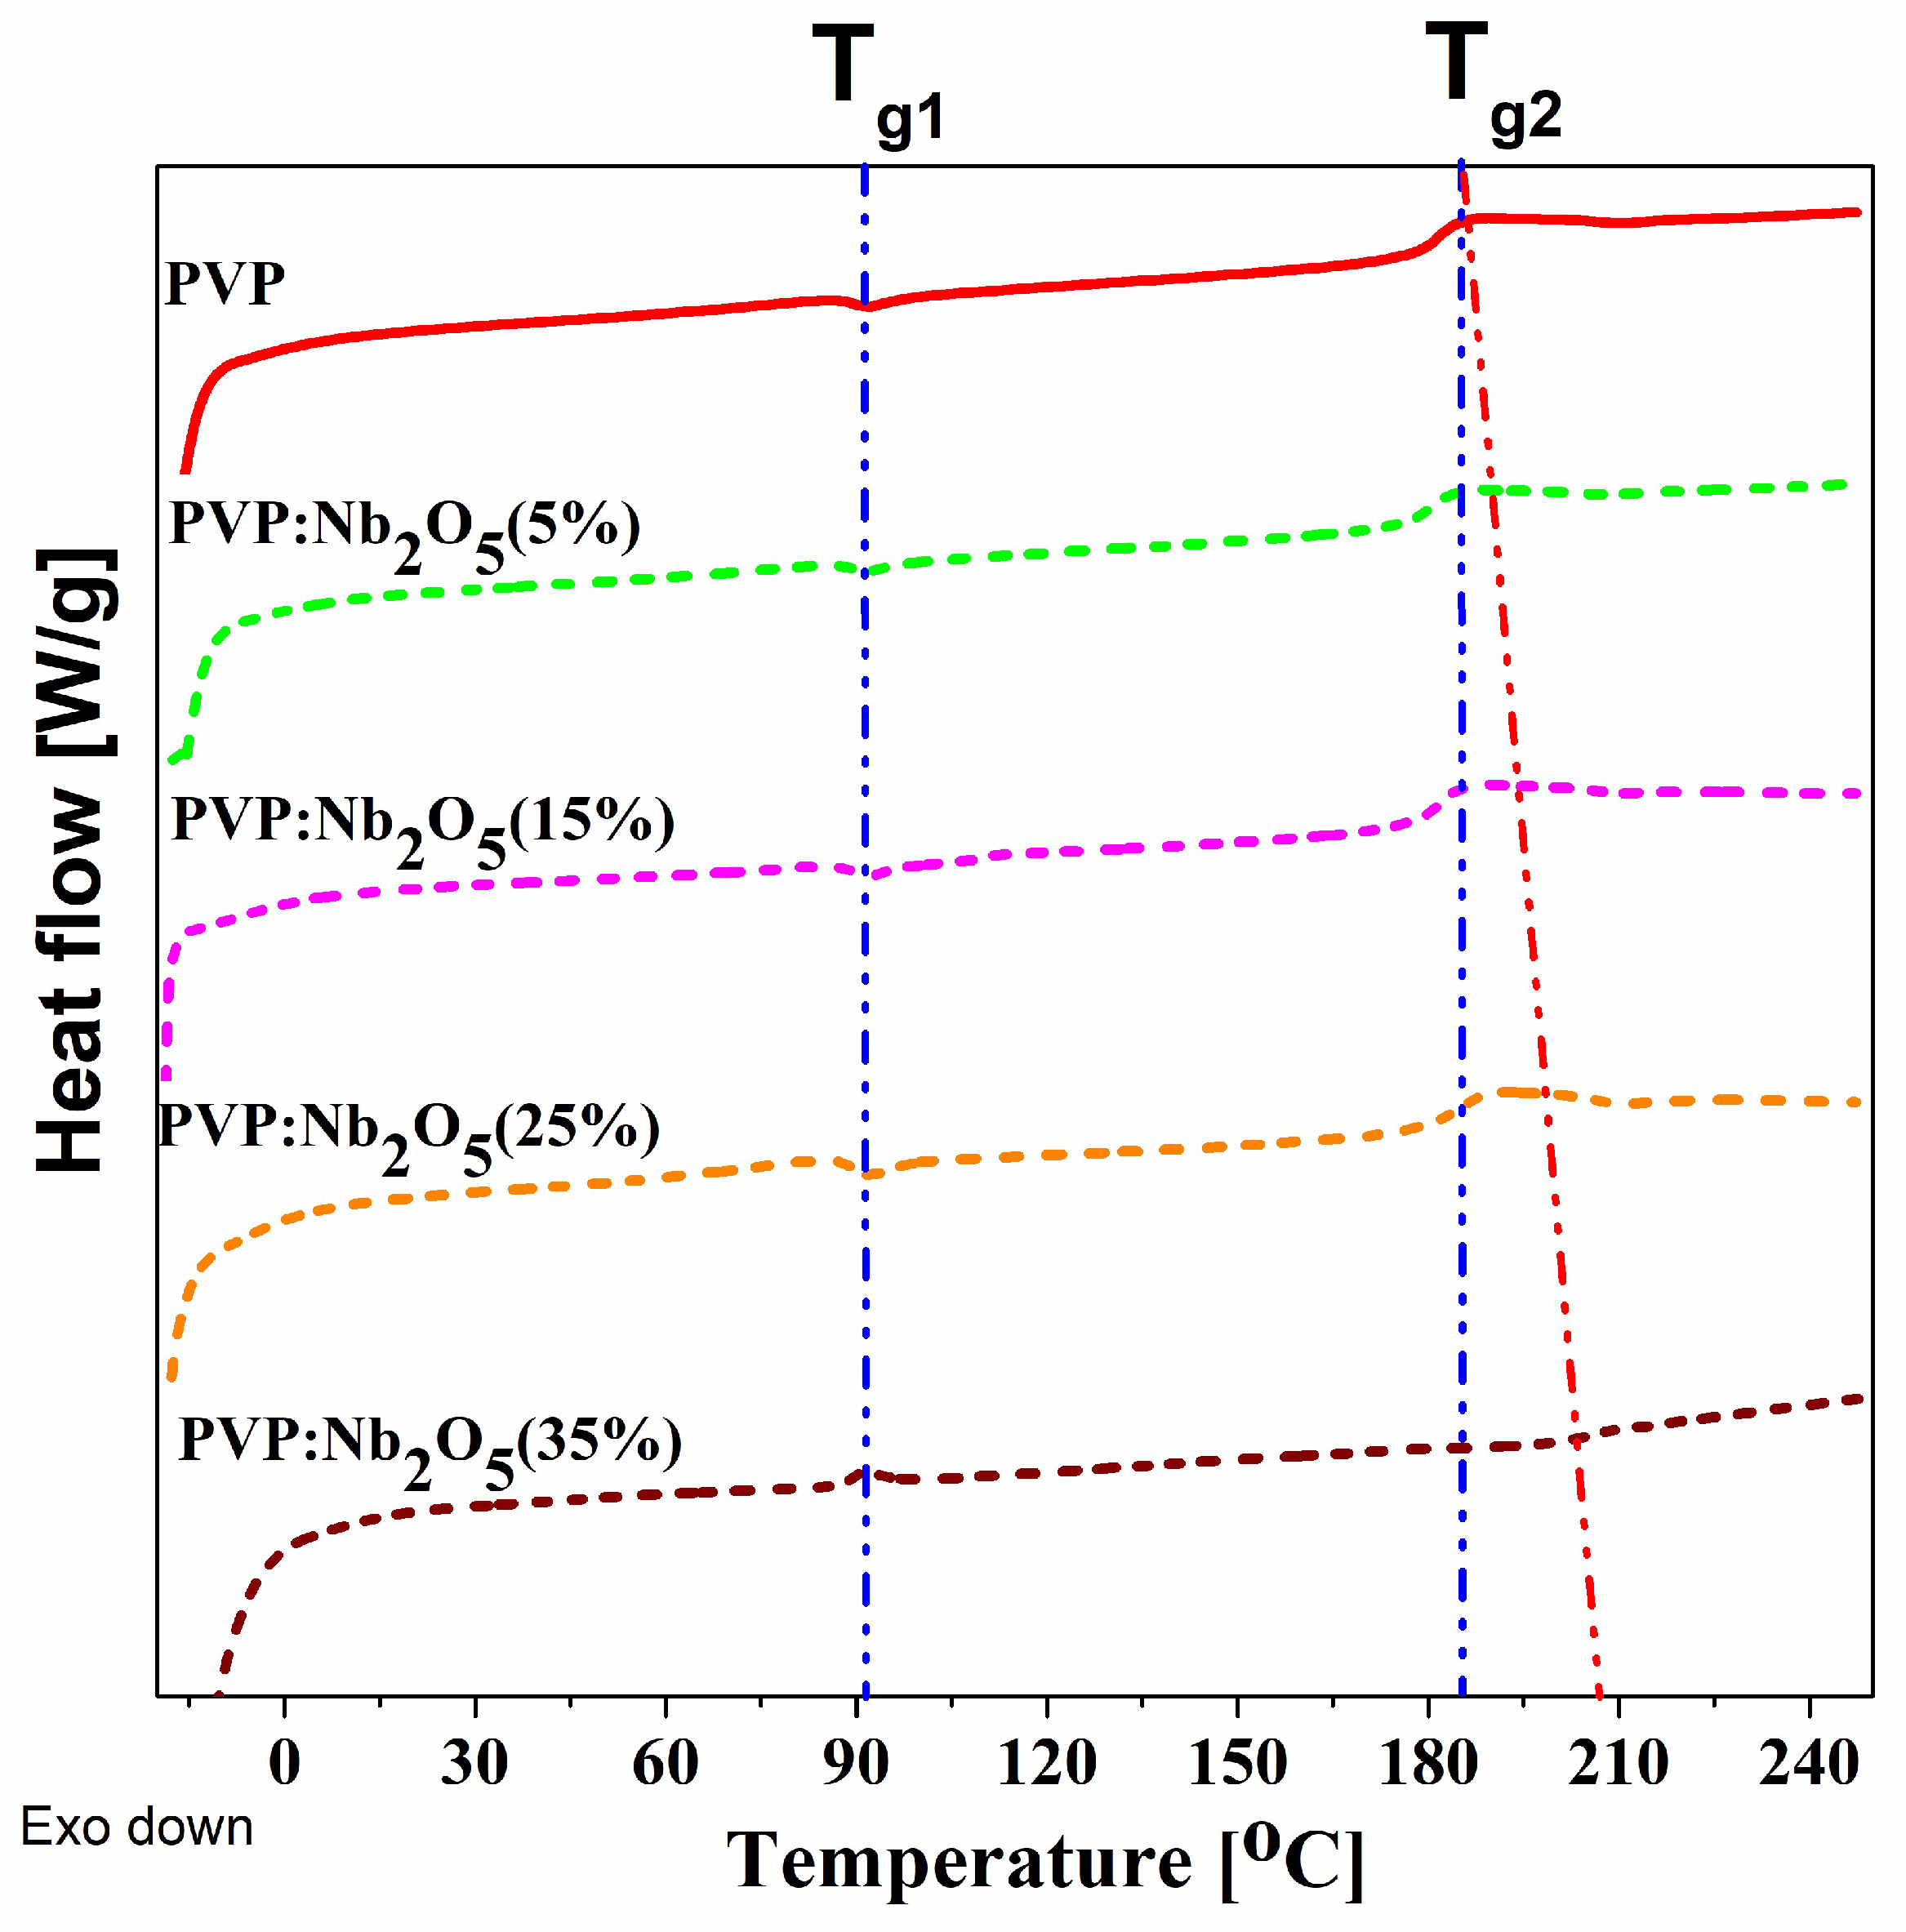
Figure 7.
The ellipsometric angle Δ plot at 900 nm as a function of temperature for PVP and its Nb2O5 composites (a) and nanoparticles distributed at lower (b) and higher concentration (c).
Figure 7.
The ellipsometric angle Δ plot at 900 nm as a function of temperature for PVP and its Nb2O5 composites (a) and nanoparticles distributed at lower (b) and higher concentration (c).
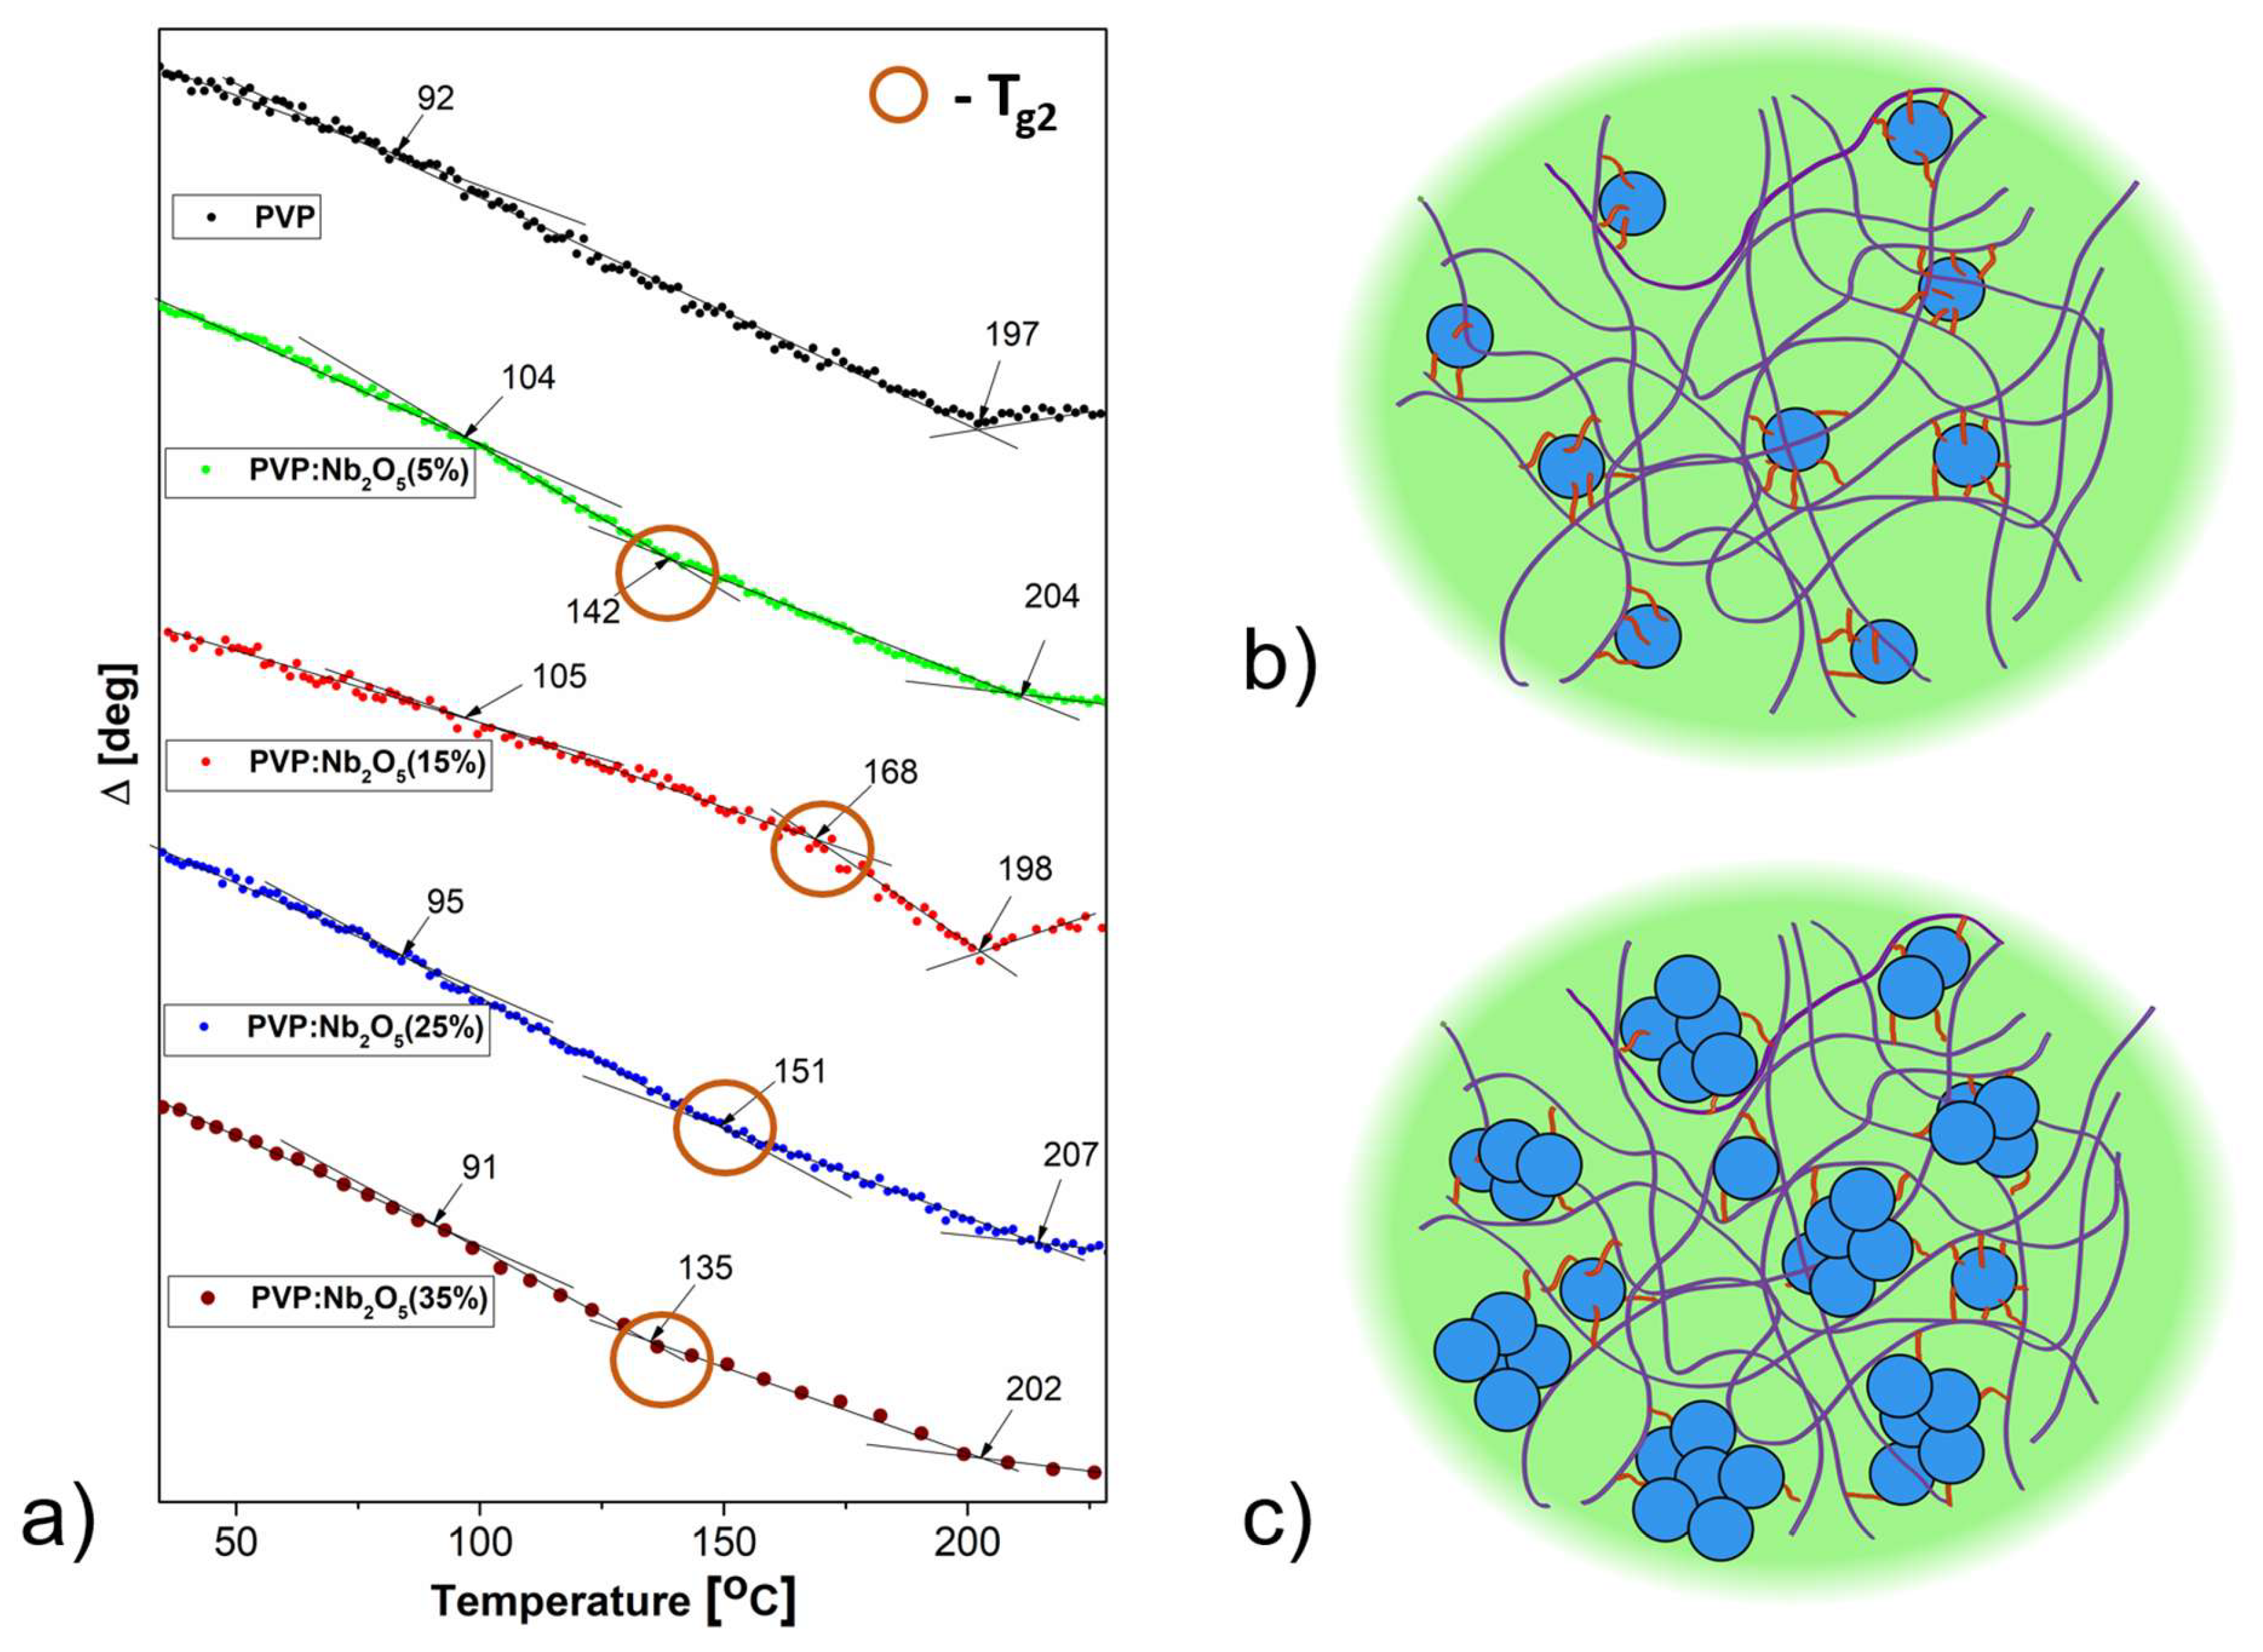
Figure 9.
Measurements of contact angle of PVP and its its Nb2O5 composites at concentrations 5% (b), 15% (c), 25%(d) and 35%(e).
Figure 9.
Measurements of contact angle of PVP and its its Nb2O5 composites at concentrations 5% (b), 15% (c), 25%(d) and 35%(e).
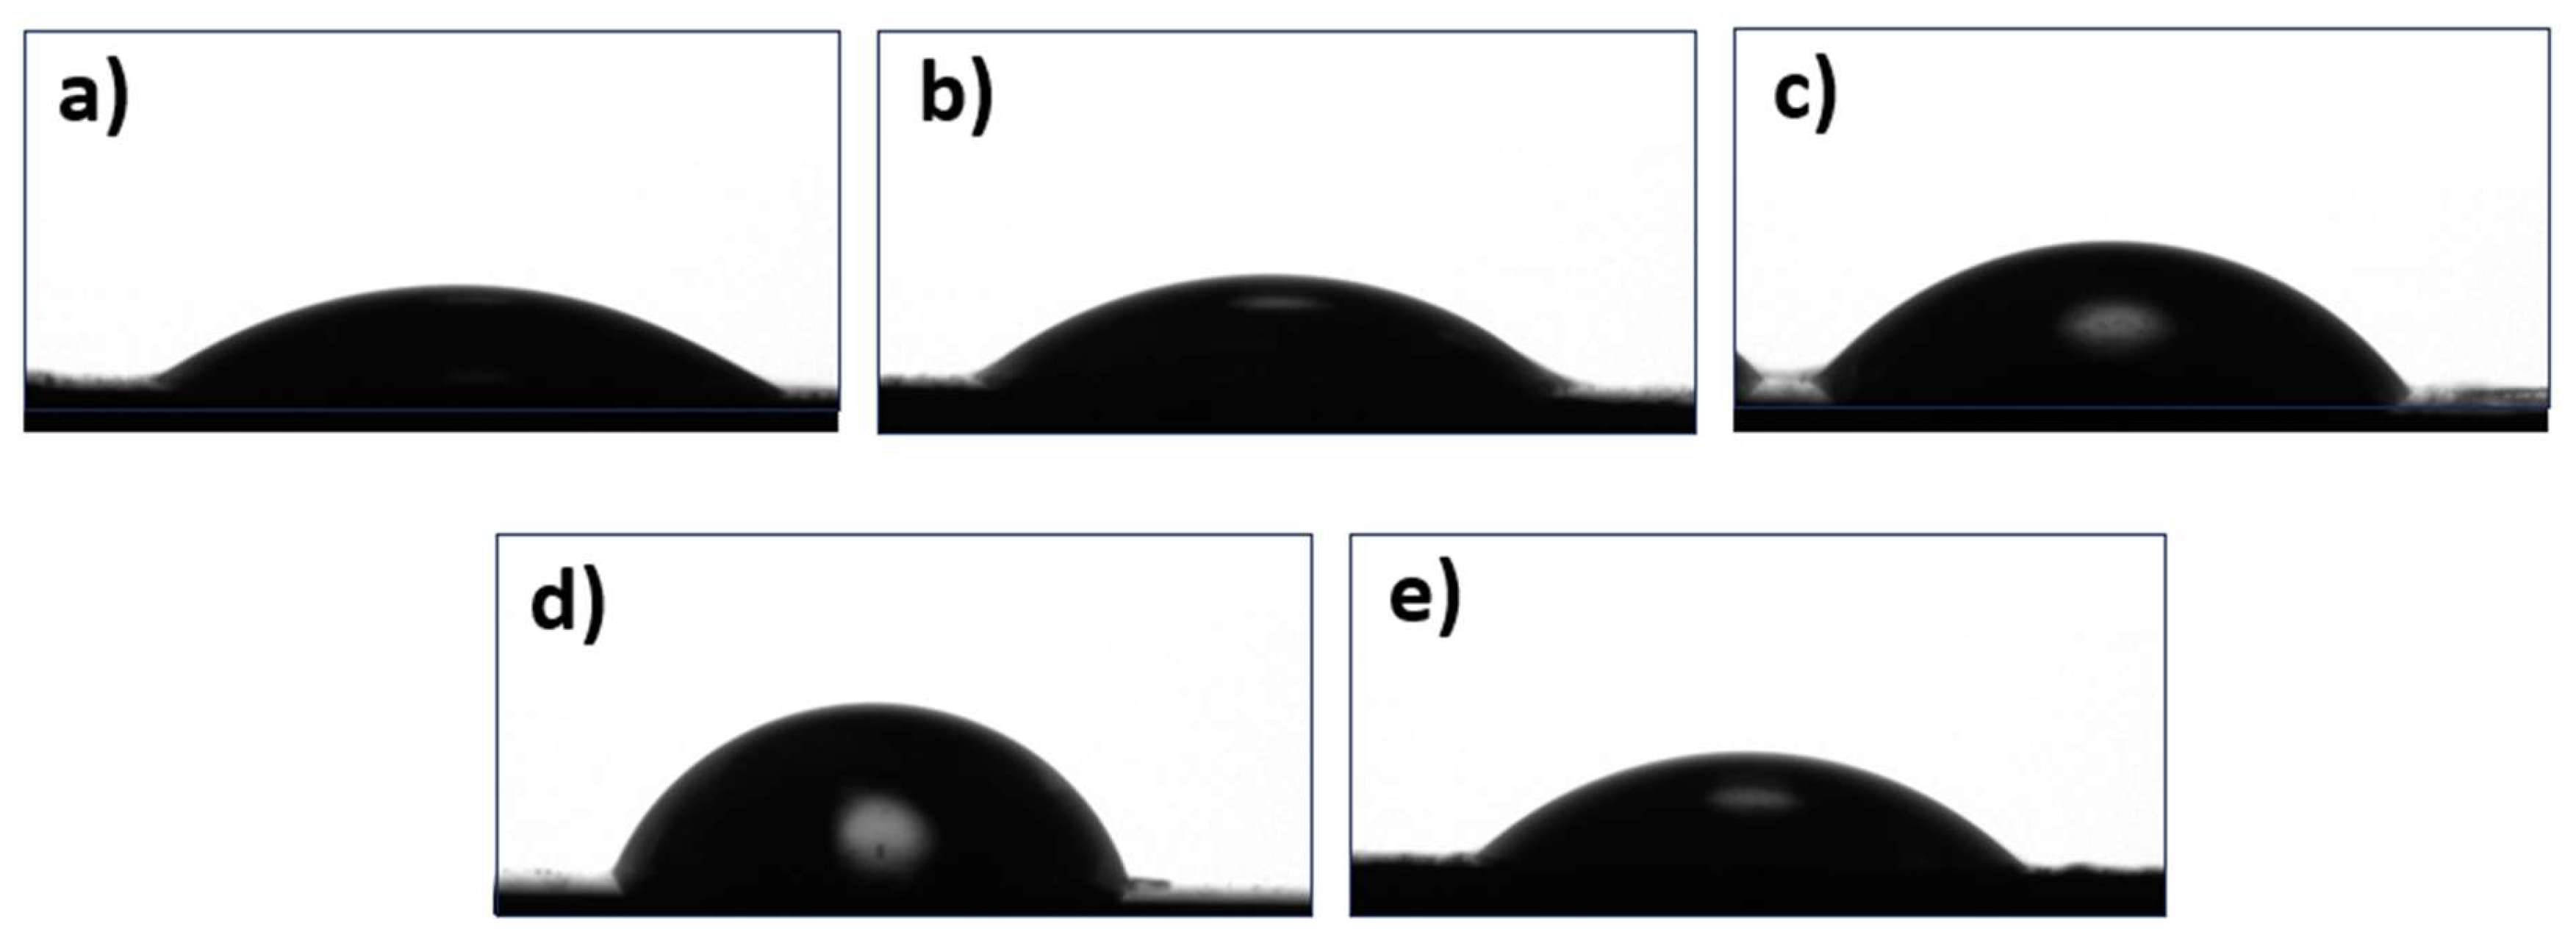

Table 1.
Concentration and weight of individual chloroform/polymer/NPs solutions.
| Nb2O5 content (%) | 0 | 10 | 15 | 25 | 35 |
|
PVP weight (mg) |
20 | 18 | 17 | 15 | 13 |
|
Nb2O5 Weight (mg) |
0 | 2 | 0 | 5 | 7 |
Table 2.
Physical parameters of PVP and its composites.
| Thin Film | PVP |
PVP: Nb2O5(5%) | PVP: Nb2O5(15%) | PVP: Nb2O5(25%) | PVP: Nb2O5(35%) |
|---|---|---|---|---|---|
|
Refractive index n [a.u] (for λ=2500nm) |
1.521 |
1.522 |
1.525 |
1.528 |
1.531 |
|
Fraction coefficient f [a.u] |
0 |
0.004 |
0.010 |
0.017 |
0.024 |
|
Thickness of samples on SiO2 d [nm] |
303 |
371 |
255 |
466 |
208 |
|
Roughness of samples on SiO2 r [nm] |
146 |
134 |
128 |
162 |
160 |
|
Thickness of samples on micr. cover glass d [nm] |
257 |
302 |
270 |
285 |
340 |
|
Roughness of samples on micr. cover glass r [nm] |
101 |
120 |
97 |
115 |
134 |
Table 3.
Thermal properties: Glass transition temperature of polyvinylpyrrolidone and their composites with Nb2O5 using DSC and VTSE.
Table 3.
Thermal properties: Glass transition temperature of polyvinylpyrrolidone and their composites with Nb2O5 using DSC and VTSE.
| DSC (powder) | Temperature ellipsometry (films) | ||||
|---|---|---|---|---|---|
| Sample | Tg1 (℃) |
Tg2 (℃) | TgV1 (℃) |
TgV2 (℃) | TgV3 (℃) |
| PVP | 88 | 188 | 92 | - | 197 |
| PVP: Nb2O5 (5%) | 88 | 181 | 104 | 142 | 204 |
| PVP: Nb2O5 (15%) | 88 | 180 | 105 | 168 | 198 |
| PVP: Nb2O5 (25%) | 89 | 183 | 95 | 151 | 207 |
| PVP: Nb2O5 (35%) |
88 | 204 | 91 | 135 | 202 |
Disclaimer/Publisher’s Note: The statements, opinions and data contained in all publications are solely those of the individual author(s) and contributor(s) and not of MDPI and/or the editor(s). MDPI and/or the editor(s) disclaim responsibility for any injury to people or property resulting from any ideas, methods, instructions or products referred to in the content. |
© 2025 by the authors. Licensee MDPI, Basel, Switzerland. This article is an open access article distributed under the terms and conditions of the Creative Commons Attribution (CC BY) license (http://creativecommons.org/licenses/by/4.0/).
Copyright: This open access article is published under a Creative Commons CC BY 4.0 license, which permit the free download, distribution, and reuse, provided that the author and preprint are cited in any reuse.


