Submitted:
24 September 2025
Posted:
25 September 2025
You are already at the latest version
Abstract
We propose an adaptive testing method that is robust for two-sample scale models with censored observations. Motivated by Uno et. al (2015), we propose simulation-based procedures to check model validity that exhibit robust performance across a broad range of alternative hypotheses. To evaluate the behavior of the proposed test, we conduct comprehensive simulations in some widely used survival functions. Simulation results indicate that the test exhibits strong performance in detecting scale difference between two samples, demonstrating adequate power. The proposed procedures are illustrated using a real-world dataset.
Keywords:
accelerated life time
; adaptive test
; censored data
; cumulative hazard
; two-sample problem
1. Introduction
In clinical trials, comparing the lifetimes of different groups, such as treatment and control groups, is crucial for evaluating therapeutic efficacy. The proportional hazards model ([2]), also referred to as the Cox model, has been widely adopted for such studies, particularly when data are censored. However, the proportional hazards assumption underlying the Cox model is restrictive and often difficult to satisfy in practice. An alternative approach is the accelerated life model ([5]), which models the direct relationship between lifetime and covariates. In this model, covariates act as acceleration or deceleration factors on the lifetime, making parameter interpretation more straightforward. For example, taking the logarithm of survival time yields a linear relationship between them. Despite this interpretational advantage, the accelerated life model presents obstacles in variance estimation because the asymptotic variance involves unknown densities, especially when censored data are present. The difficulty of estimating variance has hindered the development of model-checking procedures, necessitating the use of non-parametric methods. To address this issue, many authors have studied this model, including [10,13,15], among others.
To assess differences in variability between two groups through the cumulative hazard function in the accelerated life model, Yang ([15]) employed a weighting scheme that eliminates the density function from the variance expression through the hazard function. [15] further developed a corresponding test to validate the two-sample accelerated life model. This lack-of-fit test utilizes methodologies developed by [4]. The underlying approach is based on the idea that under (correct model specification) the scale estimators should converge, while under (model misspecification) these estimates diverge significantly. Thus, the test construction necessitates deriving multiple parameter estimates through the estimating function, which substantially increases computational complexity.
In addition, Yang’s method presents several practical challenges. First, it requires selecting an appropriate weight function that may vary depending on specific alternatives, a common issue in dealing with survival data. The careful selection of weight functions is crucial to obtain accurate results, which is not an easy process. Although various forms of weight functions have been proposed in the literature, including those by [11], the a priori selection of the optimal weight function remains a challenge. Second, both the derivation of the statistic and its practical implementation are also difficult due to the complexity of its mathematical expression. These difficulties can limit the practical applicability of the method in practice.
To address the limitations inherent in existing testing methods for accelerated life models, especially those associated with Yang’s method, this paper presents a novel procedure that dynamically determines optimal weight functions without requiring prespecified alternative hypotheses. Following [12], the proposed method adaptively determines optimal weighting schemes based on observed differences between cumulative hazard functions of the two samples. Unlike conventional testing procedures that depend heavily on assumed alternative hypotheses, this method offers enhanced flexibility and broader applicability. The proposed test statistic overcomes a limiting of existing weighted testing methods by not relying on specific alternatives, making it well-suited for developing robust testing procedures for two-sample accelerated life models.
The remainder of this paper proceeds as follows. Section 2 reviews Yang’s estimating function for accelerated life models. Section 3 and Section 4 develop proposed testing procedures. Section 5 presents numerical studies, including simulation results and a real-data example. Finally, Section 6 provides concluding remarks and directions for future research.
2. Estimating Function
Consider two censored samples with sample sizes and . Let , be independent, positive lifetimes with absolutely continuous distributions that are also independent of the corresponding censoring variables . The observed data are , and , where is the indicator function. Let be the density of . Then the hazard function and the cumulative hazard function are defined as and , respectively.
We are interested in testing the null hypothesis that two samples exhibit a scale factor relationship. To this end, consider the accelerated life model, which assumes that and are related by
for , but otherwise unspecified. Equivalently, the random variables , , have the same distribution as the random variables , . Therefore, serves as the scale factor for acceleration or deceleration, depending on whether or .
We assess the validity of the two-sample accelerated life model by using the available data and , assuming the censoring distributions are unknown. That is, we test that the accelerated life model holds. Let , , , and . The Nelson-Aalen estimator ([1]) of is
Let . [15] defined a scale estimator for the accelerated life model above as the solution to , for
where is a data-dependent weight function. [15] showed that choosing the weight function for some function , where is the product-limit estimator ([6]), eliminates the unknown density from the variance expression, thus simplifying the variance estimation procedures. Furthermore, [15] showed that is a consistent estimator for and follows a normal distribution under . It is important to note that a finite integration range, , containing sufficient data is used instead of . This adjustment addresses the potential for explosive behavior near 0 or ∞, a challenge that can be mitigated by truncating the integration range. We use this estimating function to develop testing procedures for the accelerated life model.
3. Test Statistic
Let . Our primary aim is to evaluate the null hypothesis that two samples are related by a scale factor, , consistent with the accelerated life model. Testing the null hypothesis is equivalent to verifying whether for all t in . To assess this, let be the empirical counterpart, where represents the Nelson-Aalen estimator of the cumulative hazard function . To standardize the difference at each time point t, define
where the estimated variance, , under the assumption of independence is given by
Note denotes its (approximately) estimated variance. Specifically,
Following [12] associated with the estimating function in (1), consider the following statistic that is an integrated cumulative hazard difference on the integration range,
where is a data-dependent weight function. It is clear that the test statistic is expected to perform well when the weight function is proportional to the expected value of under , as mentioned in [12]. This is because, in this case, a larger corresponds to a larger . Thus, one potential class of test statistics can be expressed as
which results in a right tail distribution under . However, this chi-squared distributed statistic might underperform for certain alternatives due to the extended right tail of its distribution. This issue could be resolved by choosing the weight function that produces a statistic with a short right tail under and a pronounced right tail under . Refer to [12] for more details. Based on [12] and [14], a convenient choice is to define as , where c is a specified value on , such as 1.65. Let
Note that would not show a long right tail under for a fixed value of c, such as 1.65. In contrast, under , would yield a large value. Therefore, selecting an appropriate value for c is based on circumstance and can be challenging. To test the two-sample scale model, we adopt the adaptive approach to select the value of c in [12]. This approach is based on the development of a process with respect to c. To construct a robust testing procedure for the two-sample accelerated life model, we incorporate this process into the approximation procedures presented in Section 4.
4. Approximation Procedures
Let and for . By the standard martingale theory, the processes
are mean-zero martingales ([3]). From these, we have
where , , , and . Let
where . Note that the distribution is determined by and due to it being a sum of integrable martingales. However, its distribution remains analytically intractable. One approach to overcome this challenge is to substitute with suitable approximations. Motivated by this, we derive an approximation process with respect to c that is formulated in terms of martingales and . This serves as a fundamental component for developing robust testing procedures. A key property of martingales is that they have zero expectations, , with variance . See [9] for details. This approximation framework allows us to establish asymptotic properties and optimize the power performance of our proposed tests under various configurations.
We now derive an approximation process, , from associated with . As mentioned in [8] and [9], the distribution of can be approximated by the normal multiplier. Let be independent random samples from the standard normal distribution. By the martingale properties of specified above, can be replaced by . Applying this substitution to yields an approximation process , where is the estimator . Specifically,
where
with
Note that in (3) can be expressed as
Following [9], the conditional distribution of the process given the data is asymtotically equivalent to the unconditional distribution of the process . The only random component in is , so this formulation facilitates computation in numerical studies.
To validate the two-sample accelerated life model, we obtain a large number of realizations of by generating , creating a reference distribution against which test statistics can be compared. Note that it is generated such that they maintain complete statistical independence from the observed data set. This approach enables robust assessment of the model’s validity under various conditions.
The procedures consists of two stages. First, we choose an optimum value of c from the null distribution approximation of the process with respect to c. Note that although an ideal test would consider the entire range of c throughout , we deliberately restrict the range to to circumvent computational challenges and theoretical complexities. In practical situations, we select to include all observed data. Then, model validation proceeds through analysis of the p-value corresponding to the adaptively selected c, providing a statistical foundation for assessing the model’s empirical fit.
Let be the observed value of . We calculate the corresponding p-value to through the approximation distribution of under . This procedure generates the null distribution of , where is the random counterpart of . Note that the distribution of is based on the minimum value of , as this represents the most statistical significance, thereby offering the most reliable criterion for evaluation. We then adaptively identify the optimal value of c that yields the minimum p-value of , i.e., . Among evaluated p-values, smaller p-values provide stronger evidence against the null hypothesis, supporting the alternative hypothesis.
By arguments in [12], asymptotically converges to a zero-mean process, which we denote as . Thus, as demonstrated by [12], the process over c given by converges to . It follows that converges to the survival function evaluated at this integral involving . For further details, refer to [12]. Similar arguments were previously presented by [8].
We utilize simulation-based approaches to estimate the asymptotic distribution of the process. To approximate the distribution of under , we generate multiple realizations of by simulating normal random samples the only source of randomness in . From a collection of realizations of , we obtain the corresponding p-value, denoted by . Subsequently, the null distribution of is approximated based on multiple sets of realizations, from which is derived. This enables empirical estimation of the null distribution of using . Notably, the asymptotic equivalence between the conditional distribution of given the data and unconditional distribution of justifies the simulation approach as a robust method for testing. Finally, as in [9] and [12], the p-value of the test, which is given by P(), can be empirically approximated by P().
5. Numerical Study
To assess the statistical properties and performance of the proposed test, we conducted comprehensive simulations using several commonly used survival functions. These simulations evaluate the statistical power and reliability of the test in the varying sample sizes and censoring proportions. Similar to [8], the simulation incorporates several configurations: the log-logistic family and Weibull distributions with the scale parameter 2 (scenario where the accelerated life model holds), as well as the lognormal survival distribution with the location (shift) parameter = 2 (scenarios where the accelerated life model is violated). Including both compatible and incompatible models enables examination of the test’s validity under correct model specification and its robustness to model misspecification. The specific simulation cases are outlined below.
- Case (a). We examine the case where follows the log-logistic density function , while the censoring variable is characterized by density , , with some constant h.
- Case (b). We also investigate conditions where has Weibull density , , with following a normal distribution with mean h and unit standard deviation.
- Case (c). Lastly, we consider scenarios where is distributed as standard normal, while follows a uniform distribution on interval . In contrast to cases (a) and (b), where the accelerated life model holds, this configurations represents the location shift model defined by the relationship . This setup enables evaluation of the test performance under conditions that violate the assumption of the accelerated life model.
- The constant h was chosen in each scenario to achieve the desired censoring proportions, allowing an evaluation of test performance under varying censoring proportions. In addition, the integration limits u and v in (1) define the temporal intersection of observations between the two groups. In survival analysis, explosive behavior is often observed near the endpoints of the estimating function. So, this setup is necessary to appropriately capture and account for such boundary effects. Specifically, u and v represent the lower and upper bounds of the shared observation times, where u is the maximum of the minimum observation times across the groups, and v is the minimum of the maximum observation times. Thus, the interval represents the time period in which observations from both groups coexist.
Table 1 and Table 2 present the power and type I error rates of the proposed test for the cases (a), (b), and (c), based on 500 repetitions. For each case, the simulations were conducted for censoring proportions of 25% and 50%, with sample sizes of 25 and 50. The simulations used the weight for the estimating function defined in (1), which corresponds to a form of . The results show that the test performs well overall, showing adequate power under both modest (25%) and heavy (50%) censoring proportions across all sample sizes considered, while maintaining Type I error rates close to the nominal level of under . The simulation results show the effectiveness of the proposed method in testing two-sample accelerated life models across various scenarios. To further demonstrate its practical utility, we applied the procedure to a real-world dataset.
The dataset comprises clinical data from 35 patients diagnosed with limited stage II or IIIA ovarian carcinoma at the Mayo Clinic and has become a benchmark for methodological validation in survival analysis. It stratifies patients into two cohorts based on tumor differentiation (low-grade versus well-differentiated). Many researchers have examined this dataset. Examples include [7,15] and Gill and [4]. They demonstrated the inadequacy of the accelerated life model. In line with them, this study further demonstrates that the relationship between disease grade and progression cannot be adequately captured by the two-sample scale modeling approach.
Specifically, the sample has a censoring percentage , and the estimated scale parameter is using the same weight function as in the simulations. The observed value is 0.0075, obtained at . The reference set for the test was constructed using the 5000 realized samples drawn from . This reference set generates the null distribution of from which the approximate is calculated. These results provide strong evidence against the adequacy of the two-sample accelerated life model. Figure 1, which displays the estimated cumulative hazard functions for both groups in the dataset, supports this conclusion graphically. These results underscores the need for more flexible or nonparametric approaches to accurately characterize outcomes.
6. Concluding Remarks
Motivated by [12], we have proposed an adaptive and robust model-checking method for two-sample accelerated life models. The procedures use an estimating function that incorporates the integrated cumulative hazard difference developed by [15]. Following the approach in [12], our test employs a simple simulation-based approach to determine optimal critical values, yielding versatility that performs well across diverse scenarios without assuming specific alternative hypotheses. Simulation results demonstrate that the proposed approach provides comprehensive evaluation of statistical power and reliability under various conditions. Real-world data analysis validated the proposed method. Although developed specifically for accelerated life models, the methodology extends to other survival models, such as the accelerated hazards model, providing a flexible framework that maintains statistical power across diverse lifetime distributions.
Acknowledgments
This research was conducted during a sabbatical leave granted by Illinois Wesleyan University. The author is grateful for this support.
Conflicts of Interest
The authors declares no conflicts of interest.
References
- Aalen, D.D. Nonparametric inference for a family of counting processes. Annals of Statistics 1978, 6, 701–726. [Google Scholar] [CrossRef]
- Cox, D. R. Regression models and life tables (with discussion), Journal of the Royal Statistical Society 1972, 34, 187–220.
- Gill, R.D. Censoring and Stochastic Integrals, MC Tract 124, Amsterdam: Mathematical Centre, 1980.
- Gill, R.D.; Schumacher, M. A Simple Test for the Proportional Hazard Assumptions, Biometrika 1987, 74, 289–300.
- Kalbfleisch, J. D.; Prentice, R. L. The Statistical Analysis of Failure Time Data, New York: Wiley, 1980.
- Kaplan, E.; Meier, P. Nonparametric Estimation from Incomplete Observations. Journal of the American Statistical Association 1958, 53, 457–481. [Google Scholar] [CrossRef]
- Lee, S.H. On the Versatility of the Combination of the Weighted log-rank statistics. Computational Statistics & Data Analysis 2007, 51, 6557–6564. [Google Scholar] [CrossRef]
- Lee, S.H.; Yang, S. Checking the censored two-sample accelerated life model using integrated cumulative hazard difference. Lifetime Data Analysis 2007, 13, 371–380. [Google Scholar] [CrossRef] [PubMed]
- Lin, D.Y.; Wei, L.J.; Ying, Z. Checking the Cox Model with Cumulative Sums of Martingales-based Residuals. Biometrika 1993, 80, 557–572. [Google Scholar] [CrossRef]
- Lin, D.Y.; Wei, L.J.; Ying, Z. Accelerated Failure Time Models for Counting Processes. Biometrika 1998, 85, 605–618. [Google Scholar] [CrossRef]
- Pepe, M.S.; Fleming, T.R. Weighted Kaplan-Meier Statistics: Large Sample and Optimality Considerations. Journal of the Royal Statistical Society, Series B, 53, 1991 341-352. [CrossRef]
- Uno, H.; Tian, L.; Claggett, B.; Wei, L.J. A Versatile Test for Equality of Two Survival Functions based on Weighted Differences of Kaplan-Meier Curves. Stat Med., 34, 2015 3680-3695. 3680. [Google Scholar]
- Wei, L. J.; Ying, Z.; Lin, D.Y. Linear Regression Analysis Censored Survival Data based on Rank Tests. Biometrika 1990, 19, 845–851. [Google Scholar] [CrossRef]
- Xu, X.; Tian, L.; Wei, L.J. Combining Dependent Tests for Linkage or Association across Multiple Phenotypic traits. Biostatistics 2003, 4, 223–229. [Google Scholar] [CrossRef] [PubMed]
- Yang, S. Some Scale Estimators and Lack-of-Fit Tests for the Censored Two Sample Accelerated Life Model. Biometrics 1998, 54, 1040–1052. [Google Scholar] [CrossRef] [PubMed]
Figure 1.
Estimated cumulative hazard function (solid) and (dotted) for two groups, ovarian cancer data.
Figure 1.
Estimated cumulative hazard function (solid) and (dotted) for two groups, ovarian cancer data.
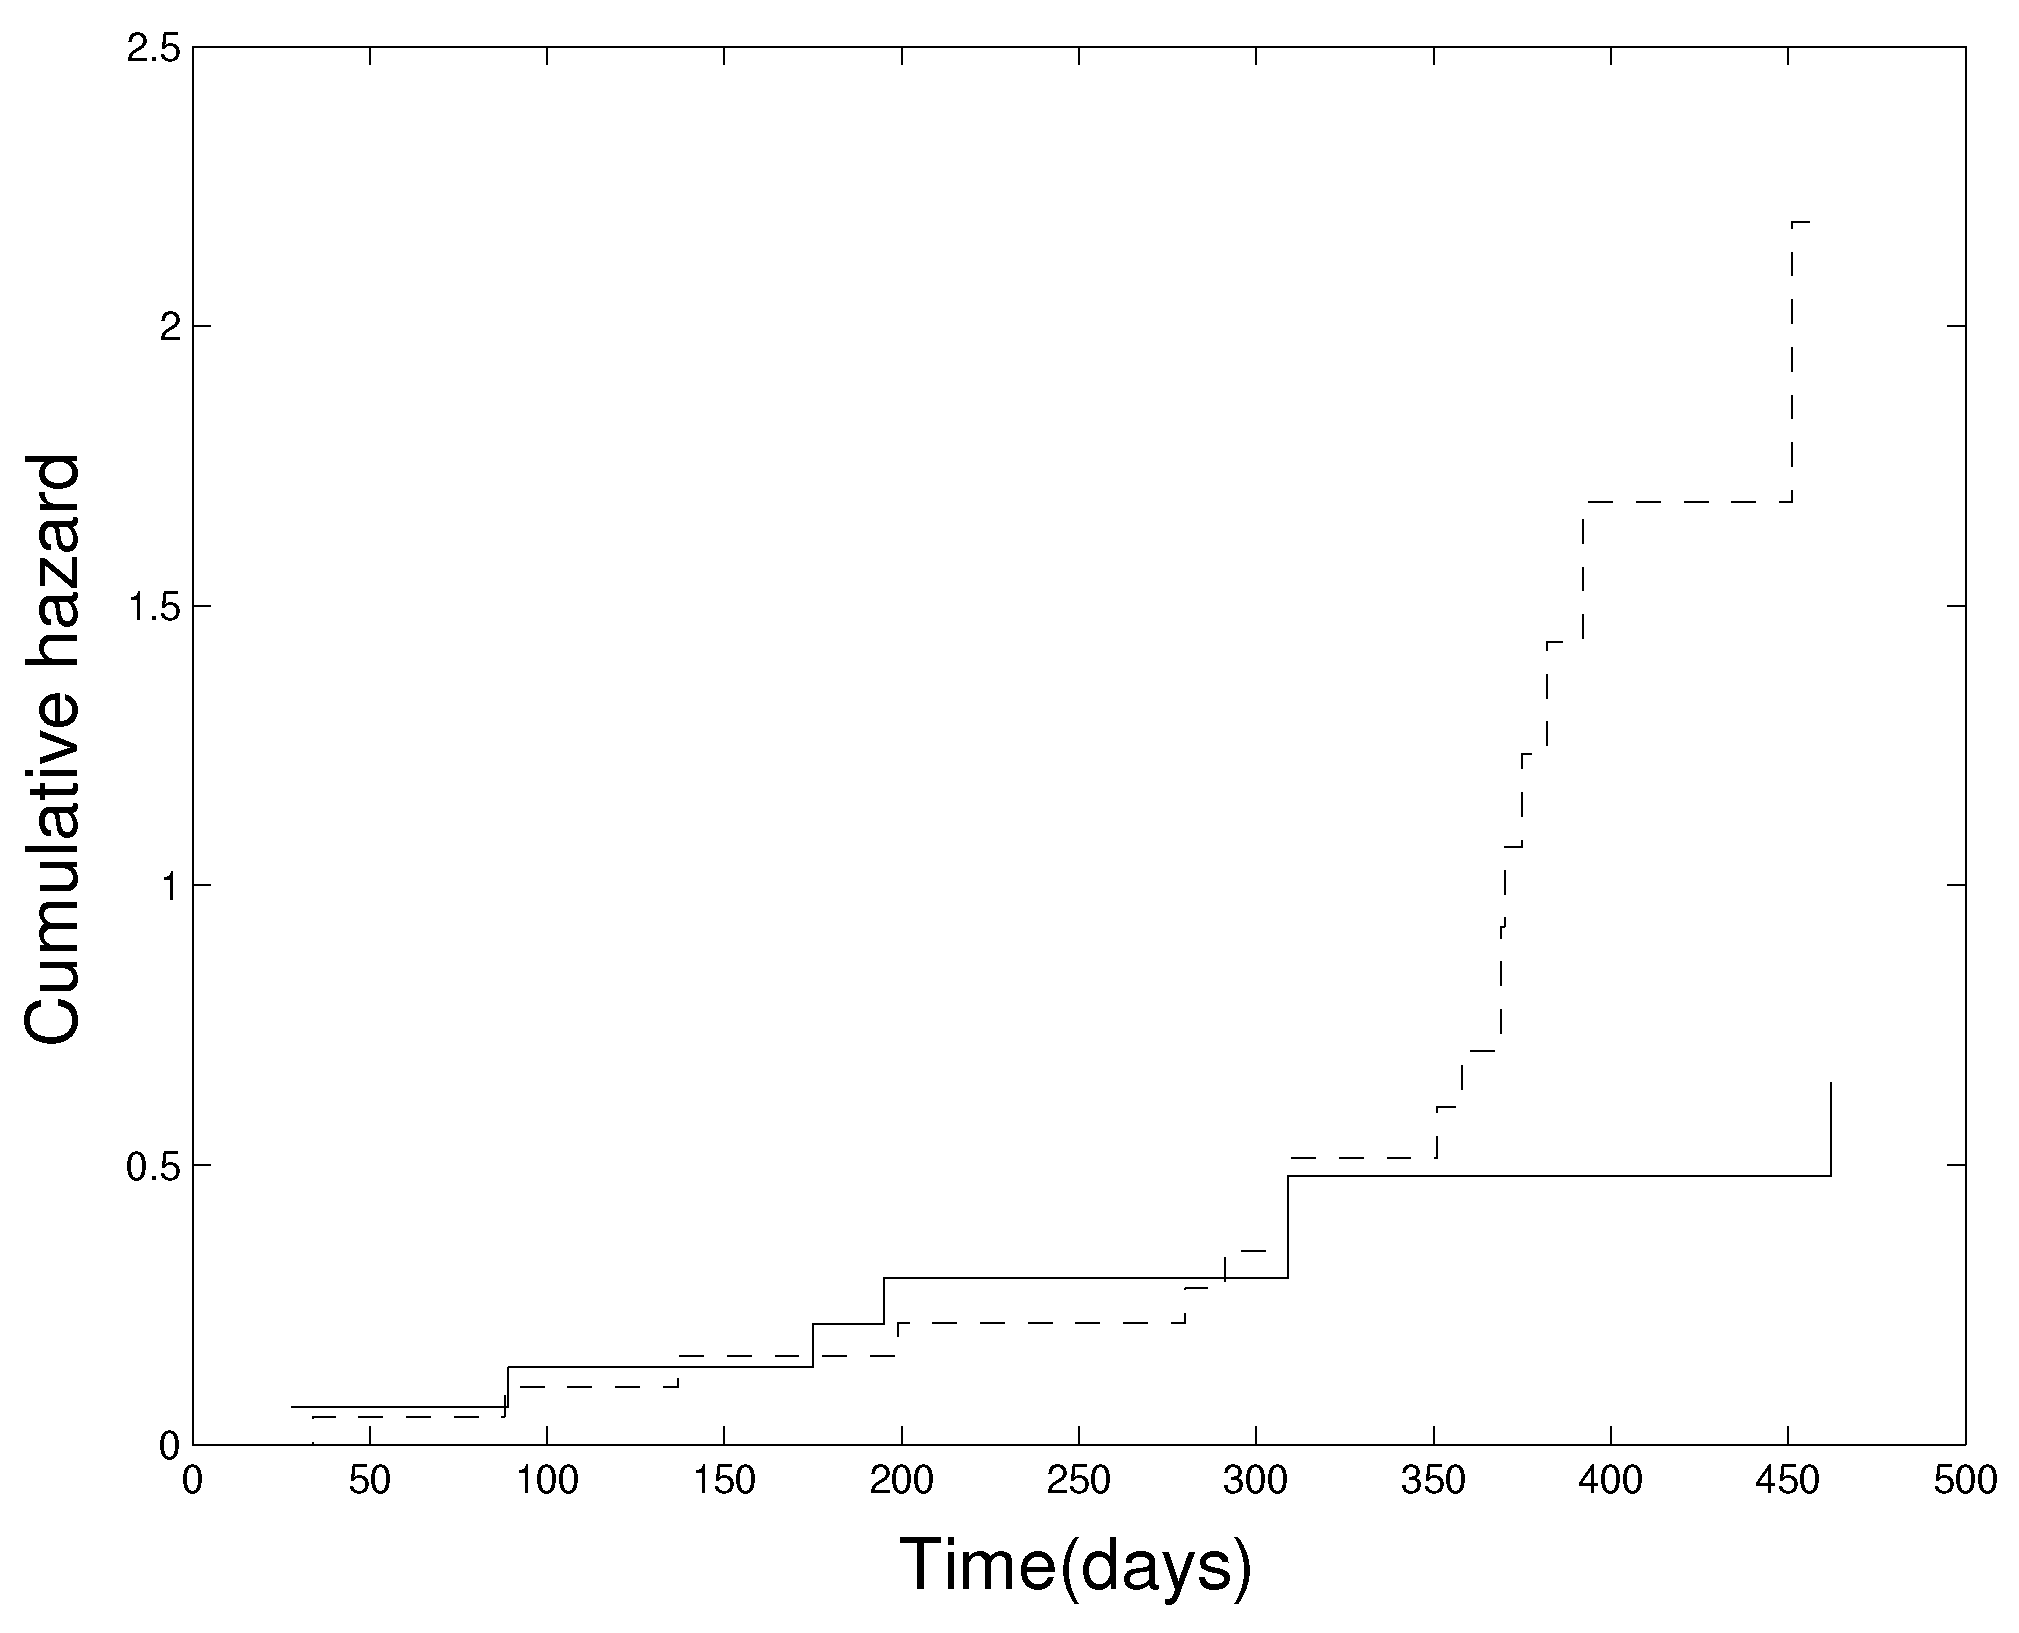

Table 1.
Results (rejection rate) at .
| 251 | 50 | |||||
|---|---|---|---|---|---|---|
| Case | 25%2 | 50% | 25% | 50% | ||
| (a) | 0.93 | 0.81 | 0.99 | 0.97 | ||
| (b) | 0.51 | 0.50 | 0.65 | 0.69 | ||
| (c) | 0.68 | 0.63 | 0.71 | 0.63 | ||
1. 2 Censoring proportion.
Table 2.
Size simulation results at .
| 251 | 50 | |||||
|---|---|---|---|---|---|---|
| Case | 25%2 | 50% | 25% | 50% | ||
| (a) | .0550 | .0640 | .0470 | .0560 | ||
| (b) | .0580 | .0670 | .0350 | .0640 | ||
| (c) | .0480 | .0620 | .0430 | .0450 | ||
1. 2 Censoring proportion.
Disclaimer/Publisher’s Note: The statements, opinions and data contained in all publications are solely those of the individual author(s) and contributor(s) and not of MDPI and/or the editor(s). MDPI and/or the editor(s) disclaim responsibility for any injury to people or property resulting from any ideas, methods, instructions or products referred to in the content. |
© 2025 by the authors. Licensee MDPI, Basel, Switzerland. This article is an open access article distributed under the terms and conditions of the Creative Commons Attribution (CC BY) license (http://creativecommons.org/licenses/by/4.0/).
Copyright: This open access article is published under a Creative Commons CC BY 4.0 license, which permit the free download, distribution, and reuse, provided that the author and preprint are cited in any reuse.


