
Submitted:
24 September 2025
Posted:
26 September 2025
You are already at the latest version
Abstract
Inactivity and increases in psychological and behavioral symptoms are common for people with dementia and current assessment relies on proxy-rated tools. We investigate the feasibility and adherence of the use of sensor technology by exploring the relationship between daytime activity and sleep quality. For a total of 40 day-night data pairs in nursing home residents with dementia (N=11), Garmin Vivoactive5 and Somnofy monitored continuous physical activity levels, Sleep Efficiency (SE), Sleep Score, Sleep Regularity Index (SRI), and Wake After Sleep Onset (WASO). Using Spearman coefficient, we explored correlations between digital and proxy-rated tools (Personal Self Maintenance Scale (PSMS), and Neuropsychiatric Inventory-Nursing Home version (NPI-NH)) and the relationships between the digital biomarkers (SE, SRI, WASO, Sleep Score, physical activity). Participants (mean age 84 years, 8 female) had moderate to severe degrees of dementia. Daytime activity levels correlated to sleep quality parameters SE (0.43, p=0.05), WASO (-0.35, p=0.02), and SRI (0.46, p=0.007), and traditional sleep measures were associated with digital biomarkers (WASO/NPI-NH-K, p=0.04). We find a relationship between daytime activity and sleep quality; however, the bidirectional relationship remains ambiguous and should be further investigated. Sensing technologies have the potential to more accurately identity subtle changes, improving clinical assessment and corresponding care recommendations.
Keywords:
dementia
; technology
; sensors
; nursing home
; sleep quality
; physical activity
1. Introduction
Decreased physical activity (PA) and increased sleep disturbances are common in nursing home residents with dementia and are often linked to polypharmacy and higher mortality (1). Current methods for monitoring these changes are often unreliable, as they rely heavily on proxy-rater assessment. Given the high prevalence of dementia in Norwegian nursing homes (at least two-thirds of residents) [2,3] and the global rise in dementia cases (estimated 139 million worldwide by 2025), there is a critical need for improved, technology-driven monitoring to increase more precise diagnostics and treatments [1].
People with dementia exhibit significant daytime inactivity, which negatively impacts their daily living and quality of life [4,5]. While some activity peaks in the afternoon and early evening [5], they largely experience sedentary behaviors such as sitting, watching TV, or sleeping and eating and drinking remain as the daily primary focus [2]. To create effective interventions, accurate assessment of activity levels is crucial, and the combined use of digital biomarkers (using multiple sensing technologies) with traditional methods has the potential to understand the relationship between daytime activity and sleep quality.
Sleep quality significantly declines with age and is particularly problematic for people with dementia, often leading to the exacerbation of behavioral and psychological symptoms in dementia (BPSD) such as agitation, psychosis, and depression [6,7,8]. At least, four age-related changes in sleep behavior are described [7]. These are decreased Sleep Efficiency (SE), which is the proportion of time spent asleep while in bed; reduced sleep duration signalizing the reduction in Total Sleep Time (TST); less deep sleep (slow-wave sleep) impacting the restorative quality of sleep, and increased Wake After Sleep Onset (WASO) with more frequent awake time during the night [7]. While polysomnography is the gold standard for measuring the sleep quality (sleep efficiency, duration, latency, stages, etc.) [9], its application in nursing homes is limited, necessitating the use of proxy-rated questionnaires such as the Neuropsychiatric Inventory – Nursing Home version (NPI-NH; item for sleep quality, section K). However, the assessment of sleep by a nighttime nurse may not reflect the real clinical situation, as demonstrated by earlier research [10].
Sensing technologies used for human activity and behavioral recognition (HAR), such as smartwatches and contactless radar installations, are widely available with the potential to further our understanding of activity and sleep disturbances. Our umbrella review identified nine recent systematic reviews describing the use of sensing technologies for HAR in people with Parkinson’s disease and dementia. We found that sensing technologies for use as assessment tools are promising, however, diversely applied and currently not well integrated for clinical use, especially concerning the behavioral symptoms of dementia [11].
An Australian study by Moyle et al. (2017) included people with dementia for a 24-hour observation of activity and sleep using traditional questionnaires and a triaxial accelerometer (armband) and demonstrated high inactivity during daytime hours and average seven hours total sleep times [5]. Adherence to the wearable showed large variations with about 50% data acquisition for final analyses [5]. A case series study from the United States by Au-Yeung et al. (2022) used actigraphy to follow a person with dementia during the last months of life. Their findings highlight the potential to apply sensing technologies for assessing activity levels in connection with psychotropic drug use and subsequent changes at the end-of-life [12]. Moreover, the methodology on traditional vs. technical assessment was investigated in nursing home residents with dementia, underling the limited validity of traditional tools compared to technology [10].
This explorative proof-of-concept study aims to examine the feasibility for the clinical use of digital biomarkers from sensing technologies in nursing home residents with dementia through investigation of the relationship between daytime activity levels and sleep quality. The Digital phenotyping for changes in activity at the end of life in people with dementia study (DIPH.DEM) is an observational trial based on sensing technology to explore the differences between traditional assessment tools in dementia and digital biomarkers. The following research questions will be explored:
- What is the adherence, feasibility, and quality of digital data acquired by Garmin Vivoactive5 and Somnofy?
- To what extent are the selected digital biomarkers for activity and sleep related to the selected clinical questionnaires in dementia?
- Which digital sleep parameters show the strongest correlations with daytime activity levels in nursing home residents with dementia?
2. Materials and Methods
2.1. Design and Study Population
This proof-of-concept study is a part of the exploratory and observational DIPH.DEM study to investigate relationships between daytime activity levels and sleep quality during the end of life in people with dementia. A proof-of-concept methodology was used for the investigation of the feasibility to use sensing technologies to measure physical activity and sleep quality for people with dementia residing in a nursing home, and as a prerequisite to a larger explorative observational study involving similar methods. Participants (N=11) were recruited through two nursing home wards in Bergen, Norway. Residents were eligible for inclusion if they were 65 years or older, had lived in the nursing home for > 6 weeks, and had a diagnosis of dementia or moderate to severe cognitive impairment assessed by the Clinical Dementia Rating Assessment (CDR). Exclusion criteria were presence of delirium at baseline assessment and current life expectancy less than 6 weeks (suggested by the multidisciplinary nursing home team).
2.2. Clinical Assessment Tools
Prior to data and demographics (age, gender) collection, training was provided by the researcher to the healthcare professionals at the nursing home, usually the primary nurse working daily with the participant. The training included verbal and written information about the use of the traditional proxy-rater assessment tools and sensing technologies.
The Clinical Dementia Rating (CDR, range 0-3) is a widely accepted global scale developed to clinically identify the presence of dementia and stage its severity (score of > 0.5 - cognitive impairment/likely dementia; 1-mild, 2-moderate, 3-severe dementia) [13]. Within our study, participants were included with a score greater than 0.5 on the CDR. The 4AT Test (range 0-12) is a screening tool for delirium and consists of four questions evaluating alertness, cognitive function, and acute change, with a score of four or above indicating potential delirium [14]. General Medical Health Rating (GMHR) (range 1-4) assesses the number and impact of comorbidities (1= very good; 2= good; 3= moderate, and 4= bad health) [15].
The Neuropsychiatric Inventory – Nursing Home version (NPI-NH) consists of twelve symptom [16] to assess behavioral disturbances in dementia, such as, delusions, hallucinations, agitation, aggression, depression, anxiety, euphoria, apathy, irritability, aberrant motor behavior, nighttime behavior, and eating behavior (range 0-12 in each item; 0-144 total score). The Norwegian version of NPI-NH was found to be reliable and valid [17,18]. For our study, we focus on results related to sleep quality and behaviors (NPI-NH section K). The Physical Self Maintenance Scale (PSMS) assesses activity levels and adverse effects of inactivity on functional activities of daily living (ADL). [19,20]. The questionnaire includes six items with five possible answers including functional activities of ambulation, bathing, grooming, dressing, toileting, and feeding (range 6 to 30), with higher scores indicating higher needs for support (6= independent, 7-12= supervision- minimum assist, 13-18= minimum assist, 19-24= moderate assistance, 25-30= max assistance). All assessment tools have been previously validated and were available in the Norwegian language.
2.3. Sensing Technologies
Garmin Vivoactive5 (4 GB) firmware version 11.14 is a wrist-worn commercial smartwatch with acceleration and a heart rate (HR) sensor able to collect information about day- and nighttime physical activity (PA) levels. [21] The watch has been validated in older adults < 65 years [21]. The device was chosen based on established evidence-based guidelines and frameworks [22]. Based on initial feedback from the participants and healthcare team, the smartwatches were programmed with a realistic clock face, no sound, alarms or vibration, low lighting, and locked features so that tampering with the settings would not occur. For research purpose, smartwatches were placed on the participants by the researcher on day one of data collection, removed and charged on day four by the onsite healthcare contact at the nursing home, and placed back on the participant afterwards (1-2 hours missing data) prior to being collected again by the researcher on day seven. To improve generalizability, raw data parameters were synced, paired, and retrieved using Fitrockr [23], a data broker based in Berlin, Germany, and acceleration was collected at 25 Hz. Participants were asked to wear the smartwatch on their preferred wrist continuously over the data collection period, including bathing and sleeping.
Somnofy (Vital Things AS, Norway) version 0.7 with sleep algorithm 1.0 is a contactless radar technology able to collect information about sleep cycles and different elements for quality of sleep; Sleep Efficiency (SE), sleep score, Wake After Sleep Onset (WASO), Sleep Regulatory Index (SRI), Total Sleep Time (TST), sleep latency, total time in bed, and no presence (time out of bed) [24]. The average sampling rate for Somnofy is 23.8 Hz with 30 second epochs mimicking gold standard Polysomnography (PSG). Somnofy has been validated against PSG in an adult Norwegian population (19-61 years, mean age 28.9 years, SD 9.7) [24] with epoch-by-epoch analyses reflecting sensitivity and specificity of 0.97 and 0.72 for Somnofy compared to 0.99 and 0.85 for PSG. For study purposes, Somnofy was installed by the researcher, placed on the wall above the bed in each room, several days prior to data collection start to anticipate technical challenges. During installation, all lights and audio alerts were turned off and the device was connected to a power source. Once the participant is within sensor range (1-3 meters), a sleep session is started. Data gathered using Garmin Vivoactive5 and Somnofy was collected continuously for seven days/six nights.
3. Data Quality, Extraction, and Preprocessing
3.1. Adherence, Feasibility, and Residents’ Safety
The quality of the data was assessed by observation of the amount of missing data (completeness), adherence to use of the smartwatch by the user (total wear time/observations), accuracy, accessibility (raw data), clarity, and comparability. We used common dimensions of established quality of data frameworks to guide the assessment of data quality within this study [25]. Adherence was assessed combining use/wear time of both the sensing technologies over the continuous data collection period. Feasibility was determined based on researcher observation and evaluation of the technology via informal questions to the primary nurse during and immediately post data collection. Training and written instructions for the healthcare representatives included components of feasibility in the instruction for daily inspection of the participant’s skin (comfort), adherence for continuous donning of the smartwatch, and communication during the seven-day period about any behaviors which could affect the data quality, such as the participant not sleeping in their own bed, BPSD related challenges, or periodic removal of the smartwatch. Informal post data collection questions were asked of the primary nurse by the researcher concerning any feedback or challenges they experienced during data collection.
3.2. Acceleration
Raw acceleration data of each participant was retrieved using the Fitrockr hub and downloaded from the platform in the Comma-Separated Values (CSV) format. Extracted data was imported and converted in MATLAB-compatible types and based on the Unix time timestamps to Unix time segmented the data into 14-hour periods (07:00:00 – 20:59:59) representing daytime; the first and last partial days were excluded to only consider full day recordings. A full day recording was considered as a data profile containing a minimum of 21 hours of data, accounting for normal technical pauses in data collection, such as charging and periodic removal of the device.
Euclidean norm minus one (ENMO) is the vector magnitude of the three raw signals (x,y,z) minus 1. 1-minute periods were used during daytime and daily 24-hour (07:00:00-06:59:59) measurements (mean, median, SD). ENMO is calculated by summing the squared acceleration of each of the three accelerometer axes at each time point and then subtracting the gravitational component (1g=9.81 m/s2).
where , and are accelerations on the three axes of the datapoint of the sample considered in milli-g.
The Mean Amplitude Deviation (MAD) [26] is a comparable universal metric which uses ENMO in its calculation utilizing the mean signal value to reduce the effect of the constant gravitational acceleration. MAD is calculated as:
where H is the size of the considered epoch, is the Euclidean norm of the acceleration,
And the average Euclidean norm in the epoch:
The unit of the MAD, like ENMO, is milli-g, and 5 second epochs were used for both metrics.
3.3. Sleep Digital Biomarkers
Sleep biomarker data was retrieved using the Somnofy platform, following the company provided guidelines, and downloaded in Excel Binary File Format (.XLSX) format. Data was manually inspected to exclude daytime sleeping (naps) and considered nighttime the sleep period starting at 21:00:00-06:59:00. This timeframe was chosen to reflect the nightly distribution of sleep medications and bedtime routines at the nursing home at approximately 21:00 each evening. Data in the designated nighttime data profile was removed if the participant had an empty or partial recording less than 2 hours in duration. Extracted data were imported and converted in MATLAB-compatible types.
SE is calculated by dividing the time asleep (seconds) by the total time in bed (seconds) (x100) and was provided in Somnofy’s base data. The total time asleep includes the following: sleep onset latency (SOL) + TST + WASO + time attempting to sleep after the final awakening [27]. SE ranges from 0-100%, where a score of 100% is a perfect score indicating no awake time between sleep onset and termination. A previous study [28] including community dwelling, inactive, frail older adults (> 65 years) found a mean SE of 84%. WASO is the total number of minutes that a person is awake after having initially fallen asleep (sleep latency). It has an inverse relationship with SE; as WASO increases, SE decreases. Normal ranges for WASO measured with gold standard polysomnography in healthy adults aged 61-73 years ranges from 77.3 ± 35.6 minutes per night [29]. SRI uses a metric that compares similarity of sleep patterns day-to-day (i.e.,: 7 days/6 nights) and calculates the averages in sleep-wake states over all epoch pairs, separated by 24 hours (100= perfect pattern; 0= random patterns) [30].
SRI scores were calculated using MATLAB [30], with the following formula:
where N is the number of available days, the number of available epoch-by-epoch comparisons, is the sleep-wake state ( = 1 for wake, = 0 for sleep), C is the number of epochs within one 24-hour interval, ≠ Not Available (NA), and +c ≠ NA. Excluded epochs were represented by = NA.
3.4. Statistical Analysis
To test the normality of our data distribution, the One-Sample Kolmogorov-Smirnov Test was used, under the null hypothesis that the samples come from a standard normal distribution. For all parameters, both activity (EMNO daytime and 24h), and sleep (SE, Sleep Score, SRI, WASO), the null hypothesis was rejected, showing that none of the samples followed a normal distribution. Therefore, because the data was non-parametric, skewed, and non-linearly distributed, Spearman rank correlation tests were used to display potential correlations between all variables; the hypothesis of no correlation was tested against the alternative hypothesis of a nonzero correlation, and results were considered statistically significant at p < 0.05. Cohen’s guidelines [31,32] were used as a general reference for interpreting effect sizes: 0.10-0.29 (small), 0.30-0.49 (medium), ≥ 0.50 (large). Scatter plots were used to demonstrate the relationship between daytime activity and sleep quality variables. Descriptive statistics and narrative synthesis are provided for the group including mean, median, min, max, and standard deviation for all relative variables.
3.5. Ethics
Verbal and written informed consent were obtained in direct conversation with the residents who demonstrated sufficient capacity to consent. For those lacking this ability, we obtained consent from the resident’s legal guardian, usually a family member, after explaining the aims and protocol of the study. The study was approved by the Regional Committee for Medical and Health Research Ethics (REK) in Norway in October 2023: Approval number 634938.
4. Results
From February 2024 to May 2024, eleven participants were recruited; one resident died directly after baseline assessment. Mean age was 84.0 years (SD ±6.1) and eight were female (Table 1). The participants had been living in the nursing home for an average of 1.5 years. All participants had dementia with a median CDR score of 2 (0.5-3), and according to CDR cut-offs, seven of the participants were classified as having moderate to severe dementia. Chronic disease other than dementia within the group included Alzheimer’s disease, Parkinson’s disease, diabetes, and heart disease. According to the GMHR, comorbidities within the group were “moderate”, indicating that most had >3 unstable conditions, or several stable conditions that were chronic requiring several daily medications to maintain symptoms. The mean number of psychotropic drugs per participant being used was 1.9 (range of 1-5) and the total polypharmacy mean was 7.6 (range of 2-13). Assessed by NPI-NH, five had symptoms of irritability and 36/45/27% symptoms of depression, agitation, and anxiety, respectively. Most participants were classified as needing minimum to moderate assistance with daily activities, scoring between 16-23 on the PSMS, indicating a moderate level of functional impairment within the group (Table 1). The highest areas of impairment were dressing, self-care, and bathing. Sleep disturbances were observed in six of the participants. The group’s mean SE at 71% was approximately 13 percentage points (16%) less than the average reported in similar populations (Table 1 and Table 2).
4.2. Adherence, Feasibility, Quality of Data
The Garmin Vivoactive5 was reported by the participants to be comfortable and there were no adverse skin conditions due to continuous wearing of the smartwatch for up to 7-days. The primary nurses reported that the smartwatches were easy to charge (< 2 hours) and that there was no resistance from the participants to return the smartwatches afterwards. Feasibility for the placement of radar technology within the participants’ rooms, access to a power source and secure Wi-Fi, and for 24-7 donning of the smartwatches was good based on the researcher’s experience with these factors and adherence to protocols by the participants and healthcare providers. Global adherence measured by total wear and observation time (Somnofy and Garmin Vivoactive5 merged) was 80%.
After the inspection of data quality post retrieval, we obtained a total of 40-day/night data pairs that confirmed to the threshold of 21 available hours and at least two hours of nighttime data. Digital sleep variables collected totalled included four total digital biomarkers and 320 acquisition points included in the final analysis of the digital sleep variables. Final analysis for all digital parameters, therefore, included a total of ten participants with complete (21-hr minimum) digital profiles and included 40 total day/night pairs. Comparability of the acceleration raw data was moderate (requiring one method of calculation) and was determined based on the amount of conversion needed to deliver a comparable universal acceleration metric (i.e.,: ENMO/MAD). In comparison, raw data collected via the radar technology had a high level of comparability, requiring no conversion post retrieval, and was taken directly from the Somnofy base data to be used for analysis. There was missing data at baseline for the following reasons: death or withdraw from the study, periodic removal of the smartwatch by the participant, removal of the smartwatch by the healthcare provider for charging, participant not sleeping in their bed (i.e.,: sofa or chair in the room or in another room), behavioural and psychological activities (i.e.,: wandering, frequent awakenings), or technology recording or transfer failure due to means for retrieving raw data (data broker).
4.3. Digital Snapshot: Day/Nighttime Physical Activity and Sleep Quality
A digital snapshot (Figure 1) is provided for the reader as a visual illustration of the digital combination of day/nighttime physical activity and sleep variables captured using Garmin Vivoactive5 and Somnofy. The participant was a 79-year-old male with diagnoses of diabetes, heart disease, and dementia. The participant scored ≥6/12 for behavioral symptoms (NPI-NH) of delusion [6], agitation/aggression [6], irritability [8], and nighttime behaviors [6]. His baseline PSMS score (10/30) suggests minimum assistance is needed for activities of daily living, however, the mean daytime physical activity score of 34.6 milli-g (ENMO) indicates extreme sedentary daytime behaviors. We also note that the participant was taking a total of twelve daily medications, including two with psychotropic properties indicated for sleep disturbance.
4.4. Digital Biomarker Comparisons
ENMO and WASO demonstrated an inverse relationship (Spearman correlation coefficient -0.37; p=0.02) suggesting that higher daytime activity levels were connected to decreased nightly awake time (Table 2, Figure 2). The correlation between ENMO and SE (0.43, p=0.05) suggests that increased physical activity could improve SE (Table 2, Figure 2), with those having higher daytime activity levels also having better efficiency. Moreover, the correlation between the Mean Amplitude Deviation (MAD) and the Sleep Regularity Index (SRI) (0.46, p=0.007) indicates that increased daytime activity improves sleep regularity (Table 2, Figure 2). These results highlight the importance of accurate monitoring and timely intervention for improved physical activity levels as moderate levels of activity indicated superior sleep quality. NPI-NH section K (sleep) is correlated with results from the digital biomarker WASO (0.65, p=0.04), suggesting that this biomarker may be promising for enhancement of current proxy-rated tools. Finally, the correlation between SE and WASO (0.57, p<0.000) (Table 2, Figure 2) confirms the previously suggested inverse relationship between these two digital biomarkers and showed that a higher SE is related to deceased wakefulness at night.
5. Discussion
This proof-of concept study confirm that the use of sensing technologies is feasible to demonstrate detailed changes in activity and sleep quality for people with dementia living in nursing homes. Adherence to use of the sensing technologies was high and the chosen sensing technologies were well tolerated by the participants. Data quality was acceptable and missing data due to compatibility issues, lack of clarity, or technical failures was minimal. We found a correlation between the traditional measure NPI-NH (Section K nighttime behaviors) and WASO was found, indicating that WASO could be a promising digital tool, supplementing proxy-rated measures. This may provide a pathway for further investigation of the potential bidirectional relationship between physical activity and sleep quality and improve dosage recommendations for daytime activity levels. The PSMS questionnaire was not significantly correlated with daytime activity levels (ENMO or MAD). This is most likely a result of the proxy-rated questionnaire not capturing the same constructs as the digital biomarkers. Lastly, we were able to demonstrate, using two unique sensing technologies, we were able to demonstrate that there are correlations between daytime physical activity levels and sleep quality indicators: SE, WASO and SRI. The results imply that quantity of physical activity drives change in sleep quality and that improvement in one indicator could concomitantly affect the other. The results imply that these digital biomarkers may be promising clinical tools in identifying subtle changes in activity levels and sleep behaviors and supports evidence of a bidirectional relationship between daytime activity and sleep quality.
Because inactivity and sleep disturbances are prevalent among people with degenerative diseases (9, 33-35), improved sleep quality and activity are targetable clinical goals for this population. Most previous findings regarding the relationship between physical activity and sleep quality are inconsistent, and the tools used within previous studies to measure activity levels and sleep disturbance have mostly consisted of low validity proxy-rated questionnaires. A meta-analysis by Atoui et al. [36] found that three variables were associated with activity levels the following day: sleep quality, SE, and WASO; however, results were high in variability and showed no association at an individual level. The bidirectional association between activity levels and sleep quality has been studied [37] longitudinally over a 5-year period using gold standard polysomnography in healthy older adults (age 54-65 years, N= 424). The study found that an intermediate amount of activity per week at baseline was associated with decreased risk for low sleep time, increased WASO, and lower SE [37]. The association between sedentary behavior, physical activity, and sleep was also assessed using accelerometry in healthy older adults and the results emphasize the effect of daytime inactivity on sleep quality, concluding that moderate levels of activity were associated with improved sleep quality parameters (TST and WASO) [38].
Within this study’s group profile some participants had relatives that visited several times a week offering additional opportunities for increased activity, highlighting the potential influence of the informal carer in decreasing inactivity within institutional settings [39]. The appropriate dosage of activity for people with dementia living in a nursing home is less investigated and digital biomarkers could be a valuable tool in the future development of recommended activity levels for this population. Polypharmacy use with the group was high ranging from 2-13 daily medications prescribed and included an average of two nightly psychotropic medications indicated for sleep disturbance. The interaction and half-life of these medications should be considered when evaluating normative daily physical activity for this population. Despite the routine environment afforded by schedules in the nursing home, the participants showed a high degree of daily variability in their physical activity levels and sleep quality. This suggests that a combination of proxy-rated measures and digital biomarkers, including both group level and idiographic analysis, would be most appropriate for providing tailored future assessments.
This study reports results for two universal acceleration metrics, ENMO and MAD, and exposes some key differences in these techniques when blending digital biomarkers. Previous studies using these methods show acceptable agreement between the results using ENMO and MAD for the transformation of raw accelerometry data (using different sensing devices) for purposes of classifying active and sedentary activities [40,41]. However, to our knowledge there are no studies which cross-analyse these universal metrics with other digital biomarkers such as the defined sleep quality variables in this study. It can be that the differences within our results using these two methods are exacerbated by the complex combination of data representing several contexts: day vs. night, activity vs. sleep, acceleration vs. radar data. The mean daytime activity levels (ENMO and MAD) within the study highlight the high level of inactivity within the group. These totals fall within examples of established thresholds for ENMO and MAD (range= 9.3- 118 milli-g) using single wrist worn accelerometry to describe sedentary and light intensity activities; for example, laying down (9.3 milli-g, ±0.5), standing or sitting still (10.3 milli-g, ±1.6), washing pots (53.8 milli-g, ±5.4), and self-paced walking (103.1 milli-g, ±7.4) [42]. Differences between the discrepancies and sensitivities in these two methods for raw acceleration data translation should be further explored as it could be that one method is more suitable for more complex evaluations (such as multiple day indexes). This should be further investigated to improve the generalizability of future studies investigating the combination of multiple sensing technologies and traditional proxy-rated tools.
The questionnaires used in this study for measurement of activity levels and sleep disturbance, PSMS and NPI-NH, are commonly utilized, proxy-rated tools in nursing home environments. Although the NPI-NH features a section dedicated to sleep, it does not specifically address the same sleep quality constructs as the digital measurements. We therefore chose a comparison of specific digital biomarkers, such as WASO, corresponding to the specific topics within the “nighttime behaviors” section of the NPI-NH, which is most comparable to digital constructs designed to highlight frequent awakenings. Similarly, the PSMS measures six functional areas related to activities of daily living compared to acceleration data that precisely measures activity levels and their frequency. To better define and illustrate physical activity levels captured by the PSMS, this study chose to use a global score with assigned activity/functional levels. Other traditional tools not included in this study may offer superior blending of constructs for the future use of sensing techniques in clinical practice and should be explored in future studies.
Ethical implications for use of digital biomarkers and knowledge based machine learning in healthcare decision making for people with dementia living in a nursing home should be considered [43]. Challenges include inherent bias, data privacy, depersonalization of patient care, and algorithmic and dataset transparency [44]. For vulnerable groups of patients, such as people with dementia, integration of standardized protocols and regulatory frameworks should be developed, decreasing the substantial variation in metrics and models which complicate the generalizability and replication of interventions [44]. These frameworks must be adaptable to the pace of rapid development of innovative technologies and algorithms.
5.1. Limitations
This study has several limitations. First, we note that although people with dementia typically can experience large variation in daily activity and sleep behaviors depending on the severity of their diagnosis, the nursing home environment provides a certain stability in daily routines, including planned activities, prescription administration, meal service, and sleep schedules. Secondly, sensor number, placement of the smartwatches on the wrist, physiological differences in movement with age, specific diagnosis, polypharmacy profiles, and functional assistance level (i.e.,: ambulation with or without an assistive device) all contribute to the quality of the activity and sleep analyses.
Sample size relativity should be considered when using digital biomarkers for analyses and it is recommended that future studies combine self-report and device measured data utilizing nomothetic and idiographic statistical analysis and conduct longitudinal observations including >50 time points or days of observation [36,45]. This study uses 40 day and night pairs, exceeding these recommendations for amount of time points and observations. This proof-of-concept study also used high thresholds (21/24 hours digital profile) for data inclusion and quality to improve the generalizability of the results. Further, the inclusion of longitudinal data would provide richer analysis of the changes in daytime activities and sleep quality over time, and we note that this is the first paper in a series and that ongoing data collection up to one year from baseline will be included in future articles.
The included sleep score algorithm used for analysis was proprietary, however, Somnofy provided the following explanation: “The sleep score investigates whether the participant has had enough sleep (duration), including quantity within each sleep stage. This is based upon general recommendation and previous research on the population, adjusted for sex and age. The score is reduced dependent on how much fragmentation is seen based on these norms.” Therefore, due to the black box nature of this algorithm, it is reported for the reader as a reference only. Lastly, and perhaps most importantly, the lack of standardized metrics and complimentary statistical methods within the field of HAR is a limitation for generalizability of results. To improve generalizability, this study follows examples from similar previous studies [40,42] using common universal metrics and statistical analyses for translation of the raw data.
6. Conclusion
The results of this study show that the use of sensing technologies for monitoring activities and sleep quality in people with dementia is feasible in a nursing home environment. This study confirms that there is a relationship between daytime activity and sleep quality; however, the bidirectional relationship remains ambiguous and should be further investigated. Sensing technologies and use of digital biomarkers has the potential to more accurately identity subtle changes in physical activity levels and sleep quality, improving clinical assessment and corresponding care recommendations.
Supplementary Materials
The following supporting information can be downloaded at the website of this paper posted on Preprints.org.
Author Contributions
MP and BSH applied for project funding. All authors (LDB, MP, OMS, KH, BSH, BM) contributed to the study conception and design. LDB and BM conducted the development of the first draft of the manuscript, and all authors contributed to the final writing and editing process of the final version. BM conducted all data pre-processing and processing of raw data, followed by further descriptive and statistical analysis by both BM and LDB. All authors read and approved the final manuscript.
Funding
Funding was provided by the Western Norway Regional Health Authority (Helse Vest RHF); sponsor protocol code: F-12829-D10484.
Ethics Statement
This study is associated with a prospective cohort study (Digital Phenotyping using sensing technologies in people with Dementia: DIPH.DEM) which was approved by the Regional Committee for Medical and Healthcare Research Ethics (REK) on October 23, 2023: 634938.
Data Availability Statement
All data supporting the results and conclusions of this article will be made available by the authors, without undue reservation.
Acknowledgements
We would like to thank Janne Grønli, Professor, PhD, and Somnologist, with the University of Bergen Department of Biological and Medical Psychology, Norway, for her time and consultation regarding the sleep topics within the article. BSH thanks the Trond Mohn Research Foundation, GC Rieber Foundation, and the Norwegian Government for supporting our work at the Centre for Elderly and Nursing Home Medicine, University of Bergen, Norway.
Conflict of Interest
The authors acknowledge that there are no conflicts of interest.
Abbreviations
ATC – Anatomical Therapeutic Chemical
4AT’s- Assessment Test for Delirium
BPSD – Behavioural and Psychological Symptoms of Dementia
CDR- Clinical Dementia Rating
CSV- Comma-Separated Values
DPIA- Data Protection Impact Assessment
ENMO- Euclidean Norm Minus One
FIM- Functional Independence Measure
GB- Gigabytes
GDPR- General Data Protection Regulation
GMHR – General Medical Health Rating
HAR – Human Activity Recognition
NPI-NH- Neuropsychiatric Inventory-Nursing Home version
PA- Physical Activity
PSMS – Physical Self Maintenance Score
REK - Regional Committee for Medical and Healthcare Research Ethics
SE – Sleep Efficiency
SRI – Sleep Regulatory Index
TST- Total Sleep Time
VO2 – Volume Oxygen
WASO – Wake After Sleep Onset
References
- Livingston, G.; Huntley, J.; Liu, K.Y.; Costafreda, S.G.; Selbæk, G.; Alladi, S.; Ames, D.; Banerjee, S.; Burns, A.; Brayne, C.; et al. Dementia prevention, intervention, and care: 2024 report of the Lancet standing Commission. Lancet 2024, 404, 572–628. [Google Scholar] [CrossRef]
- Casagrande, M.; Forte, G.; Favieri, F.; Corbo, I. Sleep Quality and Aging: A Systematic Review on Healthy Older People, Mild Cognitive Impairment and Alzheimer’s Disease. Int. J. Environ. Res. Public Heal. 2022, 19, 8457. [Google Scholar] [CrossRef]
- Mukamel, D.B.; Saliba, D.; Ladd, H.; Konetzka, R.T. Dementia Care Is Widespread In US Nursing Homes; Facilities With The Most Dementia Patients May Offer Better Care. Heal. Aff. 2023, 42, 795–803. [Google Scholar] [CrossRef]
- Ouden, M.D.; Bleijlevens, M.H.; Meijers, J.M.; Zwakhalen, S.M.; Braun, S.M.; Tan, F.E.; Hamers, J.P. Daily (In)Activities of Nursing Home Residents in Their Wards: An Observation Study. J. Am. Med Dir. Assoc. 2015, 16, 963–968. [Google Scholar] [CrossRef]
- Moyle, W.; Jones, C.; Murfield, J.; Draper, B.; Beattie, E.; Shum, D.; Thalib, L.; O’dwyer, S.; Mervin, C.M. Levels of physical activity and sleep patterns among older people with dementia living in long-term care facilities: A 24-h snapshot. Maturitas 2017, 102, 62–68. [Google Scholar] [CrossRef]
- Corbett, A.; Husebo, B.; Malcangio, M.; Staniland, A.; Cohen-Mansfield, J.; Aarsland, D.; Ballard, C. Assessment and treatment of pain in people with dementia. Nat. Rev. Neurol. 2012, 8, 264–274. [Google Scholar] [CrossRef] [PubMed]
- Li, J.; Vitiello, M.V.; Gooneratne, N.S. Sleep in Normal Aging. Sleep Med. Clin. 2018, 13, 1–11. [Google Scholar] [CrossRef] [PubMed]
- Shin, H.-Y.; Han, H.J.; Shin, D.-J.; Park, H.-M.; Lee, Y.-B.; Park, K.H. Sleep Problems Associated with Behavioral and Psychological Symptoms as Well as Cognitive Functions in Alzheimer's Disease. J. Clin. Neurol. 2014, 10, 203–209. [Google Scholar] [CrossRef]
- Webster, L.; Gonzalez, S.C.; Stringer, A.; Lineham, A.; Budgett, J.; Kyle, S.; Barber, J.; Livingston, G. Measuring the prevalence of sleep disturbances in people with dementia living in care homes: a systematic review and meta-analysis. Sleep 2019, 43. [Google Scholar] [CrossRef] [PubMed]
- Blytt, K.M.; Bjorvatn, B.; Husebo, B.; Flo, E. Clinically significant discrepancies between sleep problems assessed by standard clinical tools and actigraphy. BMC Geriatr. 2017, 17, 1–8. [Google Scholar] [CrossRef]
- Boyle, L.D.; Giriteka, L.; Marty, B.; Sandgathe, L.; Haugarvoll, K.; Steihaug, O.M.; Husebo, B.S.; Patrascu, M. Activity and Behavioral Recognition Using Sensing Technology in Persons with Parkinson’s Disease or Dementia: An Umbrella Review of the Literature. Sensors 2025, 25, 668. [Google Scholar] [CrossRef]
- Au-Yeung, W.-T.M.; Miller, L.; Beattie, Z.; May, R.; Cray, H.V.; Kabelac, Z.; Katabi, D.; Kaye, J.; Vahia, I.V. Monitoring Behaviors of Patients With Late-Stage Dementia Using Passive Environmental Sensing Approaches: A Case Series. Am. J. Geriatr. Psychiatry 2022, 30, 1–11. [Google Scholar] [CrossRef] [PubMed]
- Morris, J.C. Clinical Dementia Rating: A Reliable and Valid Diagnostic and Staging Measure for Dementia of the Alzheimer Type. Int. Psychogeriatrics 1997, 9, 173–176. [Google Scholar] [CrossRef]
- Tieges, Z.; Maclullich, A.M.J.; Anand, A.; Brookes, C.; Cassarino, M.; O’cOnnor, M.; Ryan, D.; Saller, T.; Arora, R.C.; Chang, Y.; et al. Diagnostic accuracy of the 4AT for delirium detection in older adults: systematic review and meta-analysis. Age and Ageing 2020, 50, 733–743. [Google Scholar] [CrossRef]
- Lyketsos, C.G.; Galik, E.; Steele, C.; Steinberg, M.; Rosenblatt, A.; Warren, A.; Sheppard, J.; Baker, A.; Brandt, J. The General Medical Health Rating: A Bedside Global Rating of Medical Comorbidity in Patients with Dementia. J. Am. Geriatr. Soc. 1999, 47, 487–491. [Google Scholar] [CrossRef]
- Selbæk, G.; Kirkevold, Ø.; Sommer, O.H.; Engedal, K. The reliability and validity of the Norwegian version of the Neuropsychiatric Inventory, Nursing Home Version (NPI-NH). Int. Psychogeriatrics 2007, 20, 375–382. [Google Scholar] [CrossRef] [PubMed]
- Saari, T.; Koivisto, A.; Hintsa, T.; Hänninen, T.; Hallikainen, I. Psychometric Properties of the Neuropsychiatric Inventory: A Review. J. Alzheimer's Dis. 2022, 86, 1485–1499. [Google Scholar] [CrossRef] [PubMed]
- Wood, S.; Cummings, J.L.; Hsu, M.-A.; Barclay, T.; Wheatley, M.V.; Yarema, K.T.; Schnelle, J.F. The Use of the Neuropsychiatric Inventory in Nursing Home Residents: Characterization and Measurement. Am. J. Geriatr. Psychiatry 2000, 8, 75–83. [Google Scholar] [CrossRef]
- Self-maintenance, P. Assessment of older people: self-maintaining and instrumental activities of daily living.
- Edwards, M.M. The Reliability and Validity of Self-Report Activities of Daily Living Scales. Can. J. Occup. Ther. 1990, 57, 273–278. [Google Scholar] [CrossRef]
- Kastelic, K.; Dobnik, M.; Löfler, S.; Hofer, C.; Šarabon, N. Validity, Reliability and Sensitivity to Change of Three Consumer-Grade Activity Trackers in Controlled and Free-Living Conditions among Older Adults. Sensors 2021, 21, 6245. [Google Scholar] [CrossRef]
- Boyle, L.D.; Marty, B.; Haugarvoll, K.; Steihaug, O.M.; Patrascu, M.; Husebo, B.S. Selecting a smartwatch for trials involving older adults with neurodegenerative diseases: A researcher’s framework to avoid hidden pitfalls. J. Biomed. Informatics 2025, 162, 104781. [Google Scholar] [CrossRef]
- Khaled, M.; Sareban, M.; Kreuzthaler, M.; Schulz, S.; Hussein, R. Overview of Existing Tools for Extracting Health and Fitness Data from mHealth Apps. Stud. Health Technol. Inform. 2022, 295, 49–50. [Google Scholar] [CrossRef]
- Toften, S.; Pallesen, S.; Hrozanova, M.; Moen, F.; Grønli, J. Validation of sleep stage classification using non-contact radar technology and machine learning (Somnofy®). Sleep Med. 2020, 75, 54–61. [Google Scholar] [CrossRef]
- Miller, R.; Chan, S.H.M.; Whelan, H.; Gregório, J. A Comparison of Data Quality Frameworks: A Review. Big Data Cogn. Comput. 2025, 9, 93. [Google Scholar] [CrossRef]
- Vähä-Ypyä, H.; Vasankari, T.; Husu, P.; Mänttäri, A.; Vuorimaa, T.; Suni, J.; Sievänen, H. Validation of Cut-Points for Evaluating the Intensity of Physical Activity with Accelerometry-Based Mean Amplitude Deviation (MAD). PLOS ONE 2015, 10, e0134813. [Google Scholar] [CrossRef]
- Reed, D.L.; Sacco, W.P. Measuring Sleep Efficiency: What Should the Denominator Be? J. Clin. Sleep Med. 2016, 12, 263–266. [Google Scholar] [CrossRef]
- Corral-Pérez, J.; Casals, C.; Ávila-Cabeza-De-Vaca, L.; González-Mariscal, A.; Mier, A.; Espinar-Toledo, M.; Soler, N.G.-A.; Vázquez-Sánchez, M.Á. Associations Between Physical Activity and Inactivity Levels on Physical Function and Sleep Parameters of Older Adults With Frailty Phenotype. J. Appl. Gerontol. 2023, 43, 910–921. [Google Scholar] [CrossRef] [PubMed]
- Hertenstein, E.; Gabryelska, A.; Spiegelhalder, K.; Nissen, C.; Johann, A.F.; Umarova, R.; Riemann, D.; Baglioni, C.; Feige, B. Reference Data for Polysomnography-Measured and Subjective Sleep in Healthy Adults. J. Clin. Sleep Med. 2018, 14, 523–532. [Google Scholar] [CrossRef]
- Windred, D.P.; Burns, A.C.; Lane, J.M.; Saxena, R.; Rutter, M.K.; Cain, S.W.; Phillips, A.J.K. Sleep regularity is a stronger predictor of mortality risk than sleep duration: A prospective cohort study. Sleep 2023, 47. [Google Scholar] [CrossRef] [PubMed]
- Maher, J.M.; Markey, J.C.; Ebert-May, D. The Other Half of the Story: Effect Size Analysis in Quantitative Research. CBE—Life Sci. Educ. 2013, 12, 345–351. [Google Scholar] [CrossRef] [PubMed]
- Gignac, G.E.; Szodorai, E.T. Effect size guidelines for individual differences researchers. Pers. Individ. Differ. 2016, 102, 74–78. [Google Scholar] [CrossRef]
- Shen, Y.; Lv, Q.-K.; Xie, W.-Y.; Gong, S.-Y.; Zhuang, S.; Liu, J.-Y.; Mao, C.-J.; Liu, C.-F. Circadian disruption and sleep disorders in neurodegeneration. Transl. Neurodegener. 2023, 12, 1–25. [Google Scholar] [CrossRef]
- Shi, L.; Chen, S.-J.; Ma, M.-Y.; Bao, Y.-P.; Han, Y.; Wang, Y.-M.; Shi, J.; Vitiello, M.V.; Lu, L. Sleep disturbances increase the risk of dementia: A systematic review and meta-analysis. Sleep Med. Rev. 2018, 40, 4–16. [Google Scholar] [CrossRef] [PubMed]
- Verma, A.K.; Singh, S.; Rizvi, S.I. Aging, circadian disruption and neurodegeneration: Interesting interplay. Exp. Gerontol. 2022, 172, 112076. [Google Scholar] [CrossRef] [PubMed]
- Atoui, S.; Chevance, G.; Romain, A.-J.; Kingsbury, C.; Lachance, J.-P.; Bernard, P. Daily associations between sleep and physical activity: A systematic review and meta-analysis. Sleep Med. Rev. 2021, 57, 101426. [Google Scholar] [CrossRef] [PubMed]
- Seol, J.; Lee, J.; Park, I.; Tokuyama, K.; Fukusumi, S.; Kokubo, T.; Yanagisawa, M.; Okura, T. Bidirectional associations between physical activity and sleep in older adults: a multilevel analysis using polysomnography. Sci. Rep. 2022, 12, 1–11. [Google Scholar] [CrossRef]
- Lin, C.-Y.; Lin, K.-P.; Hsueh, M.-C.; Liao, Y. Associations of accelerometer-measured sedentary behavior and physical activity with sleep in older adults. J. Formos. Med Assoc. 2023, 123, 1239–1245. [Google Scholar] [CrossRef]
- Angeles, R.C.; Berge, L.I.; Gedde, M.H.; Kjerstad, E.; Vislapuu, M.; Puaschitz, N.G.; Husebo, B.S. Which factors increase informal care hours and societal costs among caregivers of people with dementia? A systematic review of Resource Utilization in Dementia (RUD). Heal. Econ. Rev. 2021, 11, 1–15. [Google Scholar] [CrossRef]
- Karas, M.; Muschelli, J.; Leroux, A.; Urbanek, J.K.; A Wanigatunga, A.; Bai, J.; Crainiceanu, C.M.; A Schrack, J. Comparison of Accelerometry-Based Measures of Physical Activity: Retrospective Observational Data Analysis Study. JMIR mHealth uHealth 2022, 10, e38077. [Google Scholar] [CrossRef]
- van Hees VT, Gorzelniak L, Dean Leon EC, Eder M, Pias M, Taherian S, et al. Separating movement and gravity components in an acceleration signal and implications for the assessment of human daily physical activity. PLoS One. 2013;8(4):e61691.
- Bakrania, K.; Yates, T.; Rowlands, A.V.; Esliger, D.W.; Bunnewell, S.; Sanders, J.; Davies, M.; Khunti, K.; Edwardson, C.L. Intensity Thresholds on Raw Acceleration Data: Euclidean Norm Minus One (ENMO) and Mean Amplitude Deviation (MAD) Approaches. PLOS ONE 2016, 11, e0164045–e0164045. [Google Scholar] [CrossRef]
- Rubeis, G. The disruptive power of Artificial Intelligence. Ethical aspects of gerontechnology in elderly care. Arch. Gerontol. Geriatr. 2020, 91, 104186. [Google Scholar] [CrossRef] [PubMed]
- Habibi, F.; Ghaderkhani, S.; Shokoohi, M.; Banari, T.; Morsali, M.; Abadi, R.N.S.; Kiamehr, H. Harnessing artificial intelligence in Alzheimer's disease management: navigating ethical challenges in AI. AI Ethic- 2025, 5, 3461–3477. [Google Scholar] [CrossRef]
- Al-Mekhlafi, A.; Becker, T.; Klawonn, F. Sample size and performance estimation for biomarker combinations based on pilot studies with small sample sizes. Commun. Stat. - Theory Methods 2020, 51, 5534–5548. [Google Scholar] [CrossRef]
Figure 1.
Combined 24-h physical activity from Garmin VivoActive5 (ENMO), total time in bed (grey background), time at sleep onset (blue line), time at midsleep (red line) time at wake up (pink line), and corresponding mean sleep quality digital biomarkers from Somnofy; Sleep Efficiency (SE), Wake After Sleep Onset (WASO), Sleep Score (SSc), and Sleep Regulatory Index (SRI).
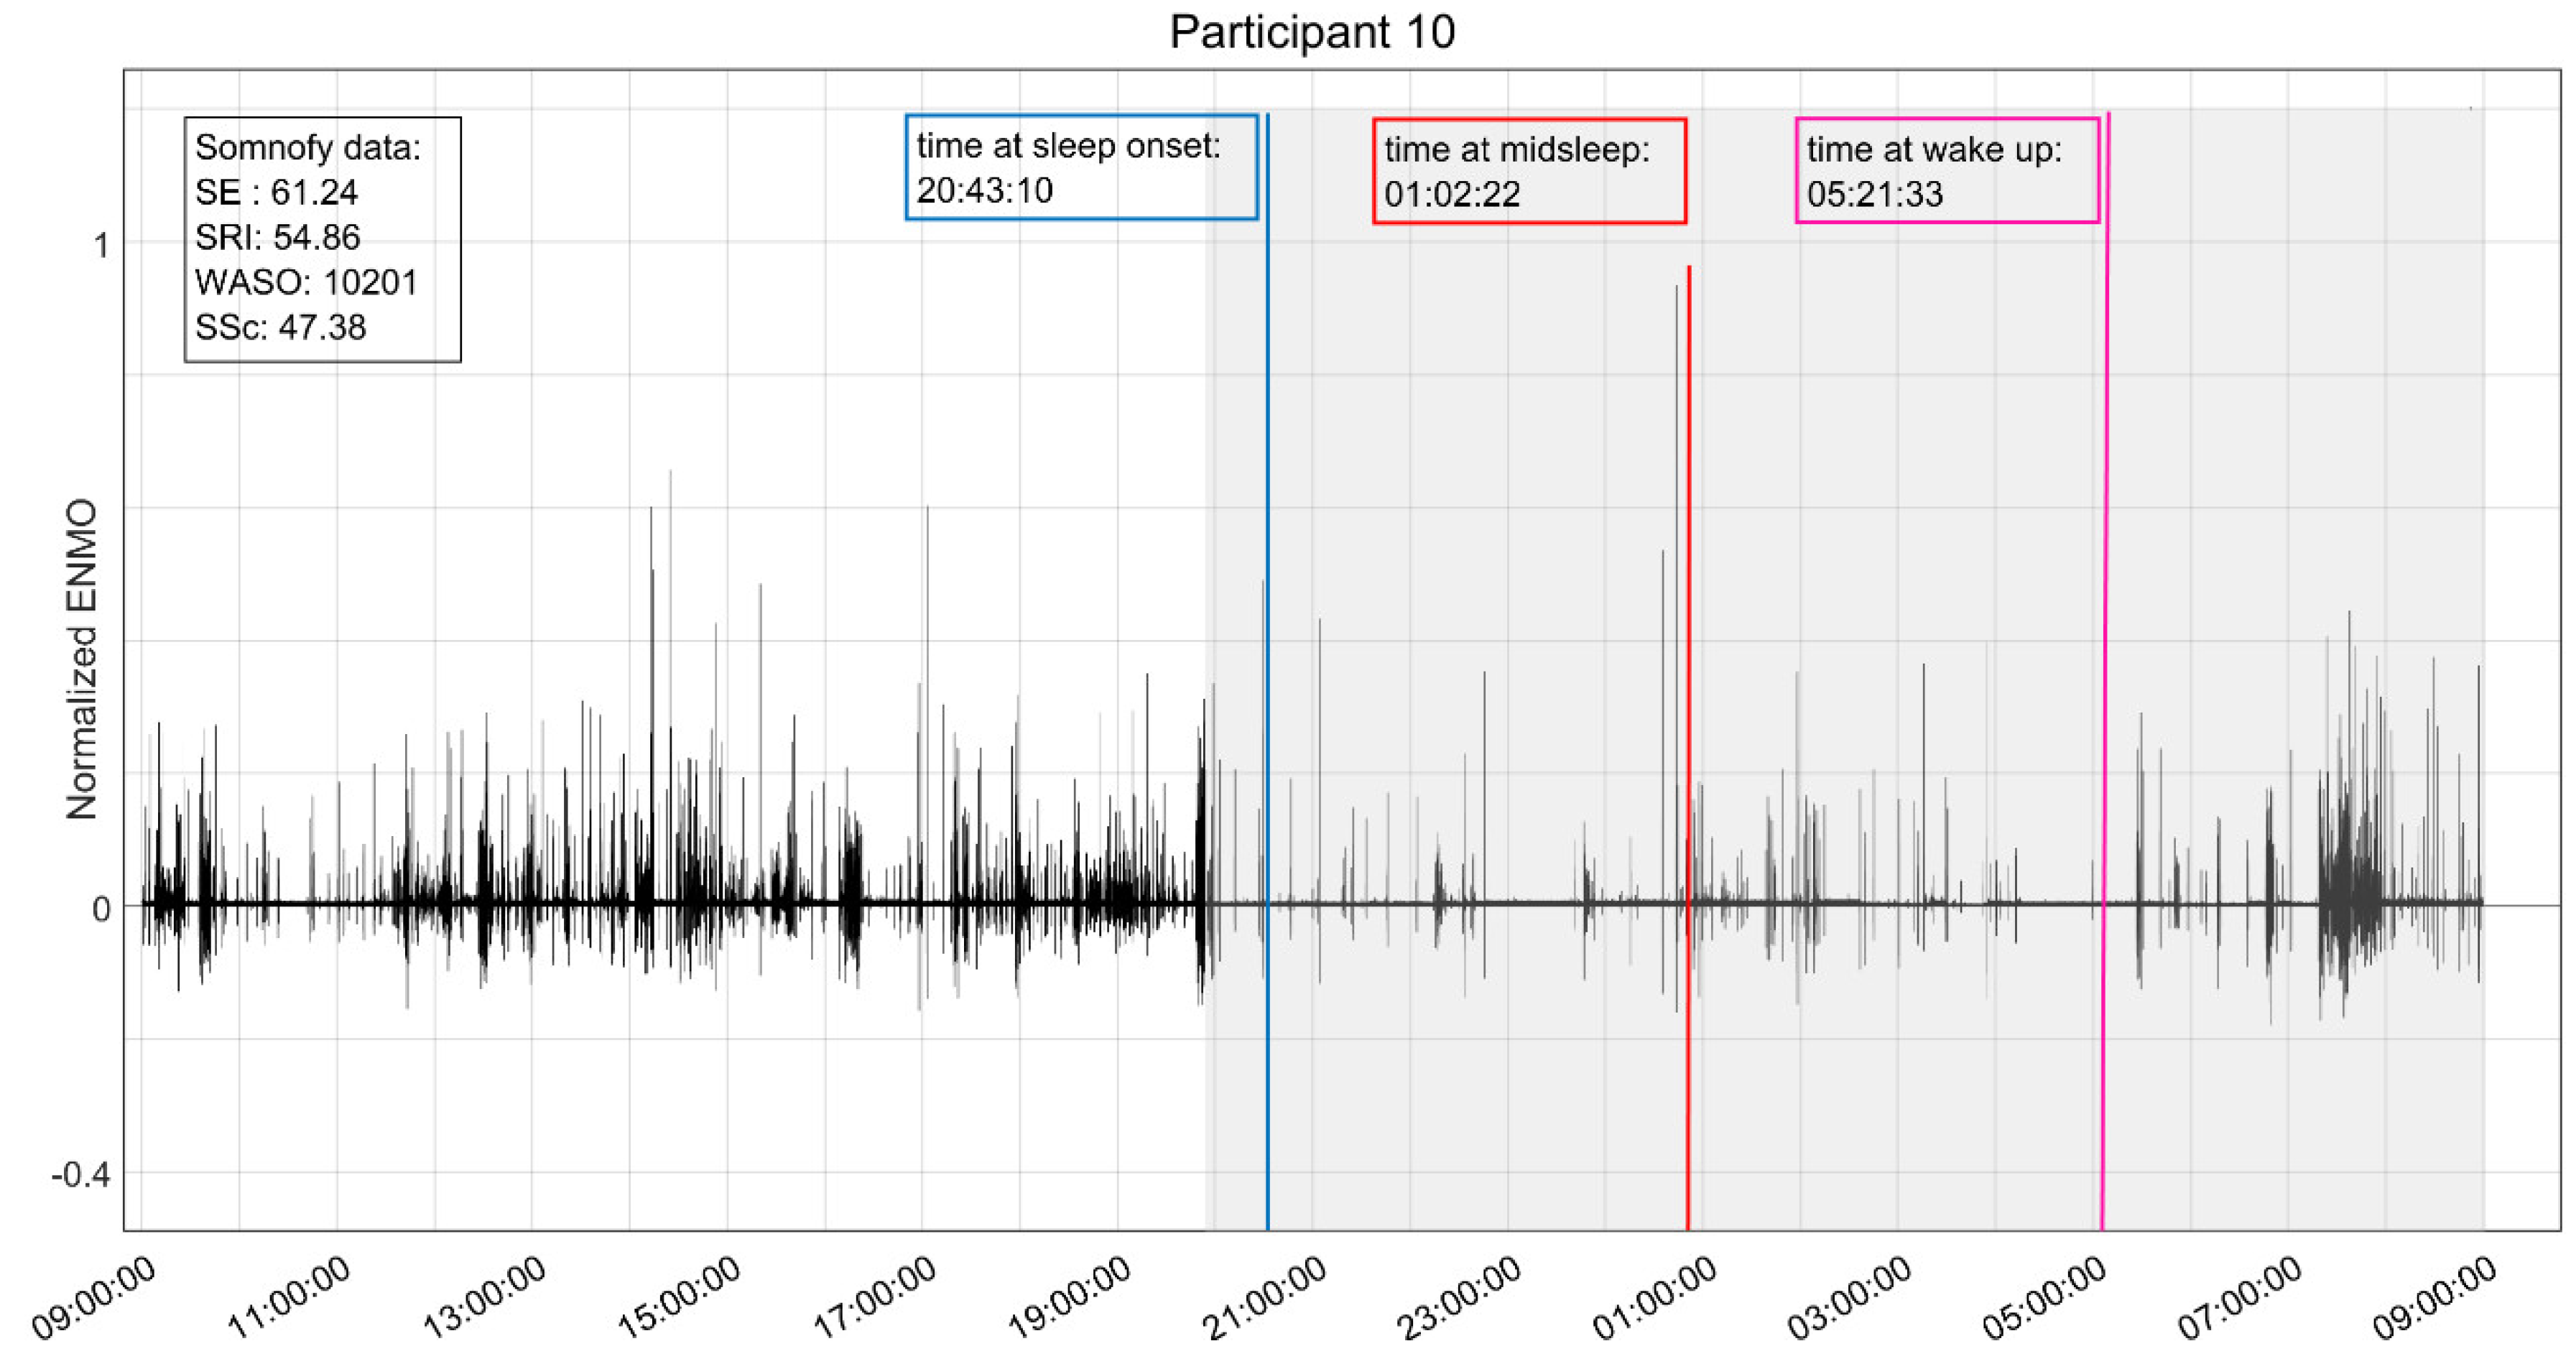
Figure 2.
Relationships between daytime physical activity measured with ENMO/MAD vs. Sleep Quality parameters: WASO, SE, SRI.
Figure 2.
Relationships between daytime physical activity measured with ENMO/MAD vs. Sleep Quality parameters: WASO, SE, SRI.
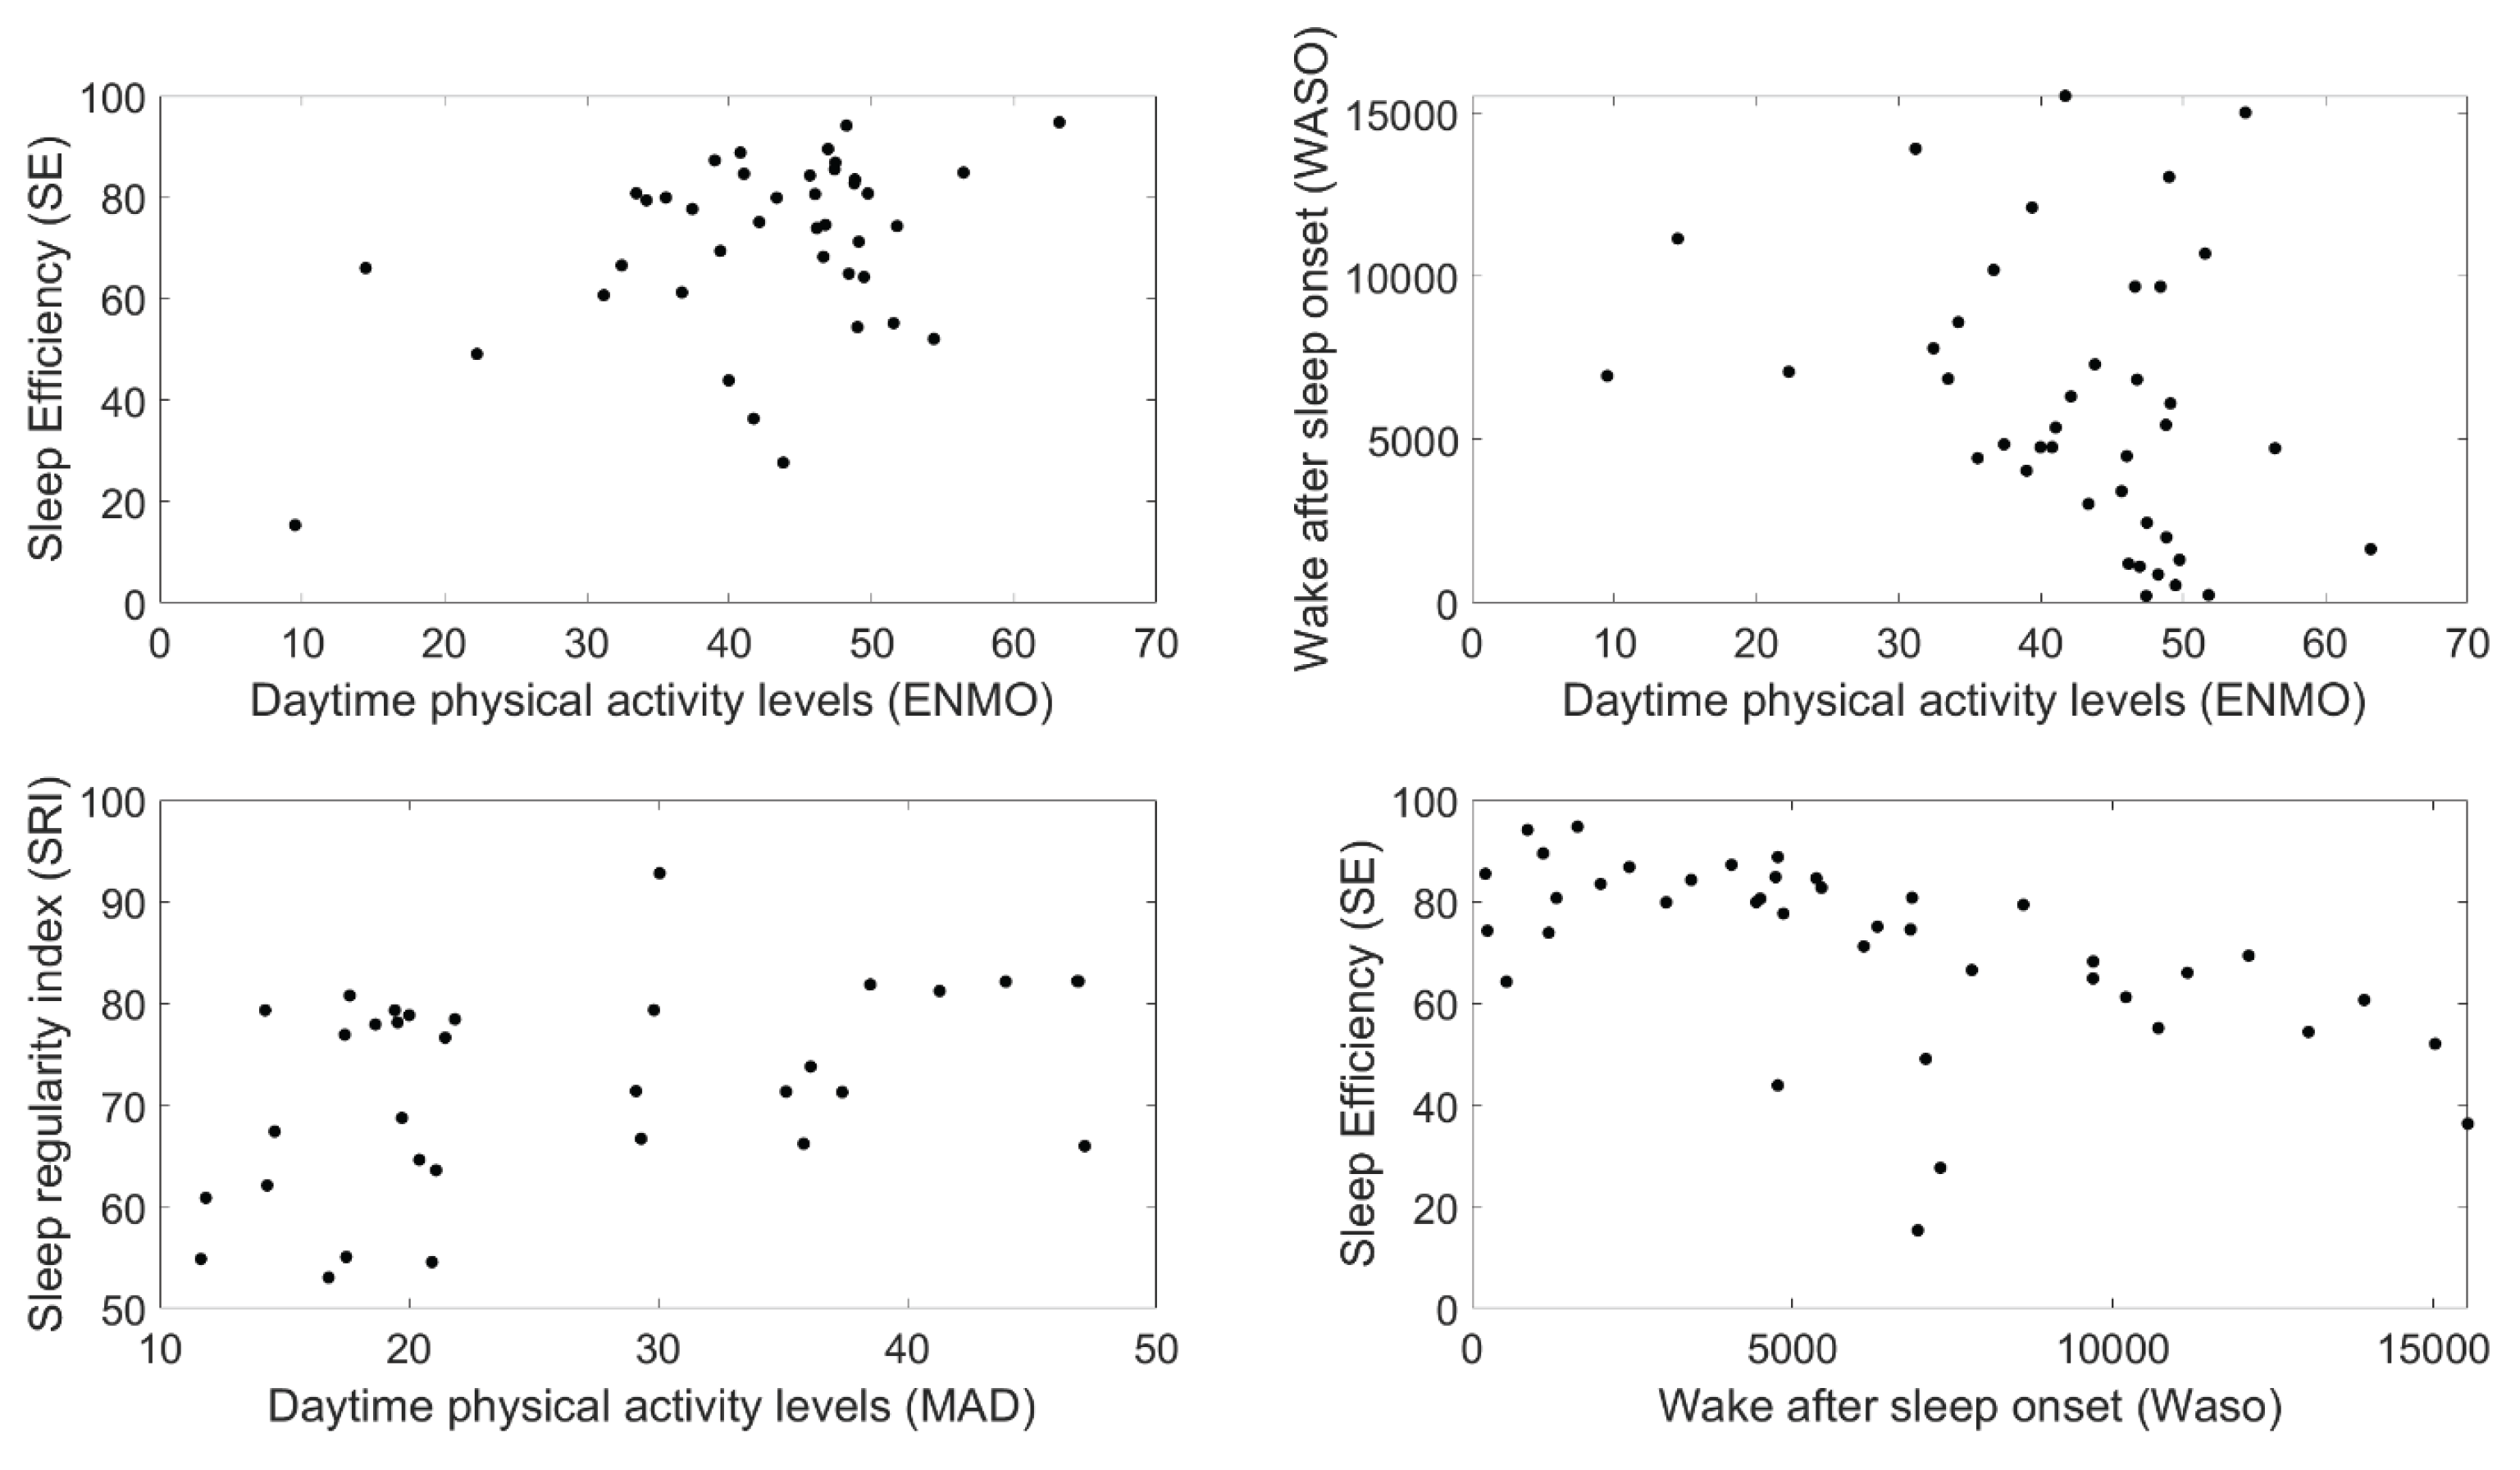

Table 1.
Sample Characteristics (N=11).
| Variables | Mean, Standard Deviation, Range (N) |
|---|---|
| Age, years | 84.0 ±6.1, 77–93 (11) |
| Gender, female (male) | 8 (3) |
| Months in the nursing home | 17.6 ±12.5, 3–42 (11) |
| Dementia as primary diagnosis | 6 |
| Alzheimer’s dementia | 3 |
| Parkinson’s disease | 1 |
| CDR score (0–3) | 2.2 ±0.7, 1–3 (11) |
| Mild | 4 |
| Moderate | 5 |
| Severe | 2 |
| PSMS score (6–30) | 15.7 ±5.7, 8–23 (11) |
| Comorbidities (GMHR) | 2.6 ±0.7, 1–3 (11) |
| NPI-NH | |
| Agitation | 2.2 ±2.2, 1–6 (5) |
| Delusion | 3.0 ±2.4, 1–6 (4) |
| Hallucinations | 3.0 ±2.6, 1–6 (3) |
| Depression | 2.0 ±1.4, 1–4 (4) |
| Anxiety | 1.3 ±0.6, 1–2 (3) |
| Apathy | 5.8 ±4.6, 1–12 (4) |
| Irritability | 3.6 ±2.9, 1–8 (5) |
| Euphoria | 8.0 ±0.0, 8–8 (1) |
| Disinhibition | 1.5 ±0.6, 1–2 (4) |
| Aberrant motor behavior | 1.0 ±0.0, 1–1 (4) |
| Nighttime behavior disturbances | 4.7 ±2.9, 1–8 (6) |
| Appetite/eating | 4.0 ±2.9, 1–8 (4) |
| Total medication | 7.6 ±3.4, 2–13 (11) |
| Psychotropic drugs | 1.9 ±1.4, 1–5 (8) |
Abbreviations: CDR; Clinical Dementia Rating, GMHR; General Medical Health Rating, NPI-NH; Neuropsychiatric Inventory-Nursing Home version, PSMS; Personal Self Maintenance Scale.
Table 2.
Results from selected digital biomarkers for physical activity and sleep quality indicators (N=10); baseline data.
Table 2.
Results from selected digital biomarkers for physical activity and sleep quality indicators (N=10); baseline data.
| Variable | Mean ± SD | Range |
|---|---|---|
| Daytime activity (ENMO)* | 42.5 ± 10.4 | 9.5–63.2 |
| 24-h activity (ENMO) | 43.5 ± 9.2 | 17.0–65.6 |
| Daytime activity (MAD) | 26.5 ± 10.5 | 11.7–47.2 |
| M5 (5 h with highest activity) | 52.2 ± 11.7 | 15.3–69.2 |
| Sleep efficiency (%) | 70.8 ± 17.9 | 15.4–94.8 |
| Sleep score Somnofy (%)† | 76.4 ± 25.3 | 11.6–100.0 |
| Wake after sleep onset (WASO), min | 102.5 ± 70.6 | 3.5–258.9 |
| Sleep regularity index (SRI, %) | 72.1 ± 9.8 | 53.0–92.8 |
| Total sleep time (TST), h | 9.6 ± 2.8 | 1.37–18.1 |
| Sleep latency, min | 35.6 ± 48.1 | 0–244.9 |
| Total time in bed, h | 10.6 ± 2.7 | 1.9–18.6 |
| No presence, min | 7.7 ± 9.8 | 0–47.5 |
†Sleep score is reported as a reference only (proprietary algorithm). Abbreviations: ENMO, Euclidean Norm Minus One; MAD, Magnitude Amplitude Deviation; M5, mean of the five most active hours of the day (milli-g); WASO, Wake After Sleep Onset; TST, Total Sleep Time; SRI, Sleep Regularity Index.
Disclaimer/Publisher’s Note: The statements, opinions and data contained in all publications are solely those of the individual author(s) and contributor(s) and not of MDPI and/or the editor(s). MDPI and/or the editor(s) disclaim responsibility for any injury to people or property resulting from any ideas, methods, instructions or products referred to in the content. |
© 2025 by the authors. Licensee MDPI, Basel, Switzerland. This article is an open access article distributed under the terms and conditions of the Creative Commons Attribution (CC BY) license (http://creativecommons.org/licenses/by/4.0/).
Copyright: This open access article is published under a Creative Commons CC BY 4.0 license, which permit the free download, distribution, and reuse, provided that the author and preprint are cited in any reuse.


