

Submitted:
24 September 2025
Posted:
25 September 2025
You are already at the latest version
Abstract
A trial was conducted from 2017 to 2023 in a 0.2 ha irrigated vineyard located in a semi-arid area of southeastern Spain, using field-grown young vines (0–6 years old) of Vitis vi-nifera L. cv. Monastrell grafted onto three rootstocks: 140Ru, 161-49C, and 110R. The main objective was to evaluate the effect of early co-inoculation in the field using commercial microbial inoculants containing arbuscular mycorrhizal fungi (AMF), plant growth-promoting rhizobacteria (PGPR), and a mycorrhizal helper bacterium (MHB) on young vine performance. We assessed the impact of microbial inoculation and its interac-tion with the rootstock on soil environment, plant water relations, leaf gas exchange, plant nutrition, growth, yield, and berry quality. Mycorrhizal colonization rates in root samples showed similar values in inoculated and non-inoculated vines across all of the rootstocks; however, inoculated vines grafted onto 140Ru showed significantly higher concentrations of total glomalin in the soil compared to their non-inoculated counterparts. Microbial in-oculation altered the soil environment, leading to increased oxygen diffusion rate (161-49C), organic matter decomposition rate (140Ru), soil CO₂ flux (110R, 140Ru), and soil H₂O flux (110R) values in the rhizosphere of inoculated vines. Additionally, inocu-lated vines grafted onto 140Ru and 161-49C exhibited improved vegetative and reproduc-tive development, enhancing productive water use efficiency (WUEyield), whereas inocu-lated vines on 110R showed poorer soil–plant water relations, growth, yield, and WUEyield compared to non-inoculated vines. Microbial inoculation also led to a significant decrease in must phenolic content, particularly in 140Ru, unlike 110R and 161-49C. These findings indicate that early microbial inoculation had a rootstock-dependent impact on the per-formance of young grapevines.
Keywords:
early AMF/bacteria inoculation
; leaf gas exchange
; plant nutrition
; grape quality
; water use efficiency
; yield response
1. Introduction
Plant–microbe interactions in the rhizosphere are key determinants of plant health, productivity, and soil fertility [1,2]. Among these microbes, arbuscular mycorrhizal fungi (AMF), which belong to the subphylum Glomeromycotina, spontaneously form a functional endomycorrhizal symbiosis with grapevine roots. These fungi are present in most of the commercial vineyards, influencing the surrounding microbiome structure that forms the so-called mycorrhizosphere. This symbiosis significantly enhances grapevine establishment, growth, photosynthesis, and gas exchange, as well as nutrient uptake, drought tolerance, and grape quality [2,3,4,5,6]. These benefits are achieved through various mechanisms, which include: (a) improved root water uptake due to the increased soil exploration via extra-radicular hyphae, which effectively extend plant roots, thereby improving water uptake efficiency; (b) better mineral nutrition, especially with regards to phosphorus and other macro- and micronutrients, not only due to the extended root system facilitated by AMF but also thanks to the direct role of extra-radicular hyphae in nutrient uptake; (c) alterations in root architecture, anatomy, and morphology; (d) modification of some physiological processes and the production of secondary metabolites (e.g., phenolic compounds, stilbenes) as well as enzymatic activities, especially those involved in plant antioxidative responses [5,7]; and (e) induction of the plant hormones (e.g., ABA), which play an essential role in mediating some plant responses to different stresses, including drought [8,9]. Additionally, AMF hyphae contribute to soil structure by binding soil particles and producing glomalin, a gluelike insoluble substance [10]. Moreover, AMF symbiosis can trigger a mycorrhiza-induced resistance in grapevines, enhancing tolerance to both biotic and abiotic stresses [6,7]. A recent study in grapevines also indicates that mycorrhization induced changes in the stomatal anatomy under water deficit, suggesting a potential regulatory role of AMF in the expression of genes related to leaf anatomy [11].
It is also well-known that, under natural conditions, the entire mycorrhizal complex comprises not only the plant and the symbiotic fungus but also other associated microorganisms, being bacteria, and especially rhizobacteria, the most abundant [12]. Rhizobacteria include plant growth-promoting rhizobacteria (PGPR) and mycorrhizal helper bacteria (MHB). PGPR are a beneficial and heterogeneous group of microorganisms that can be found in the rhizosphere, on root surfaces, or in association with plant roots. Genera such as Pseudomonas, Azospirillum, Rhizobium, and Bacillus have been widely studied for their ability to enhance plant growth and health through multiple mechanisms: 1) they contribute to plant nutrition by facilitating the uptake of essential nutrients via biological nitrogen fixation, phosphorus solubilization, and mineral mobilization; 2) they bolster plant defense by activating induced systemic resistance against pests and pathogens and by producing antibiotics, hydrolytic enzymes, and other antimicrobial compounds; 3) they influence hormonal balance and stress responses through the production of phytohormones such as indole-3-acetic acid, gibberellins, polyamines, nitric oxide, and stress-alleviating enzymes, supporting plant adaptation under adverse conditions [1,13,14]. Synergistic interactions among PGPR strains have been shown to amplify these effects, enhancing both plant development and protection [14]. Conversely, MHB play a crucial role in modulating plant–fungal interactions. They are known for their ability to enhance the mycorrhizal development by promoting hyphal growth, spore germination, and root colonization [15]. Recent findings suggest that a specific MHB can alleviate drought stress in Helianthemum almeriense plants colonized by mycorrhizal fungi by modulating water relations and plant hormone levels. [12].
Although grapevine is a highly mycotrophic plant, intensive agricultural practices over recent decades, such as heavy fertilization, tillage, and the use of pesticides (including fungicides and herbicides), have reduced the beneficial effects on the soil, as well as the abundance, diversity, and efficacy of AMF and bacteria [3,6]. Therefore, the introduction of selected AMF or beneficial bacteria into agroecosystems may benefit crop growth by optimizing plant nutrition and enhancing plant survival [16], especially when combined with more sustainable soil management practices. Microbial inoculants may also enhance agronomic efficiency by lowering production costs and minimizing environmental pollution, as they can enable the reduction or even elimination of chemical fertilizers [1].
Although numerous studies have demonstrated the benefits of microbial inoculants such as AMF and PGPB (plant growth-promoting bacteria) in grapevine cultivation, their adoption in both conventional and organic viticulture is still restricted. This reflects an ongoing debate about their necessity and overall effectiveness in vineyard applications. A significant concern is the relatively high cost of commercial inoculants, which is further compounded by their fluctuating performance under real-world field conditions. Whereas controlled laboratory and greenhouse experiments have consistently shown positive effects of AMF and PGPB inoculation on grapevine growth and physiology [6,17], field trials often yield variable or unsatisfactory results. The success of bacterial inoculants depends on several factors, including the composition of root exudates, the efficiency of bacterial colonization, and the overall soil health [1]. The performance of AMF communities is influenced by a wide range of environmental and biological factors, such as soil properties (e.g., pH, phosphorus and nitrogen content, moisture, temperature, and organic matter), agricultural practices (e.g., tillage vs. no-tillage), irrigation regimes (e.g., deficit vs. full irrigation), fungal metabolic activity, and the identity of the host plant. Specifically, the genotype of the rootstock and its compatibility with the fungal species play a critical role in determining the success of the symbiosis [3,18,19,20,21]. Recent research also emphasizes the importance of host identity in shaping the composition and structure of AMF and bacterial communities in the rhizosphere and root endosphere. Differences in root exudate composition among grapevine rootstocks appear to be a key factor influencing microbial community dynamics [22,23].
There is increasing evidence that early field inoculation can enhance the establishment of beneficial interactions between grapevine roots and soil microbes. This is because microbes can more easily colonize plant niches due to a lower competition [7,9]. For instance, Camprubí et al. [16] showed that early inoculation with a selected AMF strain improved the establishment and growth of the 110R, increasing vine survival by boosting plant fitness. Similarly, Torres et al. [24] found that AMF inoculation in two-year-old, field-grown Merlot grapevines improved vegetative growth, water status, and photosynthetic activity, particularly under deficit irrigation. Rolli et al. [13] also reported that PGPB significantly improved growth and yield in young grapevines compared to non-inoculated controls.
However, not all of the inoculation efforts are successful. Nerva et al. [7] reported that a commercial AMF inoculant failed to establish in young Pinot noir/3309C vines, regardless of the timing of application. This failure was attributed to the ineffectiveness of the inoculant, over-fertilized soils—with exceptionally high phosphorus levels—and poor compatibility with the rootstock. Similarly, Camprubí et al. [16] found that, whereas several native endophytes and Glomus intraradices BEG 72 improved the growth of 110R under greenhouse conditions using sterile, low-phosphorus soil, only a specific inoculant produced significant improvements in survival and early growth under field conditions. Likewise, the presence of AMF alone does not guarantee a beneficial symbiosis, and it is essential to evaluate the actual functionality of the mycorrhizal association to determine whether it has a meaningful contribution to vine performance under field conditions [6]. Moreover, in some cases, inoculation may even be unnecessary, particularly in soils that already host abundant native AMF populations capable of effectively colonizing grapevine roots [20].
Therefore, grapevines tend to select a specific subset of available fungal and bacterial communities, which may lead to functional differences in the microbiome that can have an influence on ecosystem roles and affect the growth and adaptation to environmental conditions of the host plant. For instance, the addition of the mycorrhizal inoculum in vines promoted the genera Pseudomonas in 1103P and Bacillus in SO4. Both genera have the ability to protect vine plants against several fungal pathogens (Botrytis, Neofusiccocum, Ilyonectria, Aspergillus, Phaeomoniella, Cylindrocarpon, and Phaeoacremonium) as well as soil nematodes such as Meloydogine and Xiphinema [25,27]. Recent studies have demonstrated that the rootstock genotype is a key driver in shaping the composition of the soil and root-associated microbiome, including AMF, and that the efficiency of mycorrhizal colonization and its effects on plant growth can vary significantly depending on the specific rootstock–AMF combination. For example, Giovannini et al. [28] showed that, although all tested AMF inocula were able to colonize different grapevine rootstocks, the extent of colonization and the resulting plant responses were highly dependent on the rootstock genotype, highlighting the importance of considering this interaction in sustainable viticulture strategies.
Besides, recent findings suggest that the interaction between rootstock and AMF + PGPB inoculum is a key factor in grapevine adaptation to water deficit, both under current and projected climate change scenarios [11]. These findings highlight the importance of using carefully selected microbial inoculants, as not all of the AMF or bacterial strains, even within the same species, yield successful results in the field. To exploit the potential benefits of AMF and bacteria in vineyards, it is essential to conduct a careful, site-specific evaluation before inoculation. This includes an assessment of the soil fertility and management practices, the irrigation regimes, the composition of native soil microbiota, and the compatibility of grapevine genotype [22,24].
The main goal of this study was to evaluate the effect of a co-inoculation of commercial microbial inoculants containing AMF and PGPR, as well as the application of MHB in field-grown Monastrell plantlets grafted onto 140Ru, 110R, and 161-49C rootstocks. These commercial rootstocks were chosen because they are the most widely used in the study area and provide a good productive response, increasing the efficiency of water use and the quality of Monastrell grapes in warm, semiarid conditions. From the early establishment of the vineyard, we studied the physiological and agronomic response of inoculated young vines under irrigated conditions. Besides, we evaluated the effect of the rootstock on young Monastrell vines and its interaction with microbial inoculation in a semiarid environment. Considering the positive effects of inoculation with beneficial microorganisms (mainly AMF) on grapevines reported in the literature (especially under controlled conditions, such as those found in pots and greenhouses), we aimed to verify the following hypothesis under field semiarid conditions: a) early microbial inoculation with AMF/PGPR in a newly planted vineyard can improve water and nutrient uptake, growth, and yield, thereby increasing early plant fitness; and b) the rootstock can influence the grapevine's response to microbial inoculation.
2. Materials and Methods
2.1. Field Conditions, Plant Materials, Irrigation, and Soil Treatments
The trial was conducted from 2017 to 2023 in a 0.2-ha plot of young (0-6 years-old) Monastrell (V. vinifera L. syn. Mourvedre) trellis vines grafted on three rootstocks, 140Ru, 110R, and 161-49C, in an experimental orchard located in Cehegín (SE Spain, 38° 6´ 38.13´´ N, 1° 40´ 50.41´´ W, 432 m a. s. l.). Planting took place in March 2017 (Figure 1A). Planting density was 2.8 m between rows and 1.0 m between plants (3571 vines/ha). The soil in the plot had a clay-loam texture (45% clay, 34% silt, 21% sand) and an organic-matter content of 1.1%, an apparent density of 1.40, a pH of 7.83, an electrical conductivity of 0.117 mS cm–1, an active limestone (CaCO3) percentage of 15.3%, a C/N ratio of 8.9, a total N percentage of 0.072%, an assimilable P of 22.76 mg kg–1, a K exchange of 0.99 meq/100 g, a Ca exchange of 13.48 meq/100 g, a Mg exchange of 2.85 meq/100 g, and a cation exchange capacity of 17.48 meq/100 g. The soil was highly compacted to a depth of 70 cm due to the previous land use. The climate was Mediterranean semiarid, characterized by hot, dry summers and a low annual rainfall (Table 1). Irrigation water was sourced from a well, with a pH of 7.96 and an electrical conductivity ranging from 0.68 to 0.81 dS m−1. The training system was a bilateral cordon trellised to a three-wire vertical system. Vine rows were oriented NW–SE. After pruning, six two-bud spurs (12 nodes) were left per vine. In May, non-productive green shoots were uniformly removed across all of the treatments, following standard local viticultural practices.
Crop evapotranspiration (ETc = ETo × Kc) was estimated using varying crop coefficients (Kc) based on the FAO recommendations and adjusted for the Mediterranean region, as well as reference evapotranspiration (ETo) values (Table 1). The applied Kc values were as follows: 0.35 in April, 0.45 in May, 0.52 in June, 0.75 from July to mid-August, 0.60 from mid-August to early September, and 0.45 from mid-September to October. ETo was calculated weekly from the mean values of the previous 5 years, applying the Penman-Monteith-FAO method. Daily climatic data were collected from a meteorological station (Campbell mod. CR 10X) located at the experimental vineyard and operated by the Agricultural Information Service of Murcia (SIAM, IMIDA, Murcia, Spain) (Table 1). All of the vines, regardless of the rootstocks, were irrigated with similar annual water volumes from April to October, using high-frequency drip irrigation (2-5 times per week during the late evening, depending on the phenological period). Water was applied by one pressure-compensated emitter per plant (4 L h–1) with one drip-irrigation line per row. During the first four years (2017–2020), vines were irrigated with high water volumes to ensure a proper vineyard establishment (Table 1). In addition, all of the vines received the same annual dose of organic fertilizer—an amino acid-enriched liquid organic matter (compost, 50 L ha−1 month−1, certified for organic farming)—supplied through the drip irrigation system from April to August. From the fourth year onwards (2021–2023), vines were irrigated solely with water under a controlled deficit irrigation (DI) regime, applying between 90 and 100 mm year−1 (Table 1). Moreover, no liquid fertilizer was applied through irrigation. Instead, fertilization during this period consisted of a single annual application of solid organic/biodynamic cattle manure in autumn, distributed on both sides of the vine rows and incorporated into the soil via shallow trenching, at a rate of 4 to 7 tons ha−1.
During the early years of vineyard establishment, management practices commonly used by local winegrowers were adopted. Inter-row and under-vine weeds were removed using mechanical methods throughout the growing season. Soil management involved no tillage, and all the vineyard management was conducted in accordance with organic production standards, without the use of unauthorized synthetic herbicides or pesticides. Since 2018, a cover crop of legumes and grasses (vetch, mustard, alfalfa, pea, wheat) has been sown annually in the inter-row spaces each autumn. These cover crops were allowed to grow until spring (April), when they were mowed and incorporated into the soil as green manure using minimal tillage (2-3 cm deep), to preserve the soil structure.
When designing this experiment, several key factors that could promote mycorrhization were initially taken into account to set it up: the low P content in the experimental soil, the selection of microorganisms adapted to a semiarid environment, the use of organic production (with no pesticides, herbicides, inorganic fertilization, or tillage), and the application of a deficit irrigation strategy after the establishment.
2.2. Experimental Design and Microbial Inoculation Treatments
From the time of the planting, the vineyard was divided into four subplots, and the experiment followed a randomized block layout with four blocks in total (two blocks per subplot). Two of the subplots were inoculated with a commercial microbial inoculum (I), applied directly into the planting hole at the time of establishment in the field (Figure 1), whereas the other two subplots served as non-inoculated controls (NI). Each subplot contained 24 vines of each rootstock (140Ru, 110R, and 161-49C), totaling 48 vines per rootstock-inoculation combination. Additionally, during the course of the experiment, sequential microbial inoculations were performed using different AMF species (Rhizophagus irregularis and Glomus iranicum) as well as successive applications of an MHB (Pseudomonas mandelii strain 29) and a PGPB (Bacillus megaterium) in combination with R. irregularis, in the inoculated subplots through the irrigation system, as shown in Figure 2.
In both subplots (I and NI), five root samplings were conducted (2017, 2018, 2019, 2020, and 2023). For each of the samplings, four representative root samples were collected from different vines of each rootstock–inoculation combination, at a depth of 30–40 cm in the rhizosphere near the plant. These root samples were processed following standard procedures for this type of samples: root isolation, selection of fine roots, staining, and observation of mycorrhiza structures using optical microscopy. Root samples were cleaned and stained with trypan blue [32], but replacing lactophenol with lactic acid. One hundred root segments per plant were mounted on slides, squashed by pressing on the coverslips, and quantified for AM colonization [33]. The percentage of mycorrhization was calculated based on the number of microscopic fields in which mycorrhizal structures were observed. Two types of organelles were distinguished: those indicative of active mycorrhization (hyphae, vesicles, and arbuscules) and those not directly associated with active mycorrhization (spores). This allowed for a distinction to be made between active mycorrhization (defined by the presence of hyphae, vesicles, and arbuscules inside the root), and non-active mycorrhization (characterized exclusively by the presence of spores in the soil, outside the root) but associated with the mycorrhizal environment [34,35].
2.3. Extraction and Quantification of Arbuscular Fungal Propagules in Soil
In November 2020, in addition to root sampling, soil sampling was conducted to assess the effect of inoculation treatments carried out during that campaign on mycorrhization. For this purpose, a procedure for extracting and quantifying AMF propagules (spores and sporocarps) was used [36]. Using this procedure and through the use of 250/125 and 50 µm mesh sieves, sporocarps and larger spores were separated with the former, whereas smaller spores were collected using the latter.
2.4. Glomalin Concentration in Soil
In November 2023, soil sampling was conducted to determine the presence of glomalin at the end of the trial. In the same vines that were used to sample the roots and evaluate the mycorrhization status, soil samples were obtained from the root environment to assess the concentration of total glomalin (TG). Replicate 0.25 g soil samples of dry-sieved 1–2 mm aggregates were extracted with 2 ml of extractant. TG was extracted using 50 mM citrate, pH 8.0 at 121° C for 90 min. For sequential extractions, the supernatant was removed by centrifugation at 3,000 × g for 15 min; 2 mL of 50 mM citrate, pH 8.0 were added to the residue and autoclaved for 60 min. The process continued until the supernatant showed none of the red-brown color typical of glomalin. Extracts from each replicate were pooled and then analyzed. After completing the extraction cycles, protein in the supernatant was determined using the Bradford dye-binding assay with bovine serum albumin as the standard [37].
2.5. Organic Matter Decomposition
We assessed the rate of organic matter decomposition using standard plant material, following the Tea Bag Index (TBI) method [38]. Pairs of green and rooibos tea bags were used. Each tea bag was labelled with a waterproof marker and weighed (±0.01 g). Subsequently, one replicate of each tea type was buried in each of the plots at a depth of 8 cm, all of them being individually marked (for a total of 32 sample units, with 8 samples per rootstock-inoculation combination). Burial was carried out between May and June 2019, and tea bags were retrieved 90 days later. After recovery, tea bags were cleaned of roots and debris, dried, and reweighed. Based on the weight loss, we calculated the TBI parameters: k (decomposition rate constant) and S (stabilization factor). Green tea contains a highly labile fraction that decomposes rapidly at first. After 90 days, the extent of decomposition of this labile fraction (k) and the amount that has stabilized (S) can be determined. In contrast, rooibos tea decomposes much more slowly and remains in the initial phase of decomposition after 90 days; its weight loss serves as a proxy for the initial decomposition rate (k). TBI parameters were calculated using the spreadsheet template provided by the TBI research team, available at http://www.teatime4science.org.
2.6. Soil Gas Exchange and Oxygen Diffusion Measurements
Between July 20 (pre-veraison) and September 8, 2021 (post-veraison), soil CO2 and H2O exchange were monitored in situ with a LI-8100A infrared gas analyzer (LI-COR Biosciences, Lincoln, NE, USA) equipped with a 20 cm survey chamber. To capture continuous diel patterns, we coupled the analyzer to an automated long-term chamber (model 8100-101). The chamber was mounted on each permanent stainless-steel collar for ≥ 48 h at some point between the onset of veraison and two weeks after its completion (mid-ripening). Measurements were taken in the wetted root zone (east-facing wet bulb) on four vines per rootstock × inoculation treatment, with sampling days selected randomly but under comparable weather conditions. Fluxes were logged at 60-min intervals, providing high-resolution time series for subsequent analysis.
In 2021, soil oxygen diffusion rate (ODR) was measured with a portable oxygen diffusion meter, model 14.36 (Royal Eijkelkamp, Giesbeek, NL). This instrument maintains a constant potential of 0.65 V between a cylindrical platinum–iridium micro-electrode (1.2 mm Ø, 6 mm exposed length) and an Ag/AgCl reference electrode, driving the reduction of all of the O2 that reaches the Pt surface (constant-current technique). The steady reduction current is internally converted to flux and logged as µg O2 cm−2 min−1. Measurements were taken at a depth of 5–10 cm, in the wet root zone, with four replicates per rootstock × inoculation treatment, on randomly selected pre- and post-veraison days under comparable weather conditions.
2.7. Vine Water Status and Leaf Gas Exchange
Each year, the stem water potential (Ψs) was determined monthly from fruit set until harvest. Eight healthy, fully exposed, and expanded mature leaves were selected from the main shoots in the middle–upper part of the vine canopy for each rootstock × inoculation treatment. All of the leaves were east-facing, enclosed in aluminum foil, and covered with plastic for at least 2 h before midday measurement. Ψs was measured at noon (12:00 p.m.–1:30 p.m.) using a pressure chamber (Model 600; PMS Instrument Co., Albany, OR, USA).
Net leaf photosynthesis was measured every 14 days between 9:00 a.m. and 10:30 a.m. from May to September in 2018, 2020, 2021, and 2023 on selected clear and sunny days. Measurements were taken on east-facing, healthy, fully expanded, mature leaves exposed to sunlight (one leaf on each of 8 representative vines per rootstock, the same vines used to measure Ψs), located in the outer canopy and growing on the main shoots. Leaf gaseous exchange parameters were measured with a portable photosynthesis measurement system (LI-6400, Li-Cor, Lincoln, NE, USA) equipped with a broadleaf chamber (6.0 cm2). During the measurements, leaf temperature ranged from 23 to 39 °C, leaf-to-air VPD ranged from 1.4 to 5.3 kPa, and relative humidity ranged from 30 to 50%. The molar air flow rate inside the leaf chamber was 500 µmol mol−1. All of the measurements were taken at a reference CO2 concentration close to ambient concentration (400 µmol mol–1) and at a saturating PPFD of 1500 µmol m–2 s–1.
2.8. Leaf Mineral Analysis
Leaf samples were collected in July 2018, 2021, and 2023 for mineral analysis. About 40 leaves were collected from eight vines per rootstock × inoculation treatment. Leaves were washed immediately, dried at 65° C for one week, and milled. After plant tissue was digested, ashes were dissolved in HNO3, and K, Mg, Ca, Na, P, Fe, Mn, Zn, and B were analyzed with an inductively coupled plasma optical emission spectrometer (Varian MPX Vista, Palo Alto, CA). Nitrogen concentration was determined using the LECO FP-428 protein detector.
2.9. Vegetative and Reproductive Development
From 2018 to 2023, the total leaf area (TLA) per vine at the end of July (veraison period) was estimated in 16 to 32 vines (depending on the year) per rootstock × inoculation treatment, using a non-destructive method. This method employed a first-order polynomial equation that related the shoot length (SL) to the TLA of the main shoot, previously developed for each of the rootstocks [39]. TLA per plant was calculated by selecting five representative main shoots per vine, measuring their average SL with a tape, and multiplying the average shoot leaf area by the total number of main shoots of the vine. During the winters of 2018 to 2023, pruning weight (PW) measurements were taken in 24 vines per rootstock × inoculation treatment, including the same vines used for yield, leaf area, and shoot measurements.
Each year, at harvest (mid-late September), yield response was measured across 24 vines per rootstock × inoculation treatment. Harvest date was determined according to the grower's practices in the area, occurring when °Brix reached 23.5–24.0. Yield per vine (kg vine−1), number of clusters per vine, berry weight, and cluster weight were calculated. Productive water use efficiency (WUEyield) was expressed as the mass of fresh grapes produced per m3 of applied water per vine.
2.10. Berry and Must Quality
Samples of mature berries were collected from each rootstock × inoculation treatment at harvest in 2018, 2019, 2020, 2021, 2022, and 2023, and transported to the laboratory. Each sample consisted of 800–900 g of berries, randomly gathered from different clusters on each vine. The berries were crushed with an automated blender (Coupe 550 GT), avoiding seed breakage. The crushed grape sample was then centrifuged, and the resulting juice was used for the analysis of pH, total soluble solids (TSS), solutes per berry, titratable acidity, and tartaric and malic acids [39,40]. The phenolic potential of the grapes was also calculated [41,42]. Grapes were homogenized and macerated for four hours at pH 1.0. Subsequently, total phenolic content and anthocyanin concentration were quantified spectrophotometrically by measuring absorbance at 280 nm and 520 nm, respectively.
2.11. Statistical Analysis
Data were analyzed using analysis of variance (ANOVA), and means were separated by Duncan's multiple range test, using Statgraphics 2.0 Plus software (Statistical Graphics Corporation, USA). One- and two-way ANOVAs were used to assess the effects of rootstock and AMF inoculation each year. In the global analysis of technological and phenolic maturity parameters, a three-way ANOVA was employed to evaluate the effects of rootstock, AMF inoculation, and year, and the rootstock × AMF inoculation interaction was analyzed. Linear and nonlinear regressions were fitted using SigmaPlot 11.0 (Systat, Richmond, CA), and the best fit for nonlinear models was selected based on Schwarz's Bayesian criterion index (SBC). Due to the non-normal distribution of mycorrhization percentage data, non-parametric statistical tests were applied to assess differences between treatments. The Krustal-Wallis test was used when comparing more than two treatments, and the Mann-Whitney U test was used for pairwise comparisons. When significant differences were found among more than two treatments, a Duncan post hoc test was performed.
3. Results
3.1. Effect of Microbial Inoculation on Mycorrhization
Overall, a gradual increase in mycorrhization was observed from the beginning of the experiment in 2017 until September 2020, when maximum levels of AMF mycorrhization (close to 60%) were reached (Figure 3). After that point, a decline was recorded, reaching approximately 20% in 2023, probably due to the absence of artificial inoculation during the years 2021 and 2022. Nevertheless, the percentage of mycorrhization was around 10 times higher in 2023 (end of the experiment) than in 2017 (beginning of the experiment), indicating a partial stability of the microbial consortium, even without reinoculation. The highest mycorrhization percentages (>60%) were observed in rootstocks 140Ru and 110R, exceeding those reached in 161-49C, although the differences were not statistically significant.
Interestingly, overall, the inoculated and non-inoculated vines showed similar values of total mycorrhization percentage (active + non-active), with slightly higher values even in the non-inoculated vines (Figure 4). Furthermore, across the different rootstocks, none consistently exhibited higher mycorrhization percentages in inoculated vines compared to non-inoculated vines.
To gain a deeper understanding of the nature of the infestation in both plant groups, the percentages of mycorrhization corresponding to the active fraction (hyphae, arbuscules, and vesicles) and the non-active fraction (spores) were analyzed separately (Figure 5). This distinction was based on the presumed functionality of each fraction and its potential effects on both plant groups. With this approach, we aimed to elucidate how the spread occurred and whether it affected the different fractions similarly in both I and NI plants. On a global scale (without directly distinguishing between I and NI plants), the active mycorrhization fraction was consistently and significantly higher than the non-active mycorrhization, with both fractions showing different behaviors (Figure 5). Non-active mycorrhization (spores) showed a significant initial increase following the first inoculation, then remained relatively stable at around 5%. In contrast, active mycorrhization progressively increased, reaching a peak of approximately 50%, before declining to around 20% after the final inoculation at the end of the trial. In any case, after 7 years, there was a clear and significant percentage of the active mycorrhization fraction compared to the levels observed at the beginning of the trial (Figure 5).
Even though the percentage of total mycorrhization in the root samples from I and NI vines (including all of the rootstocks) was similar, the distribution between active and non-active mycorrhization differed (Figure 6): NI vines showed a significantly higher percentage of non-active mycorrhization (spores), whereas I vines showed a higher rate of active mycorrhization. However, this difference was not statistically significant. Besides, to study the influence of the application use of MHB, data from the selective methodology referring to the non-active mycorrhization revealed a notable trend (Figure 1S). In 2020, following bacterial inoculation, I vines experienced a significant increase in the percentage of spores, whereas NI vines showed a decrease. Specifically, the rate of spores in I vines increased from 1.7% to 8.2%, whereas in NI vines it decreased from 8.4% to 5.2% (Figure 1S). This trend was evident in the majority of the rootstocks.
Among the evaluated parameters, the one that most consistently reflected the effect of AMF was the concentration of total glomalin in soil at the end of the experiment (2023). Soils from I vines showed glomalin concentrations approximately 12–13% higher than those from NI vines (Table 2). However, the significant R × MI interaction revealed that only the inoculated 140Ru vines had a significantly higher concentration of total glomalin in the soil compared to the non-inoculated ones. In contrast, no significant differences were observed between I and NI vines in the 110R rootstock (Table 2).
3.2. Effect of the Rootstock
3.2.1. Soil Respiration and Organic Matter Cycling
In 2019, no significant differences were observed in soil organic matter decomposition during the growing season (measured by the TBI parameters k and S in the rhizosphere of the 110R and 140Ru rootstocks [Table 2]).
In 2021, no significant differences were observed between the rootstocks in ODR in the soil (Table 2) or in soil CO2 flux (Figure 7) in the rhizosphere during the growing season. However, daily soil H2O efflux (soil evaporation rate) was higher in 110R compared to 140Ru, mainly during the afternoon and evening hours (3:00 p.m.–15:00 p.m.) (Figure 7).
3.2.2. Soil-Plant Water Relations and Leaf Gas Exchange
One year after planting (2018), significant differences in leaf gas exchange post-veraison were already observed among the rootstocks, with higher rates of photosynthesis and stomatal conductance in 110R compared to 140Ru (Table 3). However, no differences in the plant water status were observed among the rootstocks. In 2020, E during the pre-veraison period and both gs and E during the post-veraison period were significantly higher in 161-49C compared to 110R. Consequently, the A/E (in pre-veraison) and A/gs (in post-veraison) were reduced in this rootstock compared to 110R. In 2021, no significant differences in leaf gas exchange were observed among the rootstocks. However, during the post-veraison, 161-49C showed a significantly higher water stress (more negative Ψs) compared to 110R and 140Ru (Table 3). In 2023, no significant differences in plant water status or leaf gas exchange were observed among the rootstocks.
3.2.3. Leaf Mineral Nutrition
Leaf mineral concentration was also affected by the rootstock from the beginning of the plantation (Table 4). In 2018, 140Ru had lower concentrations of N, P, and K, and a higher concentration of Mg in the leaves compared to 110R and 161-49C. Additionally, 161-49C had a significantly higher concentration of Na than 110R and 140Ru. In 2021, 140Ru vines exhibited higher concentrations of Na and Mg compared to both 110R and 161-49C. Furthermore, 161-49C had a higher concentration of Mn than 110R, whereas 110R had more B than the other rootstocks in 2018 (Table 4). In 2023, 140Ru vines showed a significantly higher Mg concentration than 110R.
3.2.4. Vegetative and Reproductive Development
One year after planting (2018), significant differences in vegetative and reproductive development were also observed among the rootstocks (Figure 8, Table 5). Thus, vines grafted onto 140Ru experienced a significant increase in shoot growth, TLA, and yield (number of clusters) compared to those grafted onto 110R and 161-49C. This effect continued in subsequent years, with 140Ru consistently exhibiting higher values of shoot growth (2020, 2021, 2022, 2023), TLA (2020, 2021, 2023), pruning weight (2019, 2021, 2022, 2023), yield (2019, 2020, 2021, 2022, 2023), number of clusters (2020, 2021, 2022, 2023), cluster weight (2019, 2020, 2021, 2023), and PW (2019, 2021, 2022, 2023) compared to 110R and 161-49C (Table 5). Besides, since 2018, the 140Ru rootstock also showed a significantly higher water use efficiency (WUEyield) from a productive standpoint than 110R and 161-49C (Figure 9). The vines grafted onto 161-49C showed the least water-use efficiency from a productive point of view (Figure 9).
3.2.5. Berry Quality Response
One year after planting (2018), significant differences in certain technological and phenolic quality parameters of the berries were also observed among the rootstocks. However, these differences varied depending on the year (Tables 1S and 2S, Supporting information). In 2018, vines grafted onto 140Ru showed significantly lower values for TSS, maturity index (MI), tartaric acid, total soluble sugars, must percentage, total anthocyanins, absorbance at 520 nm (A520), and color index (CI), along with higher values for L*, a*, and C* (CIElab parameters), compared to 110R and 161-49C. In contrast, 161-49C exhibited lower acidity and higher tartaric acid and MI levels than the other rootstocks (Table 1S).
Nevertheless, when considering the entire six-year period, 140Ru generally resulted in lower average berry technological and phenolic quality (Table 6, Table 7 and Table 8). This was reflected in higher values for berry weight, pH, malic acid content, seed maturity index (SMI), L*, and K content in the must, as well as lower CI, tartaric/malic acid ratio, anthocyanins/TSS ratio, total polyphenol index (TPI), extractable polyphenols, total anthocyanins, and A520 levels, compared to the other rootstocks. In contrast, 161-49C and 110R showed improvements in technological and phenolic quality, characterized by lower pH, CIELab parameters (L*, a*, b*), and SMI, along with higher values for TSS, tartaric/malic acid ratio, anthocyanins, TPI, extractable polyphenols, and nutrient content in the must (Table 6, Table 7 and Table 8).
3.3. Effect of Microbial Inoculation and Its Interaction with the Rootstock
3.3.1. Soil Respiration and Organic Matter Cycling
Soil oxygen availability varied significantly during the growing season, with values approximately 20% higher in pre- than in post-veraison (Table 2). During the post-veraison period in 2021, a significant interaction between rootstock and microbial inoculation revealed that inoculated 161-49C vines showed a significantly higher soil oxygen diffusion rate (ODR) compared to NI vines. Conversely, no significant differences in ODR were observed between I and NI vines for 110R and 140Ru.
Our results also found that the decomposition rate (k) of standardized OM litter was significantly increased in I treatments compared to NI ones. In contrast, the litter stabilization factor (S) was not affected (Table 2). Nevertheless, a more detailed single-factor analysis for each of the rootstocks, P < 0.05 (data not shown), revealed that k was significantly higher in inoculated 140Ru vines, but not in 110R, compared to their respective non-inoculated controls (Table 2).
Additionally, repeated microbial inoculation caused a significant rise in rhizospheric soil CO2 flux during the growing season in both 110R and 140Ru rootstocks, compared to non-inoculated vines (Figure 7). Moreover, microbial inoculation increased the daily soil water flux in the rhizosphere (the wet root zone) of 110R vines, particularly in the afternoon and the evening. In contrast, daily soil water flux rates in 140Ru vines were similar between inoculated and non-inoculated vines.
3.3.2. Soil-Plant Water Relations and Leaf Gas Exchange
During the pre-veraison period of 2018, there were no significant differences between I and NI vines in leaf gas exchange nor in Ψs; there was no interaction with the rootstock. (Table 3). During the post-veraison period of 2018 (one-year-old plants), both A and E were significantly higher in the I treatment, compared to the NI one. As a consequence of these changes, instantaneous leaf water use efficiency (A/E) was significantly lower in I than in NI (Table 3). In 2020, a significant interaction between rootstock and microbial inoculation was observed. In 110R inoculated plants, E was significantly higher, whereas A/gs was lower than in 110R non-inoculated plants during the pre-veraison period (Figure 10). However, no significant differences in leaf gas exchange were found between I and NI in the other rootstocks. In 2021, during the pre-veraison period, as in previous cases, no significant differences in Ψs between I and NI vines, nor any interaction with the rootstock, were found (Table 3). However, during the post-veraison period, A/E was significantly lower in I compared to NI treatment, showing a similar response to that observed in 2018 (Table 3). In 2023, the most pronounced effects of microbial inoculation were observed in leaf gas exchange. Microbial inoculation significantly decreased A and E during the pre-veraison period, and A, gs, and E during the post-veraison period, compared to the NI treatment. Therefore, A/gs increased in I compared to NI (Table 3). Nonetheless, the unifactorial analysis for each of the rootstocks revealed that during the pre-veraison period, leaf gas exchange (A, E) was significantly reduced by microbial inoculation in 110R, but not in 140Ru (Figure 10). Similarly, during the pre- and post-veraison periods in 2023, inoculated 110R vines showed more negative Ψs values (indicating higher water stress) than NI 110R vines. In contrast, inoculated 140Ru vines showed a lower water stress (less negative Ψs and lower A/E) than non-inoculated 140Ru vines (Figure 10).
3.3.3. Leaf Mineral Nutrition
Microbial inoculation had no effect on leaf mineral content in 2018 (Table 4). However, in 2021, inoculated vines had lower Na and Fe levels and higher Zn concentrations than NI vines. The analysis of significant interactions in 2021 also revealed that in 110R, inoculation increased Mg and Mn and decreased Na concentration in the leaves. In contrast, in 161-49C, inoculation decreased Ca, Mg, and Cu levels compared to the NI treatment. Conversely, in 140Ru, inoculation increased leaf Ca concentration and decreased Na levels compared to NI. Besides, in 2023, microbial inoculation also increased the leaf concentration of P, K, Mg, and Cu compared to NI vines, and the interaction between rootstock and microbial inoculation showed that in 110R, inoculation increased leaf Zn and Cu content, whereas in 140Ru, it increased leaf Ca and Mg concentrations (Table 4).
3.3.4. Vegetative and Reproductive Development
Microbial inoculation increased shoot length (2019, 2020), TLA (2020), PW (2018, 2021), yield, and cluster weight (2019–2021), as well as the number of clusters per vine (2020), compared to the NI treatment (Table 5). However, unifactorial analysis of each of the rootstocks showed that microbial inoculation had varying effects on vegetative growth and yield parameters across the different rootstocks (Figure 11). Inoculated 110R vines displayed a significant decrease in PW (2022, 2023), TLA (2021, 2022), WUEyield (2023, Figure 9), shoot length (2022), and yield (2023). In contrast, in 140Ru, inoculation increased PW, yield (2021, 2023), and WUEyield (2021, 2023, Figure 9) compared to non-inoculated vines. Similarly, in 161-49C, microbial inoculation led to an increase in TLA (2021), PW, yield (2021), and WUE yield (2021, Figure 9), as well as cluster weight (2023) (Figure 11).
On the whole, when considering all of the three rootstocks, microbial inoculation did not significantly impact vine mortality rates after five years (data not shown), with similar percentages observed between I and NI treatments (ranging from 32% to 35%). However, in rootstock 110R, the I treatment showed a higher mortality rate (36%) compared to the NI treatment (24%). In contrast, in 161-49C, the plant mortality rate was approximately 39% in I vs. 46% in NI (no significant differences, data not shown).
3.3.5. Berry Quality Response
Microbial inoculation also altered the technological and phenolic composition of the berries at harvest, although these effects depended on both the year and the rootstock (Tables 1S and 2S). In 2018, one year after planting, inoculated vines showed a significant decrease in TSS, total soluble sugars, TPI, extractable polyphenols, extractable anthocyanins, and tannins, whereas berry weight increased compared to the NI treatment. Nevertheless, when considering the six-year period as a whole (average values), microbial inoculation did not significantly affect the technological quality parameters of the berries (Table 6). It did, however, cause a significant decrease in berry polyphenolic content (TPI, extractable polyphenols and anthocyanins), and total tannins (Table 7), as well as in must nutrient content (P and Zn, Table 8), particularly in 140Ru vines (Figure 12). In contrast, in 110R and 161-49C, microbial inoculation had no significant impact on berry phenolic quality or nutrient concentration in the must, except for an increased Mg concentration in the must in 110R (Figure 12).
4. Discussion
4.1. Effect of the Rootstock on the Performance of a Young Vineyard
Whereas 140Ru is frequently reported to promote the highest vigor in mature vines compared to other rootstocks [39,43], there is limited evidence regarding its early effects on newly planted vines. In our experiment, a significant early effect of the rootstock was observed just one year after planting (2018), with vines grafted onto 140Ru exhibiting greater values of shoot growth, total leaf area (TLA), and yield (Figure 8, Table 5). In line with recent multi-season surveys, this difference persisted through the first five growing seasons (2019–2023), during which vines grafted onto 140Ru consistently produced higher shoot biomass and yield levels than those grafted onto 110R or 161-49C, demonstrating that the early advantage translates into a sustained productive capacity. The increased leaf area, which provides a greater photosynthetic surface, may explain this early positive response in 140Ru, potentially compensating for its lower photosynthesis rates and leaf nutrient content (N, P, K) compared to 110R and 161-49C (Table 3 and Table 4). Interestingly, this early advantage in growth and yield for 140Ru persisted during the following years in young, productive vines. This response is likely due to intrinsic genetic differences among the rootstocks [44], with 140Ru exhibiting greater root water uptake and transport capacity levels [39,45,46,47]. These traits can play an essential role in early development by enabling a more efficient exploitation of available soil water resources, resulting in a higher WUEyield (Figure 9). Quantitatively, WUEyield in 140Ru was ~15–20% higher than in 161-49C during the most productive years, confirming its superior productive water-use efficiency. This was also supported by a significantly lower daily soil evaporation rate (soil water flux) in 140Ru, which indicates a lower water loss from the soil surface and denotes a more efficient water uptake by the roots compared to 110R (Figure 7). Observed leaf water potentials remained similar across the rootstocks during the first three years, corroborating that the improved performance was not due to differences in plant water status but rather to the enhanced soil moisture capture and transpirational use.
Rootstock also influenced the early quality response of the berries in very young vines. Broadly speaking, 161-49C and 110R were associated with a greater berry quality, including increased values for nutrient and sugar content in the must, anthocyanin/TSS ratio, CI, MI, tartaric/malic acid ratio, and polyphenol content (Table 6 and Table 7). These vines also produced berries with lower berry weight, reduced malic acid concentration, and lower pH values compared to those grafted onto 140Ru. These findings are consistent with previous studies conducted on mature vines [39,44,48]. Our data indicate that the smaller berry size in 161-49C and 110R concentrates skin-based phenolic compounds. In contrast, the larger berries of 140Ru dilute these constituents, explaining the lower anthocyanin and tannin concentrations despite its higher yield [49]. Additionally, 140Ru berries accumulated more K+ ions, which led to a higher must pH, a typical trade-off between yield and quality color intensity already documented in Tempranillo vines grafted onto 1103P versus 161-49C [48].
Nevertheless, it is also important to note that five years after planting (in 2022), the mortality rate of the vines (including dried up vines, missing vines that failed to grow, and declined vines that grew very little and were unproductive) varied substantially depending on the rootstock: 27% for 140Ru, 30% for 110R, and 46% for 161-49C (data not shown). The lack of water and water stress after planting are unlikely to have been the leading cause of vine decline, since the plants were fully irrigated during the first three years and received a moderate deficit irrigation over the following three years. Additionally, no differences in leaf water potential (indicating no water stress) were observed during the early years (Table 3). Severe declines of young vines grafted onto 161-49C have also been reported in several vineyards in Languedoc (southern France), as well as in other French and foreign vineyards (Germany and Italy) [50]. Although no precise cause of this decline has been identified, several factors have been observed in affected 161-49C vines, such as low carbon reserve storage in the roots, a very high proportion of tyloses (beyond 40-50% of xylem embolism), the presence of polyphenols and necroses (indicators of plant stress), and cambium dysfunction [50].
Our results suggest that high vigor and more water-use-efficient rootstocks, such as 140Ru and 110R, should be preferred for establishing new plantations under these semiarid conditions and in a context of climate change, in order to increase plant survival and early plant fitness after planting. From a practical standpoint, growers need to balance the evident trade-off between maximizing early vigor/yield (favored by 140Ru) and optimizing berry composition (favored by 161-49C). Under projected scenarios of more frequent drought and heat episodes, ensuring rapid canopy establishment and long-term vine function may outweigh the initial sacrifice in phenolic concentration, especially when deficit-irrigation strategies and canopy management can partially mitigate quality losses. These findings highlight that, under these conditions, rootstock selection is a decisive factor in new vineyards, as the low-vigor 161-49C rootstock may present greater challenges for graft establishment, suffer an early chronic decline, and increase the number of dead young plants within a few years. This frequently necessitates replanting the vineyard, which entails substantial economic losses.
4.2. Effect of Microbial Inoculation and Its Interaction with the Rootstock in the Soil Environment
Root colonization analysis of Monastrell grapevine indicated a gradual increase in the percentage of mycorrhizal colonization over time since planting. In young plants, the association with soil microbiota is not yet fully established, and microbes can colonize plant niches more easily. This explains why mycorrhizal colonization tends to be higher in younger grapevines compared to older ones [6]. This lower level of microbial competition facilitates a better accommodation of AMF in root cells, allowing the formation of a stable and functional symbiosis [7]. Quantitatively, colonization rose from less than 10% at planting (2017) to peak values of ~50–60% of fine-root length by late 2020 (Figure 3; Figure 5), which reflects the high receptivity of young vines and the effect of three consecutive annual AMF inoculations (2017-2019).
The presence of mycorrhizal colonization in the rhizosphere of NI plants also indicates the occurrence of pre-existing natural fungal communities before the trial started (spontaneous mycorrhization). Besides, over the years, we observed a similar trend in the percentage of mycorrhizal colonization in both I and NI treatments, which stagnated and declined when artificial inoculation was not performed for two consecutive years (2021 and 2022). These data suggest that: a) periodic inoculation is vital to maintain a high level of mycorrhization in the roots of semiarid vineyards; otherwise, mycorrhization rapidly reverts to lower levels, underscoring the transitory nature of the artificially elevated colonization levels; b) mycorrhizal colonization of NI plants may have been, at least partially, due to the spontaneous spread of the inoculum, since all of the plants were located within the same experimental vineyard, albeit in spatially separated and clearly different subplots. This may be partly due to inoculum drift, with AMF spores and hyphae potentially dispersing between adjoining subplots; c) the similar trends in the percentage of mycorrhization between I and NI plants may also indicate that the inoculated AMF failed to establish functional integration with the native fungal and bacterial communities colonizing grapevine roots and, therefore, did not lead to a higher root colonization in inoculated vines.
There is a variable capacity of AMF to colonize different plant roots under various environmental conditions in field experiments, depending on both fungal taxa and plant hosts [51]. Furthermore, recent research revealed that AMF inoculation in field conditions does not always lead to the replacement of native AMF communities in roots or to an increased root colonization [6]. Nevertheless, the concentration of glomalin (an insoluble gluelike protein produced by AMF) in the rhizosphere was significantly higher in I vines compared to NI vines, mainly in 140Ru (Table 2), as previously reported in AMF-inoculated seedlings [52]. This suggests that AMF inoculation reinforced native mycorrhizal colonization [53]. The application of P. mandelli strain 29 (a mycorrhizal helper bacterium) may also have contributed to a synergistic increase in fungal colonization, as observed in previous studies [12]. Overall, on average, inoculated soils contained 12–13% more total glomalin than NI soils, and in 140Ru the increase reached ~25% (2580 vs. 1953 µg g−1), indicating a significant rootstock × inoculation interaction (Table 2).
Although the presence of glomalin and structures such as arbuscules, vesicles, hyphae, and spores in the soil and root system of grapevines indicates colonization by AMF, the mere detection and abundance of these structures does not necessarily point to functional effectiveness or a positive contribution to plant performance [6,54,55]. For instance, the number of AMF spores (spore density) in the rhizosphere was not related to root colonization under different soil conditions [34,35], highlighting the need to distinguish between ”active” and ”latent, non-active” mycorrhization in field studies and in the evaluation of inoculants. Therefore, in this study, it was essential to evaluate the functionality of this symbiosis by measuring soil conditions as well as physiological and agronomic parameters in the plant, in order to determine whether it was genuinely effective and improved plant performance. In our trial, the commercial inoculum applied by the end of the experiment contained not only AMF but also the PGPB B. megaterium (Figure 2). This is common in commercial inoculants, which frequently combine AMF with various PGP microbes to enhance the benefits of inoculation [6] and maximize their effectiveness under field conditions, as these microorganisms are known to enhance nutrient uptake, stimulate root development, and increase plant resilience to biotic and abiotic stresses. Notably, following the 2020 application of P. mandelii strain 29, spore density in inoculated roots rose from ~1.7% to 8.2%, whereas NI roots decreased from 8.4% to 5.2% (Figure 1S), suggesting that the bacterium stimulated AMF sporulation. Our analyses confirmed that inoculated vines contained a higher proportion of active fungal structures than NI vines, whereas NI vines harbored more dormant spores, although differences did not reach statistical significance. Therefore, the presence of B. megaterium in the AMF inoculum used in our study may also have contributed to the positive effects observed in the soil environment and plant performance.
In 161-49C, AMF inoculation may have contributed to a better-aerated soil environment (more oxygen diffusion rate, Table 2), favoring oxygen entry and diffusion. Mycorrhizal hyphae are known to promote soil structural changes typically associated with higher gas diffusivity, such as the formation of water-stable aggregates, increased total porosity, and enhanced pore connectivity, facilitating the movement of gases through the soil matrix, and improving soil aeration [52,56,57,58,59]. Consistent with this structural improvement, inoculation also significantly increased the daily soil CO2 flux in vines grafted onto both 140Ru and 110R (Figure 7), even though we did not observe an apparent increase in soil O2 diffusion rate (Table 2). Litter decomposition assessed with the TBI study revealed that the decomposition rate constant (k) was ~10% higher in inoculated soils, whereas the stabilization factor (S) remained unaffected, pointing to a faster turnover of labile organic matter. Accordingly, the daily soil CO2 efflux measured in 2021 was also significantly greater in inoculated vines of 140Ru and 110R, with the most considerable differences appearing during afternoon peaks (Figure 7).
The application of AMF, MHB, and PGPB in field-grown vineyards creates a more favorable soil microenvironment for both roots and microorganisms in vineyards, promoting optimal conditions for both root and microbial activity [24,60,61]. Thus, a greater soil CO2 flux, along with a higher decomposition rate of the labile fraction of organic matter (k) in inoculated vines, suggests an enhanced microbial activity in the rhizosphere, and, consequently, a higher rate of soil organic matter decomposition (litter breakdown and nutrient cycling), which is a key process for CO2 release from soils [38,62]. Notably, the higher values of soil total glomalin, active mycorrhization fraction, and k, specifically observed in inoculated vines grafted onto 140Ru, suggest a greater compatibility of this rootstock with the applied AMF/bacteria inoculum, compared to other rootstocks. Besides, in the 110R rootstock (but not in 140Ru), microbial inoculation significantly increased the daily soil evaporation rate (flux H2O) in the rhizosphere (Figure 7), suggesting a greater water loss from the soil surface in this rootstock and, consequently, a lower root water uptake efficiency of I plants grafted onto 110R vines compared to NI vines.
4.3. Effect of the Microbial Inoculation And its Interaction with the Rootstock on Young Vine Performance
There is specific evidence that AMF and PGPB enhance plant growth and productivity in many crops, including grapevines [1,3]. In the latter, several studies have demonstrated the beneficial effects of early inoculation with AMF and PGPB under laboratory or greenhouse conditions [16,51]. However, there is relatively less data available from field-scale studies in young vines [7,13], particularly when plants are directly inoculated in the field, as was done in our study. Most previous research involves plant material (cuttings or seedlings) that had been inoculated with AMF and/or PGPB in the nursery prior to being planted in the field, as suggested by several studies [6,20]. We found that the microbial inoculation consistently increased one or more plant growth and yield parameters during the first two to three years, as well as in subsequent years of the experiment, consistent with previous findings in field-grown AMF/PGPB inoculated grapevines [13,51,63]. In our study, significant effects were observed in both vine seedlings and productive young vines over seven growing seasons. However, the magnitude of these effects varied depending on the specific parameter, rootstock, and year. For instance, under non-imposed DI conditions (2018–2020), young vines inoculated with AMF displayed enhanced growth, as indicated by higher values in leaf gas exchange (A, E), PW, TLA, shoot length, and berry weight. This contrasts with other studies where, in the absence of water stress, AMF inoculation negatively affected vegetative growth [24]. Under DI conditions (2021–2023), microbial inoculation also enhanced yield (in terms of the number of clusters and cluster weight) and shoot growth, although the extent of this enhancement varied by rootstock. In particular, inoculated vines grafted onto 140Ru and 161-49C showed improved vegetative and reproductive performance, including an enhanced WUEyield (Figure 9). Conversely, inoculated 110R vines exhibited reduced growth (lower TLA), a lower yield, and a diminished WUEyield, likely due to less favorable soil-plant water relations, compared to NI vines. Under the driest season (2023), inoculated vines grafted onto 110R vines showed midday Ψs 0.1–0.2 MPa lower than those of non-inoculated vines, together with 10–15% reductions in A, gs, and E, indicating a possible carbon-cost/benefit imbalance, a greater water stress, and possibly a poor compatibility with the AMF/bacteria inoculum. Besides, soil surface H2O flux in inoculated 110R subplots was also ~12% higher than in NI (Figure 7), suggesting faster soil drying and earlier stress onset. In this context, AMF-colonized vines have shown an enhanced WUE in other rootstock genotypes, such as 1103P and SO4 [7], and literature also points to a stronger AMF-rootstock specificity in 110R [16]. In that study, only field inoculation with a selected AMF strain (G. intraradices BEG 72) improved the establishment and early growth of the 110R rootstock; other native AMF strains, even within the same species, were ineffective. In contrast to the results observed in inoculated plants grafted onto 110R, inoculated vines grafted onto 140Ru showed less water stress than NI vines. This was associated with an improved global photosynthetic performance, primarily due to a larger photosynthetic leaf surface area (Figure 12). Similar improvements in photosynthetic performance have been previously reported in field-grown AMF-inoculated grapevines [24,53]. Our results are consistent with those reported by Giovannini et al. [28], who found that the response of grapevine rootstocks to AMF inoculation is highly genotype-dependent. In their study, certain rootstocks (such as 1103P) exhibited a greater increase in growth and mycorrhizal colonization in response to specific AMF strains, while others showed a more limited or variable response. Other studies have also shown that AMF inoculation reduced bunch and berry weight in certain grapevine varieties, but not in others [64], highlighting the importance of host genotype in determining the effectiveness of mycorrhizal associations. This supports the idea that the effectiveness of microbial inoculation in vineyards cannot be generalized, and that a “precision inoculation” approach—tailored to the affinity between rootstock and AMF genotype—may be necessary to maximize benefits.
Regardless of the rootstock, AMF/PGPB inoculation enhanced the P status of the vines compared to NI controls (e.g., in 2023; Table 4), which was consistent with previous findings in other grapevine varieties using a different AMF inoculum [4]. Besides, the concentrations of other macro- and micronutrients in the leaf blades (mainly K, Mg, Zn, and Cu) were also increased in I vines compared to NI vines, although this effect depended on the rootstock and the year (Table 4). Significant interactions between the rootstock and the inoculation treatment were observed: in inoculated 140Ru vines, the concentrations of Ca and Mg were increased; in 110R, leaf Mg, Zn, Mn, and Cu levels were also higher (5–15%) compared to NI vines. In contrast, inoculated 161-49C vines exhibited slight decreases (−3% to −6%) in leaf nutrient content (Ca, Mg, Cu), indicating a lower soil nutrient uptake capacity for this rootstock under inoculated conditions. Although no significant differences were observed in leaf N concentration, the maintenance of higher TLA and yield in I vines (mainly in 140Ru and 161-49C) suggests a higher total N content per plant. This implies improved N uptake, translocation, and assimilation in I vines compared to NI [51,65]. Moreover, analyses of the must revealed P and Zn concentrations ~6–8% lower in inoculated plants grafted onto 140Ru berries, likely owing to yield dilution. In contrast, Mg increased by 7% in the must of inoculated plants of 110R (Figure 12). These results support the idea that AMF, along with a variety of beneficial microorganisms (such as Pseudomonas spp. or Bacillus spp.), can improve grapevine nutrition by increasing the availability and translocation of nutrients, primarily N, P, K, Ca, and Mg [65,66]. This effect is likely due to the greater soil exploration capacity of the external hyphal network formed by AMF, resulting in a more efficient root nutrient acquisition [3]. Besides, the inclusion of an MHB (P. mandelii strain 29) may have synergistically improved nutrient uptake, given its demonstrated ability to solubilize phosphorus [12,31]. It could also have contributed to a higher microbial activity and an accelerated decomposition and mineralization of soil organic matter in the rhizosphere (as evidenced by higher values of soil CO2 flux and k) (Figure 7, Table 2), thus enhancing nutrient cycling. Moreover, mycorrhizal inoculation has been shown to upregulate nutrient transporter genes in grapevines in response to arbuscular colonization [67]. However, conflicting results regarding the enhancement of mineral nutrient concentration by AMF have also been reported [5,24,66], suggesting that the response may be highly specific to the inoculum and plant genotype [67].
Although there was considerable variability between the years and the rootstocks (Tables 1S and 2S), our research also indicates that AMF/PGPB inoculation can influence both primary and secondary metabolism in grape berries, as it has been previously reported [7,24,64]. In the early years (2018–2020), some negative technological traits were reported in inoculated vines, including lower values of TSS, sugar content, and MI, along with a higher berry weight (Table 1S). Nevertheless, when considering the complete five-year database, microbial inoculation had no significant effect on most technological parameters (Table 6). In contrast, phenolic content was clearly affected; mainly TPI, extractable anthocyanins, extractable polyphenols, and total tannins were significantly reduced in musts from inoculated vines (Table 7). Grapes of inoculated 140Ru plants contained 8–12 % less total phenolics and 15–20 % fewer extractable anthocyanins than in NI plants in 2018–2023 (Figure 12). The lower accumulation of secondary metabolites in inoculated plants may suggest that these plants did not experience sufficient stress to trigger their secondary metabolism throughout the experiment. This may also be attributed to the increased berry weight, leading to a dilution effect. In contrast, no significant differences in berry weight or phenolic content were observed between I and NI vines in the 110R and 161-49C rootstocks. These observations support a dilution-based hypothesis: improved vine water and nutrient status (notably in inoculated vines grafted onto 140Ru) produced high vigor and larger berries with a lower skin-to-pulp ratio, thereby lowering phenolic concentration per unit juice. These results contrast with some studies, in which AMF improved parameters related to secondary metabolism and phenolic content in berries [4,5,68], although these studies were conducted under controlled conditions (potted vines grown in greenhouses). Our data are more consistent with those reported by Antolín et al. [64], also in grapevines under controlled conditions, where they observed that in some varieties, AMF association improved certain berry traits by increasing the concentrations of soluble solids and anthocyanins. In contrast, in others, berry color, total phenolic and anthocyanin content were diminished in AMF-inoculated plants.
All these results suggest that: a) microbial inoculation differentially affected the soil environment and grapevine performance depending on the rootstock; b) there were synergistic positive or negative interactions between commercial AMF/PGPB bioinoculants and the native AMF/bacterial communities of soil and roots, which promoted or inhibited grapevine growth and yield, depending on the rootstock; and (c) these outcomes are closely tied to rootstock-specific rooting patterns and microbial compatibility. There is a strong likelihood that the promotion (140Ru, 161-49C) or suppression (110R) of growth, yield, and early plant fitness in inoculated vines may be related to differences in rooting patterns among the rootstocks. These differences could have contributed to variations in the mycorrhizal responsiveness of the host plant [6], and/or reflected significant differences in the native AMF/bacterial communities associated with each of the rootstocks, as well as their compatibility and interaction with foreign AMF/bacteria introduced through inoculation [7]. Recent studies have demonstrated that the rootstock shapes the grapevine-associated microbiome and drives the structure of the AMF/bacteria communities [2,28,69], largely through differences in root exudate composition [70]. Moreover, rootstock generally performed better in the presence of their native AMF communities [63]. Therefore, the relative abundance of specific AMF species is an essential factor. Some AMF communities increase plant growth and nutrient uptake, whereas others reduce these positive effects, likely due to a greater competition for root colonization or occupation of the soil niche [63]. To further elucidate these aspects, identifying the native AMF and bacterial genera/species associated with each of the rootstocks under the specific soil and climate conditions of this study could be a valuable direction for future research.
5. Conclusions and Future Remarks
We conclude that high-vigor and water-use-efficient rootstocks such as 140Ru and 110R are better suited for establishing new plantations under semiarid conditions and in the context of climate change, as they showed higher early survival rates and fewer grafting issues compared to the low-vigor 161-49C. Based on multi-season monitoring, these results confirm that rootstock choice is the single most decisive factor for rapid vineyard establishment under hot-dry scenarios, with 140Ru providing the highest early shoot and leaf area and, consequently, the largest cumulative yield during the initial years. This superior performance of 140Ru is probably linked to its deeper, highly conductive root system, which improves soil water extraction and hydraulic conductance [71], thereby compensating for its slightly lower intrinsic foliar nutrient concentration through a larger total photosynthetic surface. In contrast, 161-49C (although it produces grapes with a higher quality) showed nearly 50% vine loss or severe decline by year 5, corroborating external reports that indicate that this low-vigor stock is prone to graft-take failure and early chronic decline in dry climates.
On the other hand, early microbial co-inoculation improved plant fitness in young Monastrell vines grafted onto 140Ru and 161-49C, but did not benefit vines grafted onto 110R, which exhibited a poorer overall performance under the given soil and climatic conditions. Inoculated vines on 140Ru and 161-49C developed larger canopies, higher pruning weights, and greater yields, while sustaining a better midday water status and a higher WUEyield under deficit irrigation. Conversely, inoculation slightly reduced A, Ψs, TLA, yield, and WUEyield values in 110R, suggesting a poor rootstock/microbial inoculum compatibility and a high carbohydrate-competition effect that highlights the need for a “precision inoculation” approach tailored to the AMF affinity of each of the rootstocks. Microbial inoculation also enhanced berry weight in 140Ru vines, but decreased final berry/must phenolic content. Significantly, inoculation did not alter must sugar or acidity in any of the rootstocks, and the slight drop in phenolics observed in 140Ru appears to be a dilution effect associated with larger berry size and could be counterbalanced through canopy or irrigation management.
Based on these results, the integration of microbial inoculants (such as AMF, MHB, and PGPB) into sustainable vineyard management should be approached with caution, as its effectiveness appears to depend on several factors, including the specific rootstock-microorganism interaction/affinity. Because elevated root colonization declined when annual inoculations ceased, sustained benefits would require recurring applications; therefore, the cost-to-benefit ratio must be carefully assessed.
There is also a lack of information regarding whether natural AMF/PGPB populations are sufficient to ensure adequate colonization in new vineyard plantings, as well as which factors influence their establishment. Future research should focus on long-term sustainable soil management strategies to promote native populations of beneficial fungi and bacteria already present in vineyard soils. This could include reducing pesticide use and implementing agroecological practices (such as mulching, cover cropping, and agroforestry), which not only could enhance AMF/bacterial diversity and root colonization in grapevines but also offer additional ecological services. In semiarid areas, these approaches may even prove to be more economically sustainable in the long term.
Supplementary Materials
The following supporting information can be downloaded at the website of this paper posted on Preprints.org
Author Contributions
Conceptualization: P.R., J.M.N.; methodology: P.R., J.M.N., P.B., E.I.M. A.M..; data curation: P.R., J.M.N., P.B.; formal analysis: P.R., J.M.N., P.B., E.I.M.; investigation: P.R., J.M.N., P.B.; writing - original draft preparation: P.R.; writing - review: P.R., J.M.N., P.B., A.M.; editing: J.M.N.; funding acquisition: P.R., J.M.N., P.B. All of the authors have read and agreed to the published version of the manuscript.
Funding
This research was funded by the Ministerio de Ciencia e Innovación, Agencia Estatal de Investigación through the project UPGRAPE “PID2021-123305OB-C33”, cofinanced by the European Union; and the Instituto Nacional de Investigación y Tecnología Agraria y Alimentaria (INIA, Spain), Subprograma Nacional de Recursos y Tecnologías Agrarias, through projects “FEDER 1420–13” and “FEDER 1420–24”, co-financed by the European Regional Development Fund (FEDER).
Data Availability Statement
Data will be made available upon request.
Acknowledgments
We want to thank Francisco Javier Martínez, Ana Verónica Martínez, Mariano Saura, Eva María Arques, Francisco Hernandez, Leandro Olivares, Fabian Soto, and Juan Antonio Palazón for their support in laboratory and field tasks. During the preparation of this manuscript, the authors used Microsoft Copilot (GPT-4 architecture, July 2025 version) to assist with the revision and refinement of the English language. This assistance was limited to language editing and did not involve content generation or interpretation of scientific results. The final version of the manuscript was additionally reviewed by Andrés Paredes, a professional English translator specialized in scientific texts.
Conflicts of Interest
The authors declare no conflicts of interest.
Abbreviations
The following abbreviations are used in this manuscript:
| I | inoculated |
| NI | non-inoculated |
| AMF | arbuscular mycorrhizal fungi |
| MHB | mycorrhizal helper bacteria |
| PGPR | plant growth-promoting rhizobacteria |
| PGPB | plant growth-promoting bacteria |
| DI | deficit irrigation |
| ODR | oxygen diffusion rate |
| TBI | Tea Bag Index |
| S | stabilization factor |
| k | decomposition rate constant |
| TG | total glomalin |
| Ψs | midday stem water potential |
| A | net photosynthesis rate |
| gs | stomatal conductance rate |
| E | transpiration rate |
| A/gs | intrinsic leaf water use efficiency |
| A/E | instantaneous leaf water use efficiency |
| WUEyield | productive water use efficiency |
| VPD | vapor pressure deficit |
| TLA | total leaf area |
| PW | winter pruning weight |
| SL | shoot length |
| PW | pruning weight |
| MI | maturity index |
| TA | titratable acidity |
| A520 | absorbance at 520 nm |
| CI | color index |
| SMI | seed maturity index |
| AEI | anthocyanin extractability index |
| TSS | total soluble solids |
| TPI | total polyphenol index |
References
- De Souza, R.; Ambrosini, A.; Passaglia, L.M.P. Plant growth-promoting bacteria as inoculants in agricultural soils. Genet. Mol. Bio. 2015, 38, 401–419. [Google Scholar] [CrossRef] [PubMed]
- Balestrini, R.; Sillo, F.; Boussageon, R.; Wipf, D.; Courty, P.E. The hidden side of interaction: Microbes and roots get together to improve plant resilience. J. Plant Interact. 2024, 19, 2323991. [Google Scholar] [CrossRef]
- Trouvelot, S.; Bonneau, L.; Redecker, D.; van Tuinen, D.; Adrian, M.; Wipf, D. Arbuscular mycorrhiza symbiosis in viticulture: A review. Agron. Sustain. Dev. 2015, 35, 1449–1467. [Google Scholar] [CrossRef]
- Torres, N.; Goicoechea, N.; Morales, F.; Antolín, M.C. Berry quality and antioxidant properties in Vitis vinifera cv. Tempranillo as affected by clonal variability, mycorrhizal inoculation and temperature. Crop Pasture Sci. 2016, 67, 961–977. [Google Scholar] [CrossRef]
- Torres, N.; Antolín, M.C.; Goicoechea, N. Arbuscular mycorrhizal symbiosis as a promising resource for improving berry quality in grapevines under changing environments. Front. Plant Sci. 2018, 9, 897. [Google Scholar] [CrossRef]
- Velaz, M.; Santesteban, L.G.; Torres, N. Mycorrhizae and grapevines: The known unknowns of their interaction for wine growers´ challenges. J. Exp. Bot. 2025, eraf081. [Google Scholar] [CrossRef]
- Nerva, L.; Balestrini, R.; Chitarra, W. From plant nursery to field: Persistence of mycorrhizal symbiosis balancing effects on growth-defence tradeoffs mediated by rootstock. Agronomy 2023, 13, 229. [Google Scholar] [CrossRef]
- De Corato, U. Soil microbiota manipulation and its role in suppressing soil-borne plant pathogens in organic farming systems under the light of microbiome-assisted strategies. Chem. Biol. Technol. Agric. 2020, 7, 17. [Google Scholar] [CrossRef]
- Nerva, L.; Giudice, G.; Quiroga, G.; Belfiore, N.; Lovat, L.; Perria, R.; Volpe, M.G.; Moffa, L.; Sandrini, M.; Gaiotti, F.; Balestrini, R.; Chitarra, W. Mycorrhizal symbiosis balances rootstock-mediated growth-defence tradeoffs. Biol. Fertil. Soils 2021, 58, 17–34. [Google Scholar] [CrossRef]
- Augé, R.M. Water relations, drought and vesicular-arbuscular mycorrhizal symbiosis. Mycorrhiza 2001, 11, 3–42. [Google Scholar] [CrossRef]
- Kozikova, D.; Pascual, I.; Goicoechea, N. Arbuscular mycorrhizal fungi improve the performance of Tempranillo and Cabernet Sauvignon facing water deficit under current and future climatic conditions. Plants 2024, 13, 1155. [Google Scholar] [CrossRef] [PubMed]
- Guarnizo, A.L.; Navarro-Ródenas, A.; Calvo-Polanco, M.; Marqués-Gálvez, J.E.; Morte, A. A mycorrhizal helper bacterium alleviates drought stress in mycorrhizal Helianthemum almeriense plants by regulating water relations and plant hormones. Environ. Exp. Bot. 2023, 207, 105228. [Google Scholar] [CrossRef]
- Rolli, E.; Marasco, R.; Saderi, S.; Corretto, E.; Mapelli, F.; Cherif, A.; Borin, S.; Valenti, L.; Sorlini, C.; Daffonchio, D. Root-associated bacteria promote grapevine growth: From the laboratory to the field. Plant Soil 2017, 410, 369–382. [Google Scholar] [CrossRef]
- Khabbaz, S.E.; Ladhalakshmi, D.; Babu, M.; Kandan, A.; Ramamoorthy, V.; Saravanakumar, D.; Al-Mughrabi, T.; Kandasamy, S. Plant growth promoting bacteria (PGPB)-a versatile tool for plant health management. Can. J. Pestic. Pest Manag. 2019, 1, 1–25. [Google Scholar] [CrossRef]
- Sangwan, S.; Prasanna, R. Mycorrhizae helper bacteria: Unlocking their potential as bioenhancers of plant-arbuscular mycorrhizal fungal associations. Microb. Ecol. 2022, 84, 1–10. [Google Scholar] [CrossRef]
- Camprubí, A.; Estaún, V.; Nogales, A.; García-Figueres, F.; Pitet, M.; Calvet, C. Response of the grapevine rootstock Richter 110 to inoculation with native and selected arbuscular mycorrhizal fungi and growth performance in a replant vineyard. Mycorrhiza 2008, 18, 211–216. [Google Scholar] [CrossRef]
- Rolli, E.; Marasco, R.; Vigani, G.; Ettoumi, B.; Mapelli, F.; Deangelis, M.L.; Gandolfi, C.; Casati, E.; Previtali, F.; Gerbino, R.; Cei, F.P.; Borin, S.; Sorlini, C.; Zocchi, G.; Daffonchio, D. Improved plant resistance to drought is promoted by the root-associated microbiome as a water stress-dependent trait. Environ. Microbiol. 2015, 17, 316–331. [Google Scholar] [CrossRef]
- Schreiner, R.P. Effects of native and non-native arbuscular mycorrhizal fungi on growth and nutrient uptake of ‘Pinot noir’ (Vitis vinifera L.) in two soils with contrasting levels of phosphorus. Appl. Soil Ecol. 2007, 36, 205–215. [Google Scholar] [CrossRef]
- Schreiner, R.P.; Tarara, J.M.; Smithyman, R.P. Deficit irrigation promotes arbuscular colonization of fine roots by mycorrhizal fungi in grapevines (Vitis vinifera L.) in an arid climate. Mycorrhiza, 2007, 17, 551–562. [Google Scholar] [CrossRef]
- Schreiner, R.P.; Moyer, M.M.; East, K.E.; Zasada, I.A. Managing arbuscular mycorrhizal fungi in arid Columbia Basin vineyards of the Pacific Northwest United States. Am. J. Enol. Viticult. 2023, 74, 1–11. [Google Scholar] [CrossRef]
- Holland, T.C.; Bowen, P.; Bogdanoff, C.; Hart, M.M. How distinct are arbuscular mycorrhizal fungal communities associating with grapevines? Biol. Fertil. Soils 2014, 50, 667–674. [Google Scholar] [CrossRef]
- Darriaut, R.; Antonielli, L.; Martins, G.; Ballestra, P.; Vivin, P.; Marguerit, E.; Mitter, B.; Masneuf-Pomarède, I.; Compant, S.; Ollat, N.; Lauvergeat, V. Soil composition and rootstock genotype drive the root associated microbial communities in young grapevines. Front. Microbiol. 2022, 13, 1031064. [Google Scholar] [CrossRef] [PubMed]
- Lailheugue, V.; Darriaut, R.; Tran, J.; Morel, M.; Marguerit, E.; Lauvergeat, V. Both the scion and rootstock of grafted grapevines influence the rhizosphere and root endophyte microbiomes, but rootstocks have a greater impact. Environ. Microbiome. 2024, 19, 24. [Google Scholar] [CrossRef] [PubMed]
- Torres, N.; Yu, R.; Kurtural, S.K. Arbuscular mycrorrhizal fungi inoculation and applied water amounts modulate the response of young grapevines to mild water stress in a hyper-arid season. Front. Plant Sci. 2021, 11, 622209. [Google Scholar] [CrossRef]
- Niem, J.M.; Billones-Baaijens, R.; Stodart, B.; Savocchia, S. Diversity profiling of grapevine microbial endosphere and antag-onistic potential of endophytic pseudomonas against grapevine trunk diseases. Front Microbiol. 2020, 11, 1–19. [Google Scholar] [CrossRef]
- Petit, E.; Gubler, W.D. Influence of Glomus intraradices on Black foot disease caused by Cylindrocarpon macrodidymum on Vitis rupestris under controlled conditions. Plant Dis. 2006, 90, 1481–1484. [Google Scholar] [CrossRef]
- Li, H.Y.; Yang, G.D.; Shu, H.R.; Yang, Y.T.; Ye, B.X.; Nishida, I.; Zheng, C.C. Colonization by the arbuscular mycorrhizal fungus Glomus versiforme induces a defense response against the root-knot nematode Meloidogyne incognita in the grapevine (Vitis amurensis Rupr.), which includes transcriptional activation of the class III chitinase gene VCH3. Plant Cell Physiol. 2006, 47, 154–163. [Google Scholar] [CrossRef]
- Giovannini, L.; Pagliarani, C.; Moine, A.; Giannetti, G.; Carra, A.; Nerva, L.; Chitarra, W.; Gambino, G.; Sbrana, C.; Balestrini, R. The impact of the symbiont genotype on the effect of arbuscular mycorrhizal symbiosis on grapevine growth and physiology. Plant Biosyst. 2025, 1–13. [Google Scholar] [CrossRef]
- Pandian, K.; Samiyappan, K.; Rangasamy, A.; Raju, I.; Chitraputhirapillai, S.; Bose, J. Bacillus megaterium-embedded organo biochar phosphorous fertilizer improves soil microbiome and nutrient availability to enhance black gram (Vigna mungo L) growth and yield. Soil Sc. Plant Nutr. 2024, 24, 2048–2063. [Google Scholar] [CrossRef]
- Zhao, Y.; Zhang, M.; Yang, W.; Di, H.J.; Ma, L.; Liu, W.; Li, B. Effects of microbial inoculants on phosphorus and potassium availability, bacterial community composition, and chili pepper growth in a calcareous soil: A greenhouse study. J. Soils Sediments. 2019, 19, 3597–3607. [Google Scholar] [CrossRef]
- Navarro-Ródenas, A.; Berná, L.M.; Lozano-Carrillo, C.; Andrino, A.; Morte, A. Beneficial native bacteria improve survival and mycorrhization of desert truffle mycorrhizal plants in nursery conditions. Mycorrhiza. 2016, 26, 769–779. [Google Scholar] [CrossRef] [PubMed]
- Phillips, J.M.; Hayman, D.S. Improved procedures for clearing roots and staining parasitic and vesicular-arbuscular mycorrhizal fungi for rapid assessment of infection. Trans. Br. Mycol. Soc. 1970, 55, 158–161. [Google Scholar] [CrossRef]
- McGonigle, T.P.; Miller, M.H.; Evans, D.G.; Fairchild, G.L.; Swan, J.A. A new method which gives an objective measure of colonization of roots by vesicular-arbuscular mycorrhizal fungi. New Phytol. 1990, 115, 495–501. [Google Scholar] [CrossRef] [PubMed]
- Han, X.; Xu, C.; Wang, Y.; Huang, D.; Fan, Q.; Xin, G.; Müller, C. Dynamics of arbuscular mycorrhizal fungi in relation to root colonization, spore density, and soil properties among different spreading stages of the exotic plant three flower beggarweed (Desmodium triflorum)in a Zoysia tenuifolia lawn. Weed Science. 2019, 67, 730–742. [Google Scholar] [CrossRef]
- Sharma, K.; Singh, M.; Srivastava, D.K.; Singh, P.K. Exploring the diversity, root colonization, and morphology of arbuscular mycorrhizal fungi in Lamiaceae. J. Basic Microbiol. 2025, 65, e2400379. [Google Scholar] [CrossRef]
- Gerdemann, J.W.; Nicolson, T.H. Spores of mycorrhizal Endogone species extracted from soil by wet sieving and decanting. Trans. Br. Mycol. Soc. 1963, 46, 235–244. [Google Scholar] [CrossRef]
- Wright, S.F.; Upadhayaya, A. A survey of soils for aggregate stability and glomalin, a glycoprotein produced by hyphae of arbuscular mycorrhizal fungi. Plant Soil. 1998, 198, 97–107. [Google Scholar] [CrossRef]
- Keuskamp, J.A.; Dingemans, B.J.J.; Lehtinen, T.; Sameel, J.M.; Hefting, M.M. Tea Bag Index: A novel approach to collect uniform decomposition data across ecosystems. Methods Ecol. Evol. 2013, 4, 1070–1075. [Google Scholar] [CrossRef]
- Romero, P.; Botía, P.; Navarro, J.M. Selecting rootstocks to improve vine performance and vineyard sustainability in deficit irrigated Monastrell grapevines under semiarid conditions. Agric. Water Manag. 2018, 209, 73–93. [Google Scholar] [CrossRef]
- Romero, P.; Gil-Muñoz, R.; del Amor, F.; Valdés, E.; Fernández-Fernández, J.I.; Martínez-Cutillas, A. Regulated deficit irrigation based upon optimum water status improves phenolic composition in Monastrell grapes and wines. Agric. Water Manag. 2013, 121, 85–101. [Google Scholar] [CrossRef]
- Saint-Cricq, N.; Vivas, N.; Glories, Y. Maturité phénolique: D´efinition et contrôle. Rev. Fr. d’Oenolog. 1998, 173, 22–25. [Google Scholar]
- Ribéreau-Gayon, P.; Glories, Y.; Maujean, A.; Dubourdied, D. Handbook of Enology Vol 2: The Chemistry of Wine and Stabilization and Treatments; 3rd ed.; John Wiley & Sons, Ltd.: Chichester, UK, 2006; p. 441.
- Wooldridge, J.; Louw, P.J.E.; Conradie, W.J. Effects of rootstock on grapevine performance, petiole and must composition, and overall wine score of Vitis vinifera cv. Chardonnay and Pinot noir. S. Afr. J. Enol. Vitic. 2010, 31, 45–48. [Google Scholar] [CrossRef]
- Santesteban, L.G.; Rekarte, I.; Torres, N.; Galar, M.; Villa-Llop, A.; Visconti, F.; Intrigliolo, D.S.; Escalona, J.M.; Herralde, F.; Miranda, C. The role of rootstocks for grape growing adaptation to climate change. Meta-analysis of the research conducted in Spanish viticulture. OENOone 2023, 57, 283–290. [Google Scholar] [CrossRef]
- Romero, P.; Botía, P.; Morote, E.; Navarro, J.M. Optimizing deficit irrigation in Monastrell vines grafted on rootstocks of different vigour under semiarid conditions. Agric. Water Manag. 2024, 292, 108669. [Google Scholar] [CrossRef]
- Lovisolo, C.; Lavoie-Lamoureux, A.; Tramontini, S.; Ferrandino, A. Grapevine adaptations to water stress: New perspectives about soil/plant interactions. Theor. Exp. Plant Physiol. 2016, 28, 53–66. [Google Scholar] [CrossRef]
- Tramontini, S.; van Leeuwen, C.; Domec, J.C.; Destrac-irvine, A.; Basteau, C.; Vitali, M.; Mosbach-Schulz, O.; Lovisolo, C. Impact of soil texture and water availability on the hydraulic control of plant and grape-berry development. Plant Soil 2013, 368, 215–230. [Google Scholar] [CrossRef]
- Pou, A.; Rivacoba, L.; Portu, J.; Mairata, A.; Labarga, D.; García-Escudero, E.; Martín, I. How rootstocks impact the scion vigour and vine performance of Vitis vinifera L. cv. Tempranillo. Aust. J. Grape Wine Res. 2022, 2022, 9871347. [Google Scholar] [CrossRef]
- Navarro, J.M.; Botía, P.; Romero, P. Changes in berry tissues in Monastrell grapevines grafted on different rootstocks and their relationship with berry and wine phenolic content. Plants. 2021, 10, 2585. [Google Scholar] [CrossRef]
- Spilmont, A.S.; Sereno, C.; El khoti, N.; Torregrosa, L. The decline of the young vines grafted onto 161-49C. Acta Hortic. 2016, 1136, 251–264. [Google Scholar] [CrossRef]
- Berdeja, M.P.; Reynolds, N.K.; Pawlowska, T.; Vanden Heuvel, J.E. Commercial bioinoculants improve colonization but do not alter the arbuscular mycorrhizal fungal community of greenhouse-grown grapevine roots. Environ. Microbiome 2025, 20, 15. [Google Scholar] [CrossRef]
- Zhang, Z.; Mallik, A.; Zhang, J.; Huang, Y.; Zhou, L. Effects of arbuscular mycorrhizal fungi on inoculated seedling growth and rhizosphere soil aggregates. Soil Tillage Res. 2019, 194, 104340. [Google Scholar] [CrossRef]
- Nicolás, E.; Maestre-Valero, J.F.; Alarcón, J.J.; Pedrero, F.; Vicente-Sánchez, J.; Bernabé, A.; Gómez-Montiel, J.A.; Hernández, J.A.; Fernández, F. Effectiveness and persistence of arbuscular mycorrhizal fungi on the physiology, nutrient uptake and yield of Crimson seedless grapevine. J. Agric. Sci. 2015, 153, 1084–1096. [Google Scholar] [CrossRef]
- Alarcón, A.; González-Chávez, M.C.; Ferrera-Cerrato, R.; Villegas-Monter, A. Inoculación de hongos micorrízicos vesículo arbusculares en vid y piña obtenidos por cultivo in vitro. In: Avances de Investigación Área de Microbiología de Suelos, Pérez, J.M. Ferrera Cerrato, R., Eds.; PROEDAF-Instituto de Recursos Naturales, Colegio de Postgraduados, Montecillo, México. 1993 pp. 113–122.
- González-Chávez, M.C. Biotecnología de la micorriza en la fruticultura. In Memorias del XIII Curso Internacional de Actualización frutícola. Fruticultura, Sostenibilidad y Diversidad, Tonatico, México, 2000.
- Rillig, M.C.; Mummey, D.L. Mycorrhizas and soil structure. New Phytol. 2006, 171, 41–53. [Google Scholar] [CrossRef]
- Leifheit, E.F.; Veresoglou, S.D.; Lehmann, A.; Morris, E.K.; Rillig, M.C. Multiple factors influence the role of arbuscular mycorrhizal fungi in soil aggregation—A meta-analysis. Plant Soil 2014, 374, 523–537. [Google Scholar] [CrossRef]
- Bitterlich, M.; Sandmann, M.; Graefe, J. Arbuscular mycorrhiza improves substrate hydraulic conductivity in tomato by altering pore connectivity. Front. Plant Sci. 2018, 9, 301. [Google Scholar] [CrossRef]
- Hao, J.; Cui, B.; Liu, B.; Wu, Y.; Zhang, C. Effects of biochar and arbuscular mycorrhizal fungi on winter wheat growth and soil N2O emissions in different phosphorus environments. Front. Plant Sci. 2022, 13, 1069627. [Google Scholar] [CrossRef] [PubMed]
- Ganugi, P.; Soverini, M.; Di Lorenzo, M.; Fiorini, A.; Tittarelli, A. A 3-year application of different mycorrhiza-based plant biostimulants distinctively modulates photosynthetic performance, leaf metabolism, and fruit quality in grapes (Vitis vinifera L.). Front. Plant Sci. 2023, 14, 1236199. [Google Scholar] [CrossRef] [PubMed]
- Aguilera, P.; Barra, P.J.; Pollak, B.; Varela, S. Application of arbuscular mycorrhizal fungi in vineyards: Water and biotic stress under a climate change scenario. Front. Microbiol. 2022, 13, 826571. [Google Scholar] [CrossRef]
- MacDonald, E.; Martin, E.; Brummell, M.E.; Bieniada, A.; Elliott, J.; Engering, A.; Tasha-Leigh, G.; Saraswati, S.; Touchette, S.; Turmel-Courchesne, L.; Strack, M. Using the Tea Bag Index to characterize decomposition rates in restored peatlands. Boreal Environ. Res. 2018, 23, 221–235. https://hdl.handle.net/1959.11/29406.
- Moukarzel, R.; Ridgway, H.J.; Waller, L.; Guerin-Laguette, A.; Cripps-Guazzone, N.; Jones, E.E. Soil arbuscular mycorrhizal fungal communities differentially affect growth and nutrient uptake by grapevine rootstocks. Microb. Ecol. 2023, 86, 1035–1049. [Google Scholar] [CrossRef]
- Antolín, M.C.; Izurdiaga, D.; Urmeneta, L.; Pascual, I.; Irigoyen, J.J.; Goicoechea, N. Dissimilar responses of ancient grapevines recovered in Navarra (Spain) to arbuscular mycorrhizal symbiosis in terms of berry quality. Agronomy. 2020, 10, 473. [Google Scholar] [CrossRef]
- Berdeja, M.P.; Ye, Q.; Bauerle, T.L.; Vanden Heuvel, J.E. Commercial bioinoculants increase root length colonization and improve petiole nutrient concentration of field-grown grapevines. HortTechnology. 2023, 33, 48–58. [Google Scholar] [CrossRef]
- Nogales, A.; Santos, E.S.; Abreu, M.M.; Arán, D.; Victorino, G.; Pereira, H.S.; Lopez, C.M.; Viegas, W. Mycorrhizal inoculation differentially affects grapevine’s performance in copper contaminated and non-contaminated soils. Front. Plant Sci. 2019, 9, 1906. [Google Scholar] [CrossRef]
- Balestrini, R.; Salvioli, A.; Dal Molin, A.; Novero, M.; Gabelli, G.; Paparelli, E.; Marroni, F.; Bonfante, P. Impact of an arbuscular mycorrhizal fungus versus a mixed microbial inoculum on the transcriptome reprogramming of grapevine roots. Mycorrhiza. 2017, 27, 417–430. [Google Scholar] [CrossRef] [PubMed]
- Bruisson, S.; Maillot, P.; Schellenbaum, P.; Walter, B.; Gindro, K.; DeglèneBenbrahim, L. Arbuscular mycorrhizal symbiosis stimulates key genes of the phenylpropanoid biosynthesis and stilbenoid production in grapevine leaves in response to downy mildew and grey mould infection. Phytochemistry. 2016, 131, 92–99. [Google Scholar] [CrossRef] [PubMed]
- Moukarzel, R.; Ridgway, H.J.; Gurein-Laguette, A.; Jones, E.E. Grapevine rootstocks drive the community structure of arbuscular mycorrhizal fungi in New Zealand vineyards. J. Appl. Microbiol. 2021, 131, 2941–2956. [Google Scholar] [CrossRef]
- Marastoni, L.; Lucini, L.; Miras-Moreno, B.; Marco Trevisan, M.; Sega, D.; Zamboni, A.; Varanini, Z. Changes in physiological activities and root exudation profile of two grapevine rootstocks reveal common and specific strategies for Fe acquisition. Sci. Rep. 2020, 10, 18839. [Google Scholar] [CrossRef]
- Romero, P.; Navarro, J.M.; Pérez-Pérez, J.G.; Dodd, I.C.; Antolinos, V.; Josefa López, J.; del Amor, S.F.; Morote, E.I.; Botía, P. The rootstock imparts different drought tolerance strategies in long-term field-grown deficit irrigated grapevines. Sci. Hortic. 2025, 346, 114167. [Google Scholar] [CrossRef]
Figure 1.
Photographs showing various aspects of the experiment conducted between 2017 and 2023 on a newly established vineyard of the Monastrell variety. The study evaluated the effects of different rootstocks (140Ru, 110R, and 161-49C) under varying conditions of mycorrhization. Field microbial inoculation directly into the planting hole (A); plantlets at the beginning of the experiment in 2017–2018 (B); optical microscopy images showing the state of mycorrhization (C); Monastrell plants grafted onto the three studied rootstocks at the start of the experiment (D); various parameters explored during the experiment, including soil and plant gas exchange measurements, monitoring of organic matter degradation, root system sampling, yield control, and grape sampling for quality analysis (E); and the general condition of the vines and clusters of inoculated and non-inoculated vines grafted onto different rootstocks just before harvest (F).
Figure 1.
Photographs showing various aspects of the experiment conducted between 2017 and 2023 on a newly established vineyard of the Monastrell variety. The study evaluated the effects of different rootstocks (140Ru, 110R, and 161-49C) under varying conditions of mycorrhization. Field microbial inoculation directly into the planting hole (A); plantlets at the beginning of the experiment in 2017–2018 (B); optical microscopy images showing the state of mycorrhization (C); Monastrell plants grafted onto the three studied rootstocks at the start of the experiment (D); various parameters explored during the experiment, including soil and plant gas exchange measurements, monitoring of organic matter degradation, root system sampling, yield control, and grape sampling for quality analysis (E); and the general condition of the vines and clusters of inoculated and non-inoculated vines grafted onto different rootstocks just before harvest (F).
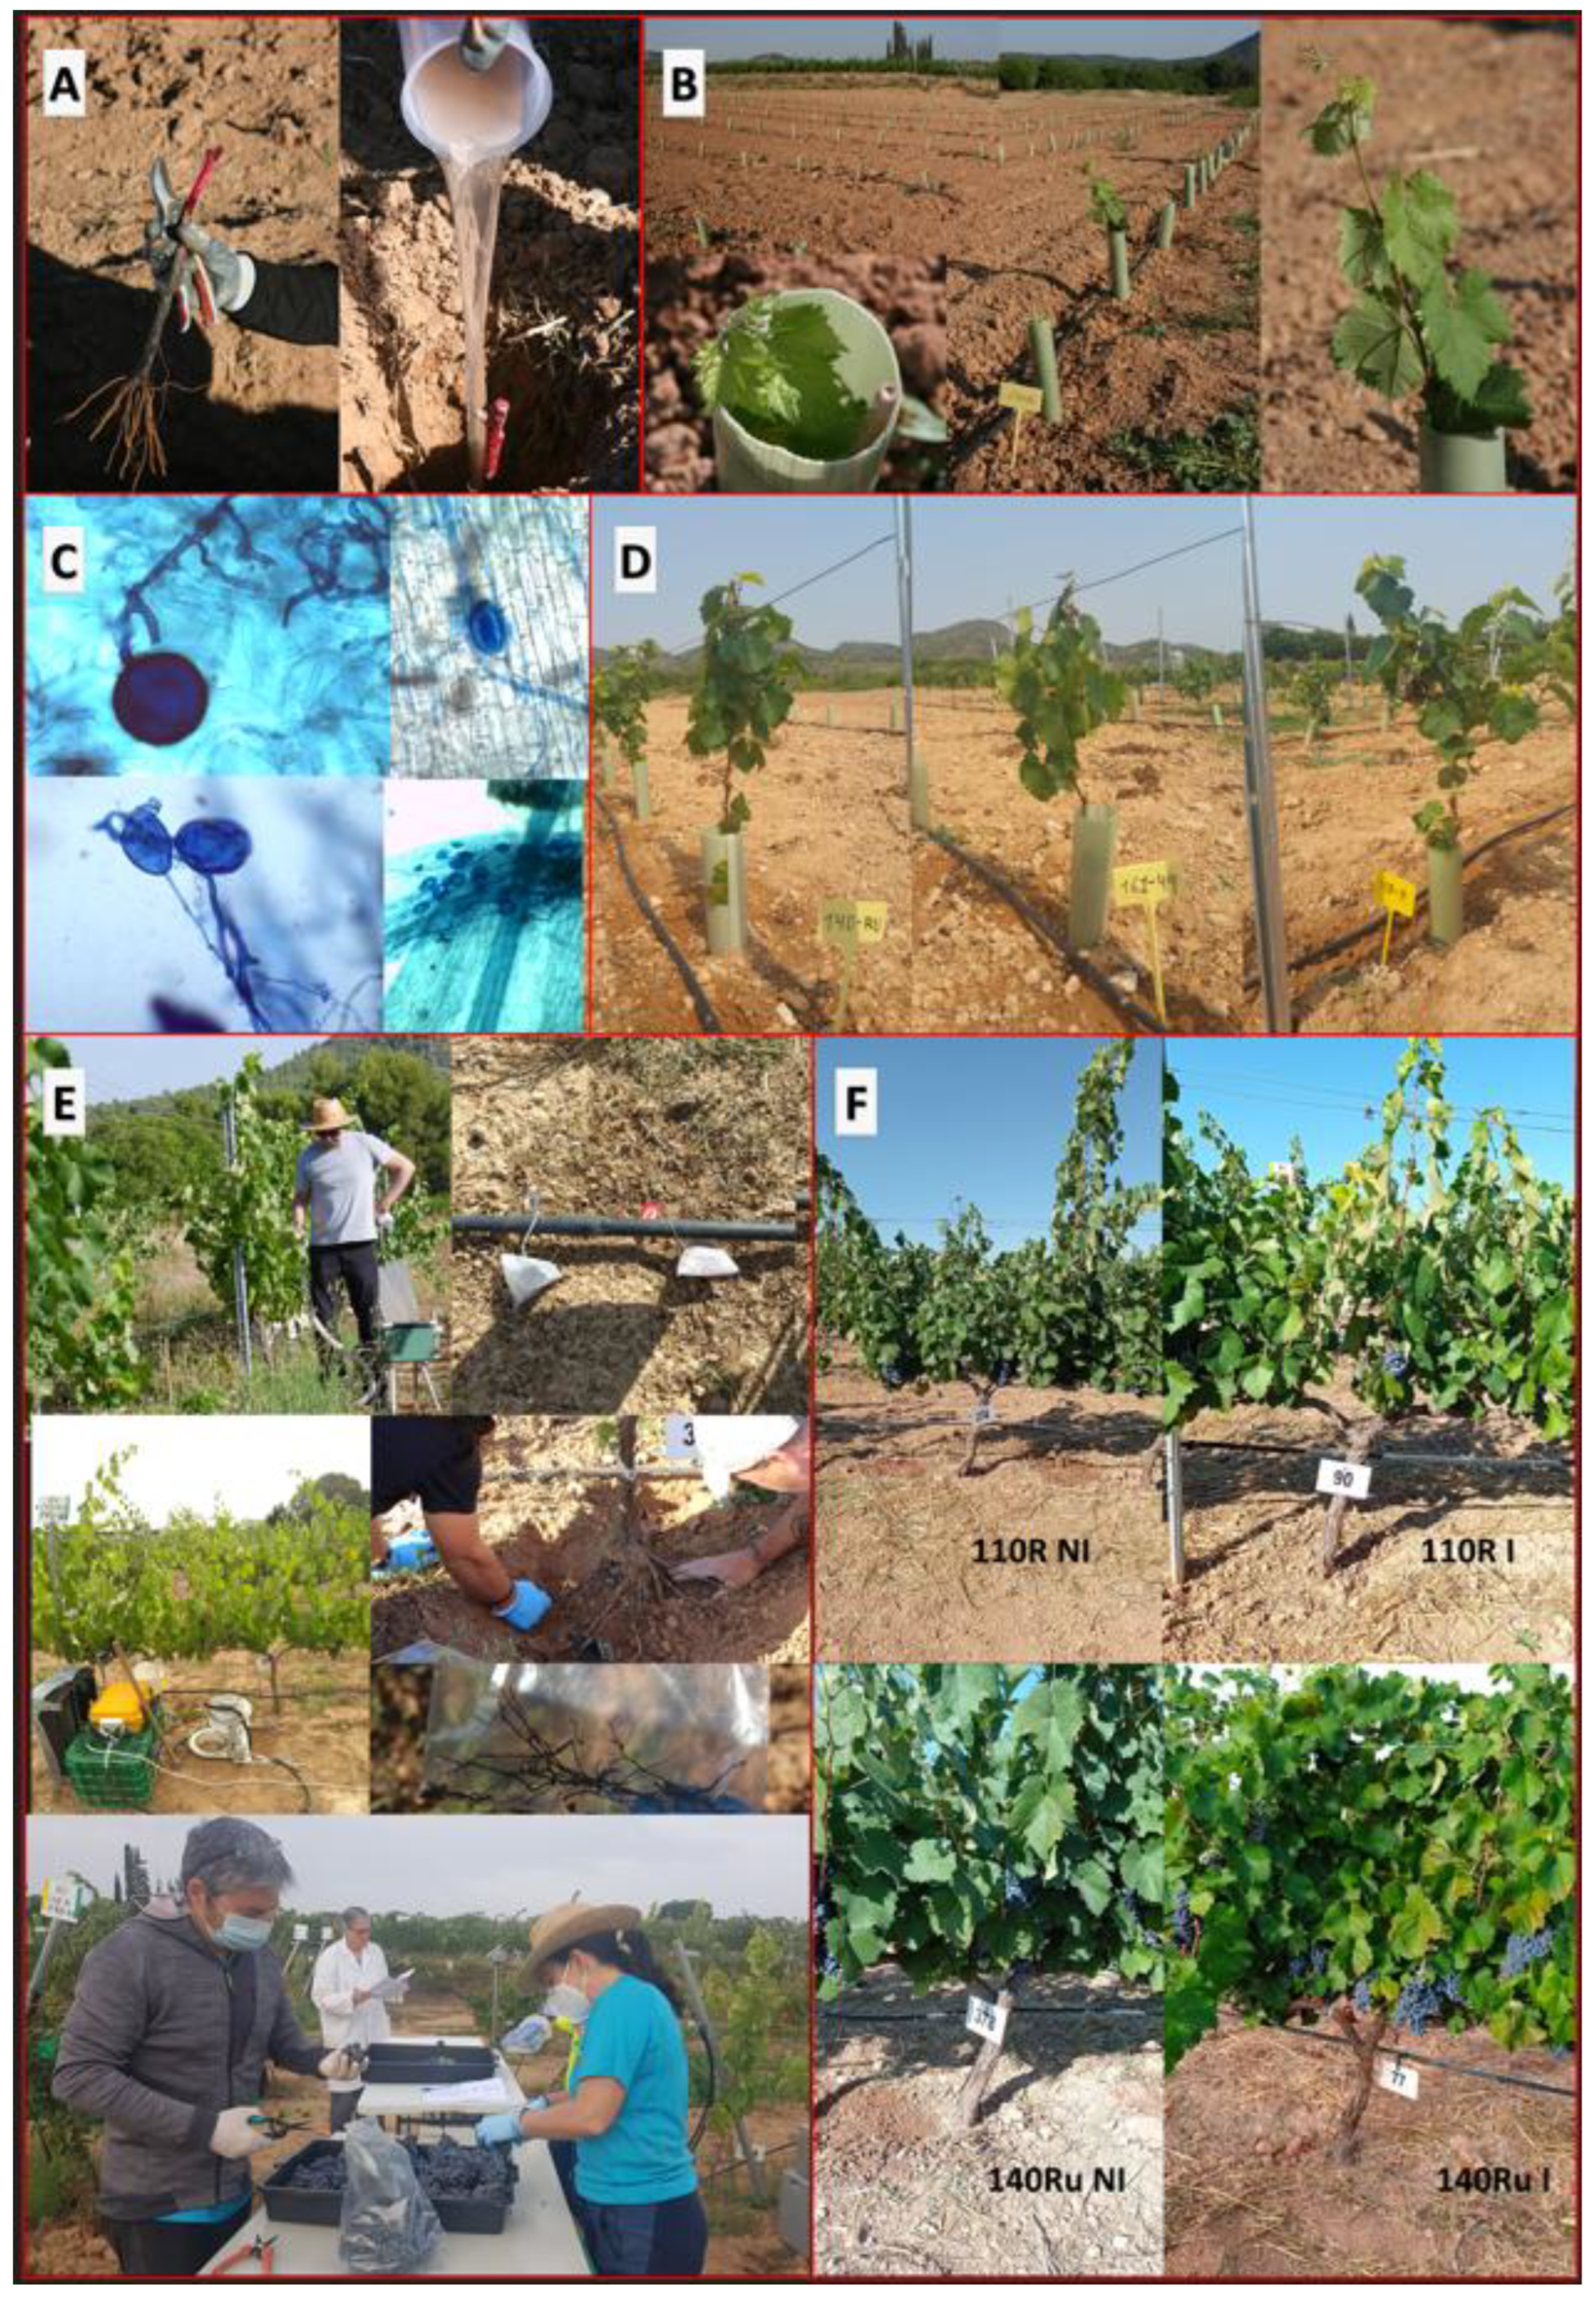
Figure 2.
Detailed timeline of the field experiment showing applied treatments and specific sampling events. Dashed lines represent microbial inoculations: inoculation with the AMF Rhizophagus irregularis (4500, 800, and 4900 propagules plant−1), the AMF Glomus iranicum var. tenuihypharum (4800 propagules plant−1), the MHB Pseudomonas mandelii strain 29 (9.8·108 CFU plant−1), and the PGPR Bacillus megaterium (7.0·107 CFU plant−1). Vertical arrows indicate moments of root and soil sampling for various microbiological and root colonization analyses. The photographs visually illustrate the experimental phases: initial soil preparation, treatment applications, and inoculations (left); intermediate vegetative growth and sampling during crop development (center); final sampling, detailed root samples, microscopic observation of symbiotic structures, and final crop development (right).The commercial microbial inocula from Mycosoil and Mycostar (Agrogenia Biotech S.L.) and Mycoup (Symborg) were chosen based on their composition of AMF species typical of an area in the Region of Murcia, as well as on their previous successful application in other crops in the southeastern Spanish Mediterranean region. The last commercial AMF inoculum that was used (R. irregularis) also contained PGPB (B. megaterium), which solubilizes nutrients such as P and K [29,30]. In addition, the MHB (P. mandelii strain 29) had also been isolated and tested by the University of Murcia as a phosphorus solubilizer that promotes mycorrhizal colonization [12,31].
Figure 2.
Detailed timeline of the field experiment showing applied treatments and specific sampling events. Dashed lines represent microbial inoculations: inoculation with the AMF Rhizophagus irregularis (4500, 800, and 4900 propagules plant−1), the AMF Glomus iranicum var. tenuihypharum (4800 propagules plant−1), the MHB Pseudomonas mandelii strain 29 (9.8·108 CFU plant−1), and the PGPR Bacillus megaterium (7.0·107 CFU plant−1). Vertical arrows indicate moments of root and soil sampling for various microbiological and root colonization analyses. The photographs visually illustrate the experimental phases: initial soil preparation, treatment applications, and inoculations (left); intermediate vegetative growth and sampling during crop development (center); final sampling, detailed root samples, microscopic observation of symbiotic structures, and final crop development (right).The commercial microbial inocula from Mycosoil and Mycostar (Agrogenia Biotech S.L.) and Mycoup (Symborg) were chosen based on their composition of AMF species typical of an area in the Region of Murcia, as well as on their previous successful application in other crops in the southeastern Spanish Mediterranean region. The last commercial AMF inoculum that was used (R. irregularis) also contained PGPB (B. megaterium), which solubilizes nutrients such as P and K [29,30]. In addition, the MHB (P. mandelii strain 29) had also been isolated and tested by the University of Murcia as a phosphorus solubilizer that promotes mycorrhizal colonization [12,31].
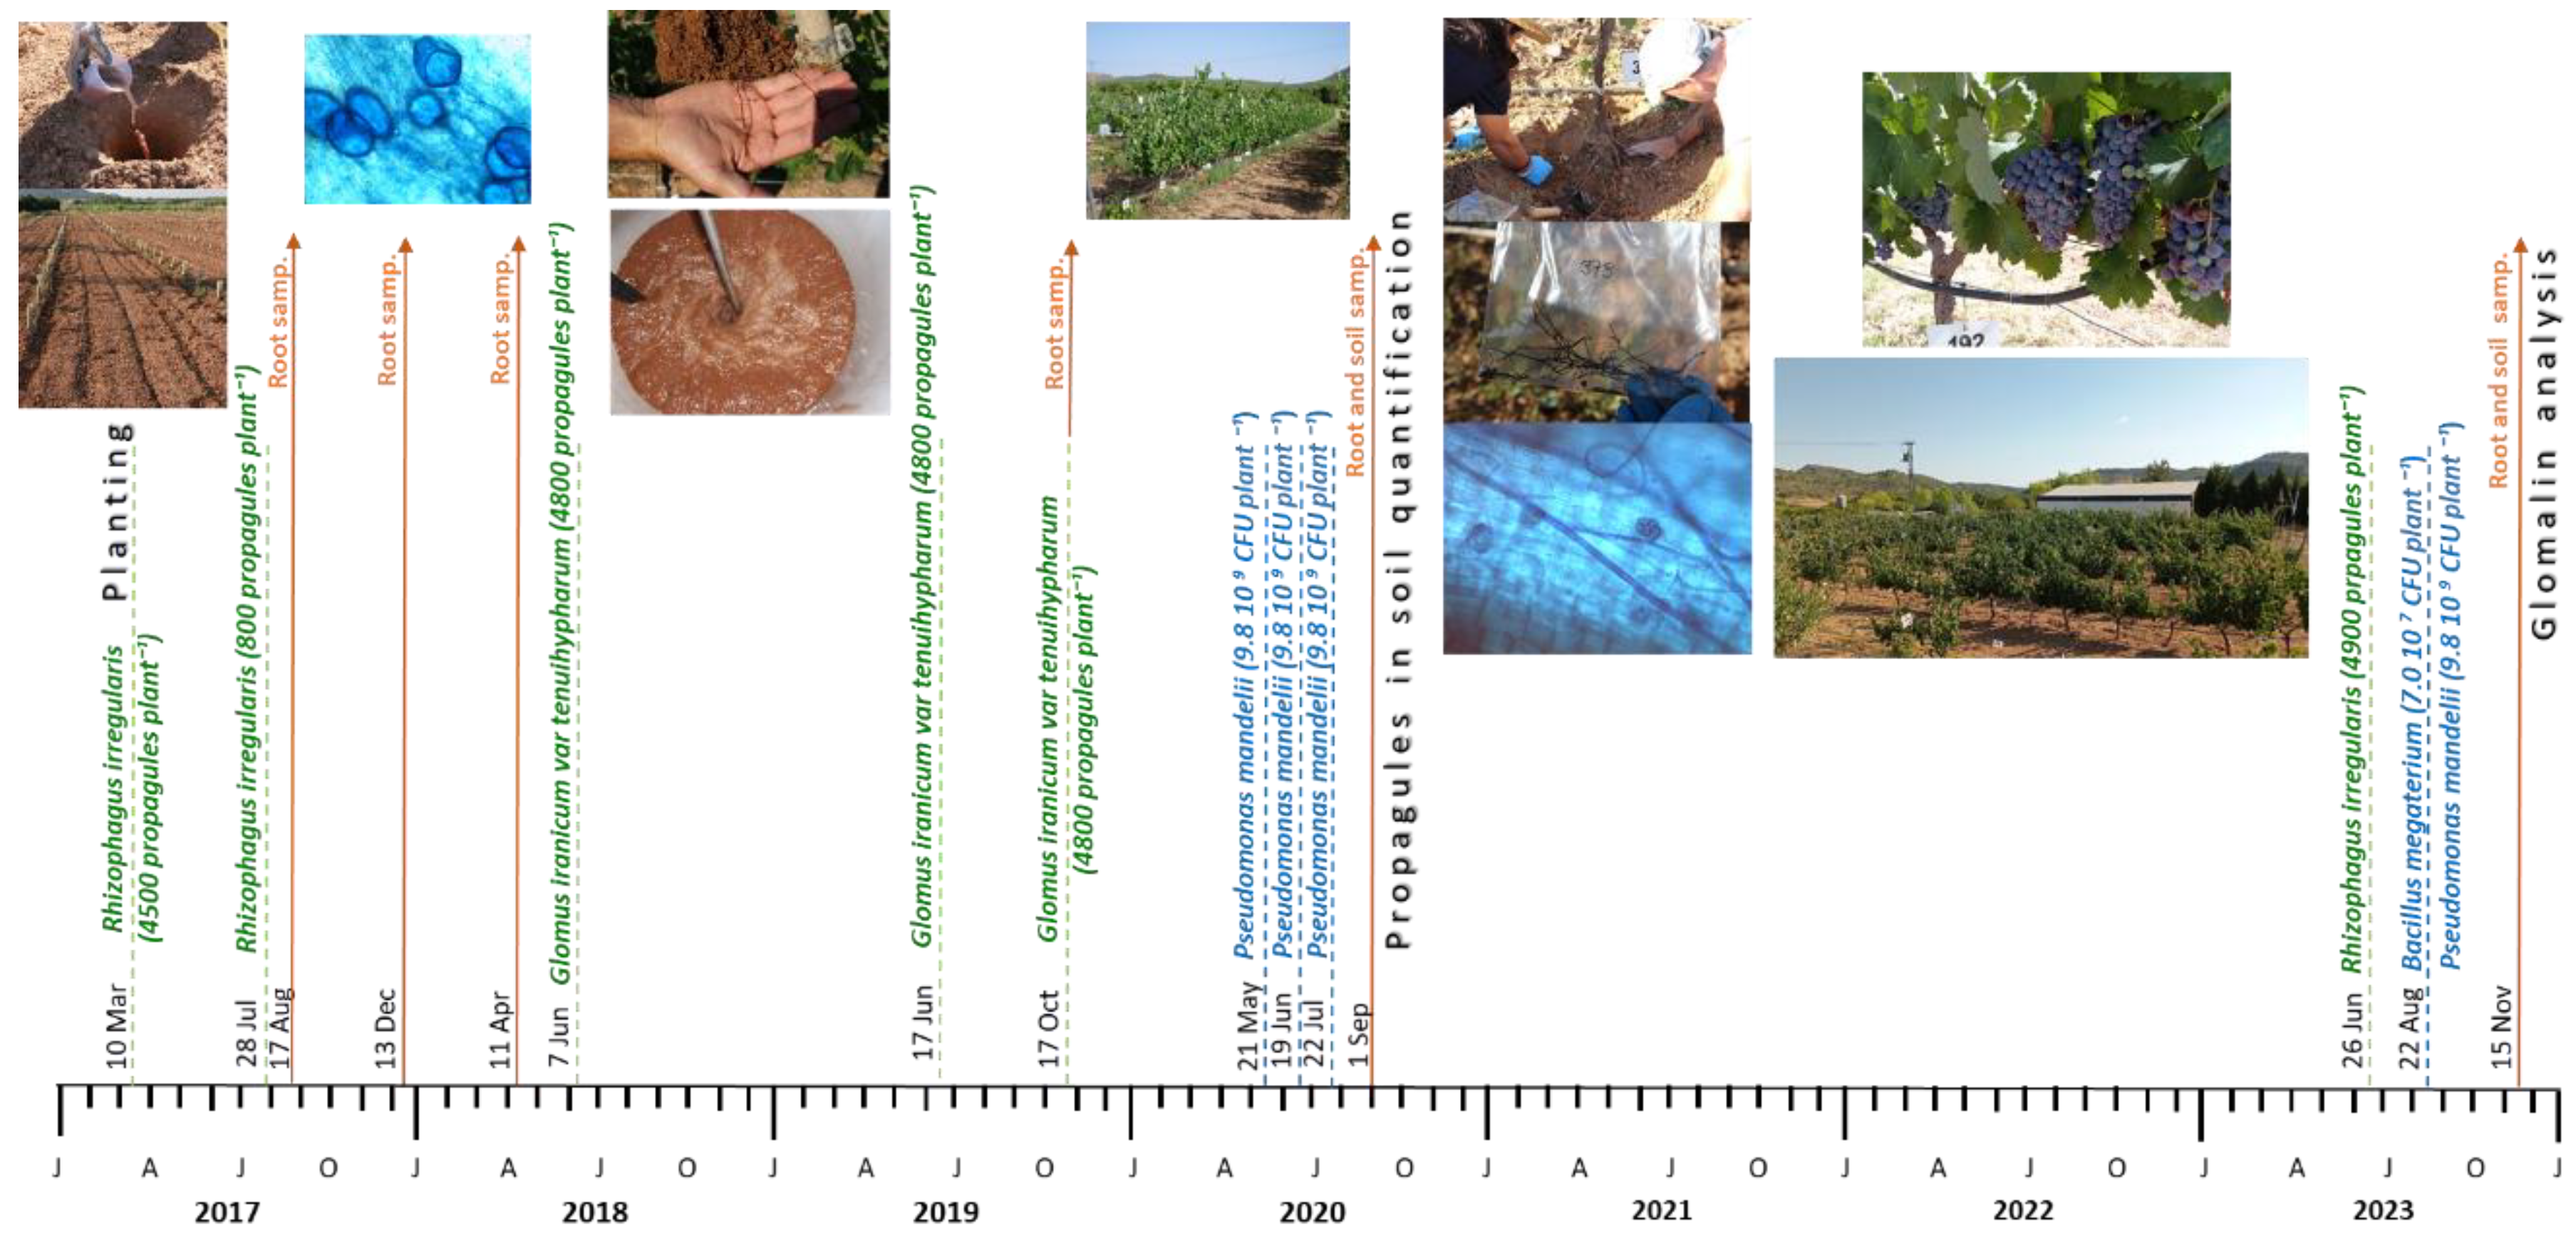
Figure 3.
Evolution of the percentage of root mycorrhization in Monastrell vines grafted onto three different rootstocks (140Ru, 110R, and 161-49C) during the experimental period (2017–2023). Colored bars represent the average percentage of mycorrhization for each of the rootstocks during the 2017–2020 period. Vertical lines represent the times of the AMF (green) and MHB (violet) inoculations. ns, not significant.
Figure 3.
Evolution of the percentage of root mycorrhization in Monastrell vines grafted onto three different rootstocks (140Ru, 110R, and 161-49C) during the experimental period (2017–2023). Colored bars represent the average percentage of mycorrhization for each of the rootstocks during the 2017–2020 period. Vertical lines represent the times of the AMF (green) and MHB (violet) inoculations. ns, not significant.
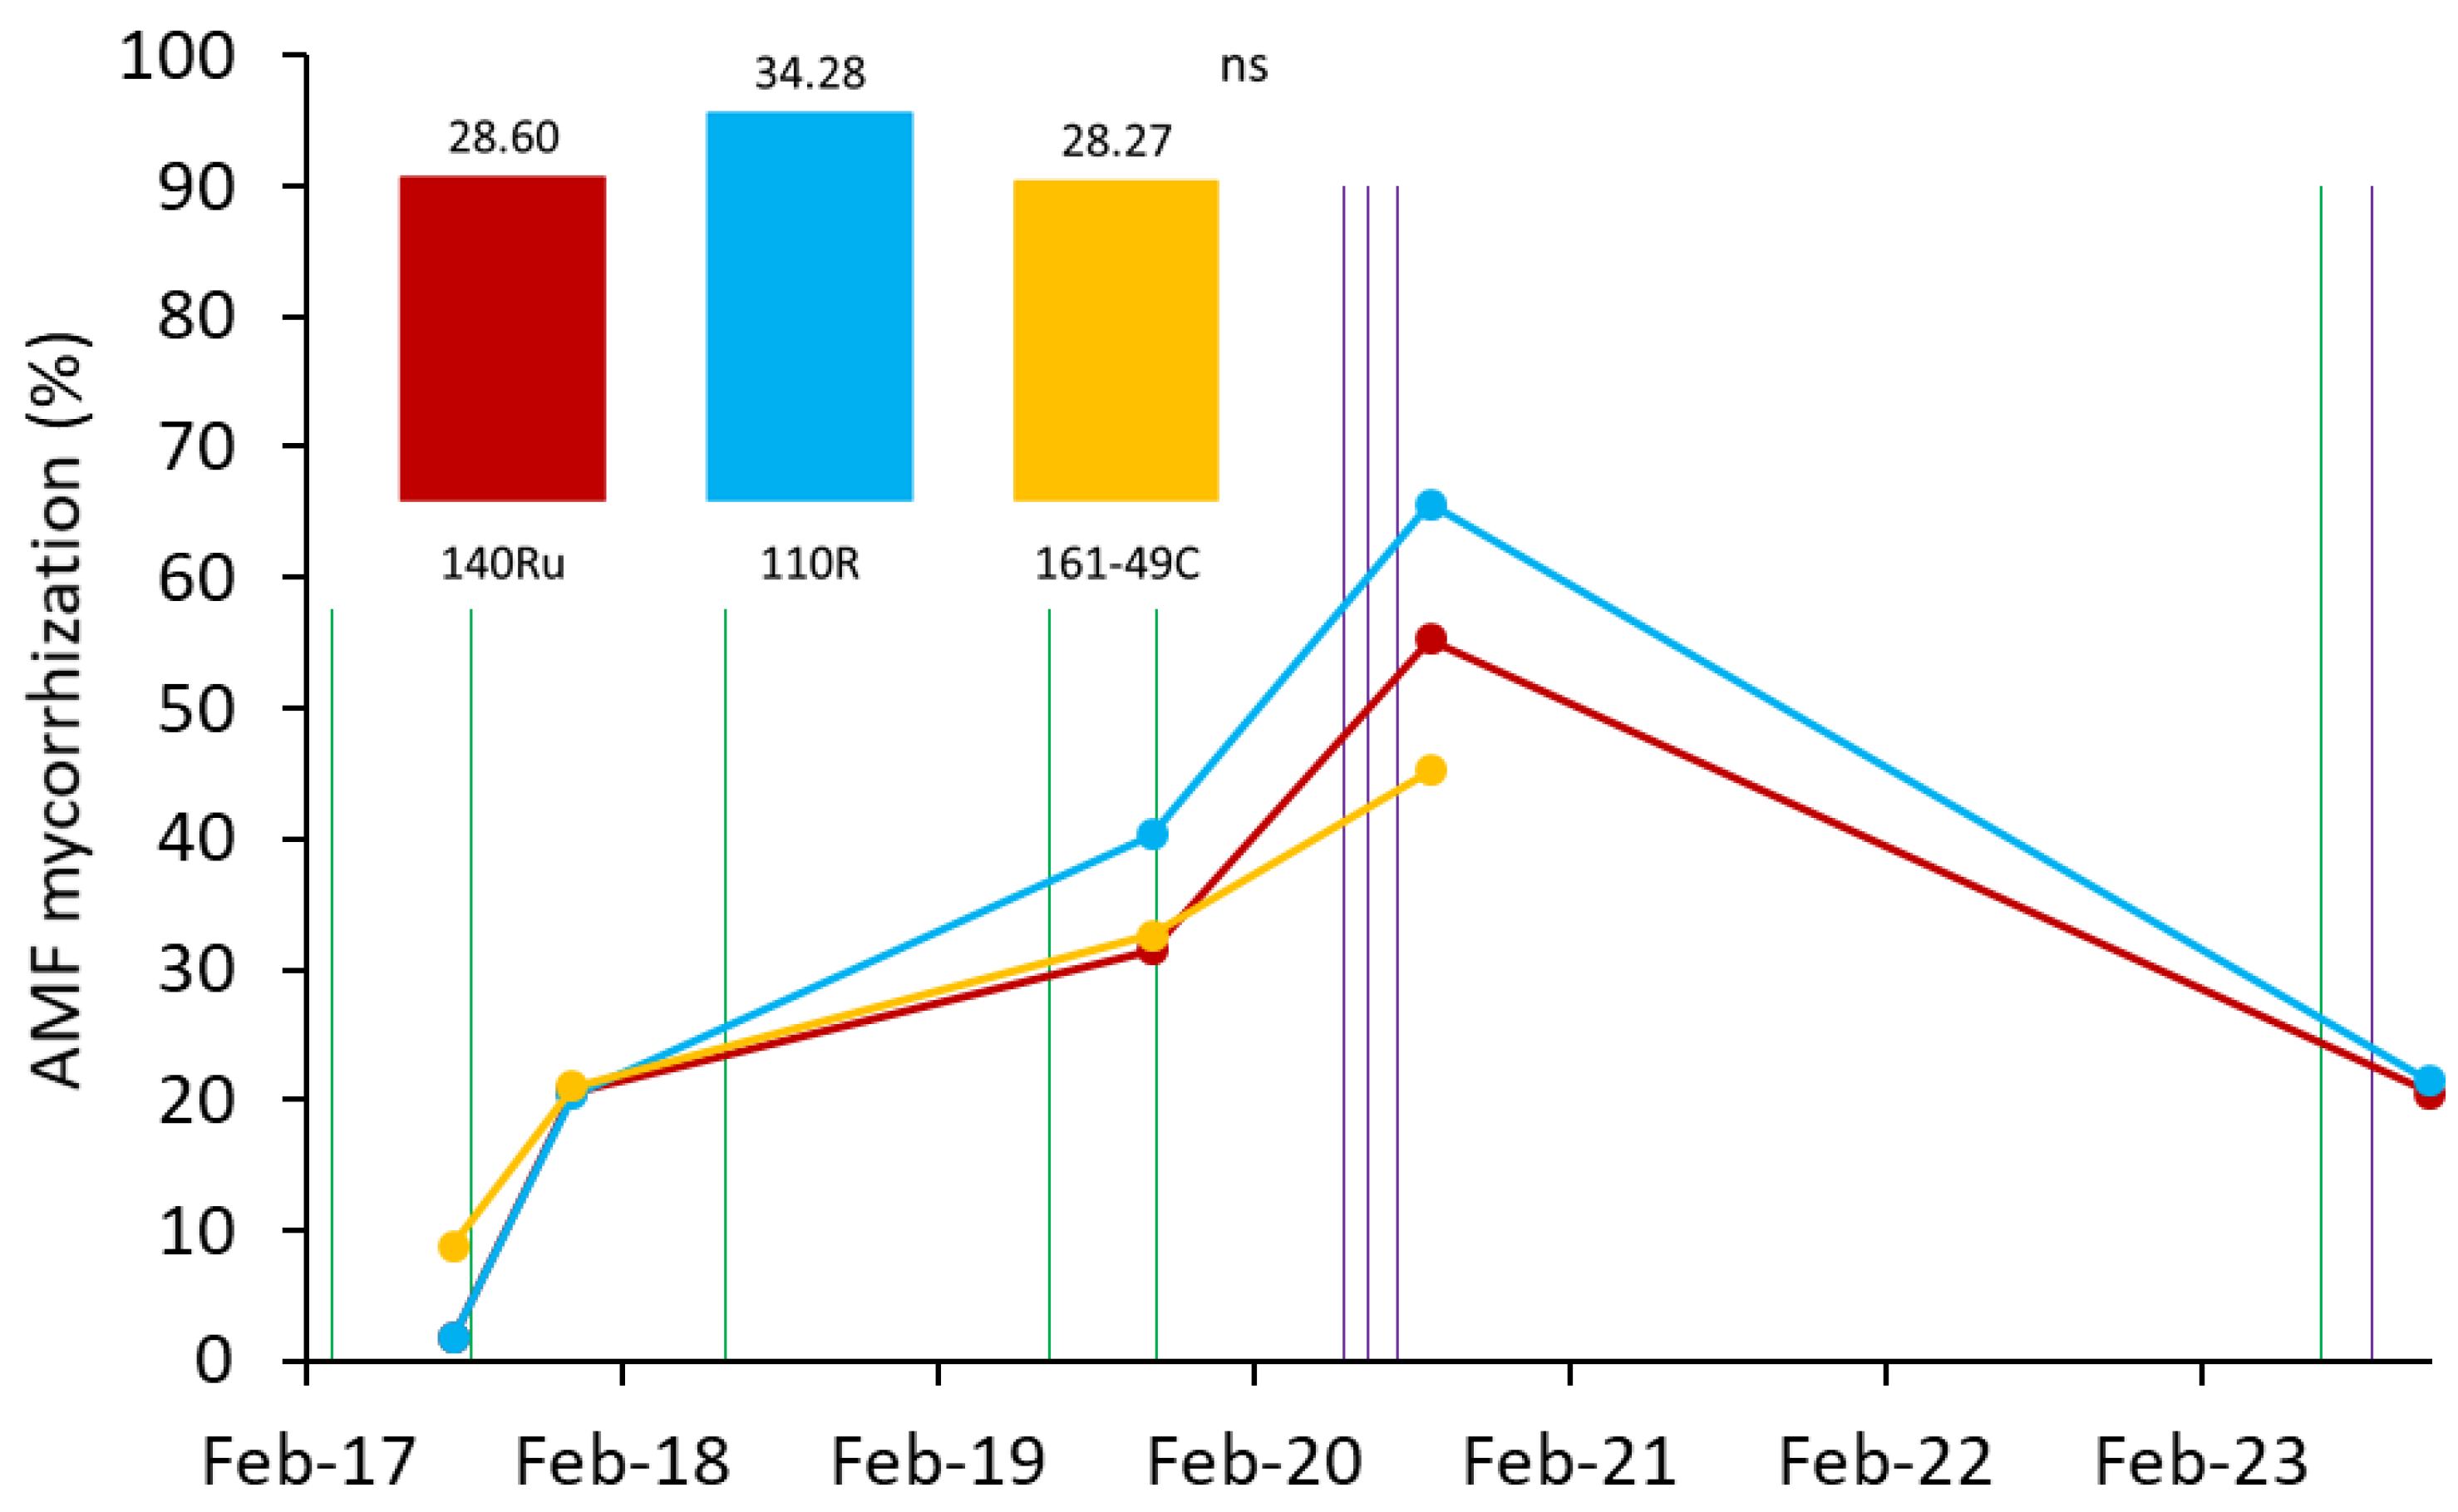
Figure 4.
Evolution of the percentage of root mycorrhization in Monastrell vines grafted onto three different rootstocks (140Ru, 110R, and 161-49C) and under two different microbial inoculation conditions (I vs. NI) during the experimental period (2017–2023). Colored bars represent the percentage of mycorrhization for each of the rootstocks during the 2017–2020 period. Vertical lines represent the times of AMF (green) and MHB (violet) inoculations. ns, not significant.
Figure 4.
Evolution of the percentage of root mycorrhization in Monastrell vines grafted onto three different rootstocks (140Ru, 110R, and 161-49C) and under two different microbial inoculation conditions (I vs. NI) during the experimental period (2017–2023). Colored bars represent the percentage of mycorrhization for each of the rootstocks during the 2017–2020 period. Vertical lines represent the times of AMF (green) and MHB (violet) inoculations. ns, not significant.
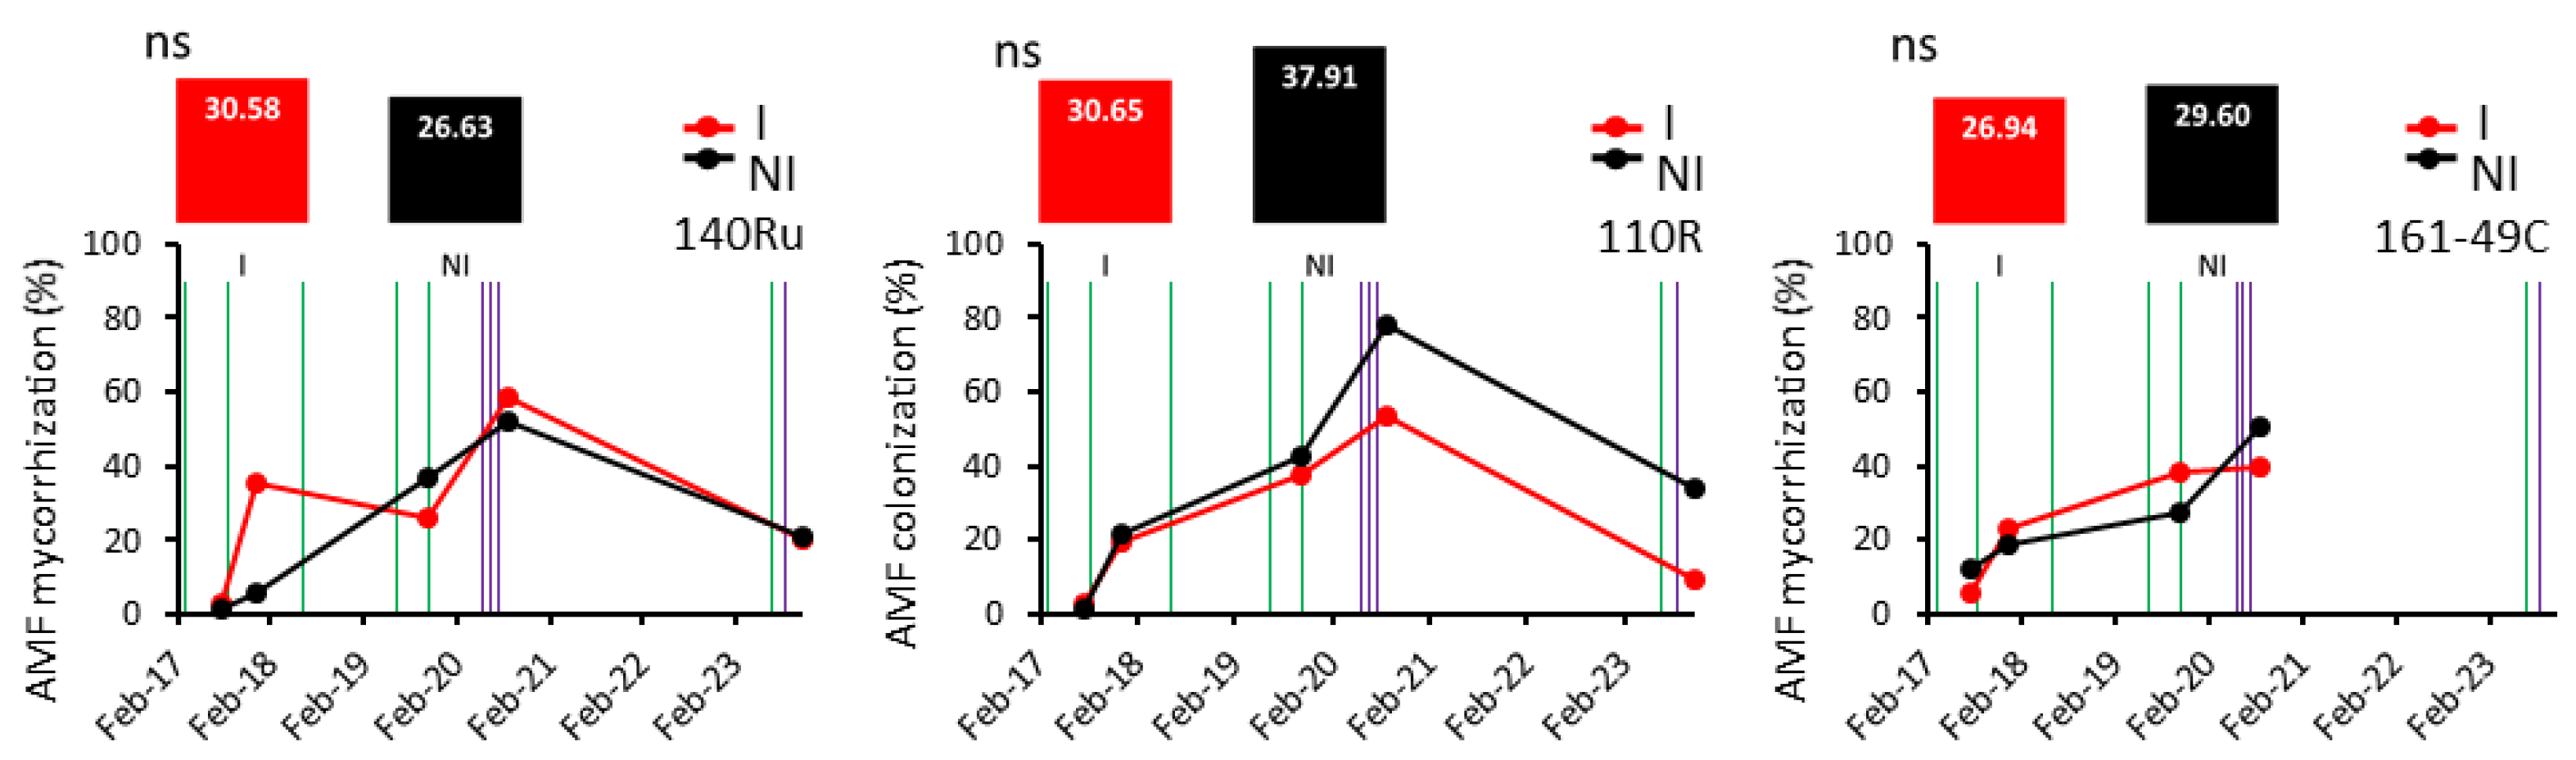
Figure 5.
Evolution of the percentage of active mycorrhization (hyphae, arbuscules, and vesicles) and non-active mycorrhization (spores) fractions during the experimental period (2017–2023), including the three rootstocks and both I and NI plants.
Figure 5.
Evolution of the percentage of active mycorrhization (hyphae, arbuscules, and vesicles) and non-active mycorrhization (spores) fractions during the experimental period (2017–2023), including the three rootstocks and both I and NI plants.
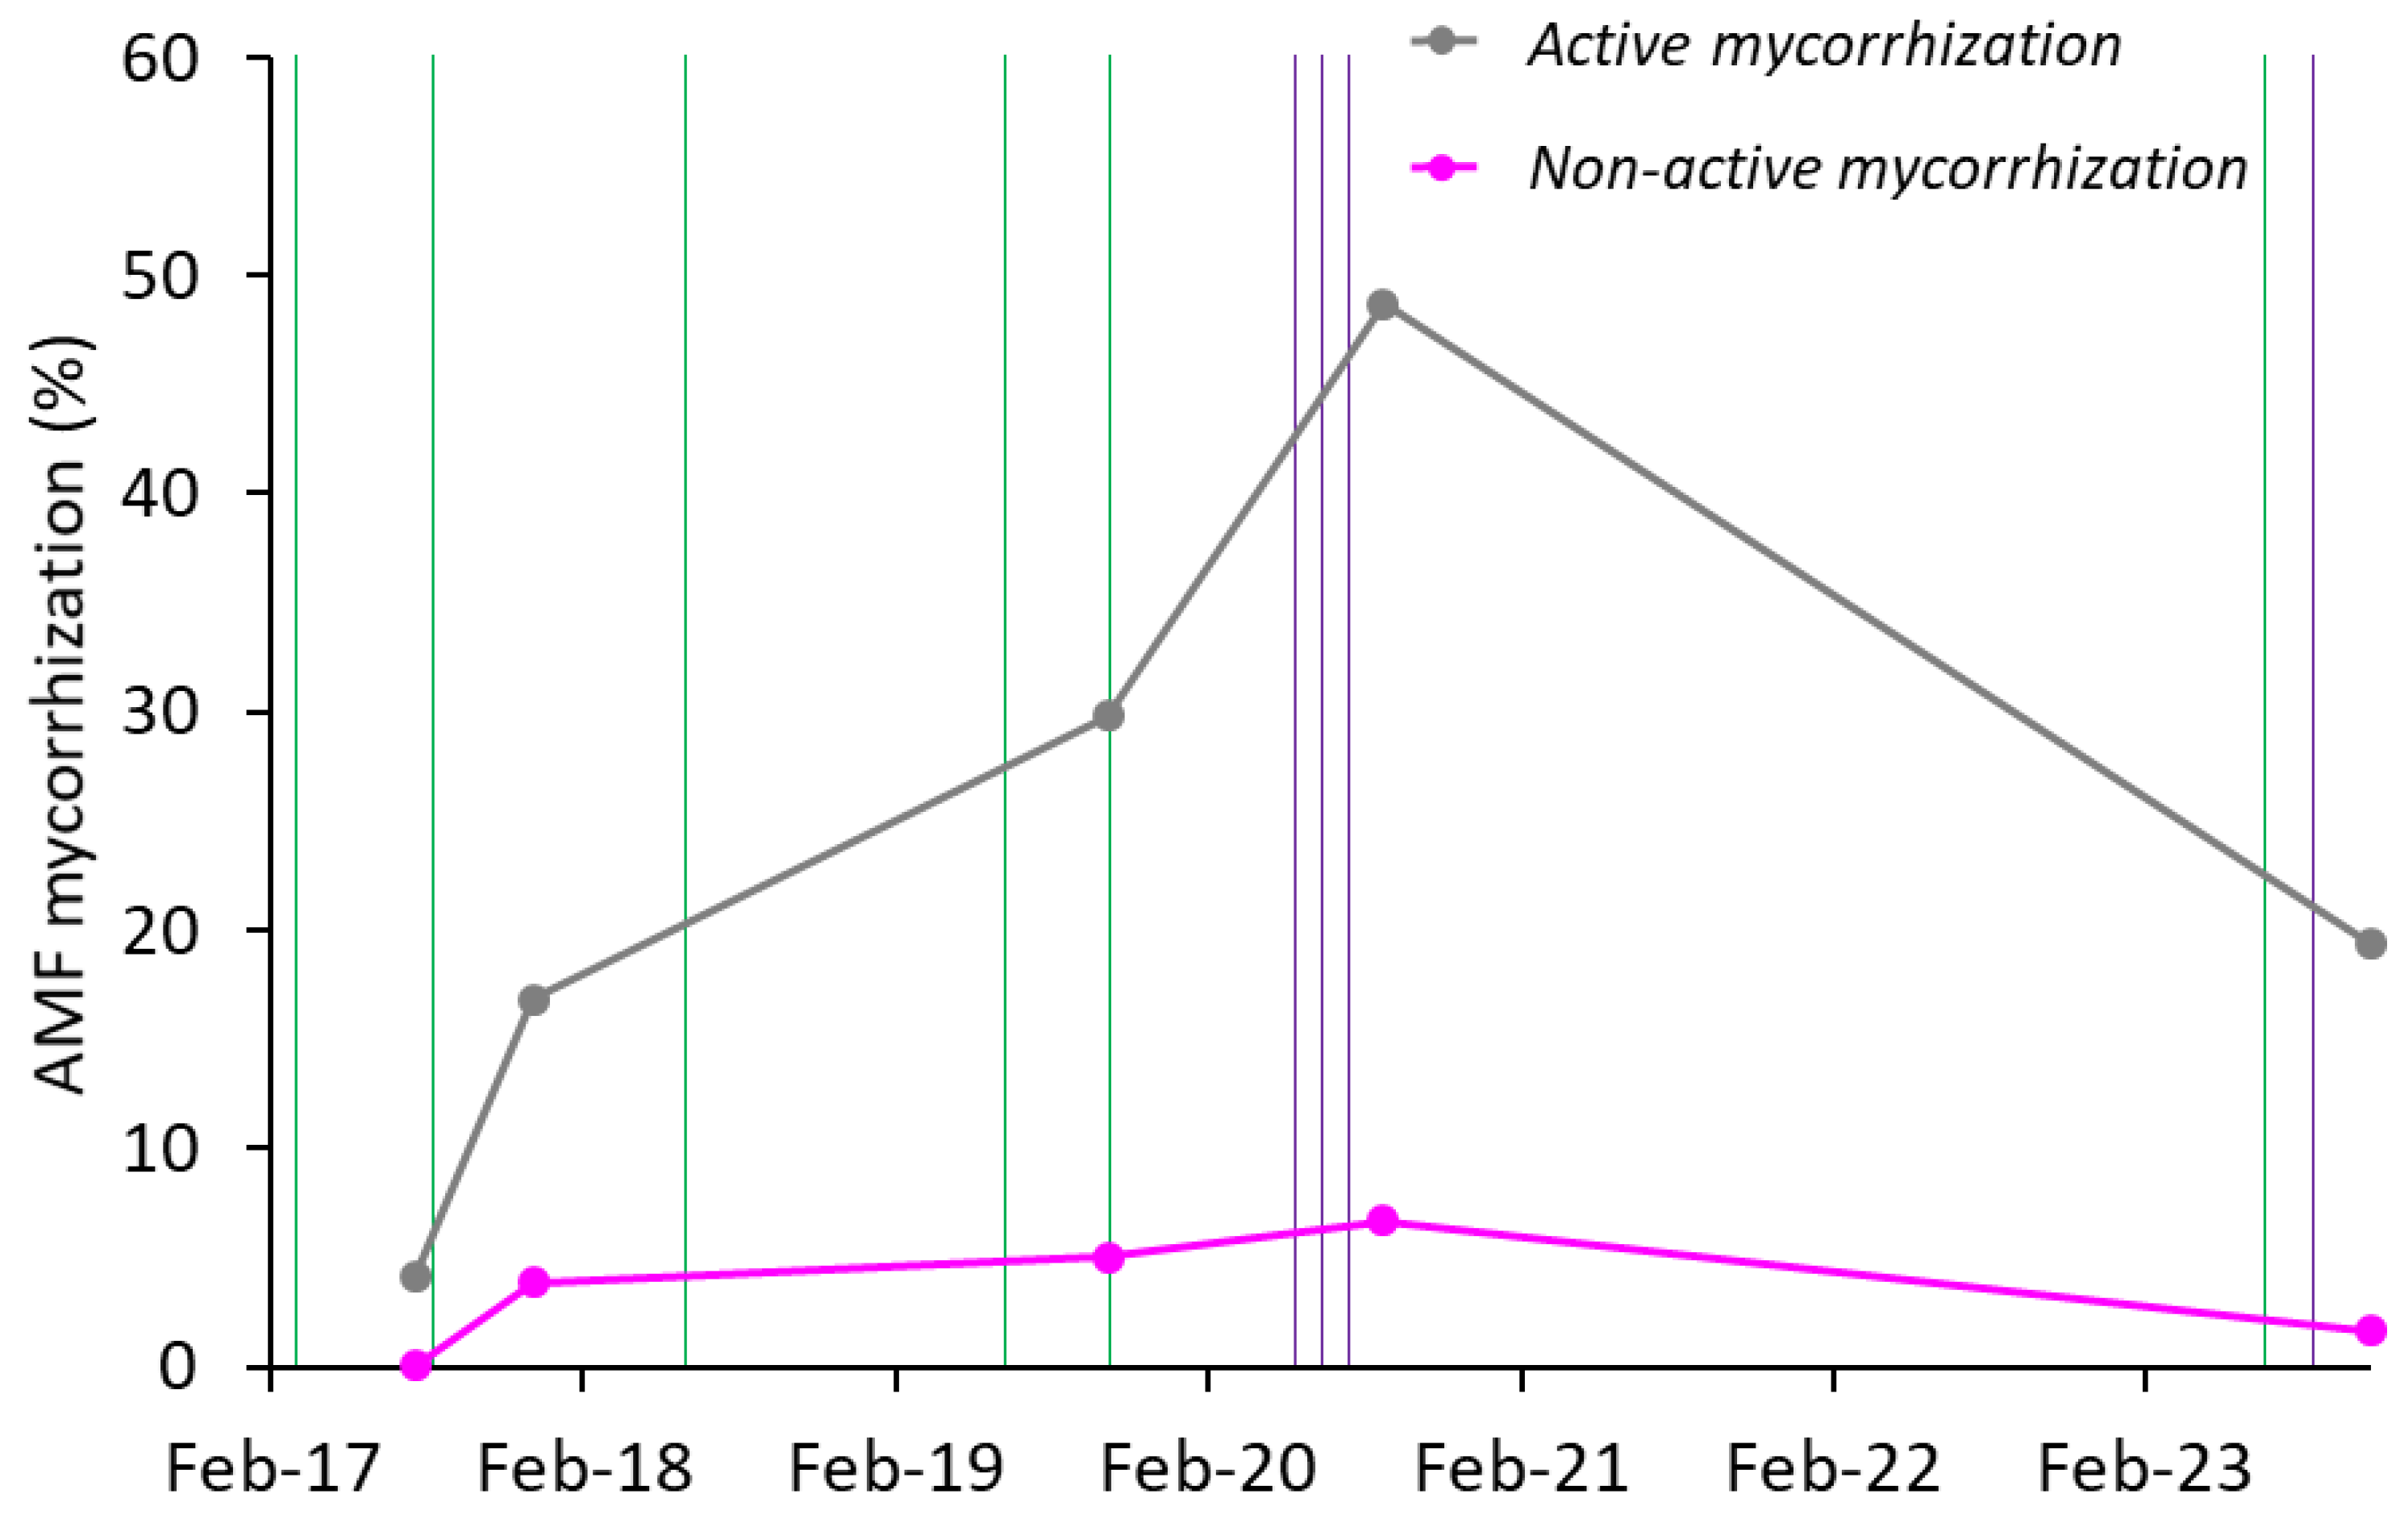
Figure 6.
Average percentage of AMF colonization in Monastrell vines under two different mycorrhizal inoculation conditions (I vs. NI) in October 2019 (after AMF inoculation but without MHB) across all of the rootstocks. Total mycorrhization includes spores and active structures (hyphae, arbuscules, and vesicles). ns, not significant; * P < 0.05, according to the non-parametric Mann-Whitney test at a 95% confidence level.
Figure 6.
Average percentage of AMF colonization in Monastrell vines under two different mycorrhizal inoculation conditions (I vs. NI) in October 2019 (after AMF inoculation but without MHB) across all of the rootstocks. Total mycorrhization includes spores and active structures (hyphae, arbuscules, and vesicles). ns, not significant; * P < 0.05, according to the non-parametric Mann-Whitney test at a 95% confidence level.
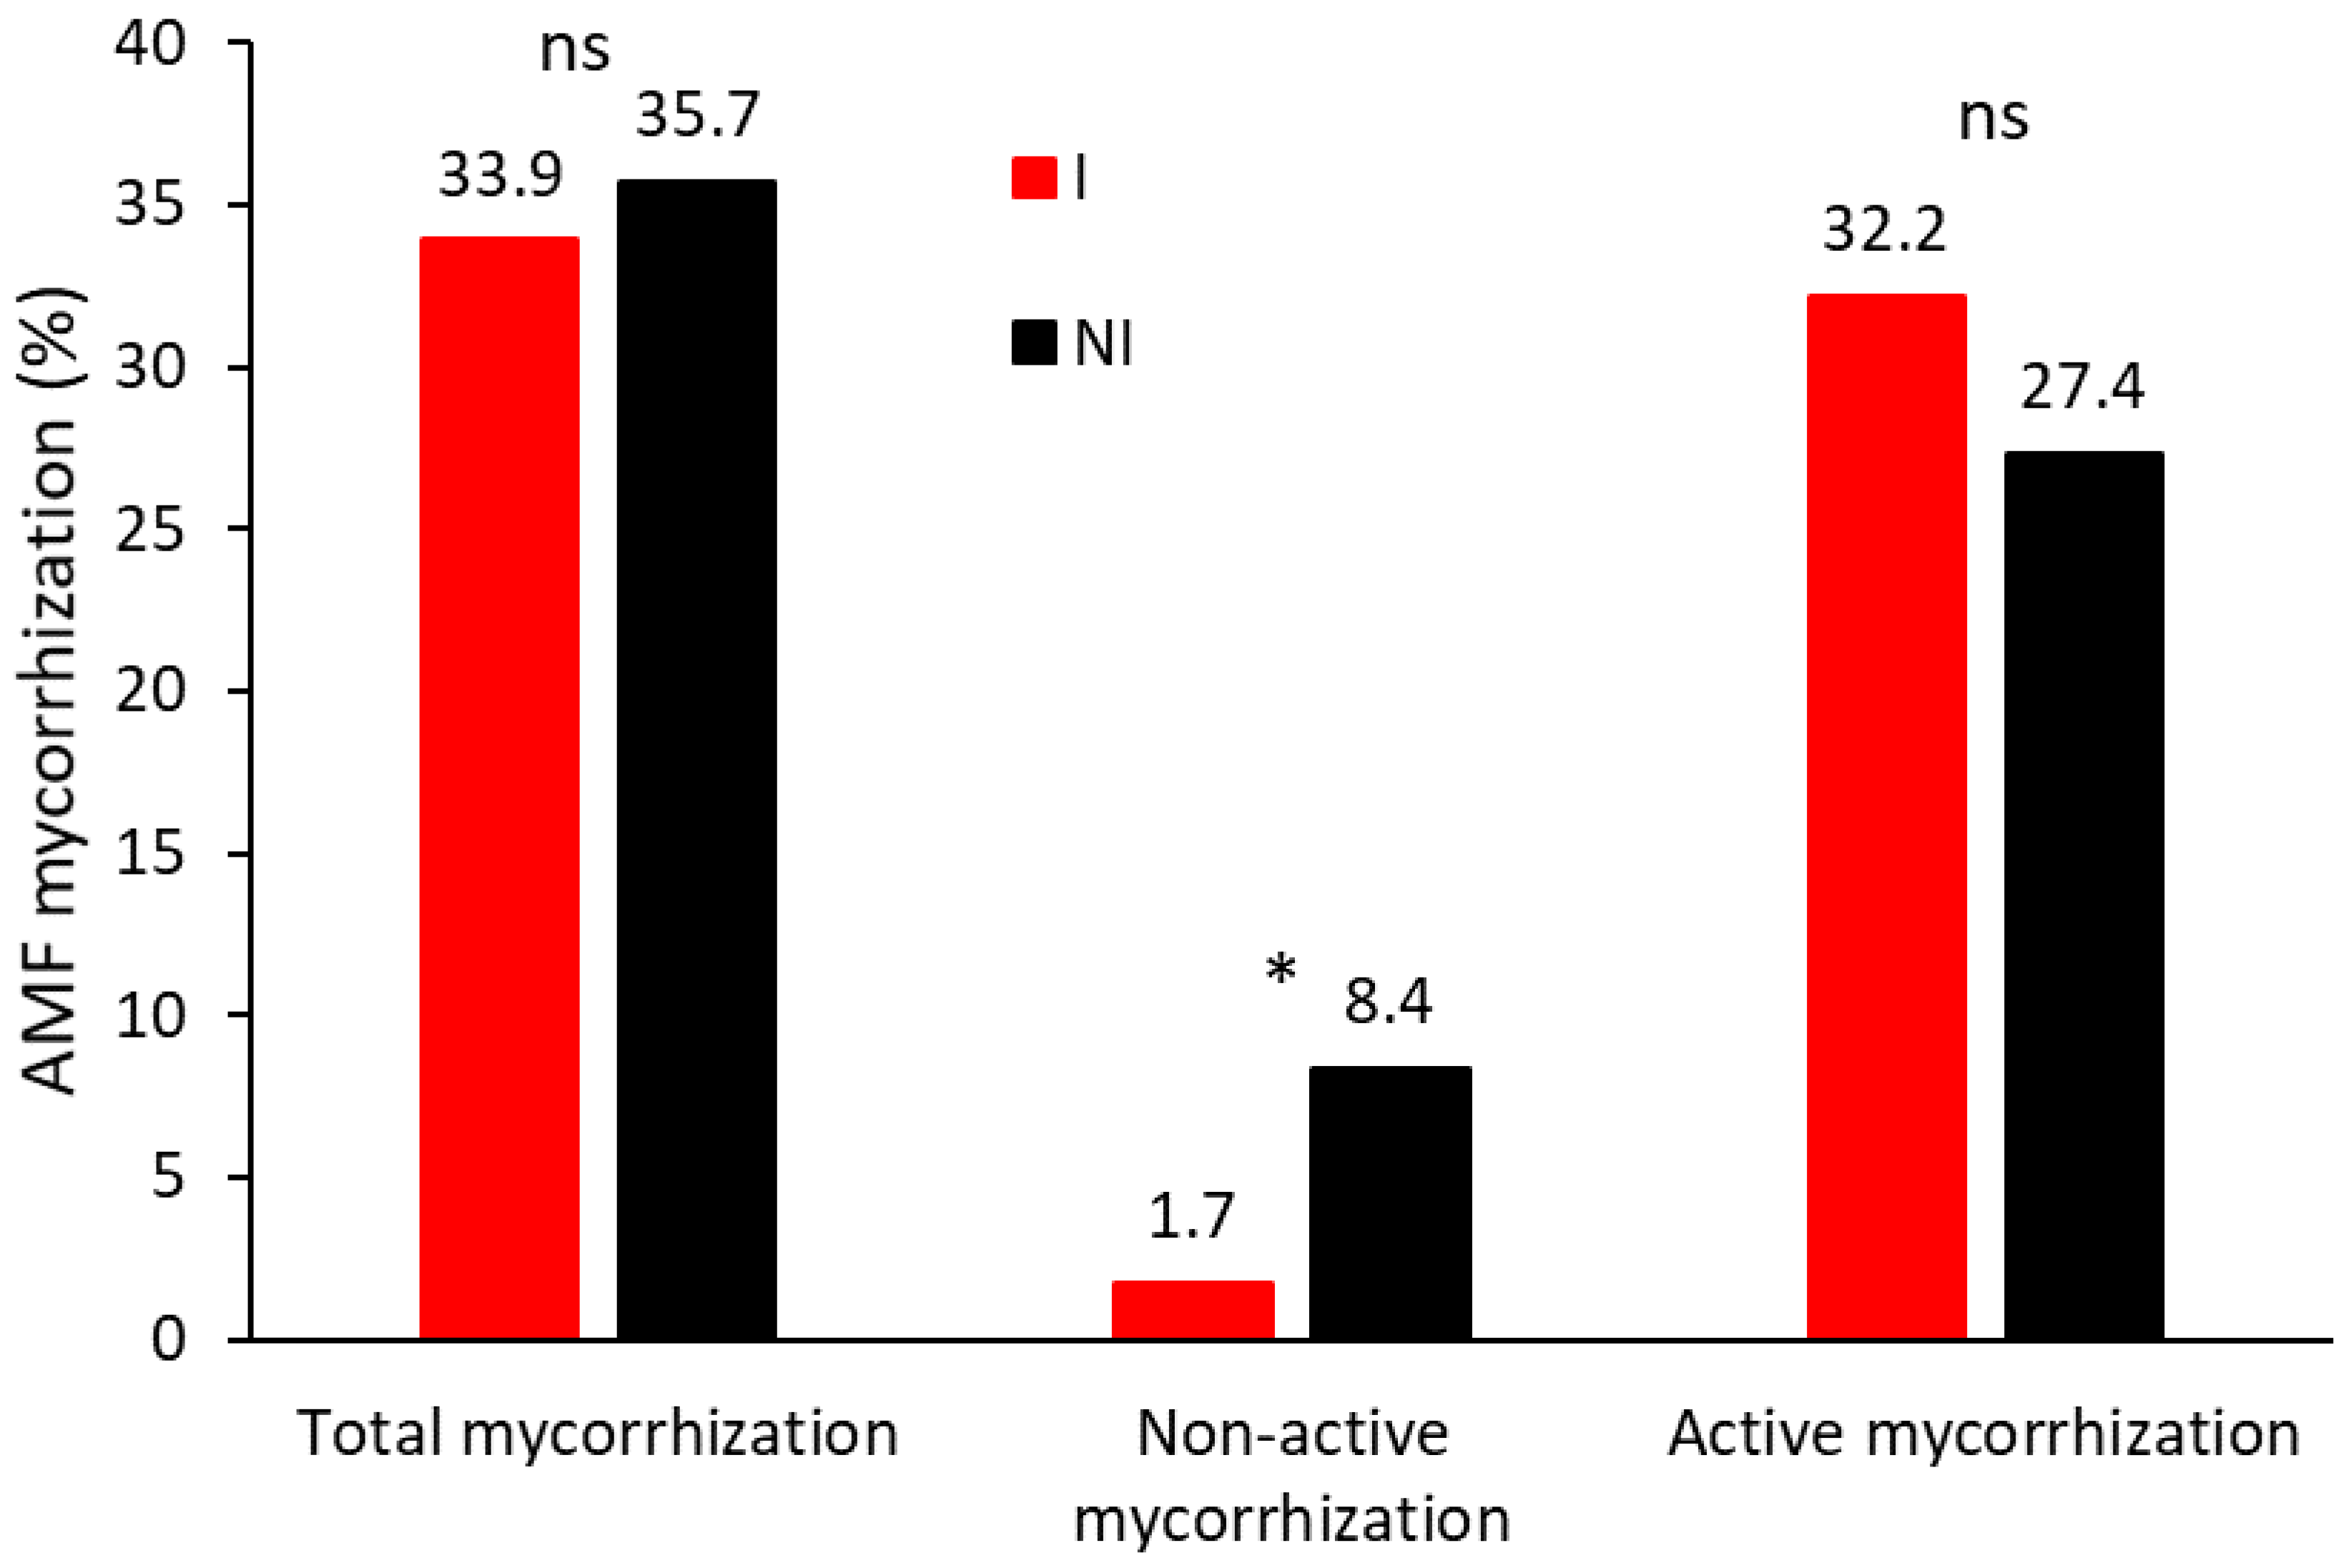
Figure 7.
Daily evolution of soil CO2 (respiration) and H2O (evaporation) fluxes measured during the post-veraison period (summer 2021), for vines on rootstocks 140Ru (maroon line) and 110R (blue line), under inoculated (I, red line) and non-inoculated (NI, black line) treatments. Left: Main effect of the rootstock (averaged across inoculation treatments); middle: Main effect of the microbial inoculation (I vs. NI); right: Rootstock × inoculation interaction. Error bars represent ± SE.
Figure 7.
Daily evolution of soil CO2 (respiration) and H2O (evaporation) fluxes measured during the post-veraison period (summer 2021), for vines on rootstocks 140Ru (maroon line) and 110R (blue line), under inoculated (I, red line) and non-inoculated (NI, black line) treatments. Left: Main effect of the rootstock (averaged across inoculation treatments); middle: Main effect of the microbial inoculation (I vs. NI); right: Rootstock × inoculation interaction. Error bars represent ± SE.
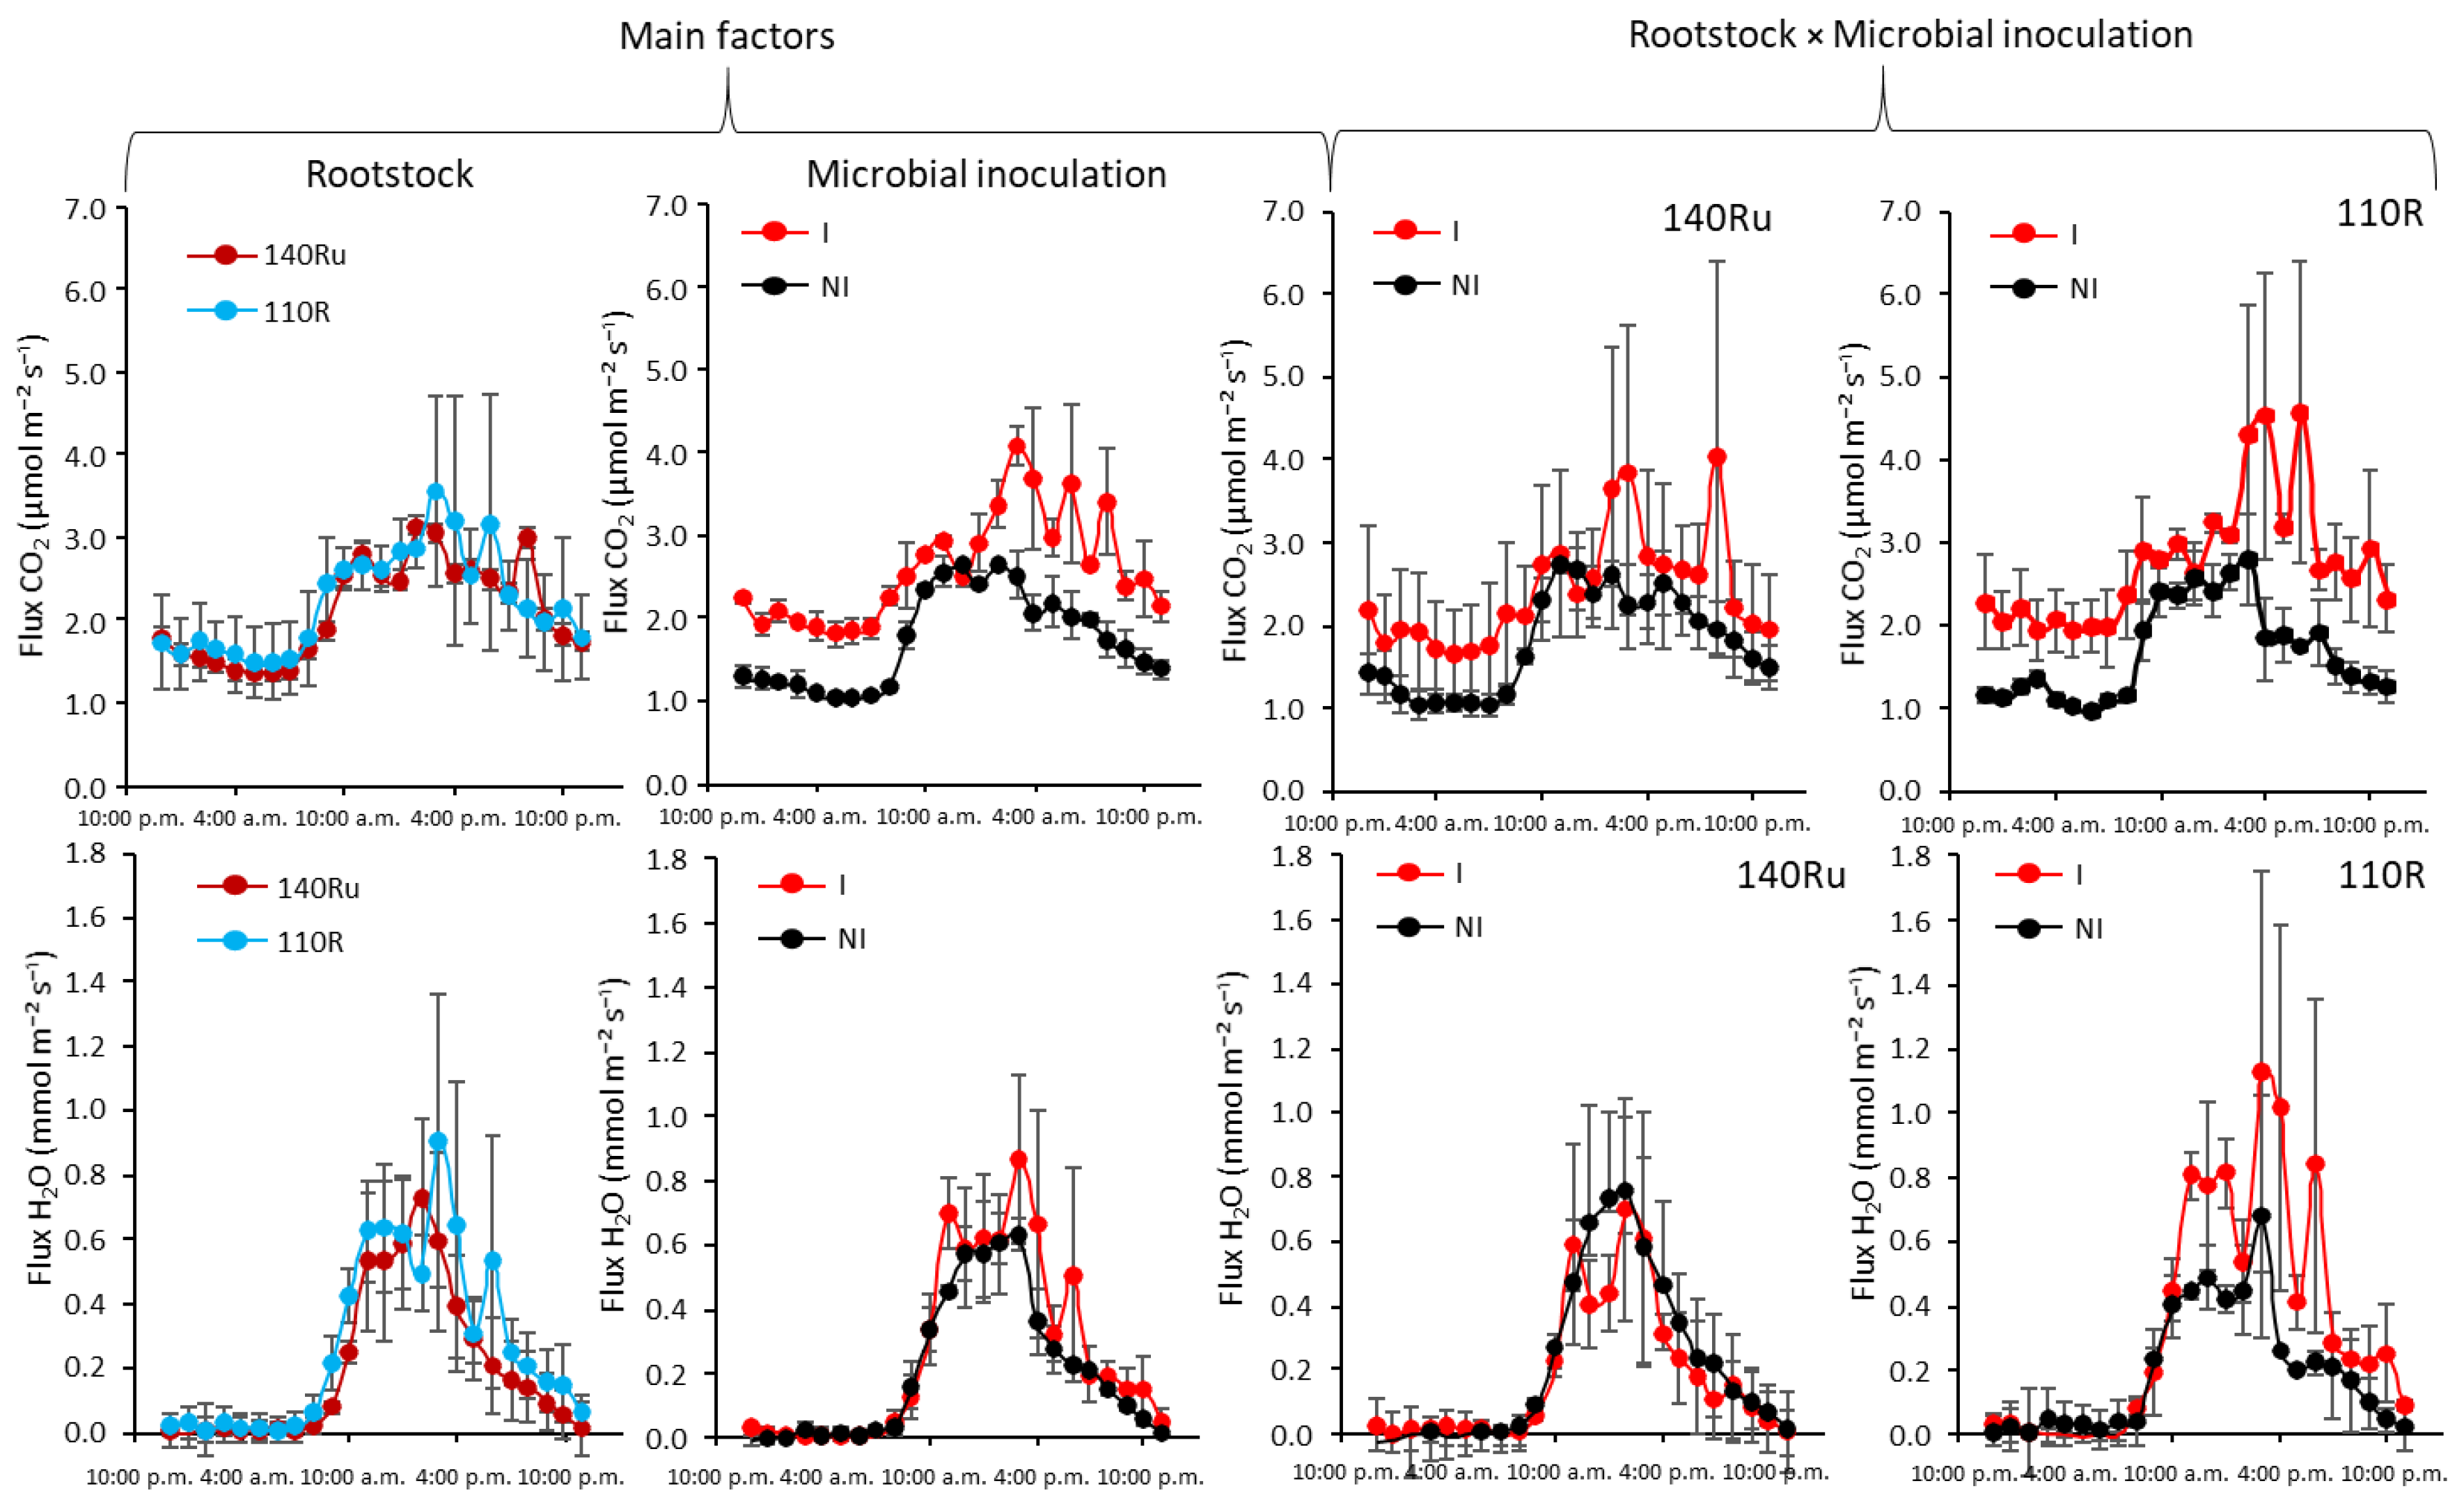
Figure 8.
Evolution of main shoot growth of Monastrell vines grafted onto three different rootstocks (140Ru, 110R, and 161-49C) (A) and under two different microbial inoculation conditions (I vs. NI) (B) during 2018. ns, not significant; * P < 0.05; ** P < 0.01.
Figure 8.
Evolution of main shoot growth of Monastrell vines grafted onto three different rootstocks (140Ru, 110R, and 161-49C) (A) and under two different microbial inoculation conditions (I vs. NI) (B) during 2018. ns, not significant; * P < 0.05; ** P < 0.01.
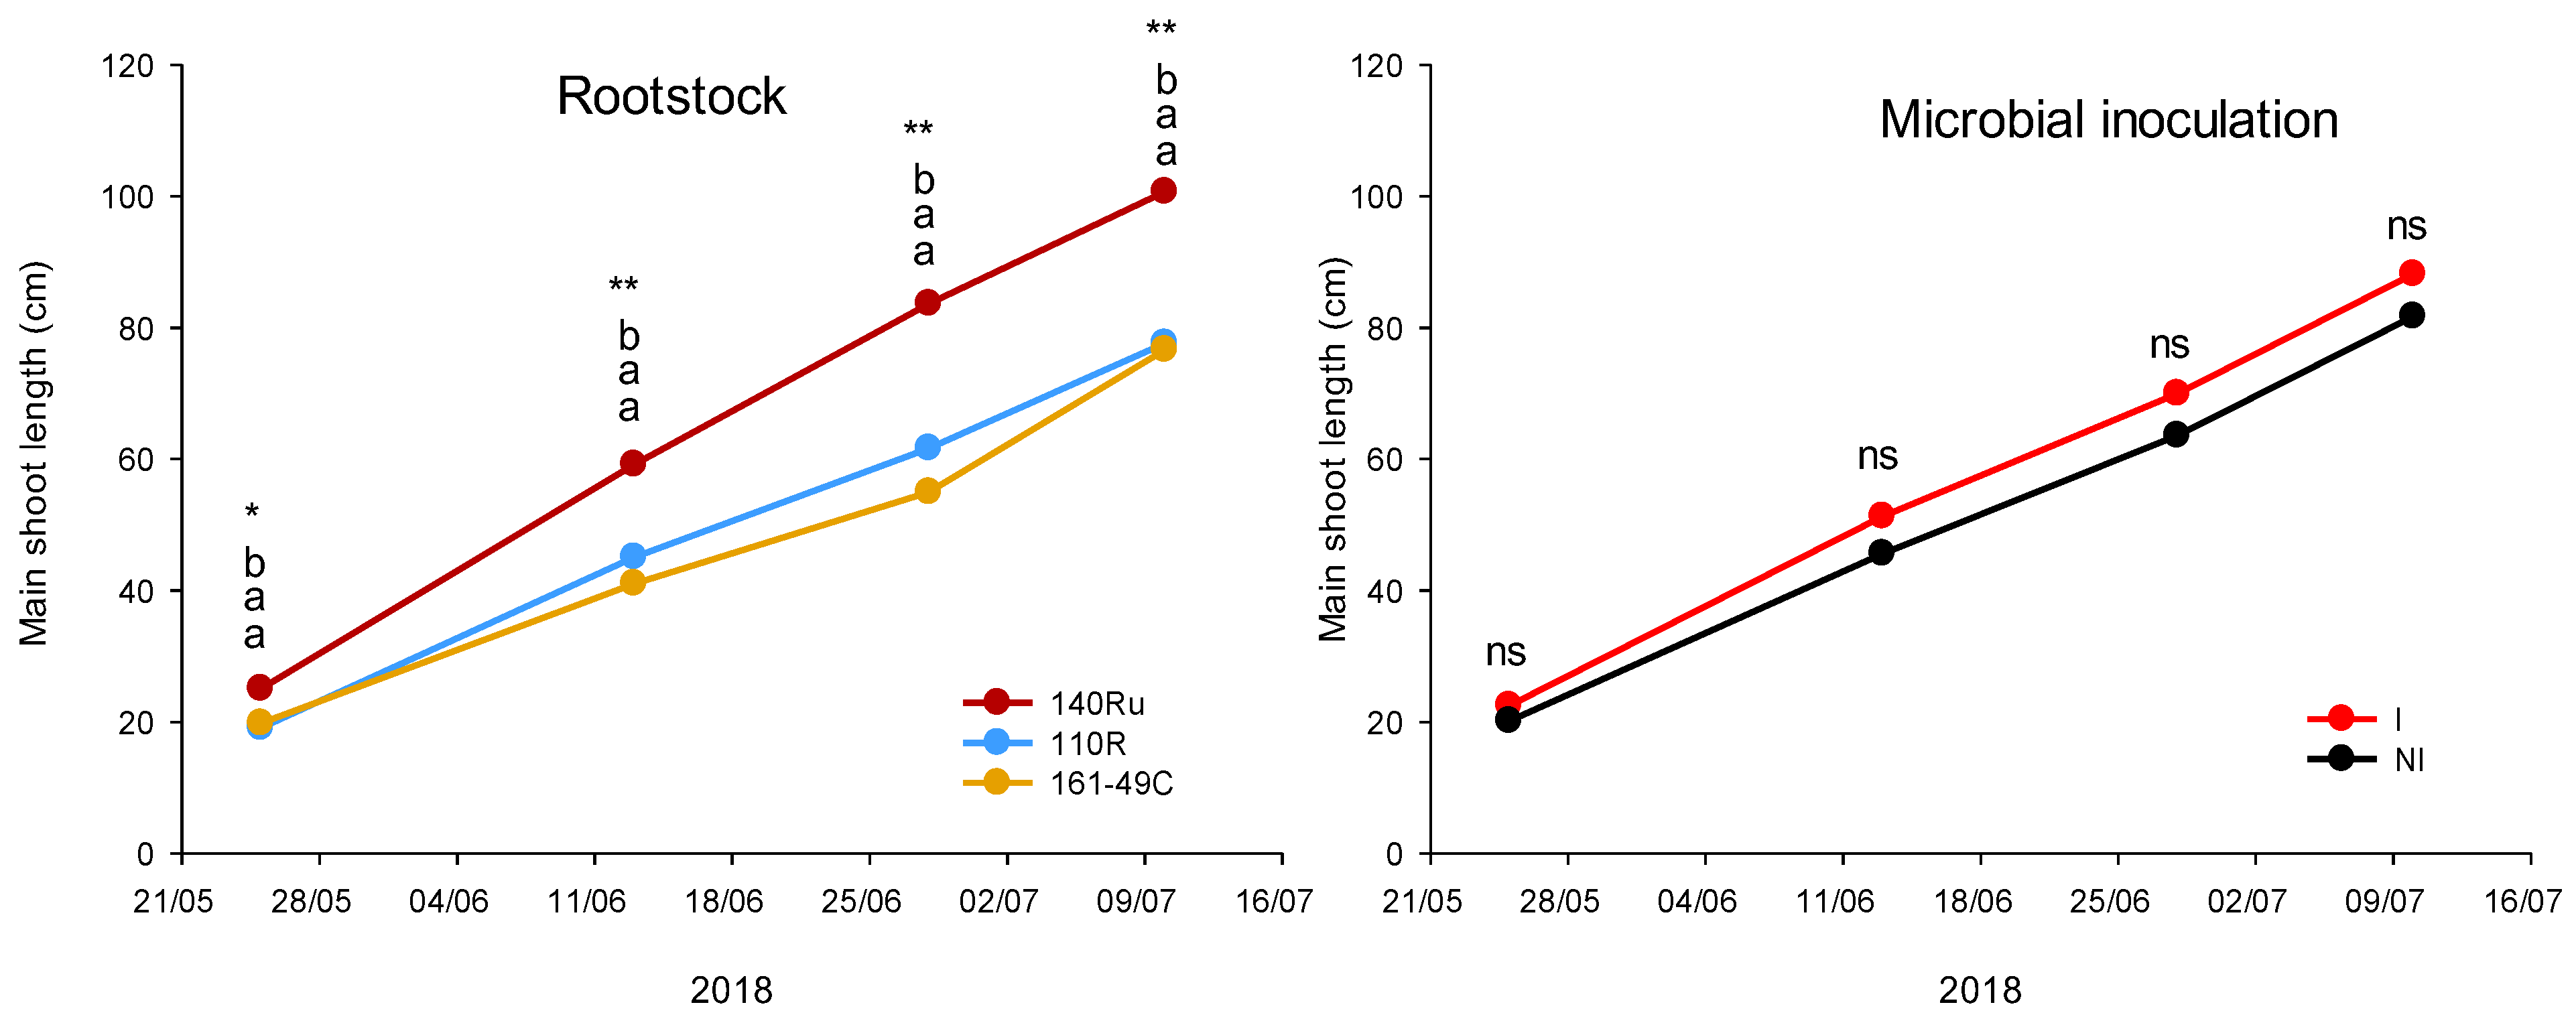
Figure 9.
Evolution of productive water use efficiency (WUEyield) in Monastrell vines grafted onto different rootstocks and under two microbial inoculation conditions (I vs. NI) during the experimental period (2018–2023). Values of WUEyield for each of the rootstocks and for both inoculated and non-inoculated plants in 2021 and 2023 (one-way analysis). ns, not significant; * P < 0.1, ** P < 0.05; *** P < 0.01; **** P < 0.001 Differences between the mean values for each of the rootstocks were determined using Duncan's multiple range test at a 95% confidence level.
Figure 9.
Evolution of productive water use efficiency (WUEyield) in Monastrell vines grafted onto different rootstocks and under two microbial inoculation conditions (I vs. NI) during the experimental period (2018–2023). Values of WUEyield for each of the rootstocks and for both inoculated and non-inoculated plants in 2021 and 2023 (one-way analysis). ns, not significant; * P < 0.1, ** P < 0.05; *** P < 0.01; **** P < 0.001 Differences between the mean values for each of the rootstocks were determined using Duncan's multiple range test at a 95% confidence level.
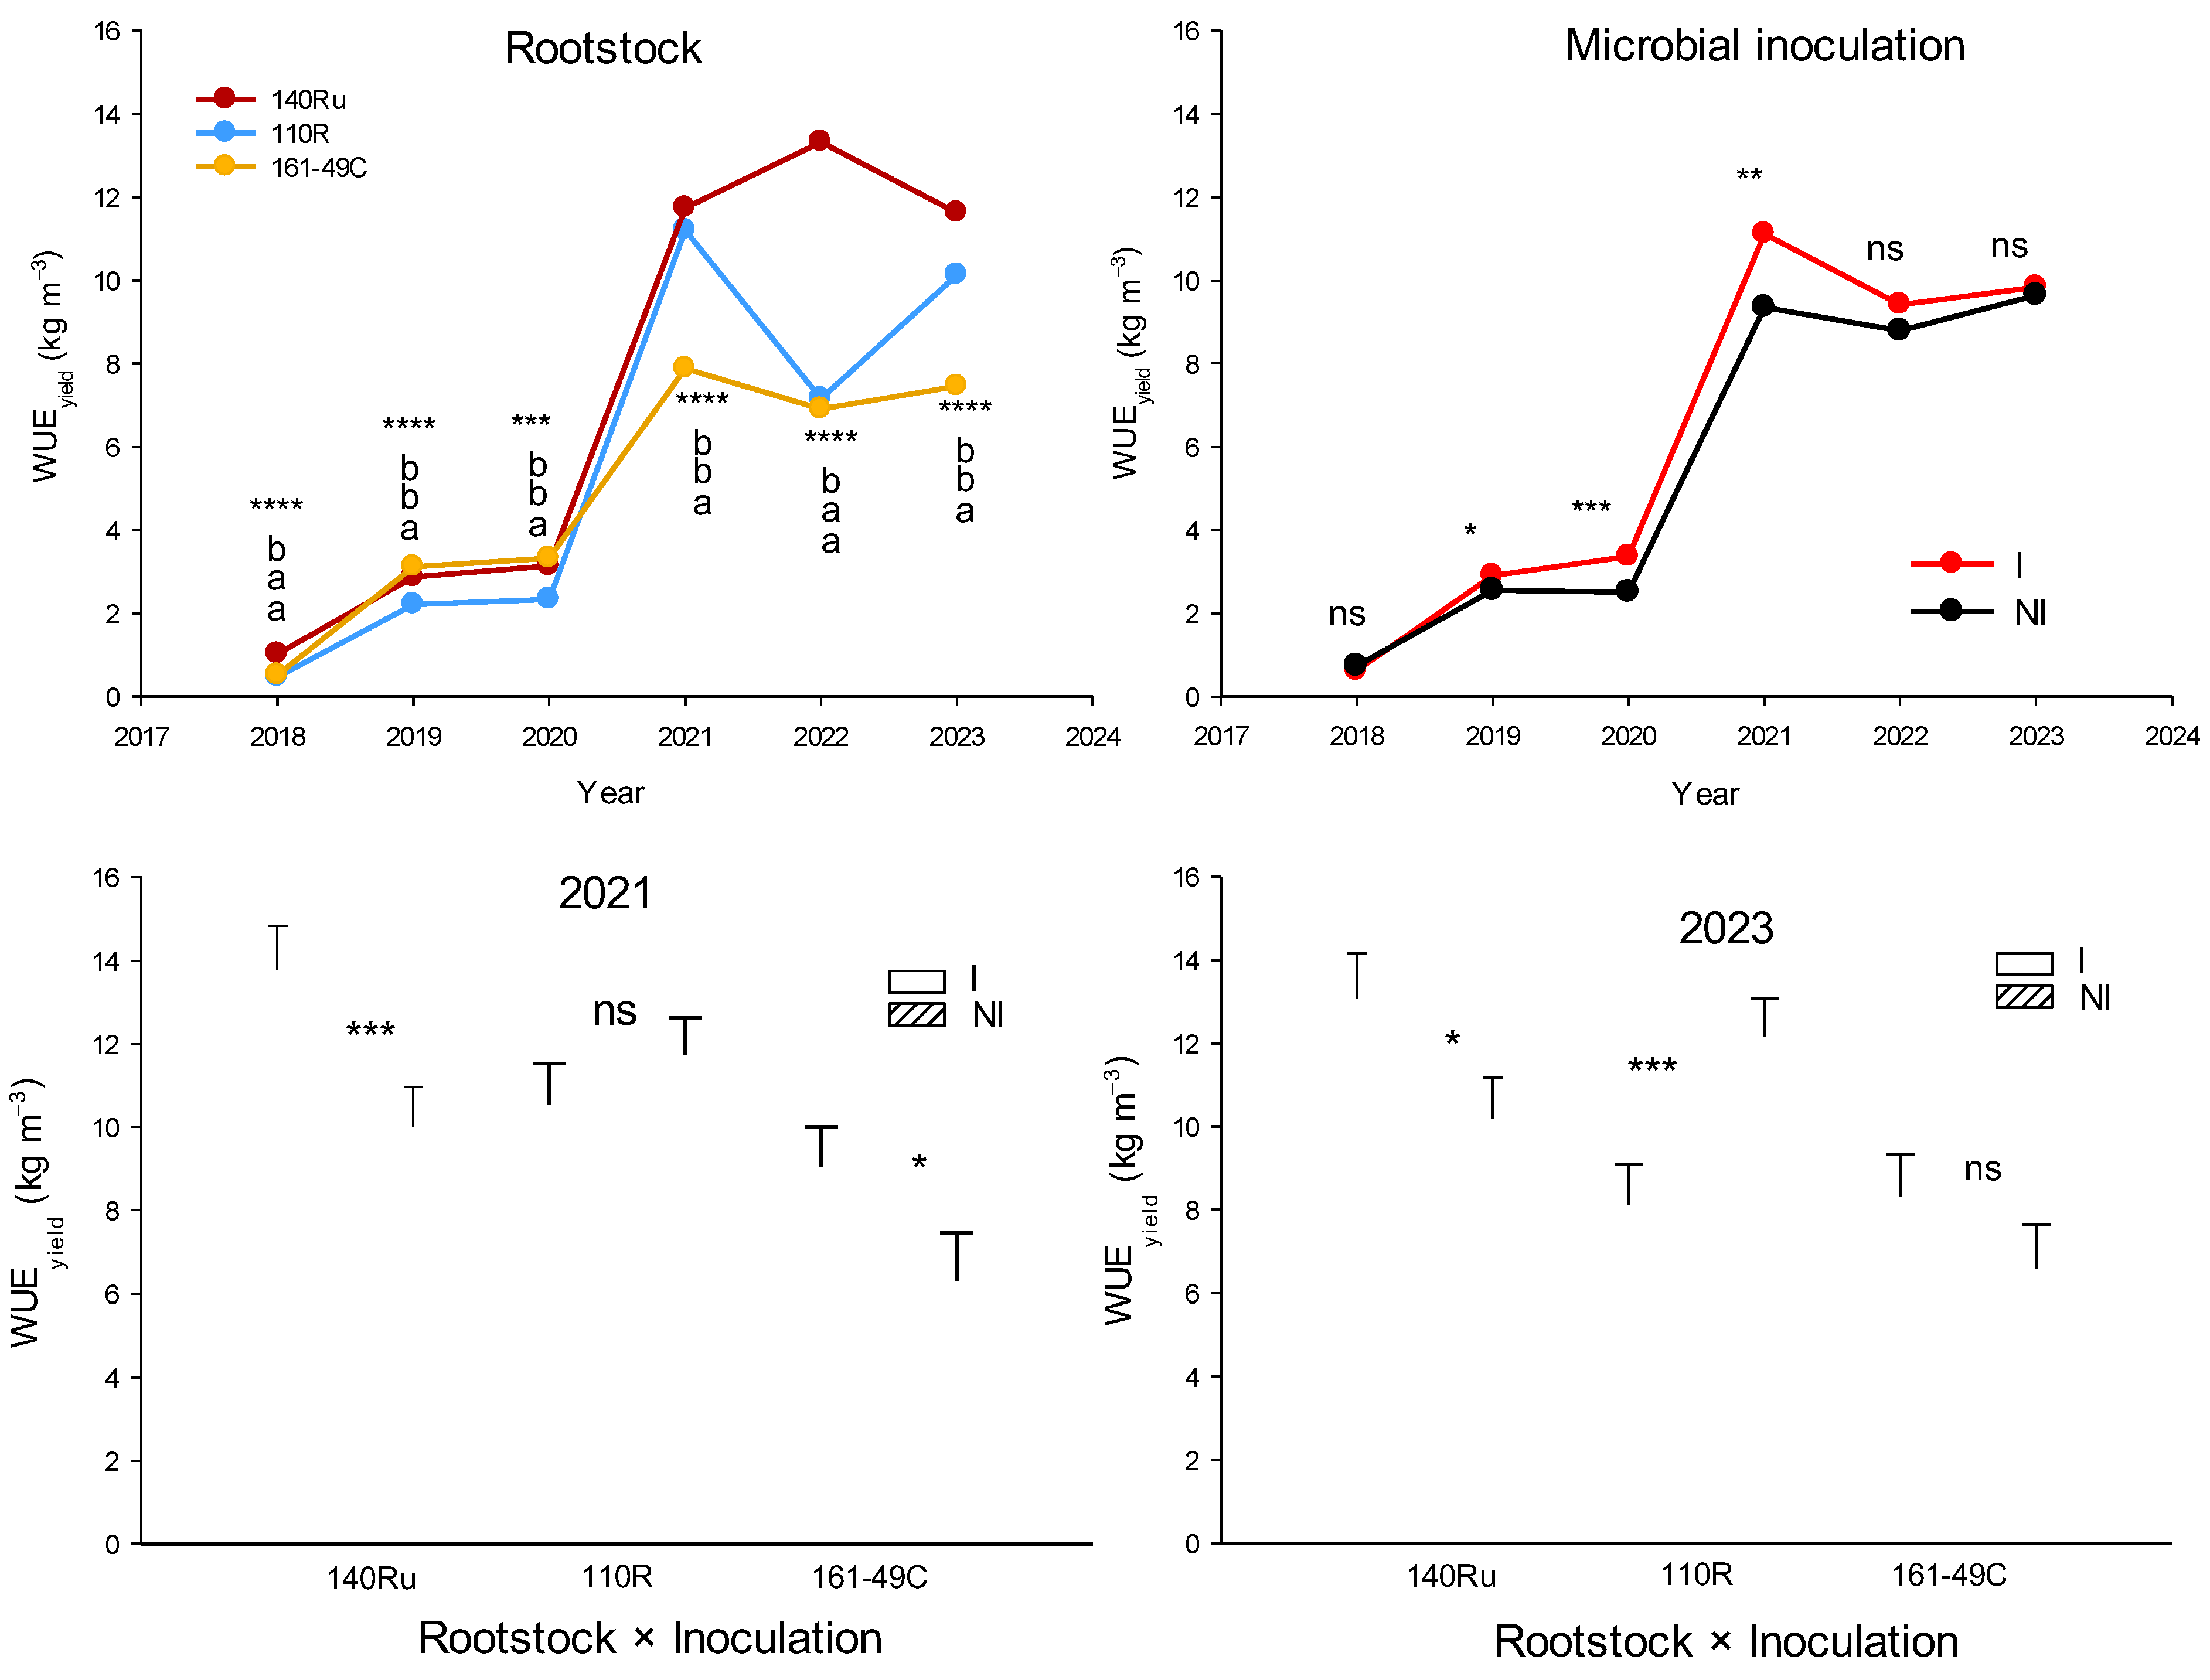
Figure 10.
Significant differences in Monastrell vines grafted onto three different rootstocks (140Ru, 110R, and 161-49C) and under two different microbial inoculation conditions (I vs. NI), in leaf gas exchange parameters (A, leaf photosynthesis rate; gs, stomatal conductance rate; E, leaf transpiration rate; A/gs, intrinsic leaf water use efficiency, for years 2020 and 2023, and midday stem water potential [Ψs], for the pre- and post-veraison periods of 2023). For each of the rootstocks, one-way ANOVA was performed for each of the physiological parameters. ns, not significant; * P < 0.05; ** P < 0.01; *** P <0.001. Mean values for each of the rootstocks were compared using Duncan's multiple range test at a 95% confidence level.
Figure 10.
Significant differences in Monastrell vines grafted onto three different rootstocks (140Ru, 110R, and 161-49C) and under two different microbial inoculation conditions (I vs. NI), in leaf gas exchange parameters (A, leaf photosynthesis rate; gs, stomatal conductance rate; E, leaf transpiration rate; A/gs, intrinsic leaf water use efficiency, for years 2020 and 2023, and midday stem water potential [Ψs], for the pre- and post-veraison periods of 2023). For each of the rootstocks, one-way ANOVA was performed for each of the physiological parameters. ns, not significant; * P < 0.05; ** P < 0.01; *** P <0.001. Mean values for each of the rootstocks were compared using Duncan's multiple range test at a 95% confidence level.
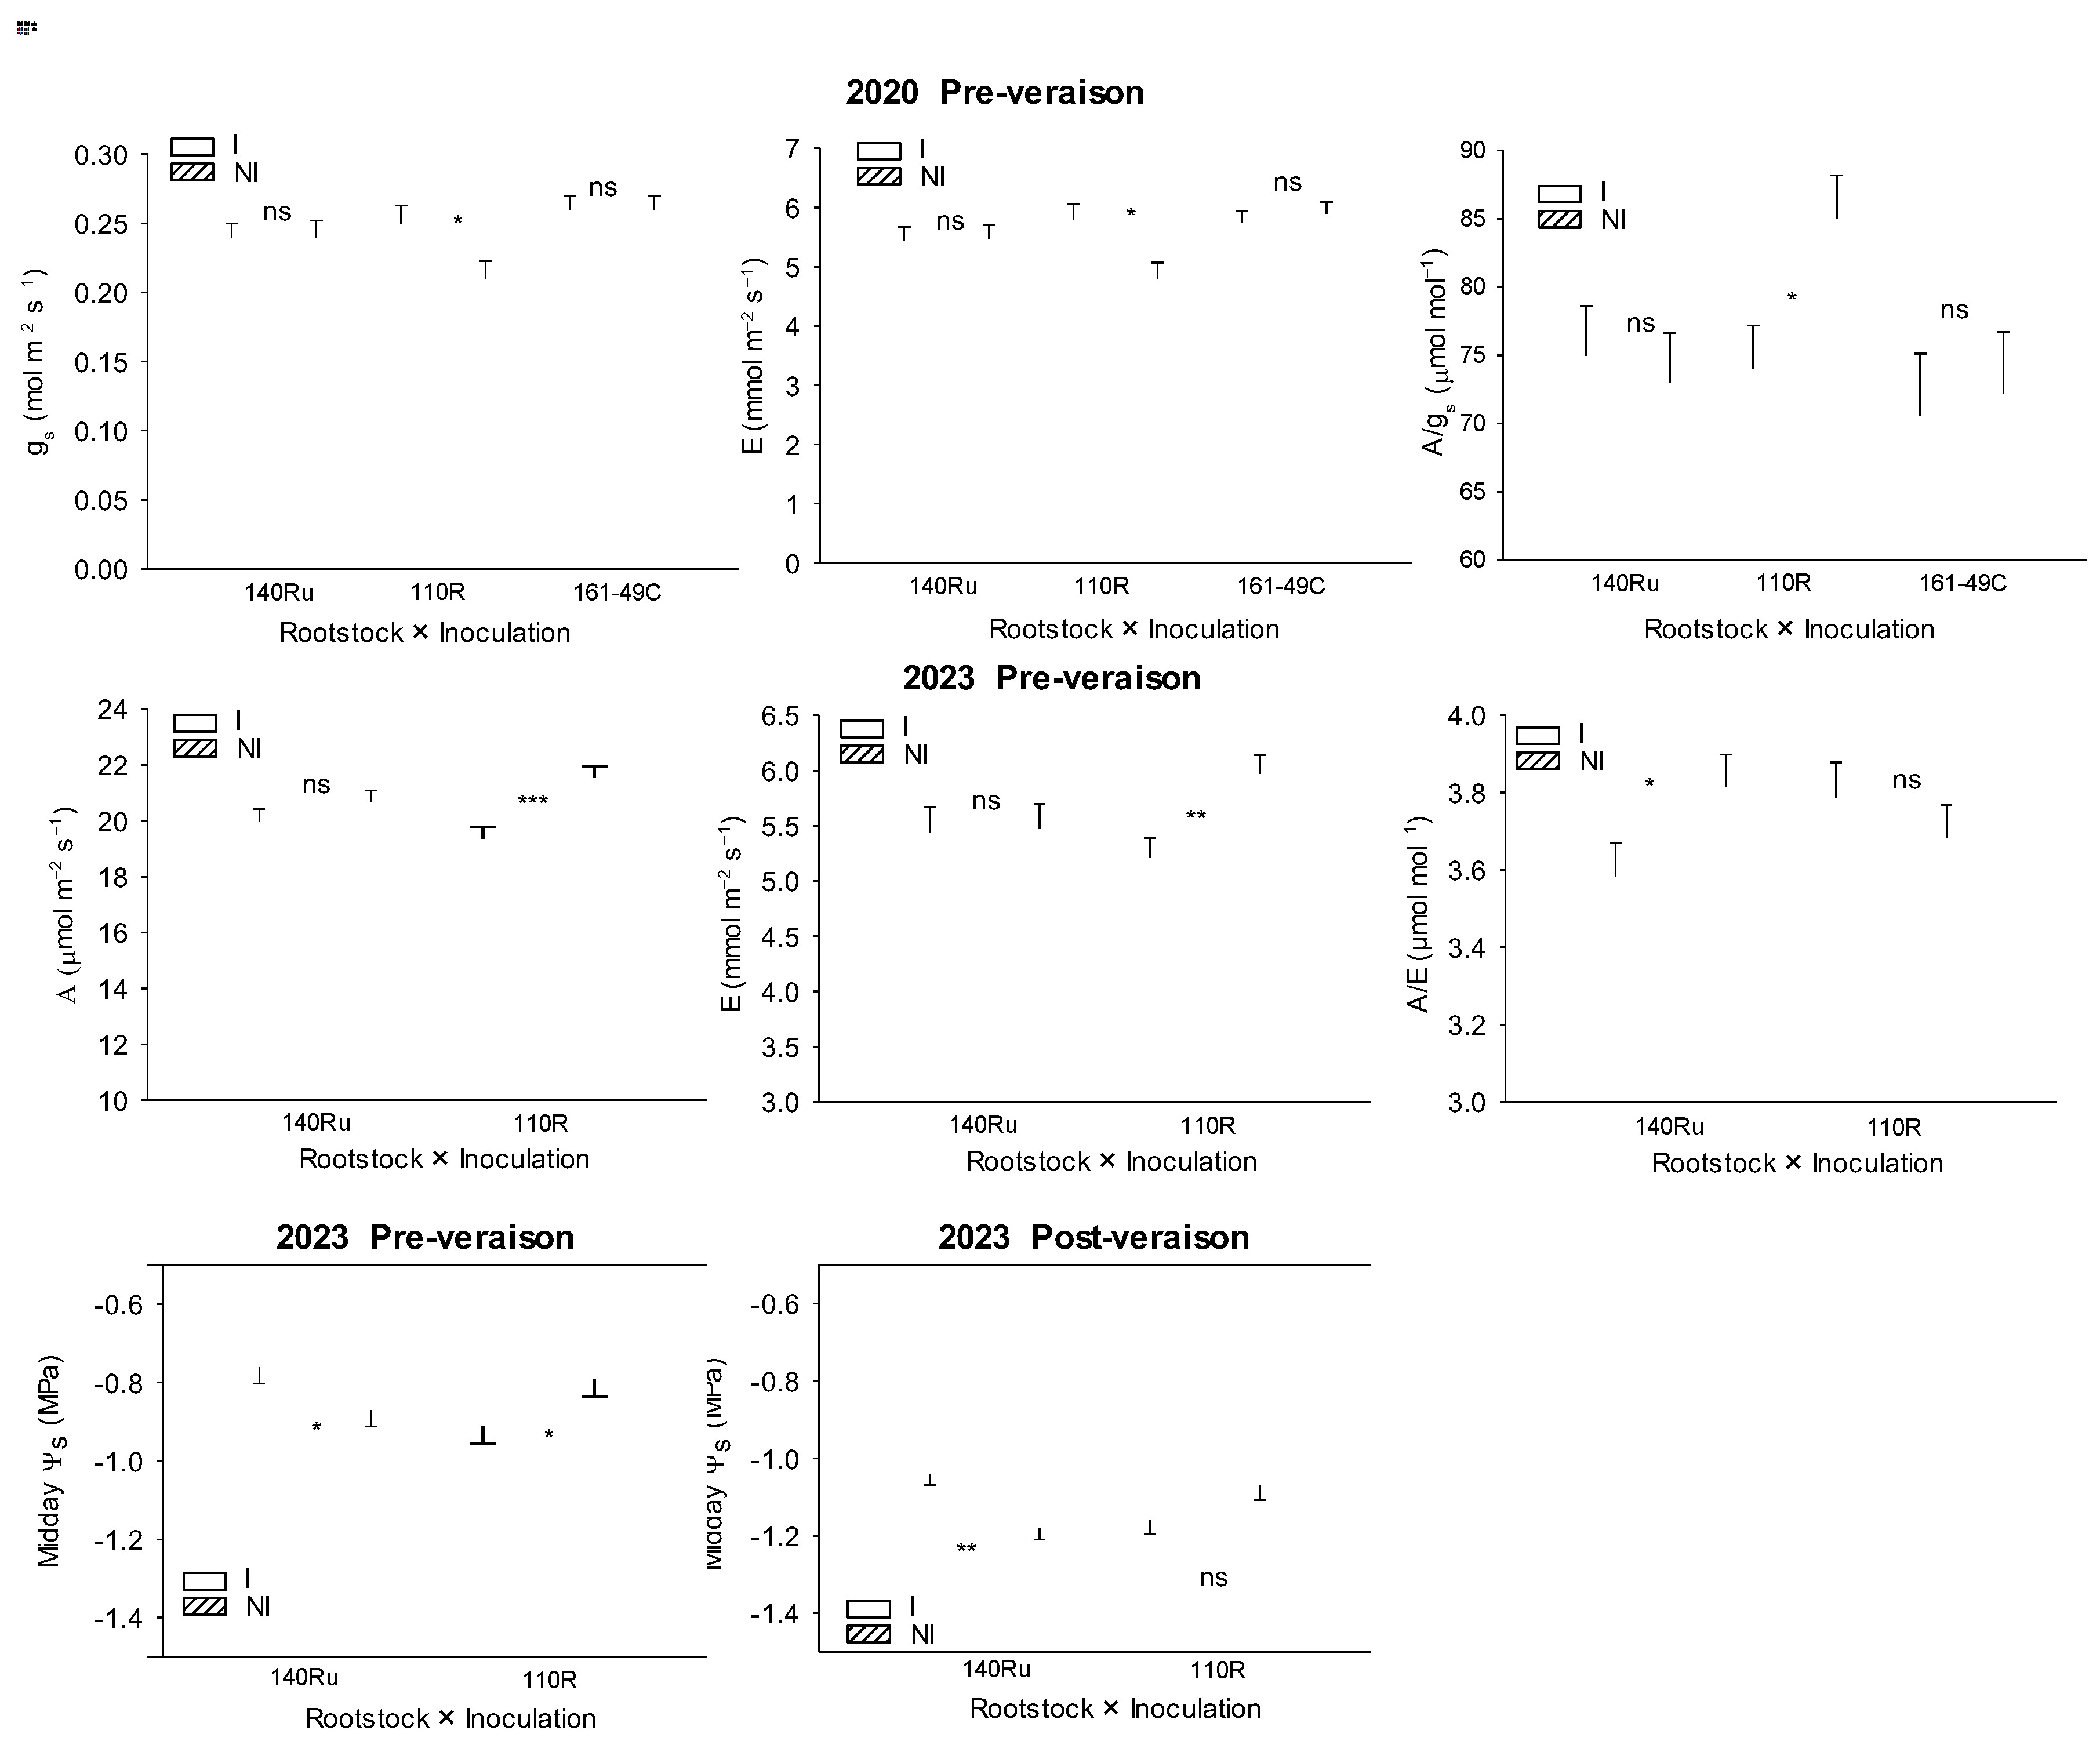
Figure 11.
Significant interactive effects between rootstock and microbial inoculation on vegetative (main shoot length; total leaf area, TLA; winter pruning weight, PW), and reproductive parameters in Monastrell vines grafted onto three different rootstocks (140Ru, 110R, and 161-49C) and under two different microbial inoculation conditions (I vs. NI), for the years 2021, 2022, and 2023. For each of the rootstocks, a one-way ANOVA was performed for each vegetative and reproductive parameter. ns, not significant; * P < 0.05; ** P < 0.01. Mean values for each of the rootstocks were compared using Duncan's multiple range test at a 95% confidence level.
Figure 11.
Significant interactive effects between rootstock and microbial inoculation on vegetative (main shoot length; total leaf area, TLA; winter pruning weight, PW), and reproductive parameters in Monastrell vines grafted onto three different rootstocks (140Ru, 110R, and 161-49C) and under two different microbial inoculation conditions (I vs. NI), for the years 2021, 2022, and 2023. For each of the rootstocks, a one-way ANOVA was performed for each vegetative and reproductive parameter. ns, not significant; * P < 0.05; ** P < 0.01. Mean values for each of the rootstocks were compared using Duncan's multiple range test at a 95% confidence level.
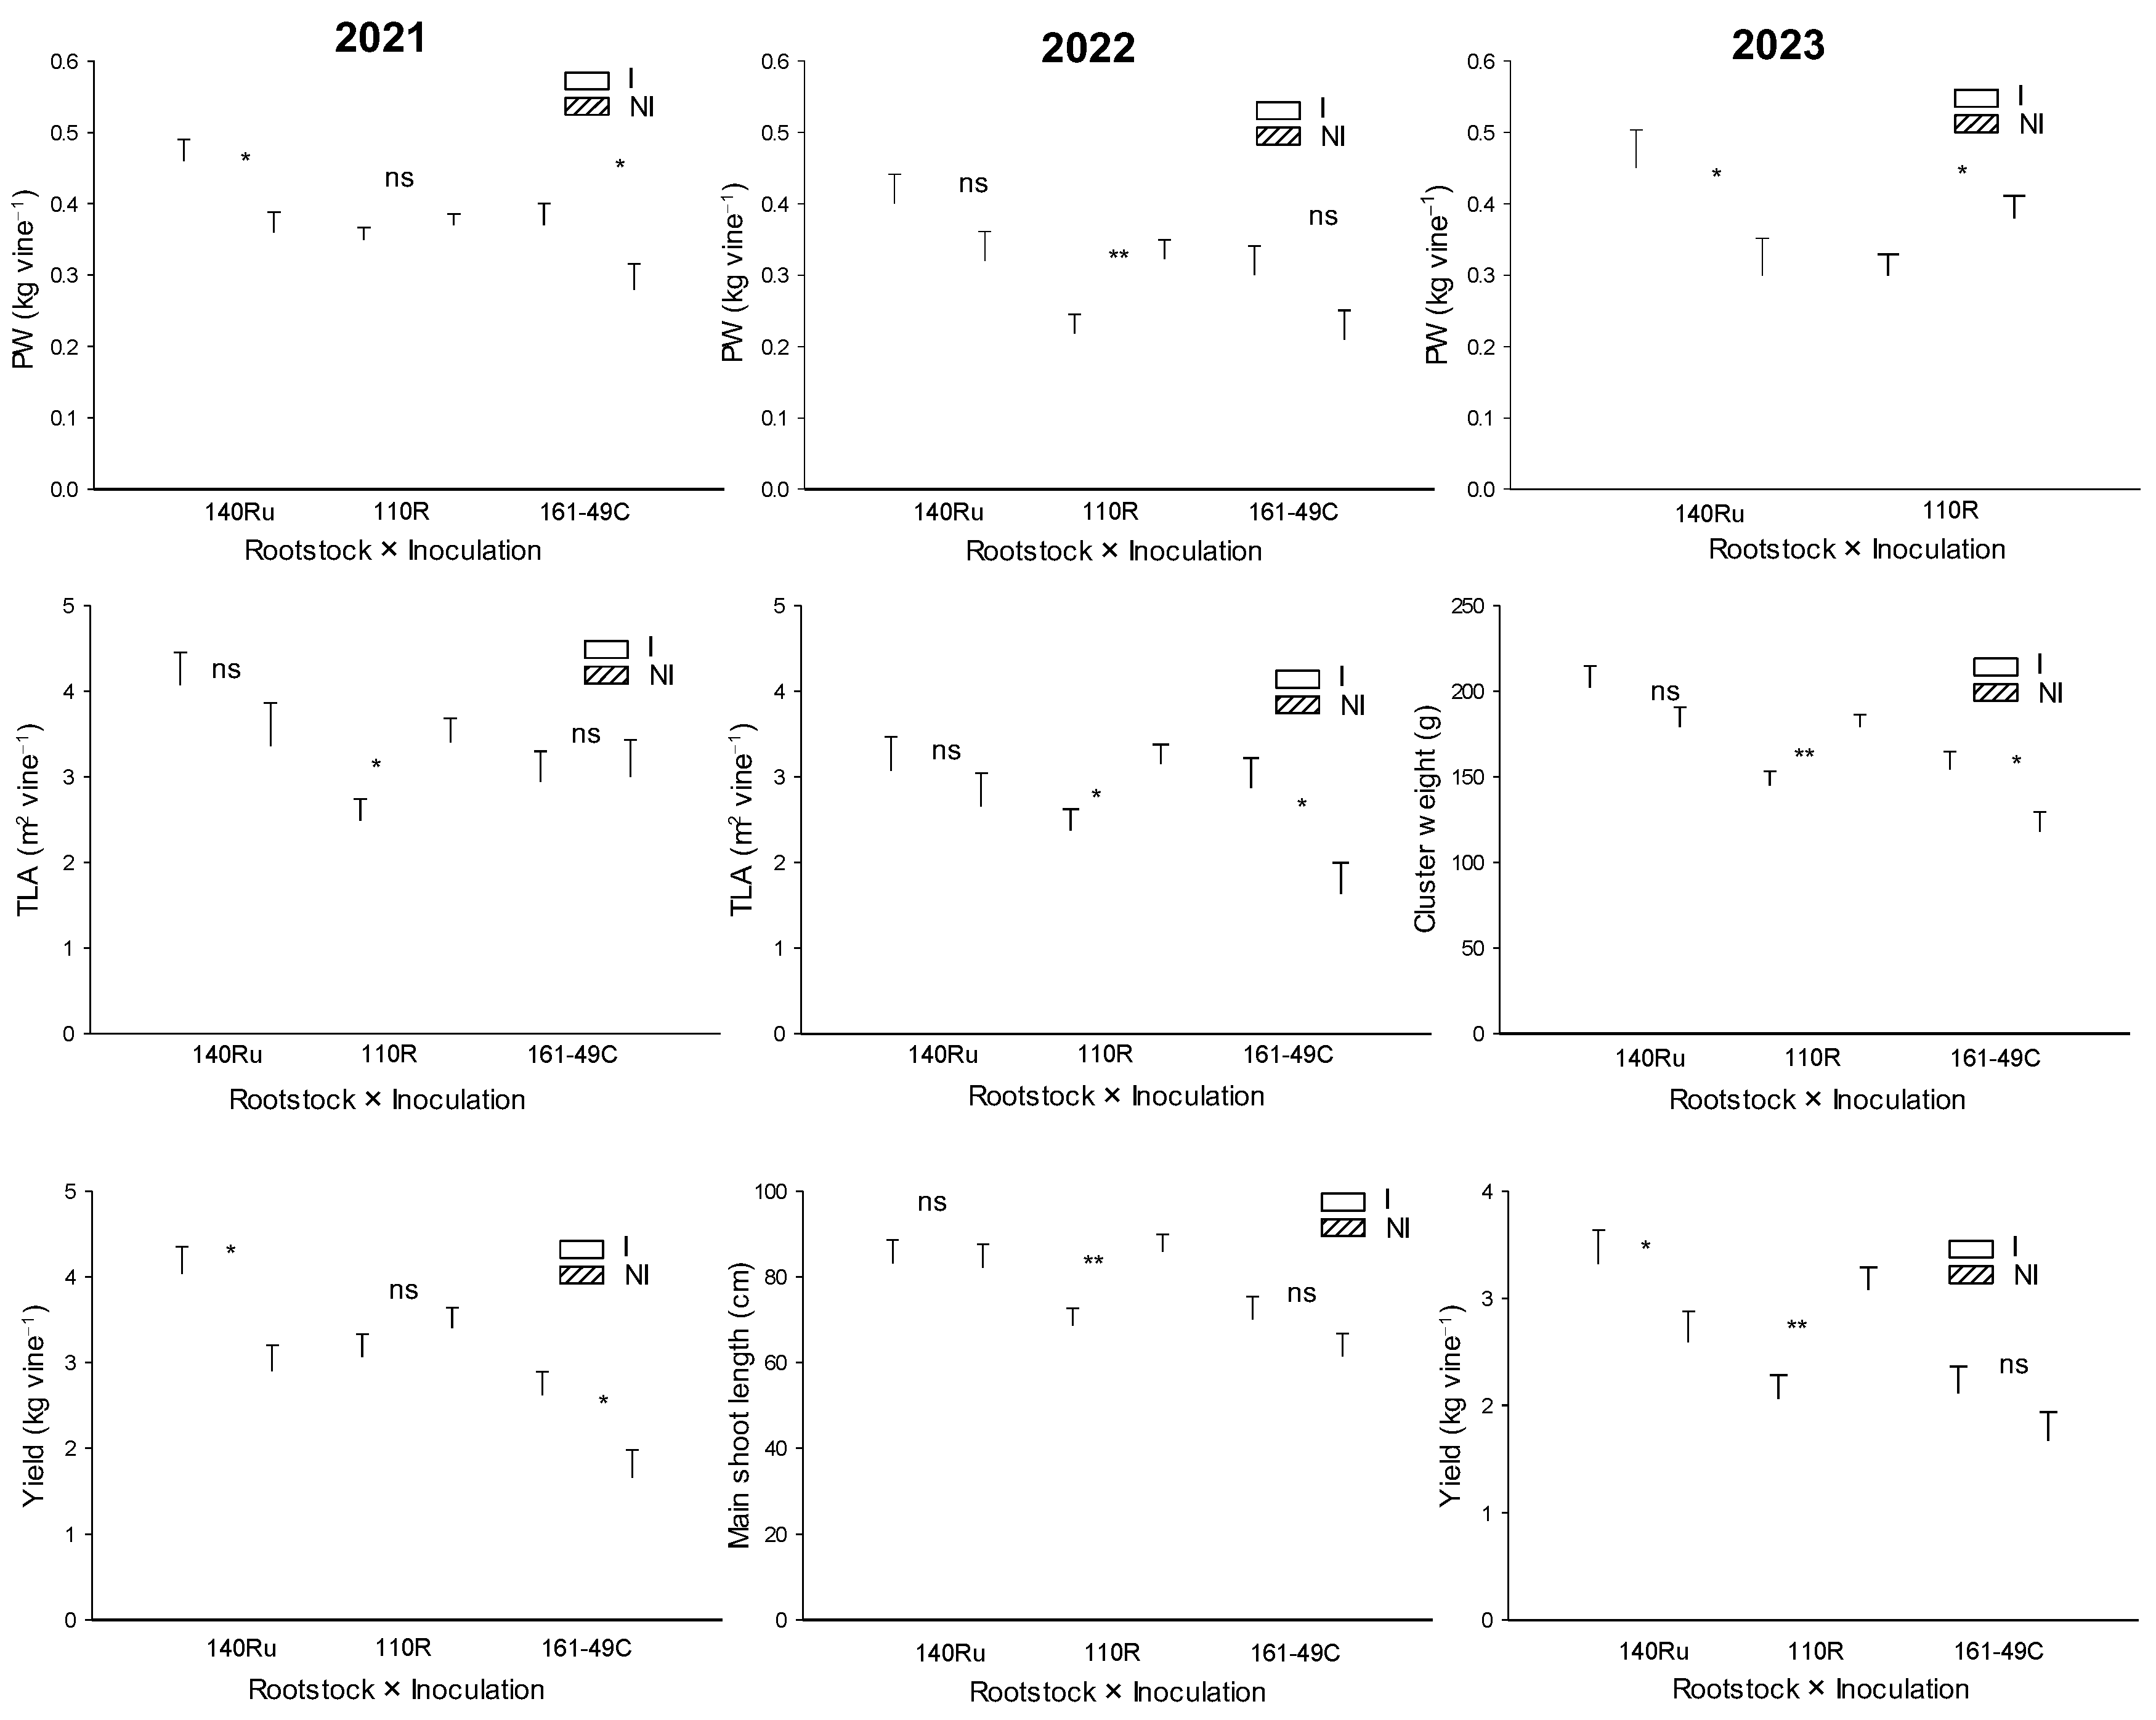
Figure 12.
Mean values of berry weight, berry phenolic quality parameters, and must mineral content in Monastrell vines grafted onto three different rootstocks (140Ru, 110R, and 161-49C) and under two different microbial inoculation conditions (I vs. NI), during the experimental period (2018–2023). ns, not significant; * P < 0.1; ** P < 0.05; *** P < 0.01. Significant differences between the mean values for each of the rootstocks were determined using Duncan's multiple range test at a 95% confidence level.
Figure 12.
Mean values of berry weight, berry phenolic quality parameters, and must mineral content in Monastrell vines grafted onto three different rootstocks (140Ru, 110R, and 161-49C) and under two different microbial inoculation conditions (I vs. NI), during the experimental period (2018–2023). ns, not significant; * P < 0.1; ** P < 0.05; *** P < 0.01. Significant differences between the mean values for each of the rootstocks were determined using Duncan's multiple range test at a 95% confidence level.
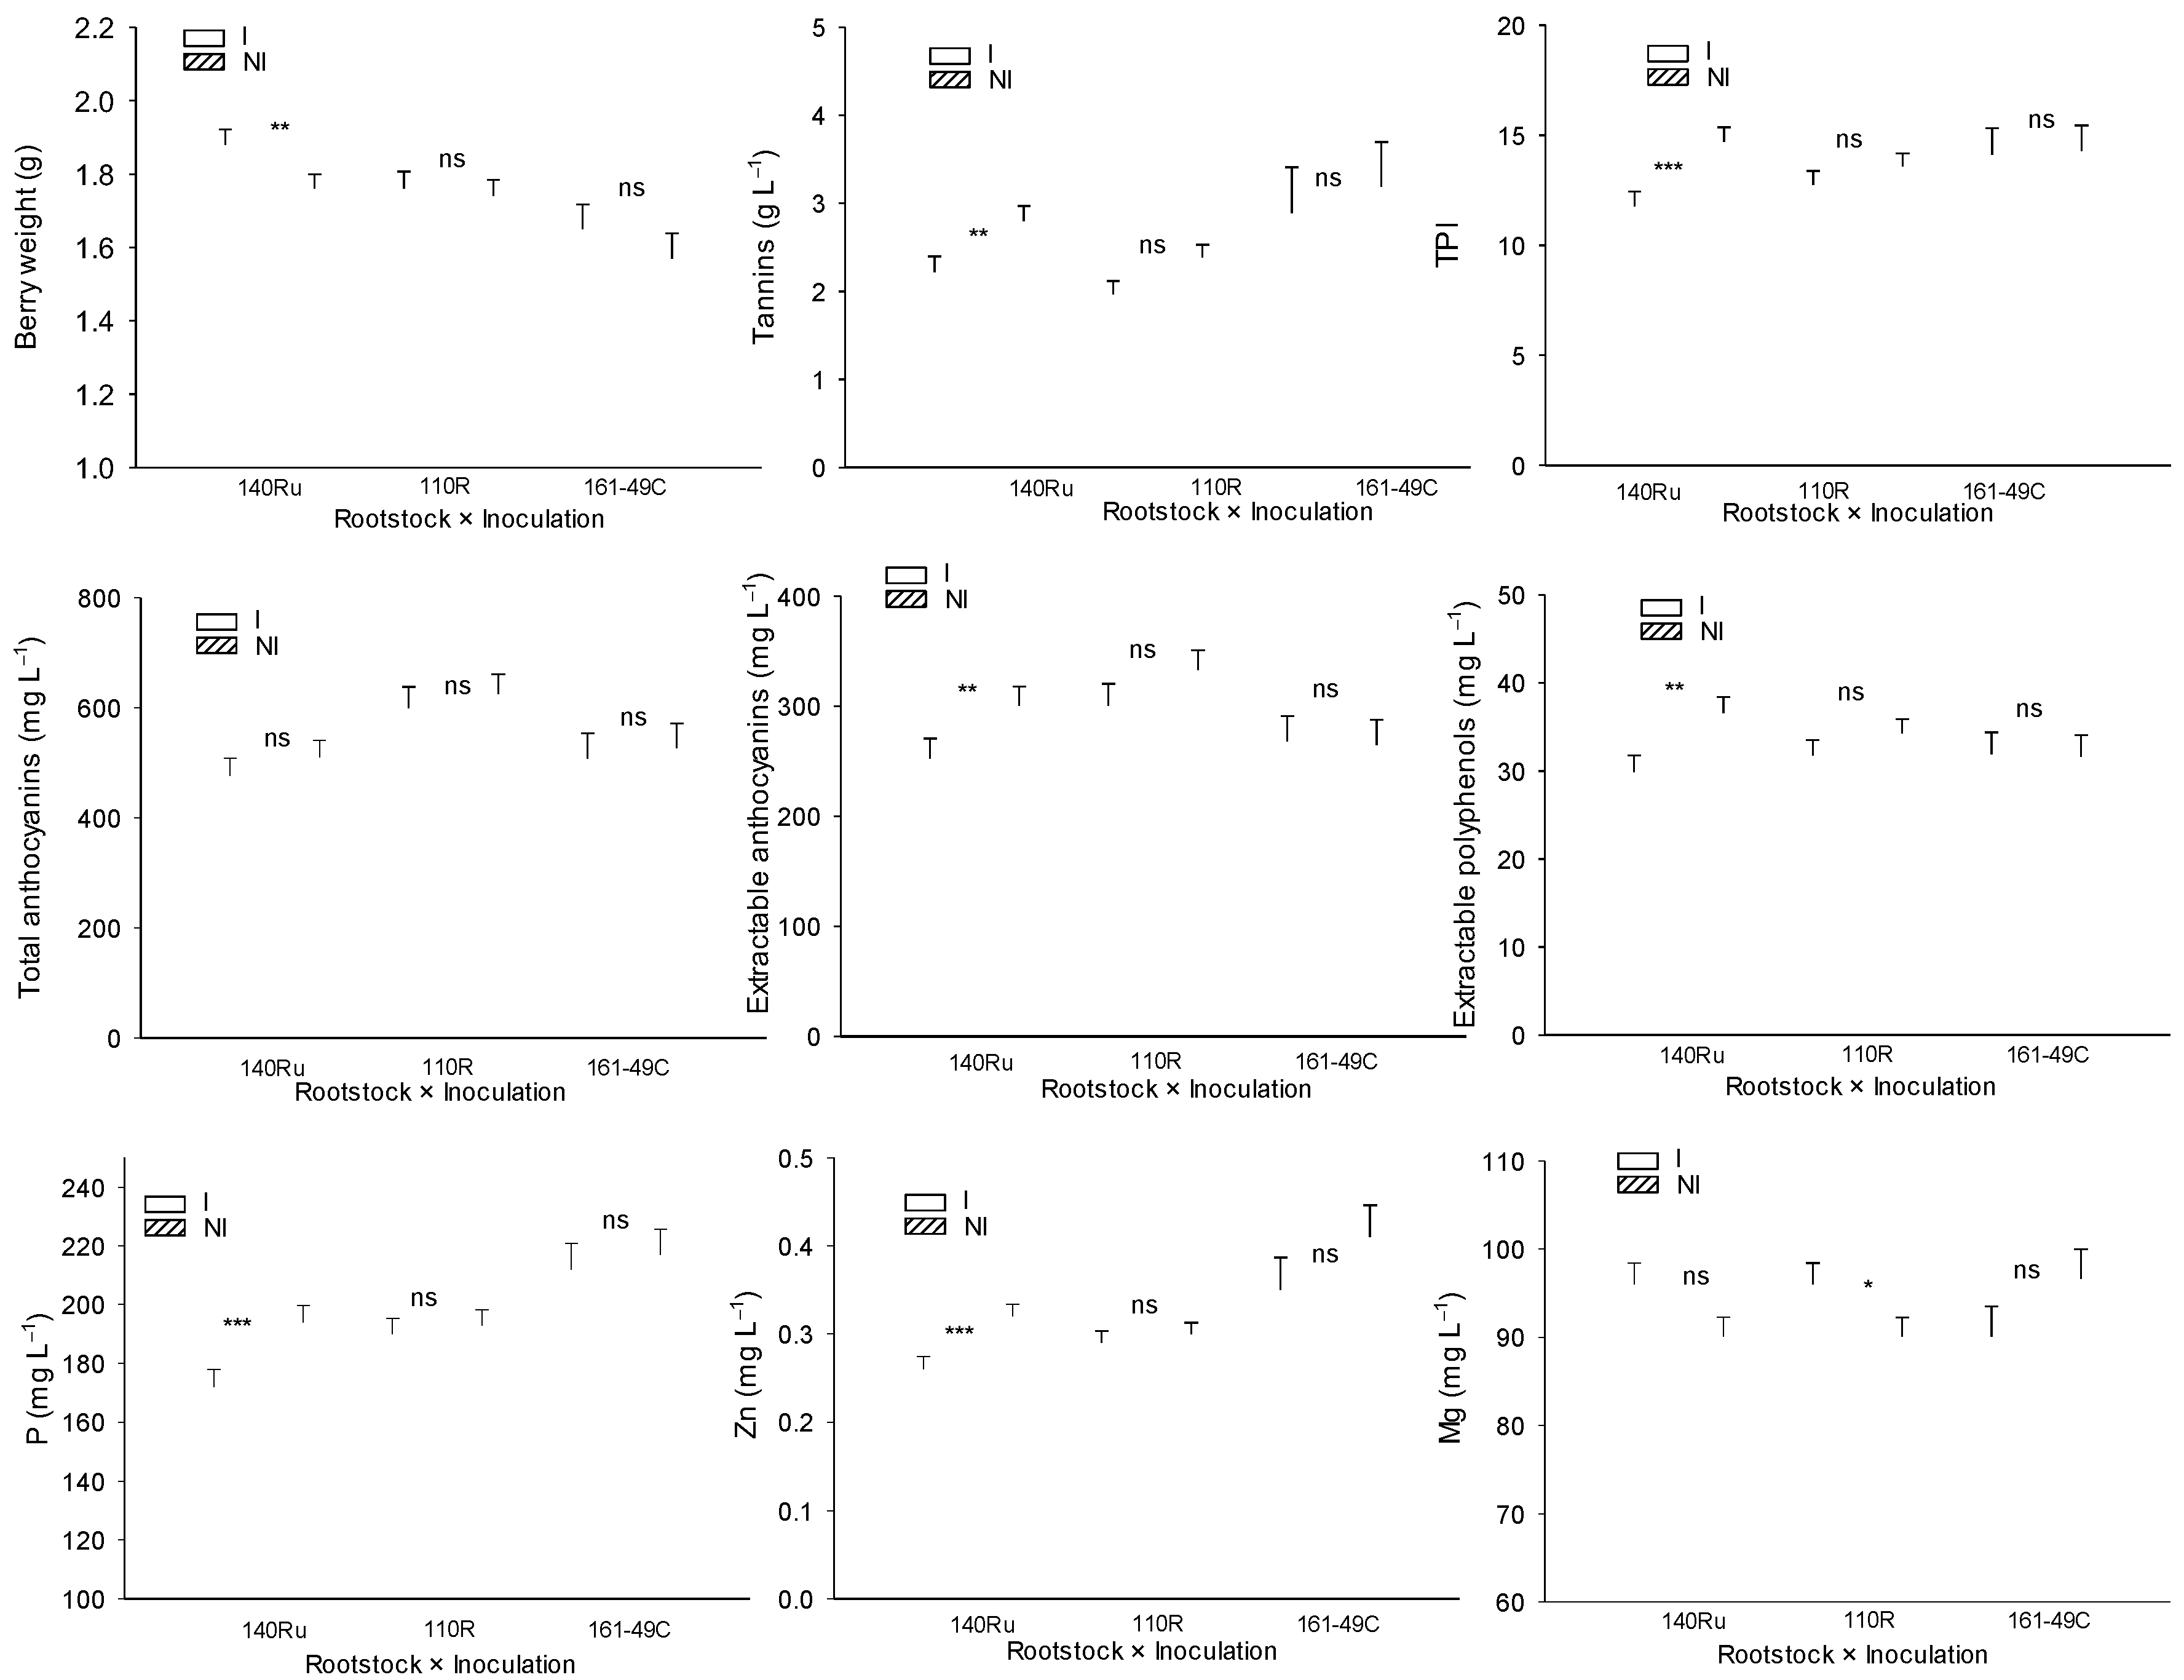

Table 1.
Annual applied volume of irrigation water and mean values of key climatic parameters for each year of the experiment in the study area.
Table 1.
Annual applied volume of irrigation water and mean values of key climatic parameters for each year of the experiment in the study area.
| Year | Irrigation (mm year−1) | ETo (mm year−1) | VPD (kPa) | Rainfall (mm year−1) | Tmax (°C) | Tmean (°C) | Tmin (°C) | RHmean (%) | Solar rad. (W m−2) | Daily sunshine (hours) |
|---|---|---|---|---|---|---|---|---|---|---|
| High irrigation conditions | ||||||||||
| 2018 | 274.4 | 1162 | 0.92 | 392 | 22.46 | 14.98 | 7.59 | 61.79 | 200.07 | 9.43 |
| 2019 | 283.1 | 1173 | 0.98 | 427 | 23.03 | 15.08 | 6.99 | 60.24 | 206.30 | 9.49 |
| 2020 | 304.0 | 1106 | 0.97 | 393 | 23.34 | 15.28 | 8.07 | 63.26 | 202.14 | 9.42 |
| Deficit irrigation conditions | ||||||||||
| 2021 | 103.5 | 1100 | 0.93 | 321 | 23.10 | 15.36 | 7.57 | 63.66 | 197.32 | 9.32 |
| 2022 | 89.4 | 1200 | 1.09 | 300 | 25.03 | 16.13 | 7.33 | 61.80 | 191.80 | 9.45 |
| 2023 | 90.6 | 1105 | 1.09 | 162 | 24.55 | 15.81 | 7.04 | 57.25 | 203.98 | 9.43 |
Table 2.
Mean values of total glomalin (TG) in the soil at the end of the experiment in 2023, mean values of oxygen diffusion rate (ODR) in the soil in pre- and post-veraison of 2021, and mean values of TBI parameters (stabilization factor S, and decomposition rate constant k) measured in 2019. Data were recorded for rootstocks 140Ru, 110R, and 161-49C in inoculated (I) and non-inoculated (NI) treatments.
Table 2.
Mean values of total glomalin (TG) in the soil at the end of the experiment in 2023, mean values of oxygen diffusion rate (ODR) in the soil in pre- and post-veraison of 2021, and mean values of TBI parameters (stabilization factor S, and decomposition rate constant k) measured in 2019. Data were recorded for rootstocks 140Ru, 110R, and 161-49C in inoculated (I) and non-inoculated (NI) treatments.
| Rootstock (R) | TG (μg g−1 soil DW) | ODR (μg m−2 s−1) | S | k | S/k | ||
| Pre-veraison | Post-veraison | ||||||
| 140Ru | 2267 | 62.8 | 48.5 | 0.23 | 0.019 | 14.3 | |
| 110R | 2194 | 54.8 | 44.5 | 0.21 | 0.019 | 12.1 | |
| 161-49C | - | 56.6 | 44.7 | - | - | - | |
| Microbial inoculation (MI) | |||||||
| I | 2378 | 58.3 | 46.9 | 0.22 | 0.023 | 10.5 | |
| NI | 2083 | 57.8 | 45.0 | 0.22 | 0.016 | 15.9 | |
| R × MI | |||||||
| 140Ru | I | 2580b | 65.8 | 49.6b | 0.22 | 0.024 | 10.1 |
| NI | 1953a | 59.8 | 47.5ab | 0.24 | 0.015 | 18.5 | |
| 110R | I | 2176ab | 53.5 | 41.6ab | 0.21 | 0.021 | 10.9 |
| NI | 2212ab | 56.1 | 47.5ab | 0.21 | 0.017 | 13.3 | |
| 161-49C | I | - | 55.6 | 49.6b | - | - | - |
| NI | - | 57.6 | 39.9a | - | - | - | |
| ANOVA | |||||||
| R | ns | ns | ns | ns | ns | ns | |
| MI | ns | ns | ns | ns | *** | *** | |
| R × MI | * | ns | * | ns | ns | ns | |
ns, not significant; * P < 0.05; *** P < 0.001. In each column and for each factor or interaction, different letters indicate significant differences according to Duncan's multiple range test at a 95% confidence level.
Table 3.
Mean values of leaf gas exchange parameters in the early morning (9:00 a.m.–10:30 a.m.) and midday stem water potential (12:30 p.m.–2:00 p.m.) measured in Monastrell young plants (from 1 to 6 years old) grafted onto three different rootstocks (140Ru, 110R, and 161-49C) and under two different microbial inoculation conditions (I vs. NI) for each of the years and in two different phenological periods (pre- and post-veraison) during the experimental period (2018–2023). A, net photosynthesis rate (μmol m−2 s−1); gs, stomatal conductance rate (mol m−2 s−1); E, transpiration rate (mmol m−2 s−1); A/gs, intrinsic leaf water use efficiency (μmol CO2 mol−1 H2O); A/E, instantaneous leaf water use efficiency (μmol CO2 mmol−1 H2O); Ψs, midday stem water potential (MPa).
Table 3.
Mean values of leaf gas exchange parameters in the early morning (9:00 a.m.–10:30 a.m.) and midday stem water potential (12:30 p.m.–2:00 p.m.) measured in Monastrell young plants (from 1 to 6 years old) grafted onto three different rootstocks (140Ru, 110R, and 161-49C) and under two different microbial inoculation conditions (I vs. NI) for each of the years and in two different phenological periods (pre- and post-veraison) during the experimental period (2018–2023). A, net photosynthesis rate (μmol m−2 s−1); gs, stomatal conductance rate (mol m−2 s−1); E, transpiration rate (mmol m−2 s−1); A/gs, intrinsic leaf water use efficiency (μmol CO2 mol−1 H2O); A/E, instantaneous leaf water use efficiency (μmol CO2 mmol−1 H2O); Ψs, midday stem water potential (MPa).
| Pre-veraison | Post-veraison | |||||||||||
| A | gs | E | A/gs | A/E | Ψs | A | gs | E | A/gs | A/E | Ψs | |
| Rootstock (R) | 2018 | |||||||||||
| 140Ru | 18.8 | 0.160 | 4.6 | 140 | 4.7 | −0.69 | 17.0a | 0.239a | 5.8 | 78 | 3.0 | −0.75 |
| 110R | 18.4 | 0.156 | 4.6 | 136 | 4.5 | −0.68 | 18.3b | 0.279b | 6.3 | 70 | 3.0 | −0.75 |
| 161-49C | 17.9 | 0.137 | 4.1 | 152 | 4.9 | −0.68 | 17.7ab | 0.268ab | 6.3 | 70 | 2.9 | −0.75 |
| Microbial inoculation(MI) | ||||||||||||
| I | 18.7 | 0.158 | 4.6 | 139 | 4.6 | −0.69 | 18.1 | 0.270 | 6.4 | 72 | 2.9 | −0.76 |
| NI | 18.0 | 0.144 | 4.2 | 146 | 4.9 | −0.67 | 17.2 | 0.254 | 5.8 | 73 | 3.1 | −0.74 |
| ANOVA | ||||||||||||
| R | ns | ns | ns | ns | ns | ns | * | * | ns | ns | ns | ns |
| MI | ns | ns | ns | ns | ns | ns | * | ns | * | ns | ** | ns |
| R × MI | ns | ns | ns | ns | ns | ns | ns | ns | ns | ns | ns | ns |
| Rootstock (R) | 2020 | |||||||||||
| 140Ru | 17.2 | 0.241 | 5.5ab | 74.2 | 3.2a | - | 14.4 | 0.168ab | 4.5a | 91.9ab | 3.4 | - |
| 110R | 18.0 | 0.231 | 5.3a | 79.4 | 3.5b | - | 13.7 | 0.156a | 4.3a | 94.6b | 3.4 | - |
| 161-49C | 17.8 | 0.256 | 5.8b | 71.4 | 3.1a | - | 15.3 | 0.210b | 5.3b | 78.5a | 3.0 | - |
| Microbial inoculation (MI) | ||||||||||||
| I | 17.8 | 0.250 | 5.7 | 73.1 | 3.2 | - | 14.7 | 0.181 | 4.8 | 85.9 | 3.2 | - |
| NI | 17.5 | 0.235 | 5.4 | 76.8 | 3.4 | - | 14.3 | 0.175 | 4.6 | 90.8 | 3.3 | - |
| ANOVA | ||||||||||||
| R | ns | ns | * | ns | *** | - | ns | ** | ** | * | ns | - |
| MI | ns | ns | ns | ns | ns | - | ns | ns | ns | ns | ns | - |
| R × MI | ns | ns | ** | ns | ** | - | ns | ns | ns | ns | ns | - |
| Rootstock (R) | 2021 | |||||||||||
| 140Ru | 15.0 | 0.164 | 4.0 | 95.4 | 3.8 | −0.97 | 12.5 | 0.117 | 2.9 | 117.7 | 4.6 | −1.28b |
| 110R | 14.8 | 0.168 | 4.0 | 93.2 | 3.7 | −1.02 | 12.6 | 0.119 | 2.9 | 115.2 | 4.5 | −1.24b |
| 161-49C | 15.0 | 0.156 | 3.9 | 97.1 | 3.9 | −1.07 | 11.4 | 0.115 | 2.8 | 113.3 | 4.3 | −1.39a |
| Microbial inoculation (MI) | ||||||||||||
| I | 14.8 | 0.159 | 3.9 | 97.3 | 3.8 | −1.04 | 11.7 | 0.114 | 2.8 | 113.5 | 4.3 | −1.30 |
| NI | 14.9 | 0.166 | 4.0 | 93.1 | 3.8 | −1.00 | 12.7 | 0.120 | 2.9 | 117.4 | 4.6 | −1.30 |
| ANOVA | ||||||||||||
| R | ns | ns | ns | ns | ns | ns | ns | ns | ns | ns | ns | * |
| MI | ns | ns | ns | ns | ns | ns | ns | ns | ns | ns | ** | ns |
| R × MI | ns | ns | ns | ns | ns | ns | ns | ns | ns | ns | ns | ns |
| Rootstock (R) | 2023 | |||||||||||
| 140Ru | 20.3 | - | 5.6 | - | 3.7 | −0.81 | 14.0 | 0.148 | 3.9 | 103.0 | 3.8 | −1.11 |
| 110R | 20.5 | - | 5.6 | - | 3.7 | −0.85 | 13.9 | 0.138 | 4.0 | 105.3 | 3.7 | −1.12 |
| 161-49C | - | - | - | - | - | - | - | - | - | - | - | |
| Microbial inoculation (MI) | ||||||||||||
| I | 19.7 | - | 5.4 | - | 3.7 | −0.83 | 13.5 | 0.129 | 3.6 | 107.7 | 3.9 | −1.10 |
| NI | 21.1 | - | 5.8 | - | 3.8 | −0.83 | 14.5 | 0.157 | 4.3 | 100.5 | 3.6 | −1.12 |
| ANOVA | ||||||||||||
| R | ns | - | ns | - | ns | ns | ns | ns | ns | ns | ns | ns |
| MI | *** | - | ** | - | ns | ns | * | ** | ** | * | ns | ns |
| R × MI | * | - | ** | - | * | ** | ns | ns | ns | ns | ns | ** |
ns, not significant; * P < 0.1; ** P < 0.05; *** P < 0.01. In each column and for each factor or interaction, different letters indicate significant differences according to Duncan's multiple range test at a 95% confidence level.
Table 4.
Leaf mineral concentration in Monastrell plants at veraison grafted onto three different rootstocks (140Ru, 110R, and 161-49C) and under two different microbial inoculation conditions (I vs. NI) in 2018, 2021, and 2023. N, P, K, Ca, Mg, and Na in % in DW, Fe, Cu, Mn, Zn, and B in mg L−1.
Table 4.
Leaf mineral concentration in Monastrell plants at veraison grafted onto three different rootstocks (140Ru, 110R, and 161-49C) and under two different microbial inoculation conditions (I vs. NI) in 2018, 2021, and 2023. N, P, K, Ca, Mg, and Na in % in DW, Fe, Cu, Mn, Zn, and B in mg L−1.
| N | P | K | Ca | Mg | Na | Fe | Zn | Mn | Cu | B | ||
| Rootstock (R) | 2018 | |||||||||||
| 140Ru | 3.0a | 0.158a | 0.62a | 2.15 | 0.45b | 0.044a | 75.6 | 19.1 | 147 | 11.1 | 38.3 | |
| 110R | 3.2b | 0.179b | 0.73b | 1.94 | 0.36a | 0.047a | 76.5 | 18.3 | 133 | 11.5 | 49.1 | |
| 161-49C | 3.2b | 0.178b | 0.75b | 2.08 | 0.35a | 0.059b | 68.1 | 19.2 | 153 | 12.3 | 43.3 | |
| Microbial inoculation (MI) | ||||||||||||
| I | 3.2 | 0.175 | 0.72 | 2.03 | 0.39 | 0.047 | 70.5 | 18.7 | 146 | 11.6 | 42.8 | |
| NI | 3.1 | 0.169 | 0.67 | 2.08 | 0.38 | 0.053 | 76.4 | 19.1 | 143 | 11.6 | 44.3 | |
| ANOVA | ||||||||||||
| R | ** | ** | ** | ns | **** | ** | ns | ns | ns | ns | ns | |
| MI | ns | ns | ns | ns | ns | ns | ns | ns | ns | ns | ns | |
| R × MI | ns | ns | ns | ns | ns | ns | ns | ** | ns | ns | ns | |
| Rootstock (R) | 2021 | |||||||||||
| 140Ru | 2.52 | 0.142 | 0.65 | 1.64 | 0.33b | 0.053b | 84.7 | 33.8 | 133ab | 14.4 | 27.7a | |
| 110R | 2.47 | 0.139 | 0.65 | 1.62 | 0.28a | 0.040a | 83.7 | 32.9 | 125a | 13.1 | 31.5b | |
| 161-49C | 2.43 | 0.138 | 0.69 | 1.67 | 0.26a | 0.037a | 82.5 | 35.3 | 145b | 13.9 | 25.6a | |
| Microbial inoculation (MI) | ||||||||||||
| I | 2.48 | 0.140 | 0.68 | 1.67 | 0.30 | 0.033 | 80.6 | 36.6 | 136 | 13.7 | 27.8 | |
| NI | 2.47 | 0.139 | 0.65 | 1.62 | 0.29 | 0.054 | 86.7 | 31.4 | 132 | 13.9 | 28.7 | |
| R × MI | ||||||||||||
| 140Ru | I | 2.51 | 0.144 | 0.69 | 1.74bc | 0.34d | 0.032a | 80.7 | 35.7 | 135bc | 14.5bc | 27.9 |
| NI | 2.53 | 0.139 | 0.62 | 1.54a | 0.32cd | 0.075c | 88.6 | 31.9 | 131ab | 14.4bc | 27.4 | |
| 110R | I | 2.41 | 0.139 | 0.64 | 1.68abc | 0.31cd | 0.033a | 79.3 | 36.0 | 135bc | 13.9abc | 31.6 |
| NI | 2.53 | 0.139 | 0.65 | 1.57a | 0.26ab | 0.047b | 88.2 | 29.8 | 115a | 12.2a | 31.3 | |
| 161-49C | I | 2.52 | 0.137 | 0.70 | 1.59ab | 0.24a | 0.033a | 81.8 | 38.0 | 139bc | 12.6ab | 23.9 |
| NI | 2.35 | 0.139 | 0.67 | 1.76c | 0.29bc | 0.040ab | 83.3 | 32.5 | 151c | 15.2c | 27.3 | |
| ANOVA | ||||||||||||
| R | ns | ns | ns | ns | *** | *** | ns | ns | *** | ns | *** | |
| MI | ns | ns | ns | ns | ns | *** | ** | *** | ns | ns | ns | |
| R × MI | ns | ns | ns | *** | *** | *** | ns | ns | ** | *** | ns | |
| Rootstock (R) | 2023 | |||||||||||
| 140Ru | 2.27 | 0.111 | 0.64 | 1.63 | 0.35 | 0.017 | 65.2 | 28.3 | 133 | 18.3 | 48.9 | |
| 110R | 2.25 | 0.111 | 0.62 | 1.60 | 0.29 | 0.016 | 63.4 | 28.0 | 119 | 20.2 | 48.2 | |
| Microbial inoculation (MI) | ||||||||||||
| I | 2.26 | 0.116 | 0.68 | 1.63 | 0.34 | 0.016 | 66.0 | 28.7 | 134 | 23.4 | 52.9 | |
| NI | 2.26 | 0.108 | 0.58 | 1.59 | 0.30 | 0.018 | 62.5 | 27.6 | 119 | 15.2 | 44.1 | |
| R × MI | ||||||||||||
| 140Ru | I | 2.27 | 0.116 | 0.66 | 1.72b | 0.38b | 0.016 | 65.5 | 26.9a | 141 | 19.3a | 57.3 |
| NI | 2.27 | 0.107 | 0.62 | 1.53a | 0.32a | 0.019 | 64.8 | 29.7ab | 126 | 17.4a | 40.4 | |
| 110R | I | 2.26 | 0.115 | 0.71 | 1.54a | 0.29a | 0.015 | 66.6 | 30.4b | 127 | 27.4b | 48.6 |
| NI | 2.25 | 0.109 | 0.54 | 1.65ab | 0.29a | 0.017 | 60.2 | 25.5a | 111 | 13.0a | 47.8 | |
| ANOVA | ||||||||||||
| R | ns | ns | ns | ns | *** | ns | ns | ns | ns | ns | ns | |
| MI | ns | *** | ** | ns | ** | ns | ns | ns | ns | *** | ns | |
| R × MI | ns | ns | ns | * | * | ns | ns | *** | ns | ** | ns | |
ns, not significant; * P < 0.1; ** P < 0.05; *** P < 0.01. In each column and for each factor or interaction, different letters indicate significant differences according to Duncan's multiple range test at a 95% confidence level.
Table 5.
Mean values of vegetative (main shoot length; total leaf area, TLA; winter pruning weight, PW), and reproductive parameters of Monastrell plants grafted onto three different rootstocks (140Ru, 110R, and 161-49C) and under two different microbial inoculation conditions (I vs. NI) for each of the years during the experimental period (2018–2023).
Table 5.
Mean values of vegetative (main shoot length; total leaf area, TLA; winter pruning weight, PW), and reproductive parameters of Monastrell plants grafted onto three different rootstocks (140Ru, 110R, and 161-49C) and under two different microbial inoculation conditions (I vs. NI) for each of the years during the experimental period (2018–2023).
| Main shoot length (cm) |
TLA (m2 vine−1) |
PW (kg vine−1) |
Yield (kg vine−1) |
Number of clusters vine−1 | Cluster weight (g) | |
| Rootstock (R) | 2018 | |||||
| 140Ru | 101b | 1.42b | 0.24 | 0.79b | 4.4b | 184 |
| 110R | 78a | 1.11a | 0.22 | 0.35a | 2.4a | 147 |
| 161-49C | 77a | 1.15a | 0.25 | 0.32a | 2.1a | 129 |
| Microbial inoculation (MI) | ||||||
| I | 88 | 1.20 | 0.28 | 0.47 | 2.9 | 153 |
| NI | 82 | 1.26 | 0.19 | 0.50 | 3.0 | 154 |
| ANOVA | ||||||
| R | ** | *** | ns | *** | *** | ns |
| MI | ns | ns | *** | ns | ns | ns |
| R × MI | ns | ns | ns | ns | ns | ns |
| Rootstock | 2019 | |||||
| 140Ru | 68 | 1.75 | 0.19b | 2.27b | 17.4 | 131ab |
| 110R | 67 | 1.61 | 0.15a | 1.75a | 15.1 | 118a |
| 161-49C | 78 | 2.08 | 0.17ab | 2.42b | 16.4 | 146b |
| Microbial inoculation (MI) | ||||||
| I | 76 | 2.00 | 0.18 | 2.33 | 16.4 | 144 |
| NI | 66 | 1.62 | 0.16 | 1.96 | 16.1 | 119 |
| ANOVA | ||||||
| R | ns | ns | ** | *** | ns | *** |
| MI | * | ns | ns | * | ns | *** |
| R × MI | ns | ns | ns | ns | ns | ns |
| Rootstock (R) | 2020 | |||||
| 140Ru | 94b | 2.88b | 0.41 | 2.68b | 11.3b | 212b |
| 110R | 83a | 2.37a | 0.40 | 2.02a | 9.8a | 188a |
| 161-49C | 95b | 2.97b | 0.45 | 2.81b | 11.6b | 221b |
| Microbial inoculation (MI) | ||||||
| I | 96 | 3.02 | 0.44 | 2.87 | 12.0 | 219 |
| NI | 85 | 2.46 | 0.40 | 2.14 | 9.7 | 195 |
| ANOVA | ||||||
| R | *** | *** | ns | *** | * | *** |
| MI | *** | *** | ns | *** | *** | *** |
| R × MI | ns | ns | ns | ns | ns | ns |
| Rootstock (R) | 2021 | |||||
| 140Ru | 113b | 3.72b | 0.41b | 3.37b | 17.8b | 178b |
| 110R | 95a | 2.95a | 0.36ab | 3.17b | 18.5b | 161b |
| 161-49C | 91a | 2.98a | 0.33a | 2.09a | 15.9a | 115a |
| Microbial inoculation (MI) | ||||||
| I | 103 | 3.17 | 0.39 | 3.10 | 17.7 | 159 |
| NI | 97 | 3.26 | 0.34 | 2.67 | 17.2 | 144 |
| ANOVA | ||||||
| R | *** | * | *** | *** | ** | *** |
| MI | ns | ns | ** | ** | ns | ** |
| R × MI | ns | * | ** | ** | ns | ns |
| Rootstock (R) | 2022 | |||||
| 140Ru | 83b | 2.86 | 0.38b | 3.35b | 16.0b | 188 |
| 110R | 77 | 2.76 | 0.27a | 1.77a | 11.4a | 297 |
| 161-49C | 66a | 2.42 | 0.26a | 1.71a | 10.5a | 142 |
| Microbial inoculation (MI) | ||||||
| I | 74 | 2.77 | 0.31 | 2.36 | 13.0 | 263 |
| NI | 77 | 2.59 | 0.29 | 2.20 | 12.3 | 155 |
| ANOVA | ||||||
| R | *** | ns | *** | *** | *** | ns |
| MI | ns | ns | ns | ns | ns | ns |
| R × MI | ** | ** | ** | ns | ns | ns |
| Rootstock (R) | 2023 | |||||
| 140Ru | 99 | 2.66 | 0.37 | 2.95b | 13.7b | 191c |
| 110R | 73 | 1.84 | 0.30 | 2.57b | 14.2b | 162b |
| 161-49C | - | - | - | 1.96a | 11.7a | 140a |
| Microbial inoculation (MI) | ||||||
| I | 86 | 2.48 | 0.33 | 2.52 | 12.7 | 169 |
| NI | 87 | 2.02 | 0.34 | 2.47 | 13.7 | 160 |
| ANOVA | ||||||
| R | *** | * | * | *** | ** | *** |
| MI | ns | ns | ns | ns | ns | ns |
| R × MI | ns | ns | * | *** | ** | *** |
ns, not significant; * P < 0.1; ** P < 0.05; *** P < 0.01. In each column and for each factor or interaction, different letters indicate significant differences according to Duncan's multiple range test at a 95% confidence level. (-) represents data not taken.
Table 6.
Technological maturity parameters of Monastrell grape must at harvest, grafted onto three different rootstocks (140Ru, 110R, and 161-49C) and under two different microbial inoculation conditions (I vs. NI) from 2018 to 2023. Mean values are an average of five years, except for the sugar content, that uses the average of three years: berry weight (g), CI (color intensity), TSS (total soluble solids, °Brix), TA (titratable acidity, g tartaric acid L−1), MI (maturity index, TSS/TA), malic acid, tartaric acid (g L−1), glucose, fructose, and total sugar content (g L−1), anthocyanins/TSS (mg L−1 °Brix−1).
Table 6.
Technological maturity parameters of Monastrell grape must at harvest, grafted onto three different rootstocks (140Ru, 110R, and 161-49C) and under two different microbial inoculation conditions (I vs. NI) from 2018 to 2023. Mean values are an average of five years, except for the sugar content, that uses the average of three years: berry weight (g), CI (color intensity), TSS (total soluble solids, °Brix), TA (titratable acidity, g tartaric acid L−1), MI (maturity index, TSS/TA), malic acid, tartaric acid (g L−1), glucose, fructose, and total sugar content (g L−1), anthocyanins/TSS (mg L−1 °Brix−1).
| Rootstock (R) | Berry weight | CI | TSS | TA | MI | pH | Malic acid | Tartaric acid | Tartaric/malic acid ratio | Total solutes berry−1 | Total soluble sugars | Glucose | Fructose | Anthocyanins/TSS |
| 140Ru | 1.88b | 3.99a | 21.83a | 3.60b | 70a | 4.20b | 2.00b | 3.26 | 1.66a | 0.41b | 302ab | 146ab | 156ab | 19.1a |
| 110R | 1.84b | 4.66b | 22.65b | 3.43a | 77b | 4.21b | 1.64a | 3.37 | 2.31b | 0.41b | 328b | 160b | 168b | 23.6b |
| 161-49C | 1.68a | 4.38b | 21.59a | 3.52ab | 71a | 4.09a | 1.54a | 3.27 | 2.54b | 0.37a | 281a | 137a | 144a | 26.2b |
| Microbial inoculation (MI) | ||||||||||||||
| I | 1.84 | 4.33 | 22.09 | 3.47 | 73 | 4.17 | 1.71 | 3.30 | 2.22 | 0.41 | 310 | 151 | 159 | 22.1 |
| NI | 1.77 | 4.36 | 21.97 | 3.56 | 72 | 4.16 | 1.74 | 3.31 | 2.11 | 0.39 | 297 | 144 | 153 | 23.8 |
| Year | ||||||||||||||
| 2018 | 1.87bc | 4.64b | 22.70c | 4.23c | 54a | 4.17ab | 3.03d | 3.89c | 1.35a | 0.42c | - | - | - | 11.1a |
| 2020 | 1.92bc | 4.16b | 24.98d | 4.27c | 58a | 4.18ab | 1.74c | 3.64c | 2.24b | 0.47d | - | - | - | 16.2a |
| 2021 | 1.47a | 4.25b | 19.10a | 3.89b | 54a | 4.06a | 1.59bc | 3.06b | 2.22b | 0.29a | 347 | 165b | 182b | 35.7b |
| 2022 | 1.96c | 3.56a | 23.13c | 2.64a | 114c | 4.16ab | 0.85a | 1.27a | 1.53a | 0.46cd | 290 | 143a | 146a | 16.1a |
| 2023 | 1.79b | 5.12c | 20.92b | 2.54a | 83b | 4.26b | 1.43b | 4.65d | 3.51c | 0.38b | 274 | 135a | 139a | 35.8b |
| ANOVA | ||||||||||||||
| R | *** | *** | *** | ** | *** | * | *** | ns | *** | *** | * | * | * | *** |
| MI | ns | ns | ns | ns | ns | ns | ns | ns | ns | ns | ns | ns | ns | ns |
| Year | *** | *** | *** | *** | *** | *** | *** | *** | *** | *** | *** | *** | *** | *** |
| R × MI | ns | ns | ns | ns | ns | ns | ns | ns | ns | ns | ns | ns | ns | ns |
ns, not significant; *, **, and *** indicate significant differences at the 0.05, 0.01, and 0.001 levels of probability, respectively. In each column and for each factor, different letters indicate significant differences according to Duncan's multiple range test at a 95% confidence level.
Table 7.
Phenolic maturity parameters of the must made from Monastrell grapes at harvest, grafted onto three different rootstocks (140Ru, 110R, and 161-49C) and under two different microbial inoculation conditions (I vs. NI) from 2018 to 2023. Mean values are the average of five years: total phenol index (TPI), extractable polyphenols (mg L−1), total anthocyanins (mg L−1), extractable anthocyanins (mg L−1), total tannins (mg g−1 FW), anthocyanin extractability index (AEI, %), seed maturity index (SMI, %), CIElab parameters (L*, a*, b*, C*, h*).
Table 7.
Phenolic maturity parameters of the must made from Monastrell grapes at harvest, grafted onto three different rootstocks (140Ru, 110R, and 161-49C) and under two different microbial inoculation conditions (I vs. NI) from 2018 to 2023. Mean values are the average of five years: total phenol index (TPI), extractable polyphenols (mg L−1), total anthocyanins (mg L−1), extractable anthocyanins (mg L−1), total tannins (mg g−1 FW), anthocyanin extractability index (AEI, %), seed maturity index (SMI, %), CIElab parameters (L*, a*, b*, C*, h*).
| Rootstock (R) | TPI | Extractable polyphenols | Total anthocyanins | Extractable anthocyanins | Total tannins | AEI | SMI | A520 | L* | a* | b* | C* | h* | ||||||||||
| 140Ru | 13.6a | 30.9 | 407a | 230a | 2.28a | 41.5 | 69.3b | 1.63a | 27.6b | 22.1b | 12.3b | 25.4b | 28.2b | ||||||||||
| 110R | 13.9ab | 31.4 | 523b | 270b | 1.93a | 45.2 | 64.8a | 1.84b | 26.0a | 20.9a | 10.7a | 23.5a | 26.5a | ||||||||||
| 161-49C | 15.4b | 42.3 | 523b | 284b | 2.80b | 40.6 | 68.0b | 1.79ab | 27.1b | 23.0b | 12.6b | 26.5b | 28.1b | ||||||||||
| Microbial inoculation (MI) | |||||||||||||||||||||||
| I | 13.5 | 32.1 | 474 | 250 | 2.11 | 43.3 | 66.7 | 1.72 | 27.0 | 22.1 | 11.8 | 25.3 | 27.4 | ||||||||||
| NI | 15.1 | 37.7 | 495 | 273 | 2.56 | 41.6 | 68.1 | 1.78 | 27.0 | 21.9 | 11.9 | 25.0 | 27.8 | ||||||||||
| Year | |||||||||||||||||||||||
| 2018 | 19.9d | 39.8b | 251a | 137a | 2.06ab | 39.0ab | 86.1d | 1.87bc | 25.7a | 19.8a | 7.6a | 21.3a | 20.5a | ||||||||||
| 2020 | 12.2b | 24.4a | 393b | 193b | 1.53a | 47.5b | 69.6c | 1.56a | 29.2b | 23.2b | 12.3b | 26.3cd | 27.6b | ||||||||||
| 2021 | 13.5b | 43.1b | 669c | 335c | 3.30c | 46.3b | 62.7b | 1.84b | 25.7a | 22.7b | 12.2b | 25.9bc | 27.6b | ||||||||||
| 2022 | 9.8a | 24.1a | 373b | 207b | 2.36b | 42.5ab | 62.2b | 1.37a | 29.4b | 23.3b | 15.5c | 28.0d | 33.4c | ||||||||||
| 2023 | 16.1c | 42.9b | 736c | 436d | 2.43b | 36.9a | 56.4a | 2.12c | 24.6a | 20.9a | 11.7b | 24.0b | 28.7b | ||||||||||
| ANOVA | |||||||||||||||||||||||
| R | * | * | *** | ** | ** | ns | ** | * | *** | *** | *** | *** | *** | ||||||||||
| MI | * | * | ns | * | * | ns | ns | ns | ns | ns | ns | ns | ns | ||||||||||
| Year | *** | *** | *** | *** | *** | * | *** | *** | *** | *** | *** | *** | *** | ||||||||||
| R × MI | ns | ns | ns | ns | ns | ns | ns | ns | ns | ns | ns | ns | ns | ||||||||||
ns, not significant; *, **, and *** indicate significant differences at the 0.05, 0.01, and 0.001 levels of probability, respectively. In each column and for each factor, different letters indicate significant differences according to Duncan's multiple range test at a 95% confidence level.
Table 8.
Average annual values of mineral composition of must at harvest in Monastrell vines grafted onto three different rootstocks (140Ru, 110R, and 161-49C) and under two different microbial inoculation conditions (I vs. NI) during the 2018–2023 6-year period. Data are expressed as mg L−1.
Table 8.
Average annual values of mineral composition of must at harvest in Monastrell vines grafted onto three different rootstocks (140Ru, 110R, and 161-49C) and under two different microbial inoculation conditions (I vs. NI) during the 2018–2023 6-year period. Data are expressed as mg L−1.
| Rootstock (R) | Ca | Mg | K | P | Cu | B | Mn | Zn | Fe |
| 140Ru | 81.1a | 101.9b | 2167c | 185a | 0.38 | 7.22a | 1.45a | 0.28a | 0.036a |
| 110R | 85.1a | 98.8ab | 2045b | 187a | 0.38 | 8.81b | 1.46a | 0.29a | 0.080b |
| 161-49C | 96.0b | 94.8a | 1943a | 209b | 0.35 | 7.36a | 1.97b | 0.35b | 0.079b |
| Microbial inoculation (MI) | |||||||||
| I | 88.0 | 99.0 | 2056 | 189 | 0.37 | 7.92 | 1.63 | 0.29 | 0.063 |
| NI | 86.8 | 98.0 | 2048 | 198 | 0.37 | 7.67 | 1.62 | 0.32 | 0.067 |
| Year | |||||||||
| 2018 | 88.3b | 113.6c | 2804e | 223b | 0.33b | 9.46c | 1.86c | 0.31b | 0.033 |
| 2020 | 98.8c | 105.8b | 2259d | 250c | 0.46d | 7.56ab | 1.80c | 0.44d | - |
| 2021 | 77.9a | 85.8a | 1350a | 159a | 0.38c | 6.78a | 1.50b | 0.28b | - |
| 2022 | 96.1c | 104.3b | 2014c | 175a | 0.41c | 8.20b | 1.86c | 0.39c | 0.097 |
| 2023 | 76.0a | 82.9a | 1831b | 161a | 0.27a | 6.97a | 1.11a | 0.099a | - |
| ANOVA | |||||||||
| R | *** | ** | *** | *** | ns | *** | *** | ** | ** |
| MI | ns | ns | ns | * | ns | ns | ns | * | ns |
| Year | *** | *** | *** | *** | *** | *** | *** | *** | *** |
| R × MI | ns | * | ns | ns | ns | ns | ns | ns | ns |
ns, not significant; *, **, and *** indicate significant differences at the 0.05, 0.01, and 0.001 levels of probability, respectively. In each column and for each factor, different letters indicate significant differences according to Duncan's multiple range test at a 95% confidence level.
Disclaimer/Publisher’s Note: The statements, opinions and data contained in all publications are solely those of the individual author(s) and contributor(s) and not of MDPI and/or the editor(s). MDPI and/or the editor(s) disclaim responsibility for any injury to people or property resulting from any ideas, methods, instructions or products referred to in the content. |
© 2025 by the authors. Licensee MDPI, Basel, Switzerland. This article is an open access article distributed under the terms and conditions of the Creative Commons Attribution (CC BY) license (http://creativecommons.org/licenses/by/4.0/).
Copyright: This open access article is published under a Creative Commons CC BY 4.0 license, which permit the free download, distribution, and reuse, provided that the author and preprint are cited in any reuse.