Submitted:
22 September 2025
Posted:
23 September 2025
You are already at the latest version
Abstract
An investigation into the influence of annealing time on structural ordering of Poly-3-Hexylthiophene has been performed via analyses of absorbance data on the premise that ordering status is reflected on the optoelectronic properties. Thin films heated from 0 to 100 minutes were examined. It was found that 20 minutes annealing yields a thin film with highest structural ordering, with density of states of 5.76×1038 m-3 kg-1 and carrier density of 5.24×10⁸ m-3. Samples annealed beyond 40 minutes exhibited a balanced presence of ordered and disordered phases. The results demonstrated that during thermal treatment at a fixed temperature, the structural ordering and conformity continuously change with time, affecting the optoelectronic properties; thus, emphasizing the necessity of “time-profile” to determine the appropriate annealing time for a specific application of the polymer.
Keywords:
polymer
; P3HT
; optical analysis
1. Introduction
Poly-3-Hexylthiophene (P3HT) may be considered a reference point in the polymeric semiconductor space, given its ubiquitous presence in organic semiconductor ecosystem. This semi-crystalline, p-type semiconductor is known to have properties that depend on molecular weight, regio-randomness and regioregularity of the molecular chains. Regio-regular P3HT (rr-P3HT) with molecular weight ≥ 95 exhibits excellent electrical and photophysical properties [1]. Notwithstanding this molecular factor, processing methods and conditions largely control observable responses of the polymer in solid form. This is possible through chain conformation, orientation and packing that are directly impacted by deposition process methods [2]. Drop-casting and spin coating provide facile solution-based techniques for P3HT thin films and device fabrications. The former suffers irreproducibility of thickness and morphology, while the latter ensures repeatable thickness once the spin-coating system is adequately calibrated, however the process yields films with molecular chains that are in non-equilibrium state due to accelerated evaporation of solvent [3]. Thus, thermal treatment of the films is necessary to attain desired responses and therein lies the divergent conclusions.
Thermal treatment generally improves the structure, electrical and optoelectronic properties of thin films. However, for P3HT, there exists an array of somewhat conflicting impacts of annealing. In one comparative study of unannealed and annealed samples, thermally improved crystallinity was considered the reason for increased absorption [4,5]. Contrary to this, Gurau et al. [6] found that though annealing induces recrystallization to a higher chain order, it led to decreased absorption in comparison to unannealed sample. Delongchamp et al. [7] attributed improved charge mobility to enhanced π - π * stacking caused by thermal-induced reorganization of the crystal structure. In the case of varied annealing temperatures, Peng et al [2] related absorption maxima to quasi-ordered state of the molecular chain, suggesting a temperature moderated interconversion between crystalline and amorphous states as well as interchain and intrachain ordering. In addition, x-ray diffraction has been leveraged in some works to explore the impact of annealing which revealed no correlation between crystalline size and photophysical properties [1,2,3], this might be attributed to the observation that solution concentration determines the final crystalline size [1]. The absence of conclusive direct correlation between annealing and crystallinity can be appreciated in the light of ref. 2 &7, and the fact that P3HT crystallizes at room temperature [1]. Hence, we can surmise that thermal treatment has little impact on crystallinity but significantly controls polymer chain orientation, conformation and packing order in P3HT and such control, is reversible and repeatable as pointed out in [2,3]. The nature of chain orientation, conformation and packing order determines optical responses. It follows then that the degree of ordering and transformation will be registered qualitatively and quantitatively in the absorption spectrum of a P3HT film.
In light of the above, and considering heat as a perturbing field, the question arises whether annealing time is a significant factor in heat-induced reversible transformation. This is pertinent to the ecosystem of P3HT because it will facilitate a systematic profiling of the polymer for specific applications within a given processing condition (solvent, concentration etc). In literature, annealing time has been about one hour. If time – dependence exists, by implication several reordering must have occurred within the hour thereby obscuring structural transformations that could have been more suitable for the applications reported.
In this submission we address this question of time – dependent reordering. Here, the impact of time-dependent annealing at 80°C is investigated by absorption spectroscopy. Optoelectronic properties extracted by this technique reveal structural state of a material. The temperature is high enough to induce reversible ordering and well below the melting point of P3HT thereby mitigating undesirable phase state.
2. Materials and Methods
Analytical grade rr-P3HT of molecular weight 97.6% from Ossila Inc was used as is. 10 mg of it was dissolved in 1 mL of chloroform at ambient temperature. The solution was agitated on a Thomas Scientific LP vortex mixer at 1000 rpm for 5 minutes to induce complete dissolution and reduce clustering, yielding a brownish solution. Six 2.0 × 2.0 mm square glass substrates were first immersed in acetone for an hour to degrease the surfaces, afterwards rinsed with distilled water and dried in open-air. They were then further cleaned in Plasma cleaner at .560mTorr and high RF for 20 minutes to remove surface impurities, to mitigate contributions from foreign atoms to the characteristics of the polymer films. 0.3 mL of the P3HT-chloroform solution were spin-deposited on each substrate at 600 rpm for 30 seconds using Apogee Spin Coater. Given the high evaporation coefficient of chloroform, the spin speed and duration were adequate to remove solvents from the films, which yielded uniform very thin and translucent films. Based on literature report [6], the films were assumed to be in a non-equilibrium state and have short conjugations. Five samples were annealed at a fixed temperature of 80° C and different times from 20 – 100 minutes in 20 minutes interval. We used the approach of collective heating and removal of a sample at specific time. The approach guaranteed that the annealed films were in the same external condition and underwent simultaneously the same internal process. Thus, the impact of time is entirely the only variable external factor. The films were labeled according to the annealing time with S0 being as-deposited (unannealed) sample. The films have thicknesses of approximately 65 nm. Prior to final reported case, a calibration of the Eco Spin System thickness yield for P3HT solution as described above, using Optical Profilometer showed consistent thickness of about 65 nm++.
To capture the optical response, Shimazu 3600 UV – Vis spectrophotometer was used to record the absorbance at 330 – 1100 nm wavelength. The absorbance spectrum is a simple but critical response in understanding nanoscale materials since it carries the signature of the structural states and when carefully analyzed reveals optoelectronic parameters.
3. Results and Discussion
The focus of this report is to resolve the existence (if any) of time-dependent reordering in P3HT. We assumed that such occurrence will be carried on the optical responses and reflected in the quantitative values of optoelectronic properties thereof. To this end the usage of a single measurable optical response to extract and analyze the properties of the P3HT polymer in solid thin film with respect to annealing time suffices. In this regard we favored the absorbance in the 330 – 1100 nm wavelength which has revealed the impact of annealing on optoelectronic properties and on the structural layout of the polymer.
3.1. Annealing and Absorbance
P3HT is a semi-crystalline material, exhibiting the ordered and amorphous phase, either of which being dominant according to the molecular weight and processing treatments. The presence of an ordered phase is usually underscored by low energy peak or shoulder in the absorbance spectrum while the amorphous phase contributes significantly to the higher energy absorption [8]. The samples studied in the current report have similar qualitative absorbance spectra typified by distinct shoulders and peaks. An instance of the absorbance is illustrated in Figure 1a for as-deposited sample S0. The shoulder at 603 nm, which is typical of high molecular weight (≥ 96), indicates 0 – 0 vibronic interchain transition and the maximum at λ = 540 nm represents 0 – 1 intrachain transition [9,10]. The wavelengths correspond to 2.0 eV and 2.3 eV respectively like most reports in literature. However, in the current case, both peaks are clearly defined. This sharp distinction demonstrates some degree of ordering associated with interchain (0-0) and intrachain (0-1) packing [2]. These features being very pronounced in the unannealed sample can be attributed to the processing procedure, described in the experiment section which aimed to minimize clustering and encourage ordering, and can provide a visual to the evolution of ordering in a comparative graphical analysis of all samples. This is shown in Figure 1b, which revealed the impact of annealing time on the polymer structure through the quantitative values of absorbance at the shoulder and at the higher energy peak. Figure 1b is the normalized spectrum which was obtained by rationalizing each data set by its smallest value, allowing for clearer resolution of annealing-time influence. The degree of ordering with respect to annealing time is thus revealed in the relative vertical shift of the absorbance spectra with reference to the unannealed sample. Two important pieces of information are revealed here. First, we note that amorphous state (disorder) dominates higher energy absorption [8] and as can be seen, the peak absorbance shifts with heating time but not in a monotonic fashion. This non-sequential change in magnitude underscores the perturbing influence of annealing time and the sensitivity of crystalline – amorphous phase inter-conversion to time-length of exposure to heat treatment, similar to temperature – dependent interconversion at fixed time in [2]. However, unlike the latter, time-dependence is not chronological. Since amorphous state is a dominant contributor to elevated absorbance peak [8], S20 - the sample annealed for 20 minutes - has the lowest spectrum which we attribute to having the highest crystalline ordering and the lowest disordered state. S40 and S0 exhibit the highest and second highest absorbance peaks because of dominant disordered phase. Second, within the constraint of 80° C temperature used here, annealing times > 40 minutes yield ‘balanced – phase ratio as their spectra lie midway between S0 and S20. We found that the trends were reproducible in repeated depositions, an instance is shown in Figure 1c. Our method of multiple sample – collective heating informs the conclusion that a single sample heated for an hour goes through several reordering within the hour. For the specific case considered here, highest ordering registered at 20 minutes of annealing.
The energy bandgap of each sample was extracted by detecting the absorption edge and using it in the formula:
3.2. Optoelectronic Properties
Optoelectronic behavior is directly linked to structural ordering of materials. To follow up on the probable influence of annealing time on molecular conformity and ordering, we analyzed the refractive index in the frame of Wemple – DiDomenico (WDD) model and Spitzer – Fan (SF) model in the long wavelength range. In the single oscillator Wemple – DiDomenico model [12]
The results of the WDD model analysis co-relates with the heat-dependent structural ordering and the interconversion of crystalline and disordered phases in literature [2]. The trend of close fit of WDD model to data clearly follows the vertical shift of absorbance spectra with respect to the spectrum of S0 in Figure 1 and is quantitively validated by the oscillation and dispersion energies of samples S20 – S100. A good level of structural ordering encourages high densities of states and carriers. The application of the SF model, in the form [14]:
4. Conclusions
Optoelectronic property profiling of semiconducting polymers within a specific fabrication technique is important to better inform on applications. Specific demonstration has been performed using the ubiquitous P3HT deposited by spin-coating and annealed at fixed temperature and variable time within the frame of absorbance spectrum, Wemple – DiDomenico and Spitzer – Fan models. Our analyses show that molecular chain reordering occur over the range of time of annealing, showing interconversion of ordered and disordered phases that are underscored by different values of optoelectronic properties. The agreement with existing literature reveals the importance of combined Wemple - DiDomenico and Spitzer – Fan models in understanding electronic structure of polymeric semiconductors. Specifically, it was found that P3HT processed as described herein achieve best ordering with highest density of states and carrier density at 20 minutes of heat treatment.
Author Contributions
Conceptualization, methodology, supervision, validation, writing – review and editing, I.U; investigation, formal analysis, visualization, writing - original draft preparation, W.J, A.H, B.F, K.G., E.B., L.O., R.B., K.M., J.A. All authors have read and agreed to the published version of the manuscript.
Funding
This research was funded by US NATIONAL SCIENCE FOUNDATION, grant number 2430293 for Partnership for Advancing Research Capacity in Semiconductors at Historically Black Colleges and Universities (PARCS-HBCU) and MICRON INC, grant number 2024080017, for Student-oriented Semiconductor Physics: A hands-on study of optoelectronic response of wide-bandgap semiconductors.
Acknowledgments
We appreciate the support of Keyence Corporation of America, through Tucker Bridges, their regional representative for the Optical Profilometry of polymer films.
Conflicts of Interest
The authors declare no conflicts of interest. The funders had no role in the design of the study; in the collection, analyses, or interpretation of data; in the writing of the manuscript; or in the decision to publish the results.
References
- Nava-Sanchez, R.; Casados-Cruz, G. and Morales-Acevedo, A. Effect of the P3HT Concentration in the Precursor Solution on the Crystallinity of Annealed P3HT Thin Films Prepared by Spin-Coating. 19th Int’l conf. on Electrical. Engineering, Computing. Science and Automatic Control, Mexico, Mexico City, (November 9-11, 2022). [CrossRef]
- Peng, R. , Zhu, J., Pang, W., Cui, Q., Wu, F., Liu, K., Wang, M., Pan, G. Thermal Annealing Effects on the Absorption and Structural Properties of Regioregular Poly(3-Hexylthiophene) Films. J. Macromolecular Sci., B, 2011, 50(3), 624–636. [CrossRef]
- Grigorian, S.; Joshi, S.; Pietsch, U. Temperature-dependent structural properties of P3HT films. IOP Conf. Ser.: Mater. Sci. Eng. 2010, 14 012007. [CrossRef]
- Cho, S.; Lee, K.; Yuen, J.; Wang, G.; Moses, D.; Heeger, A.J.; Surin, M.; Lazzaroni, R. Thermal annealing-induced enhancement of the field-effect mobility of regioregular poly(3-hexylthiophene) films. J. Appl. Phys. 2006, 100(11), 114503. [Google Scholar] [CrossRef]
- Chirvase, D.; Parisi, J.; Hummelen, J.C.; Dyakonov, V. Influence of nanomorphology on the photovoltaic action of polymer: Fullerene composites. Nanotechnology 2004, 15, 1317–1323. [Google Scholar] [CrossRef]
- Gurau, M.C.; Delongchamp, D.M.; Vogel, B.M.; Lin, E.K.; Fischer, D.A.; Sambasivan, S.; Richter, L.J. Measuring molecular order in poly(3-alkylthiophene) thin films with polarizing spectroscopies. Langmuir 2007, 23, 834–842. [Google Scholar] [CrossRef] [PubMed]
- Delongchamp, D. M., Kline, R. J., Jung, Y., Lin, E. K., Fischer, D. A., Gundlach, D. J., Cotts, S. K., Moad, A. J., Richter, L. J., Toney, M. F., Heeney, M., & McCulloch, I. Molecular basis of mesophase ordering in a thiophene-based copolymer. Macromolecules, 2008 41(15), 5709-5715. [CrossRef]
- Morfa, A.J. , Barnes, T.M., Ferguson, A.J., Levi, D.H., Rumbles, G., Rowlen, K.L. and van de Lagemaat, J. Optical characterization of pristine poly(3-hexyl thiophene) films. J. Polym. Sci. B Polym. Phys., 2011 49, 186-194. [CrossRef]
- Chang, J.F.; Clark, J.; Zhao, N.; Sirringhaus, H.; Breiby, D.W.; Andreasen, J.W.; Nielsen, M.M.; Giles, M.; Heeney, M.; McCulloch, I. Molecular-weight dependence of interchain polaron delocalization and exciton bandwidth in high-mobility conjugated polymers. Phys. Rev. B 2006, 74, 115318. [Google Scholar] [CrossRef]
- Trznadel, M.; Pron, A.; Zagorska, M.; Chrzaszcz, R.; Pielichowski, J. Effect of molecular weight on spectroscopic and spectroelectrochemical properties of regioregular poly(3-hexylthiophene). Macromolecules 1998, 31, 5051–5058. [Google Scholar] [CrossRef] [PubMed]
- Benchaabane, A.; Hajlaoui, M. E.; Hnainia, N.; Al-Tabbakh, A.; Zeinert, A.; Bouchriha, H. Optical properties enhancement of hybrid nanocomposites thin films based on P3HT matrix and ZnO@SiO2 core-shell nanoparticles, Optical Materials 102 2020, 109829.
- Wemple, S.H.; DiDomenico, M. Behavior of the electronic dielectric constant in covalent and ionic materials, Phys. Rev. B3, 1971, 1338.
- Shakra, A.M.; Mohamed, R. A.; El-Bakry, M.Y.; Ali, R. M.; Habashy, D. M., A Combined Experimental and Theoretical Study of the Optical Behavior of Se-Ge-Ga-Sb Chalcogenide Thin Films, Egypt J. Solids, 2024, 46, 33-76. [CrossRef]
- Al-Bataineh, Q. M.; Ahmad, A. A.; Alsaad, A.M.; Telfah, A. D. Optical characterizations of PMMA/metal oxide nanoparticles thin films: bandgap engineering using a novel derived model, Heliyon 7 ,2021, e05952.
Figure 1.
(a) Absorbance of As-deposited sample. (b) Normalized absorbance of samples annealed at 80° C at various times. (c) Another set of P3HT film data showing repeatability of trend.
Figure 1.
(a) Absorbance of As-deposited sample. (b) Normalized absorbance of samples annealed at 80° C at various times. (c) Another set of P3HT film data showing repeatability of trend.
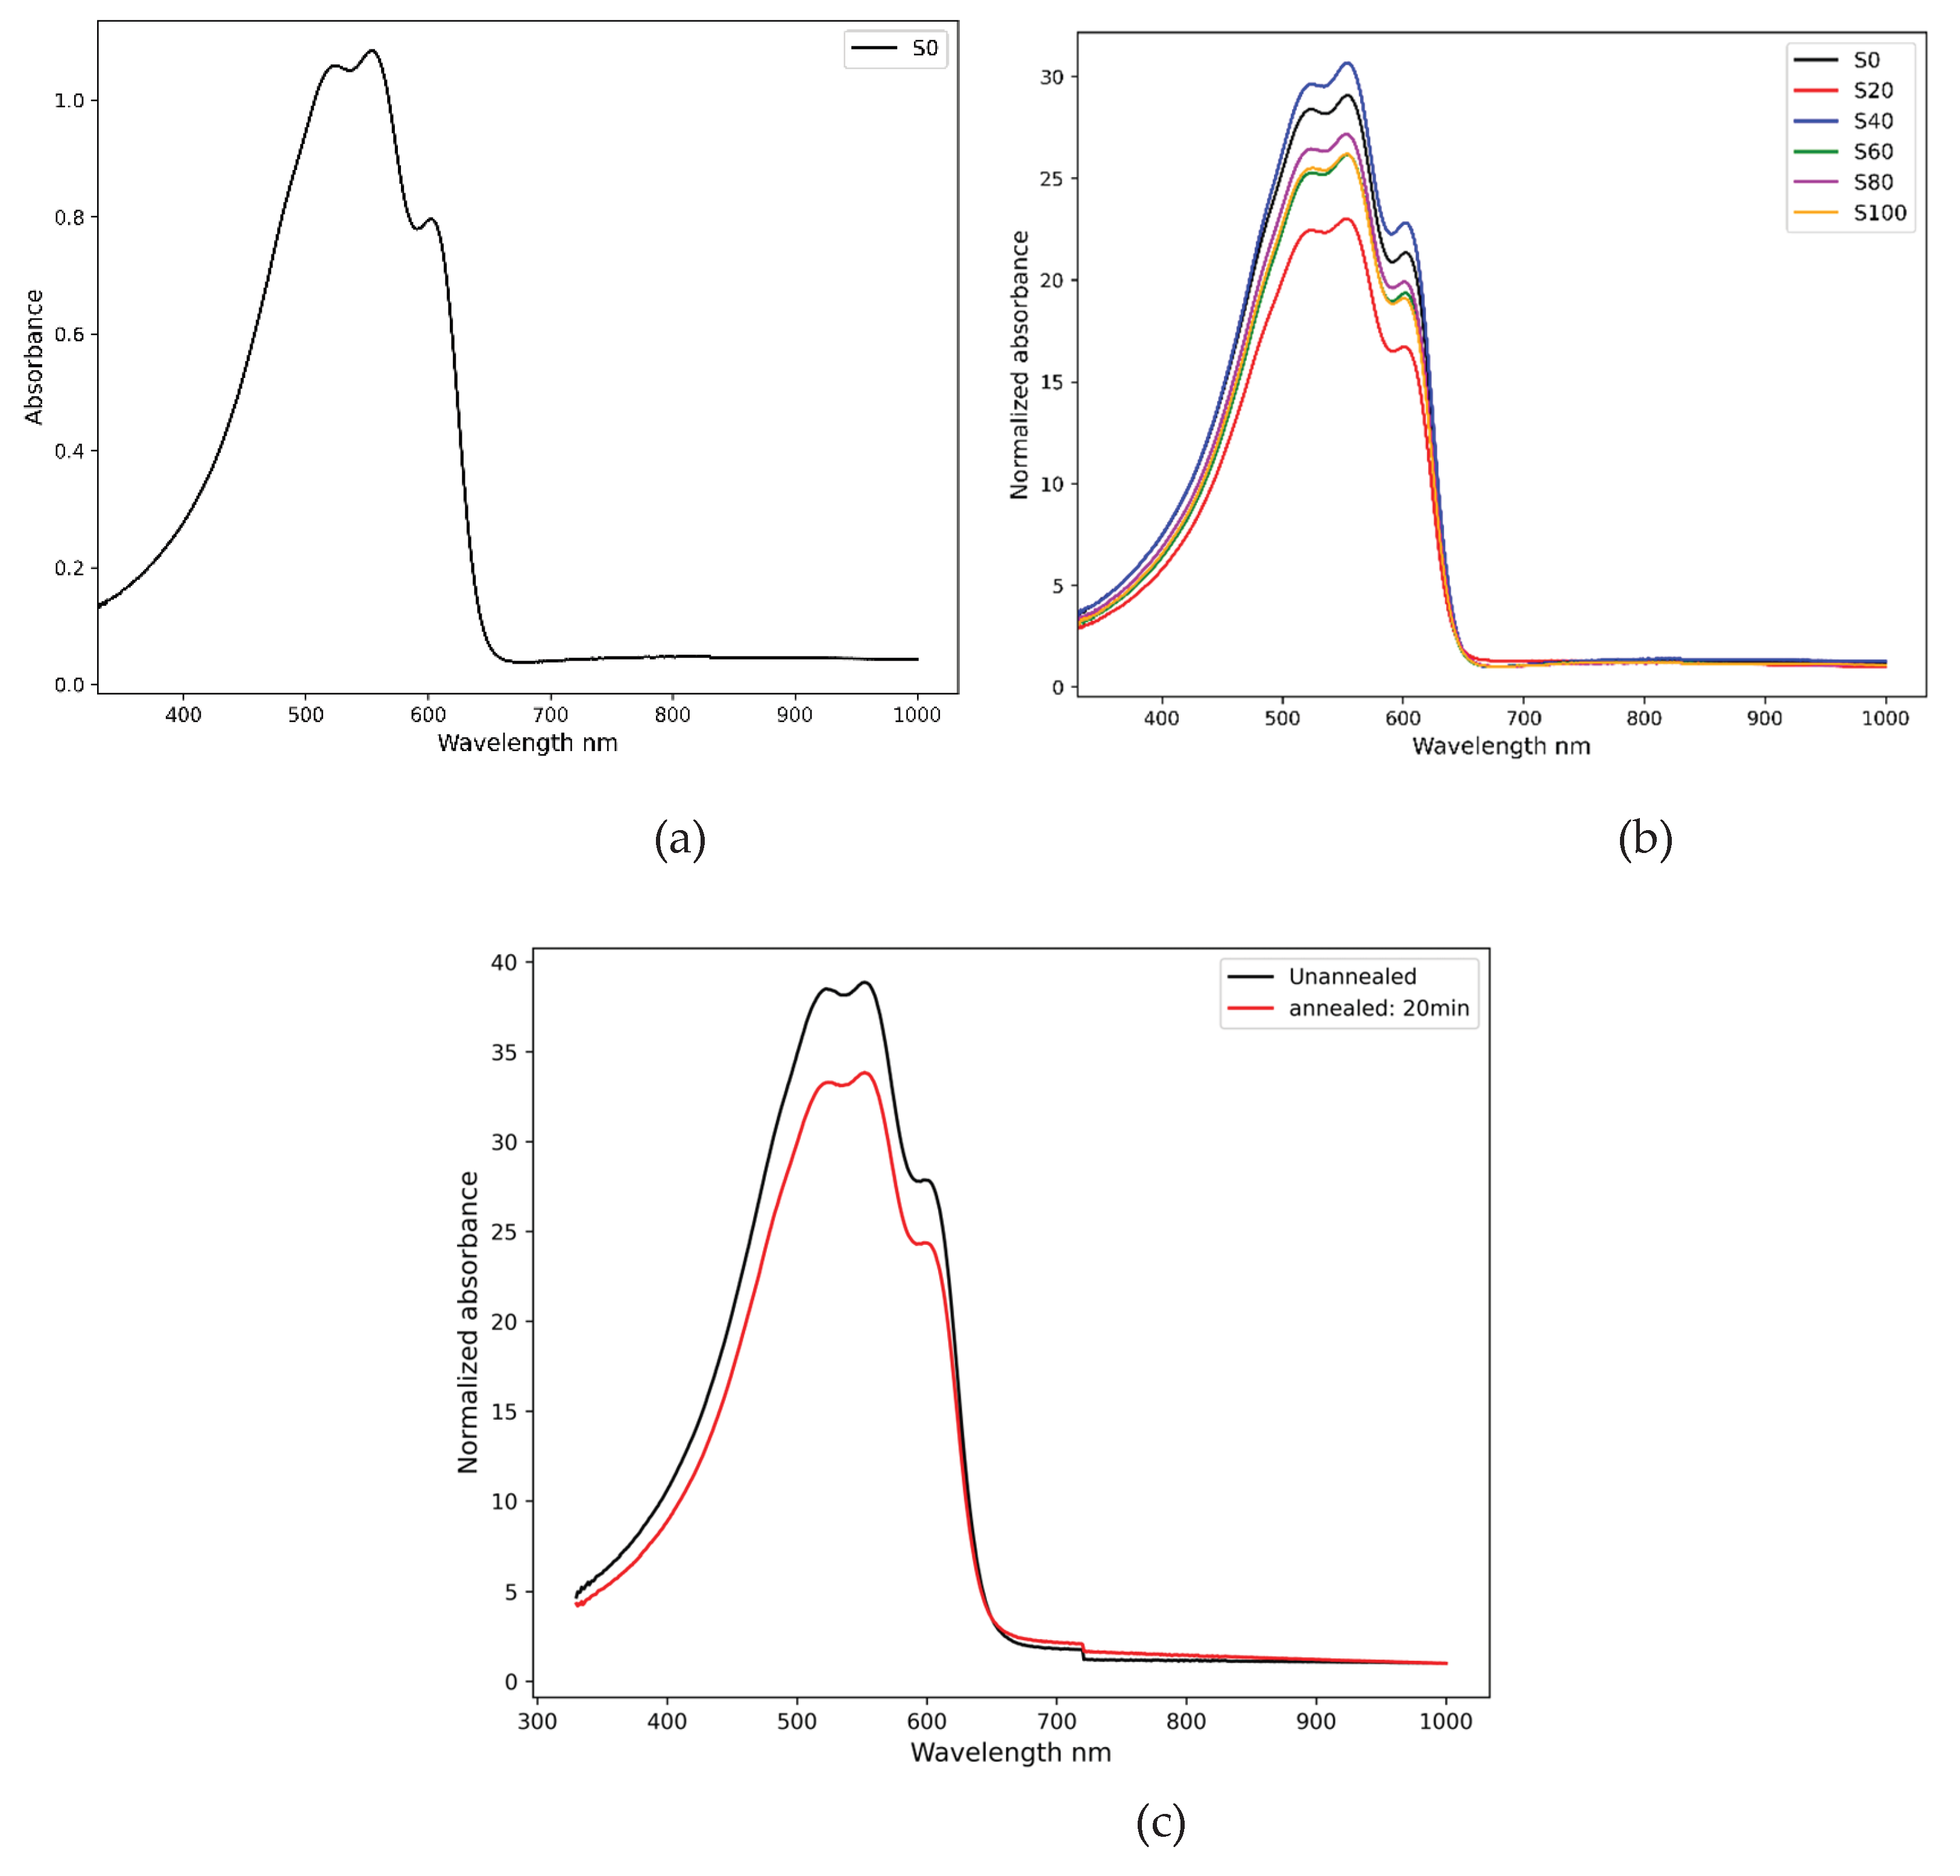
Figure 2.
WDD model fits in long wavelength range for qualitative and quantitative confirmation of ordering.
Figure 2.
WDD model fits in long wavelength range for qualitative and quantitative confirmation of ordering.
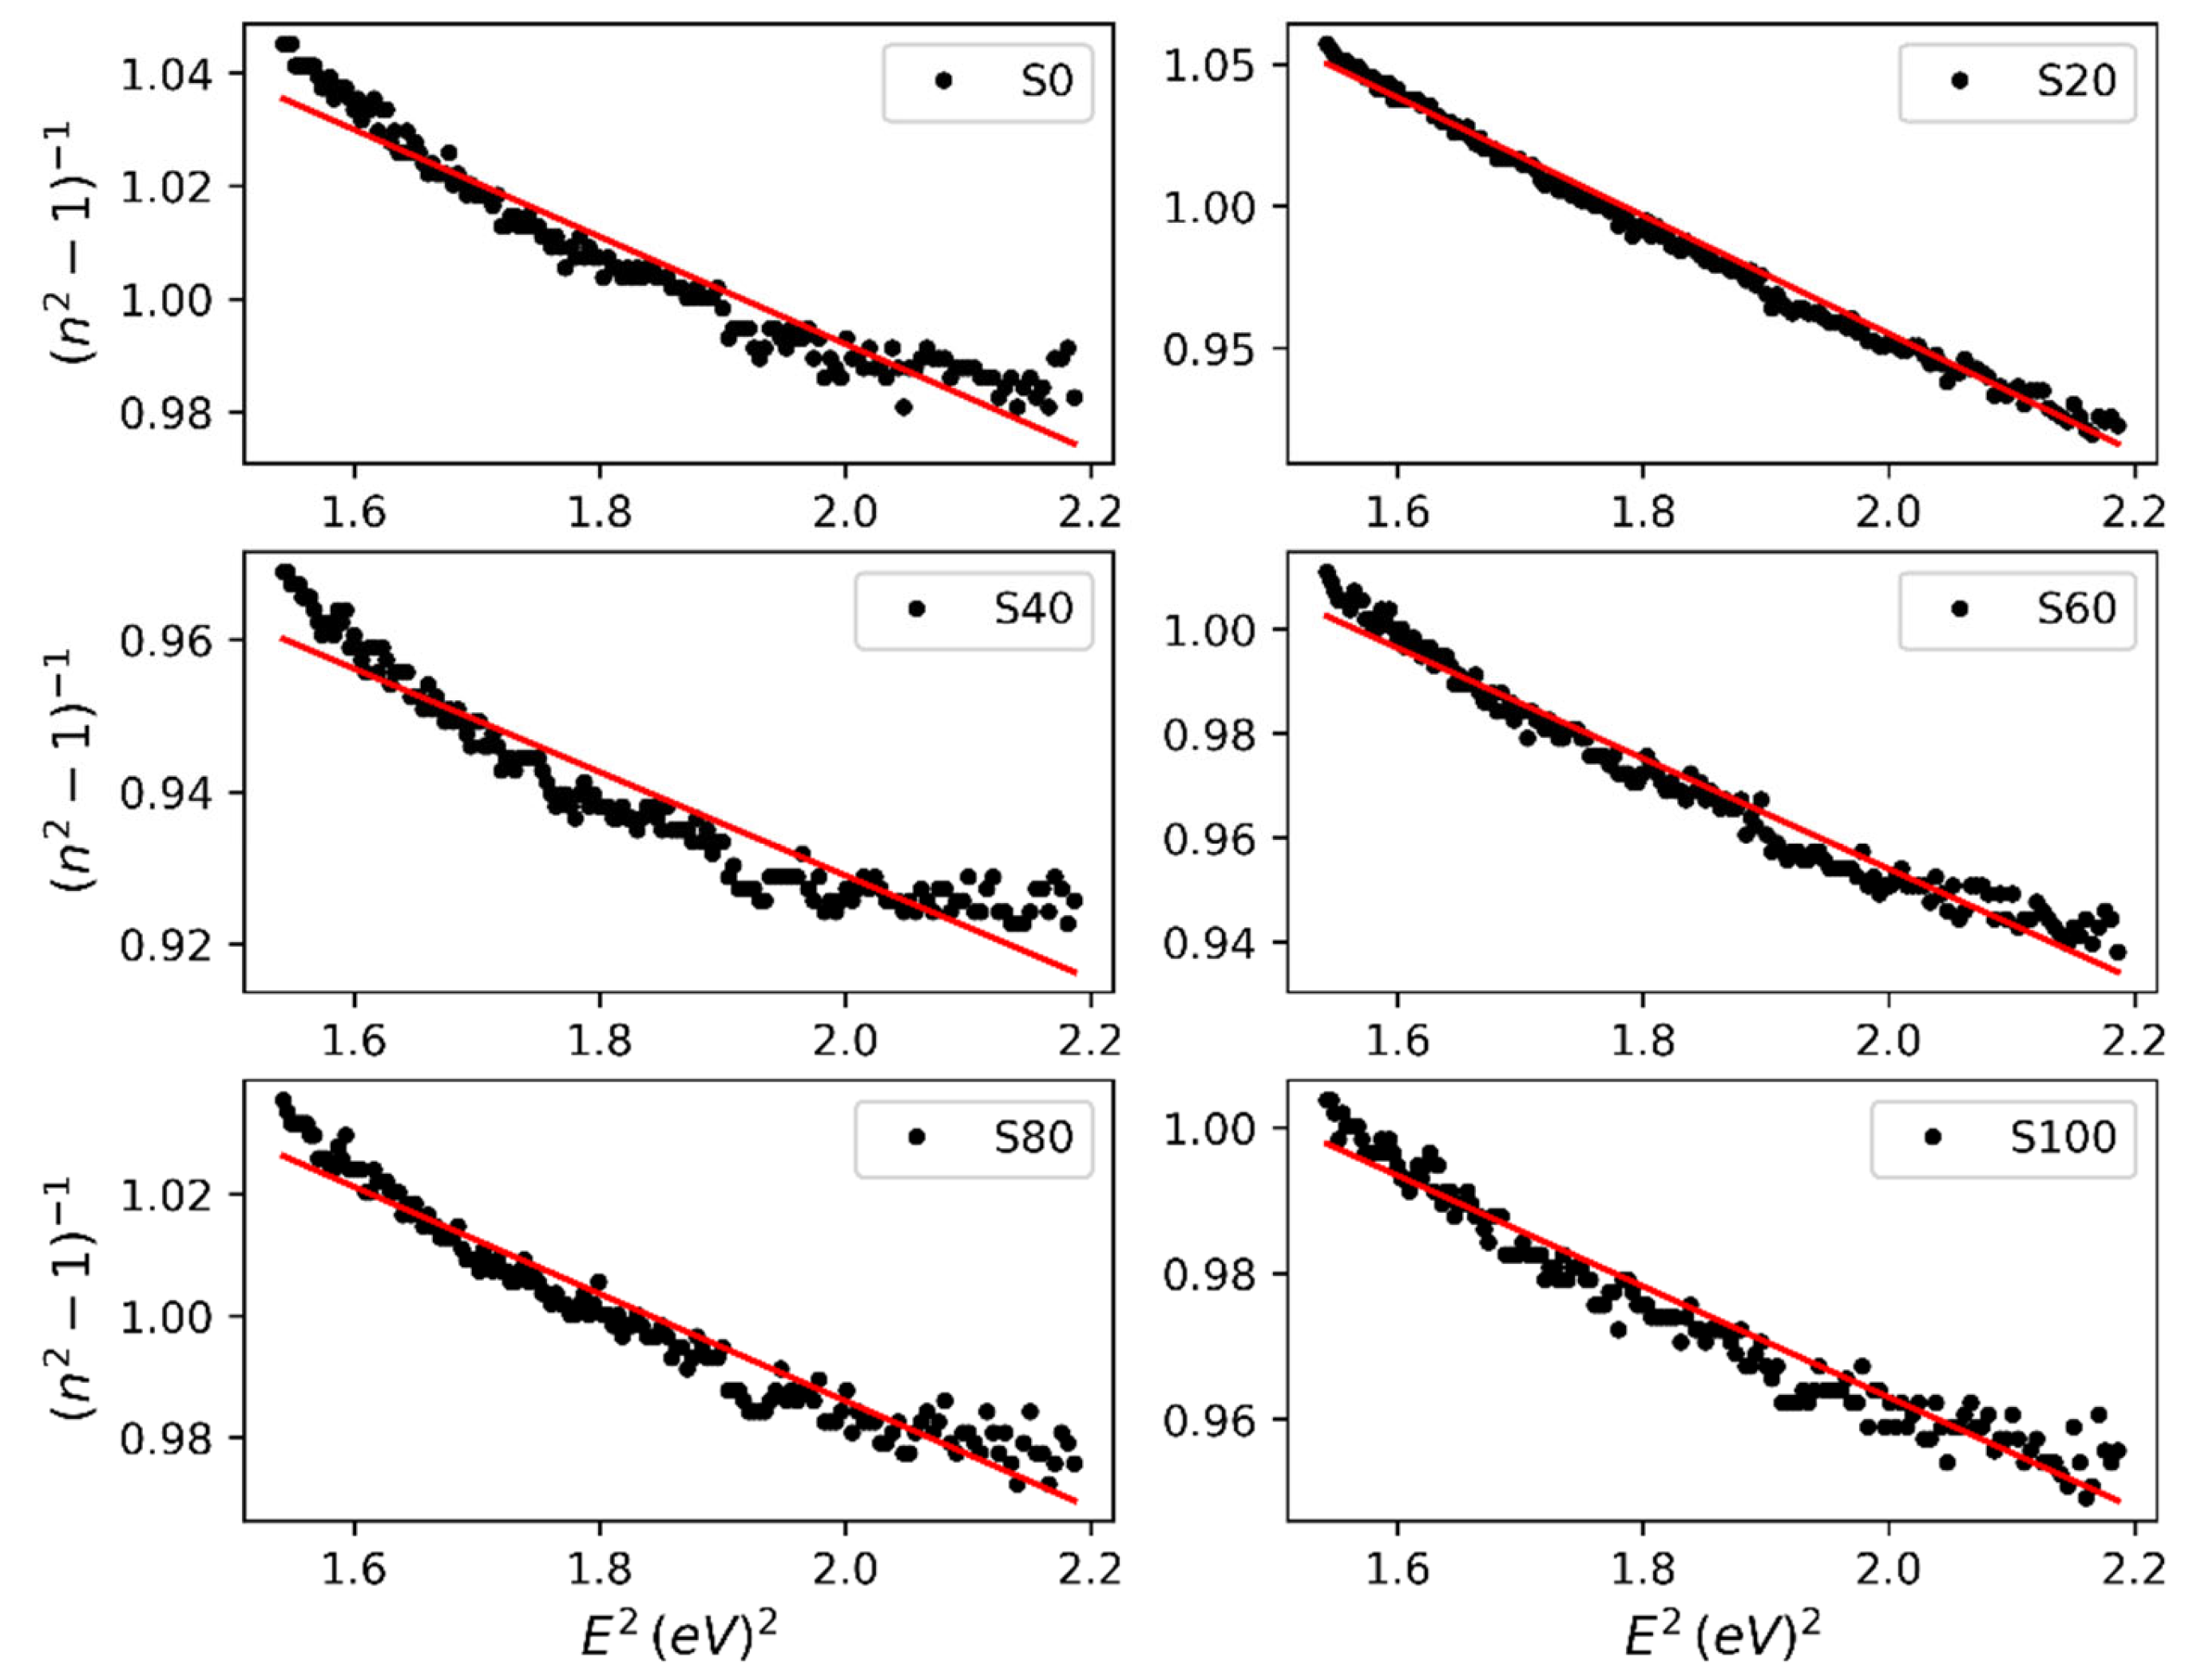
Figure 3.
Dielectric analysis using Spitzer-Fan model. The trend of close fit corresponds to absorbance spectra shifts.
Figure 3.
Dielectric analysis using Spitzer-Fan model. The trend of close fit corresponds to absorbance spectra shifts.
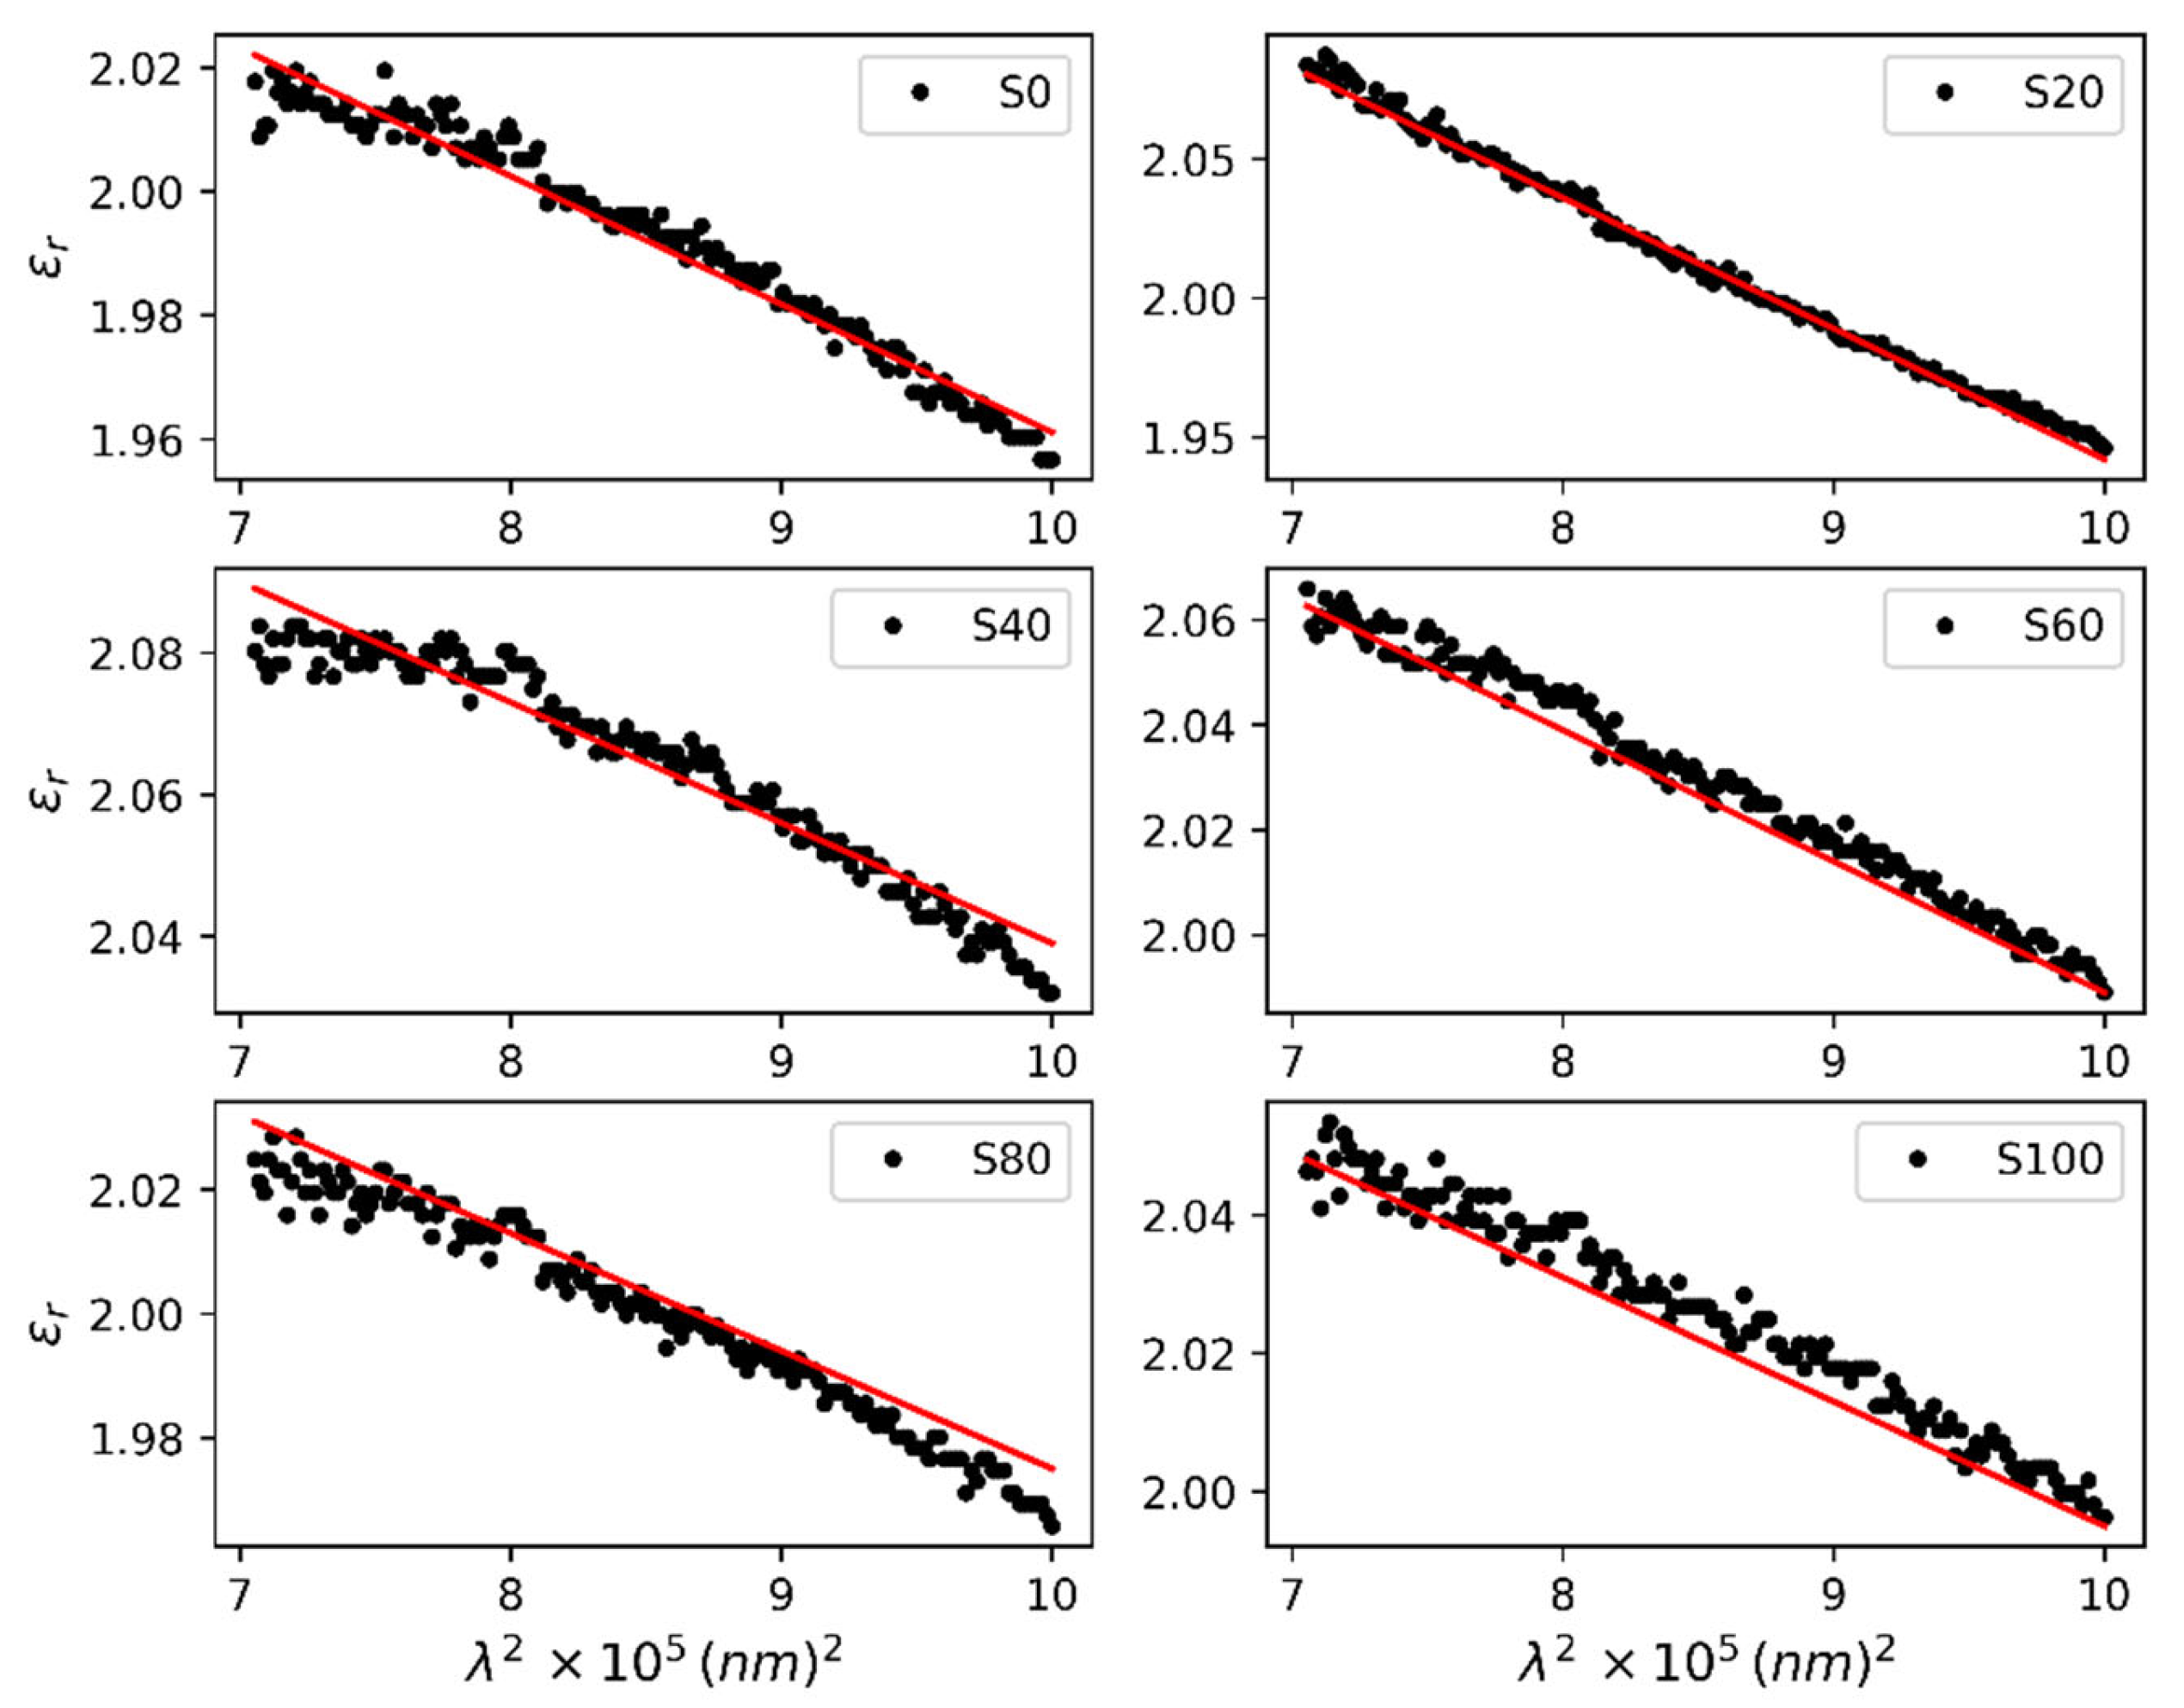
Figure 4.
Density of States with respect to annealing time. The value at 20 minutes underscores high level of ordering achieved at that interval of time.
Figure 4.
Density of States with respect to annealing time. The value at 20 minutes underscores high level of ordering achieved at that interval of time.
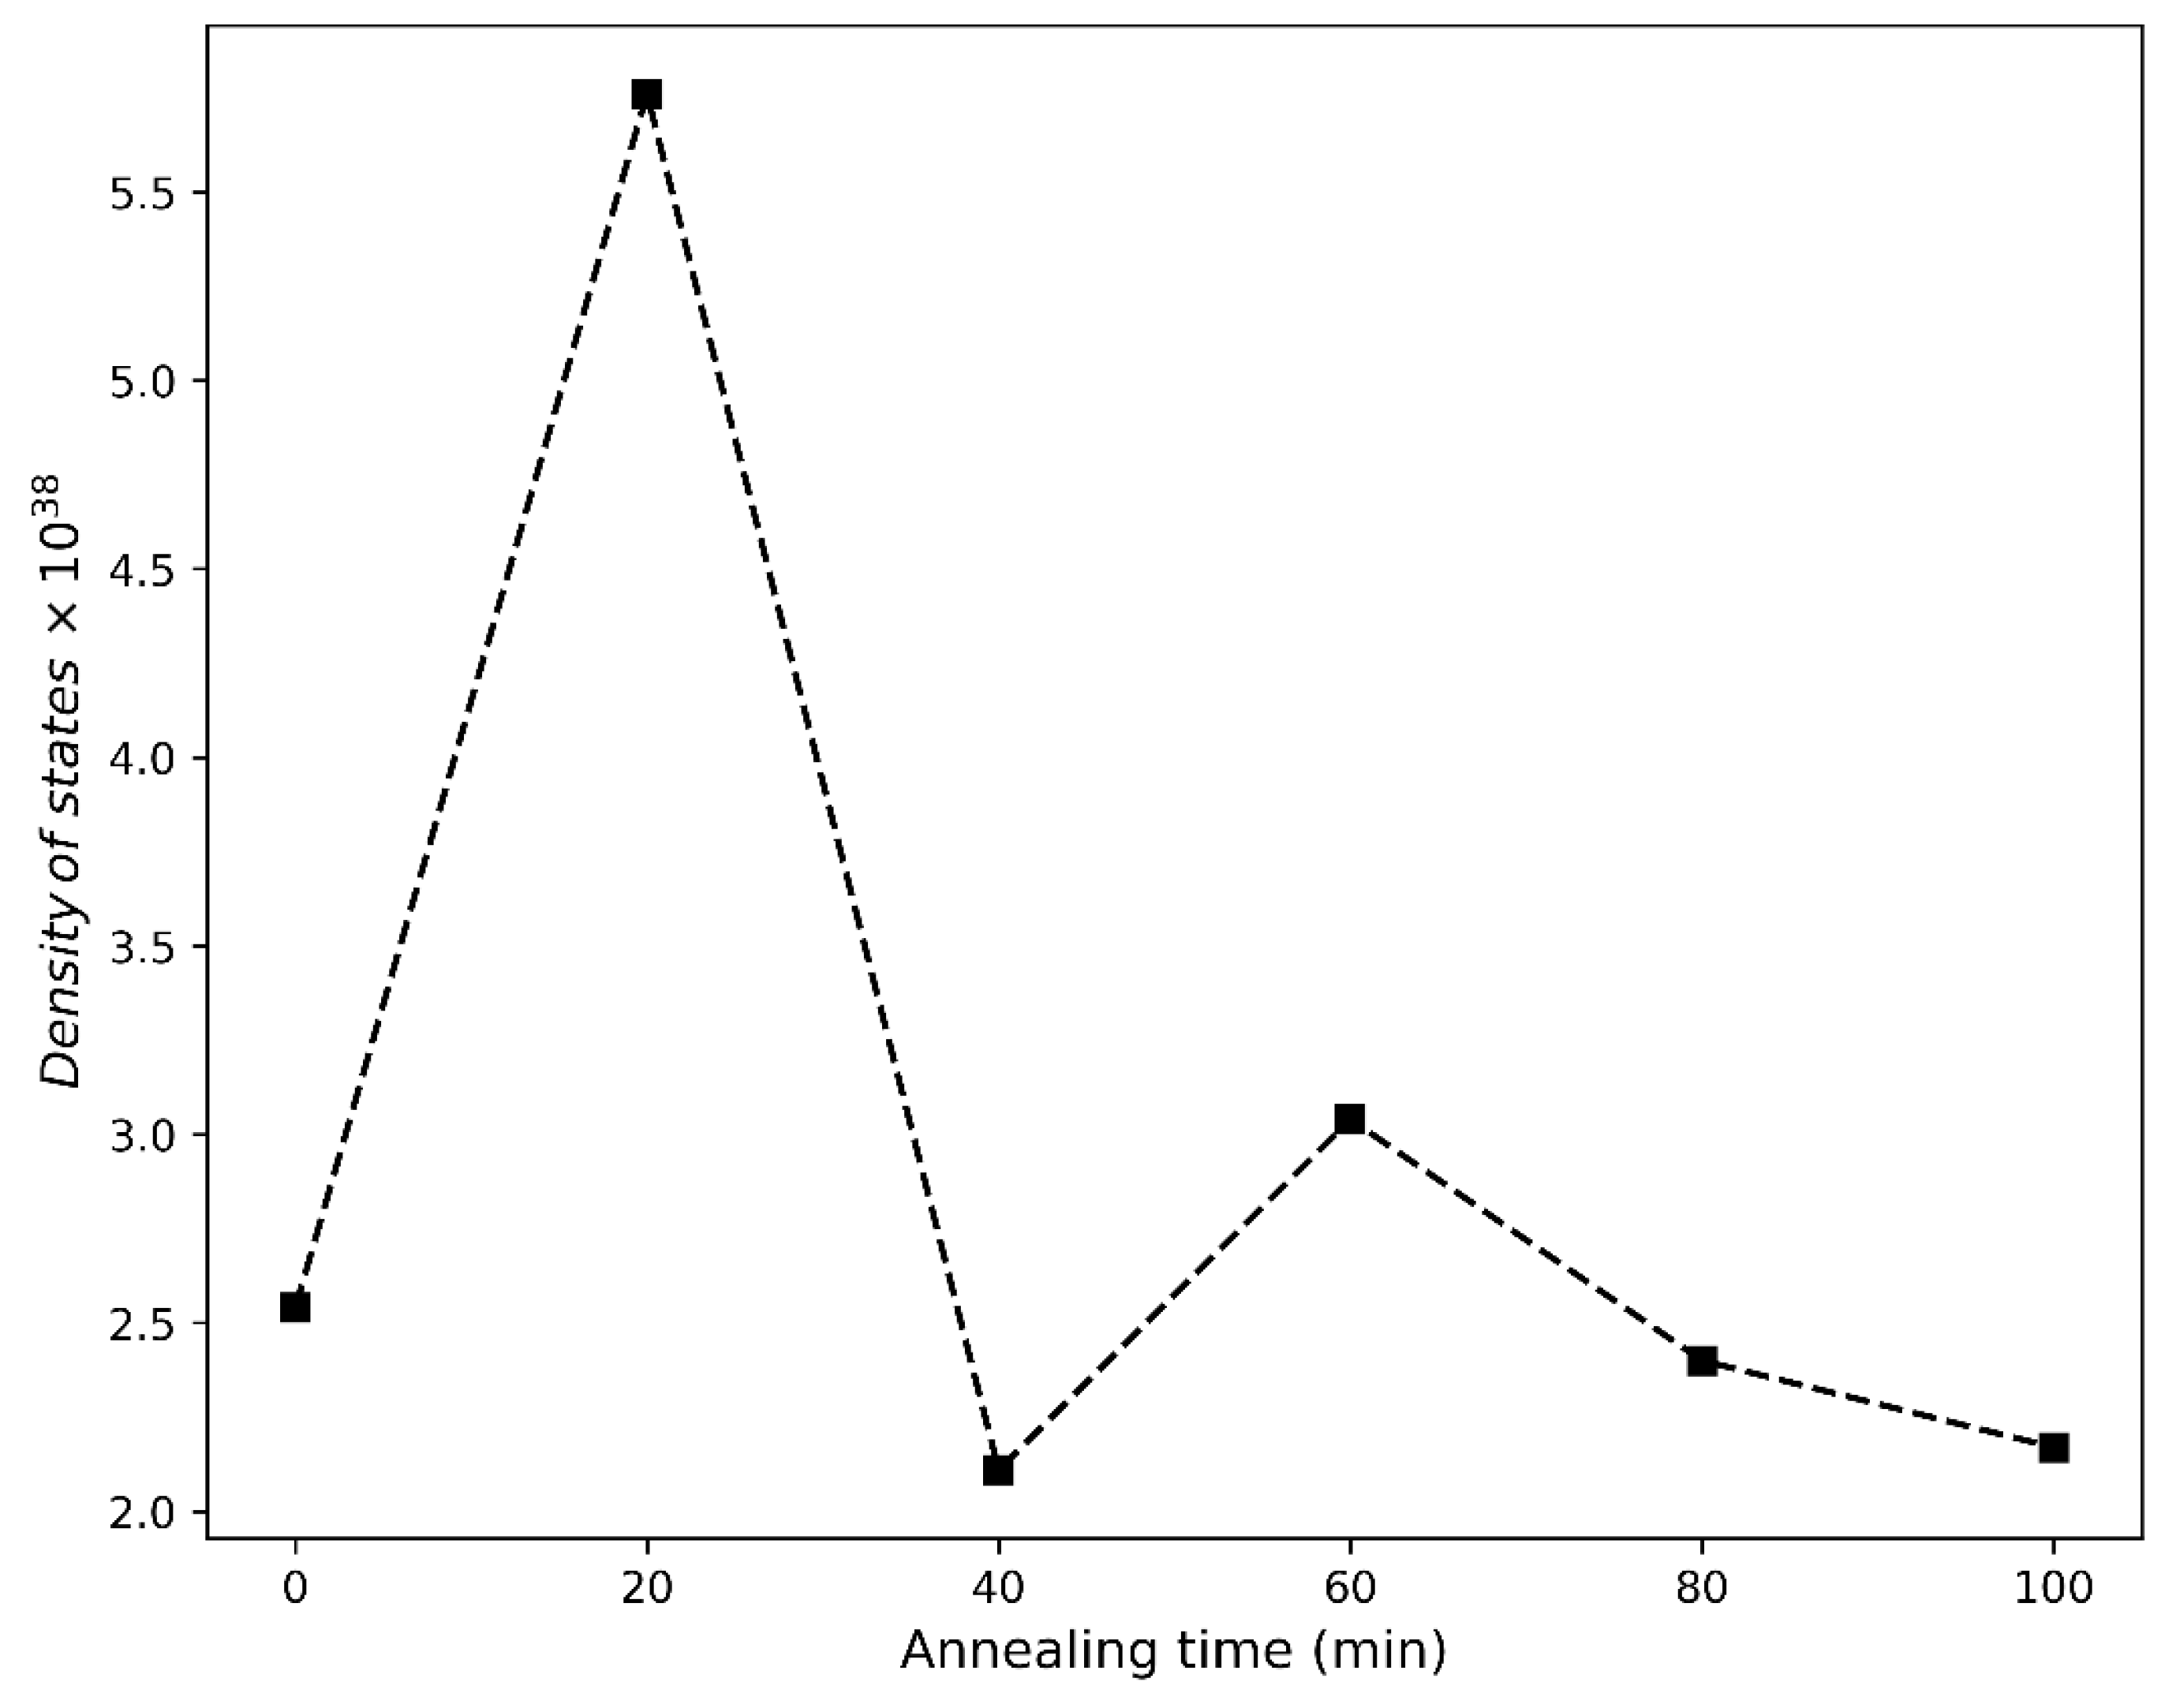

Table 1.
Optoelectronic parameters of unannealed (S0) and annealed nanofilms (S20 – S100) of P3HT.
| Model | Parameter | S0 | S20 | S40 | S60 | S80 | S100 |
| WDD | 8.878 | 3.489 | 13.753 | 8.065 | 9.710 | 11.747 | |
| 10.500 | 4.784 | 14.650 | 9.407 | 11.289 | 13.098 | ||
| 1.358 | 1.315 | 1.392 | 1.362 | 1.363 | 1.377 | ||
| SF | 2.168 | 2.412 | 2.209 | 2.239 | 2.165 | 2.175 | |
| ** | |||||||
| **Calculated using normal electron mass. | |||||||
Disclaimer/Publisher’s Note: The statements, opinions and data contained in all publications are solely those of the individual author(s) and contributor(s) and not of MDPI and/or the editor(s). MDPI and/or the editor(s) disclaim responsibility for any injury to people or property resulting from any ideas, methods, instructions or products referred to in the content. |
© 2025 by the authors. Licensee MDPI, Basel, Switzerland. This article is an open access article distributed under the terms and conditions of the Creative Commons Attribution (CC BY) license (http://creativecommons.org/licenses/by/4.0/).
Copyright: This open access article is published under a Creative Commons CC BY 4.0 license, which permit the free download, distribution, and reuse, provided that the author and preprint are cited in any reuse.


