Submitted:
22 September 2025
Posted:
23 September 2025
You are already at the latest version
Abstract
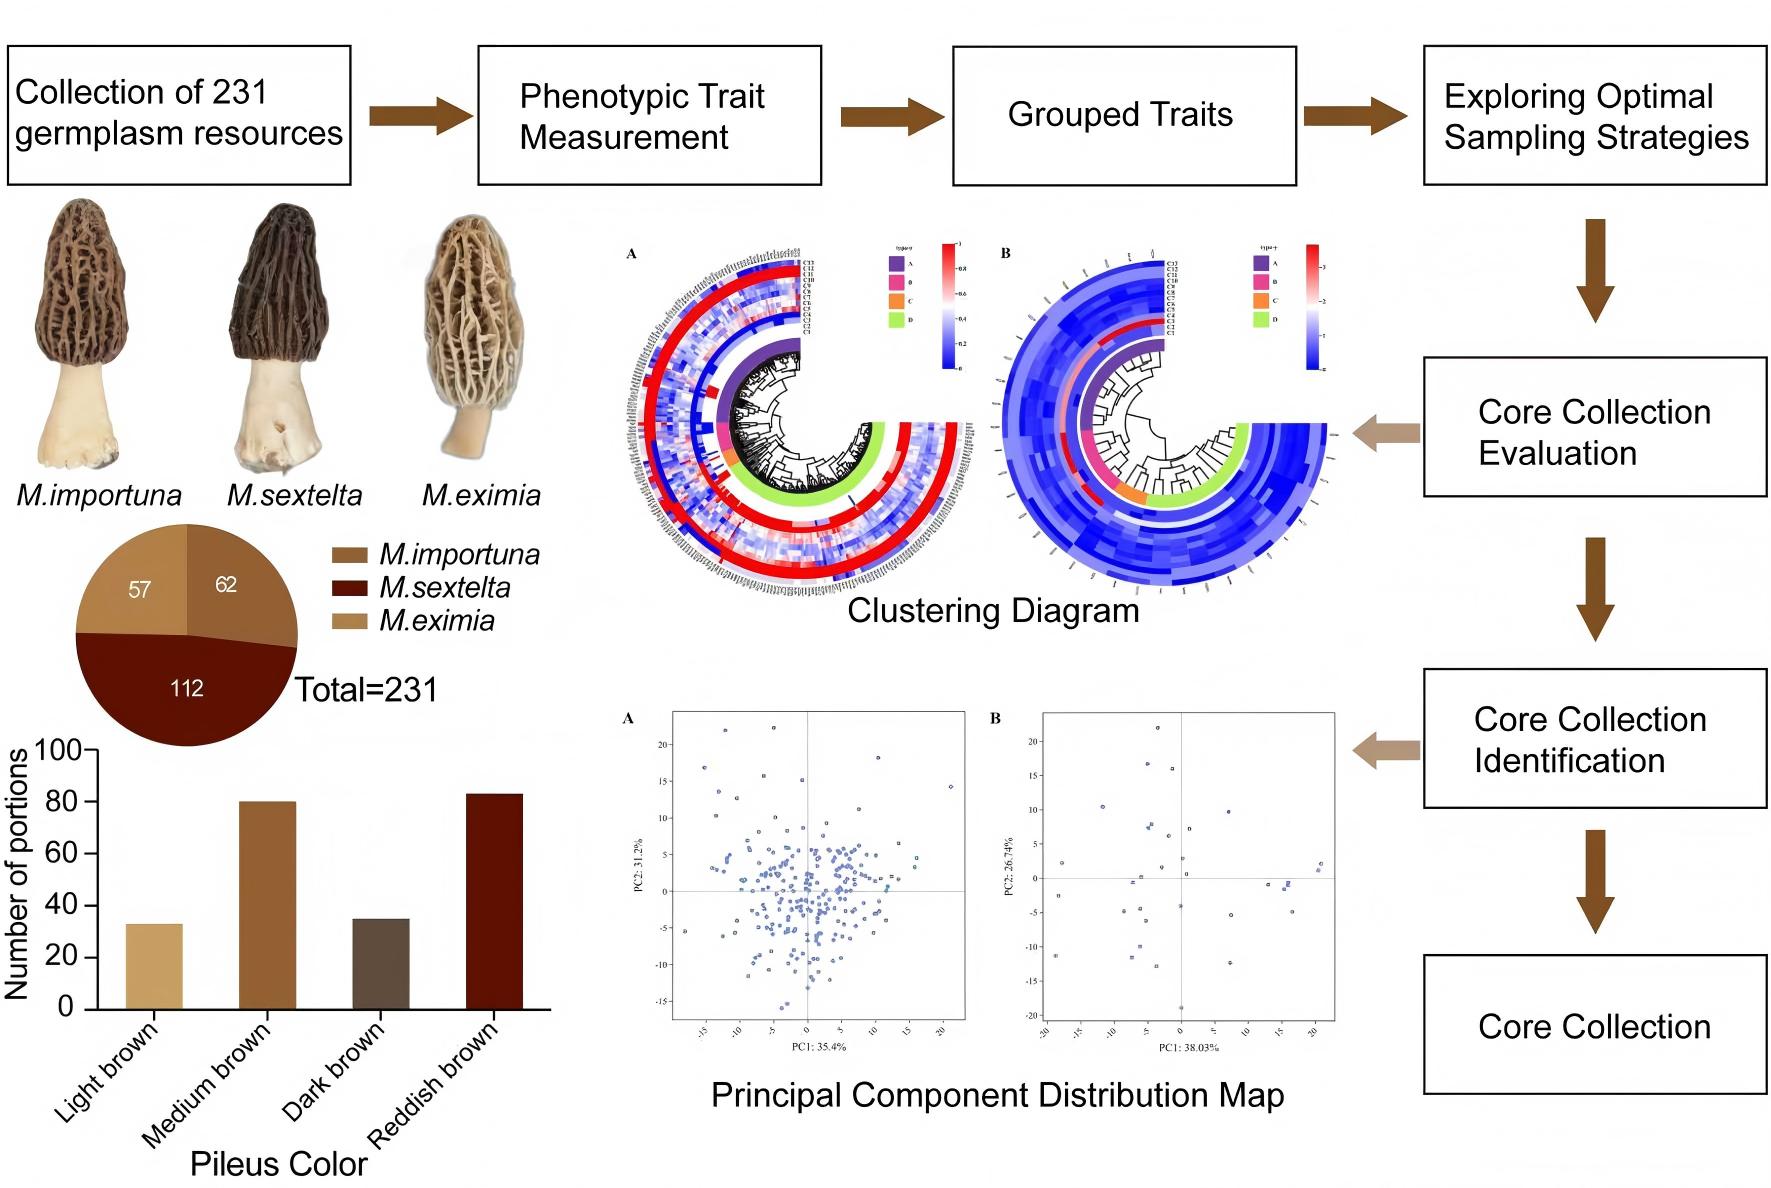
To rationally utilize Morchella germplasm resources, this study investigated 13 phenotypic traits in 231 Chinese Morchella germplasm accessions. Accessions were grouped by cap color traits and analyzed using four sampling methods (simple proportion method, logarithmic proportion method, square root proportion method, and diversity proportion method) five sampling sizes (10%, 15%, 20%, 25%, and 30%), two genetic distances (Euclidean distance and Mahalanobis distance), and four clustering methods (class-means, minimum distance, maximum distance, and sum of squared deviations) to explore optimal sampling strategies and select core collection. Core collection for the optimal sampling strategy was selected based on six indicators: percentage difference in mean, percentage difference in variance, range conformity rate, coefficient of variation change rate, phenotypic frequency variance, and phenotypic retention ratio. Phenotypic traits of the core germplasm were evaluated using genetic diversity eigenvalues, t-tests, F-tests, and systematic clustering, with confirmation via principal component analysis. Results indicated that the logarithmic ratio method yielded optimal sampling, with 15% representing the optimal sample size. Euclidean distance outperformed Mahalanobis distance, and the maximum distance method proved optimal for clustering. Ultimately, 34 Morchella germplasm resources were selected, accounting for 14.72% of the total germplasm (original germplasm). Under the P < 0.05 probability threshold, the mean, standard deviation, coefficient of variation, and genetic diversity indices of the core collection showed no significant differences from the original germplasm. Cluster analysis revealed consistent grouping of germplasm resources and phenotypic trait clusters between the core and original germplasm. In principal component analysis, the eigenvalues and cumulative contribution rates of the first four principal components were higher for the core collection than for the original germplasm. This indicates that the core collection eliminated most genetic redundancy while retaining the genetic diversity of the original germplasm, demonstrating its representative selection. This study provides a reference basis for the effective utilization and germplasm innovation of Morchella germplasm resources.
Keywords:
Morchella
; germplasm resources
; phenotypic traits
; sampling strategy
; core collection
1. Introduction
Morchella spp. is one of the most recognized and few cultivable ascomycetes among edible and medicinal fungi [1]. Its unique flavor, high nutritional quality, and medicinal value [2-4] have made it highly sought after in the market. Since the successful commercial cultivation of Morchella in 2012, the industry has experienced rapid development, with Morchella cultivation and new variety breeding becoming research hotspots [5-6]. However, with the continuous breeding and introduction of new Morchella varieties, the population and quantity of cultivable germplasm resources have gradually expanded. The asexual reproduction characteristic of Morchella has led to unclear germplasm traits and genetic background homogenization in new varieties, hindering the exploration and utilization of Morchella germplasm resources. Therefore, to enhance the utilization efficiency of germplasm resources and enable efficient and precise evaluation of germplasm resources, it is necessary to establish a core collection for Morchella.
Since the concept of core collection was proposed [7-8], scholars worldwide have established core collection collections for crops [9-10], cash crops [11-12], vegetables [13-14], fruit trees [15-16], and ornamental plants [17-18]. By constructing core collection genetic redundancy is eliminated and high-quality germplasm resources are preserved, thereby achieving more efficient germplasm resource management and utilization [8]. The population structure, genetic foundation, genetic characteristics, and morphological traits of crops all influence the construction of core collection [19]. Primary core collection for common edible fungi species has been established using molecular markers [20-22]. However, phenotypic traits serve as fundamental data for core collection construction and provide an intuitive representation of germplasm genetic diversity. Methods based on phenotypic traits for core collection construction are widely applied. As an ascomycete, Morchella exhibit a life cycle vastly different from common edible basidiomycetes. Phenotype-based core collection construction enables efficient conservation of existing Morchella germplasm resources, reduces redundancy in resource preservation, and enhances utilization efficiency. This approach provides a foundational research framework and reference for subsequent Morchella germplasm resource development and breeding efforts.
This study systematically compared four sampling methods and five sampling scales based on the precise identification of 231 Morchella germplasm resources and 13 phenotypic traits. It determined the optimal intragroup sampling method and constructed a core collection collection for Morchella by evaluating different sampling strategies. This aims to provide theoretical foundations and parental materials for the utilization of Morchella germplasm resources and variety breeding.
2. Materials and Methods
2.1. Experimental Materials
A total of 231 germplasm resources were provided for testing, including 62 specimens of Morchella importuna, 114 specimens of Morchella sextelata, and 55 specimens of Morchella eximia, supplied by the Sichuan Institute of Edible Fungi. Detailed information is presented in Table 1.
2.2. Field Trial
December 2023–March 2025 at the Modern Agricultural Science and Technology Innovation Demonstration Park of Sichuan Academy of Agricultural Sciences (104.12′42.48′′E, 30.46′37.82′′N, elevation 472 m). Managed using the Sichuan Morchella high-efficiency cultivation model [23].
2.3. Data Organization
The phenotypic trait survey referenced NY/T 4221-2022 “Guidelines for the conduct of tests for distinctness, uniformity and stability. Morchella” [24]. Trait descriptions and scoring methods are detailed in Table 2.
Raw data were organized using Excel 2019. Descriptive statistical analysis of phenotypic traits included minimum, maximum, mean (X), standard deviation (S), and coefficient of variation (CV). For frequency distribution calculations, quantitative traits were categorized into 10 levels, with adjacent levels differing by 0.5S. Level 1 < X - 2S, Level 10 ≥ X - 2S. The Shannon-Weaver genetic diversity index (H´) was calculated. Cluster analysis and principal component analysis were performed using Chiplot.
The calculation methods for key indicators are as follows:
CV=S/X×100%
H´=−∑PilnPi(i=1,2,…,n)
Pi: The percentage of germplasm units at the i-th level of a certain trait relative to the total number of units; ln: Denotes the natural logarithm.
2.4. Screening of Sampling Strategies
Based on cap color, 231 Morchella germplasm resources were grouped into four categories: light brown (I), medium brown (II), dark brown (III), and reddish-brown (IV). Five sampling intensities were set at 10%, 15%, 20%, 25%, and 30%. Within these groups, four sampling methods—simple proportion (P), logarithmic proportion (L), square root proportion (S), and diversity proportion (G) [13]—were compared to identify the method with the strongest corrective capacity for intra-group sampling. The sampling method with the strongest corrective ability for intra-group sampling was selected. Under the optimal sampling method, two genetic distances (Euclidean and Mahalanobis) and four systematic clustering methods (class-means, minimum distance, maximum distance, and sum of squared deviations) were applied for stepwise clustering analysis at different sampling scales [26]. This identified the optimal sampling strategy and established the Morchella Core collection The calculation formula is as follows:
Xi denotes the number of samples in group i, and Hi denotes the diversity index of group i.
2.5. Evaluation of Core Collection
A comprehensive evaluation of the representativeness of core collection was conducted using six assessment parameters [13,17,27], namely Mean Difference Percentage (MD), Variance Difference Percentage (VD), Range Compliance Rate (CR), Change Rate of Coefficient of Variation (VR), Phenotypic Frequency Variance (VPF), and Phenotypic Retention Ratio (RPR). To evaluate and validate the representativeness of screened core collection for the original germplasm, Excel 2019 was used to calculate the minimum, maximum, mean, standard deviation, coefficient of variation (CV), and Shannon-Weaver genetic diversity index (H´) for core collection phenotypic traits. These were then subjected to t-tests and F-tests.
2.6. Identification of Core Collection
Principal component analysis and scatter plots were used to compare the distribution of principal components between the original germplasm and the core collection, thereby confirming the effectiveness of the constructed core collection [27].
3. Results
3.1. Establishment of Core Collection
3.1.1. Analysis of Genetic Diversity in Morchella Germplasm Resources
As shown in Electronic Appendix 1, the genetic diversity indices for seven qualitative traits ranged from 0.24 to 1.30. Among these, the cap color index exhibited the highest value (1.30), dominated by medium brown (34.63%) and reddish brown (35.93%). The genetic diversity index for stem color was the lowest (0.24), dominated by yellowish-white, accounting for 93.51%. The varying degrees of genetic diversity among qualitative traits indicate that the 231 germplasm resources exhibit good phenotypic diversity, making them suitable for constructing a core collection resource.
The magnitude of the coefficient of variation reflects the degree of variation in each trait among Morchella germplasm resources, indicating the potential for variation in these traits. Table 3 shows that the coefficients of variation for quantitative traits, from highest to lowest, were: stipe diameter (25.49%) > stipe length (19.22%) > cap thickness (18.23%) > cap length-to-width ratio (15.64%) > cap width (13.22%) > cap length (12.12%). with variation ranges from 12.12% to 25.49% and an average coefficient of variation of 17.32%. Among these, stem diameter exhibited the highest coefficient of variation (7.22–25.35 mm), while cap length showed the lowest (30.85–62.30 mm). The substantial variation among traits indicates significant potential for genetic improvement in these germplasm resources. The average genetic diversity index for the six quantitative traits was 2.03. The cap length-to-width ratio exhibited the lowest genetic diversity index (1.99), while all other traits exceeded 2.00. This confirms the high genetic diversity and rich germplasm resource types, facilitating the establishment of a core collection.
3.1.2. Determination of Grouping and Sampling Methods
Based on cap color, the 231 Morchella germplasm resources were classified into four groups: Group I (light brown), Group II (medium brown), Group III (dark brown), and Group IV (reddish brown). These groups accounted for 14.29%, 34.63%, 15.15%, and 35.93% of the original germplasm, respectively. Four sampling methods and five sample sizes were used to calculate the number of specimens in each group (Table 4). The light brown group contained the fewest specimens. The proportions within each group, arranged from smallest to largest, were: simple proportion (13.04%), square root proportion (19.33%), diversity proportion (21.34%), and logarithmic proportion (22.06%). Red-brown germplasm had the highest number, with proportions increasing in the following order: logarithmic proportion, diversity proportion, square root proportion, and simple proportion, corresponding to 27.87%, 28.22%, 30.66%, and 34.78%. At different sampling scales, the differences in proportions among groups were relatively small for the logarithmic proportion, but significant for the simple proportion, square root proportion, and diversity proportion. Therefore, using the logarithmic proportion as the sampling method to construct the core collection is more reasonable.
3.1.3. Sampling Strategy Determination
Using a logarithmic proportional sampling method, we constructed 40 sets of candidate core collection using two genetic distance measures (Euclidean distance and Mahalanobis distance), four systematic clustering methods (group-mean method, minimum distance method, maximum distance method, and sum of squared deviations method), and five sampling sizes (10%, 15%, 20%, 25%, and 30%) (see Appendix 2). Lower VD, MD, and VPF values, coupled with higher CR, VR, and RPR values, indicate a superior sampling strategy. Core collection uniformity is considered good and representative when MD is below 20%, CR exceeds 80%, and VR surpasses 100%.
Comparing the two genetic distances reveals that the MD value is 0. For Euclidean distance, three datasets have VD values below 30%, while five datasets have VD values below 30% for Mahalanobis distance. The minimum VPF value is 0.06. Among Euclidean distances, two datasets have VPF values of 0.06, while one dataset has a VPF value of 0.06 for Mahalanobis distance. The maximum values for CR and VR were observed in Euclidean distance. RPR values were generally higher in Euclidean distance than in Mahalanobis distance, indicating that Euclidean distance is more suitable for constructing the core collection of Morchella.
Comparing four system clustering methods, the Longest Distance method yielded the smallest VD value (14.57%) and VPF value (0.06); The CR value (97.77%) was highest in the maximum distance method; The VR values were relatively large in both the minimum distance and maximum distance methods using Euclidean distance; The RPR value (144.00%) was highest in the minimum distance method using Euclidean distance; The minimum distance and maximum distance methods using Mahalanobis distance yielded similar results. After comparison, the maximum distance method was selected as the system clustering method.
At different sampling levels, the VD value shows an increasing trend with sampling size, slowing after 15% sampling; the MD value (0.00%) remains consistent; the VPF value exhibits minor variations; The CR value first increases then decreases, reaching its maximum (97.77%) at a sampling scale of 15%. The VR value shows a decreasing trend, with the rate of decline accelerating when the sampling scale exceeds 15%. The RPR value increases with the sampling scale. After comparing the variation patterns of these six core collection evaluation parameters, a sampling scale of 15% is suitable for core collection construction.
In summary, under the log-proportional sampling method, the Euclidean distance was selected as the genetic distance, the maximum distance clustering method was chosen, and a sampling scale of 15% (D1C7-15) was adopted as the sampling strategy for core collection.
3.2. Core Collection Evaluation
3.2.1. Comparison of Eigenvalues Between Original Germplasm and Core Collection
As shown in Table 5, the mean values, standard deviations, and genetic diversity of phenotypic traits in the original germplasm and core collection are similar, but the coefficient of variation for quantitative traits exhibits significant differences. The t-test indicates that maturity period differs among phenotypic traits, while differences in other traits are not significant. In the F-test, only cap length/width and maturity period showed significant differences. The standard deviation of phenotypic traits in the core collection was generally higher than that in the original germplasm. This may be because the core collection, after multi-level sampling, excluded more similar germplasm resources, reducing genetic redundancy between populations and increasing mutation rates. While reducing the number of germplasm resources, it still maintains strong representativeness.
3.2.2. Cluster Analysis of Original Germplasm and Core Collection
Cluster analysis of both the original germplasm and core collection based on 13 phenotypic traits (Figure 1) yielded four major clusters. Minimal differences existed between the two germplasm samples, as repeated clustering significantly reduced genetic redundancy among germplasm. The core collection fully expressed the traits of the original germplasm, enabling the differentiation of relationships between different varieties even at greater genetic distances. However, the core collection retained the structural characteristics of all samples, with no significant alteration to the fundamental structure of the population. This indicates that the strategy for constructing the core collection was reasonably sound.
3.3. Identification of Core Collection
Principal component analysis was employed to identify core collection (Table 6). Among the first four principal components, the eigenvalues, contribution rates, and cumulative contribution rates of the original germplasm were all lower than those of the core collection. The eigenvalues of the original germplasm and core collection were 1.17 and 1.21, respectively, with cumulative contribution rates of 60.67% and 68.64%, respectively. This indicates that the core collection reduced genetic redundancy among germplasm to a certain extent, effectively increased the cumulative contribution rate of the original germplasm, and maximized the retention of genetic diversity in the original germplasm.
The principal component distribution of the original germplasm is relatively concentrated (Figure 2), with significant overlap among germplasm lines and high genetic similarity, indicating a certain degree of redundancy among them. In contrast, the principal component distribution of the core collection more dispersed, suggesting that the core collection eliminates most genetic redundancy while retaining the genetic diversity and population structure of the original germplasm. This demonstrates its excellent representativeness, confirming the rationality of the constructed core collection.
4. Discussion
With the advancement of Morchella domestication and cultivation, along with the continuous breeding of new varieties, the quantity and diversity of cultivable Morchella germplasm resources have steadily increased. The effective utilization of superior Morchella germplasm resources has become a key research issue, and the construction of a core collection represents an effective solution [28]. This study systematically investigated the development of a core collection for Morchella.
Germplasm grouping and sampling strategies are pivotal to constructing core collections. Germplasm grouping reflects representativeness and genetic diversity under varying conditions, while also minimizing environmental influences. Different crops may be grouped using specific methodologies [17]. For instance, Luffa, peanut, and upland cotton were grouped by geographic origin [14, 29-30], while Cymbidium and chili pepper were grouped by petal and fruit morphology [31-32]. When traditional chrysanthemums were grouped by geographic origin or petal type, the number of accessions per group varied too widely. However, grouping by flower color resulted in a tendency toward normal distribution among groups, increasing the sampling of rare colors and ensuring sampling uniformity [17]. In this study, grouping germplasm by cap color resulted in a normally distributed and relatively uniform distribution with high genetic diversity indices. This approach increases the sample size for rare colors while ensuring sampling uniformity.
When constructing sampling strategies, it is necessary to determine the sampling method, genetic distance, systematic clustering method, and sample size. Comparative analysis of sampling methods for peppers and sweet potatoes revealed that the log-ratio method yielded the most representative core collections[32,33]. This study employed the log-ratio method to achieve uniform proportions across traits, effectively correcting for rare cap colors within germplasm groups and balancing the distribution of different colors across groups. In genetic distance clustering for crops [9-10], cash crops [11-12], vegetables [13-14], fruit trees [15-16], and ornamentals [17-18], Euclidean distance is widely used. In this study, Euclidean distance outperformed Mahalanobis distance. Sampling size primarily depends on germplasm quantity, typically ranging from 5% to 40% [34]. Given the short development history of the Morchella industry, its cultivation area is far smaller than that of crops, cash crops, or horticultural crops, and the original germplasm pool is limited. Miao Liming et al. suggest that the preserved germplasm scale is significantly smaller than that of crop species, making a sampling scale of 10%-30% more reasonable [35]. This study found that the CR value was higher at a 15% sampling scale than at other scales, indicating that a 15% sampling scale is appropriate.
5. Conclusions
Based on cap color, 231 Morchella germplasm resources were grouped into four categories. Comparing sampling strategies revealed the logarithmic proportion method as optimal. A sampling strategy was constructed using Euclidean distance, maximum distance method, and a 15% sample size. The genetic diversity characteristics of the core collections showed no significant difference from the original germplasm. However, the principal component analysis (PCA) eigenvalues and contribution rates of the core collections were higher than those of the original germplasm, indicating that the selected core collections is representative. Ultimately, 34 Morchella core collections accessions were obtained, accounting for 14.72% of the original germplasm.
Author Contributions
Conceptualization, Y.C. and X.C.; methodology, L.L and X.C.; software, X.C.; formal analysis, X.C. and S.L.; resources, J.T. and L.X.; data curation, X.C.; investigation, Y.L.; writing—original draft preparation, Y.C. and X.C.; writing—review, and editing X.C. and S.L. All authors have read and agreed to the published version of the manuscript.
Funding
This work was supported by the Agricultural Science and Technology Innovation Program of Foundation items: Supported by the Sichuan Edible Fungi Innovation Team of China Agriculture Research System (SCCXTD-2024-7); National Edible Fungi Industry Technology System (CARS-20); Sichuan Science and Technology Program (2025ZNSFSC0991); Sichuan Science and Technology Planning Project Key Research and Development Project (2021YFYZ0026).
Data Availability Statement
The original contributions presented in this study are included in the article/Supplementary Materials. Further inquiries can be directed to the corresponding author(s).
Conflicts of Interest
The authors declare no conflicts of interest.
Appendix A

Table A1.
Frequency distribution and diversity of 13 phenotypic characteristics.
| No. | Frequency distribution(%) | Genetic diversity (H´) | |||||||||
| 1 | 2 | 3 | 4 | 5 | 6 | 7 | 8 | 9 | 10 | ||
| C1 | 3.90 | 91.34 | 4.76 | 0.35 | |||||||
| C2 | 4.33 | 77.92 | 17.75 | 0.64 | |||||||
| C3 | 14.29 | 34.63 | 15.15 | 35.93 | 1.30 | ||||||
| C4 | 41.56 | 58.44 | 0.68 | ||||||||
| C5 | 2.60 | 3.03 | 10.39 | 13.42 | 19.48 | 19.05 | 20.35 | 4.76 | 4.76 | 2.16 | 2.04 |
| C6 | 1.30 | 3.46 | 10.39 | 16.45 | 18.18 | 24.68 | 10.39 | 8.66 | 3.03 | 3.46 | 2.03 |
| C7 | 1.73 | 3.03 | 7.79 | 18.18 | 23.38 | 19.48 | 12.12 | 6.06 | 5.19 | 3.03 | 2.03 |
| C8 | 4.33 | 10.39 | 15.15 | 22.51 | 22.51 | 12.55 | 5.19 | 3.90 | 3.46 | 1.99 | |
| C9 | 0.87 | 3.03 | 8.23 | 19.05 | 24.68 | 16.88 | 12.99 | 7.36 | 3.46 | 3.46 | 2.00 |
| C10 | 0.43 | 2.60 | 15.58 | 16.45 | 16.02 | 17.32 | 15.15 | 7.36 | 5.63 | 3.46 | 2.06 |
| C11 | 9.52 | 90.48 | 0.31 | ||||||||
| C12 | 6.49 | 93.51 | 0.24 | ||||||||
| C13 | 6.93 | 69.26 | 23.81 | 0.78 | |||||||
Table A2.
Comparison of 40 Sets of Candidate Core Collection Evaluation Parameters.
| Clustering Distance | Clustering Method | Overall Sampling Proportion | Core Collection | Percentage of Mean Difference(MD/%) | Percentage of Variance Difference(VD/%) | Coincidence Rate of Range (CR/%) |
Change Rate of Coefficient of Variation(VR/%) | Variance of Phenotypic Frequency(VPF) | Phenotypic Retention Rate(RPR/%) |
| Euclidean Distance(D1) | Average Linkage(C1) | 10% | D1C1-10 | 0.00 | 33.34 | 87.30 | 135.78 | 0.07 | 52.00 |
| Single Linkage(C2) | D1C2-10 | 0.00 | 20.92 | 93.64 | 141.71 | 0.06 | 56.00 | ||
| Complete Linkage(C3) | D1C3-10 | 0.00 | 32.96 | 91.84 | 135.03 | 0.10 | 56.00 | ||
| Ward's Method(C4) | D1C4-10 | 0.00 | 37.92 | 89.30 | 123.29 | 0.10 | 52.00 | ||
| Average Linkage(C5) | 15% | D1C5-15 | 0.00 | 36.96 | 94.01 | 125.85 | 0.08 | 78.00 | |
| Single Linkage(C6) | D1C6-15 | 0.00 | 25.05 | 95.13 | 136.94 | 0.06 | 81.00 | ||
| Complete Linkage(C7) | D1C7-15 | 0.00 | 44.55 | 97.77 | 139.34 | 0.09 | 75.00 | ||
| Ward's Method(C8) | D1C8-15 | 0.00 | 50.25 | 94.74 | 129.07 | 0.10 | 72.00 | ||
| Average Linkage(C9) | 20% | D1C9-20 | 0.00 | 35.19 | 95.63 | 127.18 | 0.08 | 101.00 | |
| Single Linkage(C10) | D1C10-20 | 0.00 | 34.37 | 95.18 | 132.71 | 0.08 | 105.00 | ||
| Complete Linkage(C11) | D1C11-20 | 0.00 | 43.97 | 88.42 | 119.36 | 0.08 | 122.00 | ||
| Ward's Method(C12) | D1C12-20 | 0.00 | 44.04 | 89.14 | 111.60 | 0.10 | 98.00 | ||
| Average Linkage(C13) | 25% | D1C13-25 | 0.00 | 40.12 | 90.76 | 117.92 | 0.08 | 122.00 | |
| Single Linkage(C14) | D1C14-25 | 0.00 | 29.09 | 95.18 | 130.64 | 0.07 | 125.00 | ||
| Complete Linkage(C15) | D1C15-25 | 0.00 | 45.88 | 97.08 | 122.73 | 0.09 | 115.00 | ||
| Ward's Method(C16) | D1C16-25 | 0.00 | 43.83 | 96.29 | 119.88 | 0.09 | 117.00 | ||
| Average Linkage(C17) | 30% | D1C17-30 | 0.00 | 47.73 | 95.63 | 122.60 | 0.08 | 141.00 | |
| Single Linkage(C18) | D1C18-30 | 0.00 | 30.66 | 95.18 | 125.24 | 0.08 | 144.00 | ||
| Complete Linkage(C19) | D1C19-30 | 0.00 | 49.62 | 97.08 | 119.68 | 0.09 | 133.00 | ||
| Ward's Method(C20) | D1C20-30 | 0.00 | 41.28 | 96.29 | 117.89 | 0.09 | 137.00 | ||
| Mahalanobis Distance(D2) | Average Linkage(C21) | 10% | D2C21-10 | 0.00 | 31.39 | 91.29 | 132.25 | 0.09 | 55.00 |
| Single Linkage(C22) | D2C22-10 | 0.00 | 19.95 | 92.72 | 137.35 | 0.07 | 54.00 | ||
| Complete Linkage(C23) | D2C23-10 | 0.00 | 14.57 | 91.05 | 138.83 | 0.06 | 58.00 | ||
| Ward's Method(C24) | D2C24-10 | 0.00 | 35.48 | 92.05 | 129.32 | 0.07 | 57.00 | ||
| Average Linkage(C25) | 15% | D2C25-15 | 0.00 | 33.77 | 95.31 | 129.62 | 0.08 | 78.00 | |
| Single Linkage(C26) | D2C26-15 | 0.00 | 35.37 | 95.47 | 136.25 | 0.07 | 80.00 | ||
| Complete Linkage(C27) | D2C27-15 | 0.00 | 21.98 | 93.51 | 131.23 | 0.07 | 75.00 | ||
| Ward's Method(C28) | D2C28-15 | 0.00 | 34.65 | 94.17 | 131.02 | 0.07 | 78.00 | ||
| Average Linkage(C29) | 20% | D2C29-20 | 0.00 | 32.08 | 95.49 | 128.52 | 0.07 | 101.00 | |
| Single Linkage(C30) | D2C30-20 | 0.00 | 32.15 | 95.52 | 131.94 | 0.07 | 104.00 | ||
| Complete Linkage(C31) | D2C31-20 | 0.00 | 22.41 | 93.51 | 126.56 | 0.07 | 98.00 | ||
| Ward's Method(C32) | D2C32-20 | 0.00 | 37.35 | 94.53 | 125.37 | 0.08 | 99.00 | ||
| Mahalanobis Distance(D2) | Average Linkage (C33) | 25% | D2C33-25 | 0.00 | 32.79 | 95.52 | 126.40 | 0.08 | 121.00 |
| Single Linkage(C34) | D2C34-25 | 0.00 | 29.08 | 95.52 | 128.05 | 0.07 | 121.00 | ||
| Complete Linkage (C35) | D2C35-25 | 0.00 | 30.71 | 95.13 | 124.68 | 0.08 | 120.00 | ||
| Ward's Method (C36) | D2C36-25 | 0.00 | 39.90 | 95.52 | 126.68 | 0.08 | 121.00 | ||
| Average Linkage (C37) | 30% | D2C37-30 | 0.00 | 34.57 | 95.52 | 121.82 | 0.08 | 137.00 | |
| Single Linkage (C38) | D2C38-30 | 0.00 | 33.91 | 95.52 | 125.14 | 0.07 | 143.00 | ||
| Complete Linkage (C39) | D2C39-30 | 0.00 | 35.24 | 95.18 | 121.77 | 0.08 | 140.00 | ||
| Ward's Method (C40) | D2C40-30 | 0.00 | 46.35 | 95.52 | 121.38 | 0.08 | 137.00 |
References
- Du, X.F.; Zhao, Q.; Yang, Z.L. Diversity, evolutionary history and cultivation of morels: a review. Mycosystema. 2014, 33, 183–197. [Google Scholar]
- Tietel, Z.; Masaphy, S. True morels (Morchella)-nutritional and phytochemical composition, health benefits and flavor: A review. Critical Reviews in Food Science and Nutrition. 2018, 58, 1888–1901. [Google Scholar] [CrossRef]
- Cao, Y.T.; Lu, Z.P.; Gao, X.Y.; Liu, M.L.; Sa, W.; Liang, J.; Wang, L.; Yin, W.; Shang, Q.H.; Li, Z.H. Maximum Entropy Modeling the Distribution Area of Morchella Dill. ex Pers. Species in China under Changing Climate. Biology-Basel. 2022, 11, 1027. [Google Scholar] [CrossRef]
- Tian, J.F.; Zhang, Z.; Shang, Y.H.; Zheng, Y. Extraction, structure and antioxidant activity of the polysaccharides from morels (Morchella spp.): A review. International Journal of Biological Macromolecules. 2024, 130656.
- Chen, Y.; Tang, Jie. ; Peng, W.H.; Gang, B.C.; Huang, Z.Q.; Wang, Y. A New Morchella Cultivar‘Chuan Yangdujun 6’. Acta Horticulturae Sinica. 2017, 44, 2431–2432. [Google Scholar]
- Tang, J.; Wang, Y.; Xu, Y.Y.; Tan, H.; He, X.L.; Yu, Y.; Chen, Y.; Peng, W.H. Research Progress on Key Issues of Morel Industry Development. Journal of Fungal Research. 2021, 19, 217–231. [Google Scholar]
- FRANKEL,O.H. Genetic perspeetives of germplasm conservation. Calnbridge, England:Cambridge UniversityPress. 1984, 161-170.
- Brown, A. H. Core collections: A practical approach to genetic resources management. Genome. 1989, 31, 818–824. [Google Scholar]
- Lei, M.L.; Liu, X.; Zhang, J.H.; Wang, Y.N.; Huang, R.; Du, H.L. The Genetic Representation of Local Wheat Varieties in Shanxi Province was Studied by Agronomic Characters. Molecular Plant Breeding. 2020, 18, 6853–6872. [Google Scholar]
- Song, J.M.; Arif, M.; Zi, Y.; Sze, S.H.; Zhang, M.P.; Zhang, H.B. Molecular and genetic dissection of the UsDA rice mini-core collection using high-density SNP markers. Plant Science. 2021, 308, 1–13. [Google Scholar] [CrossRef] [PubMed]
- Wang, Z.Q.; Yan, T.X.; Yan, X.W.; Liang, J.C.; Le, M.W.; Sun, J. Diversity analysis of sesame germplasm resources and core germplasm construction. Journal of Plant Genetic Resources. 2025, 26, 455–470. [Google Scholar]
- Guo, Y.C.; Zhang, L.L.; Chen, S.Y.; Qi, J.M.; Fang, P.P.; Tao, A.F.; Zhang, L.M. Zhang, L.W. DNA molecular identity card construction of core germplasm using jute. Acta Agronomica Sinica. 2021, 47, 80–93. [Google Scholar] [CrossRef]
- Zhao, X.R.; Chen, X.T.; Xue, W.; Wang, L.; Cai, X.R.; Lin, B.S.; Liu, X.J.; Cui, J.H. Construction of Core Potato Germplasm Resources in North Hebei based on Phenotypic Traits. Journal of Nuclear Agricultural Sciences. 2024, 38, 805–818. [Google Scholar]
- Zhang, T.; Wang, X.Y.; Guo, Q.W.; Wei, J.; Fang, P.P.; Xie, L.F.; Zhao, D.F.; Li, C.S. Construction of Core Germplasm Collection Based on Phenotypic Characters in Luffa spp. Chinese Journal of Tropical Crops. Chinese Journal of Tropical Crops. 2025, 46, 106–114. [Google Scholar]
- Liu, J.; Liao, K.; Cao, Q.; Sun, Q.; Liu, H.; Jia, Y. Construction of core germplasm resources of Xinjiang wild apricot using phenotypic traits. Journal of Fruit Science. 2015, 32, 787–796. [Google Scholar]
- Yin, M.Y.; Wu, B.; Wuyun, T.N.; Pang, Y.J.; Zhang, X.L. Construction of core germplasm of Pinus sylvestris var. mongolica based on phenotypic traits and SSR markers. Journal of Central South University of Forestry and Technology. 2025, 459, 13. [Google Scholar]
- Li, J.W.; Su, J.S.; Zhang, F.; Fang, W.M.; Guan, Z.Y.; Chen, S.M.; Chen, F.D. Construction of Core Collection of Traditional Chrysanthemum morifolium Based on Phenotypic Traits. Scientia Agricultura Sinica. 2021, 54, 3514–3526. [Google Scholar]
- Wang, L.; Wang, J.M.; Wang, W.; Wang, L.; Wang, L.J.; Yan, X.C.; Tan, M.L. Core sunflower germplasm was constructed based on phenotypic diversity. Chinese Journal of Oil Crops Sciences. 2021, 43, 1052–1060. [Google Scholar]
- Chen, C.; Ding, C.J.; Huang, Q.J.; Li, Z.H.; Zhang, J.; Liu, N.; Li, B.; Su, X.H. Construction of phenotypic core collection of Populus deltoides. Forest Research. 2021, 34, 1–11. [Google Scholar]
- Gao, L.H.; Bao, D.P.; Xu, Z.; Li, Y.; Lu, H.; Tan, Y.S.; Shang, X.D.; Chen, H.Y.; Wang, R.J.; Wu, Y.Y. Construction of core collection and DNA fingerprinting of Flammulina filiformis based on genetic diversity analysis. Mycosystema. 2021, 40, 3214–3230. [Google Scholar]
- Oh, Y.L.; Choi, I.G.; Kong, W.S.; Jang, K.Y.; Oh, M.Y.; Im, J.H. Evaluating genetic diversity of Agaricus bisporus accessions through phylogenetic analysis using single-nucleotide polymorphism(SNP) markers. Mycobiology. 2020, 49, 1–11. [Google Scholar] [CrossRef] [PubMed]
- Shi, X.K.; Cai, Z.X.; Guo, Z.J.; Lu, Y.P.; Chen, M.Y.; Liao, J.H. A Preliminary Report on Resequencing 18 Representative Strains of Agaricus bisporus. Fujian Journal of Agricultural Sciences. 2019, 34, 1167–1172. [Google Scholar]
- Chen, Y.; Tang, J.; Peng, W.H.; Gan, B.C.; Huang, Z.Q.; Wang, Y.; Jiang, L.; Min, J.; Liu, L.X. High-efficiency cultivation model and technology of Morchella in Sichuan. Edible and Medicinal Mushrooms. 2016, 24, 151–154. [Google Scholar]
- Ministry of Agriculture of the People's Republic of China. Guidelines for the conduct of tests for distinctness, uniformity and stability. Morchella NY/T 4221—2022. Beijing: Chinese Agriculture Press, 2022.
- Liu, Z.T.; Qiao, S.Y.; Wu, Y.H.; Zhao, S.Y. Genetics 3rd Edition. Beijing: Higher Education Press. 2015, 194.
- 26 Hu, J.; Zhu, J.; Xu, H.M. Methods of constructing core collections by stepwise clustering with three sampling strategies based on the genotypic values of crops. Theoretical and Applied Genetics. 2000, 101, 264–268. [Google Scholar] [CrossRef]
- Liu, Z.C.; Zhang, C.Y.; Zhang, Y.M.; Zhang, X.Y.; Wu, C.J.; Wang, H.B.; Shi, J.; Chen, X.S. Study on method of constructing core collection of Malus sieversii based on quantitative traits. Scientia Agricultura Sinica. 2010, 43, 358–370. [Google Scholar]
- Lyu, X.; Liu, G.X.; Li, Y.X.; Ji, Y.; Li, Y.; Li, Y.Y.; Cheng, Y.Z.; Wu, Z.D.; Zhang, X.W. Current Status and Prospects of Plant Core Germplasm Research. Journal of Plant Genetic Resources. 2025, 26, 1693–1707. [Google Scholar]
- Qi, Y.W.; Fan, L.N.; Luo, Q.W.; Wang, Q.N.; Chen, Y.S.; Huang, Z.X.; Liu, R.; Liu, S.M.; Deng, H.H.; Li, Q.W. Establishment of Saccharum spontaneum L. core collections. Acta Agronomica Sinica. 2013, 39, 649–656. [Google Scholar]
- Dai, P.H.; Sun, J.L.; He, S.P.; Wang, L.R.; Jia, Y.H.; Pan, Z.E.; Pang, B.Y.; Du, X.M.; Wang, M. Comprehensive evaluation and genetic diversity analysis of phenotypic traits of core collection in upland cotton. Scientia Agricultura Sinica. 2016, 49, 3694–3708. [Google Scholar]
- Ai, Y.; Chen, L.; Lan, S.R.; Xie, T.X.; Chen, J.; Peng, D.H. Construction of core collection of Cymbidium ensifolium varieties based on morphological traits. Molecular Plant Breeding, 2019; 17, 7924–7934. [Google Scholar]
- Lei, G.; Zhou, K.H.; Fang, R.; Wu, Y.; Chen, X.J. Studies on the constructing of pepper core collection based on phenotypic data. Acta Botanica Boreali-Occidentalia Sinica. 2016, 36, 4, 804–810. [Google Scholar]
- Li, H.F.; Chen, T.Y.; Huang, Y.M.; Wu, C.R.; Li, Y.Q.; Lu, S.Q.; Chen, X.T. Sampling strategies of sweet potato core collection based on morphological traits. Journal of Plant Genetic Resources. 2013, 14, 87–93. [Google Scholar]
- Duan, H.J.; Cao, S.; Zheng, H.Q.; Hu, D.H.; Lin, J.; Cui, B.B.; Lin, H.Z.; Hu, R.Y.; Wu, B.; Sun, Y.H.; Yun, L. Genetic Characterization of Chinese fir from Six Provinces in Southern China and Construction of a Core Collection. Scientific reports. 2017, 7, 138–148. [Google Scholar]
- Miao, L.M.; Wang, S.Y.; Zou, M.H.; Li, J.B.; Kong, L.J.; Yu, X.L. Review of the studies on core collection for horticultural crops. Journal of Plant Genetic Resources. 2016, 17, 5, 791–800. [Google Scholar]
Figure 1.
Clustering Diagram of Original Germplasm and Core Collection (A) Original Germplasm. (B) Core Collection.
Figure 1.
Clustering Diagram of Original Germplasm and Core Collection (A) Original Germplasm. (B) Core Collection.
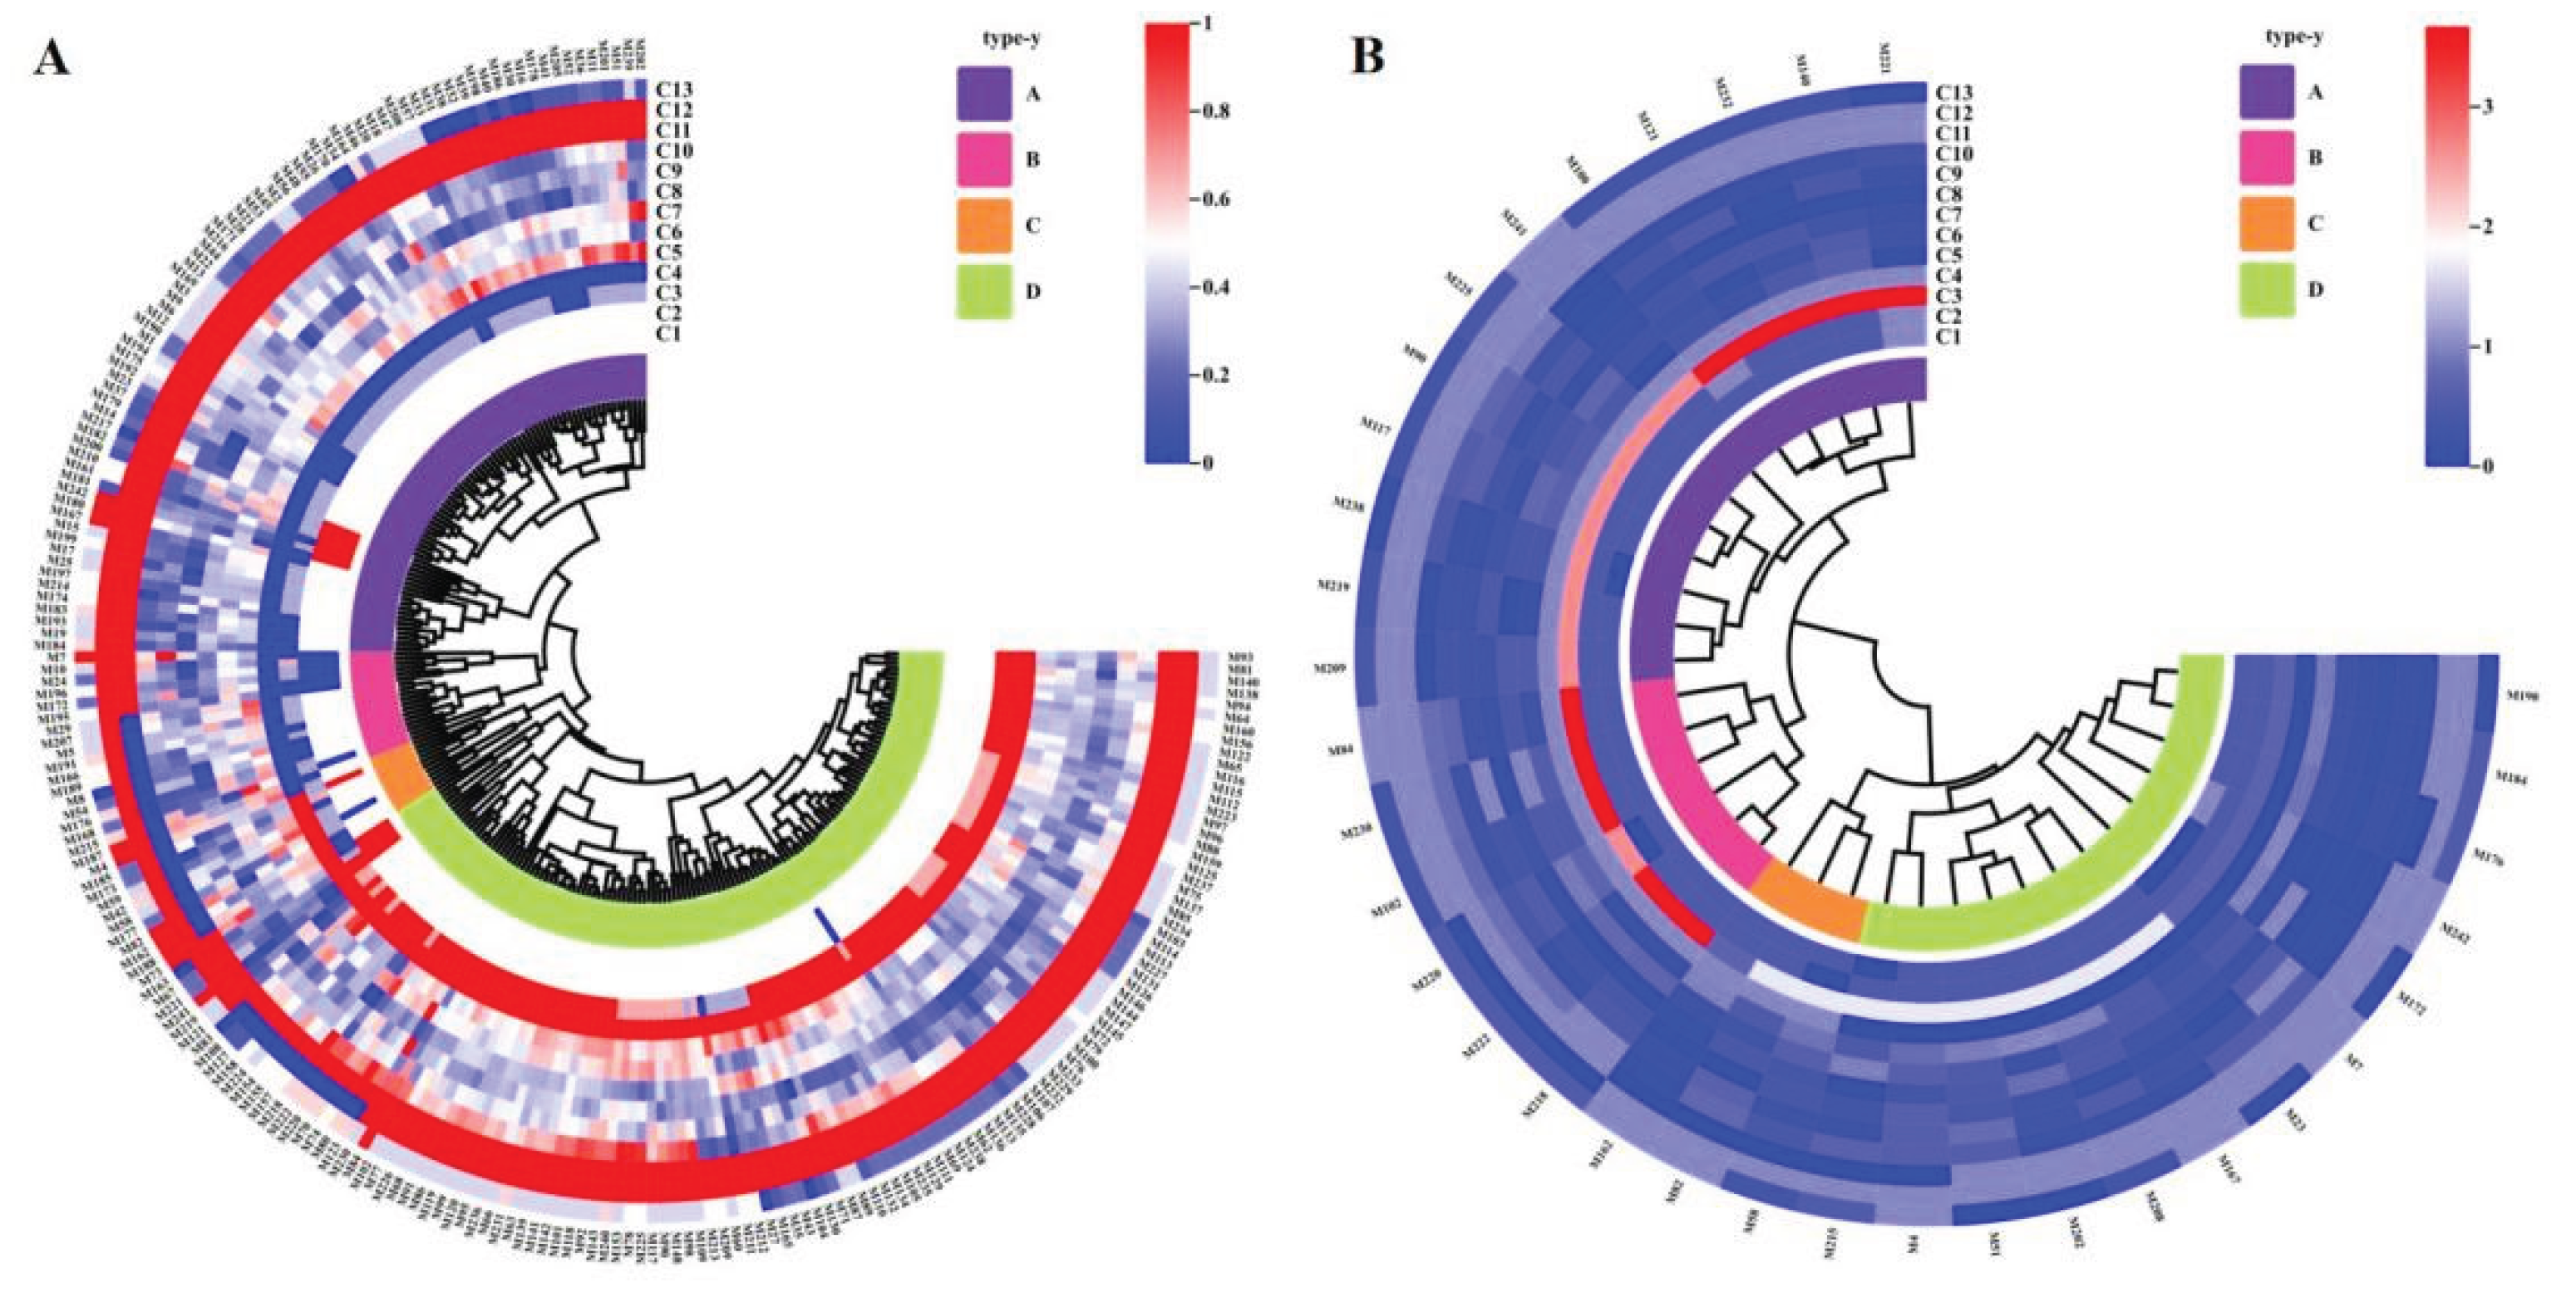
Figure 2.
Principal Component Distribution of Origina Germplasm and Core Collection. (A) Original Germplasm.( B) Core Collection.
Figure 2.
Principal Component Distribution of Origina Germplasm and Core Collection. (A) Original Germplasm.( B) Core Collection.
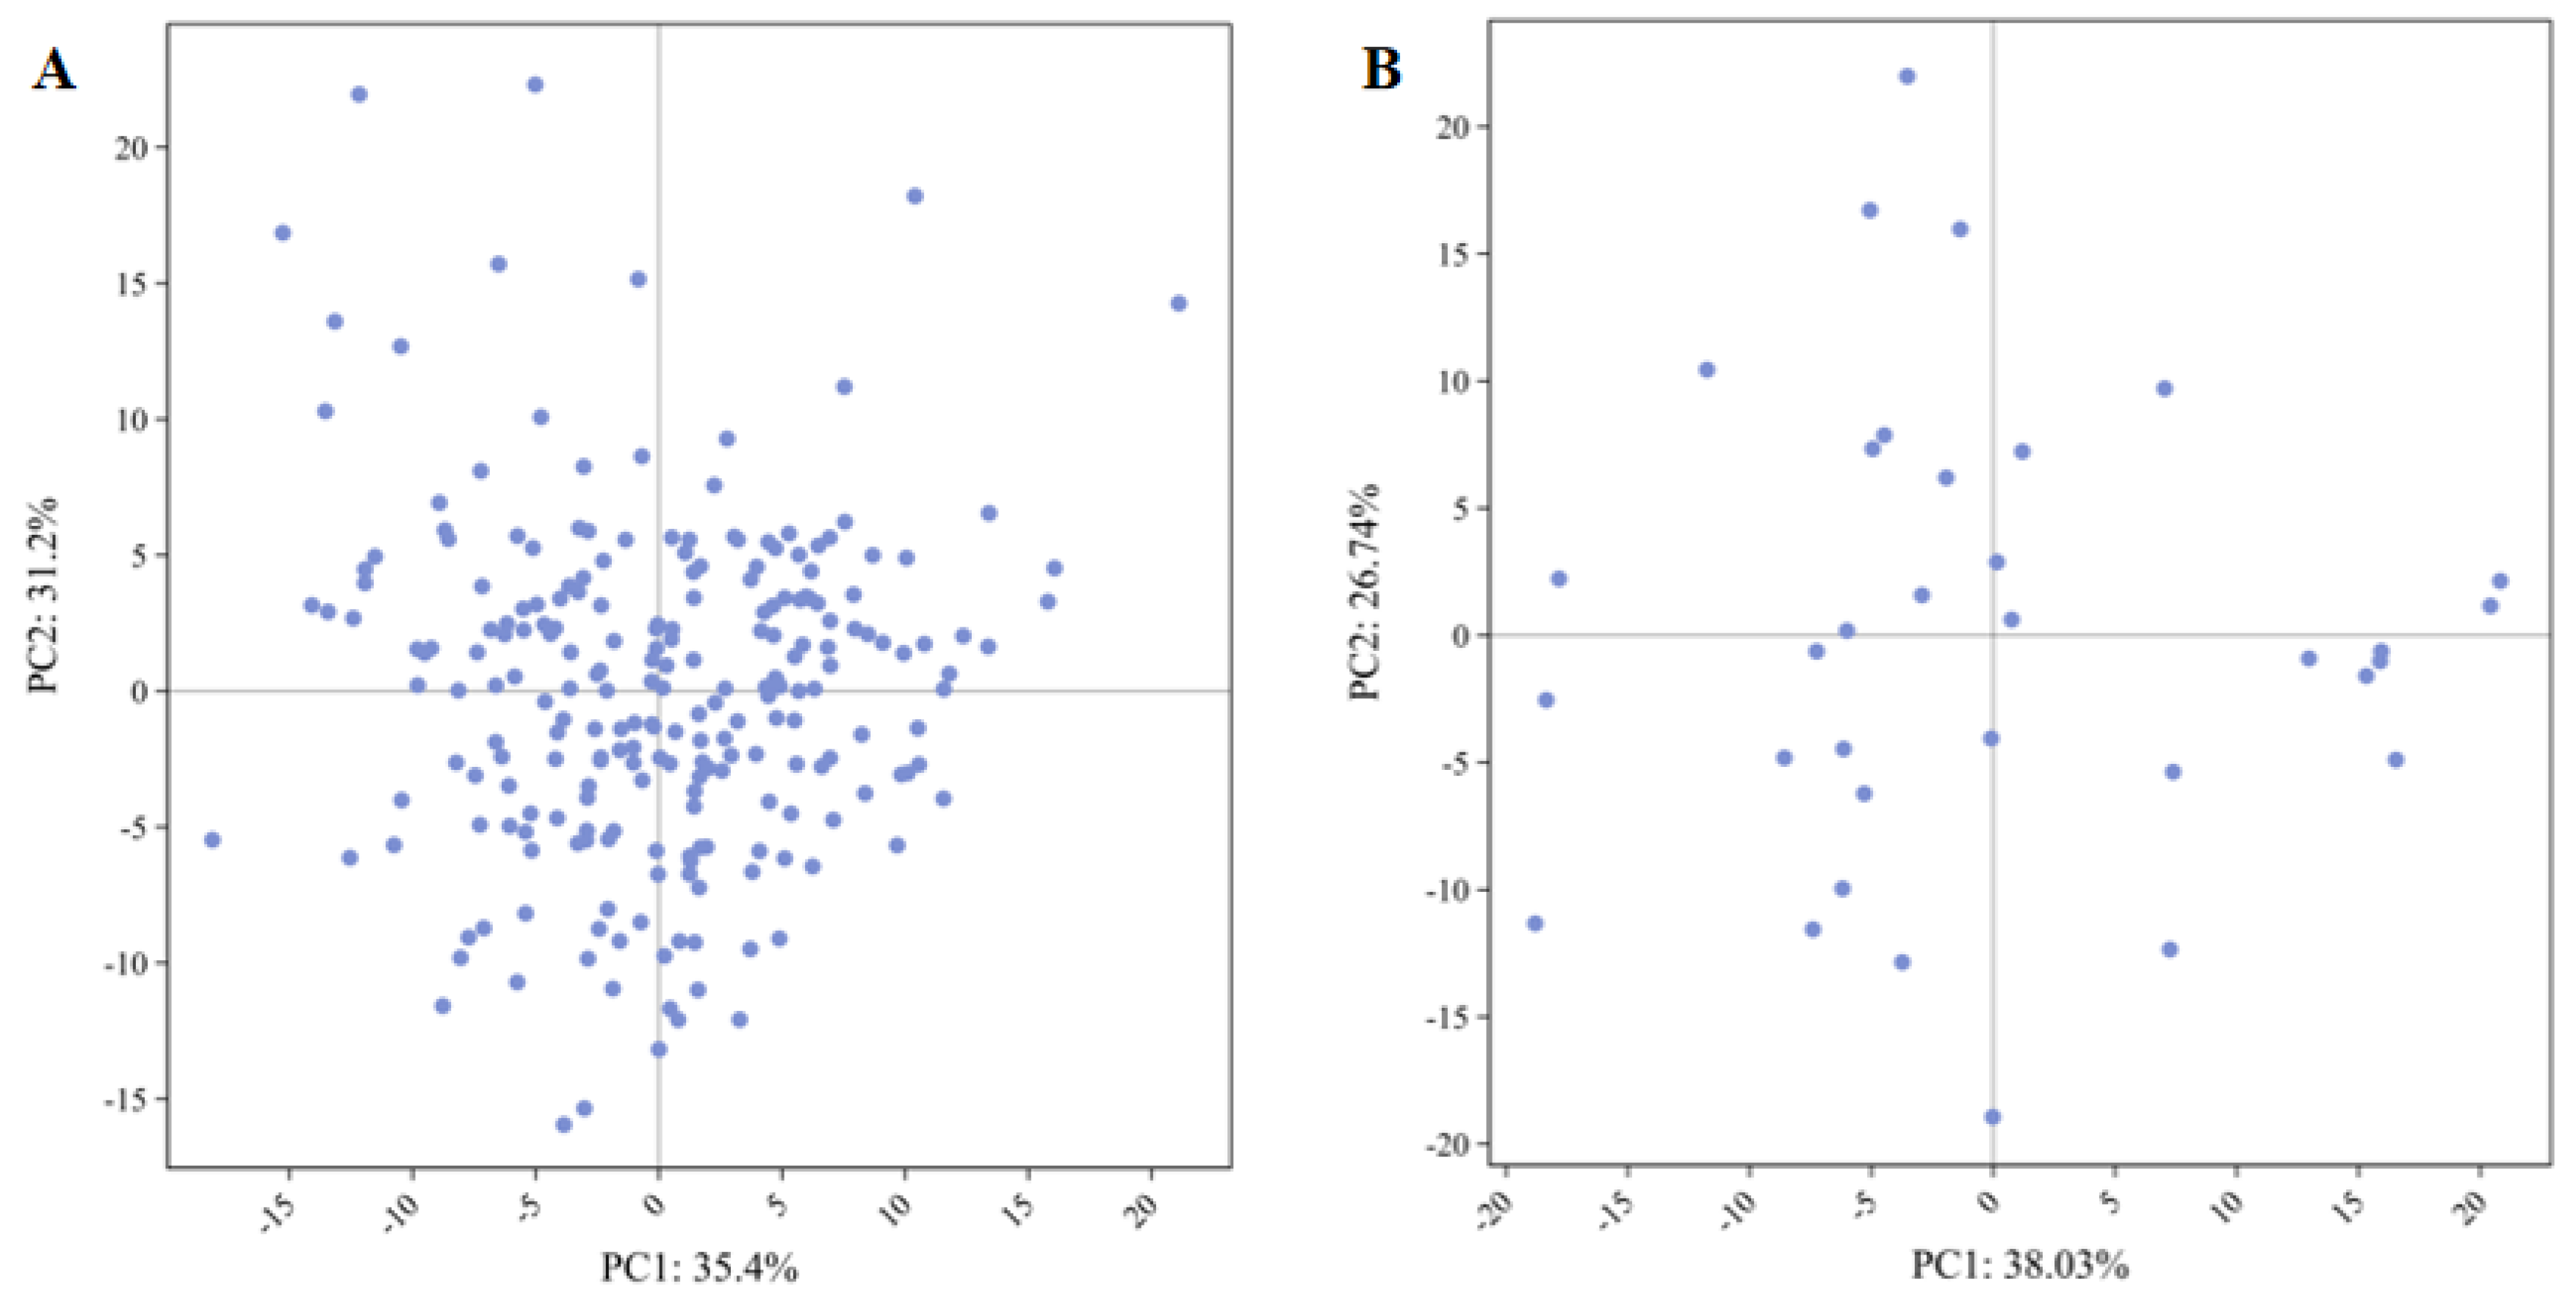
Table 1.
Test strains.
| NO. | Germplasm | Species | Source |
| 1 | M1-M48, M48-M60, M82, M215-M217 | M.importuna | Chengdu City, Sichuan Province |
| 2 | M62-M72, M86-M106, M110-M111, M115-M119, M125, M129-M148, M153-M160, M218-M219, M221-M222, M227, M230, M236-M237 | M.sextelata | Chengdu City, Sichuan Province |
| 3 | M73-M74, M220 | Shiyan City, Hubei Province | |
| 4 | M75, M112, M223-M224 | Mianyang City, Sichuan Province | |
| 5 | M76 | Zunyi City, Guizhou Province | |
| 6 | M77 | Dazhou City, Sichuan Province | |
| 7 | M78, M232-M233 | Hanzhong City, Shaanxi Province | |
| 8 | M79 | Taiyuan City, Shanxi Province | |
| 9 | M80-M81 | Lanzhou City, Gansu Province | |
| 10 | M82-M83, M114 | Nanyang City, Henan Province | |
| 11 | M84-M85 | Neijiang City, Sichuan Province | |
| 12 | M107-M109 | Jinan City, Shandong Province | |
| 13 | M113 | Guangzhou City, Guangdong Province | |
| 14 | M120 | Changsha City, Hunan Province | |
| 15 | M121-M123 | Suzhou City, Anhui Province | |
| 16 | M124, M229, M231, M240-M241 | Kunming City, Yunnan Province | |
| 17 | M126, M234-M235 | Bazhong City, Sichuan Province | |
| 18 | M127 | Shenyang City, Liaoning Province | |
| 19 | M225-M226 | Hohhot City, Inner Mongolia Autonomous Region | |
| 20 | M228 | Shijiazhuang City, Hebei Province | |
| 21 | M161, M166-M175, M177-M178, M180, M182-M185, M187-M197, M199-M202, M205, M207-M214, M238-M239 | M.eximia | Chengdu City, Sichuan Province |
| 22 | M162, M165 | Hanzhong City, Shanxi Province | |
| 23 | M163 | Yibin City, Sichuan Province | |
| 24 | M164 | Kangding City, Sichuan Province | |
| 25 | M176 | Urumqi City, Xinjiang Uygur Autonomous Region | |
| 26 | M179 | Mianyang City, Sichuan Province | |
| 27 | M181 | Shenyang City, Liaoning Province | |
| 28 | M186, M242 | Kunming City, Yunnan Province | |
| 29 | M198 | Bazhong City, Sichuan Province |
Table 2.
Phenotypic Trait Description and Scoring.
| No. | Characteristics | Characteristics type | Method of observation |
| C1 | Pileus: Shape (Subtriangular = 1; Subovate = 2; Subrectangular = 3) | QL | VG |
| C2 | Pileus: Density of Longitudinal Ridges (Sparse = 1; Medium = 2; Dense = 3) | QL | VG |
| C3 | Pileus: Color (Light brown = 1; Medium brown = 2; Dark brown = 3; Reddish brown = 4) | QL | VG |
| C4 | Pileus: Base Shape (Concave = 1; Convex = 2) | QL | VG |
| C5 | Pileus: Length | QN | MS |
| C6 | Pileus: Width | QN | MS |
| C7 | Pileus: Length/Width Ratio | QN | MS |
| C8 | Pileus: Thickness | QN | MS |
| C9 | Stipe: Length | QN | MS |
| C10 | Stipe: Diameter | QN | MS |
| C11 | Stipe: Longitudinal Section Shape (Rectangular = 1; Trapezoidal = 2) | QL | VG |
| C12 | Stipe: Color (White = 1; Yellowish-white = 2) | QL | VG |
| C13 | Maturity Period (Early = 93; Medium = 103; Late = 113) | QL | MG |
Characteristics type: QL: qualitative characteristic; QN: quantitative characteristic. Method of observation: MG: single measurement of a group of fruiting body or parts of fruiting body; MS: measurement of a number of individual fruiting body or parts of fruiting body; VG: visual assessment by a single observation of a group of fruiting body or parts of fruiting body.[25].
Table 3.
Diversity analysis of numerical characteristics of 231 germplasm resources.
| Characteristics | Min | Max | Average value | Standard deviation | Coefficient of variation |
| C5 | 30.85 | 62.3 | 47.74 | 5.79 | 12.12 |
| C6 | 16.95 | 43.47 | 28.67 | 3.79 | 13.22 |
| C7 | 0.94 | 2.79 | 1.69 | 0.26 | 15.64 |
| C8 | 5.05 | 14.03 | 7.37 | 1.34 | 18.23 |
| C9 | 13.88 | 49.58 | 26.56 | 5.10 | 19.22 |
| C10 | 7.22 | 25.35 | 15.33 | 3.91 | 25.49 |
Table 4.
Sampling Method.
| Sampling Method | Data Grouping | Proportion of Each Group | Total Sample Size | Original Germplasm | |||||
| 10% | 15% | 20% | 25% | 30% | Number with in the Group | Intra-group Proportion | |||
| Simple Proportion | Ⅰ | 13.04 | 3 | 5 | 7 | 8 | 10 | 33 | 14.29 |
| Ⅱ | 34.78 | 8 | 12 | 16 | 20 | 24 | 80 | 34.63 | |
| Ⅲ | 17.39 | 4 | 5 | 7 | 9 | 11 | 35 | 15.15 | |
| Ⅳ | 34.78 | 8 | 12 | 17 | 21 | 25 | 83 | 35.93 | |
| Logarithmic Proportion | Ⅰ | 22.06 | 5 | 7 | 10 | 13 | 15 | 33 | 14.29 |
| Ⅱ | 27.64 | 6 | 9 | 13 | 16 | 19 | 80 | 34.63 | |
| Ⅲ | 22.43 | 5 | 8 | 11 | 13 | 16 | 35 | 15.15 | |
| Ⅳ | 27.87 | 7 | 10 | 13 | 16 | 20 | 83 | 35.93 | |
| Square Root Proportion | Ⅰ | 19.33 | 4 | 7 | 9 | 11 | 13 | 33 | 14.29 |
| Ⅱ | 30.10 | 7 | 10 | 14 | 17 | 21 | 80 | 34.63 | |
| Ⅲ | 19.91 | 5 | 7 | 9 | 12 | 14 | 35 | 15.15 | |
| Ⅳ | 30.66 | 7 | 10 | 15 | 18 | 22 | 83 | 35.93 | |
| Diversity Proportion | Ⅰ | 21.34 | 5 | 7 | 10 | 12 | 15 | 33 | 14.29 |
| Ⅱ | 28.19 | 6 | 9 | 13 | 16 | 19 | 80 | 34.63 | |
| Ⅲ | 22.24 | 5 | 8 | 10 | 13 | 16 | 35 | 15.15 | |
| Ⅳ | 28.22 | 7 | 10 | 14 | 17 | 20 | 83 | 35.93 | |
Table 5.
Comparison of Characteristic Values between Original Germplasm and Core Collection.
| Characteristics | Coefficient of variation | Genetic diversity | Extremely poor | Average value | Standard deviation | |||||||
| Original Germplasm | Core Collection |
Original Germplasm | Core Collection |
Original Germplasm | Core Collection |
Original Germplasm | Core Collection |
P value(t-test) | Original Germplasm | Core Collection |
P value(F-test) | |
| C1 | 14.44 | 21.43 | 0.35 | 0.58 | 2 | 2 | 2.01 | 1.94 | 0.24 | 0.29 | 0.42 | 0.24 |
| C2 | 21.10 | 17.15 | 0.64 | 0.44 | 2 | 2 | 2.13 | 2.00 | 0.10 | 0.45 | 0.34 | 0.10 |
| C3 | 40.21 | 42.47 | 1.30 | 1.38 | 3 | 3 | 2.73 | 2.62 | 0.59 | 1.10 | 1.11 | 0.59 |
| C4 | 31.10 | 30.04 | 0.68 | 0.67 | 1 | 1 | 1.58 | 1.62 | 0.71 | 0.49 | 0.49 | 0.71 |
| C5 | 12.12 | 19.71 | 2.04 | 1.84 | 31.45 | 31.45 | 47.74 | 48.37 | 0.59 | 5.79 | 9.53 | 0.59 |
| C6 | 13.22 | 24.18 | 2.03 | 1.90 | 26.52 | 26.52 | 28.67 | 28.46 | 0.79 | 3.79 | 6.88 | 0.79 |
| C7 | 15.64 | 30.75 | 2.03 | 1.78 | 1.85 | 2.28 | 1.69 | 1.57 | 0.19 | 0.26 | 0.48 | 0.04* |
| C8 | 18.23 | 27.69 | 1.99 | 1.85 | 8.98 | 8.94 | 7.37 | 7.17 | 0.59 | 1.34 | 1.99 | 0.47 |
| C9 | 19.22 | 32.42 | 2.00 | 1.89 | 35.70 | 35.70 | 26.56 | 26.07 | 0.64 | 5.10 | 8.45 | 0.64 |
| C10 | 25.49 | 35.26 | 2.06 | 1.83 | 18.13 | 17.16 | 15.33 | 15.19 | 0.85 | 3.91 | 5.35 | 0.85 |
| C11 | 15.41 | 20.91 | 0.31 | 0.47 | 1 | 1 | 1.90 | 1.82 | 0.15 | 0.29 | 0.38 | 0.15 |
| C12 | 12.73 | 14.84 | 0.24 | 0.30 | 1 | 1 | 1.94 | 1.91 | 0.62 | 0.25 | 0.28 | 0.62 |
| C13 | 5.13 | 6.46 | 0.78 | 0.99 | 24 | 24 | 101.81 | 105.97 | 0.00* | 5.23 | 6.85 | 0.00* |
* represented significant correlation (P<0.05).
Table 6.
Comparison Table of Principal Components between Origina Germplasm and Core Collection.
| Principal component | Eigen value | Contribution rate(%) | Total contribution rate(%) | |||
| Original Germplasm | Core Collection |
Original Germplasm | Core Collection |
Original Germplasm | Core Collection |
|
| 1 | 3.09 | 3.65 | 23.78 | 28.04 | 23.78 | 28.04 |
| 2 | 2.01 | 2.43 | 15.46 | 18.71 | 39.25 | 46.75 |
| 3 | 1.62 | 1.63 | 12.43 | 12.57 | 51.68 | 59.31 |
| 4 | 1.17 | 1.21 | 9.00 | 9.33 | 60.67 | 68.64 |
Disclaimer/Publisher’s Note: The statements, opinions and data contained in all publications are solely those of the individual author(s) and contributor(s) and not of MDPI and/or the editor(s). MDPI and/or the editor(s) disclaim responsibility for any injury to people or property resulting from any ideas, methods, instructions or products referred to in the content. |
© 2025 by the authors. Licensee MDPI, Basel, Switzerland. This article is an open access article distributed under the terms and conditions of the Creative Commons Attribution (CC BY) license (http://creativecommons.org/licenses/by/4.0/).
Copyright: This open access article is published under a Creative Commons CC BY 4.0 license, which permit the free download, distribution, and reuse, provided that the author and preprint are cited in any reuse.


