
Submitted:
22 September 2025
Posted:
23 September 2025
You are already at the latest version
Abstract
Learning Analytics Dashboards (LADs) are increasingly deployed to support self-regulated learning in large-scale online courses. Yet many existing dashboards lack strong theoretical grounding, contextual alignment, or actionable feedback, and some designs have been shown to inadvertently discourage learners through excessive social comparison or high inference costs. In this study, we designed and evaluated a LAD grounded in the COPES model of self-regulated learning and tailored to a credit-bearing Massive Open Online Course (MOOC) using a data-driven approach. We conducted a randomized controlled trial with 8,745 learners, comparing a control group, a dashboard without feedback, and a dashboard with ARCS-framed actionable feedback. Results showed that the dashboard with feedback significantly increased learners’ likelihood of verification (i.e., paying for the certification track), with mixed effects on engagement and no measurable impact on final grades. These findings suggest that dashboards are not uniformly beneficial: while feedback-supported LADs can enhance motivation and persistence, dashboards that lack interpretive support may impose cognitive burdens without improving outcomes. The study contributes to the learning analytics literature by (1) articulating design principles for theoretically and contextually grounded LADs, and (2) providing large-scale experimental evidence on their impact in authentic MOOC settings.
Keywords:
learning analytics dashboards
; self-regulated learning
; MOOCs
; actionable feedback
; randomized control trial
1. Introduction
Massive Open Online Courses (MOOCs) have expanded access to education worldwide, but they continue to face persistent challenges with learner engagement and success. One contributing factor is the lack of individualized feedback to support self-regulated learning (SRL), the iterative process of planning, monitoring, and evaluating one’s learning, which is strongly associated with improved achievement [1,2,3]. Although SRL is widely recognized as beneficial, many MOOC learners struggle to engage in it effectively [4,5].
Learning Analytics Dashboards (LADs) have been proposed as tools to foster SRL at scale by visualizing indicators of performance, progress, and engagement [6,7]. When designed well, dashboards can help learners reflect on their behavior and adapt strategies [8,9]. Yet their effectiveness remains contested. Reviews have shown that many LADs lack theoretical grounding or contextual alignment [7,10], and others caution that poorly designed dashboards may increase cognitive load, encourage unhelpful social comparison, or even discourage learners [11,12]. Evidence to date has been mixed, with many studies relying on small-scale pilots or lab settings that limit generalizability [13,14]. This has led to ongoing debate about whether LADs have truly lived up to their promise [11].
A recurring critique of LAD design is the absence of strong theoretical foundations. Matcha et al. [7] found that most dashboards lacked explicit connections to SRL theory, while more recent reviews suggest incremental progress but continued inconsistency. Paulsen et al. [15] argue that the field is moving “from analytics to learning”, but note that theoretical integration is often partial. Similarly, Masiello [16] highlights that dashboards remain largely descriptive, translating data into visualizations but rarely into actionable, pedagogically meaningful guidance.
Another concern is the use of peer-referenced indicators. While showing learners how they compare to their peers can provide useful benchmarks, it can also trigger counterproductive forms of social comparison. Classic theory suggests that upward comparison often undermines motivation [17,18], and empirical studies confirm this risk in online learning settings [12,19]. To mitigate such effects, researchers have proposed using prior cohorts rather than real-time peers as reference points [20], or offering multiple benchmarks (e.g., passing, certificate-ready, mastery) aligned with diverse learner goals [21,22].
A third critique relates to inference cost, the difficulty of interpreting and acting on dashboard information. Complex or abstract visualizations have been shown to impose high cognitive demands [23,24], with their benefits often skewed toward more educated learners [20]. Recent studies emphasize that explanatory, goal-oriented designs reduce extraneous cognitive load [25], while poor designs can undermine motivation by eroding learners’ sense of competence [26]. Reducing inference costs requires not only careful visualization design but also the inclusion of actionable feedback. The ARCS model [27], which structures feedback to capture Attention, highlight Relevance, build Confidence, and foster Satisfaction, has proven effective in online learning environments [28,29].
Finally, LAD evaluation practices have often been limited. Many studies rely on small pilots, lab settings, or usability testing, restricting generalizability [13,14]. Field studies in authentic learning contexts are rarer but crucial, as they reveal confounding factors and provide stronger evidence for both researchers and practitioners [12,30,31,32]. Reviews consistently call for more large-scale, controlled evaluations of dashboards in real courses with diverse learners [11].
This study addresses these gaps by designing a theory- and context-grounded LAD for a credit-bearing MOOC in supply chain management and evaluating it through a large-scale randomized controlled trial (RCT) with 8,745 learners. Guided by the COPES model of SRL [33,34] and informed by historical course data, the dashboard incorporated pacing and progress indicators, with or without actionable ARCS-framed feedback. Our findings show that dashboards without feedback offered no measurable benefits, while dashboards with feedback significantly increased learners’ verification rates (a marker of commitment) but had mixed effects on engagement and no effect on final performance. These results suggest that dashboards are not inherently beneficial, their impact depends on specific design choices. By combining design principles with experimental evidence, this work contributes to ongoing debates about the value of LADs and offers practical guidance for building dashboards that support self-regulated learning at scale.
2. Materials and Methods
This section describes the context, design, and evaluation of the study. We begin with an overview of the MOOC that served as the research setting, then detail the development of the Learning Analytics Dashboard (LAD), and finally outline the experimental design used to assess its impact.
2.1. Course Context
The intervention was implemented in a 14-week MOOC in supply chain analytics, part of a credential-bearing online program in supply chain management. The course ran from April to August 2023 and enrolled 8,745 learners, the majority of whom were working professionals. Learners could audit the course for free or enroll as verified learners by paying a fee. Only verified learners got access to graded assignments and the final exam and were eligible for a certificate if they achieved a grade of 60% or higher.
The course consisted of five instructional modules followed by a final exam. Each module included lecture videos, practice problems, and a graded assignment. Graded assignments contributed 10% of the final grade, while the exam contributed 90%. Survey data from previous course runs (2021–2022) indicated that verified learners typically pursued two main goals: earning a certificate for professional purposes or achieving a high grade as a pathway toward graduate credit. A recurring theme in these surveys was anxiety about pacing and uncertainty about progress, which motivated the development of a learner-facing dashboard to scaffold self-regulated learning.
2.2. Dashboard Design
The Learning Analytics Dashboard (LAD) was designed using the COPES model of self-regulated learning [33,34], which conceptualizes regulation as cycles of conditions, operations, products, evaluations, and standards. From this perspective, dashboards act as external feedback systems that can supplement or correct learners’ often biased self-assessments.
To contextualize the design, we conducted exploratory analyses on clickstream data from earlier runs of the course (2021-2022). Multiple linear regression was used to predict final grades from behavioral traces (see Table 1). Indicators were selected if they showed statistical significance in the linear model (). This process yielded three indicators: (1) number of unique lecture videos completed; (2) number of unique practice problems submitted; and (3) number of practice problem solutions viewed.
Consultations with the teaching staff underscored concerns about learners’ pacing behaviors and highlighted the critical role of structured study planning in online learning. These insights informed the inclusion of time-related features in the dashboard to scaffold effective pacing strategies. The decision was further motivated by evidence on the spacing effect, which demonstrates that learning is more effective when study sessions are distributed over time rather than massed together [35,36].
Two dashboard variants were developed to examine the role of feedback in shaping learners’ interpretation and use of these indicators. The first presented the indicators with basic visualizations and general words of encouragement. The second combined the same indicators with actionable messages structured using Keller’s ARCS model [27] (Attention, Relevance, Confidence, Satisfaction). Messages were designed to highlight pacing strategies, encourage persistence, and reinforce learners’ progress.
2.3. Experimental Design
We conducted a three-arm randomized controlled trial (RCT) to evaluate the LAD’s impact on learner outcomes. Upon enrollment, learners were randomly assigned to one of three groups: (1) Group C (Control): no dashboard; (2) Group A (LAD without feedback): dashboard with indicators and generic encouragement; (3) Group B (LAD with feedback): dashboard with indicators plus ARCS-framed actionable feedback.
Learners in Groups A and B accessed their dashboards through an Engagement Dashboard button on the course landing page. To ensure consistency in the interface, control learners saw a similar button leading to a survey. Engagement with the dashboard was voluntary, with no incentives to click.
Three outcome variables were analyzed: verification status (binary: verified vs. not verified), engagement (total hours spent in the course, derived from clickstream logs), and performance (final course grade, available only for verified learners, on a 0-1 scale). Verification was analyzed with logistic regression, using Group C as the reference category. Engagement and performance were analyzed with one-way ANOVAs, followed by Tukey’s HSD for post-hoc comparisons. Because engagement data were positively skewed, engagement analyses were conducted on both raw and log-transformed values. Effect sizes were reported as odds ratios (ORs) for logistic regression and eta squared () for ANOVAs. Statistical significance was set at . All analyses were conducted in Python 3.10 using the statsmodels, scipy, and statsmodels.stats.multicomp packages.
3. Results
The results are organized into two parts. First, we present the design of the Learning Analytics Dashboard (LAD), derived from theory and contextual data. Second, we report outcomes from the randomized controlled field experiment.
3.1. Learning Analytics Dashboard Design
Grounded in the COPES model and informed by historical learner data, we derived four principles for the design of a theory- and context-driven LAD: (1) use benchmarks from prior cohorts instead of real-time peers to avoid unproductive social comparison; (2) provide multiple goal-aligned standards to reflect the diverse intentions of MOOC learners; (3) combine low-inference visualizations with actionable, ARCS-framed feedback to reduce inference costs and support motivation; and (4) make pacing visible to promote spacing effects. These principles, along with their implementation in dashboard components and theoretical grounding, are summarized in Table 2.
The final LAD (Figure 1) implemented these principles through six components. Engagement KPIs and Time Estimate (a, b) provided progress benchmarks and workload references, aligned with both passing and high-achievement trajectories. Countdown, Weekly Streak, and Time Spent Last Week (c, d, e) emphasized pacing, encouraging learners to spread study sessions rather than relying on cramming. Messages (f) differed by dashboard variant: in the no-feedback version, learners received only generic words of encouragement, whereas in the feedback version, messages were tailored to learners’ current progress and structured using Keller’s ARCS model [27] to strengthen attention, relevance, confidence, and satisfaction. All visualizations were deliberately kept simple (bar and line charts with explanatory tooltips) to minimize extraneous cognitive load, while feedback messages translated indicators into clear next steps.
Design validation with eight former learners suggested strong usability and positive reception. Participants particularly valued the combination of encouragement and actionable guidance, noting that encouragement alone might not suffice for those falling behind. They also expressed interest in countdown and additional pacing features to support planning.
3.2. Experimental Evaluation
We evaluated the impact of the LAD through a randomized controlled trial with three conditions: Group C (control, no dashboard), Group A (dashboard without feedback), and Group B (dashboard with feedback). Outcomes were examined across three dimensions: verification (whether learners paid to pursue a certificate), engagement (time invested in the course), and performance (final grades on the course). These measures capture both learners’ behavioral commitment to the course and their academic achievement.
3.2.1. Verification
Verification rates are summarized in Table 3. Learners who received the dashboard with feedback (Group B) were more likely to upgrade to the verified track (18.1%) than those in either the control condition (15.7%) or the dashboard without feedback (15.7%). Logistic regression confirmed a significant effect of condition, with learners in Group B showing higher odds of verification relative to the control (OR = 1.19, 95% CI [1.04, 1.37], ; Table 4). By contrast, the dashboard without feedback (Group A) had no effect compared to the control (OR = 1.00, 95% CI [0.87, 1.15], ). These findings indicate that dashboards enhanced with feedback increased learners’ willingness to invest financially in the course to pursue a certificate, whereas dashboards without feedback had no measurable effect.
3.2.2. Engagement
Engagement was measured as total time spent in the course (in hours). Descriptive statistics are reported in Table 5. A one-way ANOVA on raw values indicated significant differences between groups, F(2, 8742) = 4.26, , but the effect size was negligible (). Tukey post-hoc tests showed that learners in Group B (dashboard with feedback) spent significantly more time than those in Group A (dashboard without feedback), and marginally more than the control group (Group C; ). However, due to the positive skew of the engagement distribution, we repeated the analysis on log-transformed data. In this robustness check, the group effect was no longer significant, F(2, 8742) = 1.53, , and no pairwise contrasts reached significance (Table 7). Taken together, these results indicate that the differences observed in raw data were driven by a small subset of highly engaged learners, rather than a consistent effect across the population.

Table 5.
Descriptive statistics for engagement (total time in hours) by experimental group.
| Group | n | Mean | SD | Median |
|---|---|---|---|---|
| Group A (no feedback) | 2,952 | 10.53 | 28.09 | 0.48 |
| Group B (with feedback) | 2,907 | 12.64 | 32.54 | 0.46 |
| Group C (control) | 2,886 | 10.84 | 28.72 | 0.44 |
Table 6.
One -way ANOVA and Tukey post-hoc results for engagement (raw values). Engagement was measured as total time in hours.
Table 6.
One -way ANOVA and Tukey post-hoc results for engagement (raw values). Engagement was measured as total time in hours.
| Source | Sum Sq | df | F | p |
|---|---|---|---|---|
| Experimental group | 7.59e3 | 2 | 4.26 | .014 |
| Residual | 7.79e6 | 8742 | ||
| Effect size | ||||
| 0.001 | ||||
| Post-hoc Tukey HSD comparisons | ||||
| Comparison | Mean diff (h) | 95% CI | p | Significant |
| Group A vs. Group B | 2.11 | [0.28, 3.94] | .019 | Yes |
| Group A vs. Group C | 0.31 | [–1.52, 2.14] | .917 | No |
| Group B vs. Group C | –1.80 | [–3.64, 0.04] | .056 | No (trend) |
Table 7.
One-way ANOVA and Tukey post-hoc results for engagement (log-transformed values). Engagement was measured as total time in hours, log-transformed using .
Table 7.
One-way ANOVA and Tukey post-hoc results for engagement (log-transformed values). Engagement was measured as total time in hours, log-transformed using .
| Source | Sum Sq | df | F | p |
|---|---|---|---|---|
| Experimental group | 1.05e1 | 2 | 2.60 | .075 |
| Residual | 1.77e4 | 8742 | ||
| Effect size | ||||
| 0.001 | ||||
| Post-hoc Tukey HSD comparisons | ||||
| Comparison | Mean diff (log h) | 95% CI | p | Significant |
| Group A vs. Group B | 0.067 | [–0.020, 0.154] | .168 | No |
| Group A vs. Group C | –0.012 | [–0.099, 0.075] | .946 | No |
| Group B vs. Group C | –0.079 | [–0.166, 0.009] | .088 | No |
3.2.3. Performance
Performance was analyzed using final course grades. This analysis was restricted to verified learners since they were the only ones who had access to graded assignments and the final exam. Descriptive statistics are reported in Table 8: learners in Group C (control) achieved slightly higher mean grades (M = 0.39) than those in Group B (M = 0.37) and Group A (M = 0.35), but differences were small. A one-way ANOVA revealed no significant differences between groups (F(2, 1438) = 1.46, ) with a negligible effect size (). Tukey post-hoc comparisons confirmed that none of the pairwise contrasts were significant (all ; Table 9). These results indicate that neither dashboard condition, with or without feedback, had a measurable effect on learners’ final grades.
4. Discussion
This study set out to design and evaluate a Learning Analytics Dashboard (LAD) grounded in theory and contextualized in a MOOC, with the goal of enhancing self-regulated learning (SRL) and improving learner outcomes. By combining insights from SRL theory, data-driven indicator selection, and prior critiques of LAD design, we proposed a set of design principles and tested their impact in a large-scale field experiment. The results highlight both the promise and the pitfalls of LADs: dashboards with actionable, ARCS-framed feedback increased learners’ likelihood of verification (paying for the option to get a certificate) and showed tentative signs of boosting engagement, while dashboards without feedback provided no measurable benefit and may have imposed additional cognitive costs. Across all conditions, no significant effects were observed on final performance.
These findings extend the ongoing debate captured by Kaliisa et al. [11], who noted that evidence for positive effects of LADs remains mixed. Our study underscores that dashboards are not uniformly beneficial: simply visualizing learner data, without clear interpretive support, can increase inference costs and fail to motivate action. In contrast, dashboards that integrate low-inference visualizations with actionable feedback can foster motivation and persistence, leading to higher levels of commitment. In this sense, the question is not whether LADs “work,” but under what design conditions they provide value.
The results also align with research on cognitive load and motivation. Explanatory, goal-oriented designs have been shown to reduce extraneous cognitive load [25], while poorly structured feedback can undermine learners’ sense of competence [26]. Our findings fit this dual mechanism: learners who received indicators without guidance saw little benefit, whereas those who received ARCS-framed feedback showed stronger commitment to the course. Feedback thus appears essential for transforming dashboard data into actionable strategies while also sustaining motivation.
A further contribution of this study concerns pacing. Building on evidence that distributed engagement predicts certification more strongly than total time-on-task [38], we incorporated features such as weekly streaks and time-on-task indicators. While these elements alone were insufficient to produce significant effects, their integration with actionable feedback may explain why the feedback condition produced more favorable outcomes. This suggests that pacing supports are most effective when combined with guidance that helps learners interpret and act on them.
Taken together, our findings emphasize that the impact of LADs depends not on their mere presence but on their theoretical grounding, contextualization, and feedback design. Effective dashboards need to reduce inference costs, support motivational needs, and provide meaningful pacing scaffolds. Future research should continue to explore which combinations of features influence different learner outcomes, and how learner characteristics (e.g., prior achievement, goals, self-efficacy) moderate dashboard effectiveness.
4.1. Limitations and future work
This study has three main limitations. First, it was conducted in a single MOOC on supply chain management, primarily targeting working professionals, which constrains generalizability to other subjects, learner populations, or formats such as instructor-paced or non-credit-bearing courses. Second, the dashboard was evaluated as a bundled intervention, making it impossible to isolate the specific contributions of individual components—for example, whether the increase in verification rates was driven by ARCS-framed messages, pacing indicators, or their interaction. Third, the study focused on short-term outcomes within a single course; we did not examine whether exposure to dashboards fostered lasting SRL practices or longer-term academic gains. Future work should therefore test LADs across more diverse settings, employ experimental designs that isolate the contribution of individual features, and track learners longitudinally to capture sustained impacts.
5. Conclusions
This study designed and evaluated a Learning Analytics Dashboard (LAD) grounded in SRL theory and contextualized in a MOOC, testing its impact in a large-scale field experiment. The results show that dashboards are not inherently beneficial: a LAD without actionable feedback offered no measurable advantages and in some cases was associated with negative outcomes, while a LAD with ARCS-framed feedback increased learners’ verification rates and showed tentative benefits for engagement. No differences were found in final course performance across groups.
These findings suggest that LADs are most effective when they combine low-inference visualizations with actionable, motivationally framed feedback, and when they make pacing strategies explicit. For practitioners, the results caution against deploying dashboards that simply display learner data, while highlighting the value of embedding interpretive support that helps learners translate indicators into concrete actions. For researchers, the study underscores the need for designs that isolate the contribution of dashboard features and for evaluations across diverse contexts to determine when and for whom LADs are effective.
Ultimately, the question is not whether LADs have lived up to the hype, but under what conditions they can deliver on their promise. By grounding dashboards in theory, contextualizing them with course-specific data, and embedding feedback that supports both cognition and motivation, future work can move toward LADs that reliably foster self-regulated learning and learner success at scale.
Author Contributions
Conceptualization, I.B. and E.P.-C.; methodology, I.B.; software, I.B.; validation, I.B. and E.P.-C.; formal analysis, I.B.; investigation, I.B.; resources, E.P.-C.; data curation, I.B.; writing—original draft preparation, I.B.; writing—review and editing, I.B. and E.P.-C.; visualization, I.B.; supervision, E.P.-C.; project administration, I.B.; funding acquisition, E.P.-C. All authors have read and agreed to the published version of the manuscript.
Funding
This research was funded by MIT Integrated Learning Initiative (MITili).
Informed Consent Statement
Informed consent was waived because the study analyzed anonymized platform data collected under the platform’s standard terms of use, and no personally identifiable information was disclosed.
Data Availability Statement
The data supporting the findings of this study are not publicly available due to privacy and platform restrictions. Anonymized data may be made available from the corresponding author upon reasonable request and with permission of MITx/edX.
Acknowledgments
We would like to thank Dr. Chris Caplice for his guidance and support as the primary instructor of the course. We are especially grateful to Dr. Heeryung Choi, who contributed substantially to the early stages of this research through her ideas and collaborative work during her postdoctoral fellowship with our team. We also thank Connor Makowski for his contributions to the technical development of the LAD and the retrieval of data from the edX platform.
Conflicts of Interest
The authors declare no conflicts of interest. The funders had no role in the design of the study; in the collection, analyses, or interpretation of data; in the writing of the manuscript; or in the decision to publish the results.
References
- Panadero, E. A Review of Self-regulated Learning: Six Models and Four Directions for Research. Front. Psychol. 2017, 8, 422. [Google Scholar] [CrossRef]
- Winne, P.H.; Hadwin, A.F. Studying as self-regulated learning. Metacognition in educational theory and practice 1998, 93, 27–30. [Google Scholar]
- Schunk, D.H.; Zimmerman, B.J. Self-regulated learning and performance: an introduction and an overview. In Handbook of Self-Regulation of Learning and Performance; Routledge, 2011; pp. 15–26.
- Lin, X.; Lehman, J.D. Supporting learning of variable control in a computer-based biology environment: Effects of prompting college students to reflect on their own thinking. Journal of Research in Science Teaching: The Official Journal of the National Association for Research in Science Teaching 1999, 36, 837–858. [Google Scholar] [CrossRef]
- Berardi-Coletta, B.; Buyer, L.S.; Dominowski, R.L.; Rellinger, E.R. Metacognition and problem solving: A process-oriented approach. J. Exp. Psychol. Learn. Mem. Cogn. 1995, 21, 205–223. [Google Scholar] [CrossRef]
- Schwendimann, B.A.; Rodríguez-Triana, M.J.; Vozniuk, A.; Prieto, L.P.; Boroujeni, M.S.; Holzer, A.; Gillet, D.; Dillenbourg, P. Perceiving Learning at a Glance: A Systematic Literature Review of Learning Dashboard Research. IEEE Trans. Learn. Technol. 2017, 10, 30–41. [Google Scholar] [CrossRef]
- Matcha, W.; Gašević, D.; Pardo, A. A systematic review of empirical studies on learning analytics dashboards: A self-regulated learning perspective. IEEE Transactions on 2020. [Google Scholar] [CrossRef]
- Aguilar, S.J.; Karabenick, S.A.; Teasley, S.D.; Baek, C. Associations between learning analytics dashboard exposure and motivation and self-regulated learning. Comput. Educ. 2021, 162, 104085. [Google Scholar] [CrossRef]
- Hattie, J.; Timperley, H. The Power of Feedback. Rev. Educ. Res. 2007, 77, 81–112. [Google Scholar] [CrossRef]
- Jivet, I.; Scheffel, M.; Drachsler, H.; Specht, M. Awareness Is Not Enough: Pitfalls of Learning Analytics Dashboards in the Educational Practice. In Proceedings of the Data Driven Approaches in Digital Education. Springer International Publishing; 2017; pp. 82–96. [Google Scholar]
- Kaliisa, R.; Misiejuk, K.; López-Pernas, S.; Khalil, M.; Saqr, M. Have learning analytics dashboards lived up to the hype? A systematic review of impact on students’ achievement, motivation, participation and attitude. In Proceedings of the Proceedings of the 14th learning analytics and knowledge conference, 2024, pp. 295–304.
- Valle, N.; Antonenko, P.; Valle, D.; Sommer, M.; Huggins-Manley, A.C.; Dawson, K.; Kim, D.; Baiser, B. Predict or describe? How learning analytics dashboard design influences motivation and statistics anxiety in an online statistics course. Educ. Technol. Res. Dev. 2021, 69, 1405–1431. [Google Scholar] [CrossRef]
- Ez-zaouia, M.; Lavoué, E. EMODA: a tutor oriented multimodal and contextual emotional dashboard. In Proceedings of the Proceedings of the Seventh International Learning Analytics & Knowledge Conference, New York, NY, USA, 2017; LAK ’17, pp. 429–438.
- Mejia, C.; Florian, B.; Vatrapu, R.; Bull, S.; Gomez, S.; Fabregat, R. A Novel Web-Based Approach for Visualization and Inspection of Reading Difficulties on University Students. IEEE Trans. Learn. Technol. 2017, 10, 53–67. [Google Scholar] [CrossRef]
- Paulsen, L.; Lindsay, E. Learning analytics dashboards are increasingly becoming about learning and not just analytics-A systematic review. Education and Information Technologies 2024, 29, 14279–14308. [Google Scholar] [CrossRef]
- Masiello, I.; Mohseni, Z.; Palma, F.; Nordmark, S.; Augustsson, H.; Rundquist, R. A current overview of the use of learning analytics dashboards. Education Sciences 2024, 14, 82. [Google Scholar] [CrossRef]
- Festinger, L. A Theory of Social Comparison Processes. Hum. Relat. 1954, 7, 117–140. [Google Scholar] [CrossRef]
- Blanton, H.; Buunk, B.P.; Gibbons, F.X.; Kuyper, H. When better-than-others compare upward: Choice of comparison and comparative evaluation as independent predictors of academic performance. J. Pers. Soc. Psychol. 1999, 76, 420. [Google Scholar] [CrossRef]
- Tong, W.; Shakibaei, G. The role of social comparison in online learning motivation through the lens of social comparison theory. Acta Psychologica 2025, 258, 105291. [Google Scholar] [CrossRef]
- Davis, D.; Jivet, I.; Kizilcec, R.F.; Chen, G.; Hauff, C.; Houben, G.J. Follow the successful crowd: raising MOOC completion rates through social comparison at scale. In Proceedings of the LAK. rene.kizilcec.com, 2017, pp. 454–463.
- Zheng, S.; Rosson, M.B.; Shih, P.C.; Carroll, J.M. Understanding Student Motivation, Behaviors and Perceptions in MOOCs. In Proceedings of the CSCW ’15: Proceedings of the 18th ACM Conference on Computer Supported Cooperative Work & Social Computing, New York, New York, USA, 2015; pp. 1882–1895.
- Elliot, A.J.; Thrash, T.M. Achievement goals and the hierarchical model of achievement motivation. Educ. Psychol. Rev. 2001, 13, 139–156. [Google Scholar] [CrossRef]
- Dowding, D.; Merrill, J.A.; Onorato, N.; Barrón, Y.; Rosati, R.J.; Russell, D. The impact of home care nurses’ numeracy and graph literacy on comprehension of visual display information: implications for dashboard design. J. Am. Med. Inform. Assoc. 2018, 25, 175–182. [Google Scholar] [CrossRef]
- Hou, X.; Nagashima, T.; Aleven, V. Design a Dashboard for Secondary School Learners to Support Mastery Learning in a Gamified Learning Environment. In Proceedings of the Educating for a New Future: Making Sense of Technology-Enhanced Learning Adoption. Springer International Publishing; 2022; pp. 542–549. [Google Scholar]
- Cheng, N.; Zhao, W.; Xu, X.; Liu, H.; Tao, J. The influence of learning analytics dashboard information design on cognitive load and performance. Education and Information Technologies 2024, 29, 19729–19752. [Google Scholar] [CrossRef]
- Evans, P.; Vansteenkiste, M.; Parker, P.; Kingsford-Smith, A.; Zhou, S. Cognitive load theory and its relationships with motivation: A self-determination theory perspective. Educational Psychology Review 2024, 36, 7. [Google Scholar] [CrossRef]
- Keller, J.M. Development and use of the ARCS model of instructional design. Journal of instructional development 1987, 10, 2. [Google Scholar] [CrossRef]
- Inkelaar, T.; Simpson, O. Challenging the `distance education deficit’ through `motivational emails’. Open Learn. 2015, 30, 152–163. [Google Scholar] [CrossRef]
- Parte, L.; Universidad Nacional de Educación a Distancia -UNED.; Mellado, L.; Universidad Nacional de Educación a Distancia -UNED. Motivational emails in distance university. J. Educ. Online 2021, 18.
- Davis, D.; Chen, G.; Jivet, I.; Hauff, C.; Houben, G.J. Encouraging Metacognition & Self-Regulation in MOOCs through Increased Learner Feedback. In Proceedings of the LAL@ LAK. ceur-ws.org, 2016, pp. 17–22.
- Kizilcec, R.F.; Davis, G.M.; Cohen, G.L. Towards Equal Opportunities in MOOCs: Affirmation Reduces Gender & Social-Class Achievement Gaps in China. In Proceedings of the Proceedings of the Fourth (2017) ACM Conference on Learning @ Scale, New York, NY, USA, 2017; L@S ’17, pp. 121–130.
- Davis, D.; Triglianos, V.; Hauff, C.; Houben, G.J. SRLx: A Personalized Learner Interface for MOOCs. In Proceedings of the Lifelong Technology-Enhanced Learning. Springer International Publishing, 2018, pp. 122–135.
- Winne, P.H. Experimenting to bootstrap self-regulated learning. J. Educ. Psychol. 1997, 89, 397. [Google Scholar] [CrossRef]
- Winne, P.H. Modeling self-regulated learning as learners doing learning science: How trace data and learning analytics help develop skills for self-regulated learning. Metacognition and Learning 2022.
- Dempster, F.N. The spacing effect: A case study in the failure to apply the results of psychological research. Am. Psychol. 1988, 43, 627–634. [Google Scholar] [CrossRef]
- Carvalho, P.F.; Sana, F.; Yan, V.X. Self-regulated spacing in a massive open online course is related to better learning. NPJ Sci Learn 2020, 5, 2. [Google Scholar] [CrossRef] [PubMed]
- Murayama, K.; Elliot, A.J. The joint influence of personal achievement goals and classroom goal structures on achievement-relevant outcomes. J. Educ. Psychol. 2009, 101, 432–447. [Google Scholar] [CrossRef]
- Miyamoto, Y.R.; Coleman, C.; Williams, J.J.; Whitehill, J.; Nesterko, S.; Reich, J. Beyond time-on-task: The relationship between spaced study and certification in MOOCs. Journal of Learning Analytics 2015, 2, 47–69. [Google Scholar] [CrossRef]
Figure 1.
Screenshot of the Learning Analytics Dashboard (LAD). Components (a–e) provide low-inference visualizations of engagement and pacing, while component (f) delivers ARCS-framed actionable feedback.
Figure 1.
Screenshot of the Learning Analytics Dashboard (LAD). Components (a–e) provide low-inference visualizations of engagement and pacing, while component (f) delivers ARCS-framed actionable feedback.
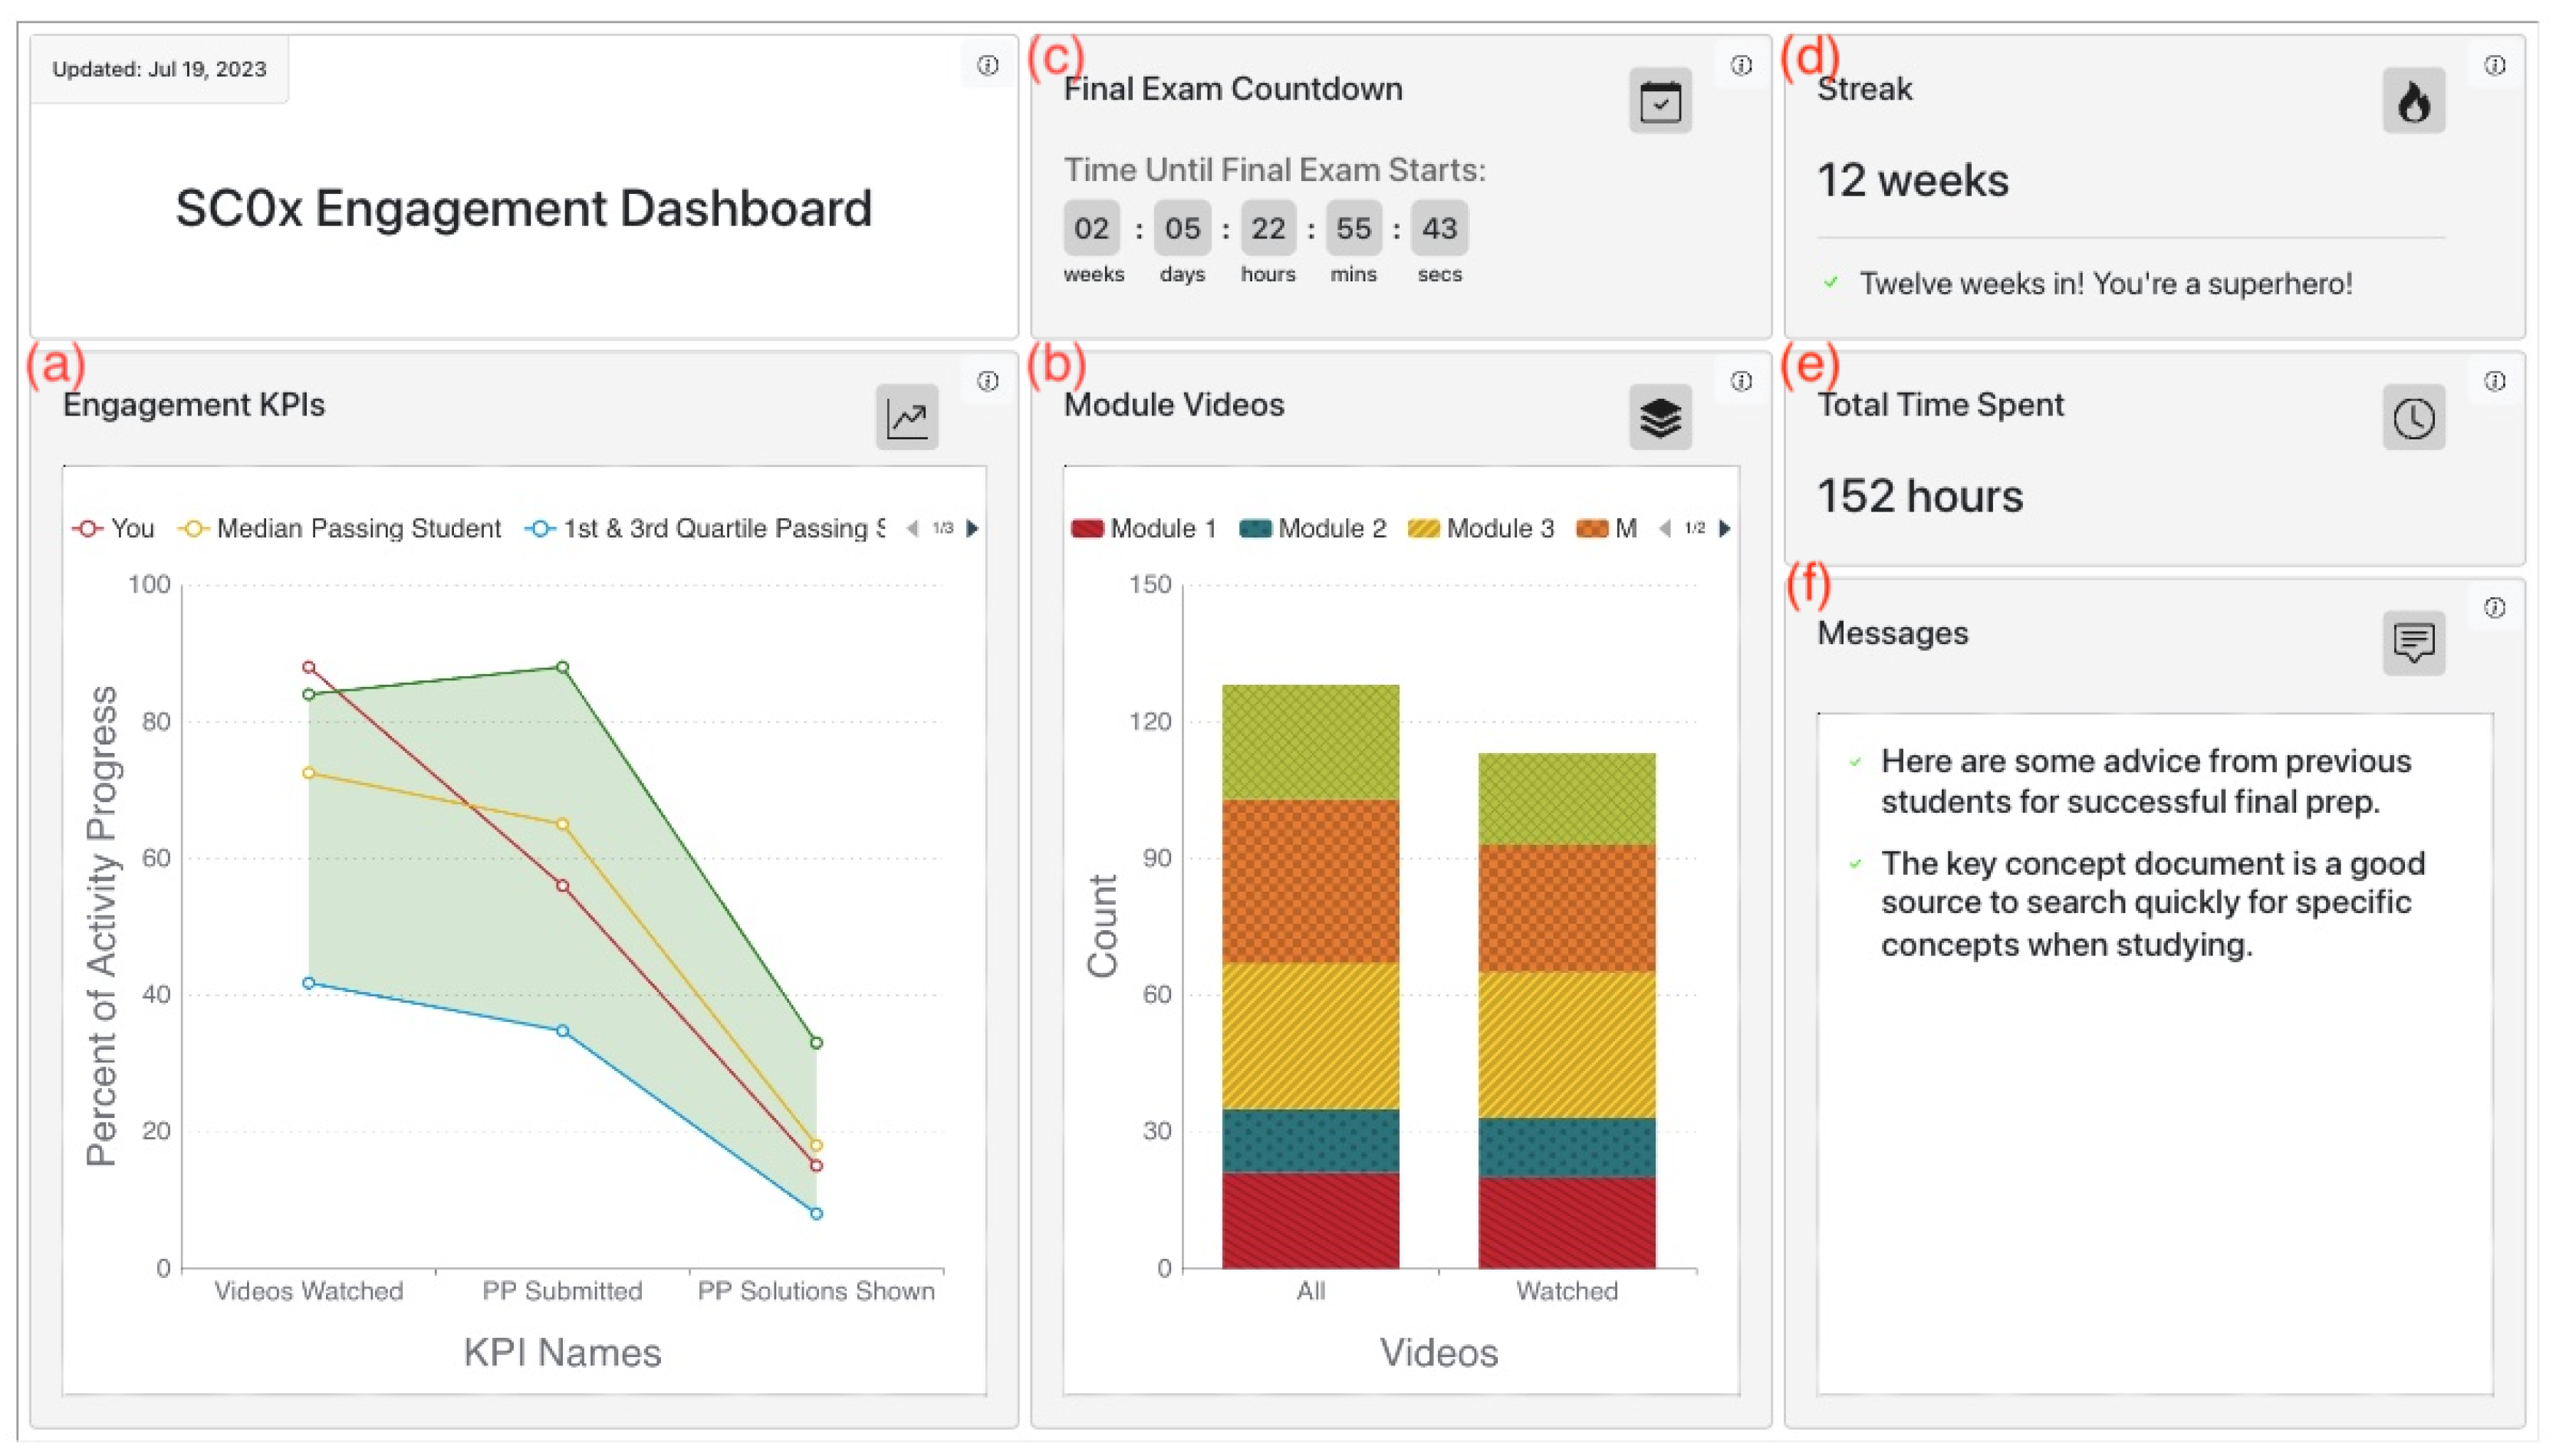
Table 1.
Exploratory Regression Results (MLR) for Behavioral Indicators.
| Indicator | Definition | MLR Significance | |
|---|---|---|---|
| 1 | Number of unique lecture videos completed | Log entries for unique videos with ≥1 “stop_video” event | 0.001 |
| 2 | Number of unique practice problems submitted | Log entries for unique practice problems with ≥ 1 submission | |
| 3 | Number of solutions for unique practice problems checked | Ratio of solution views (“show_answer”) over incorrect attempts | |
| 4 | Time period between modules | Time difference between final attempt in one module and first “play_video” in the next | 0.379 |
| 5 | Time period within a module | Time difference between first “play_video” and last attempt in same module | 0.009 |
| 6 | Number of video revisits during/after graded assignments | Log entries for unique videos with ≥1 “play_video” after initial attempt on module test | 0.627 |
| 7 | Writing activities on discussion forums | Log entries for forum posts/comments with “created” event | 0.246 |
| 8 | Reading activities on discussion forums | Log entries for forum posts/comments with “viewed” event | 0.604 |
Table 2.
Mapping of LAD design principles to dashboard components, SRL mechanisms (COPES), and supporting evidence.
Table 2.
Mapping of LAD design principles to dashboard components, SRL mechanisms (COPES), and supporting evidence.
| Design principle | Dashboard component(s) | SRL mechanism (COPES) | Supporting evidence |
|---|---|---|---|
| Benchmarks from prior cohorts | Engagement KPIs (a) | Standards & Evaluation | Reduces unproductive social comparison [12,17,19,20] |
| Multiple goal-aligned standards | Engagement KPIs (a), Time Estimate (b) | Standards & Planning | Supports diverse learner goals; avoids mismatches [21,22,37] |
| Low-inference visuals + actionable ARCS feedback | All visualizations (a–e) + Messages (f) | Operations, Products, Evaluation | Reduces inference cost and extraneous load; supports competence and persistence [23,24,25,26,27] |
| Spacing effect (make pacing visible) | Countdown (c), Weekly Streak (d), Time Spent Last Week (e) | Conditions, Planning | Distributed engagement predicts certification beyond time-on-task [35,36,38] |
Table 3.
Verification status by experimental group. Percentages reflect the proportion of learners who verified (paid for a certificate) out of all enrolled in that group.
Table 3.
Verification status by experimental group. Percentages reflect the proportion of learners who verified (paid for a certificate) out of all enrolled in that group.
| Group | Verified n (%) | Total n |
|---|---|---|
| Group C (no dashboard) | 452 (15.7%) | 2,886 |
| Group A (no feedback) | 462 (15.7%) | 2,952 |
| Group B (with feedback) | 527 (18.1%) | 2,907 |
Table 4.
Logistic regression predicting verification (1 = paid for certificate). Group C (no dashboard) is the reference category.
Table 4.
Logistic regression predicting verification (1 = paid for certificate). Group C (no dashboard) is the reference category.
| Predictor | OR | 95% CI | p-value |
|---|---|---|---|
| Intercept | 0.19 | [0.17, 0.21] | |
| Group A (no feedback) | 1.00 | [0.87, 1.15] | .990 |
| Group B (with feedback) | 1.19 | [1.04, 1.37] | .012 |
Table 8.
Descriptive statistics for performance (final grade, verified learners only) by experimental group.
Table 8.
Descriptive statistics for performance (final grade, verified learners only) by experimental group.
| Group | n | Mean | SD | Median |
|---|---|---|---|---|
| Group A (no feedback) | 462 | 0.351 | 0.360 | 0.245 |
| Group B (with feedback) | 527 | 0.368 | 0.368 | 0.280 |
| Group C (control) | 452 | 0.392 | 0.371 | 0.400 |
Table 9.
One-way ANOVA and Tukey post-hoc results for performance (final course grade, verified learners only).
Table 9.
One-way ANOVA and Tukey post-hoc results for performance (final course grade, verified learners only).
| Source | Sum Sq | df | F | p |
|---|---|---|---|---|
| Group | 0.392 | 2 | 1.46 | .233 |
| Residual | 192.993 | 1438 | ||
| Effect size | ||||
| 0.002 | ||||
| Post-hoc Tukey HSD comparisons | ||||
| Comparison | Mean diff | 95% CI | p | Significant |
| Group A vs. Group B | 0.017 | [–0.038, 0.072] | .743 | No |
| Group A vs. Group C | 0.041 | [–0.016, 0.098] | .205 | No |
| Group B vs. Group C | 0.024 | [–0.031, 0.079] | .561 | No |
Disclaimer/Publisher’s Note: The statements, opinions and data contained in all publications are solely those of the individual author(s) and contributor(s) and not of MDPI and/or the editor(s). MDPI and/or the editor(s) disclaim responsibility for any injury to people or property resulting from any ideas, methods, instructions or products referred to in the content. |
© 2025 by the authors. Licensee MDPI, Basel, Switzerland. This article is an open access article distributed under the terms and conditions of the Creative Commons Attribution (CC BY) license (http://creativecommons.org/licenses/by/4.0/).
Copyright: This open access article is published under a Creative Commons CC BY 4.0 license, which permit the free download, distribution, and reuse, provided that the author and preprint are cited in any reuse.


