
Submitted:
20 September 2025
Posted:
22 September 2025
You are already at the latest version
Abstract
Airports are among the most energy-intensive infrastructures, and the decarbonization of ground operations is essential to achieving sustainable aviation goals. Vehicle-integrated photovoltaics (VIPV) offer a promising strategy to complement electrification by enabling on-board renewable generation. While previous studies have mainly focused on fixed PV installations such as rooftops or carports, the potential of VIPV in airports has been largely overlooked, and no structured methodology has been established to investigate it. This study addresses this gap by proposing a two-scenario framework for assessing VIPV performance. The first scenario, termed the Generalized Approach, estimates annual energy production based on irradiance data, vehicle surface area, and driving-to-standby ratios. The second scenario, termed the Data-Driven Approach, incorporates detailed GPS-based driving data to capture the dynamic effects of orientation, speed, and operating conditions. Applied to European and Middle Eastern airports, the framework showed that VIPV could cover 1,700–5,500 km/year for buses, 650–5,000 km/year for minibuses, and 840–6,180 km/year for luggage tractors, with avoided emissions strongly influenced by local grid intensity. Grid parity analysis indicated favorable conditions in sunny, high-cost electricity markets. The framework is transferable to other VIPV applications and provides a practical tool for evaluating their technical, environmental, and economic potential.
Keywords:
vehicle-integrated photovoltaics (VIPV)
; airport ground vehicles
; solar vehicles in airport
for buses, 650–5,000 for minibuses, and 840–6,180 for luggage tractors, with avoided emissions strongly influenced by local grid intensity. Grid parity analysis indicated favorable conditions in sunny, high-cost electricity markets. The framework is transferable to other VIPV applications and provides a practical tool for evaluating their technical, environmental, and economic potential.
1. Introduction
The global transition toward low-carbon mobility is accelerating, with growing emphasis on reducing greenhouse gas emissions across all transport sectors. Airports, as complex and energy-intensive infrastructures, are central to this transformation [1]. While much of the attention has focused on aircraft emissions, ground operations also account for a significant share of the environmental footprint. Decarbonizing these activities has therefore become a priority, with electrification of ground support vehicles (GSV) and service fleets emerging as a key step toward sustainable airport operations [2,3].
Electrification, however, increases dependence on charging infrastructure and grid electricity, which may still be partially supplied from fossil-based sources [4,5]. Integrating renewable energy directly into vehicles through vehicle-integrated photovoltaics (VIPV) offers a complementary solution. By generating electricity at the point of use, VIPV can reduce charging needs, improve operational flexibility, and contribute to emission reduction targets [6,7]. Despite these advantages, the application of VIPV in airports has received very limited attention. Most existing research and real-world deployments of PV in airports remain focused on fixed installations such as rooftops, carports, or ground-mounted systems [8,9].
The technical evaluation of VIPV poses its own challenges, as the energy yield depends not only on solar resources and installed PV surface but also on vehicle movement, orientation, and operational cycles. Several modeling approaches have been proposed in the literature to address these factors [10,11,12,13]. In this context, the present work contributes by proposing methodologies into a structured two-scenario framework tailored for VIPV applications. The first scenario offers a generalized approach that does not rely on detailed driving behavior. Vehicle activity is simplified into driving and standby modes, represented by time fractions for each hour. This allows the use of global horizontal irradiance applied to the vehicle roof, combined with simplified assumptions such as flat road conditions, general losses, and performance ratios. While simple, this scenario enables long-term assessments of technical, economic, and environmental potential using readily available data, making it particularly valuable as an accessible entry point for early-stage analyses (particularly in airport applications).
The second scenario, by contrast, is designed for applications where detailed driving data are available. Vehicle position, orientation, and speed are incorporated to calculate dynamic irradiance on multiple surfaces, allowing more accurate representation of real-world operating conditions. This scenario can accommodate both repetitive driving cycles and variable operational profiles, enabling deeper investigation of VIPV performance, operational strategies, and system-level impacts.
The novelty of this study lies in two key aspects. First, it organizes the methodology into a coherent and transferable framework, filling the gap between oversimplified models and data-intensive approaches. Second, it applies this framework to the underexplored case of airport ground vehicles, thereby highlighting a promising application domain for VIPV. While the airport case study demonstrates the potential of the methodology, the framework is designed to be flexible and transferable, offering a structured reference for assessing VIPV in a wide range of transport sectors.
Through this contribution, the study provides both a methodological foundation and a practical demonstration of VIPV potential, supporting researchers, engineers, and decision-makers in advancing sustainable mobility solutions.
2. Methodology
The energy yield of VIPV systems was estimated using a combination of simplified and detailed modeling approaches. Two scenarios were defined to reflect different levels of data availability and modeling complexity. The first scenario provides a generalized framework that relies on basic irradiance data and simplified operational assumptions, whereas the second incorporates detailed driving profiles and environmental conditions for a more accurate representation.
2.1. General PV Power Model
The power output of a PV system can be expressed as [14]:
where η is the overall system efficiency, G is the incident solar irradiance (), and is the effective PV area (). The overall efficiency is defined as the product of the PV module efficiency () and the efficiency of the power conversion system ().
Here, A is the available geometric surface area of the vehicle, and is the coverage ratio that accounts for the fraction of usable surface suitable for PV installation. Solar irradiance (G) is composed of three main components: direct (beam), diffuse, and reflected [15].
In this study, only the direct and diffuse components were considered. To better approximate real operating conditions, two correction factors were introduced:
- curvature factor (
) to account for reduced effective capture due to curved vehicle surfaces [16], and
- shading loss factor (
) representing partial obstruction from nearby objects or the vehicle itself.
Thus, the effective irradiance was calculated as:
2.2. Scenario 1: Generalized Approach
In the first scenario, vehicle operation was simplified into two modes: driving and standby. This approach is particularly relevant when detailed driving data are not available. The fraction of time spent in each mode was represented by a driving-to-standby ratio (R), applied on an hourly basis.
Energy generation in each mode was estimated as [14,17]:
where represents standby charging losses (), represents hourly irradiance (), represents the performance ratio and represents the driving-to-park ratio. The performance ratio was calculated as [17]:
where is specific photovoltaic power output () and is the global tilted irradiance at the optimum angle (). These parameters for each region are available on the Global Solar Atlas [18]. It should also be noted that the standard test condition irradiance () is taken as 1000 (), which is the internationally recognized reference solar irradiance level used for evaluating PV system performance under ideal conditions.
This scenario provided long-term estimates of annual energy yield under simplified assumptions, enabling further evaluation of sustainability and economic performance.
2.3. Scenario 2: Data-Driven Approach
When detailed driving data were available, more comprehensive scenario was applied. This approach accounted for additional effects such as thermal behavior, vehicle speed, and irradiance on multiple surfaces (roof, sides, and rear).
The PV module temperature (T) was estimated using the Faiman model [21,22]:
where represents the air temperature, represents the constant heat transfer component , represents the convective heat transfer component , and represents the wind speed . Since wind speed data from Typical Meteorological Year (TMY) files are given at 10 m height, they were adjusted to the height of the vehicle roof, using Equation 13. It should be noted that, when the vehicle is stopped (Speed = 0), the wind speed is adjusted based on the height of the minibus roof to simulate natural airflow. When the vehicle is in motion, the wind speed is considered the same as the vehicle speed, thus neglecting the wind speed.
For irradiance estimation, the model extended calculations beyond the roof to all relevant vehicle surfaces. The direct and diffuse irradiance on a tilted surface were calculated as [15,23,24]:
where DNI and DHI are the direct normal and diffuse horizontal irradiance, respectively; β is the surface tilt angle; θZ is the solar zenith angle; γS is the solar azimuth angle; and γ is the surface azimuth. The coefficients F1 and F2 are anisotropy and horizon brightening factors, respectively, which adjust the distribution of diffuse irradiance.
These equations, originally developed for fixed PV systems, were adapted to moving vehicles by discretizing the driving pathway into one-second intervals. At each step, the sun’s position relative to each vehicle surface was calculated using driving data (latitude, longitude, orientation, and speed). The modeling was implemented using VIPVLIB [25], an extended version of PVLIB [26] developed to capture vehicle dynamics and VIPV-specific conditions.
2.4. Environmental and Economic Assessment
Beyond energy yield, two additional performance metrics were evaluated.
- Avoided emissions () were calculated as [14]:where E represents the annual energy production () and CI is the carbon intensity of the regional grid (). Since carbon intensity varies significantly between regions, being higher in grids dominated by fossil fuels and lower in those with larger shares of renewables, the environmental benefits of VIPV deployment are strongly location, dependent.
- Levelized Cost of Electricity (LCOE) was used to evaluate economic feasibility [27]where represents the total lifetime energy production, and represents the total life cycle cost. This metric provides the average cost of electricity generation over the system lifetime, enabling direct comparison of VIPV with grid electricity and other energy technologies.
3. Case Studies
To demonstrate the applicability of the proposed framework, two sets of case studies were conducted, corresponding to the two scenarios defined in the methodology. Scenario 1 emphasizes a generalized assessment across multiple geographical locations, while Scenario 2 focuses on detailed route-based analyses using real driving data.
3.1. Scenario 1: Generalized Approach
In the first scenario, simulations were carried out for a range of international airports to investigate the influence of climatic conditions, grid carbon intensity, and electricity prices on VIPV performance. Three Italian cities, Milan, Rome, and Palermo were selected to represent different climatic regions and electricity price levels within a common national framework, while also reflecting differences in airport scale and operational characteristics. To extend the analysis within Europe, three additional airports in Lisbon, Frankfurt, and Copenhagen were considered, capturing diverse solar resources and market conditions. Finally, three major hub airports in Doha, Dubai, and Istanbul were included to highlight environments with high solar potential and global strategic importance, despite their comparatively lower electricity prices.
Figure 1 presents the carbon intensity of national electricity grids in 2024 [28], together with non-household electricity prices. Among the European cities, Lisbon exhibited the lowest emissions factor (0.101 kg CO₂ per kWh), while Doha showed the highest (0.49 kg CO₂ per kWh), reflecting the heavy reliance on fossil fuels in its energy mix. Electricity prices displayed a wide variation, from €0.03 per kWh in Doha to €0.27 per kWh in Copenhagen, providing an important benchmark for assessing grid parity [29].
For all locations, the PV system lifetime was assumed to be 10 years with an annual degradation rate of 1%. Although fixed PV installations often achieve lower degradation values, the conservative assumption reflects the more demanding operating conditions of VIPV systems, including vibration, intermittent shading, thermal cycling, and mechanical wear. The PV module efficiency was assumed to be approximately 21%, corresponding to a power density of 210 , which was used to calculate the available installed capacity [17].
3.2. Scenario 2: Data-Driven Approach
Unlike vehicles that follow fixed or repetitive drive cycles, airport ground vehicles operate along highly variable and often unpredictable routes. Their movement depends on daily operational needs, which means trips rarely follow a standardized pattern. This makes it challenging to define representative duty cycles for simulation. In this study, therefore, Scenario 2 was designed not to establish universal driving cycles but to show how real-world driving data can be used to capture the dynamic effects of vehicle motion on VIPV performance.
To illustrate this approach, GPS-based datasets from four international airports were analyzed: Istanbul Sabiha Gökçen, Rome Fiumicino, Milan Bergamo, and Palermo Airport. Figure 2 shows the routes of the vehicles during several trips at these airports.
At Istanbul Sabiha Gökçen Airport, three independent trips were available, ranging in duration from 3 to 10 minutes. The variety in trip length, route geometry, and vehicle orientation offered valuable insight into the influence of operational diversity on VIPV performance. At Rome Fiumicino and Palermo airports, two trips were analyzed in each case, lasting approximately 5 minutes and 2 minutes, respectively. Finally, a single 1-minute trip was considered at Milan Bergamo Airport. Figure 3 presents the corresponding speed and azimuth profiles, highlighting the variability across the datasets.
The purpose of these examples was not to provide a comprehensive statistical prediction of VIPV energy yield but rather to illustrate the modeling capability of the second scenario. By applying the framework to different operational routes, the study demonstrates how detailed driving data can refine VIPV performance assessment under realistic conditions. In future work, the collection of larger datasets could enable the development of predictive models, providing more robust estimates of long-term energy production across diverse airport operations.
It should be noted that, the values of efficiency of the power converter () and reference temperature () were set to 96% and 25°C respectively [19]. The PV module technology used in the simulations was crystalline silicon (c-Si). Detailed electrical and thermal parameters of the module technology are provided in Table 1.
4. Results
4.1. Scenario 1
To investigate the technical feasibility of VIPV under different operating conditions, a sensitivity analysis was carried out on two key parameters: standby charging losses (L) and the driving-to-park ratio ®. Standby losses represent the auxiliary consumption required to keep systems active while the vehicle is parked (e.g., BMS operation, etc). Two levels were considered: 100 W (L1, low-loss) and 700 W (L2, high-loss) [14]. The driving-to-park ratio was varied across four values: 0.2 (R1), 0.4 (R2), 0.6 (R3), and 0.8 (R4).
Annual energy production was first estimated across nine cities, for installed PV areas ranging from 3 to 30 m². Figure 4 illustrate representative results for selected cases (R1L1, R1L2, R3L1, and R3L2).
Under low-loss conditions (L1), energy generation increases almost linearly with PV area. However, under high-loss conditions (L2), the increase becomes nonlinear, especially for small PV areas where standby consumption represents a large fraction of the total power harvested. Across all cases, Doha and Dubai produced the highest annual yields due to their high solar resource, followed by Palermo, Rome, and Lisbon, while Copenhagen and Frankfurt showed the lowest performance.
Another analysis focused on three representative PV areas: 3 m² (luggage tractor), 7 m² (minibus), and 20 m² (bus). For each class of vehicle, the achievable solar driving range was calculated by dividing the annual energy yield by the average consumption per kilometer. Results (Figure 5) showed ranges of:
These findings demonstrate that even under conservative assumptions, VIPV could cover a meaningful portion of yearly driving needs, particularly in sunny locations. In addition, Figure 6 presents the variations in daily energy production obtained from the VIPV system for the minibus (7 m² PV) across different cities within the R3L2 driving profile. This example was selected to illustrate how local climatic conditions and seasonal irradiance significantly influence the achievable energy yield.
Environmental benefits were quantified as avoided CO₂ emissions by multiplying annual generation with the regional grid carbon intensity. Figure 7 shows that avoided emissions strongly depend not only on irradiance but also on the carbon intensity of the local grid. For example, Lisbon, with low grid carbon intensity, yielded modest avoided emissions despite good irradiance, whereas Doha, with a highly carbon-intensive grid, showed the largest potential reductions.
Finally, the economic potential of VIPV was analyzed using the Levelized Cost of Electricity (LCOE) as a benchmark for grid parity. Under operating condition R3L1 (moderate driving, low losses) and R3L2 (moderate driving, high losses), results were compared against regional electricity prices assuming a WACCreal of 3% (Figure 8). Additional sensitivity analyses at WACCreal values of 2% and 5% were performed for the R3L2 case (Figure 9).
4.2. Scenario 2
Figure 10 shows PV module temperature profiles for trips in Istanbul, Rome, Milan, and Palermo. The influence of both ambient conditions and vehicle speed on module temperature is evident, with higher irradiance and lower airflow leading to higher module temperatures.
Figure 11 and Figure 12 illustrate the energy production per square meter of PV integrated into different vehicle surfaces (roof, sides, rear) for trips conducted at different times of the day (morning vs. afternoon) and seasons (July 30 vs. December 27). Seasonal and diurnal variations were clearly observed: July trips produced significantly more energy than December trips, and afternoon trips showed different surface contributions compared to early morning trips due to changes in sun position.
These figures highlight the variations in energy generation results between different trips, which are primarily influenced by the changing azimuth angles of each vehicle surface throughout the journeys. Because the orientation of the vehicle relative to the sun varies with the path taken, each surface (top, back, left, and right) experiences different irradiance levels depending on its alignment during the trip. This effect becomes more pronounced when trips occur at different times of the day, due to the sun’s movement, and during different seasons, as demonstrated by the simulations on July 30 and December 27.
The trip analyzed in Milan was relatively short, lower than two minutes. This reflects a common scenario in certain airports where the distance between aircraft and terminals is minimal, and as a result, shuttle buses may not be used extensively and often remain parked. This situation presents an opportunity: when vehicles are not in use, they can be parked in non-shaded areas, fully exposed to sunlight to maximize solar energy harvesting. Furthermore, since the vehicle’s energy consumption is zero during these times, the generated solar energy can be stored for later use. Consequently, this stored energy can contribute to vehicle operation during active periods, effectively increasing the solar range and improving the overall utility of the VIPV system.
5. Conclusions
This work uses a structured novel framework for evaluating the performance of vehicle-integrated photovoltaics in airport ground vehicles. The novelty lies in two aspects: first, the organization of modeling approaches into two complementary scenarios that address both limited-data and detailed-data conditions; and second, the application of this framework to the underexplored but highly relevant context of ground operations in airports.
Scenario 1 provided a generalized methodology capable of producing long-term estimates of energy yield, avoided emissions, and grid parity using minimal input data. The results showed that even under conservative assumptions, VIPV can meaningfully extend the driving range of airport vehicles and contribute to decarbonization, with outcomes strongly influenced by local irradiance, electricity prices, and grid carbon intensity. Scenario 2 illustrated the value of detailed driving data, highlighting how trip geometry, vehicle orientation, and seasonal or diurnal variations affect instantaneous energy production. As a further consideration, the analysis revealed that idle periods represent opportunities to maximize solar harvesting and improve system utility.
Together, the two scenarios show the flexibility of the proposed framework: it can be applied as a simple screening tool in early-stage assessments and as a detailed model when comprehensive datasets are available. Beyond airports, the framework is transferable to other transport applications where VIPV may be relevant. Future research should focus on expanding datasets of real driving patterns, refining predictive models, and exploring operational strategies to fully unlock the potential of VIPV in sustainable mobility systems.
Author Contributions
Conceptualization, H.S., G.A. and M.C.B.; methodology, H.S., G.A. and M.C.B.; software, H.S. and G.M.; formal analysis, H.S., G.A. and F.V.; investigation, H.S.; resources, G.A.; data curation, H.S.; writing—original draft preparation, H.S., G.A. and M.C.B.; writing—review and editing, H.S., G.A., M.C.B. and P.R.; supervision: G.M., P.R. and F.V.; project administration, G.A. and M.C.B.; funding acquisition, G.A.; All authors have read and agreed to the published version of the manuscript.
References
- M. Parhamfar, “Towards green airports: Factors influencing greenhouse gas emissions and sustainability through renewable energy,” Next Research, vol. 1, no. 2, p. 100060, Dec. 2024. [CrossRef]
- S. Sreenath, K. S. Sreenath, K. Sudhakar, and A. F. Yusop, “Airport-based photovoltaic applications,” Progress in Photovoltaics: Research and Applications, vol. 28, no. 8, pp. 833–853, Aug. 2020. [CrossRef]
- Ajayi, P. C.-K. Luk, L. Lao, and M. F. Khan, “Energy Forecasting Model for Ground Movement Operation in Green Airport,” Energies (Basel), vol. 16, no. 13, p. 5008, Jun. 2023. [CrossRef]
- M. Alruwaili and L. Cipcigan, “Airport electrified ground support equipment for providing ancillary services to the grid,” Electric Power Systems Research, vol. 211, p. 108242, Oct. 2022. [CrossRef]
- Y. Xiang, H. Y. Xiang, H. Cai, J. Liu, and X. Zhang, “Techno-economic design of energy systems for airport electrification: A hydrogen-solar-storage integrated microgrid solution,” Appl Energy, vol. 283, p. 116374, Feb. 2021. [CrossRef]
- H. Samadi, G. H. Samadi, G. Ala, V. Lo Brano, P. Romano, and F. Viola, “Investigation of Effective Factors on Vehicles Integrated Photovoltaic (VIPV) Performance: A Review,” World Electric Vehicle Journal, vol. 14, no. 6, p. 154, Jun. 2023. [CrossRef]
- H. Samadi, G. H. Samadi, G. Ala, V. Lo Brano, P. Romano, F. Viola, and R. Miceli, “Potential and Methods of Integrating Solar Cells into Vehicles,” in 2023 International Conference on Clean Electrical Power (ICCEP), IEEE, Jun. 2023, pp. 715–720. [CrossRef]
- B. K. Yadav, R. B. K. Yadav, R. Yadav, M. Jahangiri, S. S. Priya, T. R. Bajracharya, and K. Sudhakar, “Decarbonizing airport using solar and wind farm: A case of Biratnagar, Nepal,” e-Prime - Advances in Electrical Engineering, Electronics and Energy, vol. 8, p. 100583, Jun. 2024. [CrossRef]
- P. Ollas et al., “Evaluating the role of solar photovoltaic and battery storage in supporting electric aviation and vehicle infrastructure at Visby Airport,” Appl Energy, vol. 352, p. 121946, Dec. 2023. [CrossRef]
- K. Araki, Y. K. Araki, Y. Ota, and K. Nishioka, “Testing and rating of vehicle-integrated photovoltaics: Scientific background,” Solar Energy Materials and Solar Cells, vol. 280, p. 113241, Jan. 2025. [CrossRef]
- K. Araki, Y. K. Araki, Y. Ota, and M. Yamaguchi, “Measurement and Modeling of 3D Solar Irradiance for Vehicle-Integrated Photovoltaic,” Applied Sciences, vol. 10, no. 3, p. 872, Jan. 2020. [CrossRef]
- M. Abdelhamid, S. M. Abdelhamid, S. Pilla, R. Singh, I. Haque, and Z. Filipi, “A comprehensive optimized model for on-board solar photovoltaic system for plug-in electric vehicles: energy and economic impacts,” Int J Energy Res, vol. 40, no. 11, pp. 1489–1508, Sep. 2016. [CrossRef]
- M. Oh, S.-M. M. Oh, S.-M. Kim, and H.-D. Park, “Estimation of photovoltaic potential of solar bus in an urban area: Case study in Gwanak, Seoul, Korea,” Renew Energy, vol. 160, pp. 1335–1348, Nov. 2020. [CrossRef]
- H. Samadi, G. H. Samadi, G. Ala, A. Imburgia, S. Licciardi, P. Romano, and F. Viola, “Evaluating the Role of Vehicle-Integrated Photovoltaic (VIPV) Systems in a Disaster Context,” World Electric Vehicle Journal, vol. 16, no. 4, p. 190, Mar. 2025. [CrossRef]
- J. A. Duffie and W. A. Beckman, Solar Engineering of Thermal Processes. Wiley, 2013. [CrossRef]
- Y. Ota, K. Y. Ota, K. Araki, A. Nagaoka, and K. Nishioka, “Facilitating vehicle-integrated photovoltaics by considering the radius of curvature of the roof surface for solar cell coverage,” Clean Eng Technol, vol. 7, p. 100446, Apr. 2022. [CrossRef]
- C. Kutter, L. E. C. Kutter, L. E. Alanis, D. H. Neuhaus, and M. Heinrich, “YIELD POTENTIAL OF VEHICLE INTEGRATED PHOTOVOLTAICS ON COMMERCIAL TRUCKS AND VANS,” 2021. [Online]. Available: https://www.researchgate. 3551. [Google Scholar]
- Global Solar Atlas, Accessed: Apr. 6, 2025. [Online]. Available: https://globalsolaratlas.info/map.
- H. Kim, J. H. Kim, J. Ku, S.-M. Kim, and H.-D. Park, “A new GIS-based algorithm to estimate photovoltaic potential of solar train: Case study in Gyeongbu line, Korea,” Renew Energy, vol. 190, pp. 713–729, 22. 20 May. [CrossRef]
- K. Mallon, F. K. Mallon, F. Assadian, and B. Fu, “Analysis of On-Board Photovoltaics for a Battery Electric Bus and Their Impact on Battery Lifespan,” Energies (Basel), vol. 10, no. 7, p. 943, Jul. 2017. [CrossRef]
- D. Faiman, “Assessing the outdoor operating temperature of photovoltaic modules,” Progress in Photovoltaics: Research and Applications, vol. 16, no. 4, pp. 307–315, Jun. 2008. [CrossRef]
- C. Thiel et al., “Impact of climatic conditions on prospects for integrated photovoltaics in electric vehicles,” Renewable and Sustainable Energy Reviews, vol. 158, p. 112109, Apr. 2022. [CrossRef]
- R. Perez, P. R. Perez, P. Ineichen, R. Seals, J. Michalsky, and R. Stewart, “Modeling daylight availability and irradiance components from direct and global irradiance,” Solar Energy, vol. 44, no. 5, pp. 271–289, 1990. [CrossRef]
- E. L. King, J. A. E. L. King, J. A. Kratochvil, and W. E. Boyson, “Measuring solar spectral and angle-of-incidence effects on photovoltaic modules and solar irradiance sensors,” in Conference Record of the Twenty Sixth IEEE Photovoltaic Specialists Conference - 1997, IEEE, pp. 1113–1116. [CrossRef]
- VIPVLIB. Available: https://github.com/hamidsmd/VIPVLIB.
- K. S. Anderson, C. W. K. S. Anderson, C. W. Hansen, W. F. Holmgren, A. R. Jensen, M. A. Mikofski, and A. Driesse, “pvlib python: 2023 project update,” J Open Source Softw, vol. 8, no. 92, p. 5994, Dec. 2023. [CrossRef]
- F. Vartiainen, G. F. Vartiainen, G. Masson, C. Breyer, D. Moser, and E. Román Medina, “Impact of weighted average cost of capital, capital expenditure, and other parameters on future utility-scale PV levelised cost of electricity,” Progress in Photovoltaics: Research and Applications, vol. 28, no. 6, pp. 439–453, Jun. 2020. [CrossRef]
- Electricity Maps, Accessed: Jul. 9, 2025. [Online]. Available: https://www.electricitymaps.com.
- 23. Electricity prices for non-household consumers (2024-S2), Accessed: Jun. 6, 2025. [Online]. Available: https://ec.europa.eu/eurostat/databrowser/view/nrg_pc_205custom_17400202/default/table?lang=.
- N. M. Kumar, S. S. N. M. Kumar, S. S. Chopra, M. Malvoni, R. M. Elavarasan, and N. Das, “Solar Cell Technology Selection for a PV Leaf Based on Energy and Sustainability Indicators—A Case of a Multilayered Solar Photovoltaic Tree,” Energies (Basel), vol. 13, no. 23, p. 6439, Dec. 2020. [CrossRef]
- B. manufacturer Karsan, “ELECTRIC MINIBUS with Zero Emissions, Karsan e-JEST.” Accessed: Sep. 16, 2024. [Online]. Available: https://www.karsan.com/en/e-jest-highlights#e-jest-specs.
- Alke’ Airport luggage vehicles, Accessed: May. 5, 2025. [Online]. Available: https://www.alke.com/airport- luggage-vehicles.
Figure 1.
Non-household electricity price and carbon intensity across different cities.
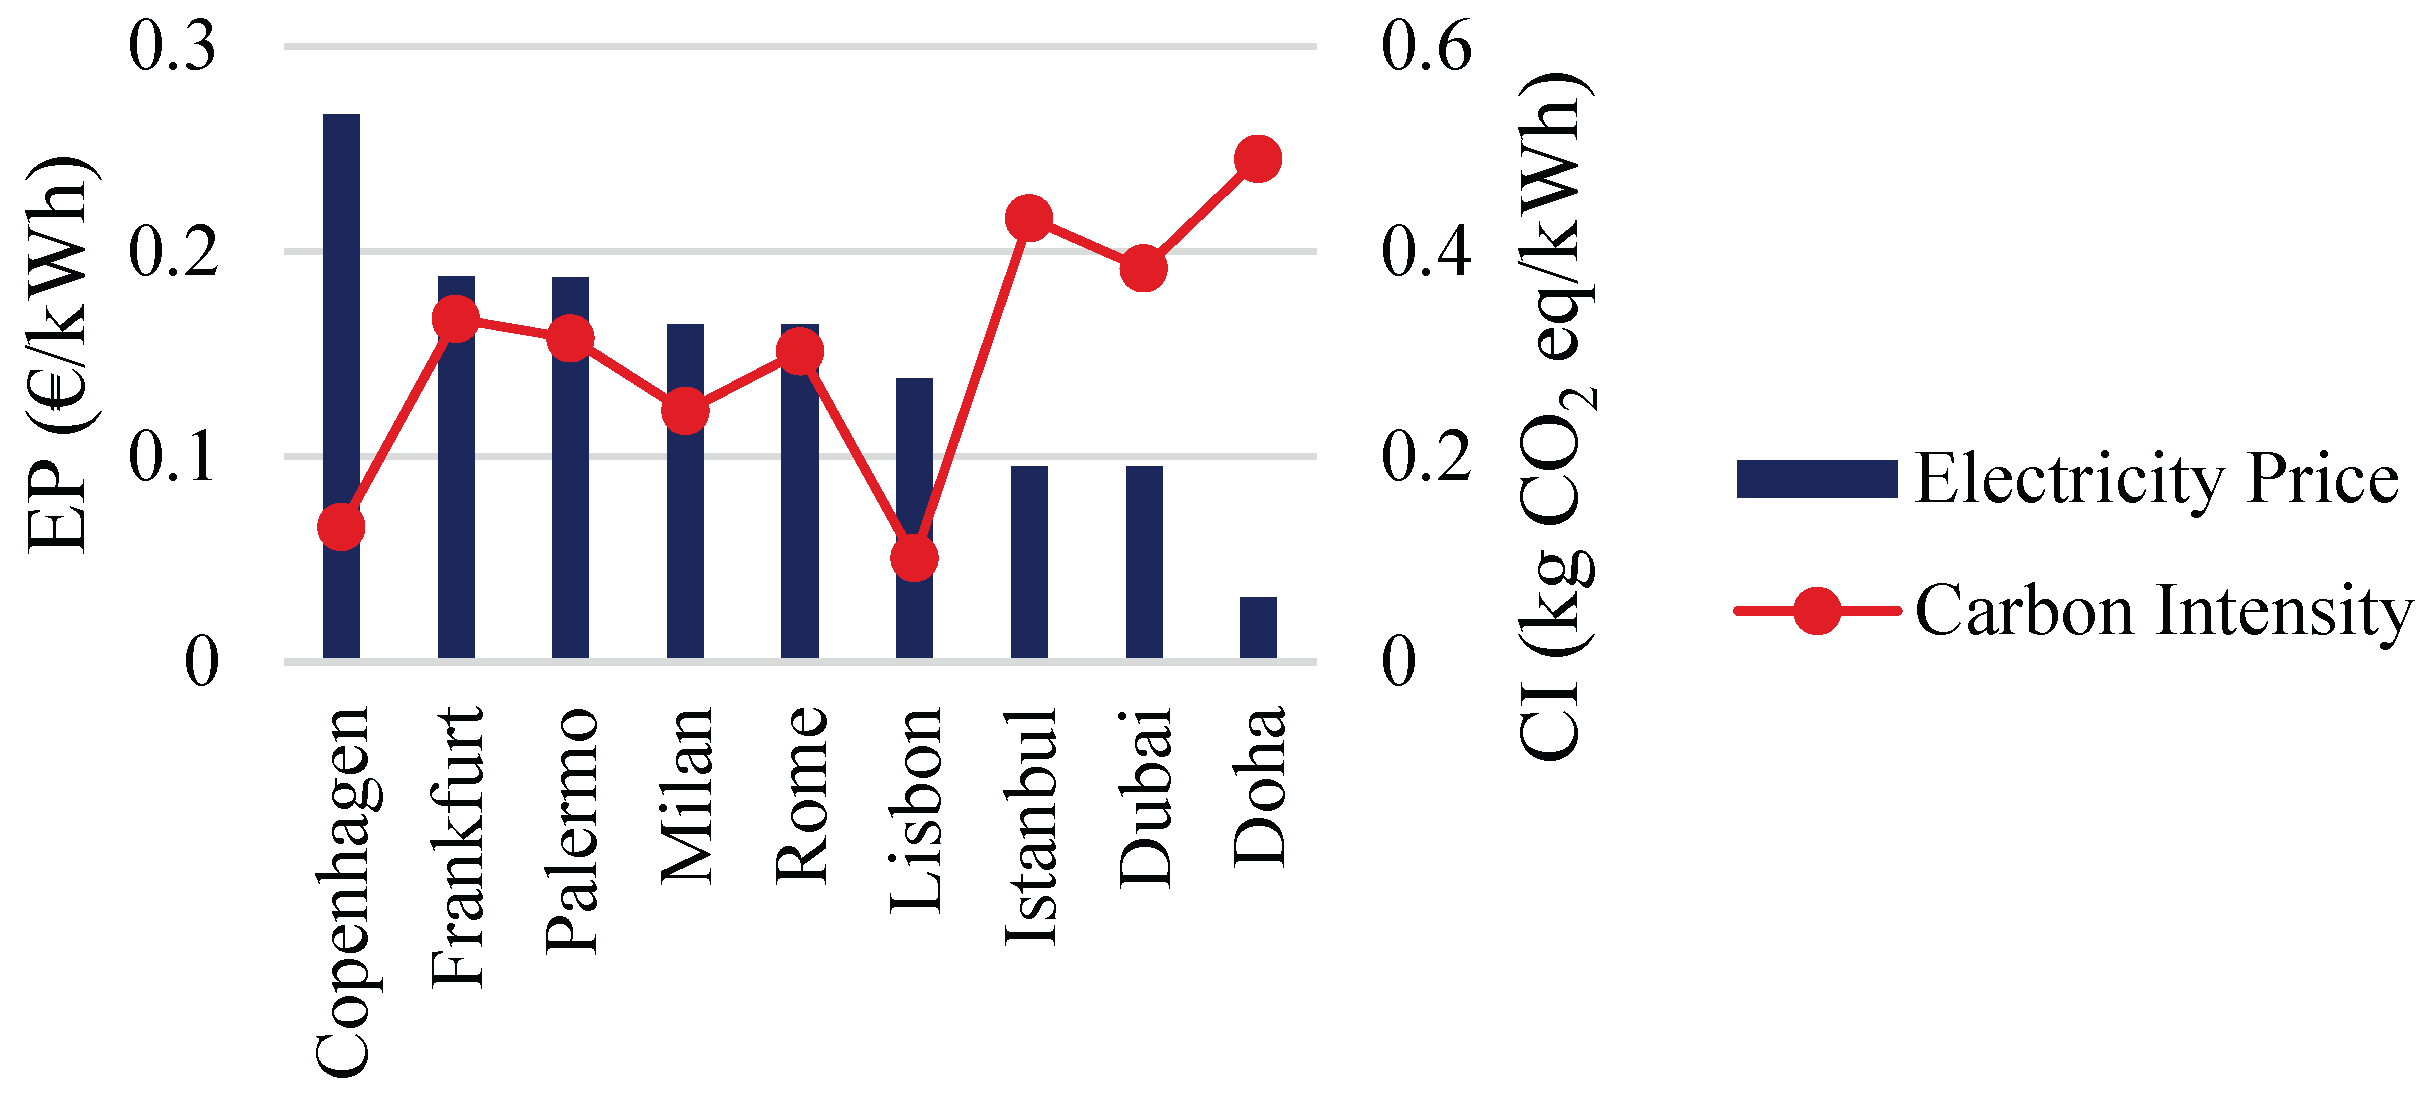
Figure 2.
The vehicle routes during representative trips at four airports: (a) Istanbul Sabiha Gökçen, (b) Rome Fiumicino, (c) Palermo, and (d) Milan Bergamo.
Figure 2.
The vehicle routes during representative trips at four airports: (a) Istanbul Sabiha Gökçen, (b) Rome Fiumicino, (c) Palermo, and (d) Milan Bergamo.
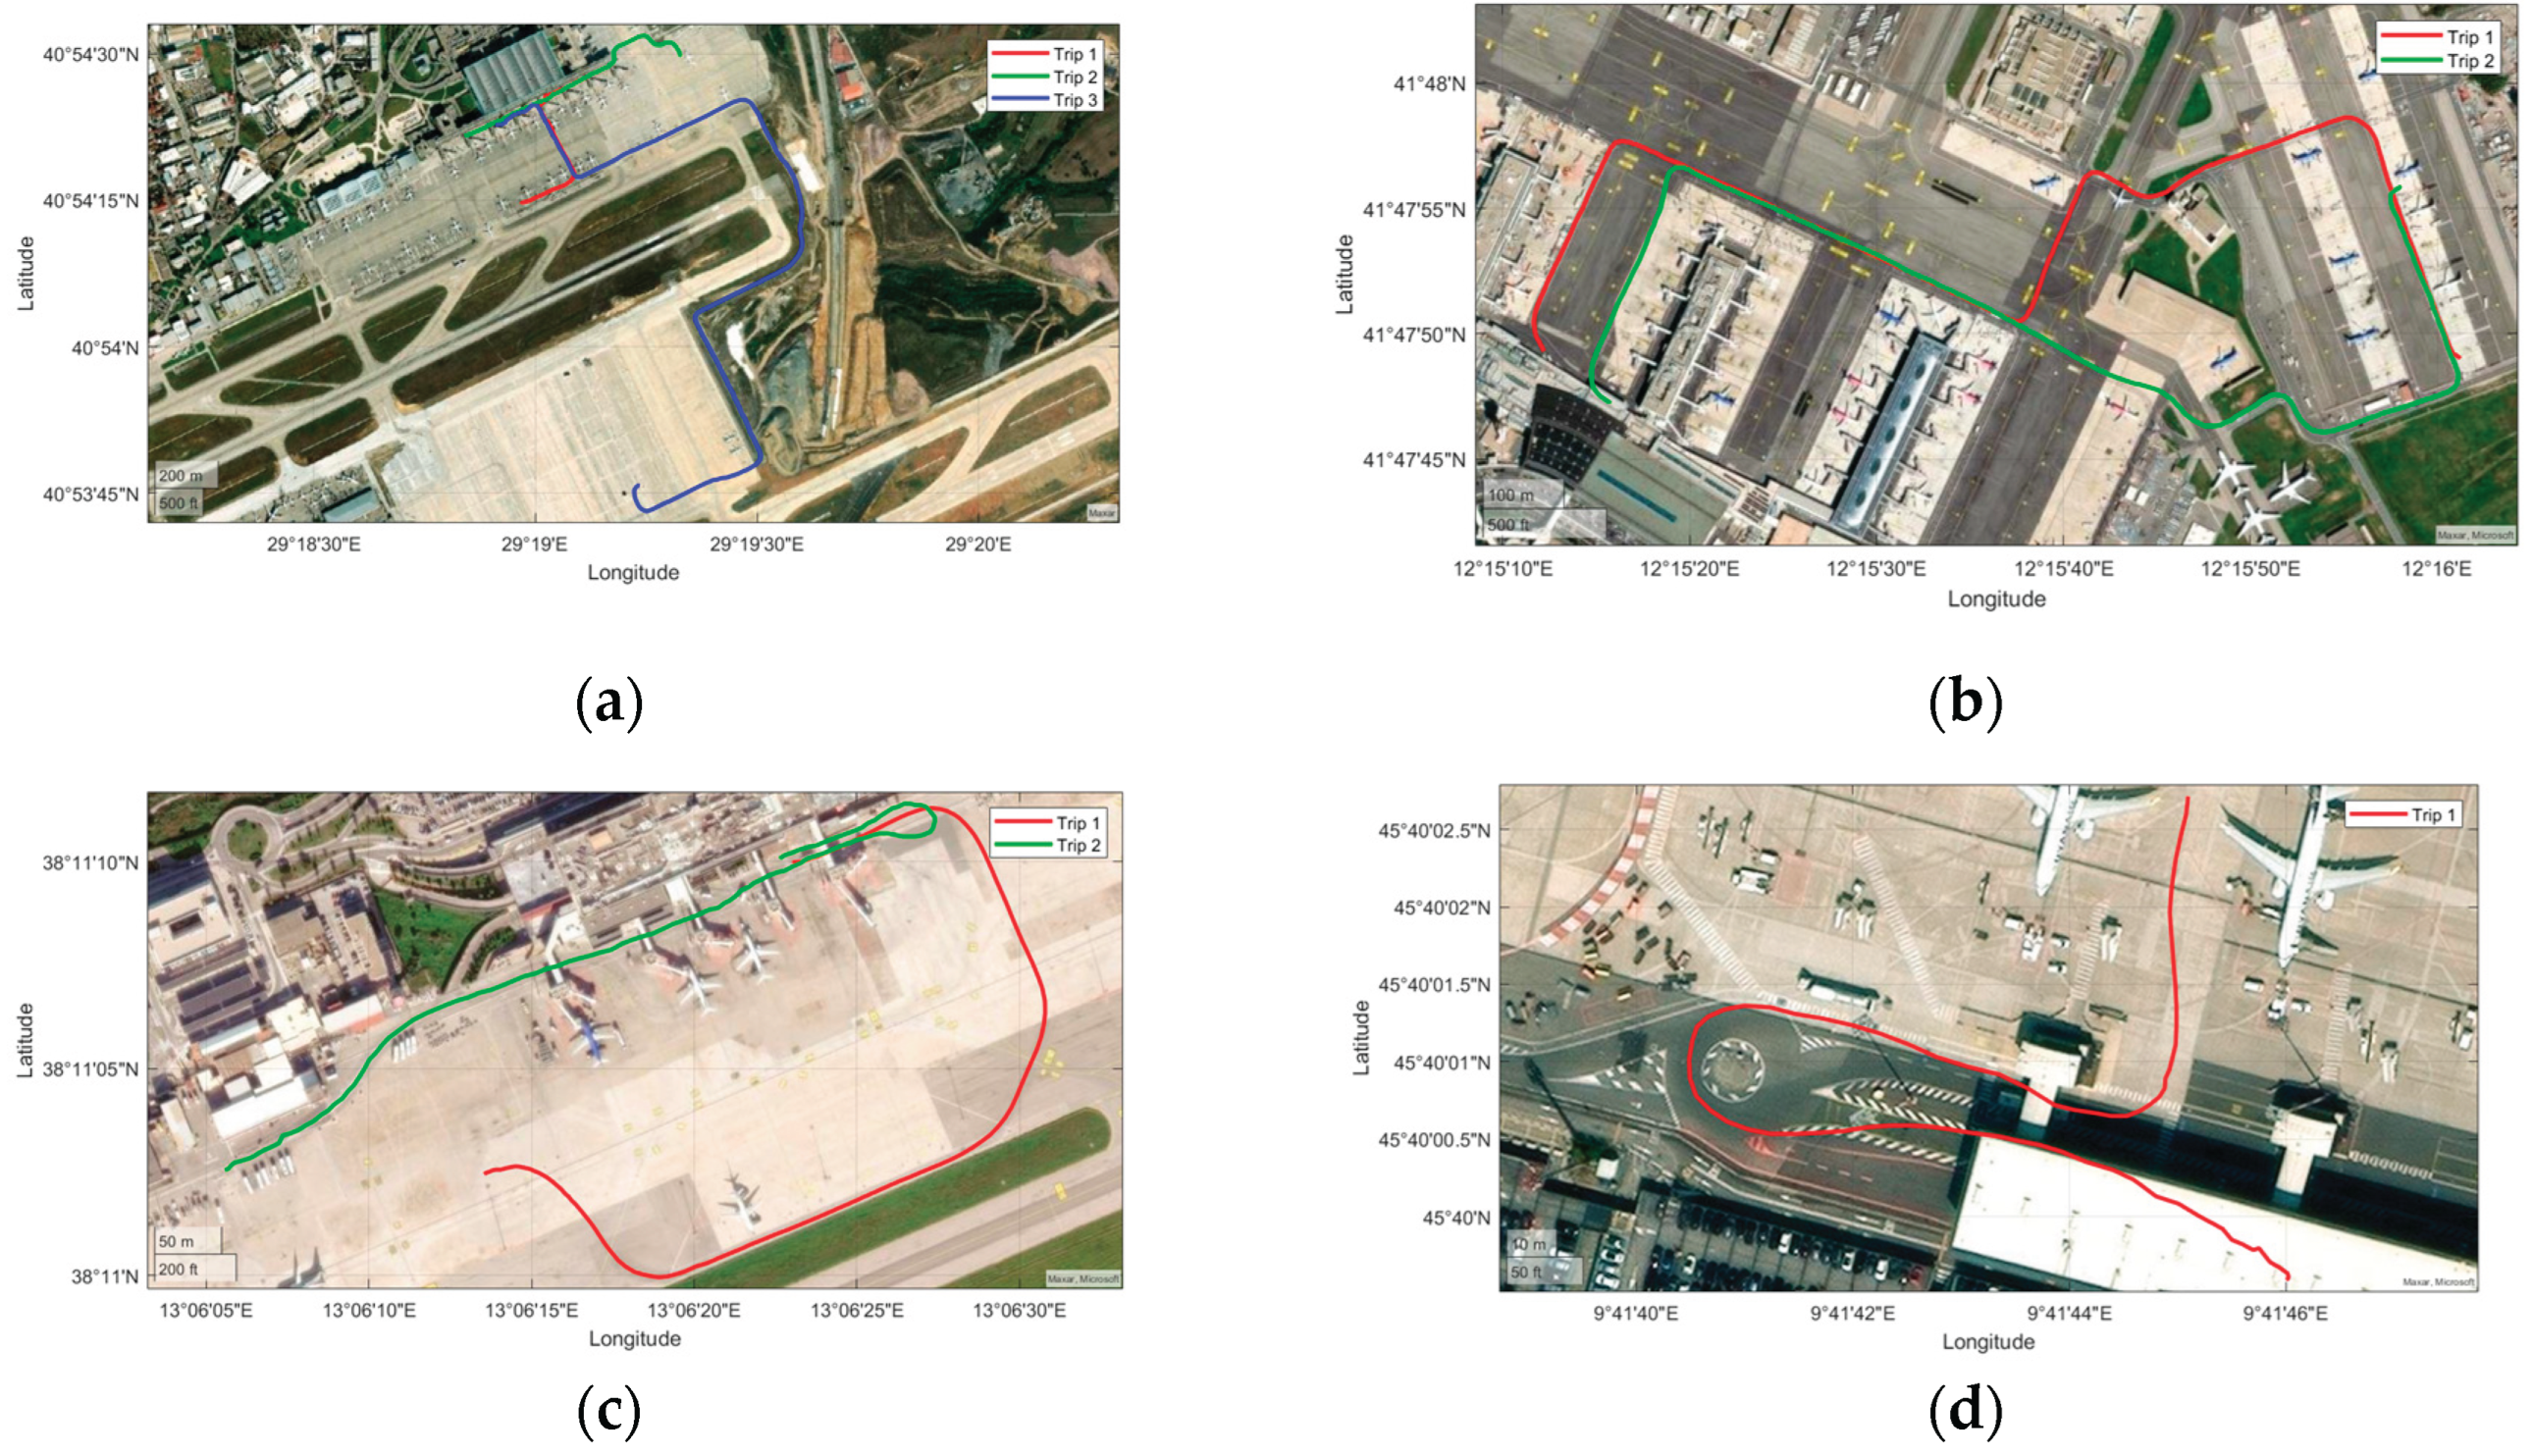
Figure 3.
Vehicle speed profiles and azimuth angle variations during trips: Istanbul (a) Trip 1, (b) Trip 2, (c) Trip 3; Milan (d); Rome ® Trip 1, (f) Trip 2; Palermo (g) Trip 1, (h) Trip 2.
Figure 3.
Vehicle speed profiles and azimuth angle variations during trips: Istanbul (a) Trip 1, (b) Trip 2, (c) Trip 3; Milan (d); Rome ® Trip 1, (f) Trip 2; Palermo (g) Trip 1, (h) Trip 2.
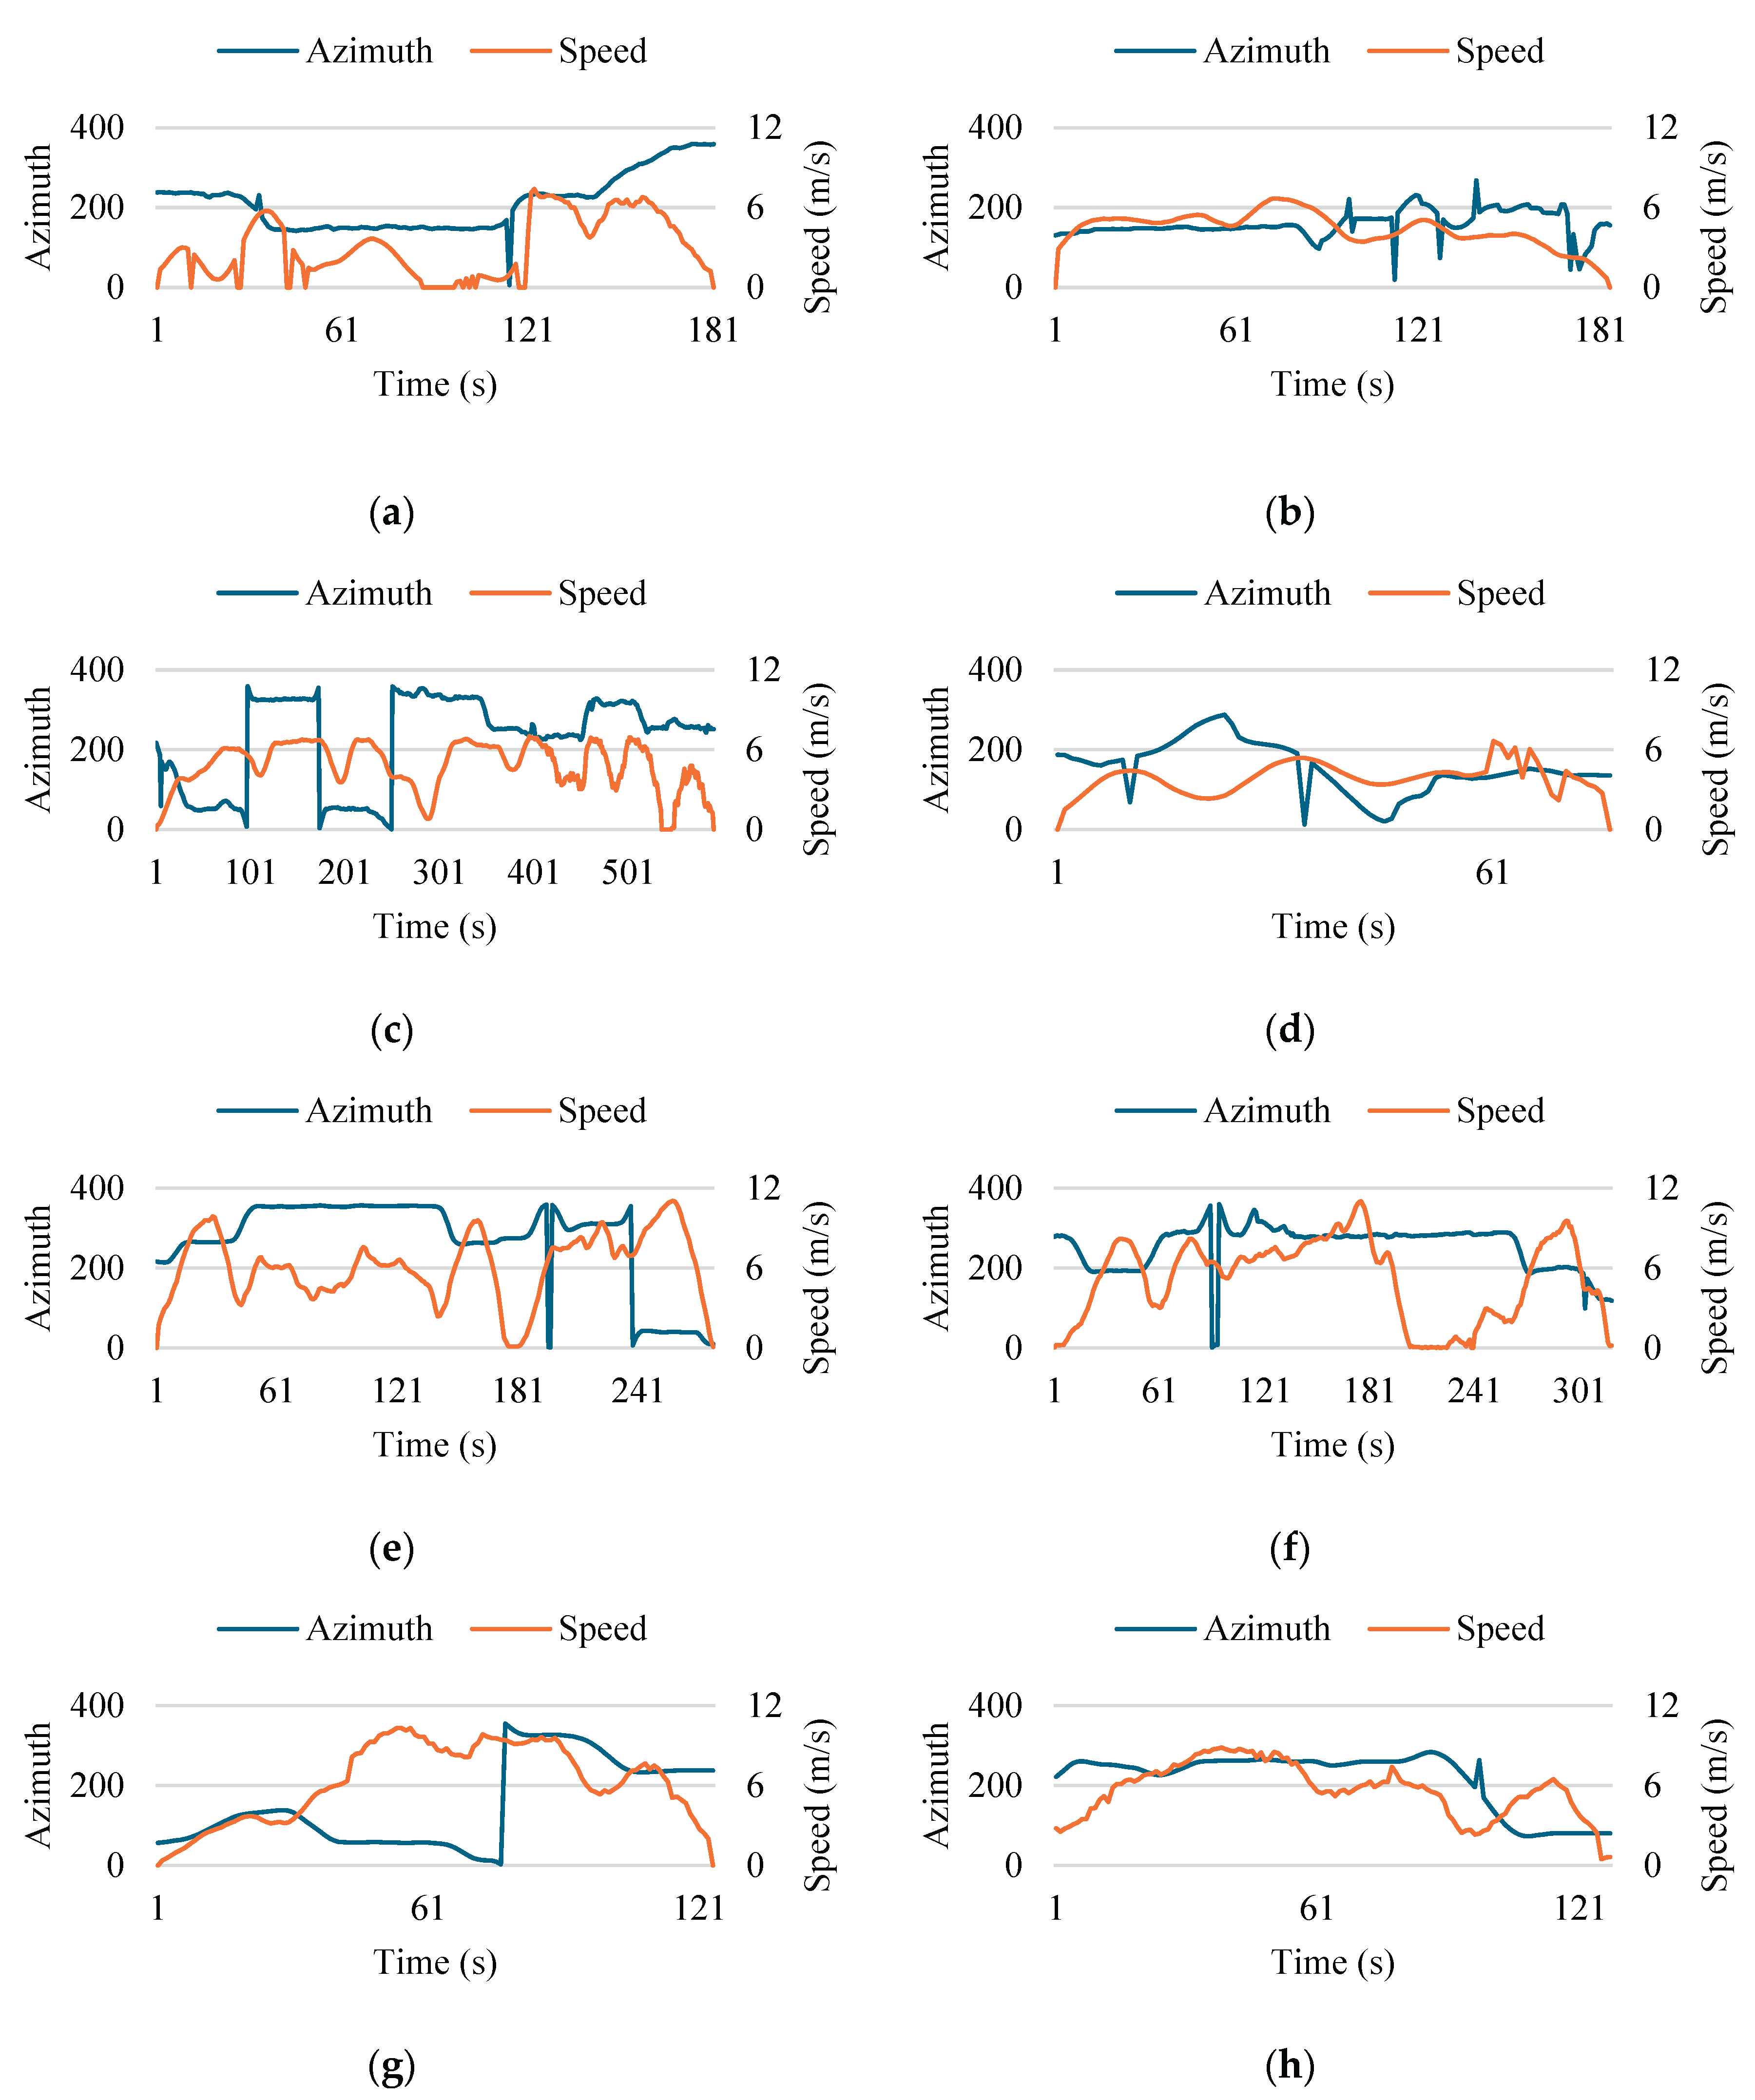
Figure 4.
Yearly energy production of VIPV systems for different cities and PV areas under selected operating conditions: (a) R1L1, (b) R1L2, (c) R3L1, (d) R3L2.
Figure 4.
Yearly energy production of VIPV systems for different cities and PV areas under selected operating conditions: (a) R1L1, (b) R1L2, (c) R3L1, (d) R3L2.
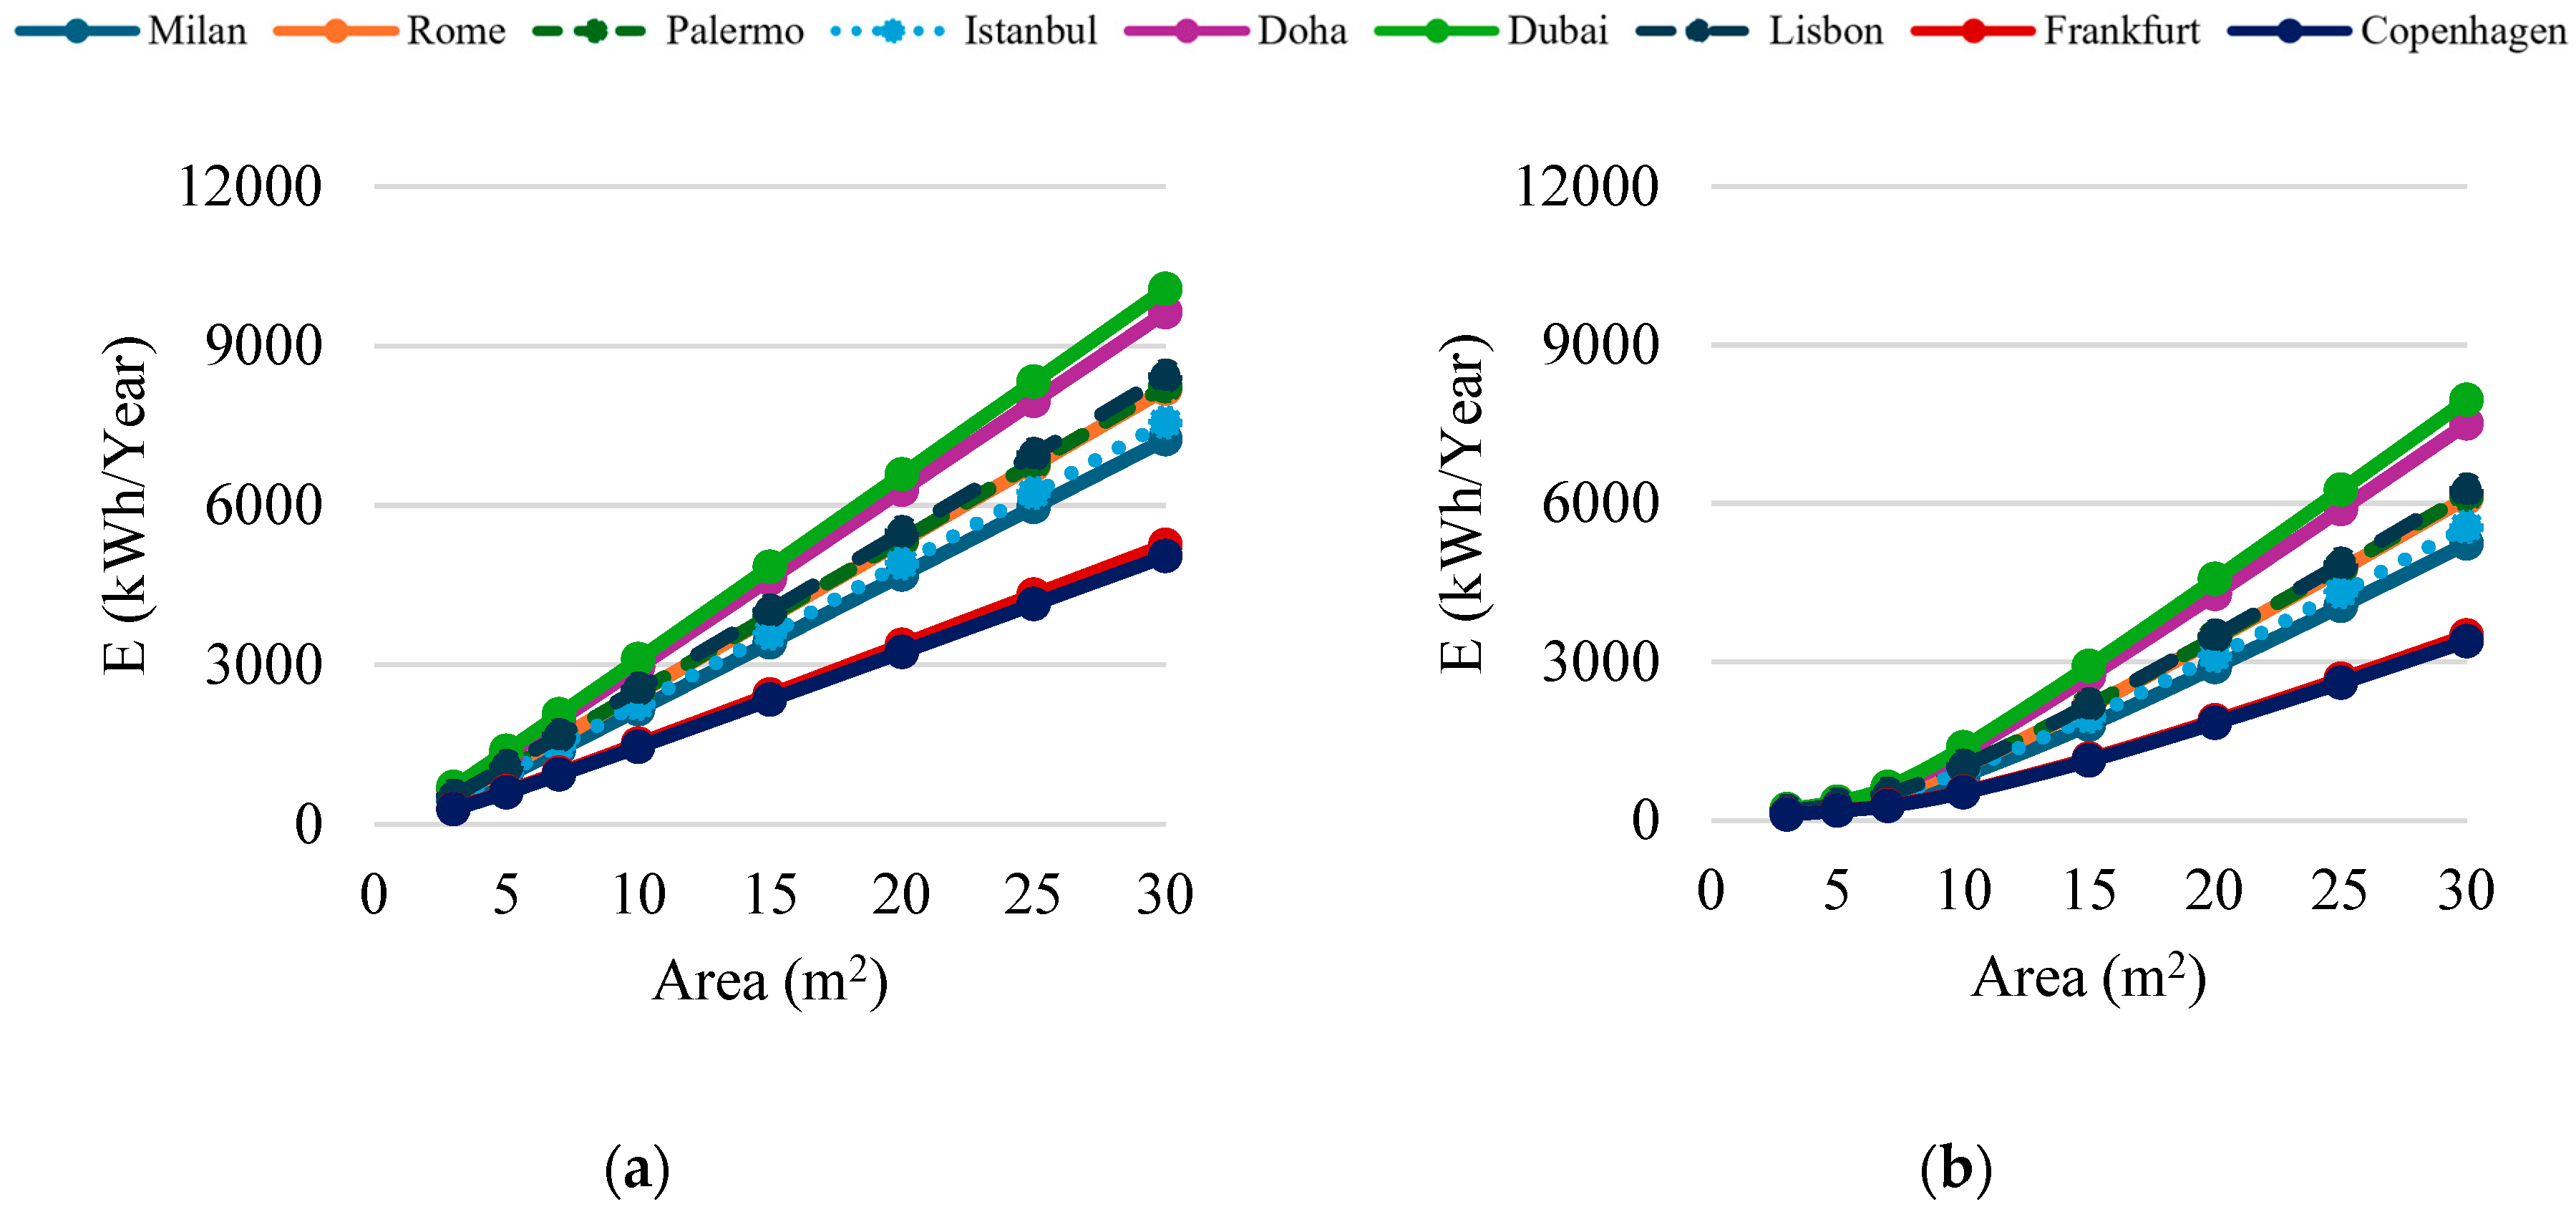
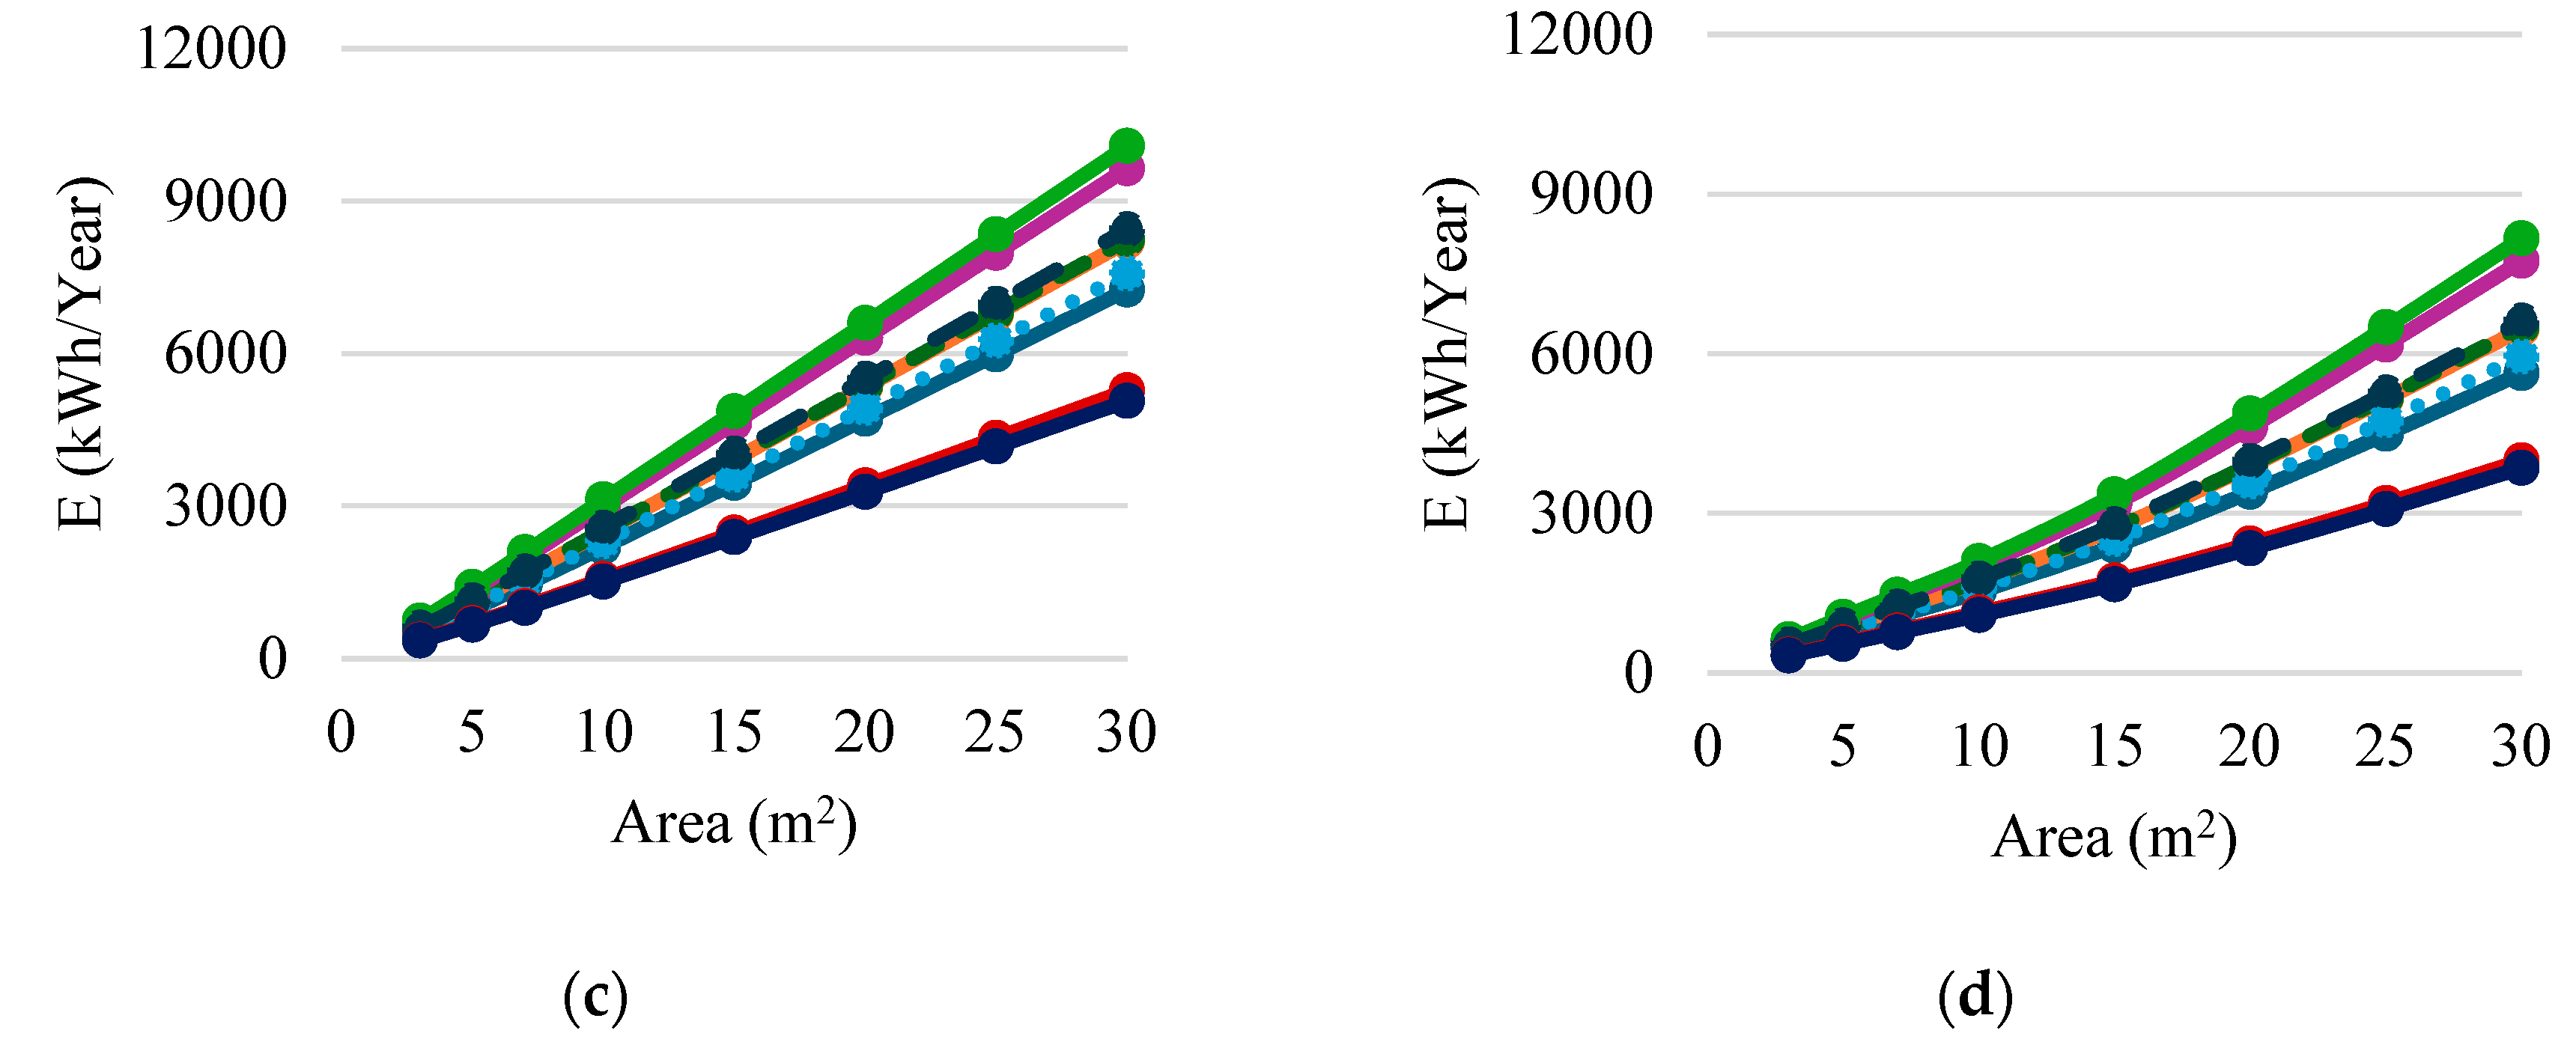
Figure 5.
Yearly solar driving range achievable by VIPV for three representative vehicle types: (a) bus (20 m² PV), (b) minibus (7 m² PV), and (c) luggage tractor (3 m² PV), under different cities and working conditions.
Figure 5.
Yearly solar driving range achievable by VIPV for three representative vehicle types: (a) bus (20 m² PV), (b) minibus (7 m² PV), and (c) luggage tractor (3 m² PV), under different cities and working conditions.
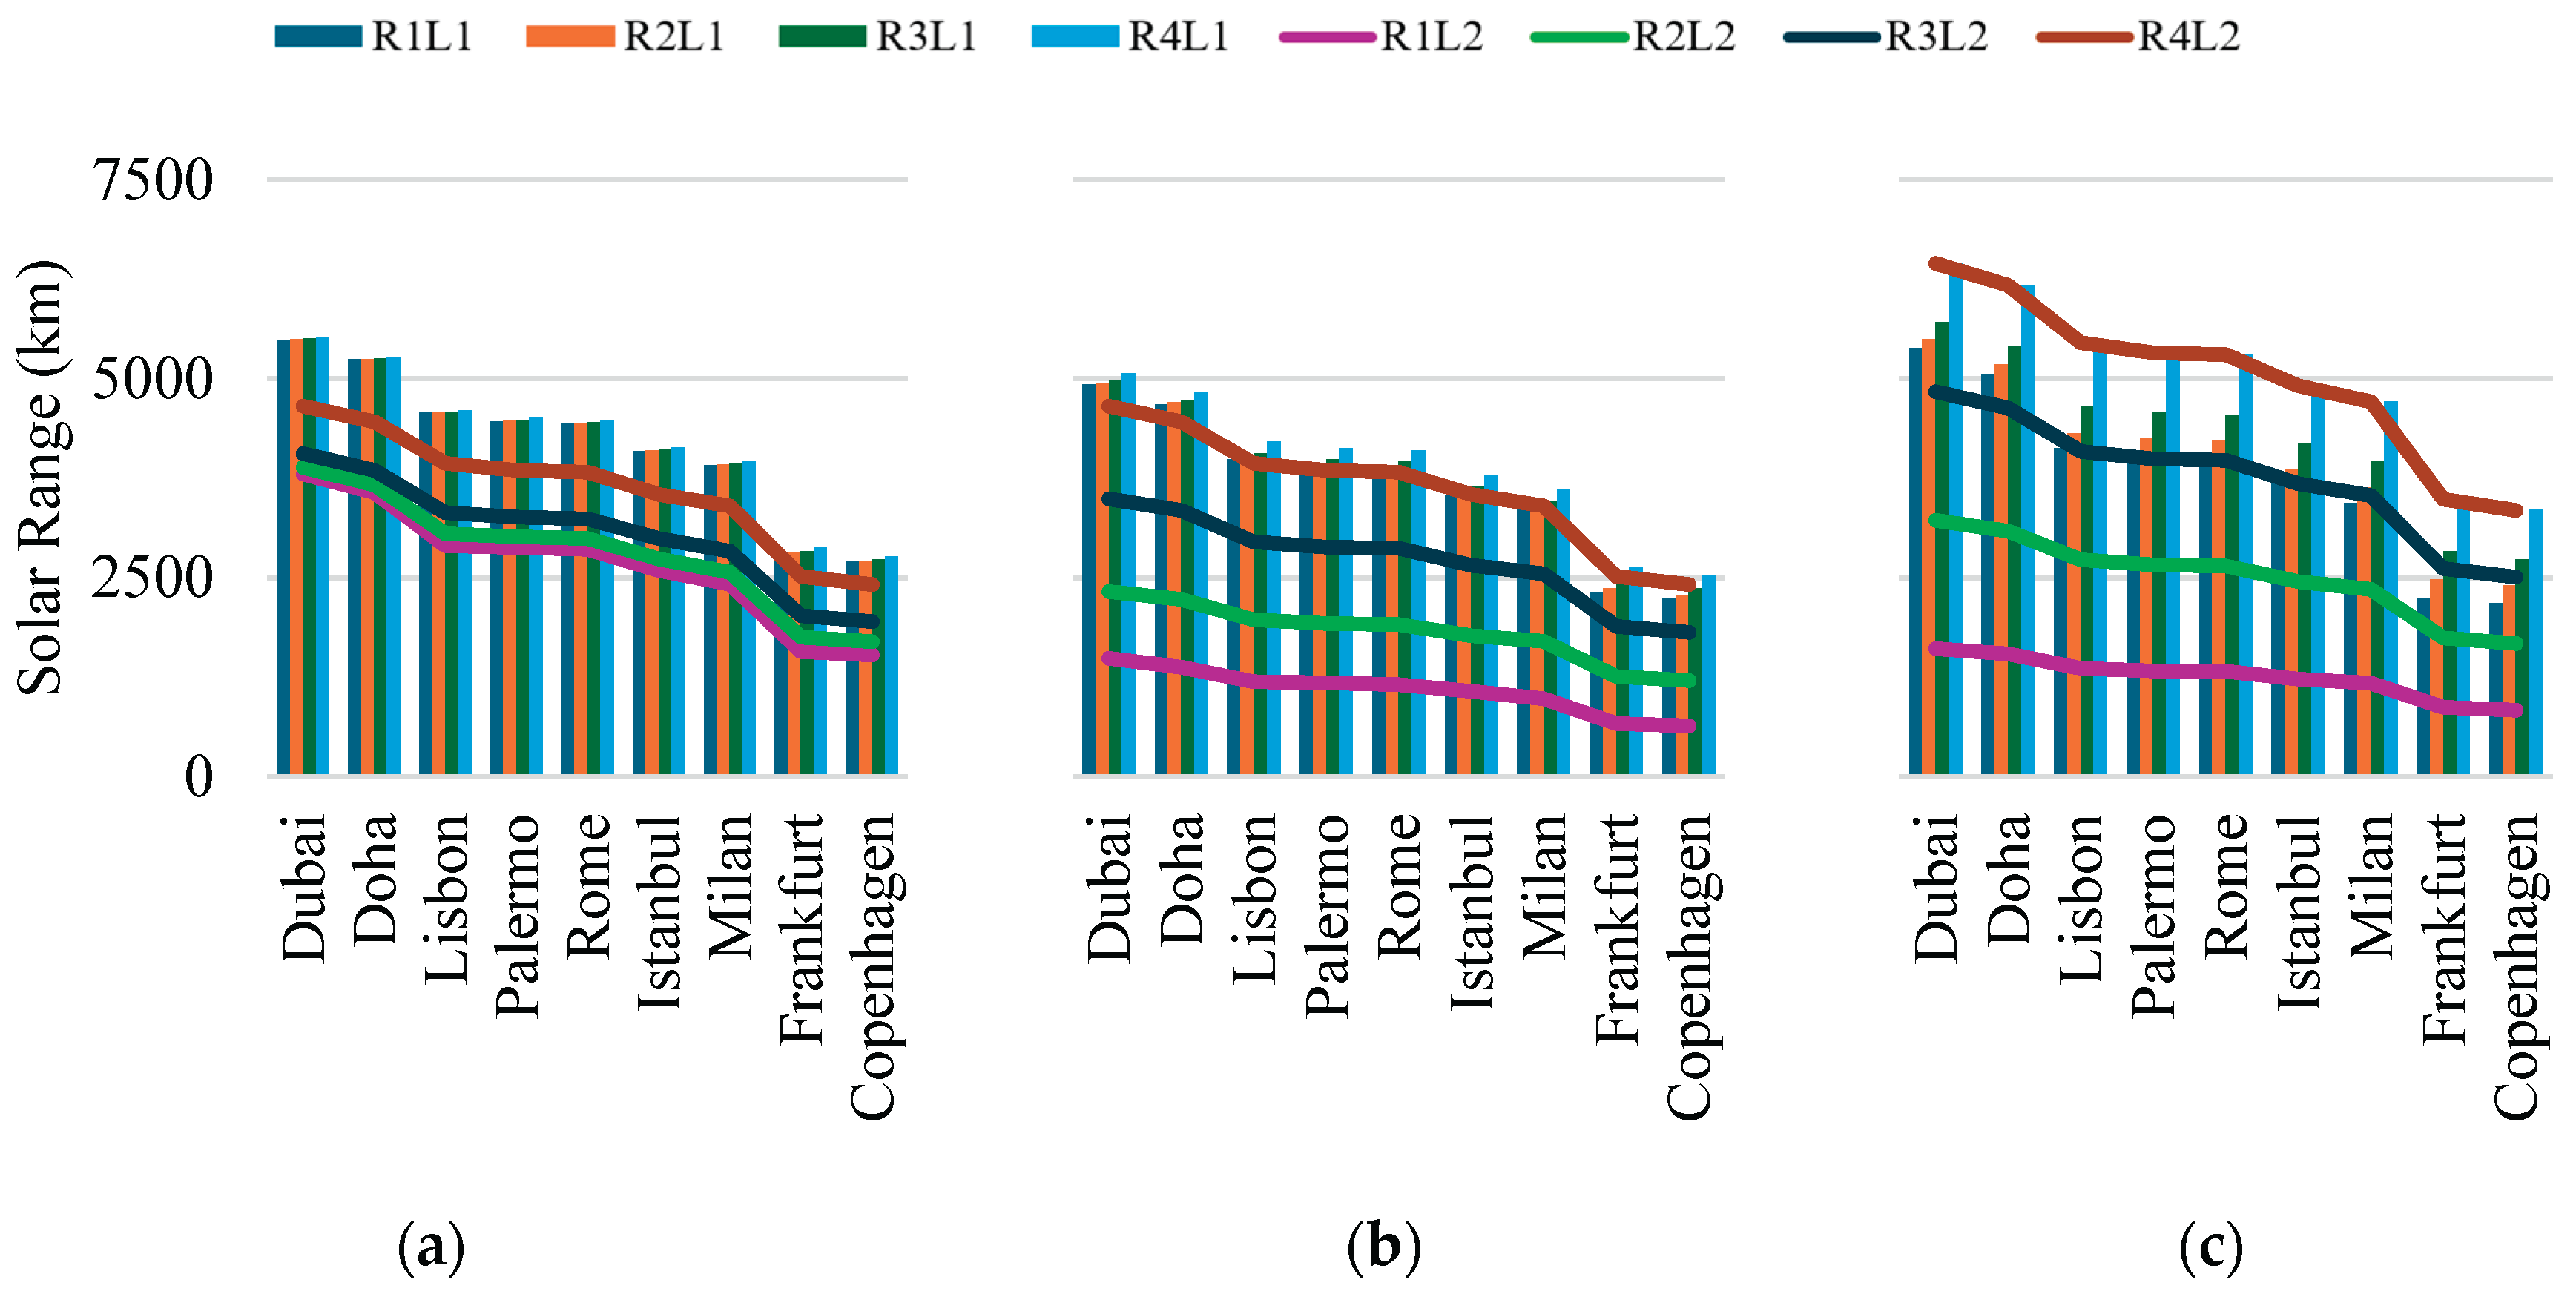
Figure 6.
Daily solar driving range achievable by VIPV for the minibus (7 m² PV) in R3L2: (a) July (b) December.
Figure 6.
Daily solar driving range achievable by VIPV for the minibus (7 m² PV) in R3L2: (a) July (b) December.
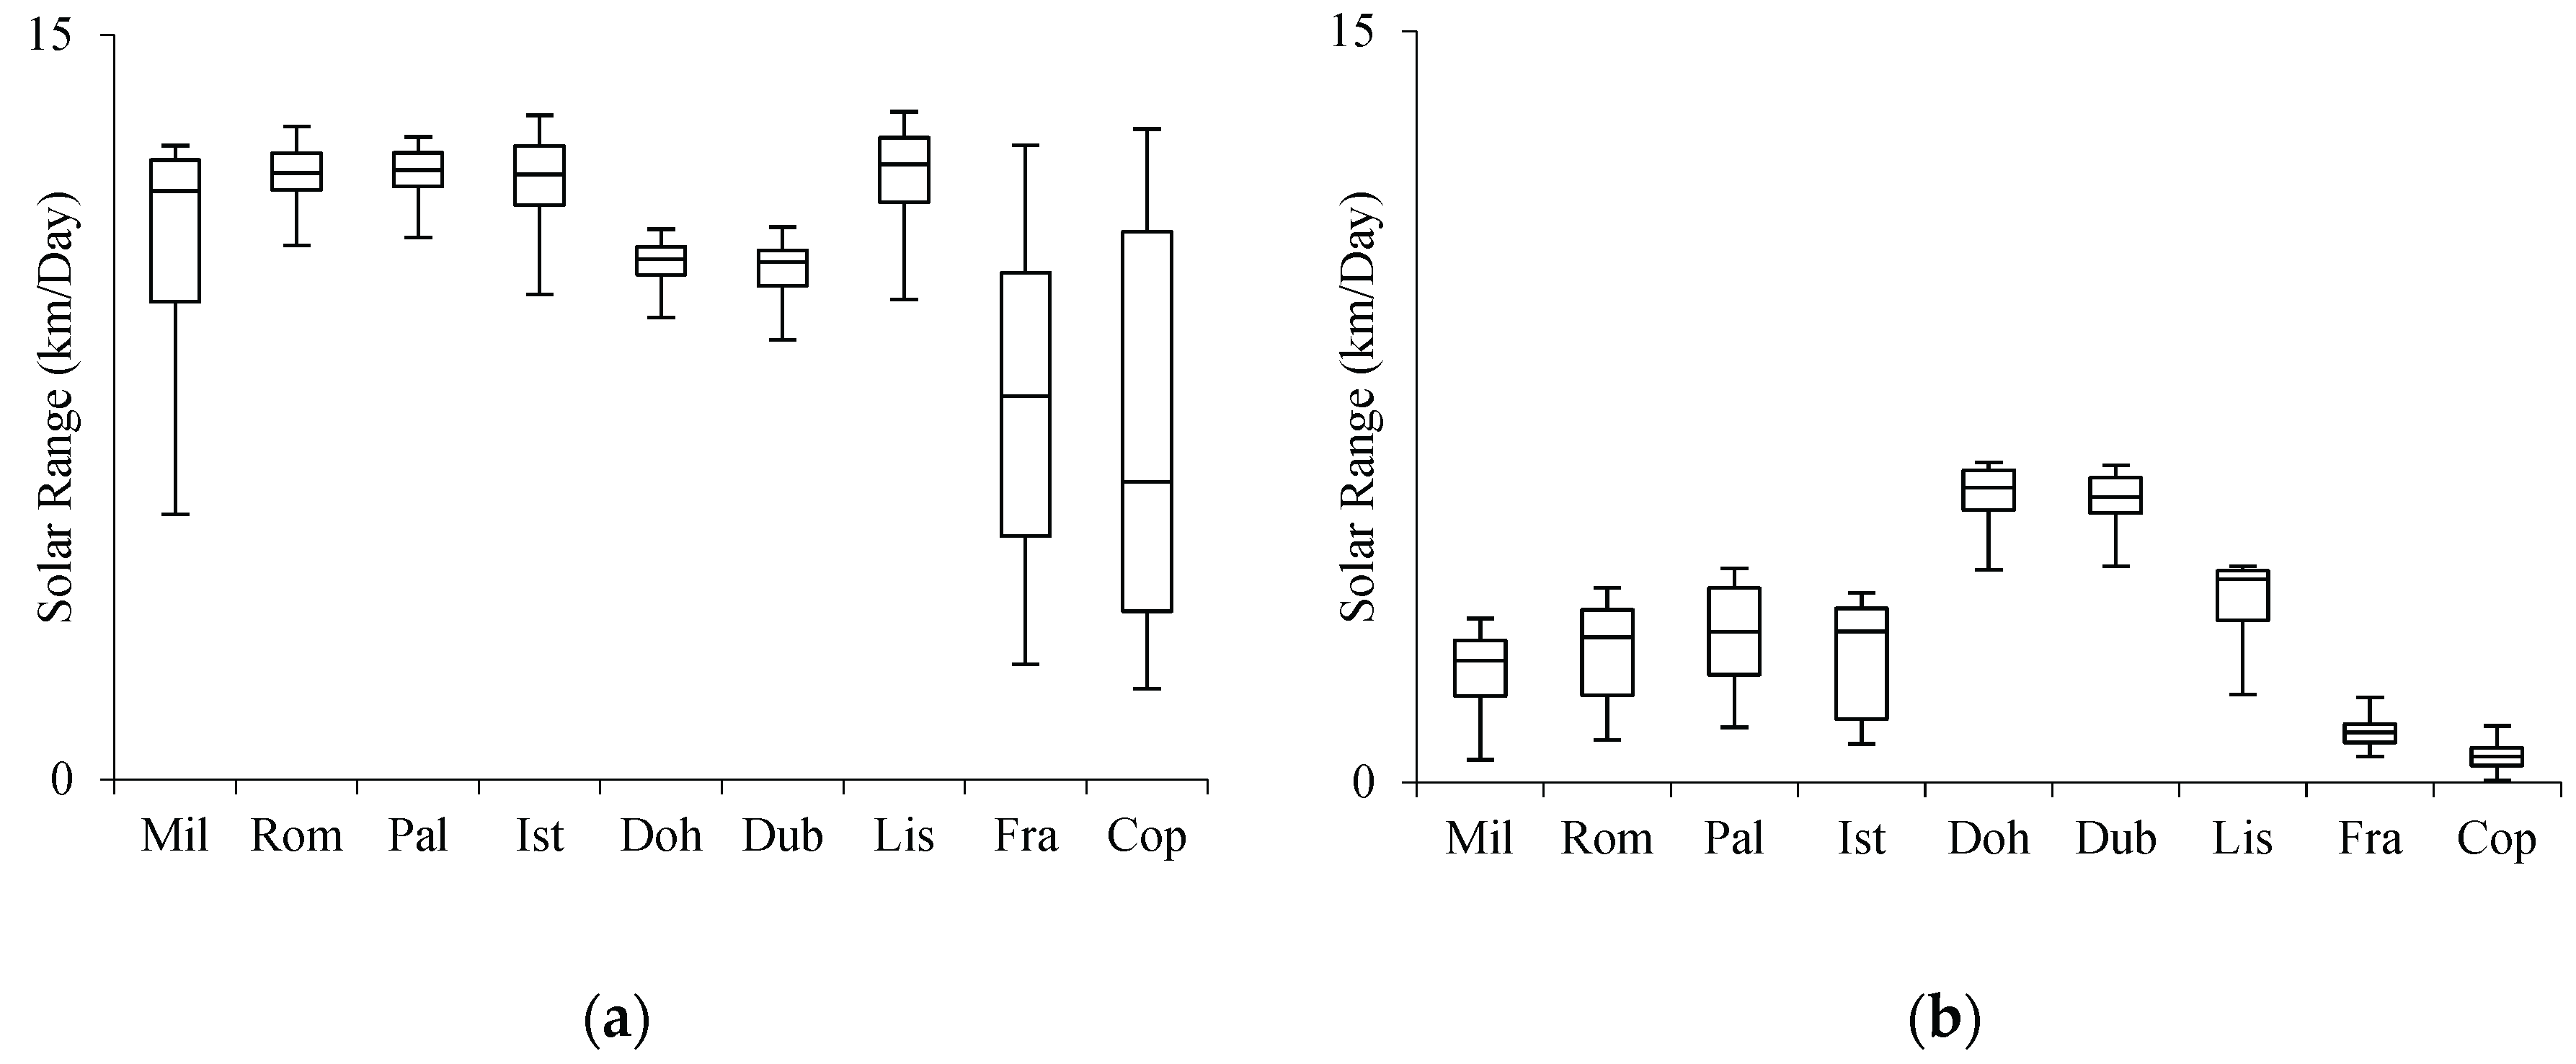
Figure 7.
Yearly avoided CO₂ emissions from VIPV systems in different cities and PV areas under selected operating conditions: (a) R1L1, (b) R1L2, (c) R3L1, (d) R3L2.
Figure 7.
Yearly avoided CO₂ emissions from VIPV systems in different cities and PV areas under selected operating conditions: (a) R1L1, (b) R1L2, (c) R3L1, (d) R3L2.
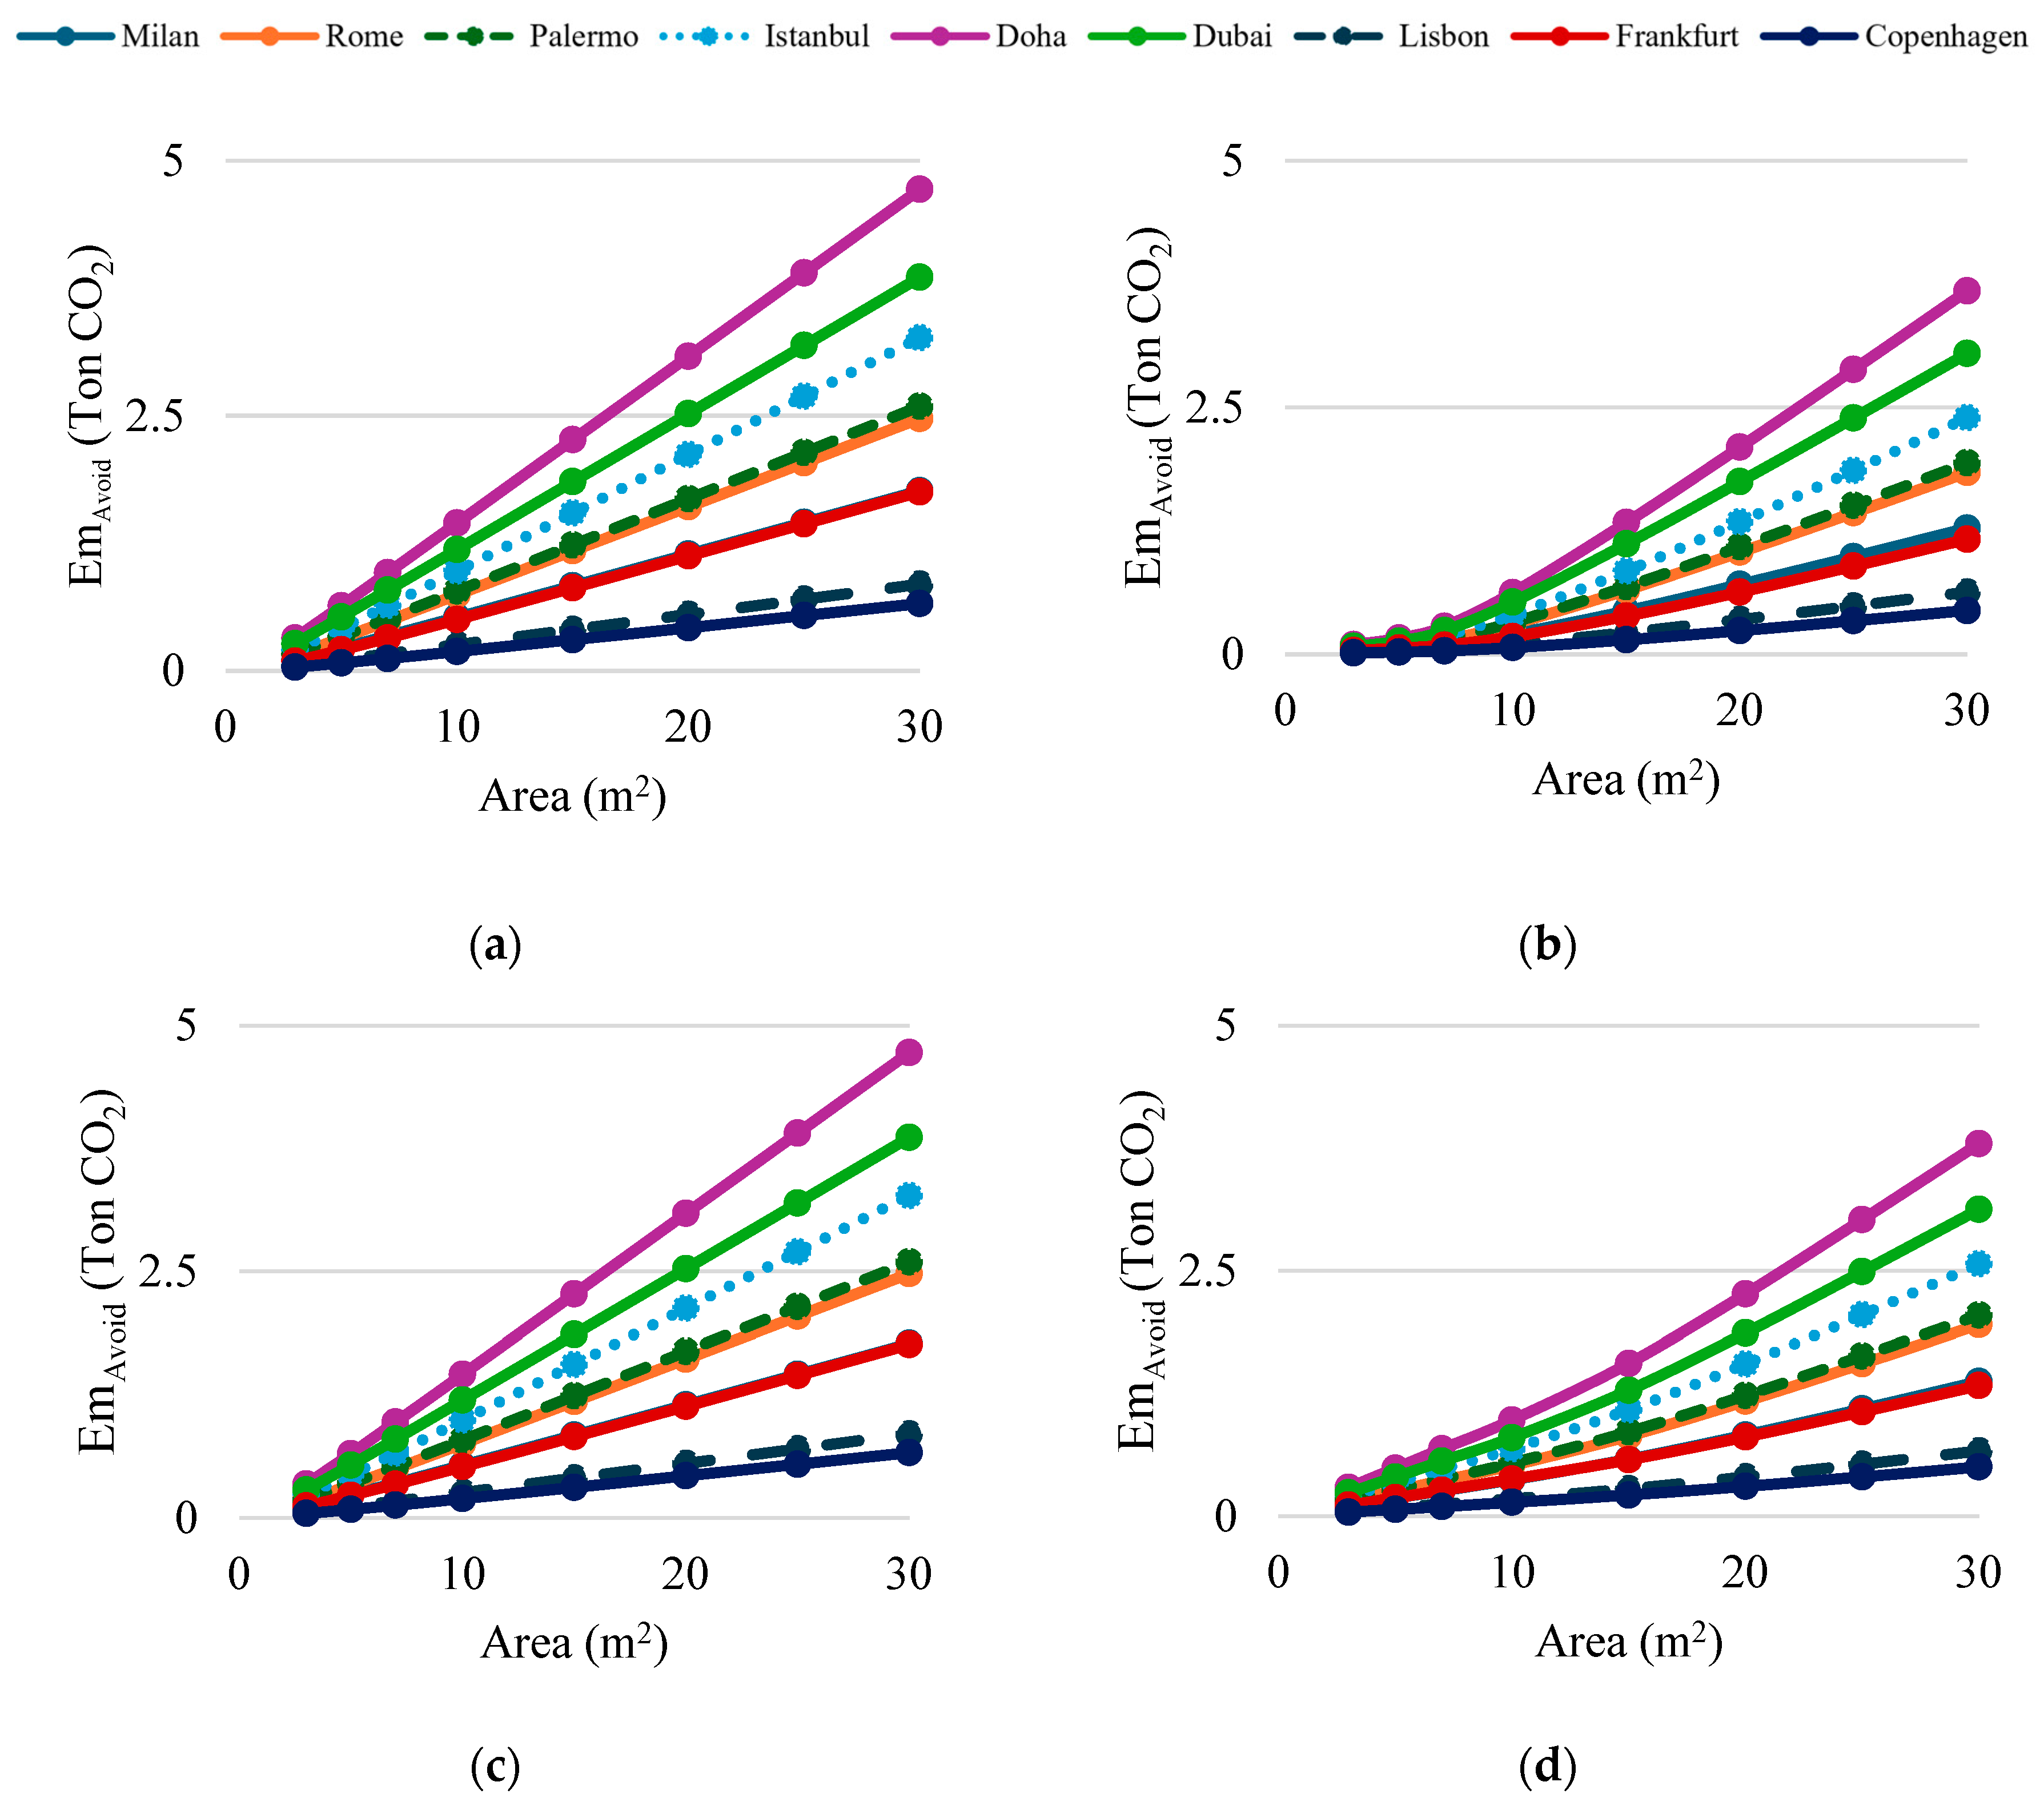
Figure 8.
Maximum system costs at grid parity for different cities under WACCreal = 3%: (a) R3L1, (b) R3L2.
Figure 8.
Maximum system costs at grid parity for different cities under WACCreal = 3%: (a) R3L1, (b) R3L2.
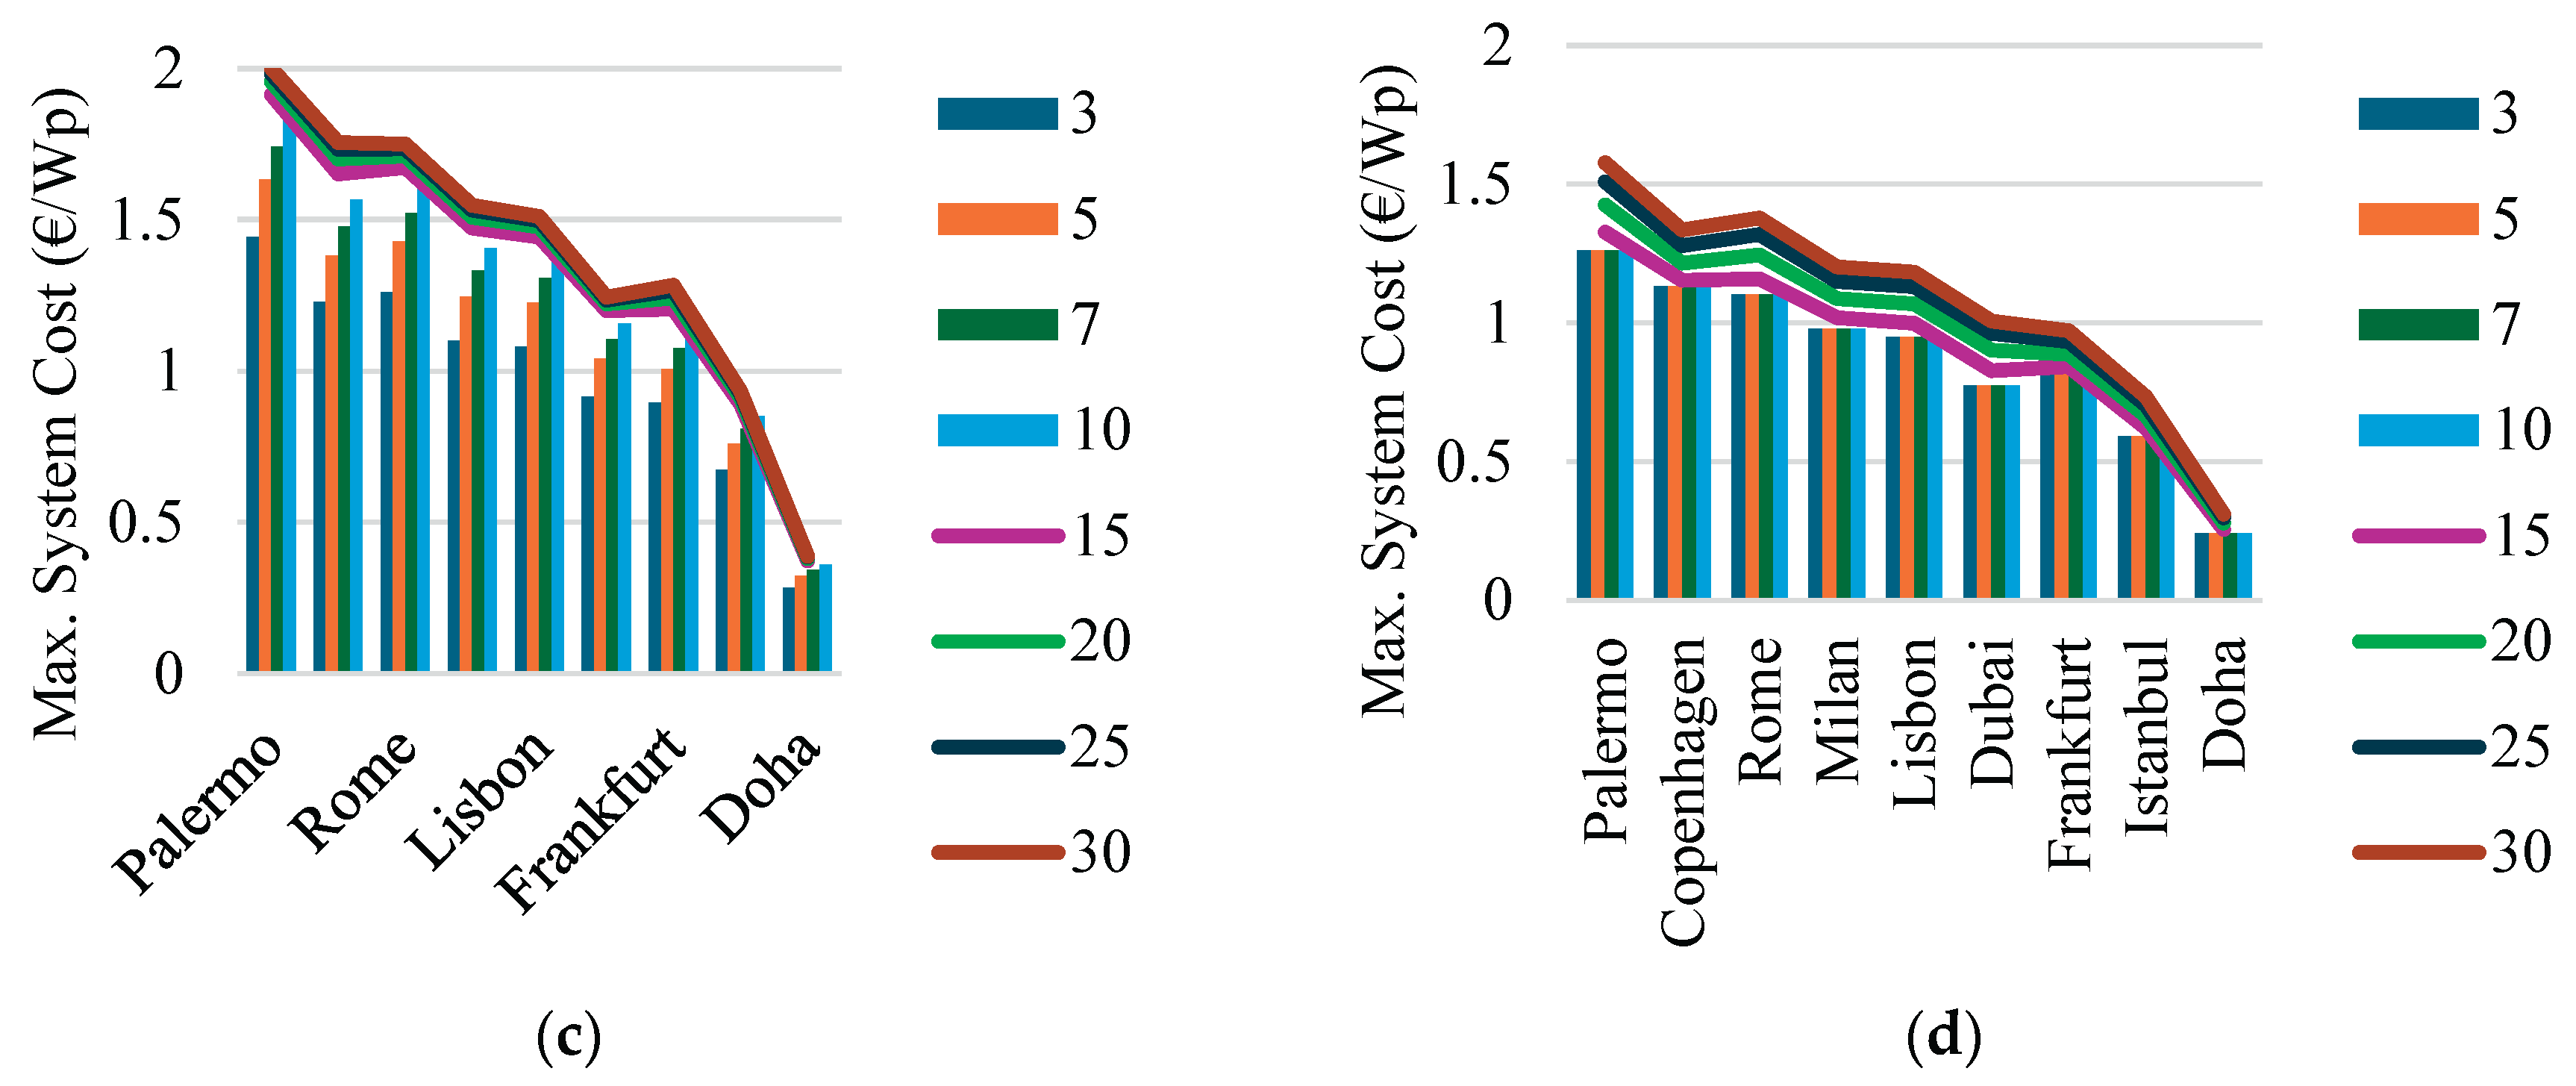
Figure 9.
Maximum system costs at grid parity for different cities under operating condition R3L2 with: (a) WACCreal = 2%, (b) WACCreal = 5%.
Figure 9.
Maximum system costs at grid parity for different cities under operating condition R3L2 with: (a) WACCreal = 2%, (b) WACCreal = 5%.
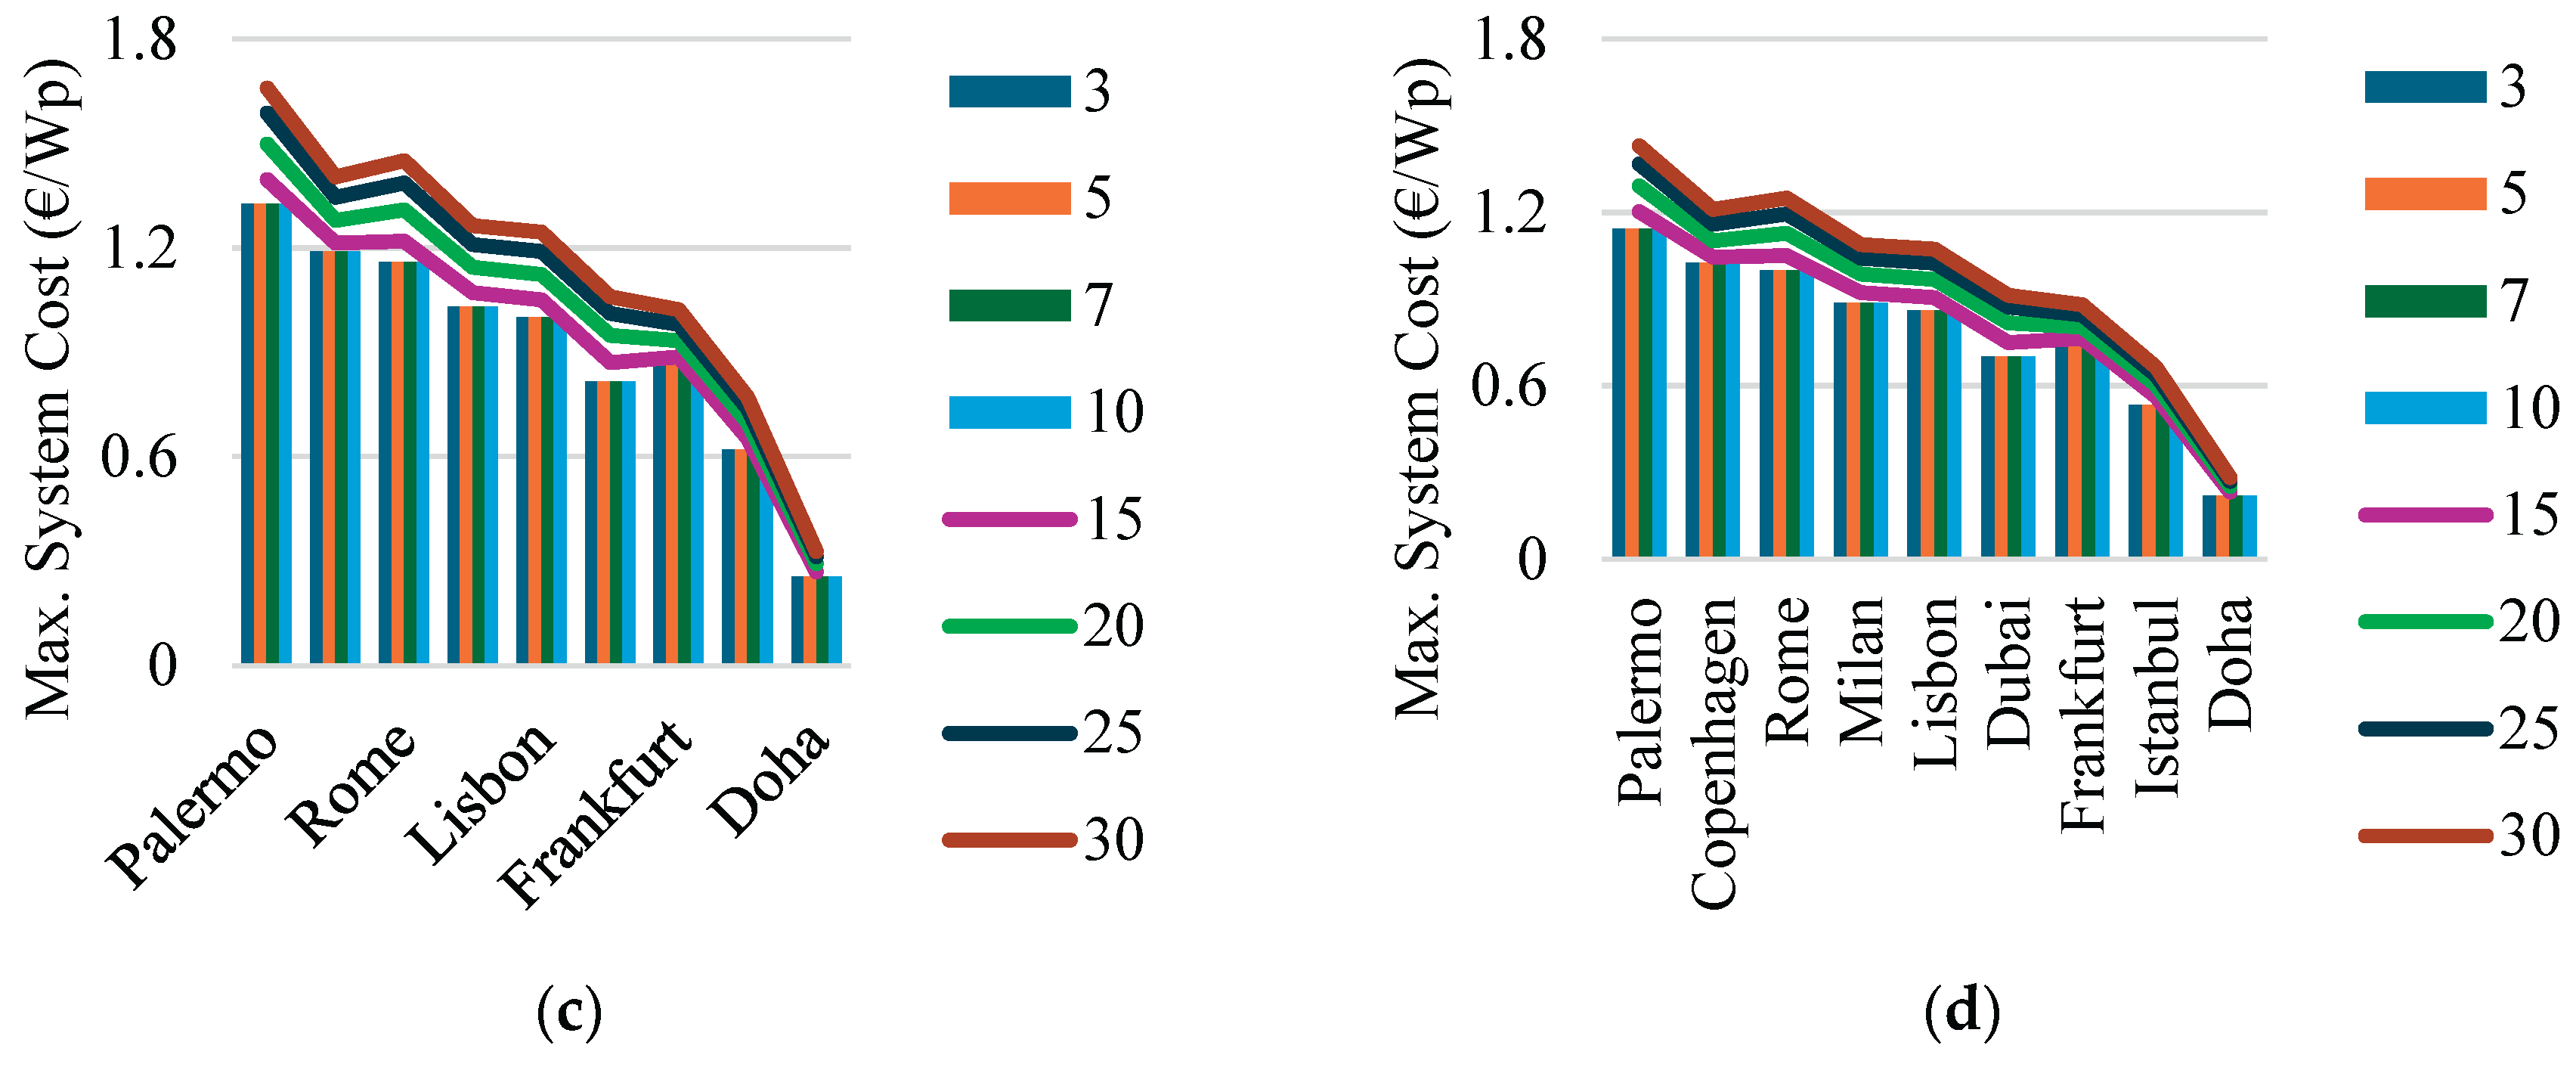
Figure 10.
Temperature variations of PV modules integrated on vehicle surfaces during trips at: (a) Istanbul, (b) Rome, (c) Milan, and (d) Palermo.
Figure 10.
Temperature variations of PV modules integrated on vehicle surfaces during trips at: (a) Istanbul, (b) Rome, (c) Milan, and (d) Palermo.
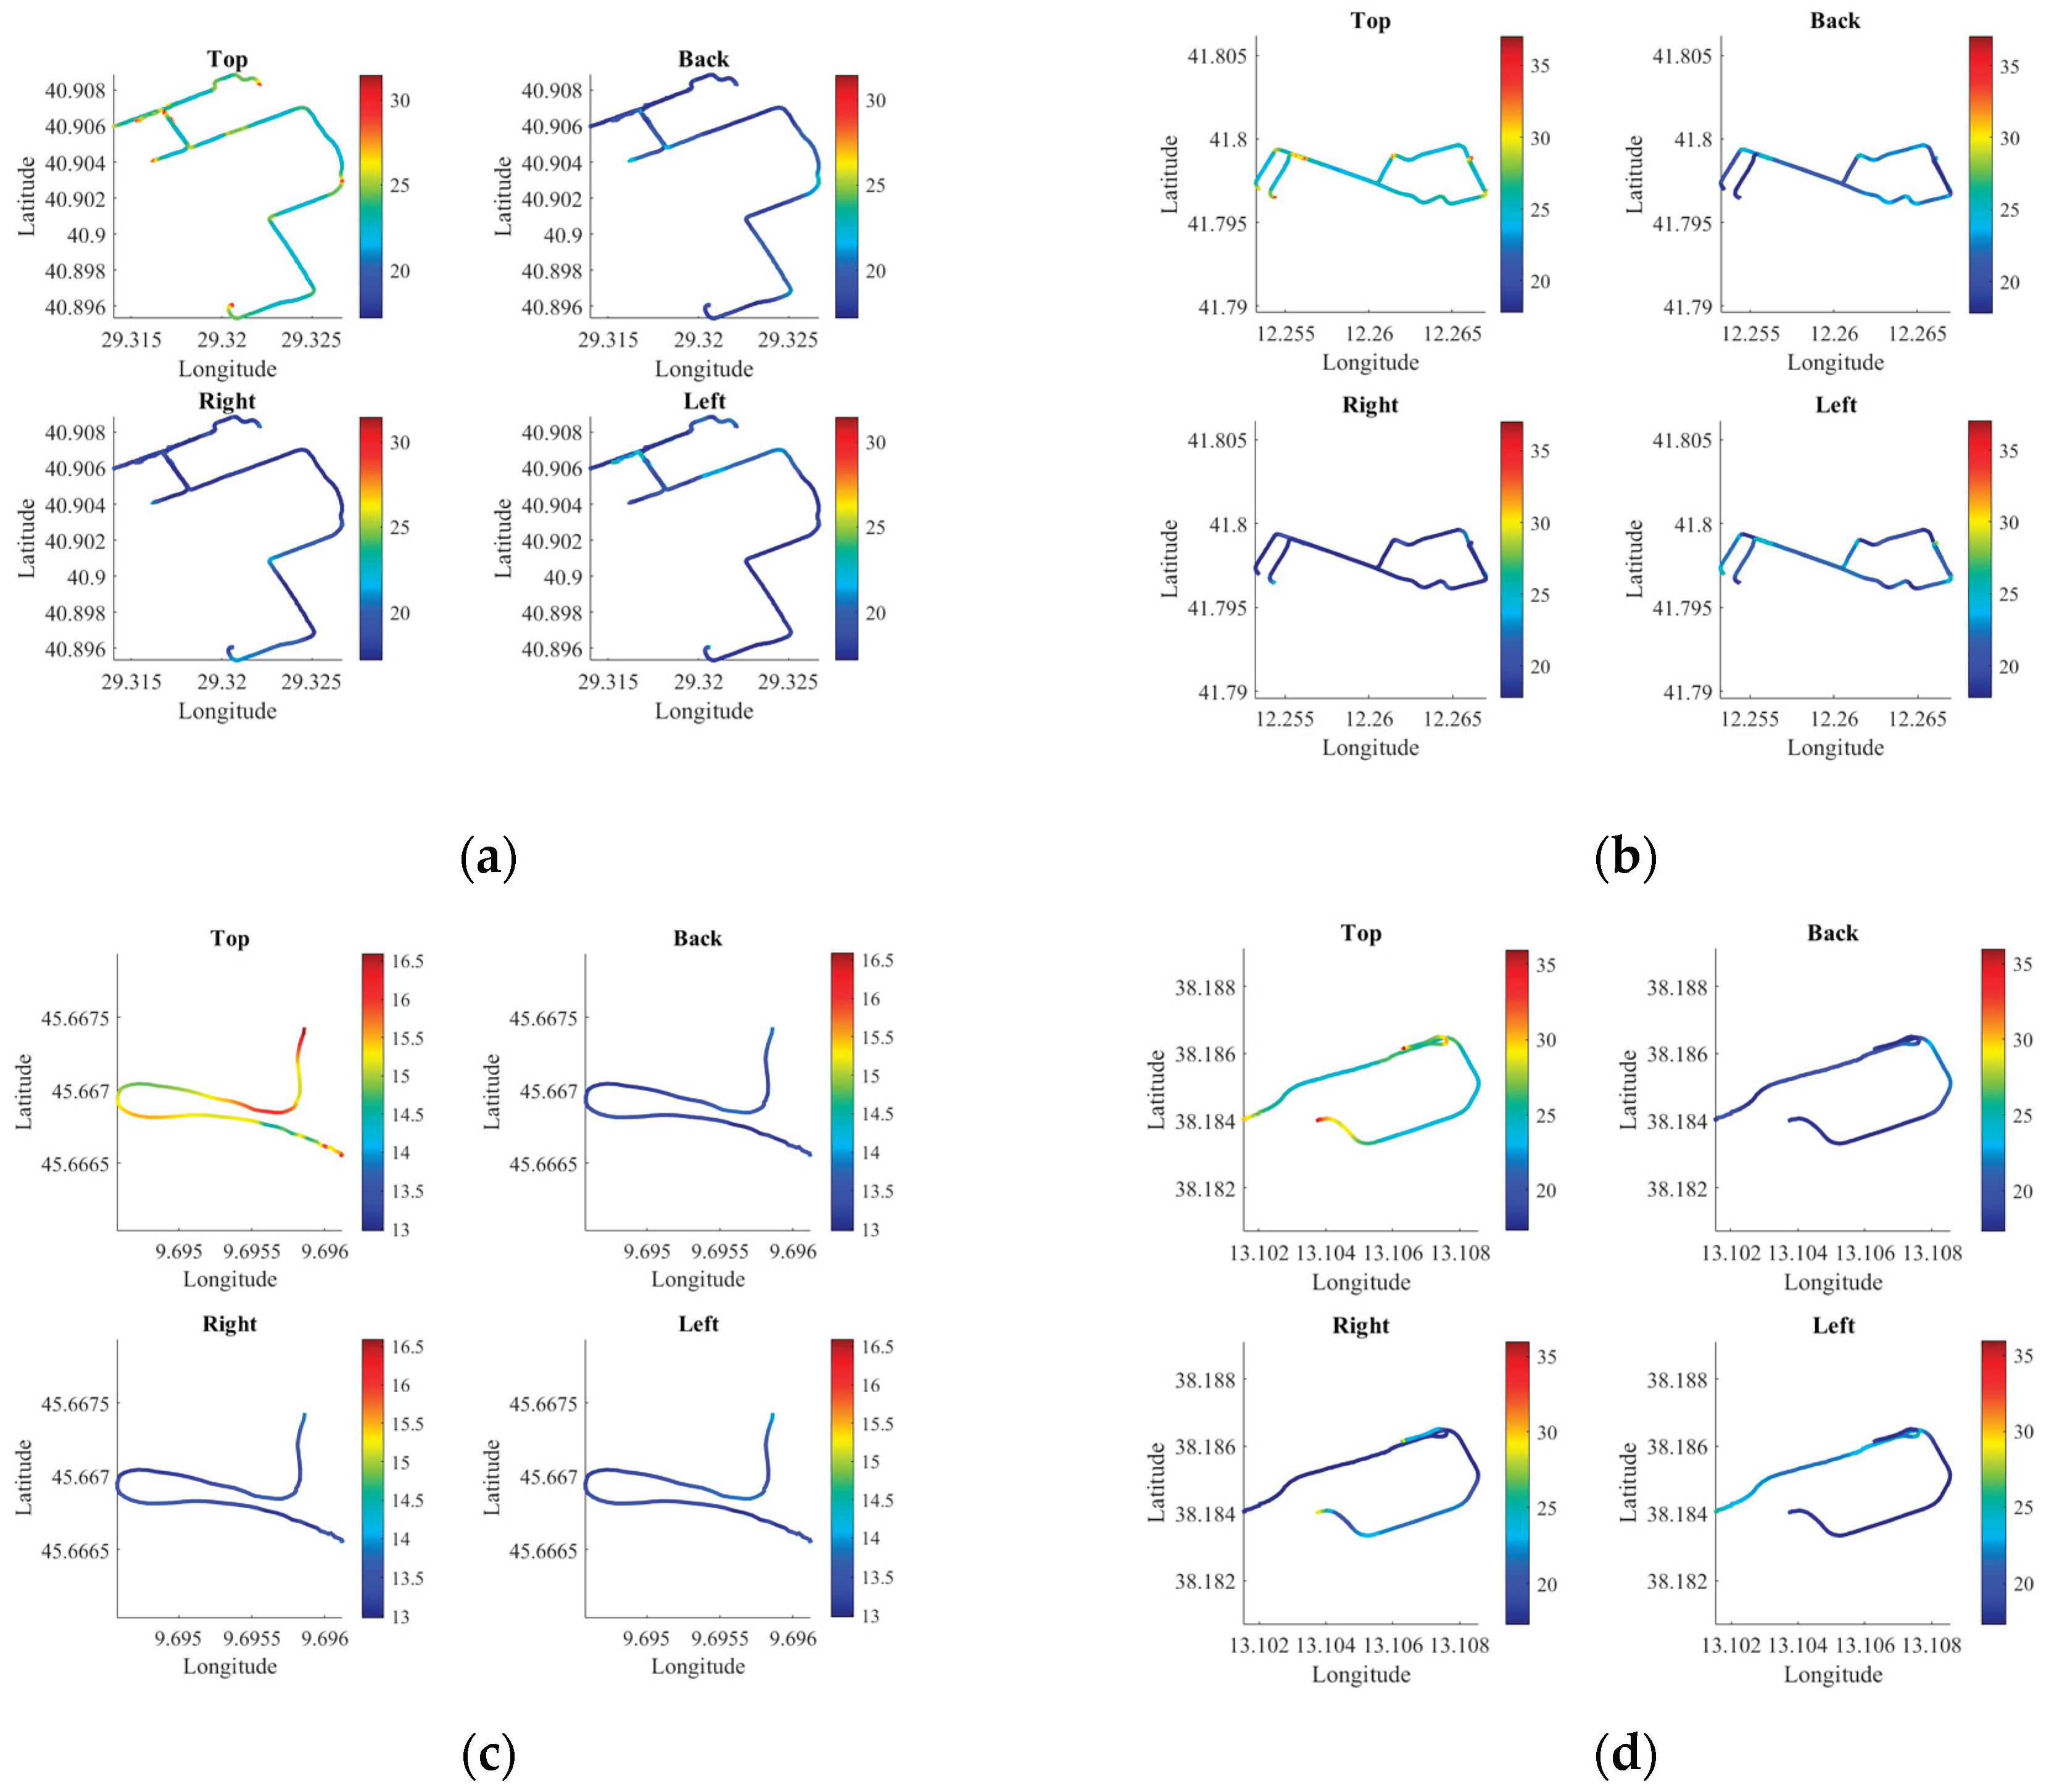
Figure 11.
Energy production per square meter of PV installed on vehicle surfaces (roof, back, left, right) during three trips in Istanbul, conducted on July 30 and December 27: (a) Trip 1, (b) Trip 2, (c) Trip 3.
Figure 11.
Energy production per square meter of PV installed on vehicle surfaces (roof, back, left, right) during three trips in Istanbul, conducted on July 30 and December 27: (a) Trip 1, (b) Trip 2, (c) Trip 3.
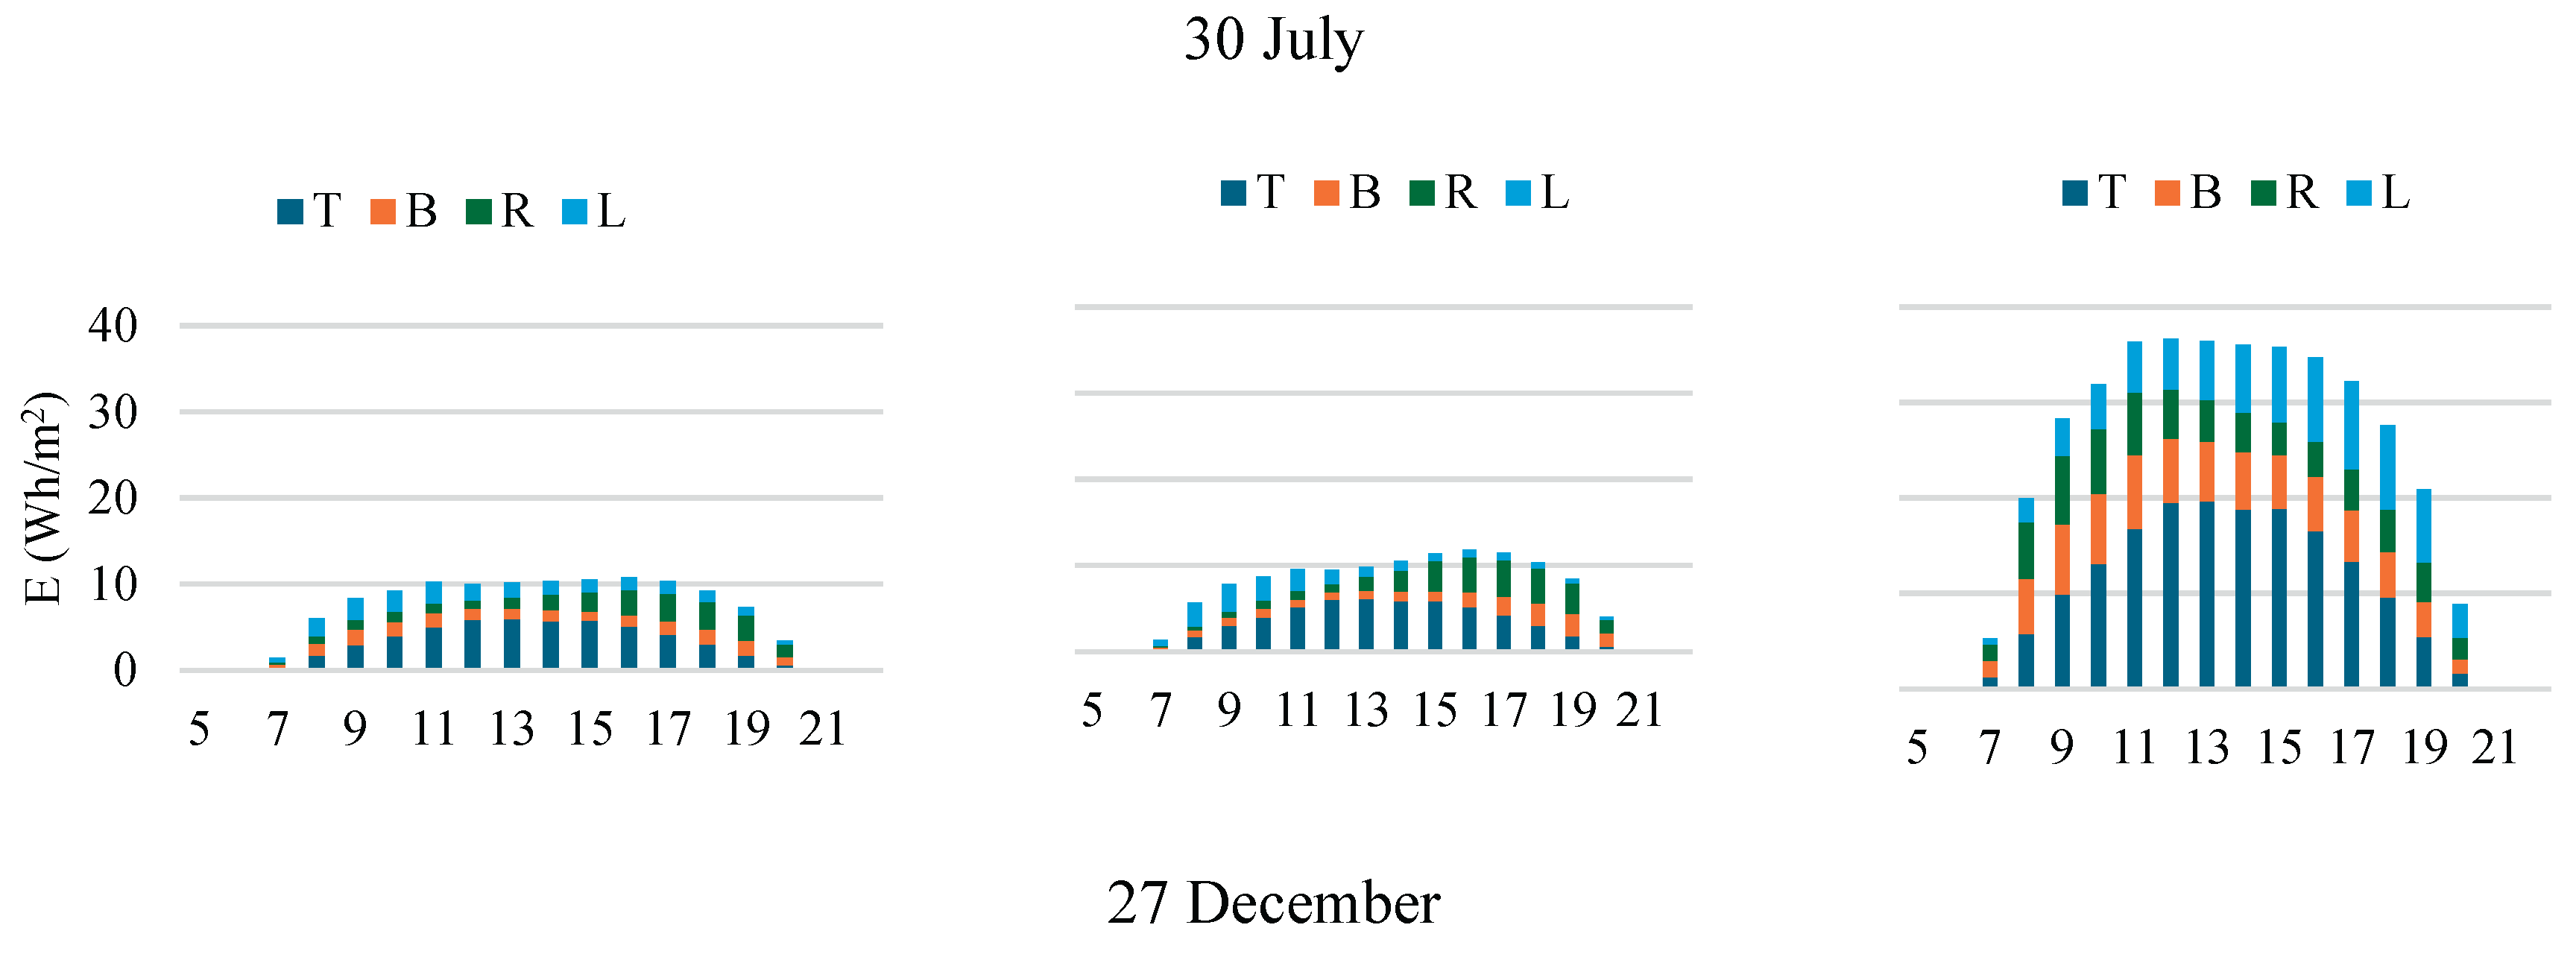
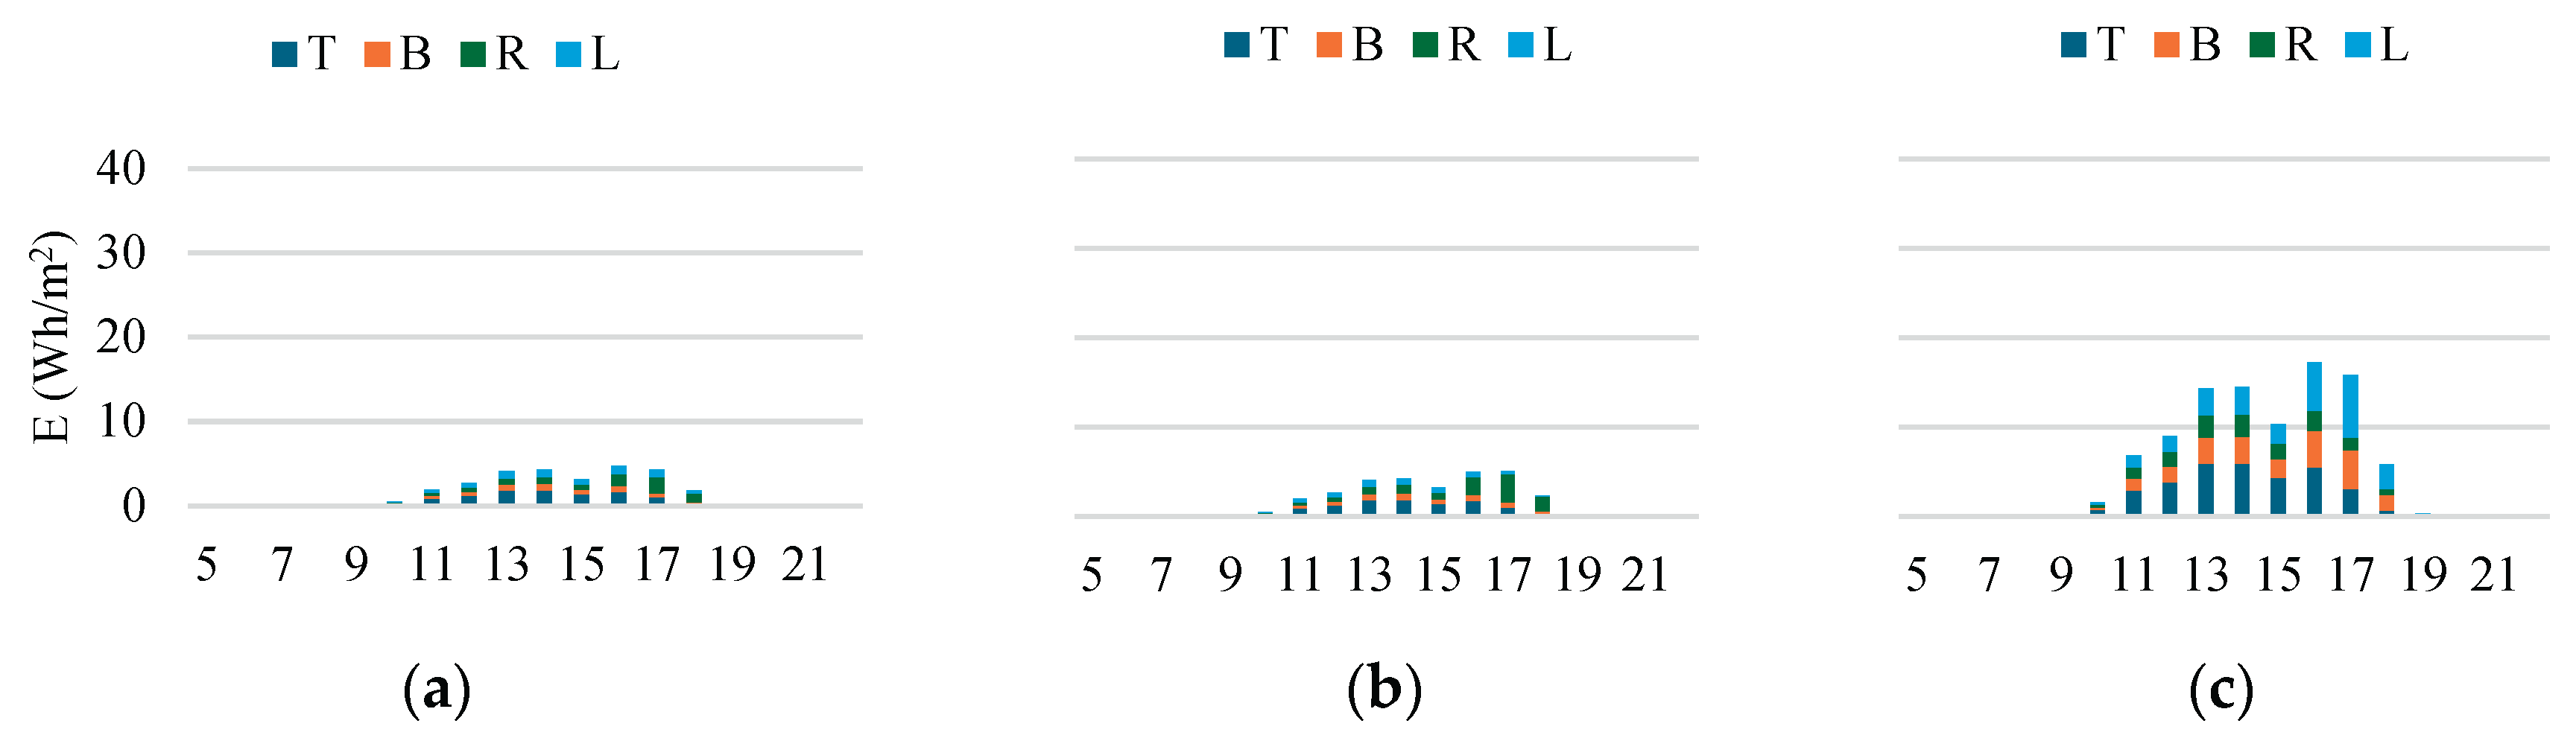
Figure 12.
Energy production per square meter of PV installed on vehicle surfaces during trips in: (a) Palermo Trip 1, (b) Palermo Trip 2, (c) Rome Trip 1, (d) Rome Trip 2, (e) Milan.
Figure 12.
Energy production per square meter of PV installed on vehicle surfaces during trips in: (a) Palermo Trip 1, (b) Palermo Trip 2, (c) Rome Trip 1, (d) Rome Trip 2, (e) Milan.
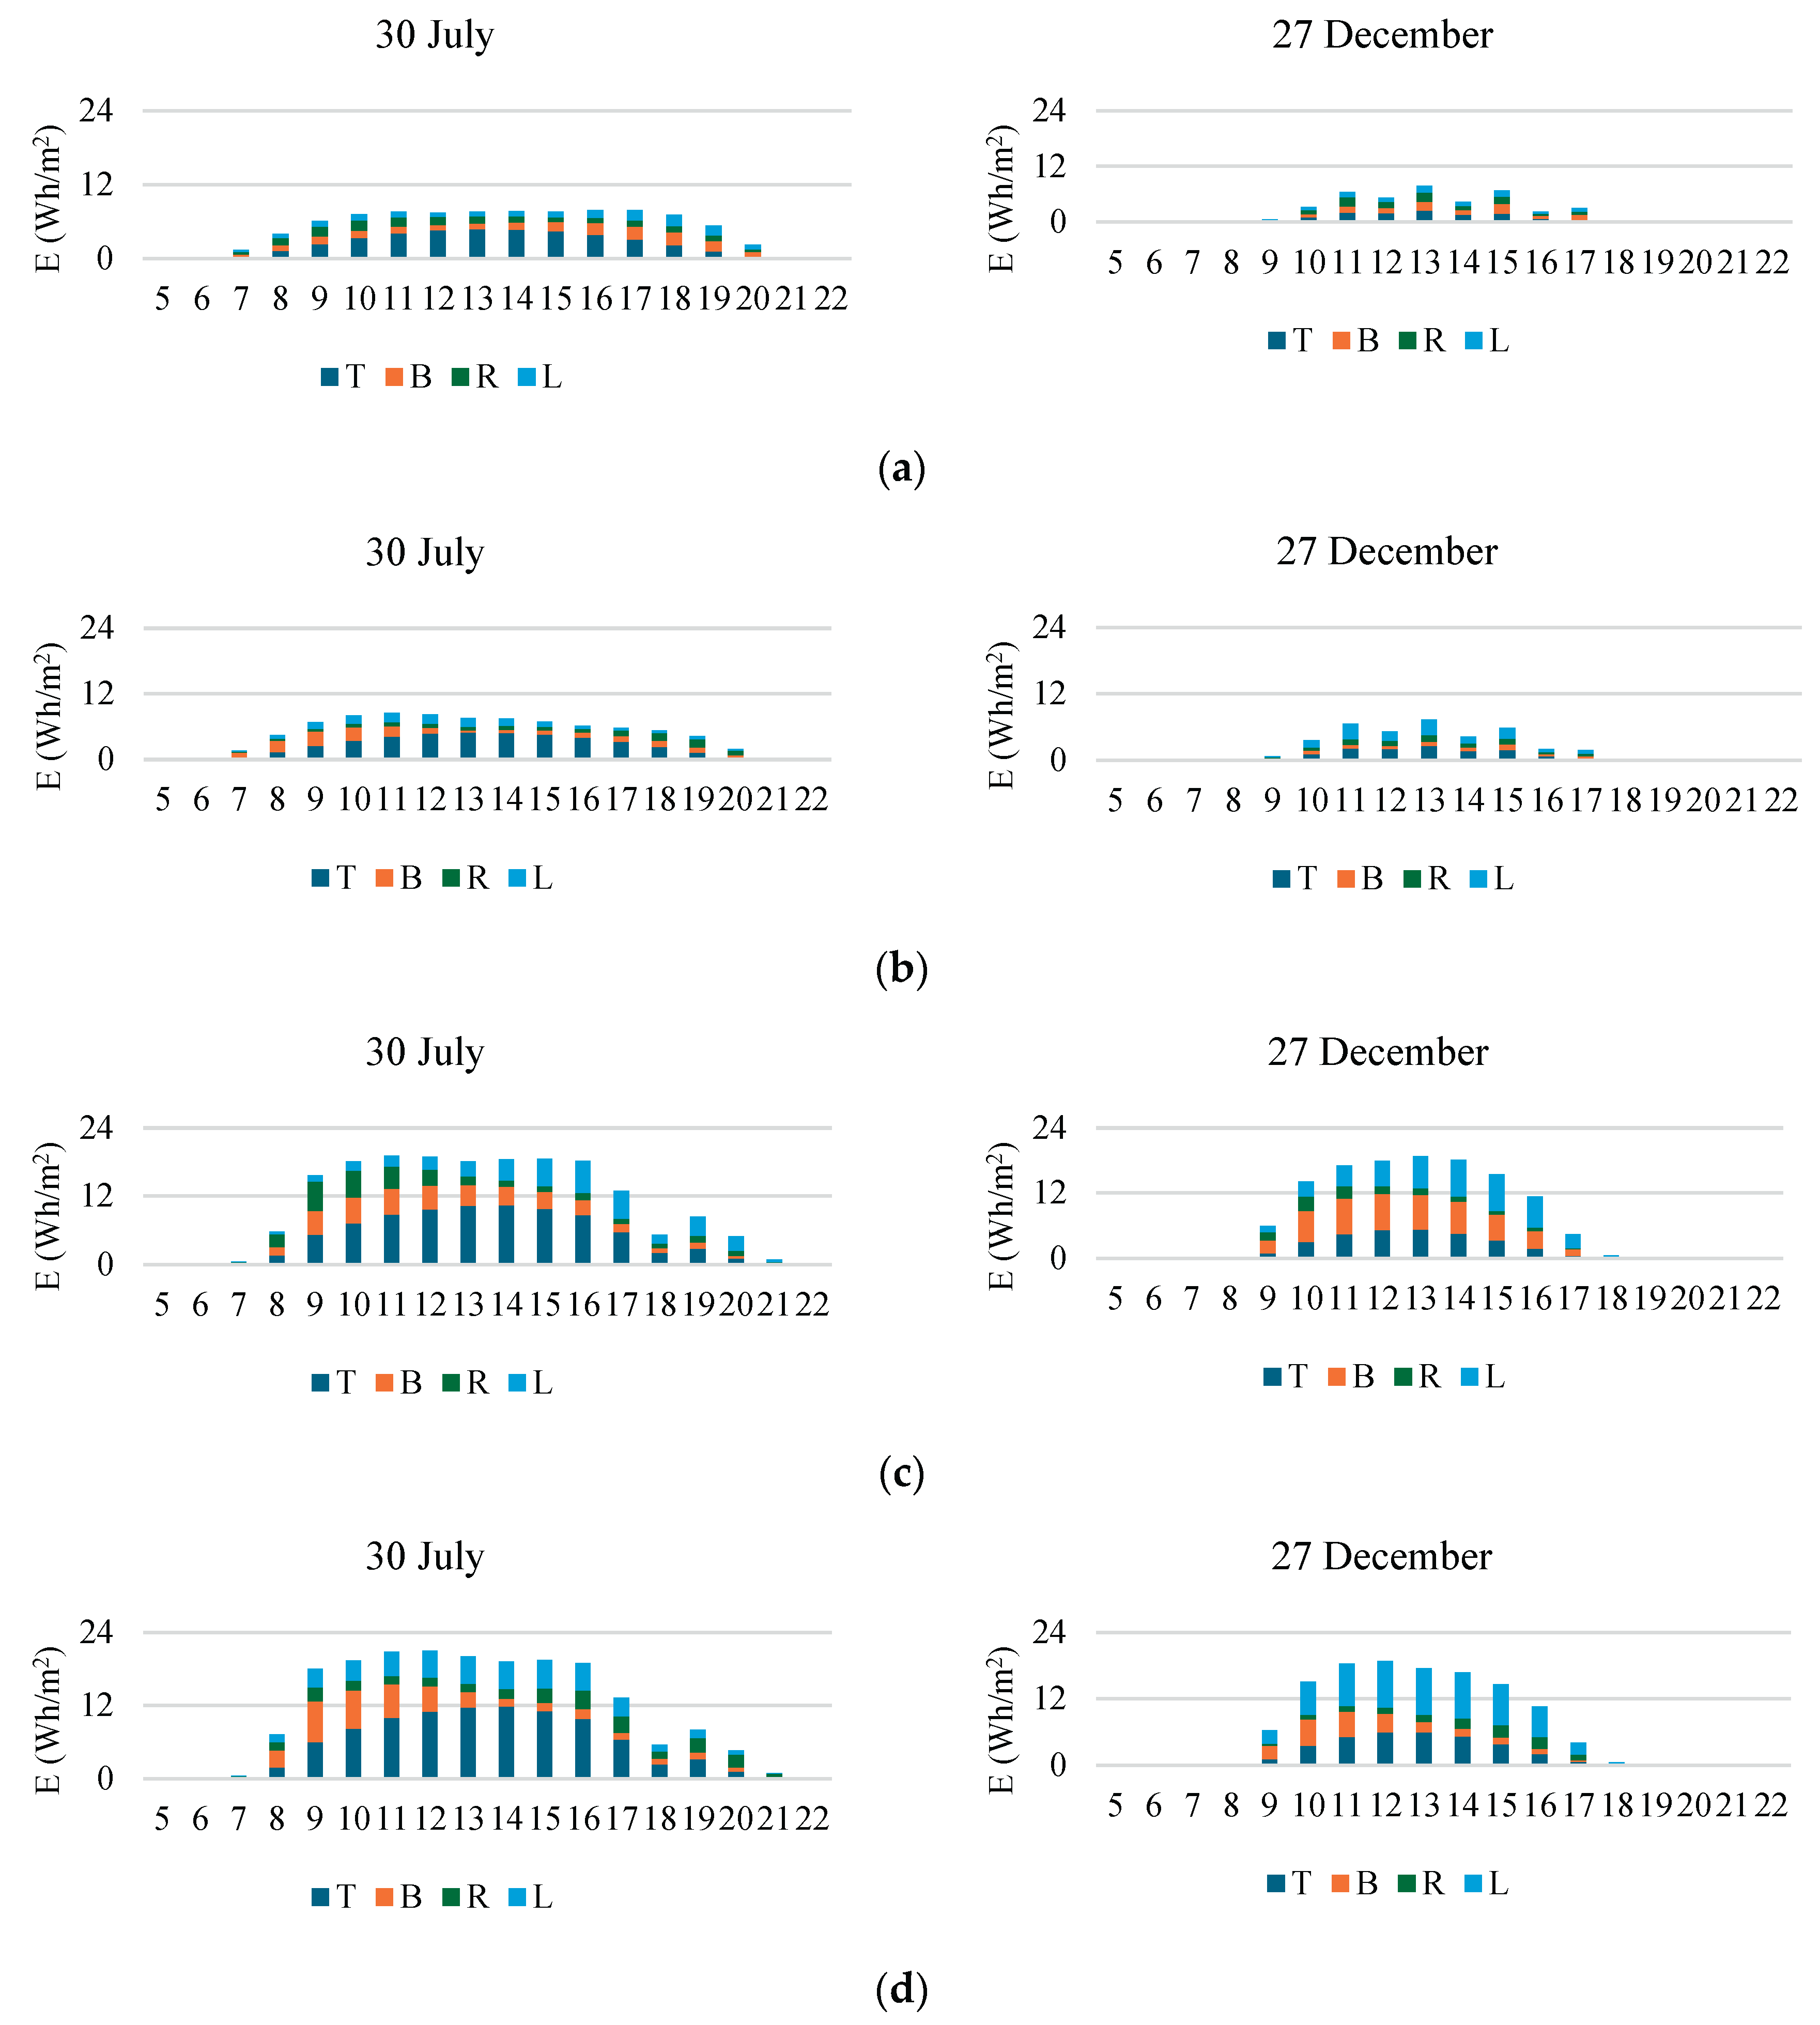
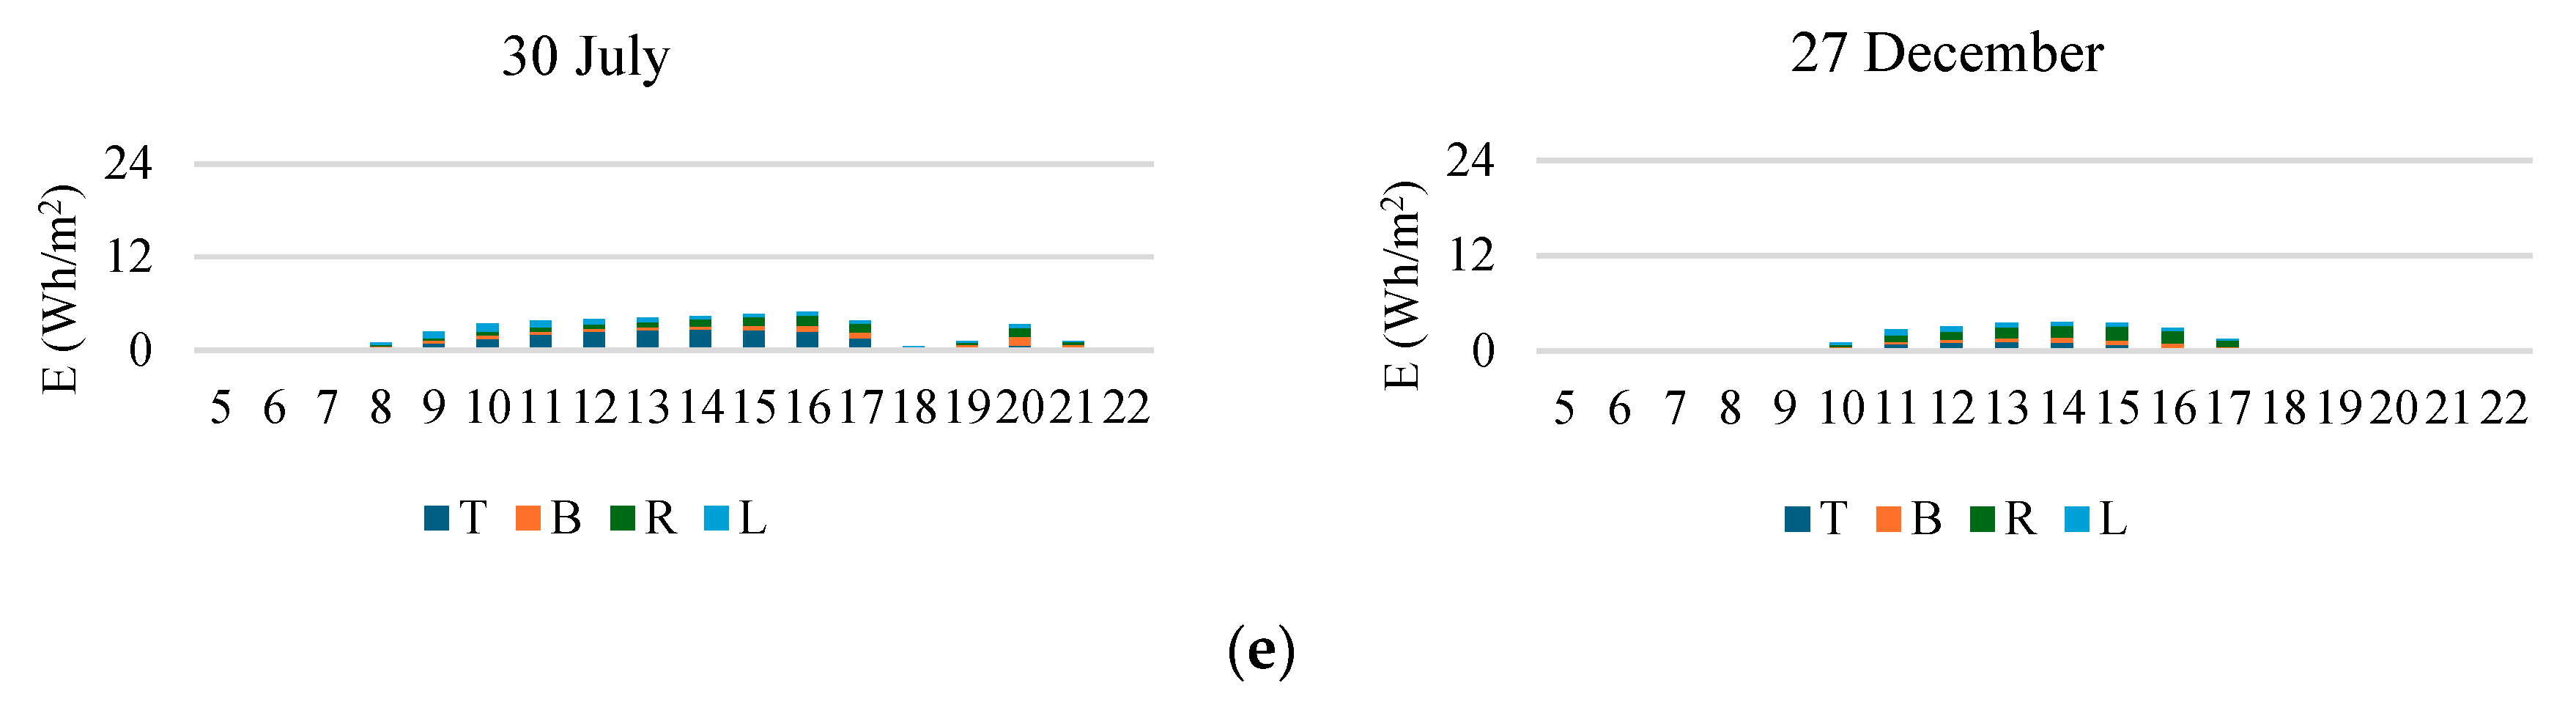

Table 1.
Specifications and electrical parameters of the crystalline silicon PV modules used in the simulations [30].
Table 1.
Specifications and electrical parameters of the crystalline silicon PV modules used in the simulations [30].
| PV Module | Efficiency [%] | ] | ] | |
|---|---|---|---|---|
| c-Si | 21.6 | - 0.47 | 30.02 | 6.28 |
Disclaimer/Publisher’s Note: The statements, opinions and data contained in all publications are solely those of the individual author(s) and contributor(s) and not of MDPI and/or the editor(s). MDPI and/or the editor(s) disclaim responsibility for any injury to people or property resulting from any ideas, methods, instructions or products referred to in the content. |
© 2025 by the authors. Licensee MDPI, Basel, Switzerland. This article is an open access article distributed under the terms and conditions of the Creative Commons Attribution (CC BY) license (http://creativecommons.org/licenses/by/4.0/).
Copyright: This open access article is published under a Creative Commons CC BY 4.0 license, which permit the free download, distribution, and reuse, provided that the author and preprint are cited in any reuse.


