
Submitted:
19 September 2025
Posted:
23 September 2025
You are already at the latest version
Abstract
Anemia caused by gastrointestinal parasitism is a major constraint to small ruminant productivity, particularly in low-resource production systems where diagnostic tools and veterinary access are limited. This study evaluated the potential of radiofrequency non distructive technique (RF-NDT) wave derived features as non-invasive biomarkers for anemia detection in goats, using FAMACHA© scores as a biological reference. Variable clustering of the top ten frequencies revealed distinct patterns across health states. Healthy animals (FAMACHA© 1) were characterized by a single frequency cluster centered at 8.43 GHz, explaining 93.7% of variation, whereas moderately affected animals (FAMACHA© 2) shifted to 9.33 GHz with reduced uniformity (88.7%). Borderline animals (FAMACHA© 3) required two clusters (9.89 and 8.23 GHz), explaining 91.0% of variation, indicating increasing tissue heterogeneity with anemia progression. Regression analysis demonstrated strong predictive power, with Linear Regression achieving R² = 1.00 and Random Forest R² = 0.79 (RMSE = 0.07), while Support Vector Regression underperformed (R² = 0.31). Classification models confirmed the feasibility of categorical anemia detection. The Multilayer Perceptron achieved the highest accuracy (0.84), F1-score (0.83), and ROC-AUC (0.94), outperforming Support Vector Machine (accuracy 0.67, F1 = 0.67) and K-Nearest Neighbors (accuracy 0.60, F1 = 0.61). These findings establish proof-of-concept that RF waves capture physiologically meaningful dielectric signatures linked to anemia, reflecting hemoglobin concentration, hydration, and microcirculatory function. The integration of RF sensing with machine learning offers a rapid, non-invasive, and scalable diagnostic approach for sustainable herd health management. Future work should expand validation across breeds and environments, optimize sensor design, and embed neural classifiers for field-ready deployment.
Keywords:
classification model
; multilayer perceptron
; radio-frequency waves
; predictive modeling
; livestock
; FAMACHA©
; parasitism
; small ruminants
1. Introduction
Small ruminants, including goats and sheep, play a critical role in sustainable livestock production systems globally due to their capacity to thrive in marginal environments and provide essential resources [1]. Goat products, including high-quality protein, milk, and fiber, contribute significantly to the livelihoods of millions of households, particularly in developing regions where other livestock may struggle to survive [2]. However, despite these advantages, small ruminants face numerous health challenges that impede their productivity, such as parasitism, metabolic stress, and subclinical diseases. These health issues lead to considerable economic losses and jeopardize the sustainability of production systems that depend on these animals, as highlighted in multiple studies and reviews [3,4,5].
The economic impact of health challenges, particularly due to parasitic infections, is significant [3]. For instance, gastrointestinal nematodes, predominantly Haemonchus contortus, have been identified as a leading cause of morbidity and mortality in sheep and goats. The prevalence of these parasites contributes directly to reduced weight gain, milk production, and overall health [5,6]. Effective management of these infections is further complicated by the growing resistance to commonly used anthelmintics, which has been thoroughly documented in numerous studies [7,8]. This situation underscores the necessity for continuous monitoring and effective control strategies to alleviate the burden of parasitism in small ruminants.
Traditional monitoring practices, such as body condition scoring, FAMACHA charting, and periodic hematological testing (Packed Cell Volume), have served as essential tools for assessing the health status of these animals [9]. Yet, they also present several shortcomings such as primarily being labor-intensive, subjective, and reactive rather than proactive and preventative as strategies for addressing health issues. The FAMACHA system has been recognized for its ability to identify anemia due to H. contortus infections with high sensitivity and specificity [10,11]. However, its performance can vary significantly based on the training of the personnel conducting the assessments, which can lead to discrepancies in results; this may render results to be somewhat subjective [12]. Additionally, reliance on potentially subjective assessments can lead to inconsistencies in health monitoring, making it imperative to seek more robust and precise alternatives.
As the demand for efficient, welfare-oriented, and climate-resilient livestock production systems increases, there is an emergent need for innovative approaches to animal health monitoring. One promising direction lies in the integration of non-invasive and scalable technologies that can provide real-time health assessments. For example, advances in machine learning applications for predicting anthelmintic resistance and managing gastrointestinal nematode infections show potential for transforming traditional practices into more automated and precise methodologies [10]. The use of technology, such as digital applications that can analyze data collected from various health indicators (e.g., PCV, fecal egg counts or physical health assessments), could streamline health monitoring, allowing for timely interventions when health declines are detected [11].
Radiofrequency (RF) wave sensing represents a promising technology in this regard. Radiofrequency waves, occupying the electromagnetic spectrum between 2 GHz and 18 GHz, have unique penetration and interaction properties with biological tissues [12]. When RF waves pass through or reflect from biological materials, they generate distinctive signatures determined by tissue composition, density, hydration status, and structural properties [13,14,15]. These dielectric properties make RF waves particularly attractive for non-destructive and non-invasive sensing applications. Unlike optical approaches, which are limited to surface-level features, RF signals can penetrate tissues, enabling the detection of subsurface physiological changes [16,17]. Moreover, RF systems can operate with minimal sample preparation, offer rapid measurement times, and are adaptable to field conditions, making them well-suited for livestock applications.
The concept of RF-based monitoring has been explored in several agricultural contexts. In cereals and grains, RF spectroscopy has been used to estimate moisture content and bulk density with high accuracy, supporting postharvest management [18]. Similarly, in poultry science, RF and microwave sensors have been evaluated as alternatives to near-infrared and hyperspectral imaging for detecting muscle myopathies, such as woody breast, due to their ability to capture tissue-level differences in water content and structure [19]. Translating this principle to small ruminants, RF sensing has the potential to detect early physiological alterations associated with health and welfare conditions such as anemia, hydration deficits, and changes in muscle or fat composition before they are clinically observable [20]. Thus, the application of RF-based methods could provide producers with a rapid, non-invasive, and scalable system for monitoring animal health in real time.
The rationale for pursuing alternative non-distructive RF (RF-NDT) wave sensing in small ruminant health monitoring is threefold. First, RF technology offers objectivity and repeatability, overcoming the biases and inconsistencies of manual scoring systems. Second, it provides a non-invasive and rapid diagnostic approach, reducing the need for invasive sampling or repeated handling that stresses animals and requires skilled labor. Third, RF sensing aligns with sustainability and welfare goals, as it enables early detection and targeted interventions, thereby reducing mortality, lowering drug use, and improving feed efficiency factors that directly influence greenhouse gas emissions per unit of production. These benefits are particularly relevant in resource-limited settings where cost-effective, scalable solutions are critical to long-term livestock productivity [21,22,23,24,25,26,27,28].
Despite these advantages, gaps in knowledge remain. The application of RF wave sensing in live small ruminants has not been extensively studied, and its ability to discriminate specific health-related physiological changes requires empirical validation [23,27]. Biological variability across breeds, ages, and production environments introduces challenges for developing robust predictive models [29,30,31]. Furthermore, while RF waves are theoretically well-suited for tissue characterization, their utility in differentiating subtle variations associated with parasitism or metabolic status in live animals has yet to be systematically investigated [30]. These uncertainties highlight the need for proof-of-concept studies to establish baseline evidence for feasibility and to guide future development of integrated animal health monitoring systems.
The present study addresses this gap by evaluating the feasibility of using a radiofrequency wave device operating between 2 and 18 GHz as a non-destructive proof-of-concept tool for small ruminant health monitoring. Specifically, this study investigates whether RF wave interactions with biological tissues can provide measurable signatures that may serve as proxies for physiological status. By generating and analyzing RF-based datasets, the goal is to assess the potential of this approach as a foundation for future multimodal sensing platforms. While the present work is exploratory, it is envisioned as a steppingstone toward the development of comprehensive animal health monitoring systems that integrate RF sensing with complementary modalities and AI-driven analytics to enhance precision, sustainability, and resilience in small ruminant production.
2. Materials and Methods
2.1. Animals and Housing
A total of eight intact male Spanish goats (Capra hircus) were used in this proof-of-concept study. The animals were 24 months of age and weighed between 36 and 50 kg at the time of data collection. All goats were maintained at the Fort Valley State University (FVSU) Agriculture Technology Center farm in Fort Valley, Georgia, USA. The animals were raised under standard husbandry conditions, with unrestricted access to fresh water and grazing pastures. Goats were managed on a mixed-grass pasture system that permitted natural exposure to gastrointestinal nematodes during the grazing season (March–September 2023). This natural grazing regime ensured that the animals developed physiological variability in parasitic status and hematological indicators (e.g., packed cell volume, PCV), under field conditions while allowing for the evaluation of radiofrequency (RF) sensing under realistic management scenarios.
2.2. Experimental Design
The proof of concept study employed a longitudinal, non-invasive design in which RF measurements were repeatedly collected from each goat at multiple body locations. Although only eight goats were used, the design leveraged repeated within-animal sampling to capture intra- and inter-individual variation in RF signatures over time. Four anatomical sides per goat (left lateral, right lateral, dorsal, and ventral regions) were selected for RF data acquisition, thereby maximizing spatial coverage of body tissues and physiological states. This approach yielded a robust dataset while minimizing animal numbers, in line with the 3Rs principle (Replacement, Reduction, and Refinement) of ethical animal use.
2.3. Radio-frequency Wave Data Collection
Radio-frequency wave signals were collected using a custom-designed radiofrequency device (Compass technology group, LLC, Alpharetta, GA) configured to emit and record signals across a frequency range of 2 to 18 GHz. This spectrum was selected because it spans both ultra-high frequency (UHF) and super-high frequency (SHF) bands, enabling sufficient penetration and interaction with soft tissues, while preserving sensitivity to dielectric properties of biological material. For each anatomical side, a total of 1,601 discrete frequencies were scanned, resulting in 6,404 data points per animal per session of 5-10 seconds. Across all eight goats, the experiment produced a cumulative dataset of 51,232 raw RF observations. Measurements were conducted with the animals in a standing, restrained position to minimize movement noises, and the device was held at a standardized distance (15 cm) and orientation relative to the body surface to ensure measurement consistency.
2.4. Data Preprocessing
Following data collection, RF data were exported for preprocessing and modeling. Raw frequency-domain measurements were first subjected to data cleaning procedures to remove noise caused by environmental condition, motion, or equipment fluctuations. Standard signal processing steps included filtering, normalization, and frequency-domain smoothing. Cleaned data were subsequently prepared for machine learning model development, where frequency signatures could be evaluated as predictors of physiological or health-related conditions. While the present study focused on proof-of-concept data characterization, preprocessing was conducted in alignment with best practices for RF signal analysis to enable reproducibility and downstream integration into predictive analytics pipelines by following Siddique et al. [19].
2.5. Ethical Considerations
All animal use protocols were reviewed and approved by the Fort Valley State University Agricultural and Laboratory Animal Care and Use Committee (ALACUC approval number F-T-01-2022). The study was designed to comply fully with institutional and national regulations governing animal welfare. In particular, care was taken to reduce conditions that could lead to mortality or distress in the experimental goats, especially those associated with low PCV values caused by parasitic infection. No animals were sacrificed for this study, and all goats were monitored daily by trained personnel for health and welfare throughout the experimental period. The study adhered to the guiding principles of minimizing animal numbers, refining procedures to reduce stress, and replacing invasive techniques with non-invasive monitoring approaches whenever feasible.
3. Data Analysis
The raw RF data collected from the device, consisting of both amplitude and phase components across the 2–18 GHz frequency range, were exported for computational processing. Data preprocessing and statistical analyses were conducted using Python and JMP Pro 16.0 (SAS Institute Inc., Cary, NC, USA). The analytical workflow was designed to systematically clean, screen, and extract meaningful frequency-domain features associated with physiological variation, while minimizing the risk of spurious findings inherent with high-dimensional datasets [19].
Initial data screening was performed to identify and remove noise that could arise from environmental interference, device variability, or motion during measurement. To reduce false positives and control for Type I error rates, a false discovery rate (FDR) analysis was applied to the complete RF spectrum [32]. This approach allowed us to filter out spurious associations and retain only frequencies with a high likelihood of biological relevance. Subsequently, the Predictor Screening (PS) module in JMP Pro was employed, using a Bootstrap Forest algorithm, to isolate frequency ranges most strongly associated with classification outcomes [33]. The combination of FDR and Bootstrap Forest screening ensured that the retained predictors were statistically robust and biologically interpretable.
From this two-step screening process, the top ten discriminative frequencies were selected for further analysis. These frequencies were then subjected to variable clustering, which enabled dimensionality reduction by grouping correlated frequencies into clusters. Each cluster represented a set of RF “signature frequencies” potentially linked to distinct physiological states. This variable clustering step [32] allowed for the identification of frequency subsets that were most informative for health status classification while reducing redundancy in the predictor space. The outcome variable was defined by FAMACHA scoring, a widely used field proxy for anemia in small ruminants [34]. In the dataset, goats were classified into three ordinal categories: FAMACHA 1 (healthy), FAMACHA 2 (healthy/mild risk), and FAMACHA© 3 (borderline anemia) [35]. However, the class distribution was imbalanced, with relatively fewer observations in the healthy category. To mitigate the risk of biased model performance caused by class imbalance, the Synthetic Minority Over-sampling Technique (SMOTE) was employed. SMOTE generated synthetic instances of the minority class, thereby balancing the dataset and enhancing the model’s ability to discriminate across all health categories [36,37,38,39].
For predictive modeling, the cleaned and balanced dataset was used to train multi-class classification models in Python. A nested 10-fold cross-validation framework was adopted to provide an unbiased estimate of model performance and to minimize overfitting [19,40,41]. The outer loop of the nested design was used to evaluate generalization performance, while the inner loop optimized model hyperparameters [42,43,44]. Performance metrics included accuracy, precision, recall, and area under the receiver operating characteristic curve (AUROC), which were calculated for each class. This combined workflow comprising FDR-based screening, frequency clustering, data balancing via SMOTE, and rigorous nested cross-validation, which provided a robust and reproducible pipeline for evaluating the diagnostic potential of RF wave signatures. By integrating statistical rigor with machine learning approaches, this study established a foundational methodology for linking RF signal variation with physiological markers of health in small ruminants.
3. Results and Discussion
3.1. Variable Clustering
Variable clustering of the top ten radio frequencies selected for RF-based detection of small ruminants health yielded different outcomes depending on FAMACHA score. For animals classified under FAMACHA© Score 1 (non-anemic), a single cluster consisting of nine frequency variables was formed, with 8.43 GHz identified as the most representative frequency. This cluster explained 93.7% of the total variation, suggesting that the dielectric response of tissues in healthy animals is highly consistent and can be effectively summarized using a single, low-GHz frequency. The spectral uniformity at this stage implies optimal physiological conditions, where tissue hydration, blood content, and cell structure contribute to stable RF reflectance behavior. Dielectric properties are essential to understanding how biological tissues interact with electromagnetic fields, including RF waves. A study by Ley et al. [45] describes the frequency-dependent dielectric properties of various animal tissues, including liver, muscle, fat, and blood, emphasizing the relevance of low-GHz frequencies for characterizing healthy tissue structures [45,46]. Their findings demonstrate that within this frequency range, dielectric responses are reliable, enabling precise monitoring that could assist in diagnostic applications. The ability to summarize these responses at low frequencies simplifies the diagnostic process and provides a direct connection between physiological health indicators and RF reflectance properties. The RF signal at 8.43 GHz likely interacts primarily with extracellular water content and cell membrane polarization, which are stable in healthy goats.
In animals scored as FAMACHA© Score 2 (moderately healthy), clustering also resulted in a single cluster of nine members, with 9.33 GHz emerging as the most representative frequency. This cluster explained 88.7% of total variation. While similar in structure to the healthy group, the shift from 8.43 GHz to 9.33 GHz may reflect early-stage physiological changes such as reduced hemoglobin, mild dehydration, or subclinical muscle atrophy. Antanaitis et al. [47] stated that changes in ruminal health can lead to significant physiological alterations, including dehydration and hemoconcentration, which can subsequently affect RF dielectric responses in tissues. Dehydration leads to lower tissue water content [48], resulting in altered dielectric properties at certain RF frequencies. In small ruminants, a hydrated state typically correlates with stable dielectric characteristics at low frequencies, whereas deviations may indicate stress or health issues. The lower proportion of explained variation compared to the healthy group suggests increasing heterogeneity in tissue dielectric properties, though still largely describable by a single frequency.
The clustering pattern changed more notably for animals with FAMACHA© Score 3 (borderline anemic). Two distinct clusters were identified, with representative frequencies at 9.89 GHz (Cluster 1; 6 members) and 8.23 GHz (Cluster 2; 3 members). These clusters individually explained 87.1% and 98.9% of the variation within their respective clusters, contributing to a combined variation explanation of 91.0% (Figure 1). The fragmentation into two clusters and the frequency dispersion suggests that borderline anemia introduces greater variability in the tissue’s electromagnetic response. This may result from more profound physiological changes such as poor blood perfusion, muscle loss, or electrolyte imbalance, leading to divergence in RF signal behavior across tissues [47,48]. These conditions result in spatial heterogeneity in tissue dielectric properties. The need for two clusters suggests that different tissue layers or physiological features dominate at different frequency ranges, perhaps shallow vs. deeper tissue penetration. The body no longer reflects RF energy uniformly, and classification models must therefore rely on more than one frequency band to capture this complexity.
Overall, these results show a progressive spectral shift and increasing variation in frequency clustering as anemia severity increases. The most representative frequencies moved from 8.43 GHz (Score 1) to 9.33 GHz (Score 2) and then split into 9.89 GHz and 8.23 GHz (Score 3) (Figure 1). The transition from a single-cluster structure in healthier animals to a two-cluster profile in borderline animals highlights the added complexity and heterogeneity of tissue response under stress. These findings reinforce the idea that a narrow frequency band may suffice for early decrease in animal health detection, whereas advanced cases require a broader spectral analysis for accurate classification. Such frequency-specific insights can inform sensor design and help optimize machine learning classifiers for anemia detection in small ruminants under field conditions.
4.2. Regression Analysis: RF Waves Predicting FAMACHA© Scores
To evaluate the feasibility of using radiofrequency (RF) waves derived features as predictive biomarkers for anemia severity in goats, we implemented and compared both regression and classification models following SMOTE-based class balancing and 10-fold cross-validation [40,41]. The objective was twofold: (1) to accurately predict FAMACHA© scores as a regression task, and (2) to classify animals into discrete anemia categories using supervised learning classifiers. Three regression models were tested: Linear Regression (LR), Random Forest Regressor (RFR), and Support Vector Regression (SVR). Linear Regression model for predictive analytics demonstrated a perfect R² of 1.00 (Figure 2), along with near-zero MAE (0.00), MSE (0.00), and RMSE (0.00), suggesting an exact linear relationship between the selected RF frequency features and the FAMACHA© score. While this may imply exceptional predictive capability, such perfect values requires further investigation to rule out potential model overfitting or data leakage despite careful validation safeguards.
Random Forest showed strong performance with an R² of 0.79 (Figure 3) and low error metrics (MAE: 0.02, MSE: 0.00, RMSE: 0.07), indicating it effectively captures non-linear relationships between RF wave patterns and anemia severity. Unlike linear regression, Random Forest introduces robustness against outliers and noise—characteristics inherently expected in biological systems like small ruminant health (Figure 3).
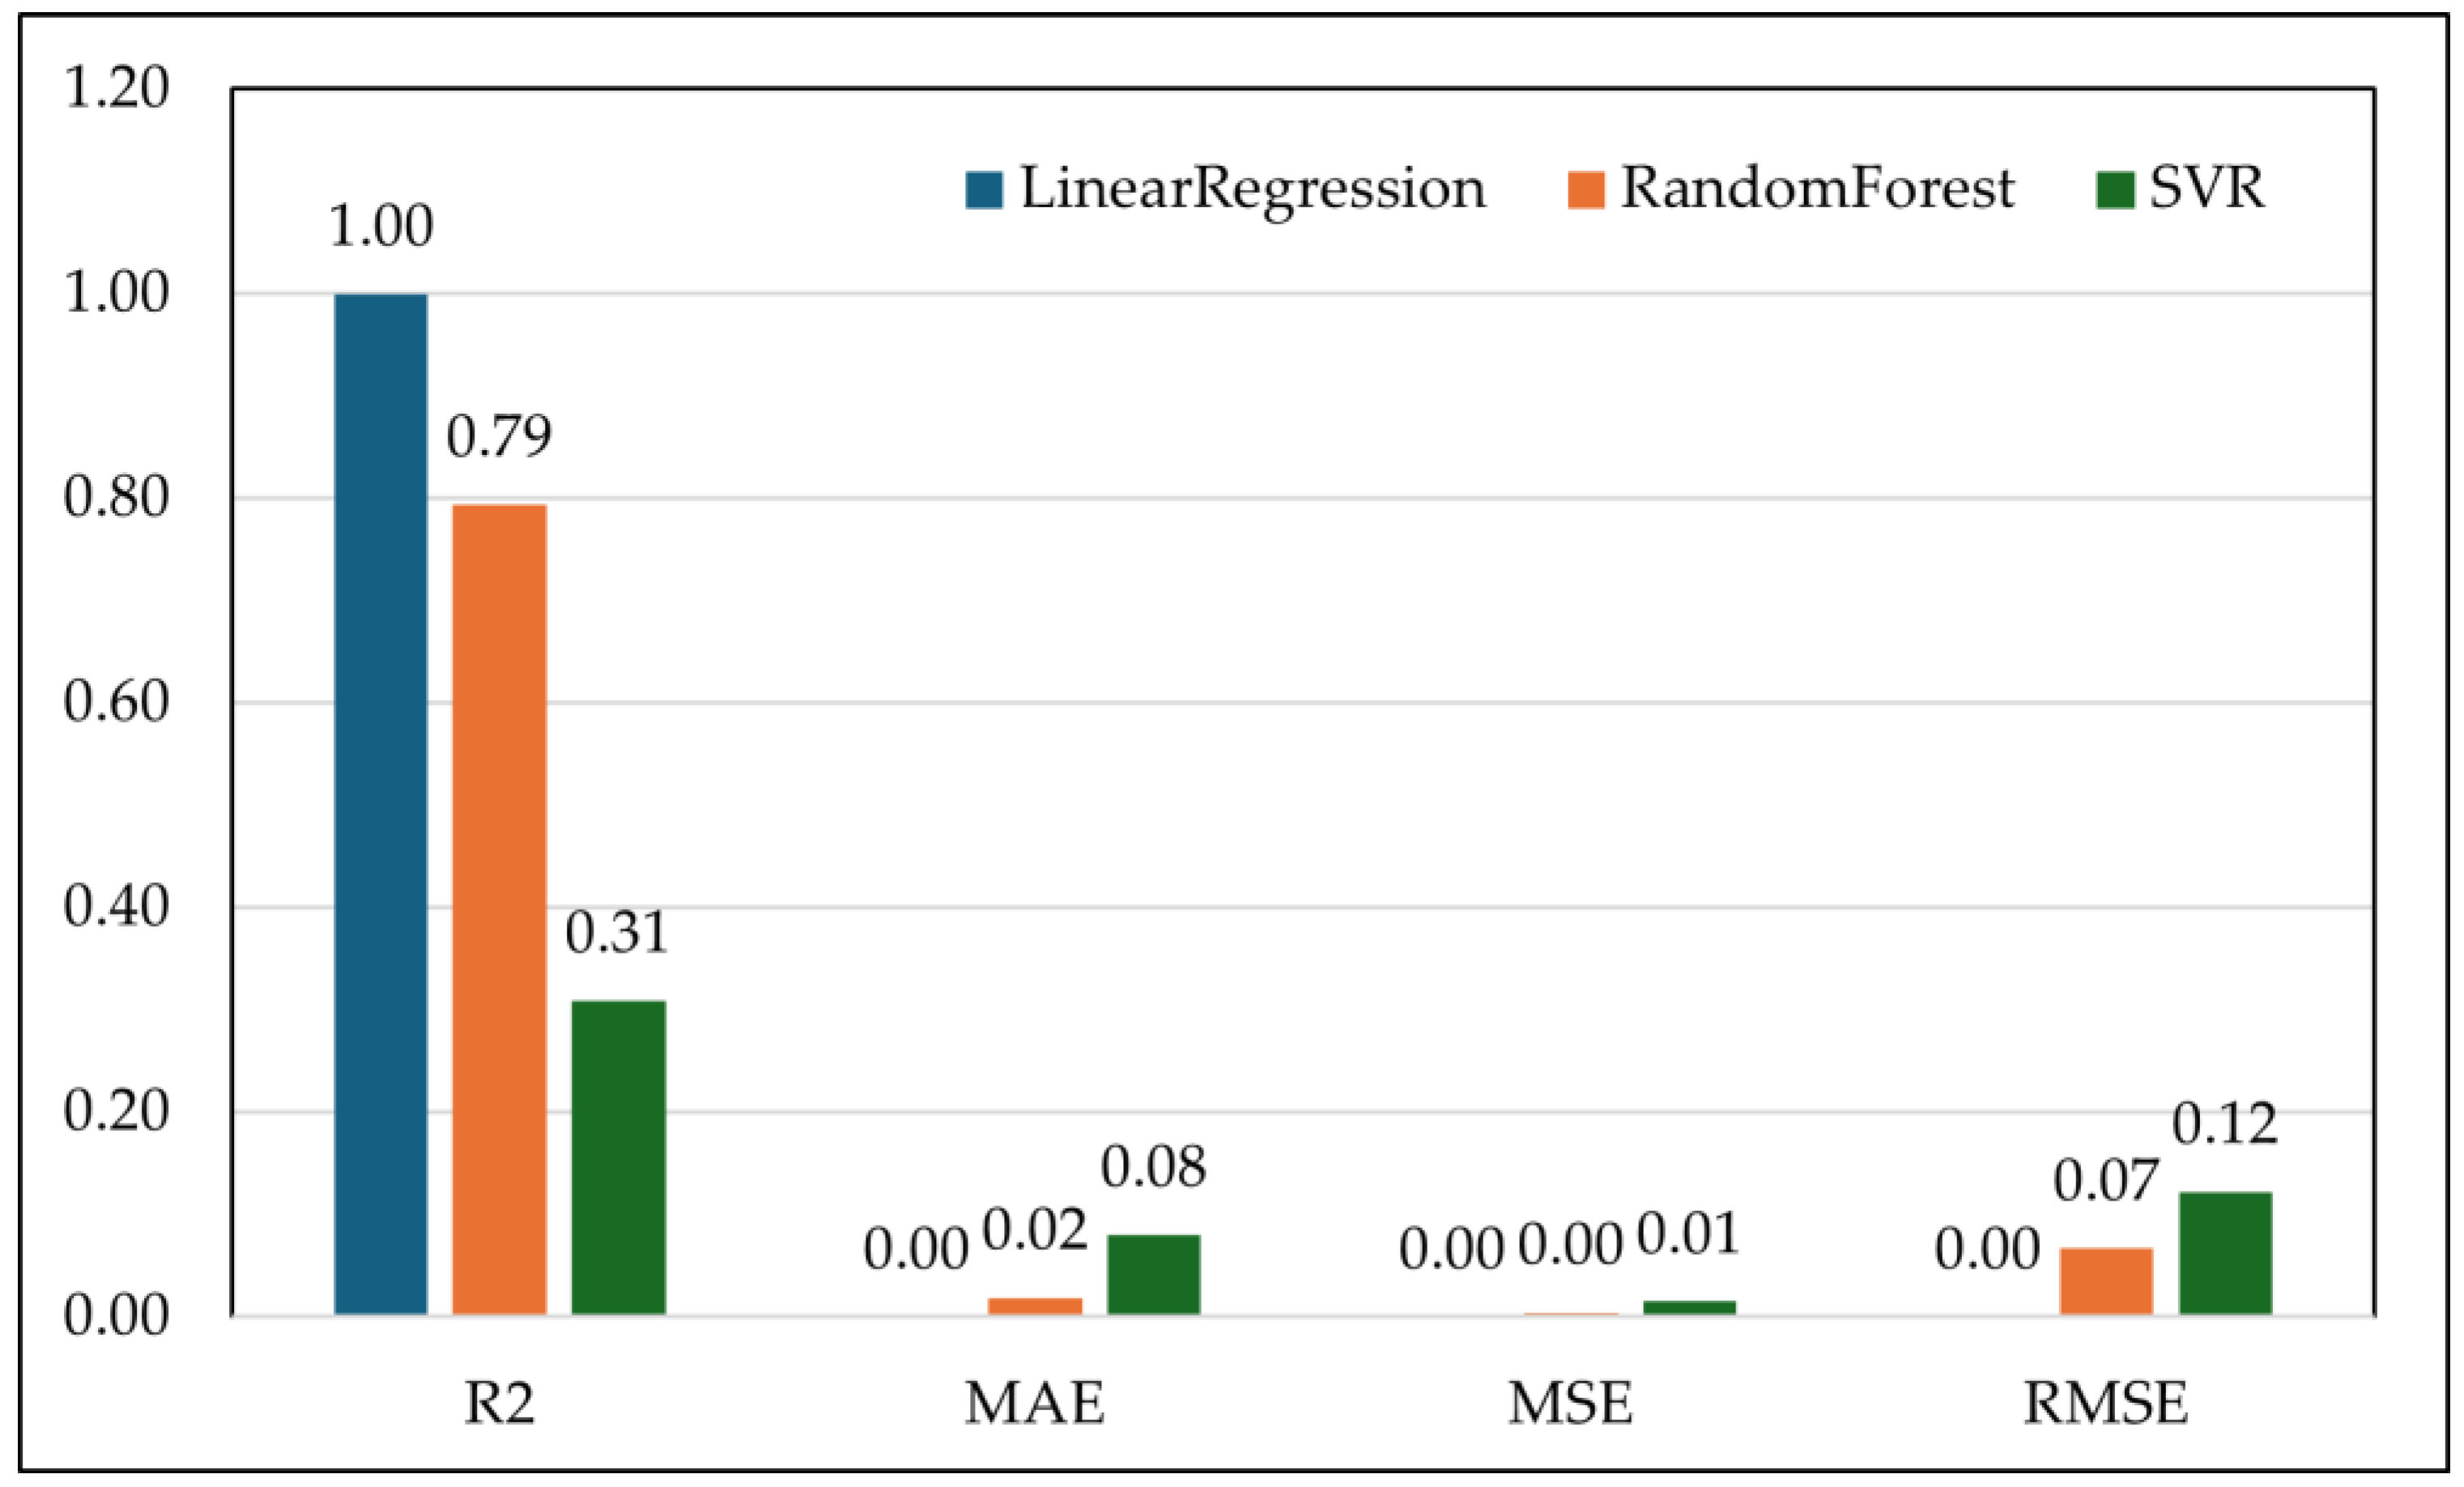
SVR underperformed relative to the other two models, with an R² of just 0.31 (Figure 4) and notably higher error rates (MAE: 0.08, MSE: 0.01, RMSE: 0.12). This suggests that SVR struggled to model the relationship between RF features and FAMACHA© scores, potentially due to sensitivity to the data scaling or the kernel choice being insufficient for the signal complexity present in the RF data. The regression results indicate that RF waves hold significant promise as non-invasive diagnostic features for monitoring physiological changes in goats related to anemia. A high R² value suggests that shifts in electromagnetic signal absorption or reflection across specific frequency bands correspond meaningfully with capillary refill signs underlying the FAMACHA© scoring system (Figure 5). This supports the hypothesis that tissue hydration, hemoglobin concentration, and circulatory status nfluencing FAMACHA©, alter, altering the dielectric properties measurable by RF waves.
4.3. Classification Analysis: RF waves features for Discrete Animal health Detection
To assess the potential of RF wave derived features for categorical prediction of animal health, three classification algorithms were tested: Multilayer Perceptron (MLP), Support Vector Machine (SVM), and K-Nearest Neighbors (KNN). These models were trained on the top ten RF frequencies selected as the most representative of FAMACHA© classes, ensuring that only biologically relevant signals were used in the classification process.
The multi-layer perceptron (MLP) classifier achieved the highest performance across all metrics, with an accuracy of 84%, precision, recall, and F1-score of 83, and a 94% of ROC-AUC. These results indicate that MLP effectively captured the non-linear and multi-dimensional interactions [49,50,51,52] among RF frequencies that characterize subtle gradations of anemia. Neural networks excel at modeling complex data distributions, and in this context, MLP’s superior ability to learn from overlapping class boundaries reflects the nuanced electromagnetic differences [53,54] between healthy, mildly, and borderline anemic goats. The architecture of MLPs, with their layers of interconnected neurons, enables these networks to learn from and adapt to the intricacies of data, making them effective for tasks that involve complex, non-linear relationships among features. Moreover, MLPs have been noted for their faster convergence and improved generalization compared to other neural network types, which makes them suitable for applications requiring quick model training on varied input data [53]. This rapid processing can be particularly advantageous in scenarios involving real-time monitoring of small ruminants, where timely intervention is critical and system responsiveness is essential. One of the strengths of MLPs is their ability to manage overlapping class boundaries. In the context of RF-based diagnostics, subtle changes in tissue dielectric properties resulting from conditions such as dehydration or muscle atrophy may not be readily distinguishable using traditional methods. However, MLPs can effectively learn these patterns through supervised training, recognizing patterns within the spectral data that would otherwise be challenging for simpler models to classify accurately [54]. The application of MLPs in such contexts not only provides improved classification accuracy but also enhances the interpretability of the underlying electromagnetic data, thereby facilitating better animal health monitoring. This capability is crucial, as anemia does not progress in discrete jumps, but along a continuum of physiological deterioration.
The SVM model analysis produced moderate results (Accuracy: 67%; F1-score: 67%; ROC-AUC: 83%) (Figure 1). SVM’s strength lies in its ability to create separating hyperplanes in high-dimensional feature space. Higher ROC-AUC suggests that SVM could distinguish broad anemia categories; however, its lower accuracy and F1-score imply difficulty in resolving fine-grained differences between neighboring classes (e.g., FAMACHA© 2 vs. FAMACHA© 3). This limitation likely reflects the biological reality that electromagnetic changes in tissue are incremental and overlapping, meaning strict decision boundaries are insufficient for perfect classification. The KNN classifier performed least effectively (Accuracy: 60%; F1-score: 61%; ROC-AUC: 83%). While the ROC-AUC indicates that the RF signals carried some discriminatory power, KNN’s reliance on proximity-based classification in high-dimensional space likely led to misclassifications. The RF features are continuous and often noisy due to environmental and physiological variability (e.g., hydration levels, coat thickness), and such noise disproportionately affects distance-based methods like KNN. Consequently, KNN struggled to generalize in cases where anemia classes exhibited overlapping RF signal profiles.
Figure 6.
Comparison of classification performance across Multilayer Perceptron (MLP), Support Vector Machine (SVM), and K-Nearest Neighbors (KNN).
Figure 6.
Comparison of classification performance across Multilayer Perceptron (MLP), Support Vector Machine (SVM), and K-Nearest Neighbors (KNN).
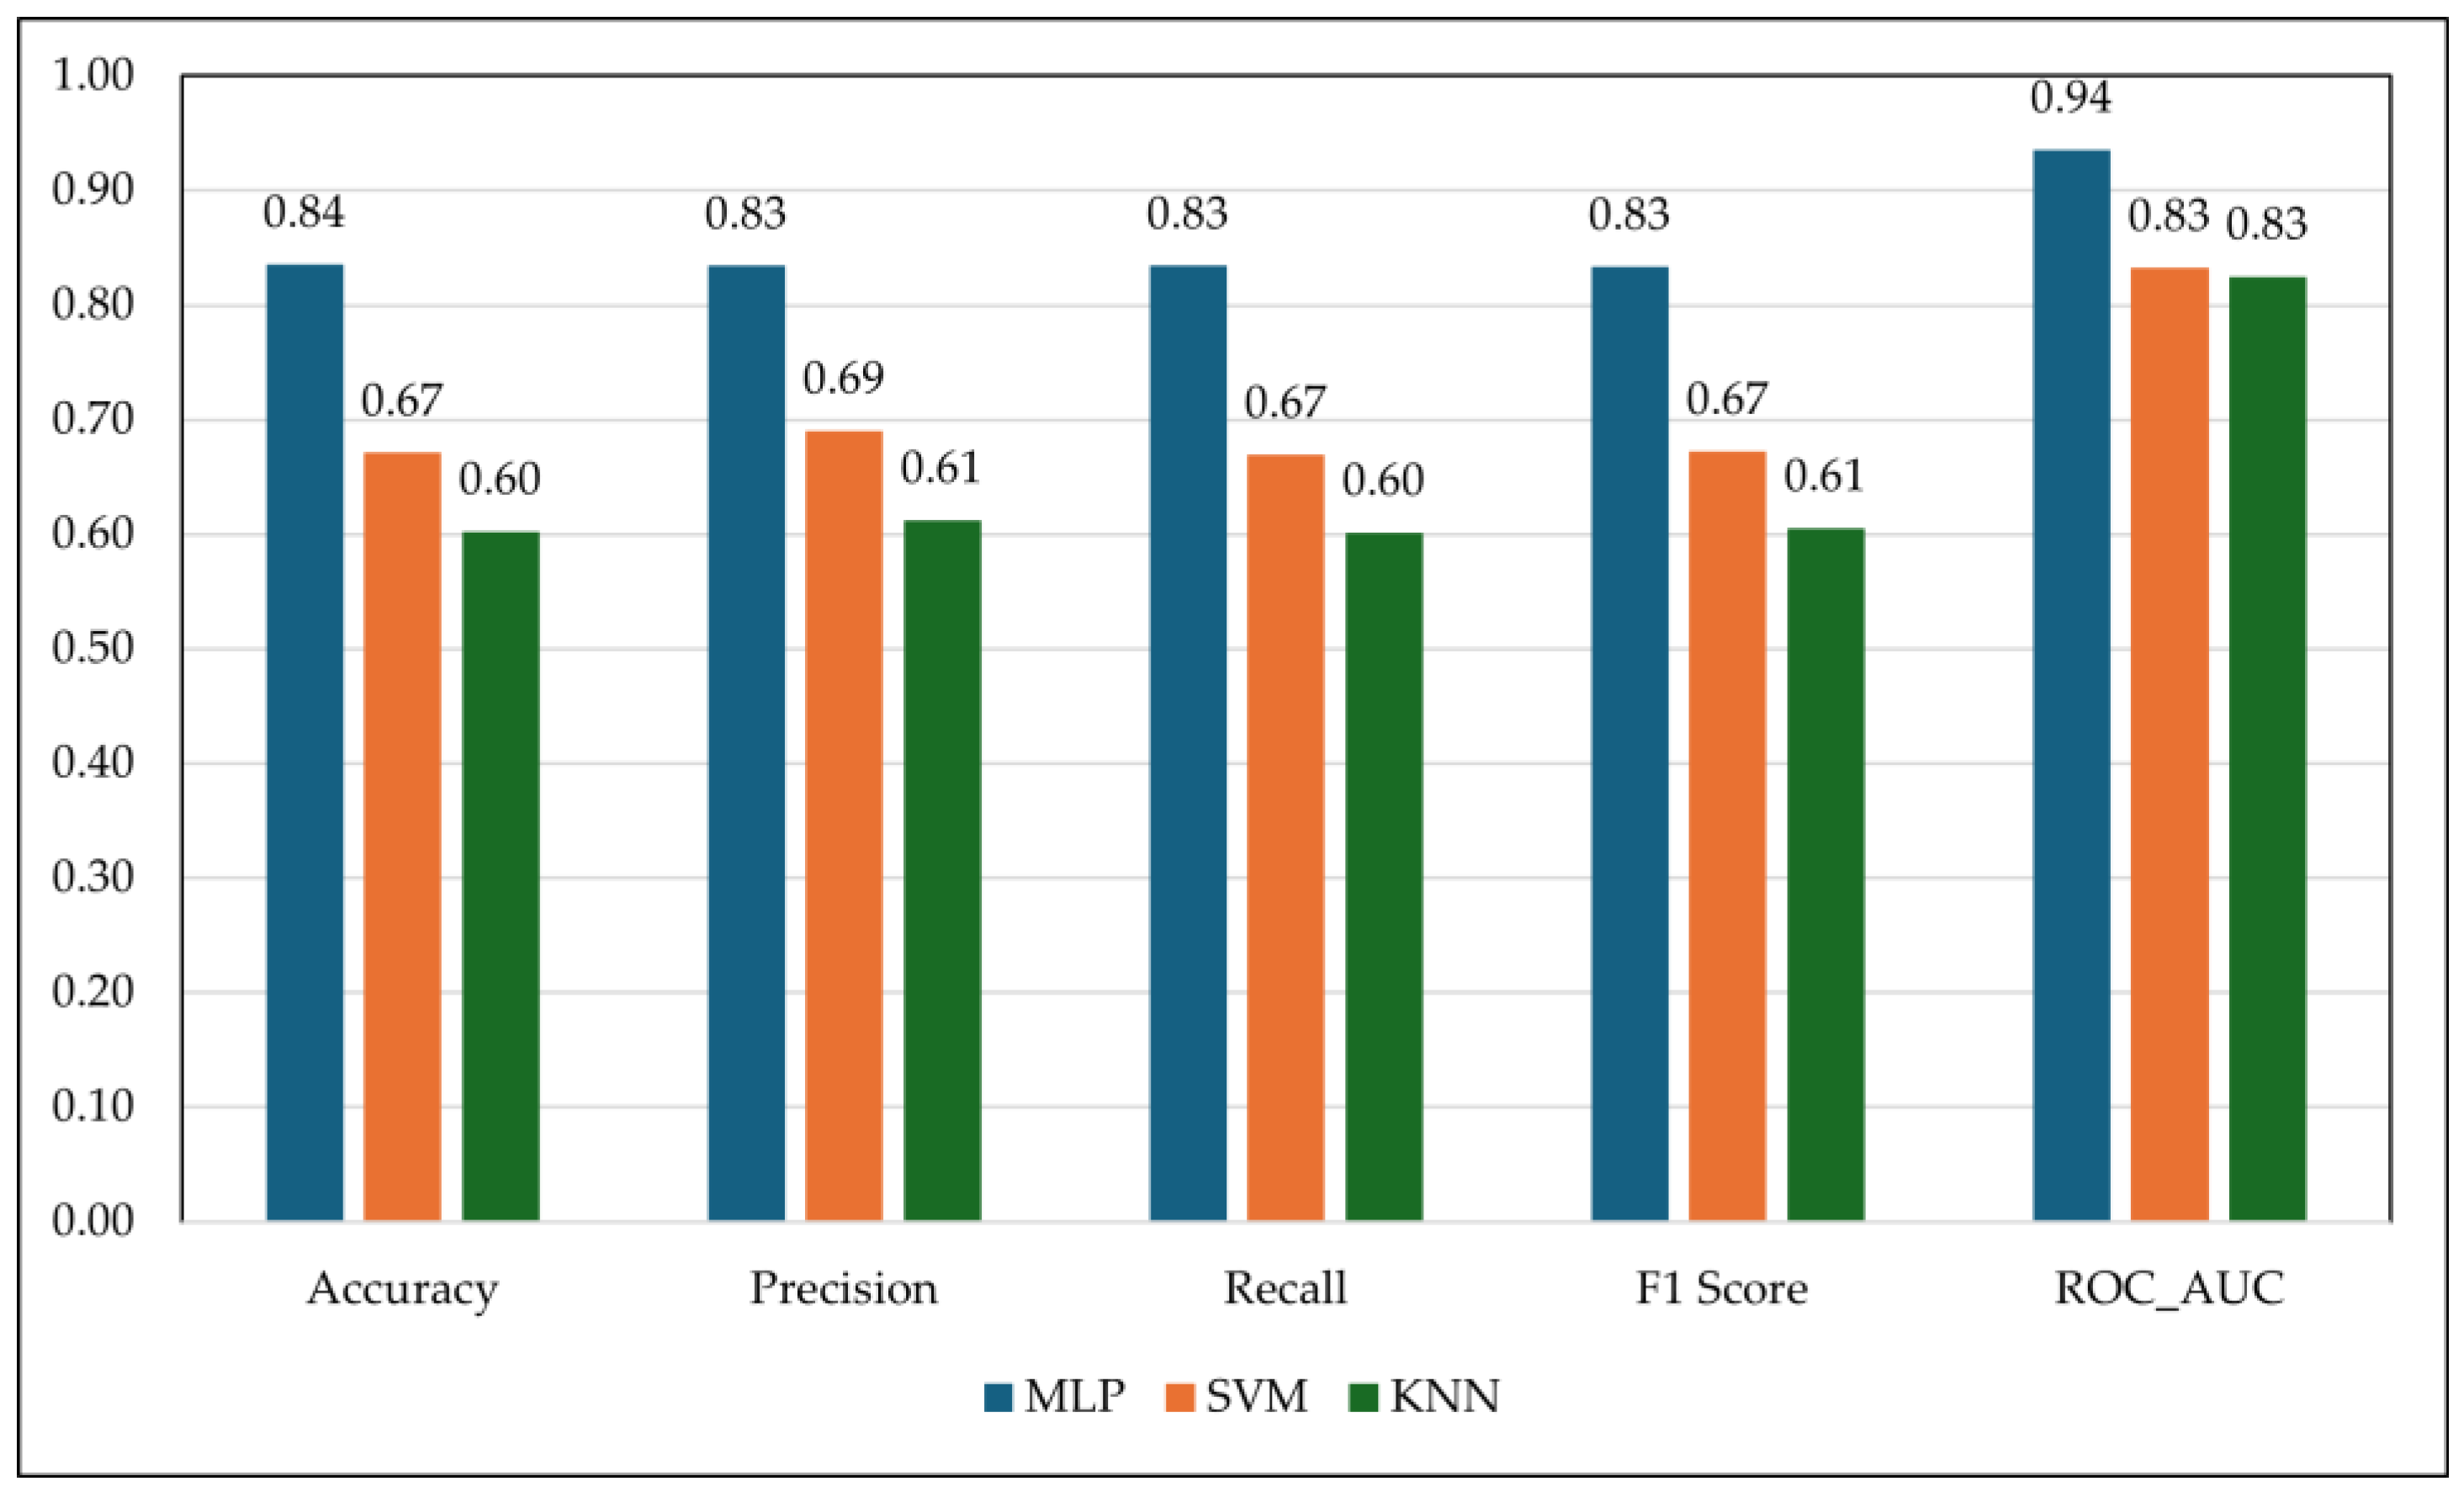
The classification results observed from this analysis confirms that RF waves interact with biological tissues in ways that reveal physiologically meaningful differences in animal health status. As anemia progresses, reductions in hemoglobin concentration, shifts in hydration, and altered microcirculation change the dielectric properties of tissues. These changes manifest as subtle but consistent frequency-dependent variations in RF wave absorption and reflection [55]. The superior performance of MLP highlights the feasibility of using machine learning to capture and classify these electromagnetic signatures with higher accuracy. By identifying non-linear patterns in RF data that correspond to physiological states, the MLP model demonstrates that RF-based sensing can move beyond theoretical potential to practical diagnostic application. Importantly, the classification accuracy achieved here is sufficient to support herd-level decision-making, such as identifying animals at risk of clinical anemia before severe productivity or welfare impacts occur.
This approach is potentially transformative in pastoral and resource-limited farming systems, where labor, equipment, and veterinary access are scarce. A lightweight RF sensing device coupled with a MLP classifier could provide farmers with a rapid, non-invasive, and repeatable diagnostic tool. Such technology would reduce reliance on manual FAMACHA© scoring, minimize observer bias, and enable more timely interventions against parasitic infections, ultimately supporting improved animal health, productivity, and sustainability.
6. Conclusions and Future Research:
This study illustrates the efficacy of radiofrequency (RF) wave characteristics as non-invasive markers for decreasing health in small ruminants. Variable clustering revealed a gradual spectrum divergence, depending on the degree of anemia severity. Healthy animals (FAMACHA© 1) were represented by an individual cluster centered at 8.43 GHz, accounting for 93.7% of the variation, while mildly affected animals (FAMACHA© 2) were moved to the signature frequency of 9.33 GHz, exhibiting less explanatory power at 88.7%. Borderline animals (FAMACHA© 3) necessitated two separate clusters (9.89 GHz and 8.23 GHz) to account for tissue heterogeneity, elucidating 91.0% of the total variation. The data suggest that the gradual development of anemia disturbs the uniform dielectric response of tissues, resulting in spectrum complexity that reflects different physiological changes in hemoglobin concentration, hydration state, and microcirculatory function.
Regression analyses yielded additional proof of the predictive capacity. The linear regression model showed an R² of 1.00 with minimal error, indicating a robust linear correlation between RF characteristics and FAMACHA© scores. Nevertheless, this near-optimal performance may indicate overfitting and necessitate further validation. The Random Forest model had strong predictive performance (R² = 0.79; RMSE = 0.07), effectively managing biological variability and noise, whereas Support Vector Regression exhibited weaker performance (R² = 0.31; RMSE = 0.12), reflecting its inadequate ability to capture intricate non-linearities in the collected radio-frequency data.
Classification analyses validated the viability of discrete animal health screening. The Multilayer Perceptron (MLP) attained superior performance (accuracy = 0.84; precision/recall/F1 = 0.83; ROC-AUC = 0.94), underscoring its efficacy in simulating non-linear, overlapping class boundaries. The Support Vector Machine's model yielded intermediate outcomes (accuracy = 0.67; F1 = 0.67), while the K-Nearest Neighbors exhibited the least effective performance (accuracy = 0.60; F1 = 0.61), presumably due to its susceptibility to noise in high-dimensional RF space.
These results collectively demonstrate proof of concept that RF waves detect physiologically significant dielectric signals of anemia in goats. This study lays the groundwork for the development of RF-based diagnostic instruments that offer rapid, consistent, and non-invasive health evaluations in resource-constrained environments, potentially leading to significant advancements in the field of small ruminant health.
Subsequent investigations should be concentrated on (i) validation utilizing extensive, multi-breed, and multi-environment datasets; (ii) longitudinal monitoring of RF responses during parasite challenges and subsequent recovery; (iii) enhancement of sensor design for depth of penetration and durability in the field; and (iv) incorporation of embedded machine learning models, especially neural networks, for real-time diagnostics on farms. Progressing in these areas will facilitate the transition of RF-based sensing from experimental validation to practical use in the management of sustainable small ruminant health.
Author Contributions
Conceptualization, A.S.; methodology, A.S., R.K, TT, J.V.W; validation, TT, A.S, R.K, G.K.I formal analysis, A.S., and TT; investigation, A.S., TT; O.S, J.V.W, G.K.I, R.K. D.B; data curation, D.B, G.K.I, R.K, A.S. and O.S; writing—original draft preparation, A.S.; writing—review and editing, O.S, T.T, J.V.W., and E.M; supervision, T.T. All authors have read and agreed to the published version of the manuscript.
Funding
No Funding
Institutional Review Board Statement
Not applicable
Informed Consent Statement
Not applicable.
Data Availability Statement
Data can be provided by corresponding authors upon reasonable request.
Acknowledgments
I would like to thank FVSU library resources for providing us with access to the databases. I would also like to thank my co-authors for their valuable insight during preparation of manuscript.
Conflicts of Interest
The authors declare no conflicts of interest.
References
- Sejian V, Silpa MV, Lees AM, Krishnan G, Devaraj C, Bagath M, Anisha JP, Reshma Nair MR, Manimaran A, Bhatta R, Gaughan JB. Opportunities, challenges, and ecological footprint of sustaining small ruminant production in the changing climate scenario. Agroecological footprints management for sustainable food system. 2020 Dec 17:365-96.
- Lu CD. The role of goats in the world: Society, science, and sustainability. Small Ruminant Research. 2023 Oct 1; 227:107056.
- Fauziah N, Aviani JK, Agrianfanny YN, Fatimah SN. Intestinal parasitic infection and nutritional status in children under five years old: a systematic review. Tropical medicine and infectious disease. 2022 Nov 12;7(11):371.
- Abdalhamed AM, Zeedan GS, Abou Zeina HA. Isolation and identification of bacteria causing mastitis in small ruminants and their susceptibility to antibiotics, honey, essential oils, and plant extracts. Veterinary world. 2018 Mar 26;11(3):355. [CrossRef]
- Dahhir H, Talb O, Asim M. Preliminary study of seroprevalence of border disease virus (bdv) among sheep and goats in mosul city, iraq. Adv. Anim. Vet. Sci. 2019;7(7):566-9.
- https://doi.org/10.17582/journal.aavs/2019/7.7.566.569. [CrossRef]
- Paul TK, Rahman MK, Haider MS, Saha SS. Fatal haemonchosis (H. contortus) in Garole sheep at coastal region in Bangladesh. Research in Agriculture Livestock and Fisheries. 2020 Apr 26;7(1):107-12. [CrossRef]
- Getachew T, Alemu B, Sölkner J, Gizaw S, Haile A, Gosheme S, Notter DR. Relative resistance of Menz and Washera sheep breeds to artificial infection with Haemonchus contortus in the highlands of Ethiopia. Tropical animal health and production. 2015 Jun;47(5):961-8. [CrossRef]
- Singh D, Swarnkar CP. Worm control approaches and their impact on status of anthelmintic resistance at an organized sheep farm. Indian Journal of Animal Sciences. 2017 May 1;87(5):568-72.
- Wagener MG, Neubert S, Punsmann TM, Wiegand SB, Ganter M. Relationships between body condition score (BCS), FAMACHA©-score and haematological parameters in alpacas (Vicugna pacos), and llamas (Lama glama) presented at the veterinary clinic. Animals. 2021 Aug 27;11(9):2517.
- Niciura SC, Sanches GM. Machine learning prediction of multiple anthelmintic resistance and gastrointestinal nematode control in sheep flocks. Revista Brasileira de Parasitologia Veterinária. 2024 Mar 18;33(1):e019023. [CrossRef]
- Moreira RT, de Alencar Mota AL, Câmara AC, Soto-Blanco B, Borges JR. FAMACHA©: Predictive value for control of Haemochus sp. in sheep from Brazilian Cerrado. Semina: Ciências Agrárias. 2021 Jul 2;42(5):2825-38. [CrossRef]
- Sajovitz F, Adduci I, Yan S, Wiedermann S, Tichy A, Joachim A, Wittek T, Hinney B, Lichtmannsperger K. Correlation of Faecal Egg Counts with Clinical Parameters and Agreement between Different Raters Assessing FAMACHA©, BCS and Dag Score in Austrian Dairy Sheep. Animals. 2023 Oct 13;13(20):3206. [CrossRef]
- Singh D, Swarnkar CP. Worm control approaches and their impact on status of anthelmintic resistance at an organized sheep farm. Indian Journal of Animal Sciences. 2017 May 1;87(5):568-72. [CrossRef]
- Walker JG, Ofithile M, Tavolaro FM, van Wyk JA, Evans K, Morgan ER. Mixed methods evaluation of targeted selective anthelmintic treatment by resource-poor smallholder goat farmers in Botswana. Veterinary Parasitology. 2015 Nov 30;214(1-2):80-8. [CrossRef]
- Rebez EB, Sejian V, Silpa MV, Kalaignazhal G, Thirunavukkarasu D, Devaraj C, Nikhil KT, Ninan J, Sahoo A, Lacetera N, Dunshea FR. Applications of artificial intelligence for heat stress management in ruminant livestock. Sensors. 2024 Sep 11;24(18):5890.
- Mehrotra P, Chatterjee B, Sen S. EM-wave biosensors: A review of RF, microwave, mm-wave and optical sensing. Sensors. 2019 Feb 27;19(5):1013.
- Vander Vorst A, Rosen A, Kotsuka Y, Djajaputra D. RF/microwave interaction with biological tissues. Medical Physics. 2007 Feb 1;34(2):786-7.
- O’Brien C, Alamar MC. An overview of non-destructive technologies for postharvest quality assessment in horticultural crops. The Journal of Horticultural Science and Biotechnology. 2025 Apr 14:1-9.
- Siddique A, Gupta A, Sawyer J, Garner LJ, Morey A. Rapid detection of poultry meat quality using S-band to KU-band radio-frequency waves combined with machine learning—A proof of concept. Journal of Food Science. 2024 Dec;89(12):9608-21.
- Origlia C, Rodriguez-Duarte DO, Tobon Vasquez JA, Bolomey JC, Vipiana F. Review of microwave near-field sensing and imaging devices in medical applications. Sensors. 2024 Jul 12;24(14):4515.
- Nie L. , Berckmans D. , Wang C. , & Li B.. Is continuous heart rate monitoring of livestock a dream or is it realistic? a review. Sensors 2020;20(8):2291. [CrossRef]
- Khunteta S. , Saikrishna P. , Agrawal A. , Kumar A. , & Chavva A.. Rf-sensing: a new way to observe surroundings. IEEE Access 2022;10:129653-129665. [CrossRef]
- Dayoub M. , Shnaigat S. , Tarawneh R. , Al-Yacoub A. , Al-Barakeh F. , & Al-Najjar K.. Enhancing animal production through smart agriculture: possibilities, hurdles, resolutions, and advantages. Ruminants 2024;4(1):22-46. [CrossRef]
- Bhatt C. , Henderson S. , Brzozek C. , & Benke G.. Instruments to measure environmental and personal radiofrequency-electromagnetic field exposures: an update. Physical and Engineering Sciences in Medicine 2022;45(3):687-704. [CrossRef]
- Sinclair M. , Zhang Y. , Descovich K. , & Phillips C.. Farm animal welfare science in china—a bibliometric review of chinese literature. Animals 2020;10(3):540. [CrossRef]
- Balehegn M. , Duncan A. , Tolera A. , Ayantunde A. , Issa S. , Karimou M. et al.. Improving adoption of technologies and interventions for increasing supply of quality livestock feed in low- and middle-income countries. Global Food Security 2020;26:100372. [CrossRef]
- Kopler I. , Marchaim U. , Tikász I. , Opaliński S. , Kokin E. , Mallinger K. et al.. Farmers’ perspectives of the benefits and risks in precision livestock farming in the eu pig and poultry sectors. Animals 2023;13(18):2868. [CrossRef]
- Adesogan AT, Gebremikael MB, Varijakshapanicker P, Vyas D. Climate-smart approaches for enhancing livestock productivity, human nutrition, and livelihoods in low-and middle-income countries. Animal Production Science. 2025 Apr 14;65(6).
- Lhermie G. , Pica-Ciamarra U. , Newman S. , Raboisson D. , & Waret-Szkuta A.. Impact of peste des petits ruminants for sub-saharan african farmers: a bioeconomic household production model. Transboundary and Emerging Diseases 2021;69(4). [CrossRef]
- Al-Salihi K.. The epidemiology of foot-and-mouth disease outbreaks and its history in iraq. Veterinary World 2019;12(5):706-712. [CrossRef]
- Fu L. , Wang L. , Liu L. , Zhang L. , Zhou Z. , Zhou Y. et al.. Effects of inoculation with active microorganisms derived from adult goats on growth performance, gut microbiota and serum metabolome in newborn lambs. Frontiers in Microbiology 2023;14. [CrossRef]
- Bogomolov M, Peterson CB, Benjamini Y, Sabatti C. Hypotheses on a tree: new error rates and testing strategies. Biometrika. 2021 Sep 1;108(3):575-90.
- Rahman MS, Al-Farsi K, Al-Maskari SS, Al-Habsi NA. Stability of electronic nose (e-nose) as determined by considering date-pits heated at different temperatures. International journal of food properties. 2018 Jan 1;21(1):850-7.
- Burke JM, Kaplan RM, Miller JE, Terrill TH, Getz WR, Mobini S, Valencia E, Williams MJ, Williamson LH, Vatta AF. Accuracy of the FAMACHA system for on-farm use by sheep and goat producers in the southeastern United States. Veterinary parasitology. 2007 Jun 20;147(1-2):89-95.
- Van Wyk JA, Bath GF. The FAMACHA system for managing haemonchosis in sheep and goats by clinically identifying individual animals for treatment. Veterinary research. 2002 Sep 1;33(5):509-29.
- Bhagat RC, Patil SS. Enhanced SMOTE algorithm for classification of imbalanced big-data using random forest. In2015 IEEE international advance computing conference (IACC) 2015 Jun 12 (pp. 403-408). IEEE.
- Wang S, Dai Y, Shen J, Xuan J. Research on expansion and classification of imbalanced data based on SMOTE algorithm. Scientific reports. 2021 Dec 15;11(1):24039.
- Blagus R, Lusa L. SMOTE for high-dimensional class-imbalanced data. BMC bioinformatics. 2013 Mar 22;14(1):106.
- Hussin SK, Abdelmageid SM, Alkhalil A, Omar YM, Marie MI, Ramadan RA. Handling imbalance classification virtual screening big data using machine learning algorithms. Complexity. 2021;2021(1):6675279.
- Yates LA, Aandahl Z, Richards SA, Brook BW. Cross validation for model selection: a review with examples from ecology. Ecological Monographs. 2023 Feb;93(1):e1557.
- Malakouti SM. Babysitting hyperparameter optimization and 10-fold-cross-validation to enhance the performance of ML methods in predicting wind speed and energy generation. Intelligent Systems with Applications. 2023 Sep 1; 19:200248.
- Ali H, Muthudoss P, Chauhan C, Kaliappan I, Kumar D, Paudel A, Ramasamy G. Machine learning-enabled NIR spectroscopy. Part 3: hyperparameter by design (HyD) based ANN-MLP optimization, model generalizability, and model transferability. AAPS PharmSciTech. 2023 Dec 7;24(8):254.
- Grefenstette E, Amos B, Yarats D, Htut PM, Molchanov A, Meier F, Kiela D, Cho K, Chintala S. Generalized inner loop meta-learning. arXiv preprint arXiv:1910.01727. 2019 Oct 3.
- Srinivasan DV, Moradi M, Komninos P, Zarouchas D, Vassilopoulos AP. A generalized machine learning framework to estimate fatigue life across materials with minimal data. Materials & Design. 2024 Oct 1; 246:113355.
- Ley S. , Schilling S. , Fišer O. , Vrba J. , Sachs J. , & Helbig M.. Ultra-wideband temperature dependent dielectric spectroscopy of porcine tissue and blood in the microwave frequency range. Sensors 2019;19(7):1707. [CrossRef]
- Spliethoff J. , Tanis E. , Evers D. , Hendriks B. , Prevoo W. , & Ruers T.. Monitoring of tumor radio frequency ablation using derivative spectroscopy. Journal of Biomedical Optics 2014;19(9):097004. [CrossRef]
- Antanaitis R. , Džermeikaitė K. , Krištolaitytė J. , Stankevičius R. , Daunoras G. , Televičius M. et al.. Changes in parameters registered by innovative technologies in cows with subclinical acidosis. Animals 2024;14(13):1883. [CrossRef]
- Meyer JP, McAvoy KE, Jiang J. Rehydration capacities and rates for various porcine tissues after dehydration. PLoS One. 2013 Sep 4;8(9):e72573.
- Gong A, Wei X, Liu Y, Chen Z, Fan B, Jia A, Wu S. SSA-sMLP: A venous thromboembolism risk prediction model using separable self-attention and spatial-shift multilayer perceptrons. Thrombosis Research. 2025 May 6:109334.
- Huan R, Ji L, Lu H, Zheng S, Chen P, Liang R. MUDIFEI: Multi-dimensional Feature Extraction and Interaction Model for Human Transition Action Recognition based on Sensor Data. IEEE Sensors Journal. 2025 Jul 23(99):1-.
- Poddar H. From neurons to networks: Unravelling the secrets of artificial neural networks and perceptrons. InDeep Learning in Engineering, Energy and Finance 2024 Dec 26 (pp. 25-79). CRC Press.
- Rahman MM. A Deep Learning Approach for Computational Electromagnetics. McGill University (Canada); 2023.
- Ayodele B. , Mustapa S. , Kanthasamy R. , Zwawi M. , & Cheng C.. Modeling the prediction of hydrogen production by co-gasification of plastic and rubber wastes using machine learning algorithms. International Journal of Energy Research 2021;45(6):9580-9594. [CrossRef]
- Taki O. , Rhazi K. , & Mejdoub Y.. Stirling engine optimization using artificial neural networks algorithm. ITM Web of Conferences 2023;52:02010. [CrossRef]
- Santorelli A, Abbasi B, Lyons M, Hayat A, Gupta S, O’Halloran M, Gupta A. Investigation of anemia and the dielectric properties of human blood at microwave frequencies. IEEE Access. 2018 Oct 2;6:56885-92.
Figure 1.
Proportion of variation explained by clustered Radio-frequency wave variables across FAMACHA© scores. Each bar represents a cluster of frequency variables grouped by similarity, with the most representative frequency labeled. X axis represents proportion of variation explained; and Y axis represents cluster numbers within each FAMACHA© categeory.
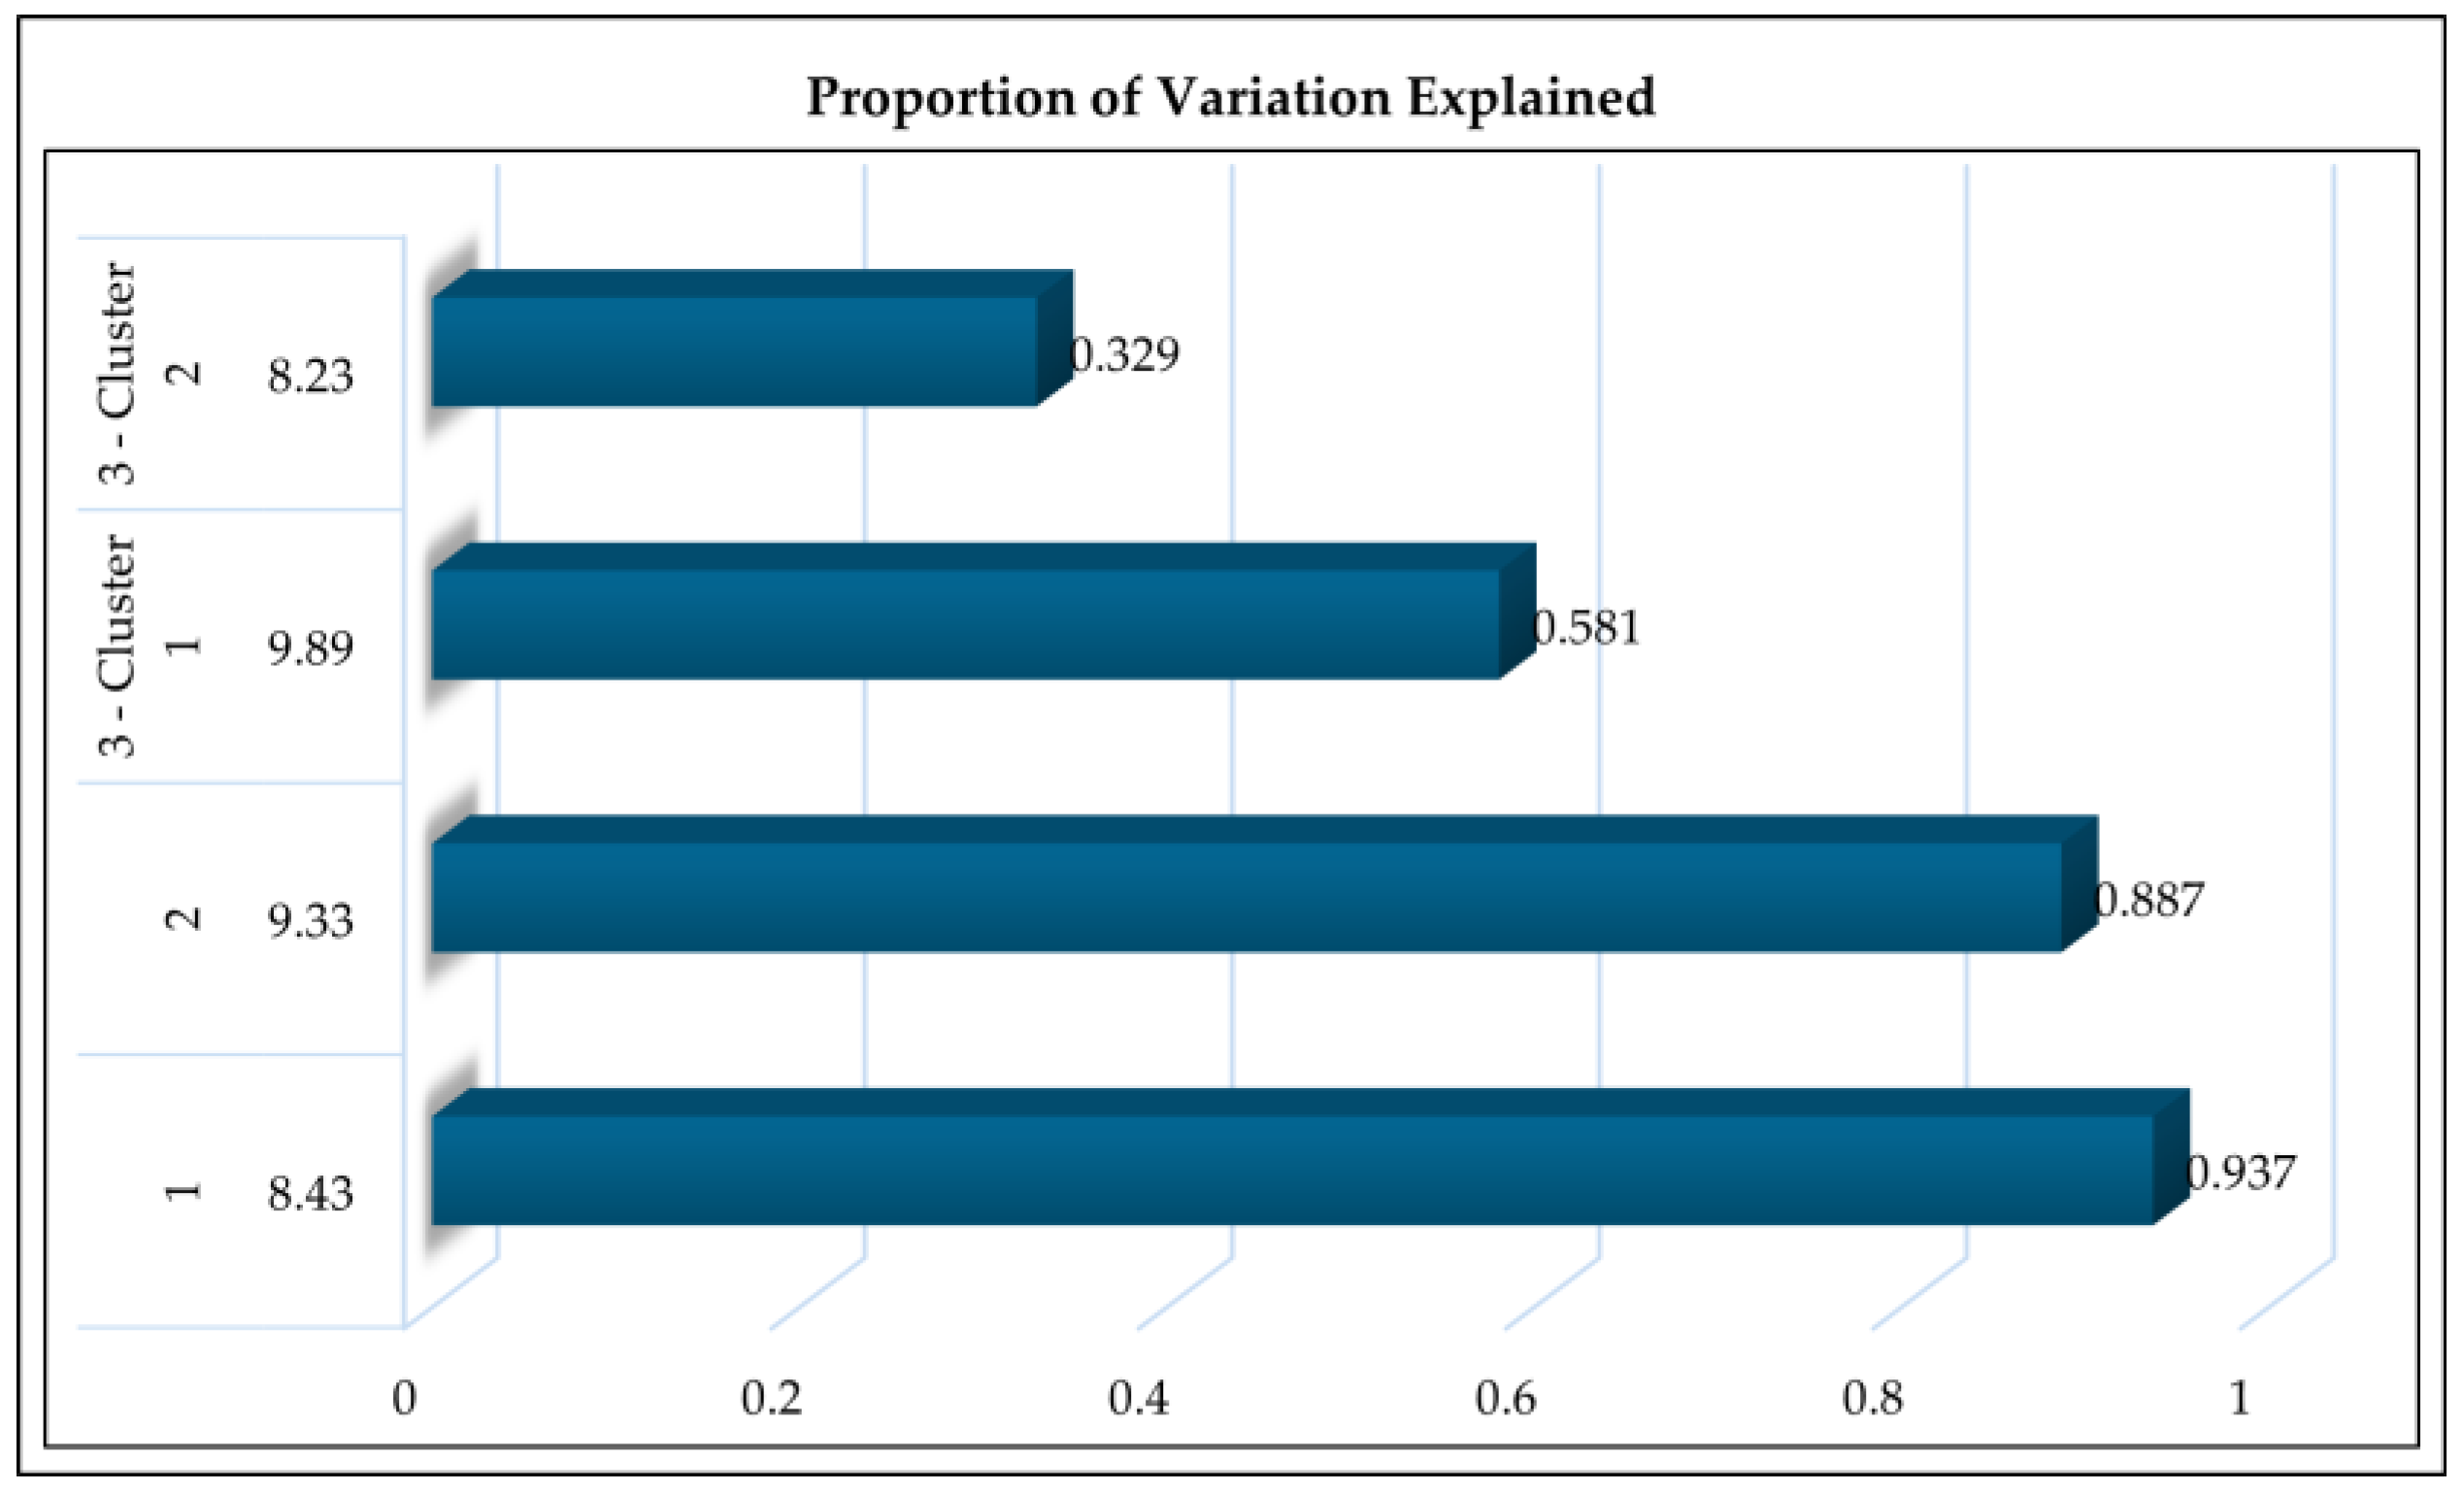
Figure 2.
The scatter plot compares predicted versus actual normalized FAMACHA© scores generated using the Linear Regression model based on RF wave features.
Figure 2.
The scatter plot compares predicted versus actual normalized FAMACHA© scores generated using the Linear Regression model based on RF wave features.
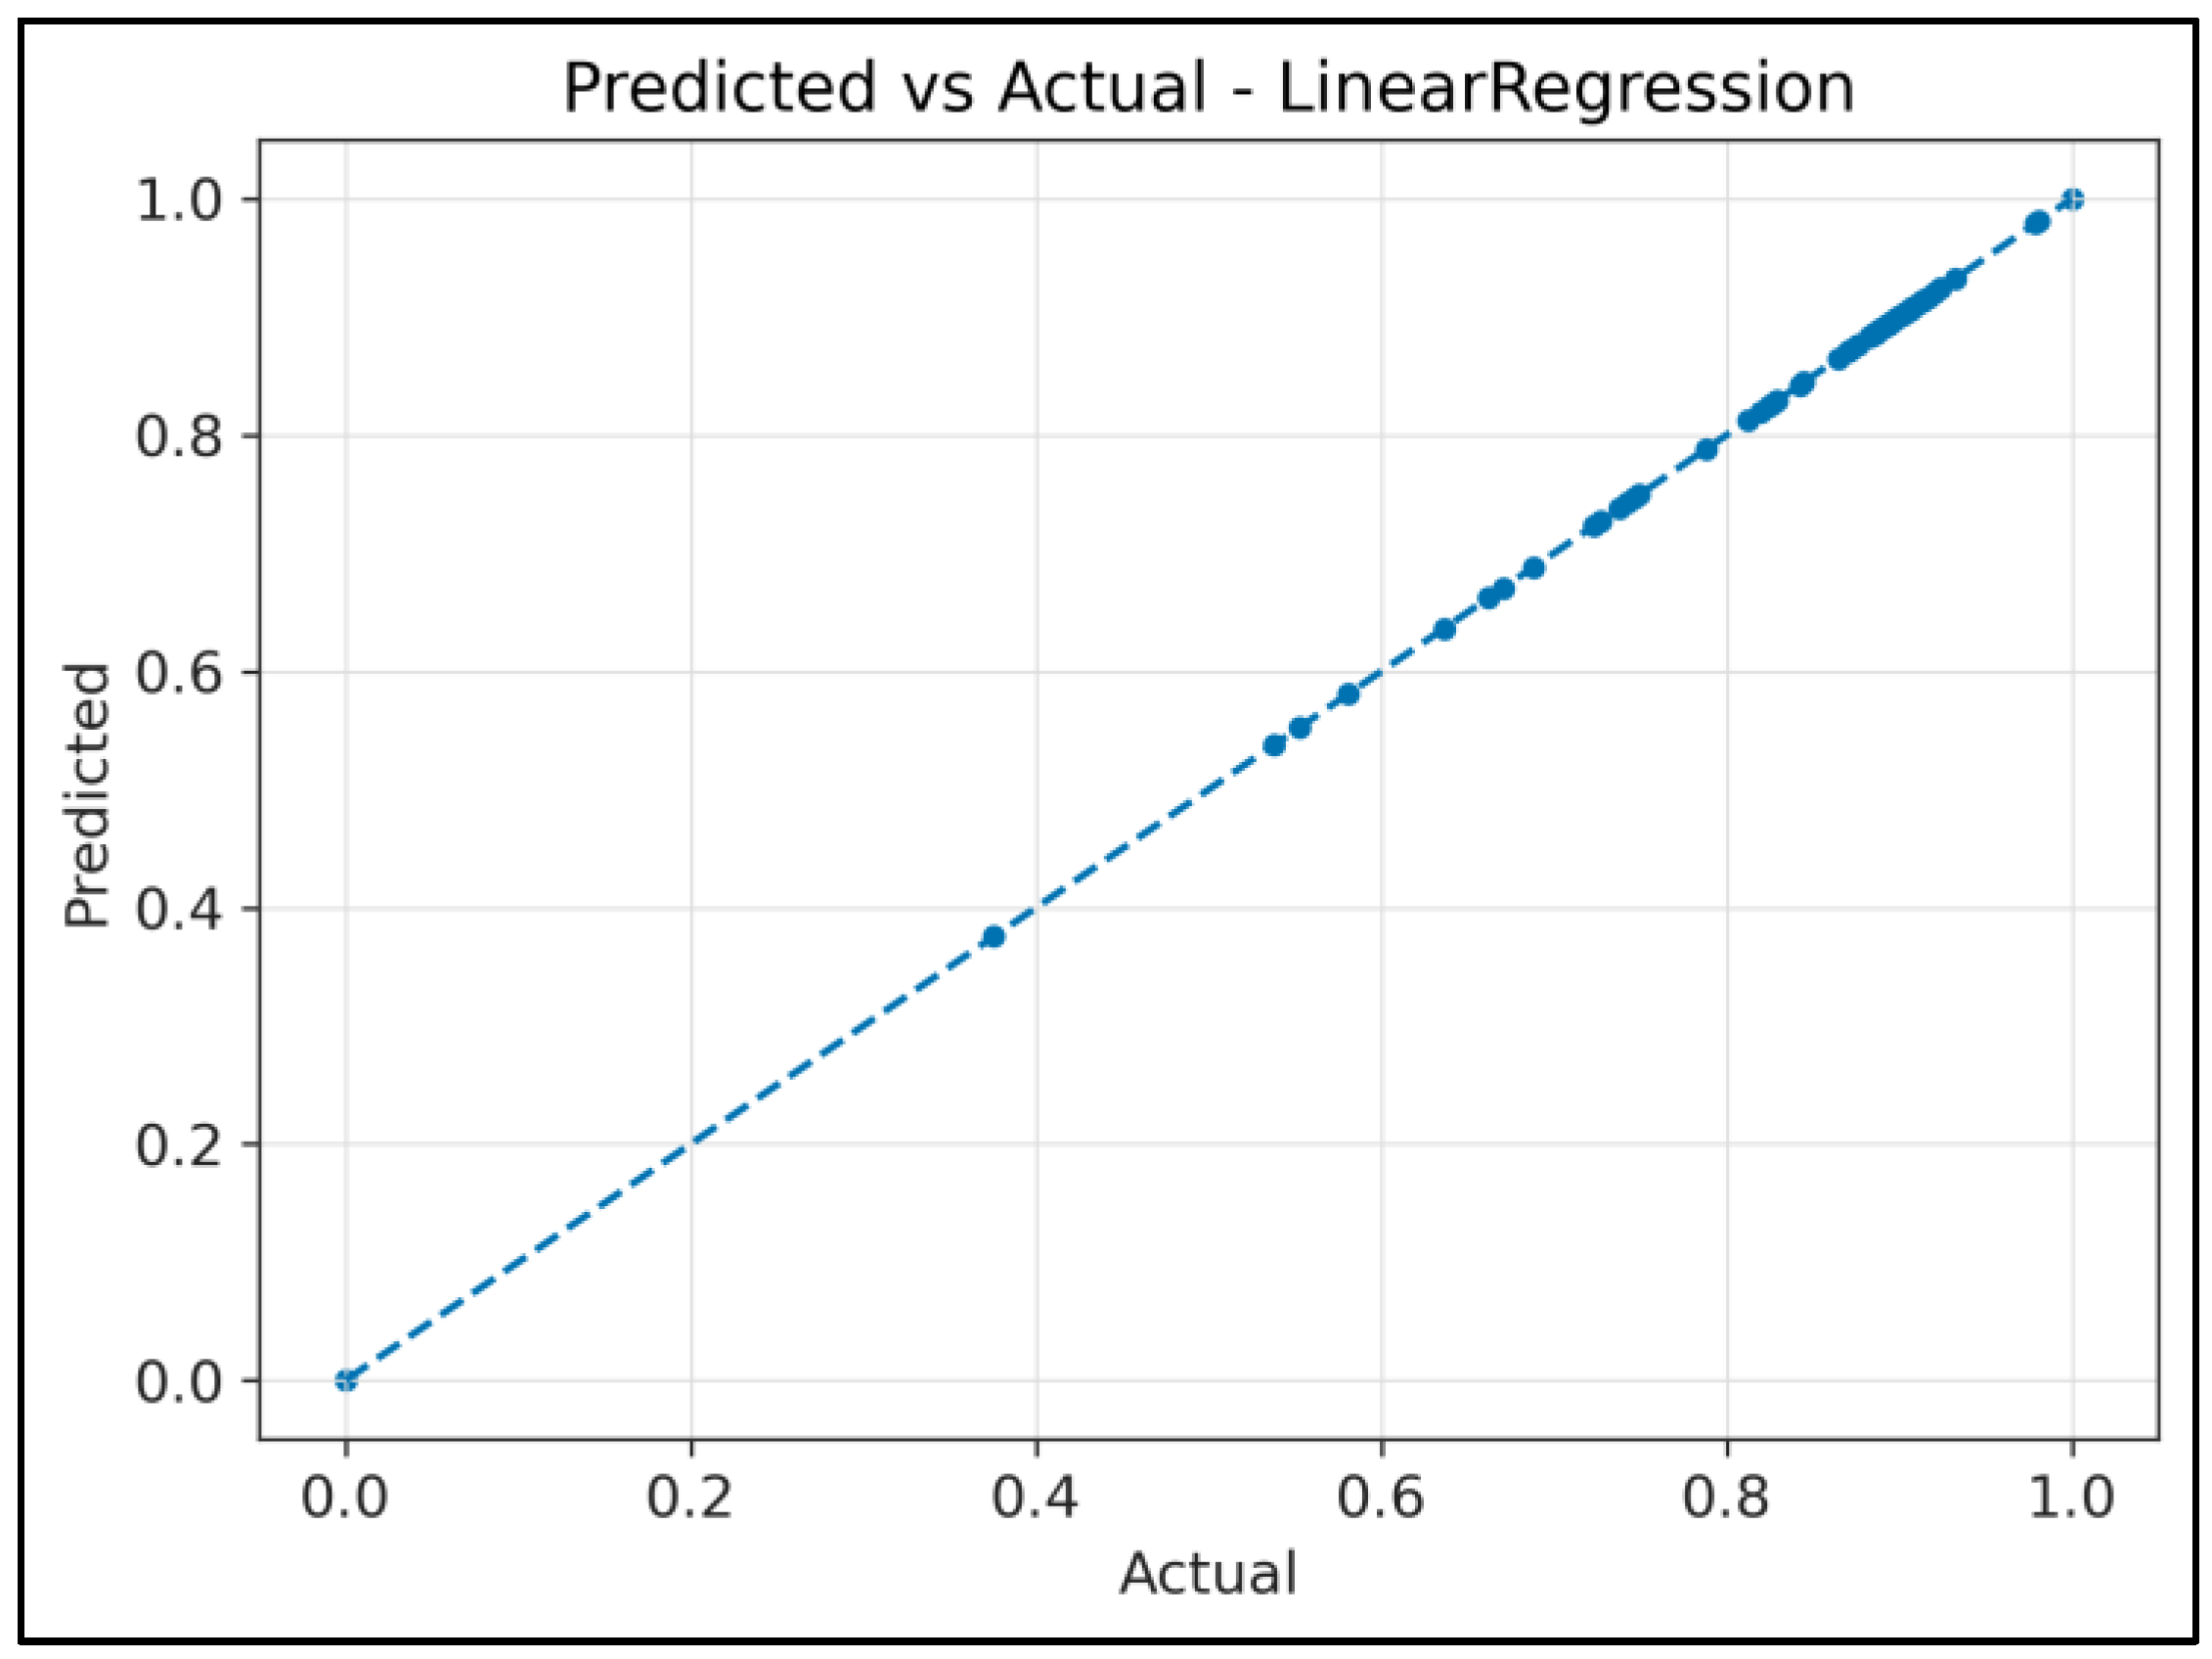
Figure 3.
The scatter plot compares predicted versus actual normalized FAMACHA© scores generated using the Random Forest model based on RF wave features.
Figure 3.
The scatter plot compares predicted versus actual normalized FAMACHA© scores generated using the Random Forest model based on RF wave features.
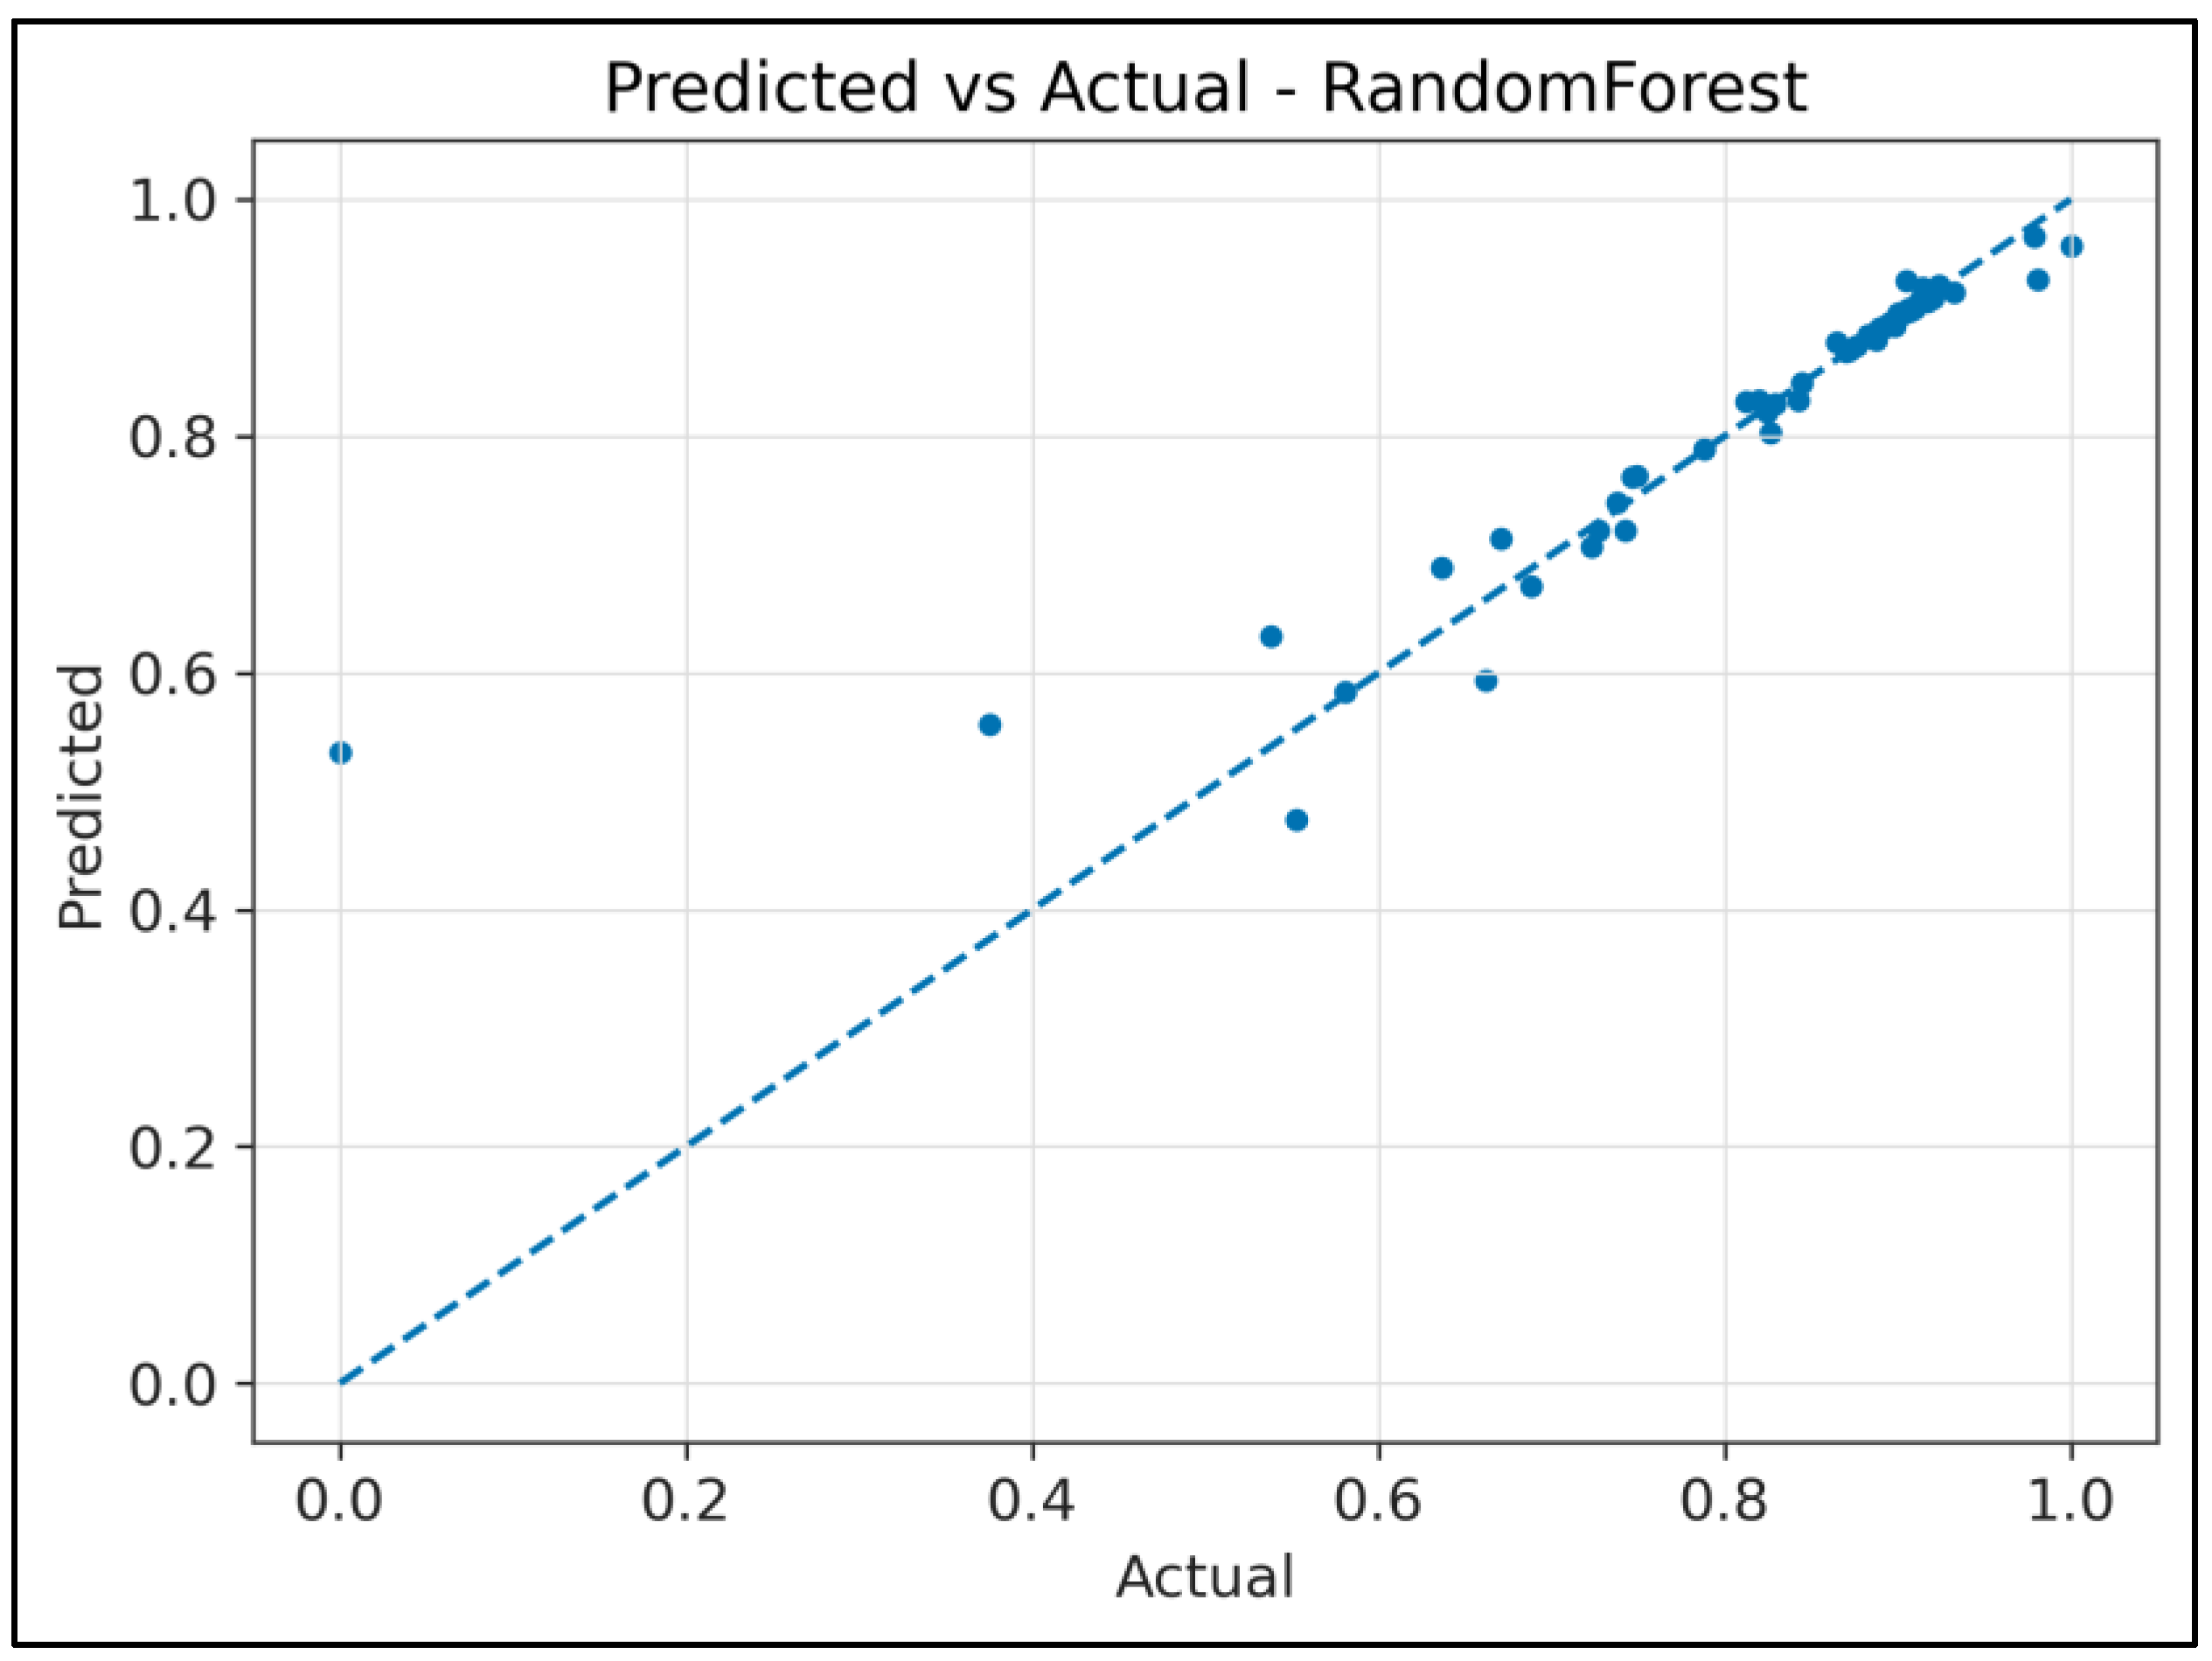
Figure 4.
The scatter plot compares predicted versus actual normalized FAMACHA© scores generated using the Support Regression model based on RF wave features.
Figure 4.
The scatter plot compares predicted versus actual normalized FAMACHA© scores generated using the Support Regression model based on RF wave features.
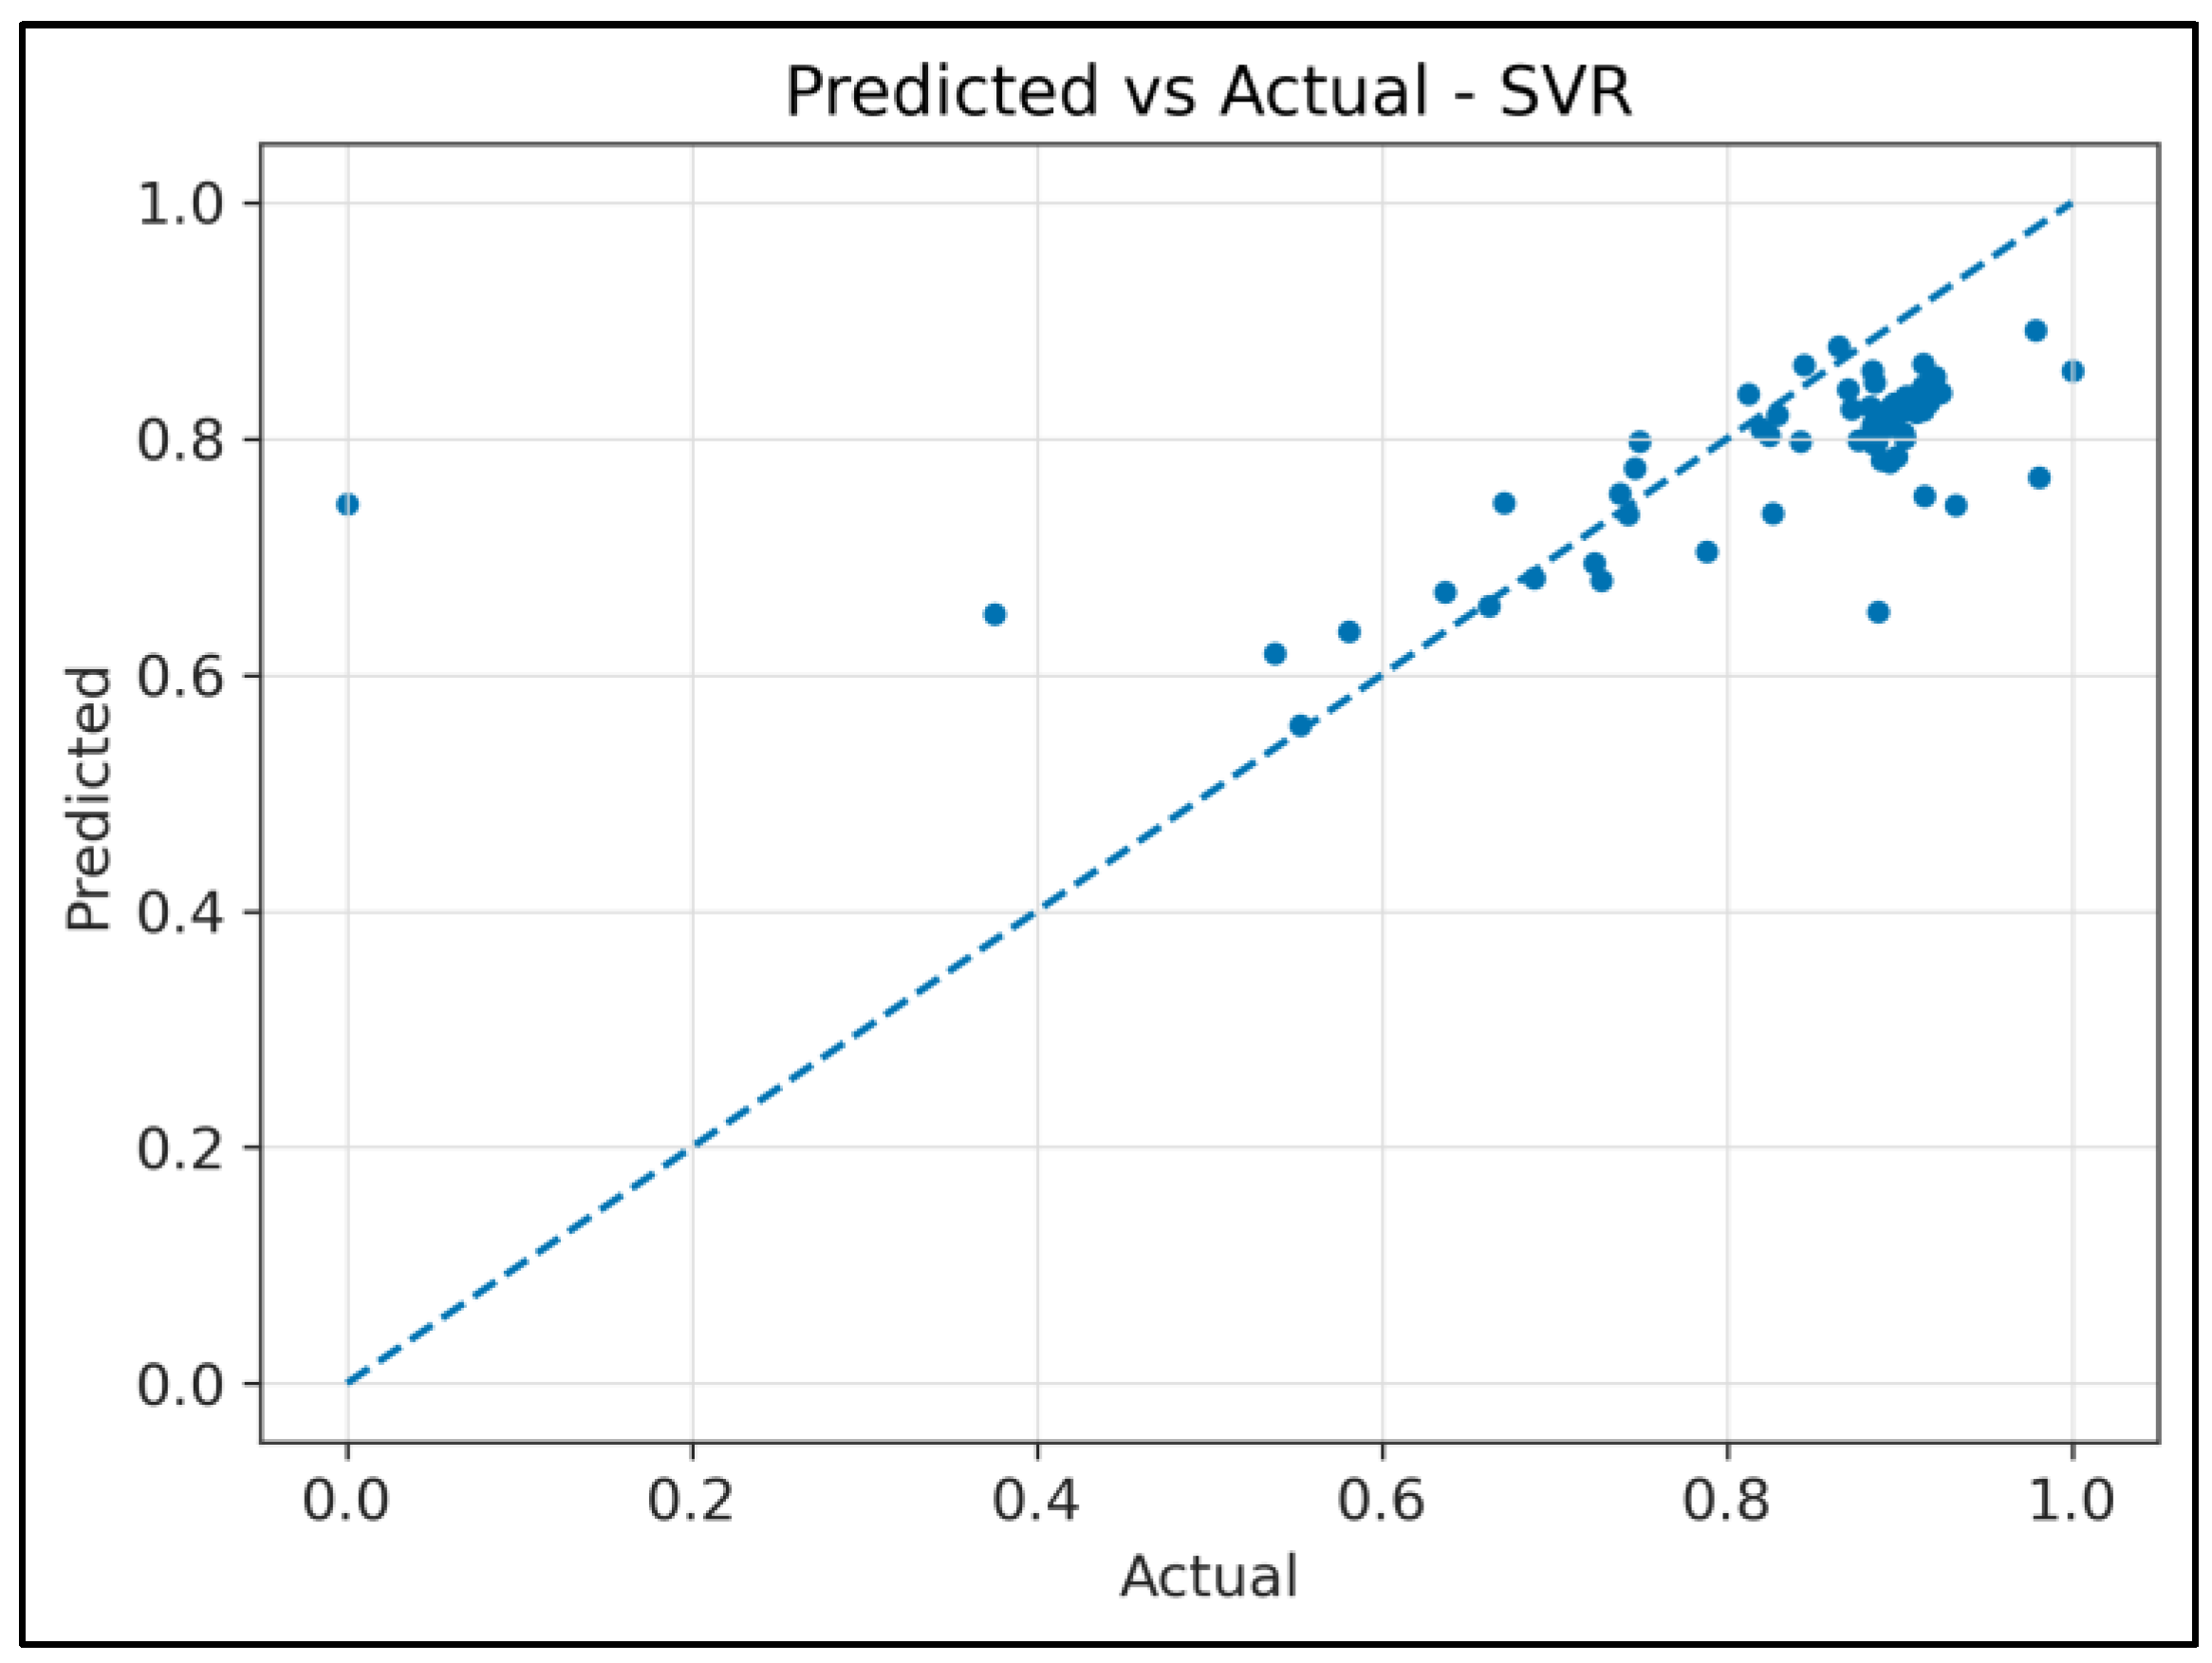
Figure 5.
Comparison of model performance metrics for Linear Regression (LR), Random Forest (RF), and Support Vector Regression (SVR) applied to clustered RF wave frequencies. The R² values show the explanatory power of each model, while MAE, MSE, and RMSE indicate prediction errors. Linear Regression achieved a perfect fit (R² = 1.00, negligible error), Random Forest demonstrated strong predictive accuracy (R² = 0.79, RMSE = 0.07), and SVR showed the weakest performance (R² = 0.31, RMSE = 0.12). These results highlight Random Forest’s robustness to biological variability, while Linear Regression and SVR represent extremes of apparent overfitting and underfitting, respectively.
Disclaimer/Publisher’s Note: The statements, opinions and data contained in all publications are solely those of the individual author(s) and contributor(s) and not of MDPI and/or the editor(s). MDPI and/or the editor(s) disclaim responsibility for any injury to people or property resulting from any ideas, methods, instructions or products referred to in the content. |
© 2025 by the authors. Licensee MDPI, Basel, Switzerland. This article is an open access article distributed under the terms and conditions of the Creative Commons Attribution (CC BY) license (http://creativecommons.org/licenses/by/4.0/).
Copyright: This open access article is published under a Creative Commons CC BY 4.0 license, which permit the free download, distribution, and reuse, provided that the author and preprint are cited in any reuse.


