
Submitted:
17 September 2025
Posted:
22 September 2025
You are already at the latest version
Abstract
Melanin is a component of many cosmetic or hair care formulations because of its photoprotective and antioxidant ca-pabilities. For such formulations, matching hair or skin tone is important. This report proposes the establishment of a framework to objectively compare different melanin-like materials based upon the intensity of their color and/or their presentation as eumelanin- or pheomelanin-like. Using absorbance spectroscopy from the UV to the near-infrared re-gions of the electromagnetic spectrum, numerical and graphical presentations are proposed to grade the appearance of melanin-like materials. In addition, we highlight FT-IR spectroscopy as a tool to evaluate the presence of carboxylic acid or carboxylate functional groups in the melanin-like materials. Such functional groups may be present due to the specif-ics of the reaction conditions or the choice of purification process and can have an impact on the binding capabilities of the melanin-like materials. The combination of objective parameters related to the type and intensity of the color of a melanin-like material can provide a basis for the proper formulation of melanin-based cosmetics matching any desired skin or hair tone.
Keywords:
eumelanin
; pheomelanin
; absorbance spectroscopy
; FT-IR spectroscopy
; catecholamine
; catechol
1. Introduction
Melanin (MN) is a term used to describe a diverse group of biomolecules present in many groups of living organisms and has been the subject of various reviews. Despite decades of research, MN is still poorly defined in its chemical structure and therefore the review reports on MN offer diverse descriptions of what constitutes MN.[1,2] In human and other animal species’ physiology two distinct classes of MN are responsible for the coloration of skin and hair: eumelanin (EuMN) and pheomelanin (PhMN).[2,3] EuMN is typically described as a brown to black colored material built from L-DOPA as the precursor. PhMN is commonly described as a yellow to red pigment formed by a combination of L-DOPA and the amino acid cysteine. This distinction between EuMN and PhMN may only be applicable for in vivo biosynthesis. In vitro, the addition of L-cysteine to the air-mediated oxidation of MN precursors in alkaline environment leads to darker, more EuMN-like materials.[4] On the other hand, yellow-to-red materials can be generated in vitro if other precursors, e.g., epinephrine, are used, or may be hiding behind the dark-colored, EuMN-like material.[4,5] Apart from L-DOPA, other catecholic compounds can serve as precursor for MN-like materials. Catecholamines like dopamine or norepinephrine, with or without cysteine, have been described as the precursors of neuromelanin, a MN material found in the brain of humans or animals.[6] Plant, fungal and some bacterial MN are built from nitrogen-free precursors, e.g., homogentisic acid, catechol or dihydroxynaphthalene.[7,8,9,10] The experiments described in this report involve MN-like materials synthesized from a wide variety of catecholic precursors or serotonin. The term “MN-like” used in this report is solely based upon the appearance of any material as dark-colored, EuMN-like, or as light-colored, PhMN-like, as has been done in previous reports.[4,11]
A striking feature of MN materials is their capacity to absorb light in a monotonic, exponentially declining fashion through the ultraviolet (UV), visible (vis) and near infrared (NIR) regions of the electromagnetic spectrum. This phenomenon creates their appearance as dark-colored, EuMN-like, or light-colored, PhMN-like, and anything in between.[4,11] This monotonic absorbance spectrum has been explained in terms of an overlay of the absorbance spectra of individual chemical species present in the material; the so-called chemical diversity model.[12,13,14] An alternative model invokes a combination of geometric order and disorder within MN aggregated structures, leading to delocalized excitonic effects amongst the oligomeric units making up the aggregates.[15] Others have argued that the monotonic absorbance spectra observed in MN materials are due to charge transfer (CT) phenomena.[16,17] An extensive review and discussion on the interaction of MN materials with electromagnetic radiation is given by Xie et al.[18]
Apart from skin or hair tone matching, MN-like materials are considered for use in cosmetic formulations because of their protective properties as antioxidants or UV light absorbents.[19,20,21,22,23] Dai et al. reviewed the recent advances in the study of UV-shielding materials used for sunscreen or other applications.[24] Many studies related to MN-like materials focus on the use of dopamine, L-DOPA, or their associated derivatives, 5,6-dihydroxyindole (DHI) and 5,6-dihydroxyindole carboxylic acid (DHICA), as precursor for the synthesis of MN. The approach in this and previous reports[4,11,25,26] is different by using a broad variety of precursors to synthesize MN-like materials (see Figure 1) and comparing their properties.
MN-like materials were generated through air-mediated oxidation in an alkaline environment and were evaluated for their capacity to absorb light from the UV, including a subdivision into UVA or UVB, to the Vis/NIR region of the electromagnetic spectrum. In addition, select materials were studied using FT-IR spectroscopy following dialysis or HCl-induced acidification. The results presented in this report are a combination of recently conducted, unreported experiments, and an evaluation of data accumulated from experiments reported upon between 2019 and 2025.[4,5,11,25,26,27,28,29,30,31] This report highlights two important features. First, the use of a mathematical equation, and associated parameters, to propose a process for an objective graphical or numerical description and comparison of the appearance of any MN-like material. Second, the use of FT-IR spectroscopic analyses to evaluate the presence of carboxylic acid or carboxylate functional groups. Carboxylic acids/carboxylates may be present: a) as part of the precursor employed (see Figure 1), b) due to the oxidative cleavage of aromatic rings that may occur during the synthesis or aging of the material[32] and c) due to the purification process of the MN material employed.
2. Materials and Methods
2.1. Materials
Dopamine.HCl (Thermo Scientific. Waltham, MA, USA), L-DOPA (MP Biomedicals, Santa Ana, CA, USA), epinephrine.HCl (Sigma-Aldrich, St Louis, MO, USA), epinephrine (Alfa Aesar, Ward Hill, MA, USA), norepinephrine.HCl (Sigma-Aldrich, St Louis, MO, USA), catechol (Acros Organics, Geel, Belgium), pyrogallol (Sigma-Aldrich, St Louis, MO, USA), caffeic acid (Sigma-Aldrich, St Louis, MO, USA), dihydrocaffeic acid (Thermo Scientific. Waltham, MA, USA), chlorogenic acid (Alfa Aesar, Waltham, MA, USA), 3,4-dihydroxybenzoic acid (Sigma-Aldrich, St Louis, MO, USA), serotonin.HCl (Thermo Scientific, Waltham, MA, USA), and 5,6 dihydroxyindole (DHI; Thermo Scientific, Waltham, MA, USA) were all purchased through Fisher Scientific (Waltham, MA, USA) but originated from different suppliers as indicated.
2.2. UV and vis/NIR Spectroscopy
UV and vis/NIR spectroscopic measurements were made in wells of a 96-well microplate using a SynergyHT microplate reader from Biotek (Winooski, VT, USA). For measurements involving absorbance readings below 350 nm, UV-transparent microplates were used. Spectra were recorded with 5 nm intervals. The spectrophotometer used in the experiments provides reproducible and linear, concentration-dependent measurements for absorbance readings up to 3.5.
2.3. FT-IR Spectroscopy
FT-IR analyses were performed using the Spectrum Two FT-IR spectrometer from PerkinElmer (Waltham, Massachusetts). Scans were made using the universal ATR accessory between 650 and 4,000 cm-1 with a resolution of 4 cm-1 and using the OptKBr beam splitter and LiTaO3 detector. For each sample 24 scans were accumulated.
2.4. Evaluation of Crude Reaction Mixtures
Over the course of eight years (2018-2025), reactions involving the air-mediated oxidation of catecholic precursors in the presence of Na2CO3 were studied for varying reasons.[4,5,11,25,26,27,28,29,30,31] The reaction conditions differed in: a) the precursor used (see Figure 1), b) the concentration of precursor used (between 0.5 and 20 mM), c) the concentration of Na2CO3 present (between 5 and 50 mM, d) whether the mixture was kept stagnant or stirring, e) the reaction volume (between 200 μL and 200 mL) or f) temperature (room temperature or 37˚C). RP-HPLC analyses were used to monitor the disappearance of precursor as detailed elsewhere.[25] At the end of the reaction an absorbance scan of the crude reaction mixture in the vis/NIR range (350 nm to 900 nm) was recorded.
2.5. Evaluation of Purified Materials
Reactions were set up by dissolving between 200 and 300 mg precursor in 100 mL 25 or 50 mM Na2CO3. A higher concentration of Na2CO3 was used for the precursors in hydrochloride salt form. A reaction with epinephrine was set up by dissolving 250 mg in 50 mL 5 mM HCl followed by the addition of 50 mL 200 mM Na2CO3. Crude reaction mixtures were purified through dialysis followed by freeze drying. Dried materials were scanned using FT-IR spectroscopy. Select dried materials were dispersed in distilled water at a concentration between 1 and 2 mg/mL and a dilution series was prepared in distilled water. The diluted mixtures were scanned for their absorbance in the vis/NIR and UV range. Select dialyzed and dried materials were dispersed in water at a concentration of 6 mg/mL. This dispersion was acidified using HCl to a final concentration of 0.1N. The precipitations were centrifuged, washed with water and freeze-dried. When no or little precipitation occurred, the acidified dispersion was dialyzed and freeze-dried. FT-IR spectra were recorded of all HCl-acidified materials.
2.6. Dialysis and Freeze Drying
Dialysis was performed using Spectrum Spectra/Por RC dialysis membranes with molecular-weight-cut-off (MWCO) of 3.5kDa obtained from Fisher Scientific (Suwanee, GA). Samples were freeze dried using a Labconco FreeZone Plus 4.5L benchtop freeze dry system obtained from Fisher Scientific (Suwanee, GA).
3. Results
3.1. Mathematical Analyses of Absorbance Profiles
As documented in the literature, the absorbance spectra of MN materials dispersed in water yield an exponentially declining profile with increasing wavelength. Thus, such absorbance spectra can be fitted with an exponential function as shown in equation (1).
In this equation, k is the decay constant of the exponential profile of the absorbance (A) as a function of the wavelength (λ). A0 is the absorbance of the sample when λ = 0. To obtain the values of k and A0, exponential regression analyses were performed for absorbance readings between 500 and 800 nm to avoid the interference of components with strong absorbance in the upper UV region (300 – 400 nm) and to ensure that all absorbance readings were sufficiently above baseline. For light-colored materials, e.g., derived from epinephrine or pyrogallol, regression analyses were performed between 500 and 700 nm. To objectively quantify the intensity of the color of any given MN material, equation (1) is integrated between 400 and 900 nm using the established values of A0 and k obtained for that MN material. Such integration, shown in equation (2), represents the area-under-the-curve, termed AUCvis, and represents the total absorbance of the spectrum within the vis/NIR region of the electromagnetic spectrum.
The value of A0 in equation (1) depends on the concentration of the sample, while the value of k is independent of the concentration and is to be considered a material specific parameter. These facts are illustrated in Figure 2, panels (a) and (b), for a dialyzed and freezedried, L-DOPA based MN material dispersed in water. Figure 2, panel (a), shows the absorbance profiles in the vis/NIR region of the same sample dispersed at varying concentrations. Figure 2, panel (b), compares the values of AUCvis, obtained from equation (2), and the values of A0, from equation (1), as a function of sample concentration. From these analyses the average (± standard deviation; n = 7) value of k for the material was determined to be 0.0065 ± 0.0001.
The absorbance in the UV region by MN materials is not readily approached with a simple mathematical equation due to the presence of specific absorbance bands within that region. To obtain an objective estimate of the total absorption in the entire UV region of the electromagnetic spectrum (between 230 and 400 nm) or the UVA (between 320 and 400 nm) and UVB (between 280 and 320 nm) regions, the AUC in those regions, termed AUCUVT, AUCUVA and AUCUVB, were calculated as shown in equations (3a). (3b) and (3c).
Figure 3, panel (a), shows the absorbance profiles in the UV region of the same samples shown in Figure 2, panel (a). Figure 3, panel (b), shows the linear relationships between the values of AUCUVT, AUCUVA or AUCUVB, and the concentration of the sample.
The AUCvis parameter provides an objective evaluation of the intensity of the appearance (color or “darkness”) of a particular MN dispersion. However, it does not provide an objective evaluation of the type of MN material: EuMN- or PhMN-like. To objectively evaluate the nature of the MN dispersion, the ratio of the absorbance at 650 nm over the absorbance at 500 nm (A650/A500) was evaluated as a function of the value of k from equation (1) as has been discussed elsewhere.[4] Although these two wavelengths are arbitrarily chosen, it follows precedent as a suggested way to differentiate dark-colored EuMN from light-colored PhMN.[33,34,35] Given the exponential relationship between A and λ as shown in equation (1), an exponential relationship exists between k and A650/A500 as outlined in Eq.4.
Higher values of k and lower values of A650/A500 typically indicate light-colored (orange to yellow) materials. Lower values of k and higher values of A650/A500 typically indicate dark-colored (brown to black) materials. As discussed earlier, over the course of eight years (2018-2025), reactions involving the air-mediated oxidation of a variety of precursors were studied. At the end of each reaction an absorbance scan between 350 and 900 nm was recorded and modeled according to equation (1). Reactions involving serotonin consistently resulted in precipitated materials. However, after washing with water the dark-colored material could be dispersed in 1N HCl. Absorbance spectra could then be recorded and modeled according to equation (1). Figure 4 shows a plot, updated from an earlier version[36], of the average value of k (± standard deviation) vs. the average value of A650/A500 (± standard deviation) for every individual precursor studied. These data points are plotted in relationship to the theoretical line according to equation (4).
All experimental data points fall on or are close to the theoretical line. An exception appeared to be some reactions involving catechol for which the average values of k and A650/A500 are sometimes off the theoretical line. The absorbance profiles of reactions involving catechol contain the typical monotonic profiles of MN materials but with a weak, broad absorbance band around 650 nm (results not shown), and this may account for the deviations observed in Figure 4.
3.2. Characterization of Purified Materials: vis/NIR and UV Absorbance
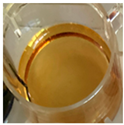
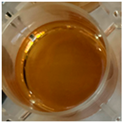
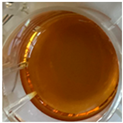
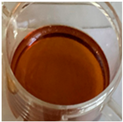
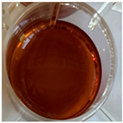
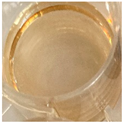
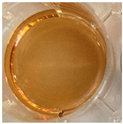
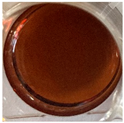
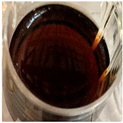
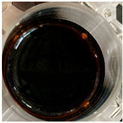
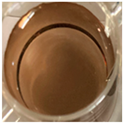
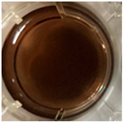
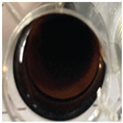
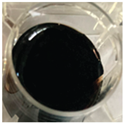
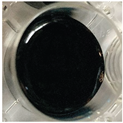
The color or appearance of MN materials depends on the concentration (C) of the dispersion and the type of precursor used in its synthesis. This is illustrated in Table 1, showing photographs of dialyzed and freeze dried MN materials, built from different precursors, dispersed in water at different concentrations.
The photographs shown in Table 1 illustrate the relationship between the intensity of the color of a MN-like material and its concentration. As discussed earlier, the intensity of the color can objectively be described using a parameter like AUCvis from equation (2). However, any comparison of the appearance of MN materials should consider the concentration of the MN material involved. Thus, a parameter like AUCvis/C could serve as an objective numerical value reflecting the intensity of the color of a particular MN material: the higher the value of AUCvis/C, the darker the appearance of the material dispersed in water. As discussed in Section 3.1, the parameter k from equation (1) is a material-specific parameter and is associated with the appearance of the MN material as EuMN- or PhMn-like. This can be illustrated in a graphical presentation as shown in Figure 5.
As can be observed from Table 1 and Figure 5 increasing concentrations of pyrogallol-based MN materials will not yield a dark, brown-to-black appearance. On the other hand, dilute dispersions of a DHI-based MN material will not yield a light, yellow-like appearance. In addition to its value of AUCvis/C, the overall color of a MN-like material depends in part on its value of k. Table 2 includes the values of k for the materials listed. In this context, the value of (AUCvis/C)/k could also serve as a parameter for an objective comparison of MN-like materials as it combines both concentration and type of MN material: the higher the value of (AUCvis/C)/k, the darker and more EuMN-like the material appears dispersed in water. The values of (AUCvis/C)/k are shown in Table 2 for the materials listed.
Select MN-like materials listed in Table 2 were synthesized twice from the same precursor. The variation in the values of AUCvis/C, k or (AUCvis/C)/k of MN-materials synthesized from the same precursor illustrate the batch-to-batch variability that occurs when synthesizing MN-like materials.
Similarly to AUCvis/C, concentration-independent parameters like AUCUVT/C, AUCUVA/C or AUCUVB/C, can serve as objective indicators of the capacity to absorb UV light by any MN material. A comparison of these parameters is shown in Table 3 for the same materials listed in Table 2.
All the parameters listed in Table 2 indicate that the MN material generated from DHI was the darkest in appearance and the MN material generated from epinephrine was the lightest in appearance. Comparing the values of AUCvis/C, the DHI-based material could be considered 101 times darker than the epinephrine-based material. Alternatively, comparing the values of (AUCvis/C)/k, the DHI-based material could be considered 265 times darker than the epinephrine-based material. However, comparing the values of AUCUVT/C, AUCUVA/C and AUCUVB/C, the DHI-based material absorbed only 1.83, 1.39 or 1.43 times more UV, UVA or UVB light respectively compared to the epinephrine-based material. Figure 6 presents the correlation between the values of AUCvis/C and AUCUVT/C, AUCUVA/C and AUCUVB/C for the materials listed in Tables 1 through 3.
The results shown in Figure 6 suggest a poor correlation between the values of AUCvis and any AUCUV parameter.
3.3. Characterization of Purified Materials Using FT-IR Spectroscopy
FT-IR spectroscopy is a commonly used technique to study MN-like materials. As was outlined in a previous report, the FT-IR spectra of MN-like materials exhibit a similar pattern of signals, independent of the precursor used. That same report detailed how FT-IR spectroscopy can be used to distinguish MN-materials purified through dialysis or following acidification with HCl. Post-synthesis dialysis of the alkaline, MN synthesis reaction mixtures, preserves the carboxylic acid functionalities in their carboxylate form. Acidified MN materials will convert the carboxylic acid functionalities into their acidic form. Thus, the purification process will have an impact on the acidic or basic character of the synthetic MN, which may impact its capacity to bind to other substances. These considerations are shown in Figure 7, panels (a) and (b). Figure 7, panel (a), shows an overlay of the fingerprint region of the FT-IR profiles obtained from MN materials derived from dopamine or pyrogallol following dialysis or HCl-induced precipitation. Figure 7, panel (b), shows the subtraction of the signal of the dialyzed material from the signal of the HCl-precipitated material.
The profile obtained following the HCl-induced precipitation or acidification shows a clear shoulder in the low 1,700 cm-1 region of the spectrum. By comparing the FT-IR spectra of the dialyzed materials to the HCl precipitated or acidified materials, one can assign the signal in the low 1,700 cm-1 region to the presence of carboxylic acid groups. The subtracted absorbance profiles shown in Figure 7, panel (b), not only shows the emergence of the signal in the low 1,700 cm-1 region, but additional, negative or positive, peaks. The negative signals at 1,546 and 1,383 cm-1 can be assigned to the disappearance of the asymmetric and symmetric C-O stretch of the carboxylate functional groups.[37] The positive signal at 1,186 cm-1 can be assigned to the C-O stretch of the emerging carboxylic acid groups; possibly overlapping with the C-O stretch of phenols.[38,39] Although the addition of HCl would render any amine group into its protonated salt form, the N-H stretching or bending vibrations may be too weak to be readily distinguishable in the FT-IR spectra of the complex MN materials.[40]. Although both dopamine and pyrogallol do not contain carboxylic acid functionalities in their molecular structure, the FT-IR spectra shown in Figure 7 do exhibit evidence of carboxylic acid/carboxylate functional groups. This suggests that oxidative aromatic ring cleavage occurred during the synthesis reaction as has been discussed elsewhere.[32]. Reaction time (or “aging” of the MN material) may impact the extent to which this aromatic cleavage may occur, with a possible impact on the appearance or other properties of the MN material.[41]
3.4. Physical (In)Stability of Melanin-Like Materials
Although MN-like materials can be dispersed into homogenous mixtures in water or salt solutions, changes in ionic strength, in addition to changes in pH, can affect the physical (in)stability of the dispersed MN materials. A previous report provided experimental results on the physical instability of L-DOPA-based materials in the presence of multivalent cations.[28] Similar observations were made for dopamine- or DHI-based MN materials. Figure 8 illustrates the relative AUCvis, calculated according to Eq.2, remaining in the supernatants of mixtures of dopamine- or DHI-based MN with increasing concentrations of Ca2+.
4. Discussion
The main purpose of this report is to propose an objective framework to grade MN-like materials based upon the type and the intensity of its visual appearance and its UV light absorbing capacity. As the chemical structure of MN-like materials is not firmly established, it is difficult to objectively standardize this class of biomolecules. This report proposes the establishment of a set of numerical parameters, derived from spectroscopic analyses, which can provide a framework to compare and classify different MN-like materials for their capacity to absorb light in the UV and Vis/NIR range of the electromagnetic spectrum. In addition, a graphical presentation, as shown in Figure 5, can visually illustrate the proposed grading framework for MN materials. As shown in Table 2 and Table 3, select precursors were used twice to generate well-characterized MN materials. The differences in the values of the parameters shown in these two tables reflect the challenges in generating MN materials with reproducible properties. Thus, this author advocates for the establishment of a reference library of well-characterized MN materials with a broad range of appearances and properties. Such a library could be used as benchmark materials as a comparison for any newly synthesized MN material, independent of its intended application. The analyses and processing of data suggested in this report could be added to other suggested standard analysis protocols for MN-like materials.[42]
Despite the fact that many review papers highlight MN’s insolubility in water and organic solvents, MN materials are often described as “soluble” in alkaline, e.g., KOH or NaOH, environments.[8,43] The synthesis process used in our experiments involved the use of Na2CO3 as the base and the MN products generated almost always presented themselves as seemingly dissolved in the medium. It has been argued that MN materials thus generated are dispersions of a colloidal, hybrid materials.[25,27,28] A model has been proposed suggesting that the in vitro synthesized MN consists of a dark-colored core MN-like material physically stabilized by a colorless ligand. This colorless ligand has been observed to strongly absorb UV light and to have fluorescent properties.[25] These previous results and the evaluation of the parameters shown in Table 2 and Table 3 suggest that the capacity to absorb UV light may not correlate with the intensity of the visible color of the MN material. The results shown in Figure 6 confirm the poor correlation between the values of AUCvis and any AUCUV parameter values and suggest that a doubling of the value of AUCvis would lead to a 20 to 40% increase in AUCUVT. MN materials are frequently discussed in terms of their protective or harmful interaction with UV light.[18,33] However, despite the markedly darker appearance of DHI materials compared to epinephrine materials, no markedly different capacity to absorb UV light was observed (see Section 3.3). This observation strengthens the notion that the color and the capacity to absorb UV light may be separate properties of the overall MN material; residing in the two different entities making up the hybrid, colloidal material.[25,28]
The physical stability or instability of a colloidal particle depends on physical and chemical factors (particle size, pH, ionic strength, surface charge, zeta potential).[44] Thus, the addition of HCl or multivalent cations may induce precipitation of MN materials as highlighted in this and earlier reports.[25,27,28] The impact of pH or ionic strength on the physical stability of MN dispersions needs to be taken into account when formulating them in cosmetic or other formulations.
Due to its insolubility in water or organic solvent, chemical characterization of MN materials is still incomplete. A commonly used technique is FT-IR spectroscopy, although it provides only limited information regarding the chemistry of MN materials. An overview of typical peak signals in FT-IR spectra of natural or synthetic MN is presented by Perna et al.[45] The FT-IR analyses we performed on select materials, as shown in Figure 7 and in previous reports, provide various observations.[36] The FT-IR spectra of dialyzed MN materials display very similar features despite the diversity in the chemistry of the precursors involved. By comparing and subtracting the FT-IR spectra of dialyzed vs. HCl-precipitated or -acidified material, one can observe that many MN materials contain carboxylic acid/carboxylate functionalities. Even MN materials synthesized from precursors without carboxylic acids, e.g., dopamine or DHI, exhibit carboxylic acid/carboxylate features. This indicates that oxidative aromatic ring cleavage occurred during the synthesis reaction as has been discussed elsewhere.[32] In the case of amine-containing MN materials, the amino functionality could be positively charged creating the possibility that select MN material may exist as zwitterions. The presence or absence of any charge on the surface of MN materials can impact their physic-chemical properties, e.g., their tendency to aggregate into smaller or larger units, or their suitability for any particular application.[46,47]
Some of the parameters selected for the proposed grading framework, e.g., the parameters of equation (2) or equation (4), were arbitrarily chosen and could be altered. However, any such changes would not have an impact on the fundamentals of the framework: the assignment of objective numerical values related to the UV absorbance and the appearance of the MN material, and the potential of this framework on the standardization of MN-like materials.
5. Conclusions
With this report we propose an objective numerical and graphical process to compare the visual appearance of any melanin-like material. The process is based upon the mathematical processing of spectroscopic analyses and deriving numerical parameters related to 1) the material’s capacity to absorb light in the UV and visible region and 2) its appearance as eumelanin- or pheomelanin-like. The use of FT-IR spectroscopy is highlighted to evaluate the conjugate acid or base properties of the melanin material. Additionally, the impact of multivalent cations on the physical stability of melanin dispersions is discussed as it can have an impact on formulations containing melanin materials.
Author Contributions
Conceptualization, methodology, formal analysis, investigation, data curation, writing, review, editing, visualization by KV.
Funding
This research was in part funded by the “Bridge to Doctorate Program at Tennessee State University” grant from the National Science Foundation (NSF; grant 1810991), by The Tennessee Louis Stokes Alliance for Minority Participation (TLSAMP) supported by the National Science Foundation (NSF – HRD 1826954) and by NIH grant 5U54CA163066.
Acknowledgments
The author wishes to thank Venise Govan, Jada Harrison, Tyona Caldwell, Stenesha Fortner, Jaila Winford, Iesha Brown, Sha’Kendria Summers, Jayla Moore, Aaliyah Flake, Keturah Badie, Alin Joseph and Tylor Miller for the execution and the collection of data associated with the experiments described herein. JM was supported by the “Bridge to Doctorate Program at Tennessee State University” grant from the National Science Foundation (NSF; grant 1810991). VG, JW and KB were supported by The Tennessee Louis Stokes Alliance for Minority Participation (TLSAMP) supported by the National Science Foundation (NSF – HRD 1826954). AF and TM were supported by NIH grant 5U54CA163066.
Conflicts of Interest
The author declares no conflicts of interest.
Abbreviations
The following abbreviations are used in this manuscript:
| MN | melanin |
| EuMN | eumelanin |
| PhMN | pheomelanin |
| UV | ultraviolet |
| Vis | visible |
| NIR | near infrared |
| FT-IR | Fourier Transform Infrared Spectroscopy |
| AUC | area-under-the-curve |
| C | concentration |
References
- Motovilov, K. A., and A. B. Mostert. “Melanin: Nature’s 4th Bioorganic Polymer.” Soft Matter 20, no. 29 (2024): 5635–51. [CrossRef]
- Wakamatsu, K., and S. Ito. “Recent Advances in Characterization of Melanin Pigments in Biological Samples.” Int J Mol Sci 24, no. 9 (2023). [CrossRef]
- Simon, J. D., and D. N. Peles. “The Red and the Black.” Acc Chem Res 43, no. 11 (2010): 1452–60. [CrossRef]
- Vercruysse, Koen P. “The “Unconventional” Effect of Cysteine on the in Vitro Synthesis of Melanin.” ACS Omega (2024). [CrossRef]
- Vercruysse, Koen P., and Venise Govan. “Melanogenesis: A Search for Pheomelanin and Also, What Is Lurking Behind Those Dark Colors? .” ChemRxiv. Cambridge: Cambridge Open Engage;, 2019. [CrossRef]
- Nicolaus, B. J. “A Critical Review of the Function of Neuromelanin and an Attempt to Provide a Unified Theory.” Med Hypotheses 65, no. 4 (2005): 791–6. [CrossRef]
- Glagoleva, A. Y., O. Y. Shoeva, and E. K. Khlestkina. “Melanin Pigment in Plants: Current Knowledge and Future Perspectives.” Front Plant Sci 11 (2020): 770. [CrossRef]
- Singh, Sanju, Satish B. Nimse, Doniya Elze Mathew, Asmita Dhimmar, Harshal Sahastrabudhe, Apexa Gajjar, Vishal A. Ghadge, Pankaj Kumar, and Pramod B. Shinde. “Microbial Melanin: Recent Advances in Biosynthesis, Extraction, Characterization, and Applications.” Biotechnology Advances 53 (2021): 107773. [CrossRef]
- Suthar, M., L. Dufosse, and S. K. Singh. “The Enigmatic World of Fungal Melanin: A Comprehensive Review.” J Fungi (Basel) 9, no. 9 (2023). [CrossRef]
- Tang, Q., Z. Li, N. Chen, X. Luo, and Q. Zhao. “Natural Pigments Derived from Plants and Microorganisms: Classification, Biosynthesis, and Applications.” Plant Biotechnol J (2024). [CrossRef]
- Vercruysse, Koen P., Venise Govan, Jada Harrison, Tyona Caldwell, and Jaila Winford. “Appearing as Eumelanin or as Pheomelanin and the Push Towards Eumelanin by Cysteine.”, edited by ChemRxiv, 2022. [CrossRef]
- Meredith, P., B. J. Powell, J. Riesz, S. P. Nighswander-Rempel, M. R. Pederson, and E. G. Moore. “Towards Structure-Property-Function Relationships for Eumelanin.” Soft Matter 2, no. 1 (2006): 37–44. [CrossRef]
- Tran, M. L., B. J. Powell, and P. Meredith. “Chemical and Structural Disorder in Eumelanins: A Possible Explanation for Broadband Absorbance.” Biophys J 90, no. 3 (2006): 743–52. [CrossRef]
- d’Ischia, M., A. Napolitano, A. Pezzella, P. Meredith, and T. Sarna. “Chemical and Structural Diversity in Eumelanins: Unexplored Bio-Optoelectronic Materials.” Angew Chem Int Ed Engl 48, no. 22 (2009): 3914–21. [CrossRef]
- Chen, C. T., C. Chuang, J. Cao, V. Ball, D. Ruch, and M. J. Buehler. “Excitonic Effects from Geometric Order and Disorder Explain Broadband Optical Absorption in Eumelanin.” Nat Commun 5 (2014): 3859. [CrossRef]
- Petropoulos, V., A. Mavridi-Printezi, A. Menichetti, D. Mordini, P. Kabacinski, N. C. Gianneschi, M. Montalti, M. Maiuri, and G. Cerullo. “Sub-50 Fs Formation of Charge Transfer States Rules the Fate of Photoexcitations in Eumelanin-Like Materials.” J Phys Chem Lett 15, no. 13 (2024): 3639–45. [CrossRef]
- Kohl, Forrest R., Christopher Grieco, and Bern Kohler. “Ultrafast Spectral Hole Burning Reveals the Distinct Chromophores in Eumelanin and Their Common Photoresponse.” Chemical Science 11, no. 5 (2020): 1248–59. [CrossRef]
- Xie, W., A. Dhinojwala, N. C. Gianneschi, and M. D. Shawkey. “Interactions of Melanin with Electromagnetic Radiation: From Fundamentals to Applications.” Chem Rev 124, no. 11 (2024): 7165–213. [CrossRef]
- Oh, Jeong-Joo, Jee Young Kim, Seung Han Son, Won-Jo Jung, Da Hee Kim, Jin-Woo Seo, and Gyu-Hyeok Kim. “Fungal Melanin as a Biocompatible Broad-Spectrum Sunscreen with High Antioxidant Activity.” RSC Advances 11, no. 32 (2021): 19682–89. [CrossRef]
- Battistella, Claudia, Naneki C. McCallum, Karthikeyan Gnanasekaran, Xuhao Zhou, Valeria Caponetti, Marco Montalti, and Nathan C. Gianneschi. “Mimicking Natural Human Hair Pigmentation with Synthetic Melanin.” ACS Central Science 6, no. 7 (2020): 1179–88. [CrossRef]
- Menichetti, Arianna, Dario Mordini, Silvia Vicenzi, and Marco Montalti. “Melanin for Photoprotection and Hair Coloration in the Emerging Era of Nanocosmetics.” International Journal of Molecular Sciences 25, no. 11 (2024): 5862. [CrossRef]
- Brenner, M., and V. J. Hearing. “The Protective Role of Melanin against Uv Damage in Human Skin.” Photochem Photobiol 84, no. 3 (2008): 539–49. [CrossRef]
- Poorniammal, R., S. Prabhu, J. Jernisha, and L. Dufossé. “Microbial Pigments in Cosmetics and Personal Care.” In Microbial Colorants, 367–84, 2025. [CrossRef]
- Dai, Ke, Shuai Cao, Jiewei Yuan, Zhiwei Wang, Hong Li, Chengqian Yuan, Xuehai Yan, and Ruirui Xing. “Recent Advances of Sustainable Uv Shielding Materials: Mechanisms and Applications.” ACS Applied Materials & Interfaces 17, no. 21 (2025): 30402–22. [CrossRef]
- Flake, Aaliyah, and Koen Vercruysse. “The Invisible Fraction within Melanin Capable of Absorbing Uv Light and with Fluorescent Properties: Is It Lacking Consideration?” International Journal of Molecular Sciences 25, no. 15 (2024): 8490. [CrossRef]
- Vercruysse, Koen P., and Venise Govan. “The Yellow and the Black of Synthetic Melanins. .” ChemRxiv. Cambridge: Cambridge Open Engage, 2021. [CrossRef]
- Galeb, Hanaa A., Jonas Eichhorn, Sam Harley, Alexander J. Robson, Laurine Martocq, Steven J. Nicholson, Mark D. Ashton, Hend A. M. Abdelmohsen, Emel Pelit, Sara J. Baldock, Nathan R. Halcovitch, Benjamin J. Robinson, Felix H. Schacher, Victor Chechik, Koen Vercruysse, Adam M. Taylor, and John G. Hardy. “Phenolic Polymers as Model Melanins.” Macromolecular Chemistry and Physics 224, no. 14 (2023): 2300025. [CrossRef]
- Vercruysse, Koen P., Venise Govan, and Jaila Winford. 2024.
- Vercruysse, Koen P. “Preliminary Observations on the Interactions between Chlorogenic Acid and Select Amino Acids.”. ChemRxiv. Cambridge: Cambridge Open Engage, 2019. [CrossRef]
- Vercruysse, Koen P. “Evaluating the “Darkness” of Melanin Materials.”. ChemRxiv. Cambridge: Cambridge Open Engage, 2020.
- Vercruysse, Koen P., Venise Govan, and Stenesha Fortner. “Kinetic Study of the Melanogenesis from Select Catecholamines in the Presence of L-Cysteine or Other Amino Acids. .” ChemRxiv. Cambridge: Cambridge Open Engage, 2020. [CrossRef]
- Della Vecchia, Nicola F., Roberto Avolio, Michela Alfè, Maria E. Errico, Alessandra Napolitano, and Marco d’Ischia. “Building-Block Diversity in Polydopamine Underpins a Multifunctional Eumelanin-Type Platform Tunable through a Quinone Control Point.” Advanced Functional Materials 23, no. 10 (2013): 1331–40. [CrossRef]
- Ito, S., K. Wakamatsu, and T. Sarna. “Photodegradation of Eumelanin and Pheomelanin and Its Pathophysiological Implications.” Photochem Photobiol 94, no. 3 (2018): 409–20. [CrossRef]
- Ozeki, H., S. Ito, K. Wakamatsu, and A. J. Thody. “Spectrophotometric Characterization of Eumelanin and Pheomelanin in Hair.” Pigment Cell Res 9, no. 5 (1996): 265–70. [CrossRef]
- Wakamatsu, K., A. Nagao, M. Watanabe, K. Nakao, and S. Ito. “Pheomelanogenesis Is Promoted at a Weakly Acidic Ph.” Pigment Cell Melanoma Res 30, no. 3 (2017): 372–77. [CrossRef]
- Vercruysse, Koen P. “Disorder Vs. Order: The Common Features in the Spectroscopic Analyses of Diverse Melanin Materials.” ChemRxiv. Cambridge: Cambridge Open Engage, 2025. [CrossRef]
- Smith, Brian C. “The Carbonyl Group, Part V: Carboxylates - Coming Clean.” Spectroscopy 33, no. 5 (2018): 20–23.
- Smith, Brian C. “The C=O Bond, Part Iii: Carboxylic Acids.” Spectroscopy 33, no. 1 (2018): 14–20.
- Smith, Brian C. “Alcohols - the Rest of the Story.” Spectroscopy 32, no. 4 (2017): 19–23.
- Smith, Brian C. “Organic Nitrogen Compounds V: Amine Salts.” Spectroscopy 34, no. 9 (2019): 3037.
- Micillo, R., L. Panzella, K. Koike, G. Monfrecola, A. Napolitano, and M. d’Ischia. ““Fifty Shades” of Black and Red or How Carboxyl Groups Fine Tune Eumelanin and Pheomelanin Properties.” Int J Mol Sci 17, no. 5 (2016). [CrossRef]
- d’Ischia, Marco, Kazumasa Wakamatsu, Alessandra Napolitano, Stefania Briganti, José-Carlos Garcia-Borron, Daniela Kovacs, Paul Meredith, Alessandro Pezzella, Mauro Picardo, Tadeusz Sarna, John D. Simon, and Shosuke Ito. “Melanins and Melanogenesis: Methods, Standards, Protocols.” Pigment Cell & Melanoma Research 26, no. 5 (2013): 616–33. [CrossRef]
- Pralea, I. E., R. C. Moldovan, A. M. Petrache, M. Ilies, S. C. Heghes, I. Ielciu, R. Nicoara, M. Moldovan, M. Ene, M. Radu, A. Uifalean, and C. A. Iuga. “From Extraction to Advanced Analytical Methods: The Challenges of Melanin Analysis.” Int J Mol Sci 20, no. 16 (2019). [CrossRef]
- Stenkamp, Victoria S., Patricia McGuiggan, and John C. Berg. “Restabilization of Electrosterically Stabilized Colloids in High Salt Media.” Langmuir 17, no. 3 (2001): 637–51. [CrossRef]
- Perna, Guiseppe, Maria Lasalvia, and Vito Capozzi. “Vibrational Spectroscopy of Synthetic and Natural Eumelanin.” Polym Int 65 (2016): 1323–30. [CrossRef]
- Bedran, Z. V., S. S. Zhukov, P. A. Abramov, I. O. Tyurenkov, B. P. Gorshunov, A. B. Mostert, and K. A. Motovilov. “Water-Activated Semiquinone Formation and Carboxylic Acid Dissociation in Melanin Revealed by Infrared Spectroscopy.” Polymers (Basel) 13, no. 24 (2021). [CrossRef]
- Micillo, R., L. Panzella, M. Iacomino, G. Prampolini, I. Cacelli, A. Ferretti, O. Crescenzi, K. Koike, A. Napolitano, and M. d’Ischia. “Eumelanin Broadband Absorption Develops from Aggregation-Modulated Chromophore Interactions under Structural and Redox Control.” Sci Rep 7 (2017): 41532. [CrossRef]
Figure 1.
Chemical structures of the precursors used in the synthesis of MN-like materials for this report.
Figure 1.
Chemical structures of the precursors used in the synthesis of MN-like materials for this report.
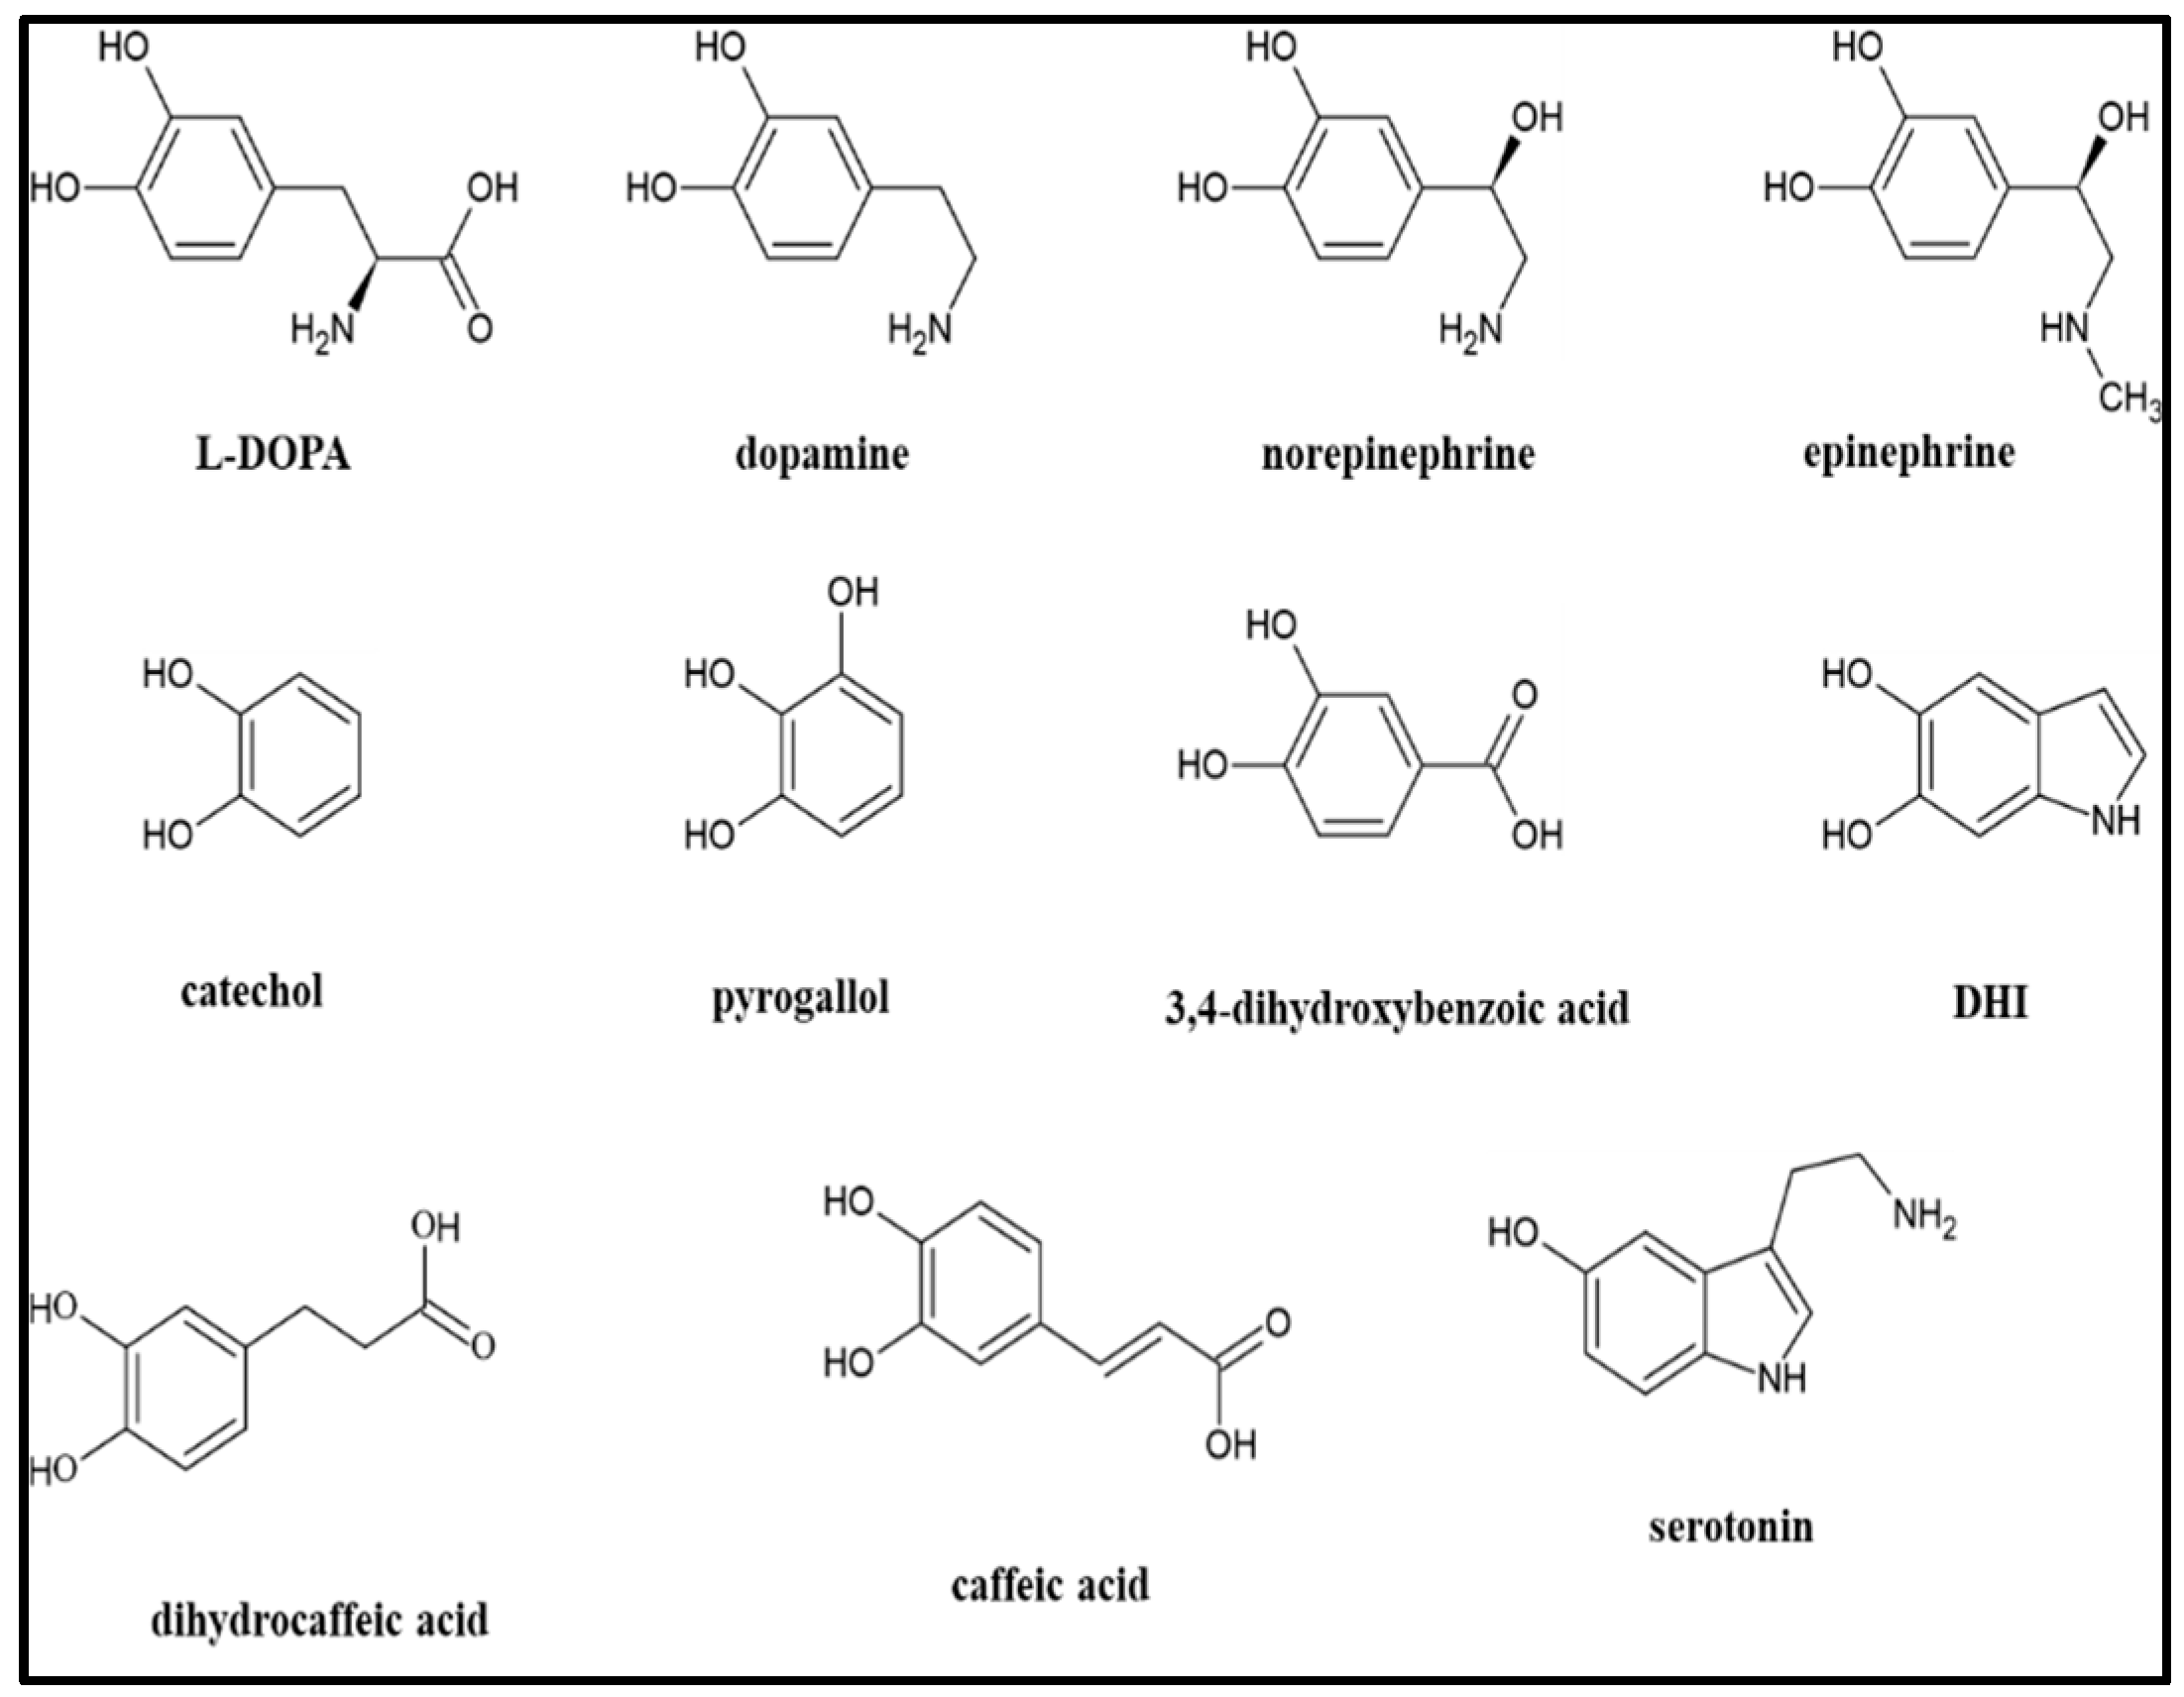
Figure 2.
(a) Absorbance profiles in vis/NIR region of L-DOPA based MN material dispersed in water at varying concentrations. (b) Concentration dependency of the values of AUCvis, calculated using equation (2), and the value of A0 from equation (1).
Figure 2.
(a) Absorbance profiles in vis/NIR region of L-DOPA based MN material dispersed in water at varying concentrations. (b) Concentration dependency of the values of AUCvis, calculated using equation (2), and the value of A0 from equation (1).
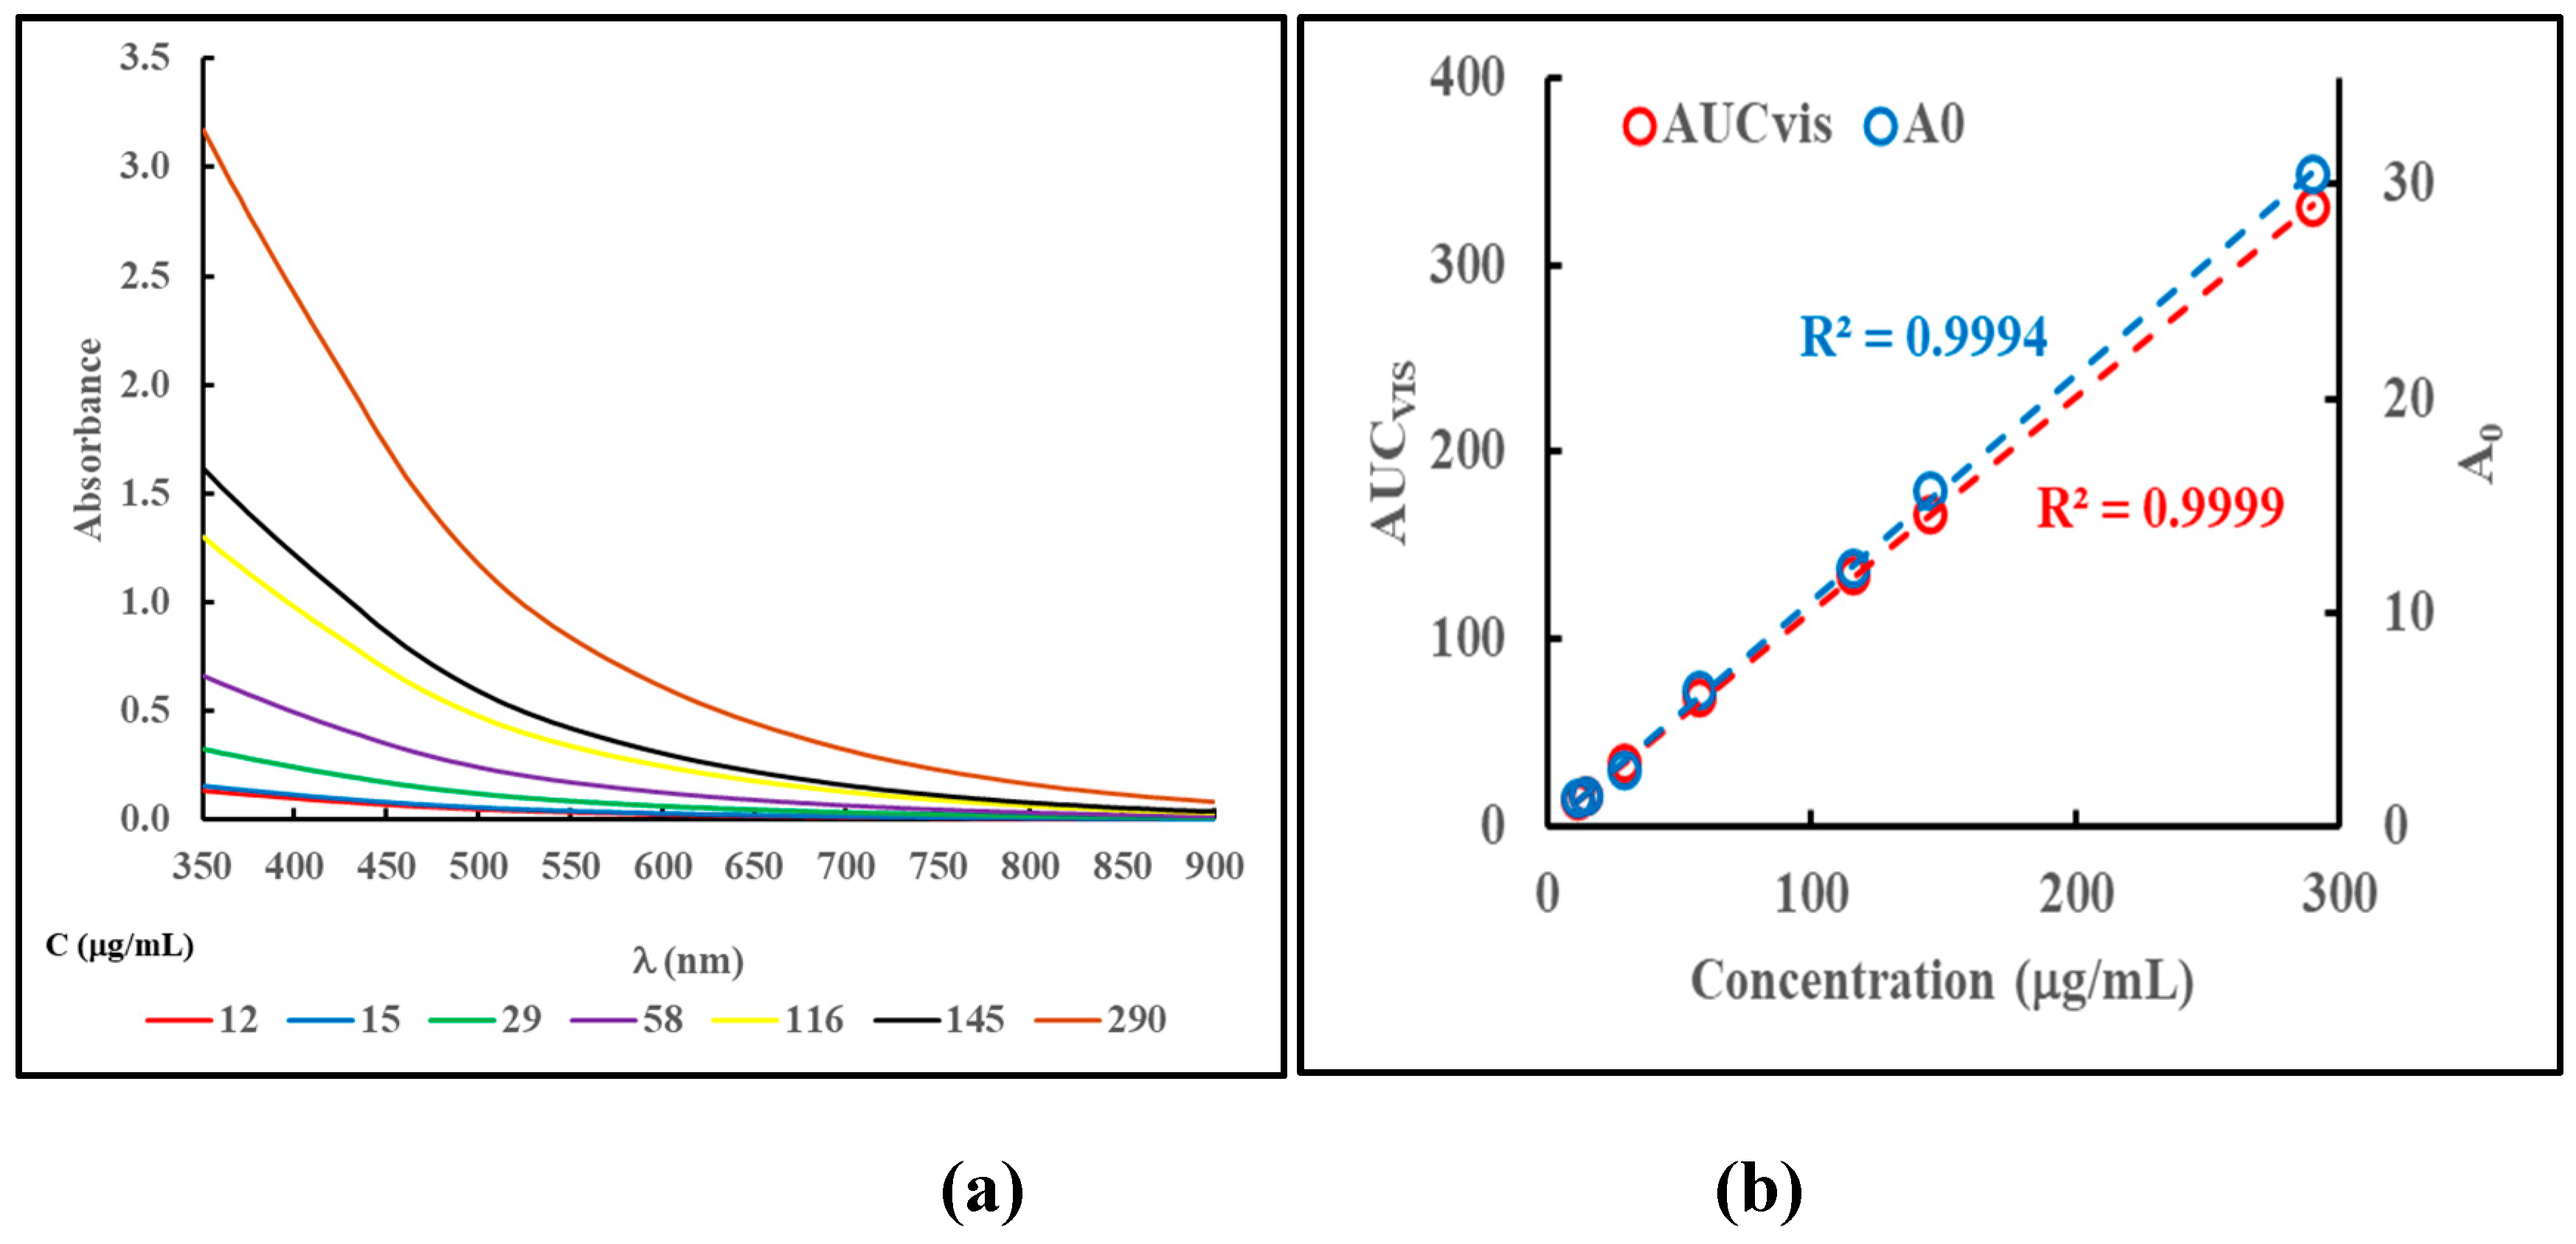
Figure 3.
(a) UV absorbance profiles of a L-DOPA based MN material dispersed in water at varying concentrations. (b) Relationship between the values of AUCUVT, AUCUVA and AUCUVB (calculated using equations (3a), (3b) and (3c)), and sample concentration.
Figure 3.
(a) UV absorbance profiles of a L-DOPA based MN material dispersed in water at varying concentrations. (b) Relationship between the values of AUCUVT, AUCUVA and AUCUVB (calculated using equations (3a), (3b) and (3c)), and sample concentration.
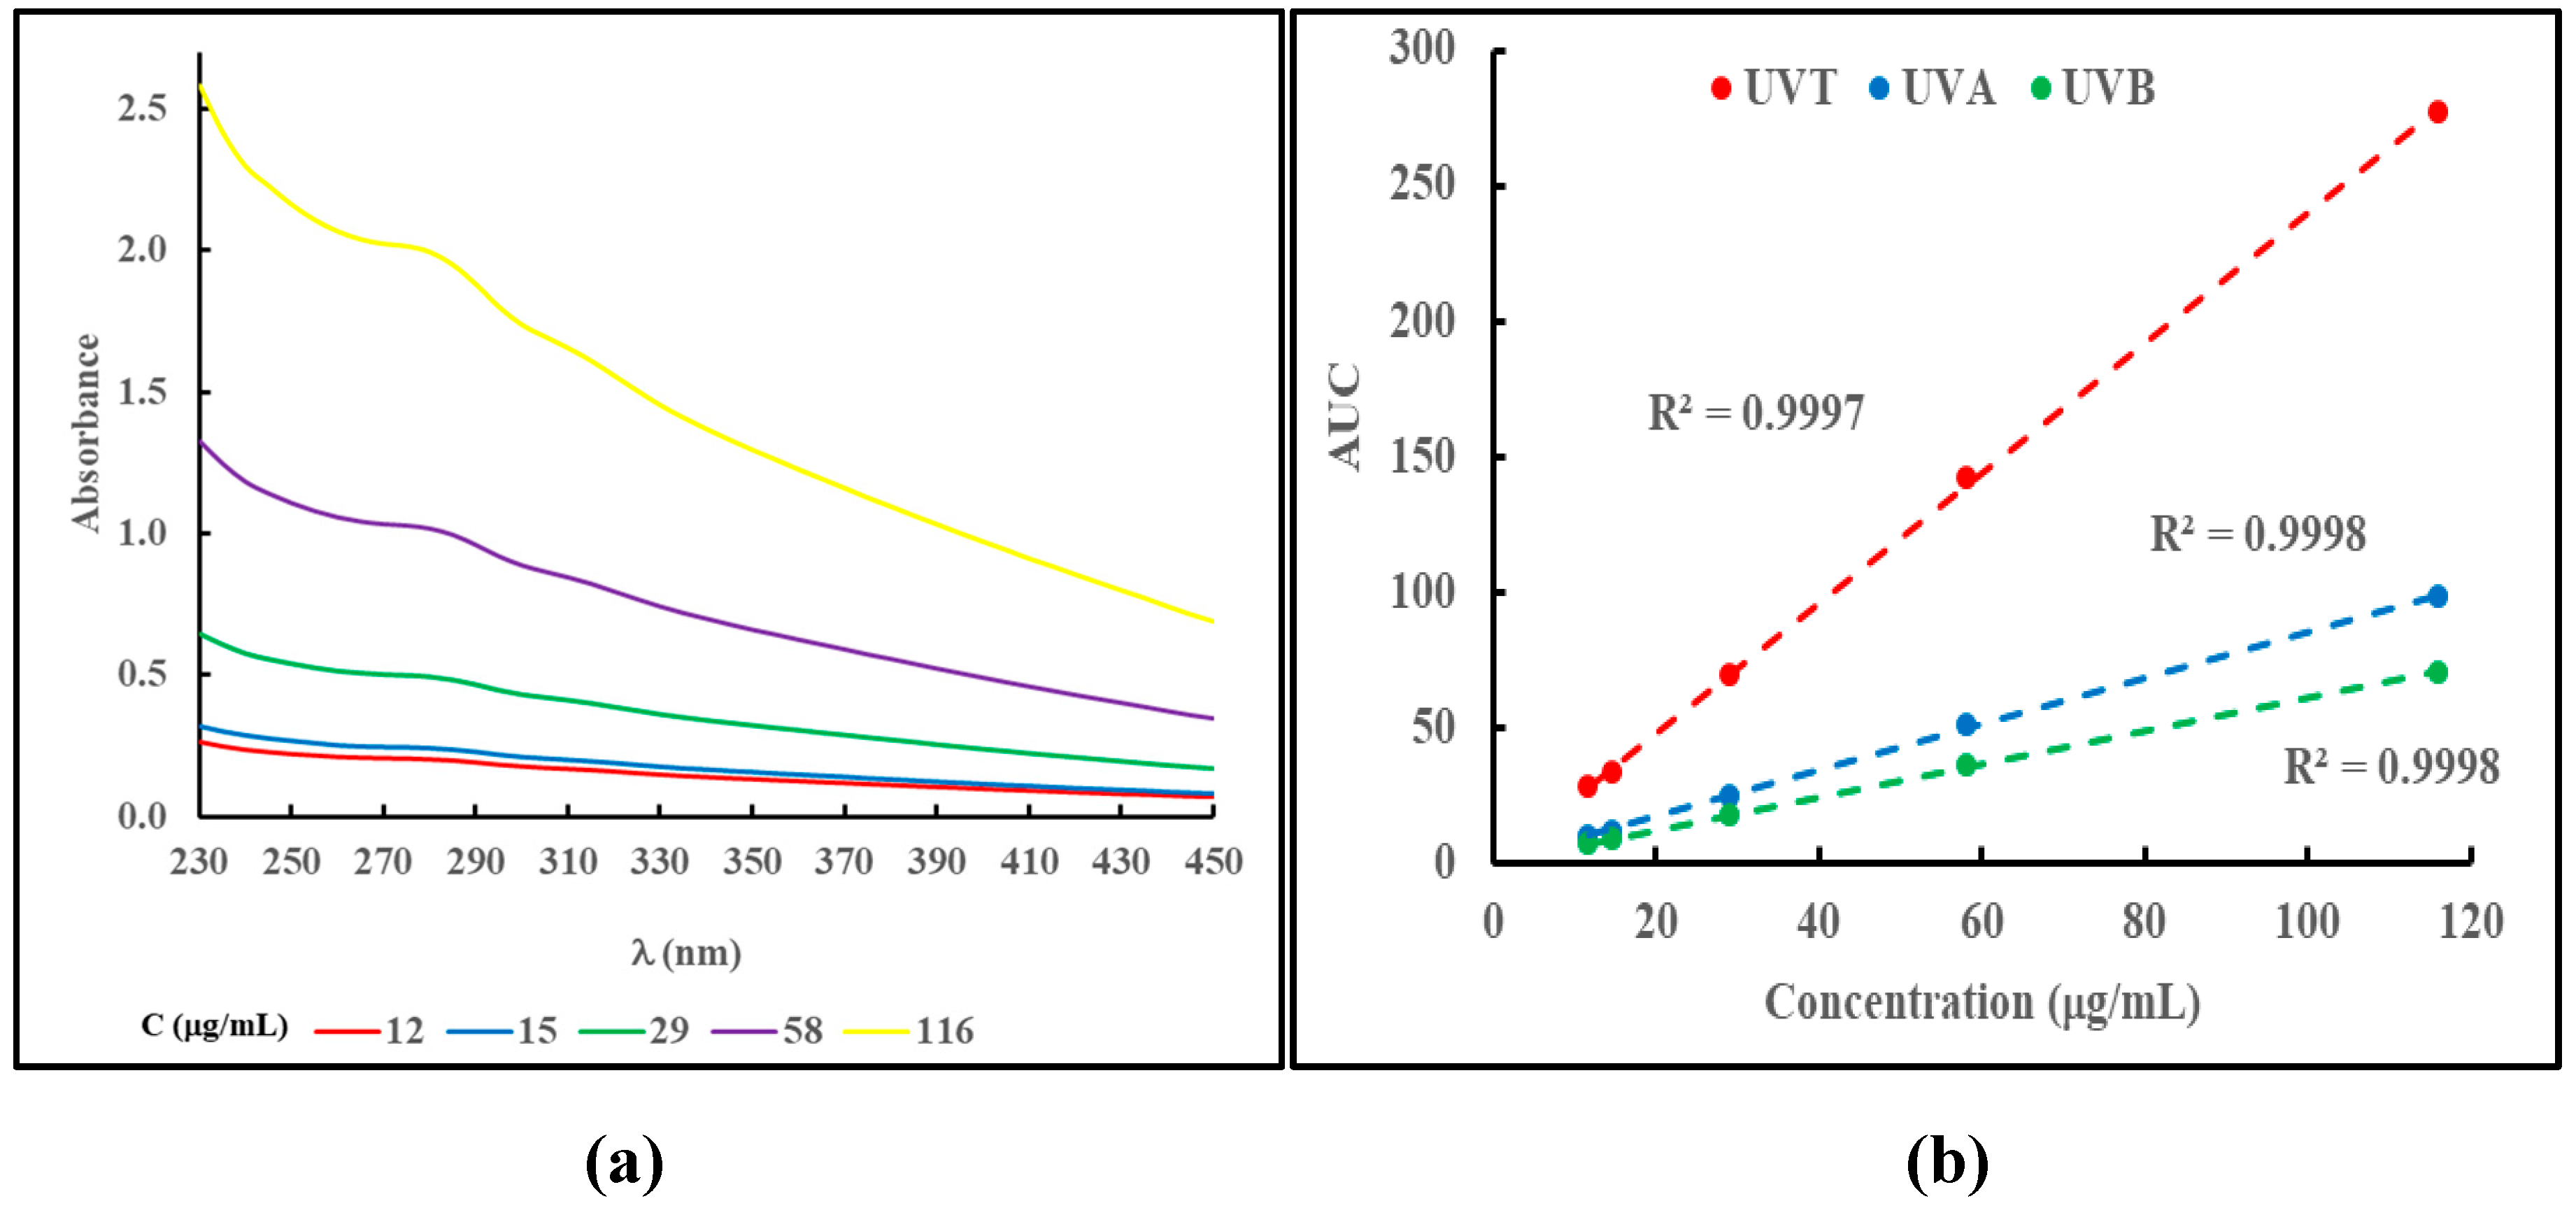
Figure 4.
Plot of the average (± standard deviation) value of k as a function of the average (± standard deviation) value of A650/A500 according to equation (4) at the end of the synthesis reaction for the individual precursors used in the studies outlined in Section 2.4 and 2.5.
Figure 4.
Plot of the average (± standard deviation) value of k as a function of the average (± standard deviation) value of A650/A500 according to equation (4) at the end of the synthesis reaction for the individual precursors used in the studies outlined in Section 2.4 and 2.5.
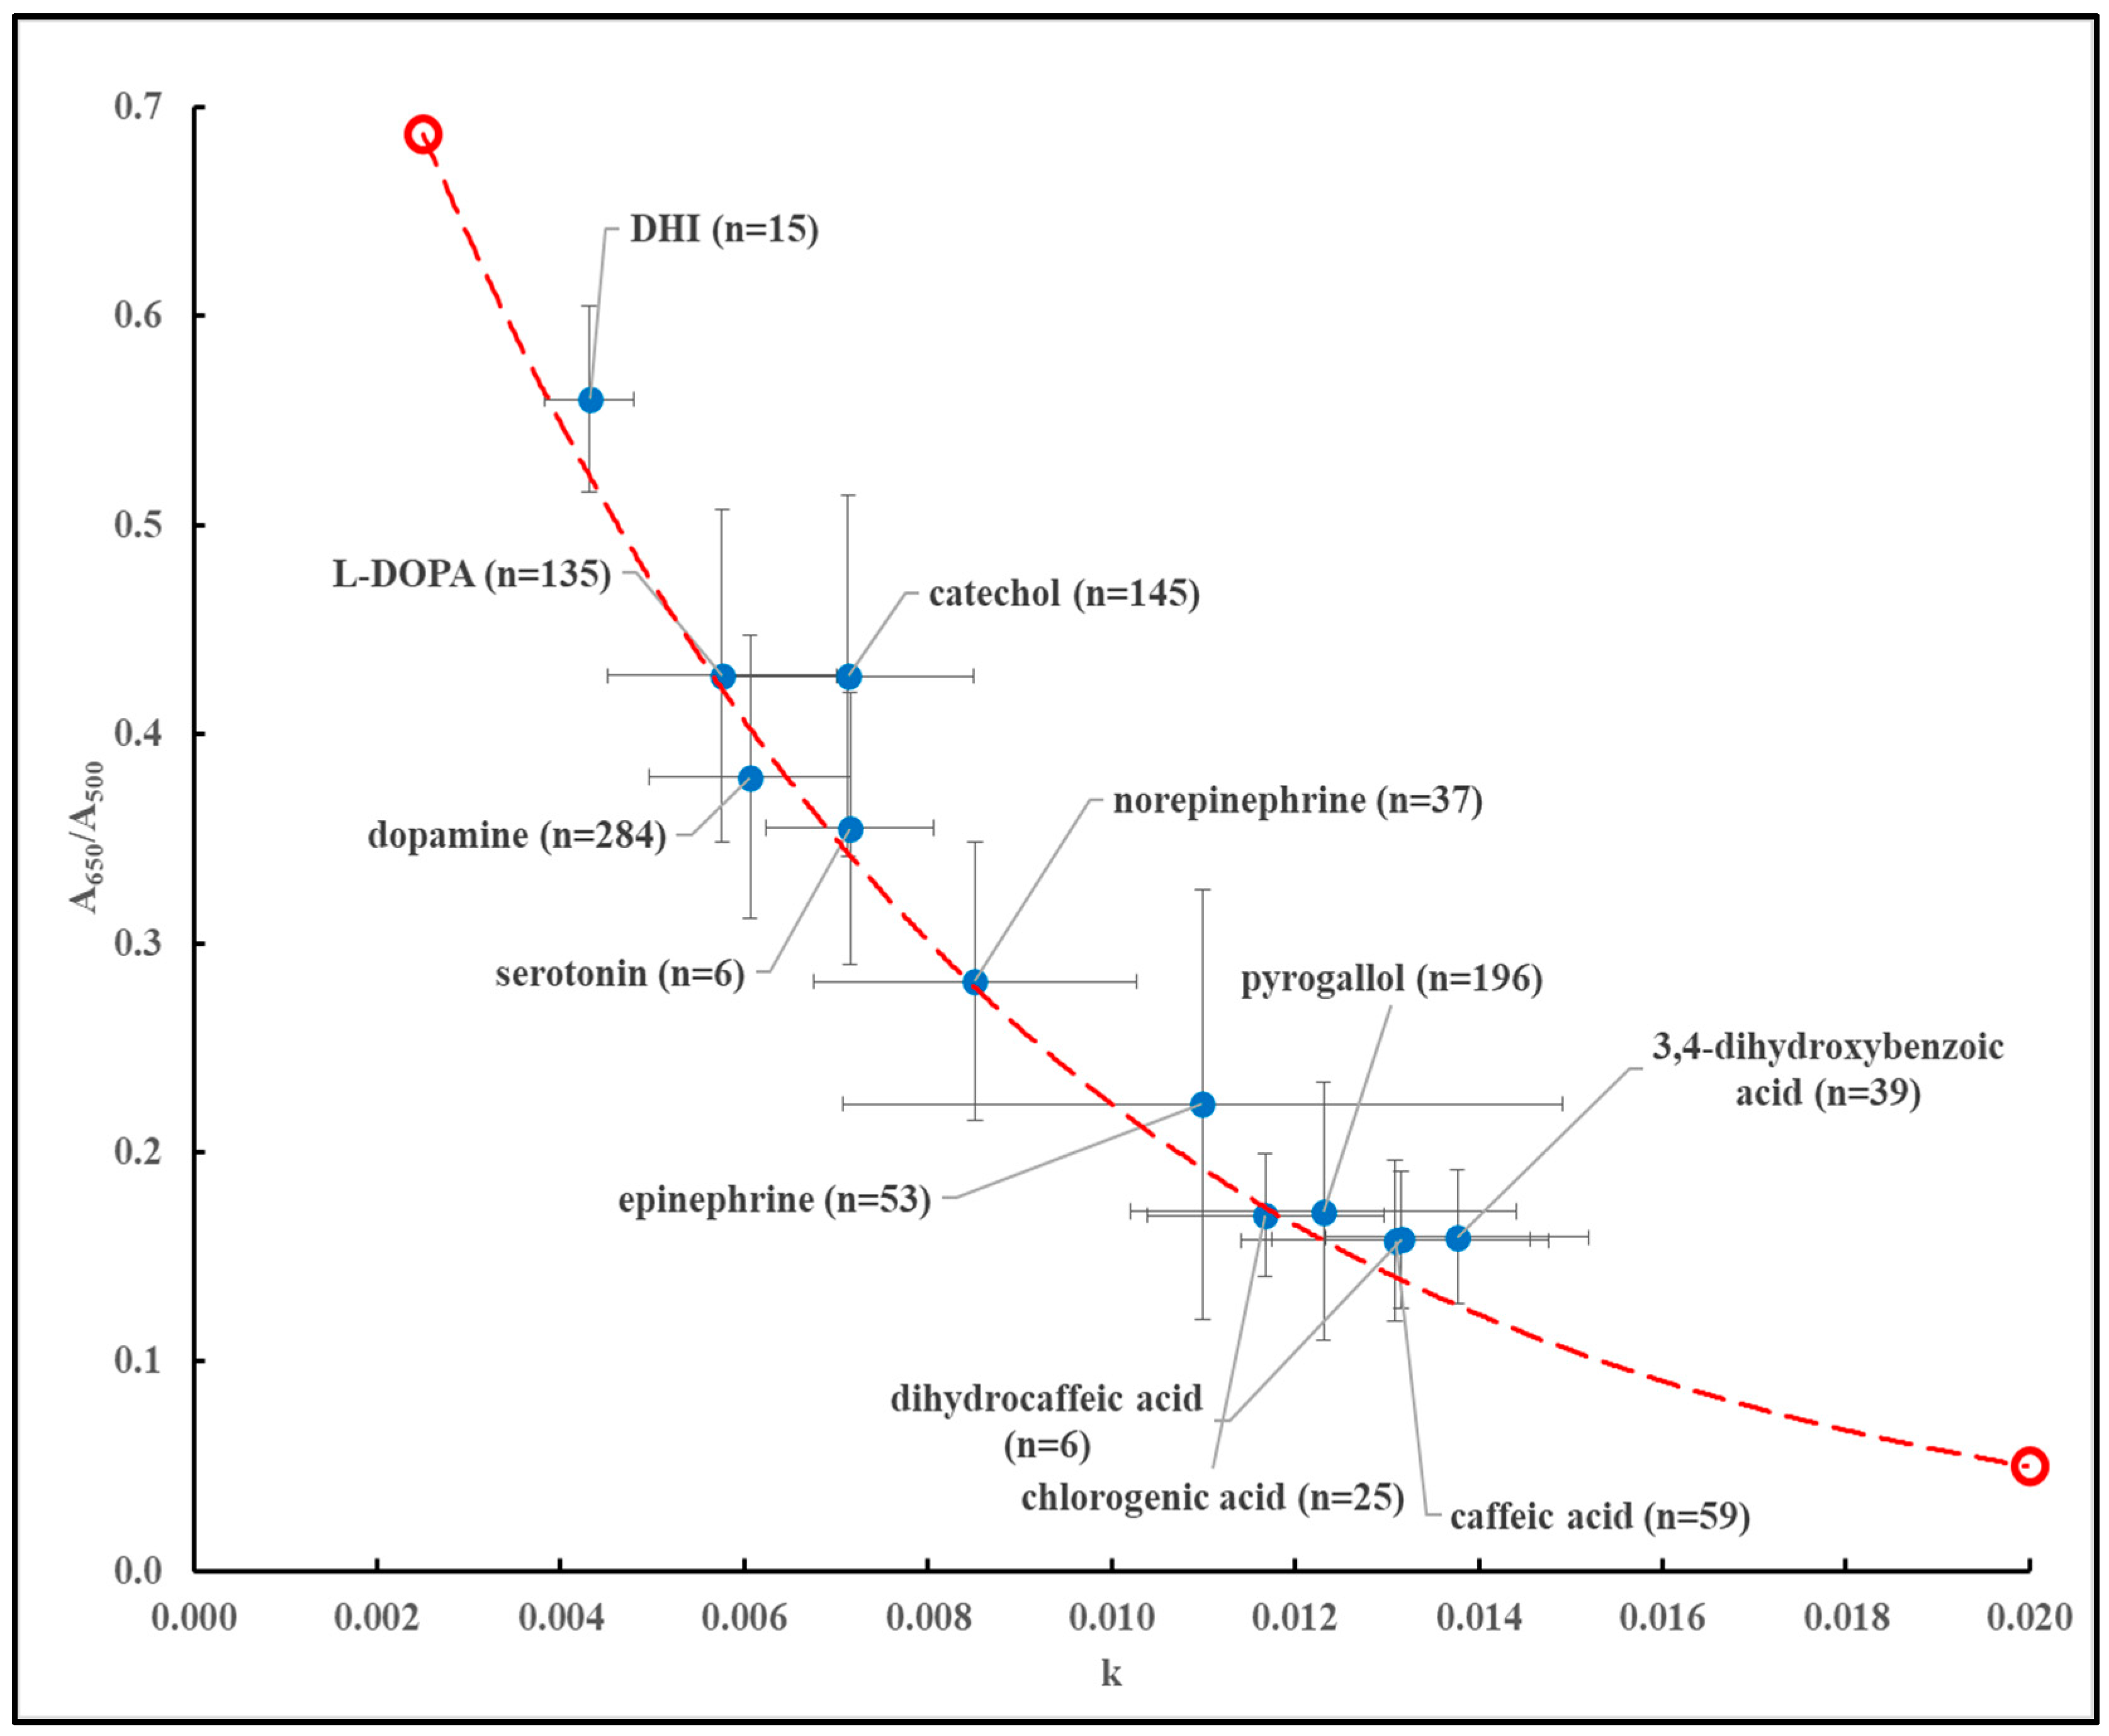
Figure 5.
Graphical representation of the appearance of different melanin-like materials dispersed at different concentrations (see Table 1) using the average values of k and A650/A500 obtained for the materials illustrated. The line represents the theoretical relationship between k and A650/A500 according to equation (4).
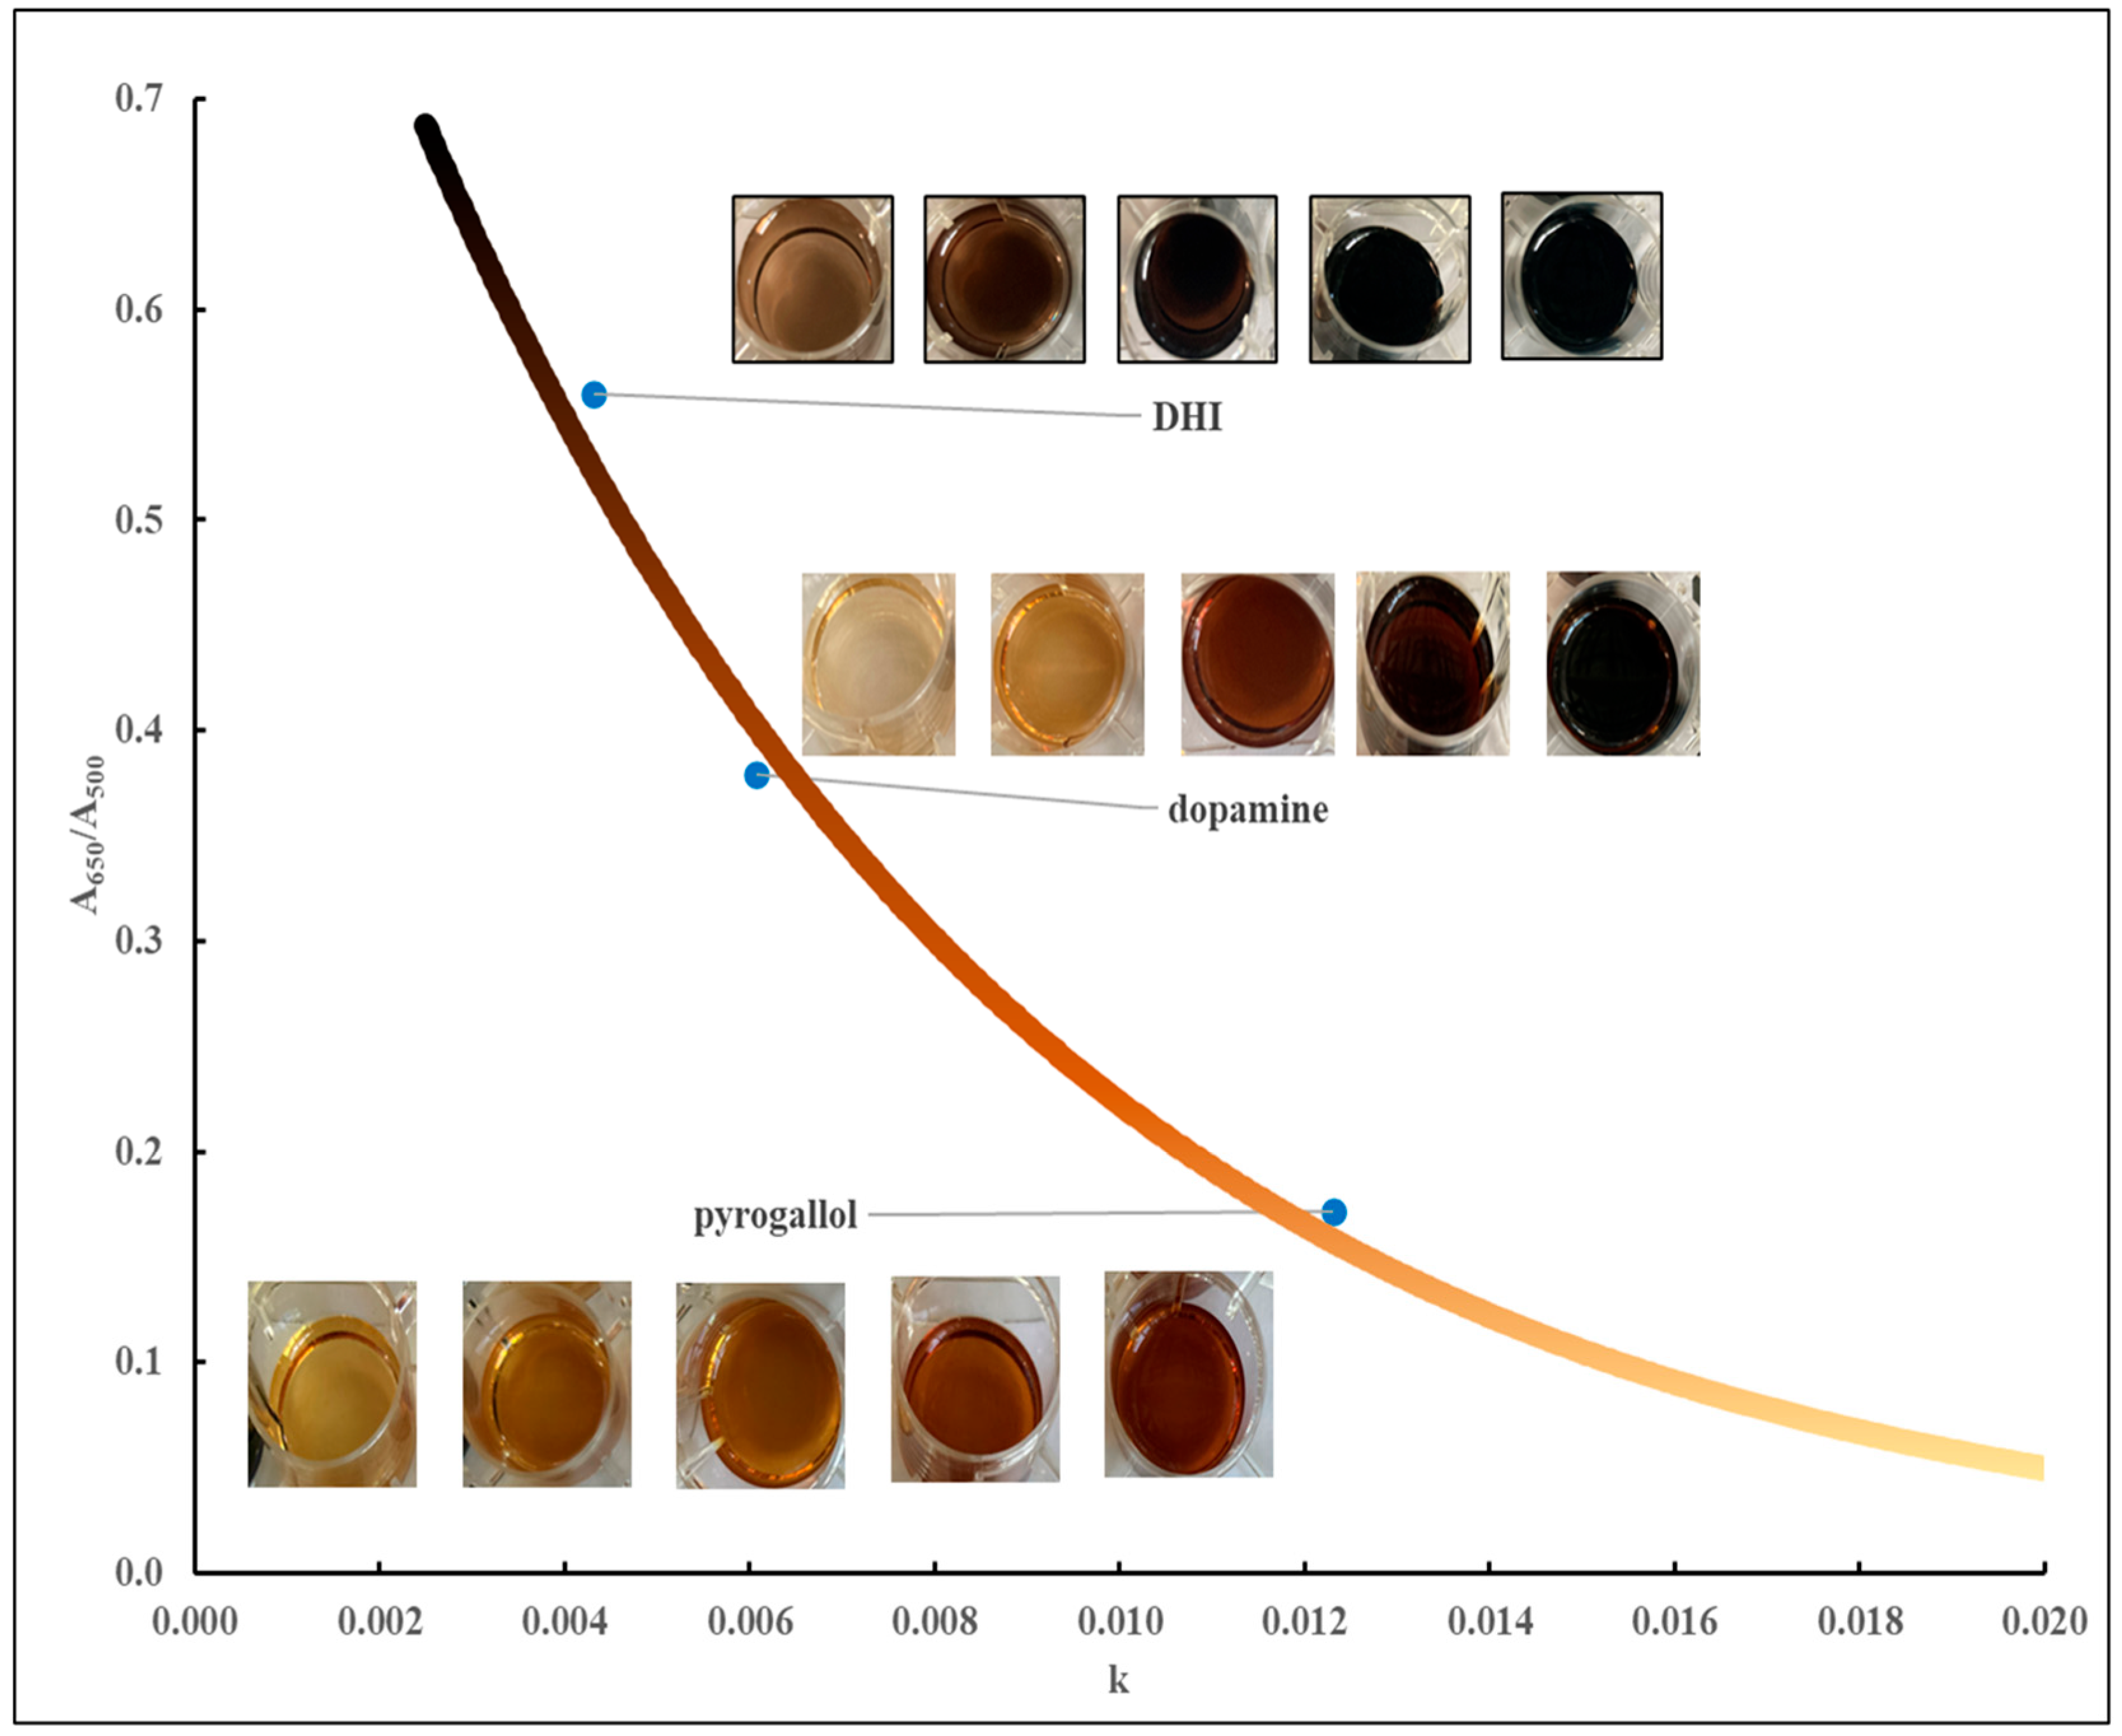
Figure 6.
Correlation between the values of AUCvis/C from Table 2 and the values of AUCUVT/C, AUCUVA/C and AUCUVB/C from Table 3.
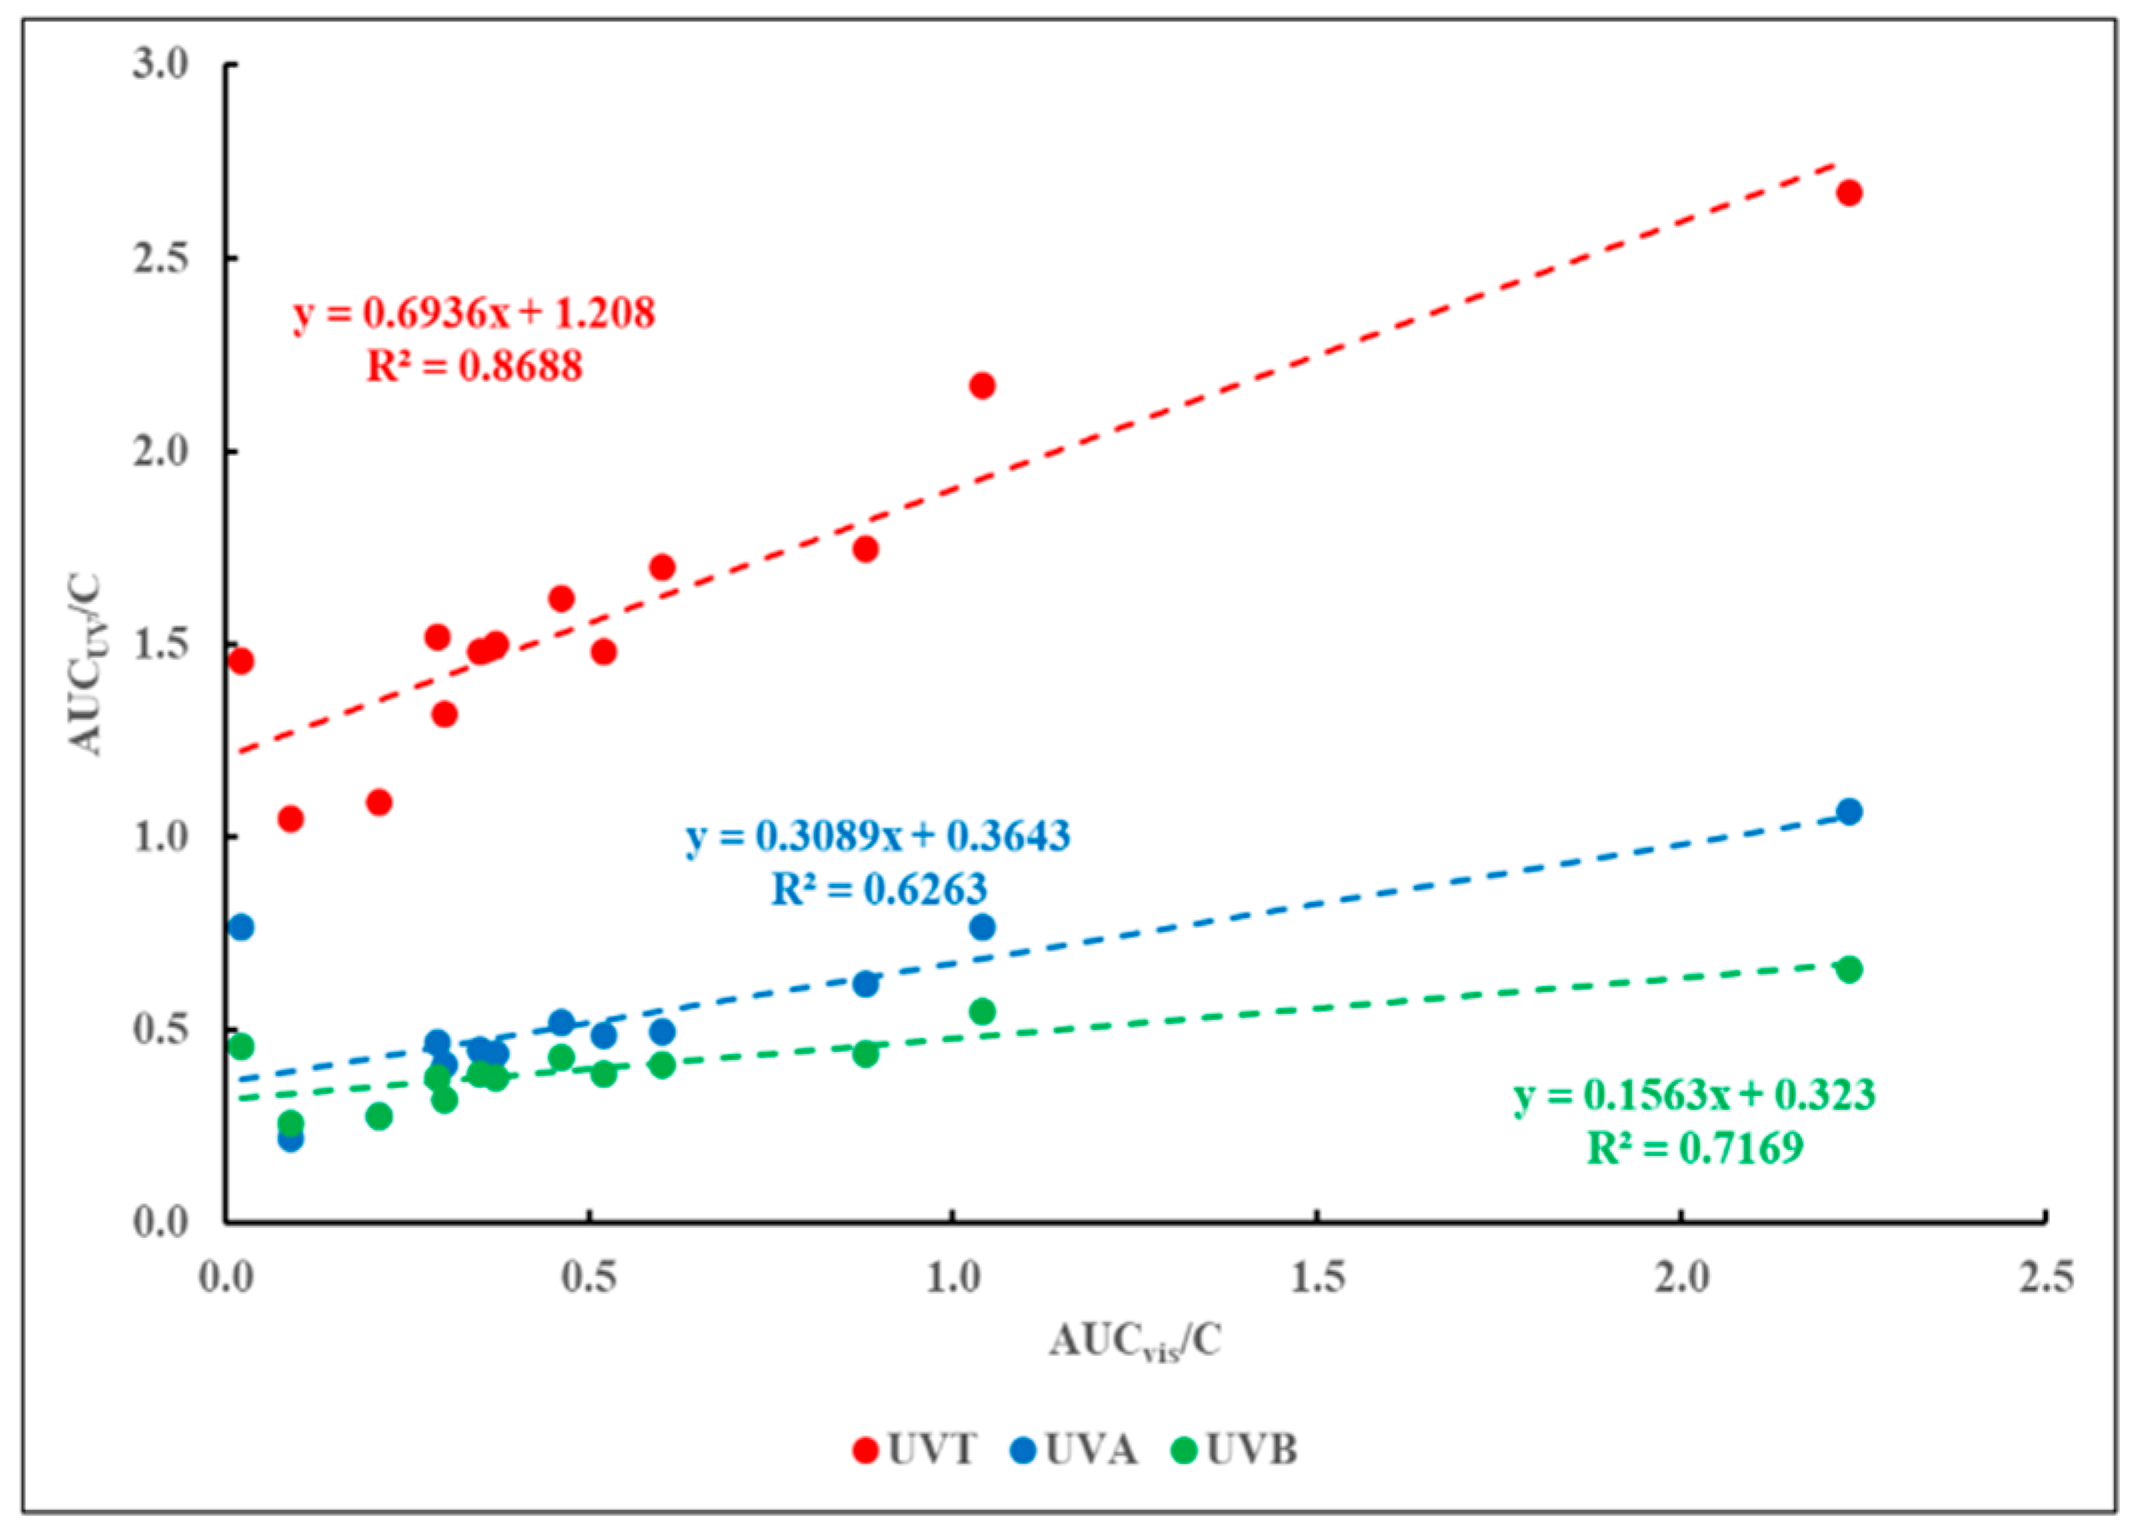
Figure 7.
(a) Normalized FT-IR spectra of MN-like material derived from dopamine or pyrogallol and purified through dialysis or HCl-induced precipitation. (b) Absorbance difference following subtraction of the normalized spectrum of the dialyzed material from the normalized spectrum of the HCl-precipitated material shown in panel (b).
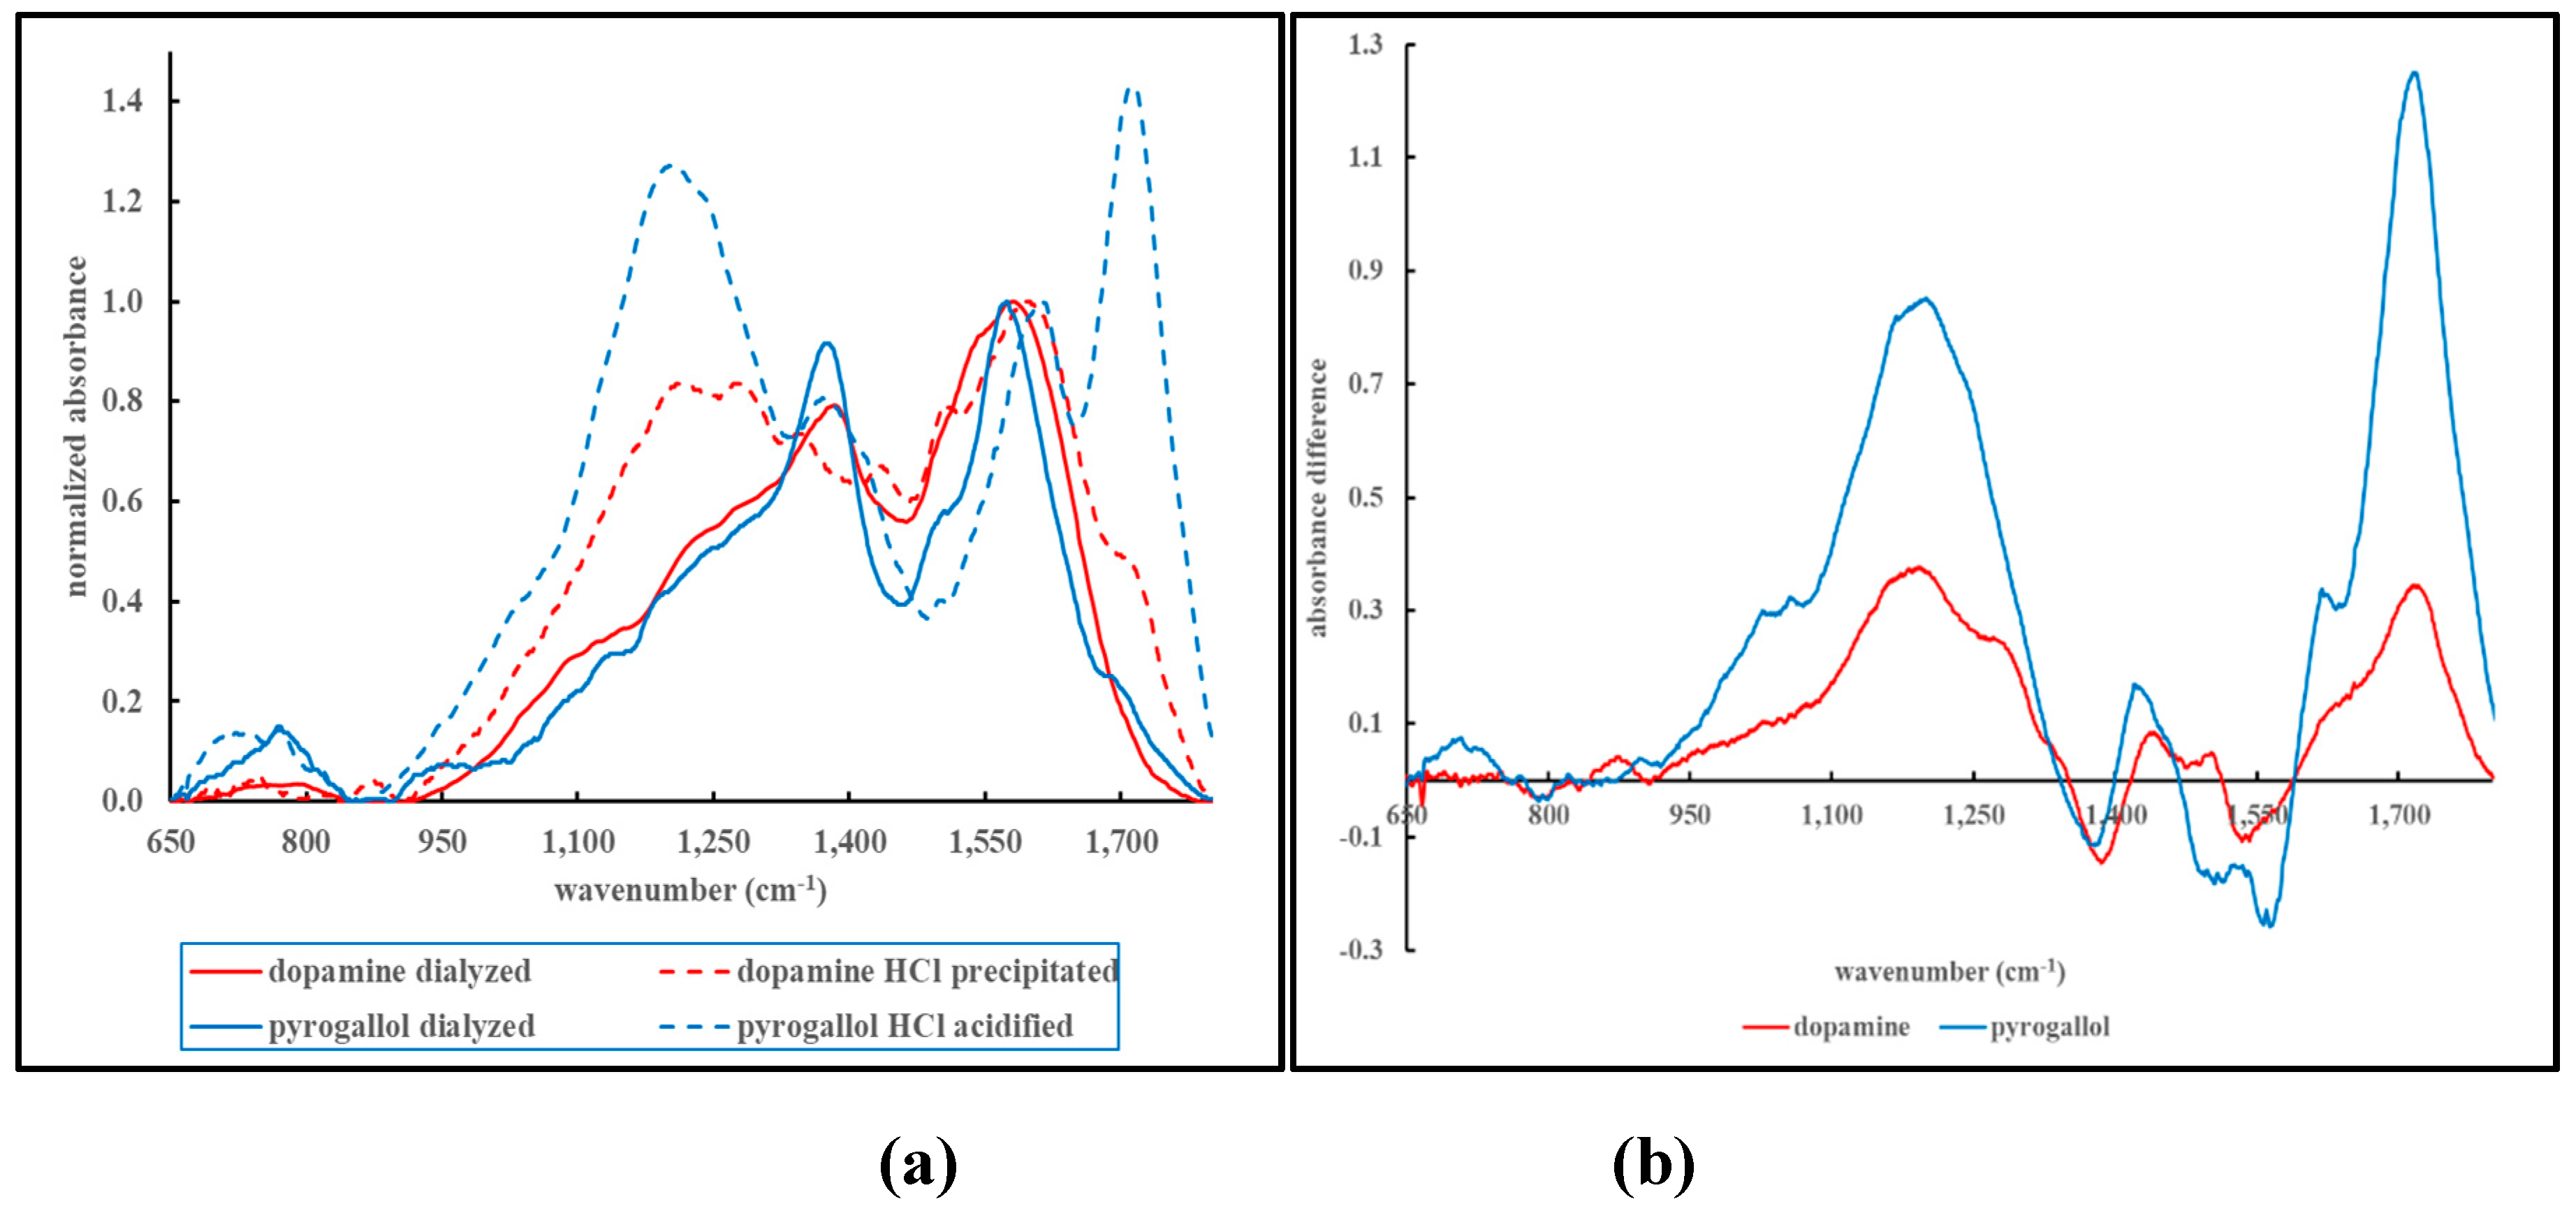
Figure 8.
Relative AUCvis of the supernatants following precipitation of dopamine- or DHI-based MN material, dispersed in water at 0.7 mg/mL and mixed with varying concentrations of Ca2+.
Figure 8.
Relative AUCvis of the supernatants following precipitation of dopamine- or DHI-based MN material, dispersed in water at 0.7 mg/mL and mixed with varying concentrations of Ca2+.
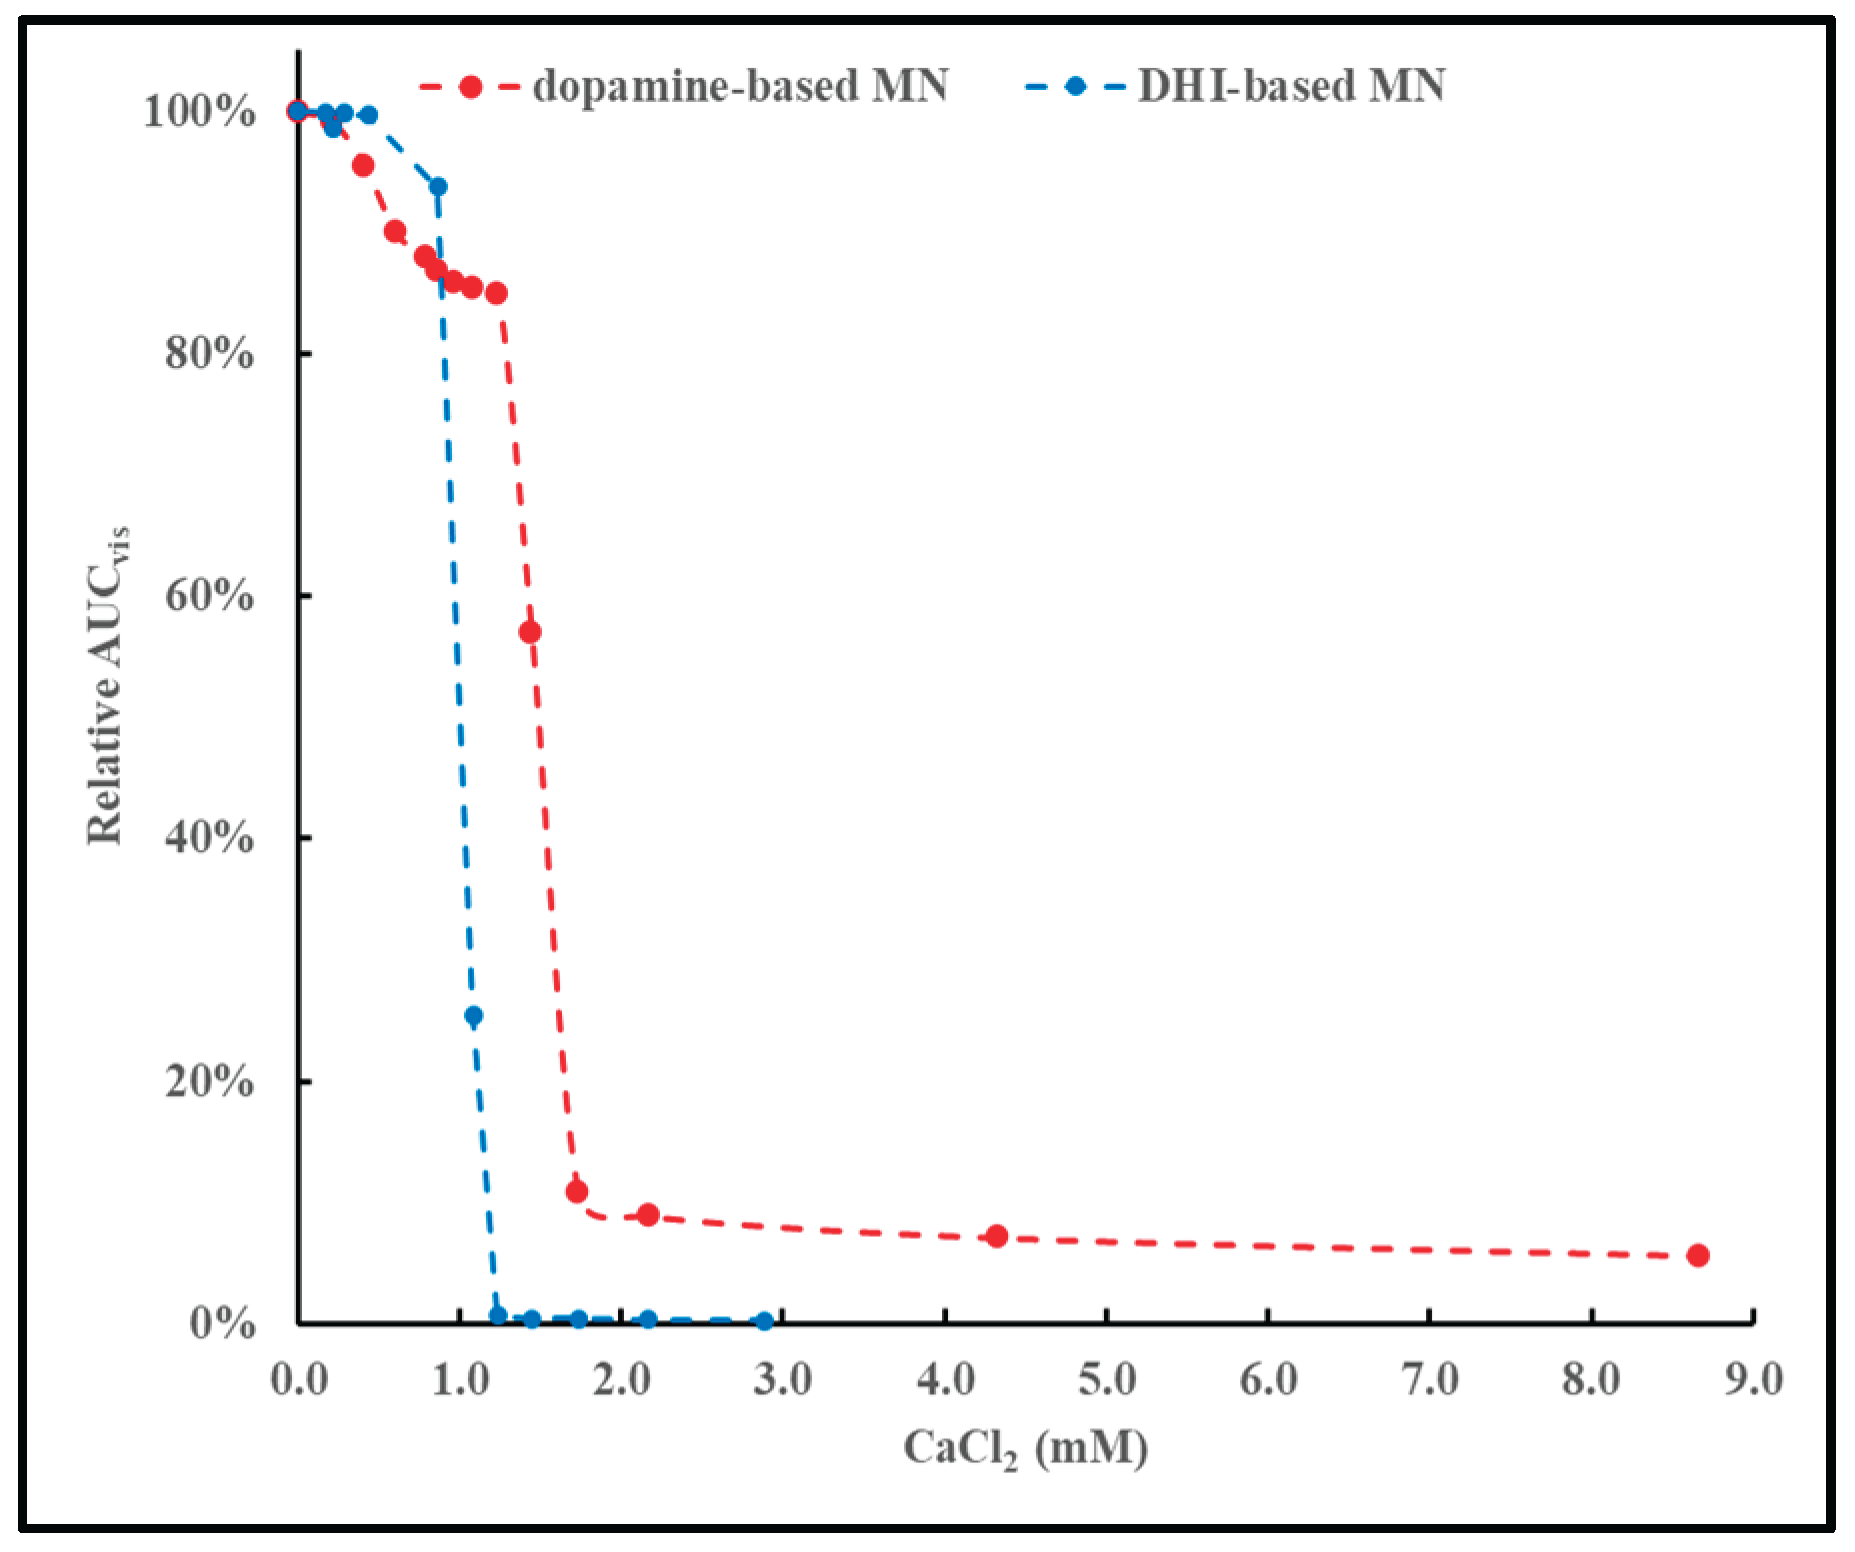

Table 1.
Photographs of dialyzed and freezedried MN materials synthesized from different precursors and dispersed in water at different concentrations (C); photographs by K.V.).
Table 1.
Photographs of dialyzed and freezedried MN materials synthesized from different precursors and dispersed in water at different concentrations (C); photographs by K.V.).
| Pyrogallol-based | ||||
 C = 472 g/mL |
 C = 810 g/mL |
 C = 1,417 g/mL |
 C = 2,125 g/mL |
 C = 2,833 g/mL |
| Dopamine-based | ||||
 C = 132 g/mL |
 C = 362 g/mL |
 C = 925 g/mL |
 C = 1,388 g/mL |
 C = 2,775 g/mL |
| DHI-based | ||||
 C = 46 g/mL |
 C = 90 g/mL |
 C = 175 g/mL |
 C = 560 g/mL |
 C = 2,800 g/mL |
Table 2.
Comparison of AUCvis/C, k, and (AUCvis/C)/k values of MN-like materials synthesized from various precursors and purified as outlined in Section 2.4. AUCvis was calculated according to equation (2). Dilution series of each MN material, dispersed in distilled water, at six different concentrations were analyzed in triplicate. All values shown are average ± standard deviation.
| Precursor | AUCvis/C | k | (AUCvis/C)/k |
| 3,4-dihydroxy benzoic acid catechol catechol DHI dopamine dopamine epinephrine L-DOPA L-DOPA norepinephrine norepinephrine pyrogallol pyrogallol |
0.090 ± 0.016 0.37 ± 0.03 0.21 ± 0.02 2.23 ± 0.3 0.52 ± 0.05 0.46 ± 0.04 0.022 ± 0.001 0.88 ± 0.05 1.04 ± 0.10 0.35 ± 0.03 0.60 ± 0.01 0.30 ± 0.02 0.29 ± 0.01 |
0.0127 ± 0.0002 0.0085 ± 0.0004 0.0069 ± 0.0002 0.0050 ± 0.0002 0.0077 ± 0.0005 0.0083 ± 0.0002 0.0128 ± 0.0016 0.0063 ± 0.0002 0.0064 ± 0.0001 0.0118 ± 0.0011 0.0103 ± 0.0001 0.0127 ± 0.0002 0.0130 ± 0.0005 |
7.1 ± 1.2 44 ± 5.2 30 ± 3.6 447 ± 76 67 ± 6.2 56 ± 5.0 1.69 ± 0.09 139 ± 9.3 163 ± 14 30 ± 0.88 58 ± 0.68 24 ± 1.40 22 ± 0.67 |
Table 3.
Comparison of AUCUVT/C, AUCUVA/C and AUCUVB/C values of MN-like materials synthesized from various precursors and purified as outline Section 2.4. Dilution series of each MN material, dispersed in distilled water, at four different concentrations were analyzed in triplicate. All values shown are average ± standard deviation.
| Precursor | AUCUVT/C | AUCUVA/C | AUCUVB/C |
| 3,4-dihydroxy benzoic acid catechol catechol DHI dopamine dopamine epinephrine L-DOPA L-DOPA norepinephrine norepinephrine pyrogallol pyrogallol |
1.05 ± 0.14 1.50 ± 0.11 1.09 ± 0.06 2.67 ± 0.33 1.48 ± 0.14 1.62 ± 0.16 1.46 ± 0.05 1.75 ± 0.06 2.17 ± 0.18 1.48 ± 0.05 1.70 ± 0.04 1.32 ± 0.06 1.52 ± 0.03 |
0.22 ± 0.03 0.44 ± 0.03 0.28 ± 0.02 1.07 ± 0.14 0.49 ± 0.04 0.52 ± 0.05 0.77 ± 0.04 0.62 ± 0.02 0.77 ± 0.06 0.45 ± 0.02 0.50 ± 0.01 0.41 ± 0.02 0.47 ± 0.01 |
0.26 ± 0.04 0.38 ± 0.03 0.28 ± 0.02 0.66 ± 0.08 0.39 ± 0.04 0.43 ± 0.04 0.46 ± 0.01 0.44 ± 0.01 0.55 ± 0.05 0.39 ± 0.01 0.41 ± 0.06 0.32 ± 0.01 0.38 ± 0.01 |
Disclaimer/Publisher’s Note: The statements, opinions and data contained in all publications are solely those of the individual author(s) and contributor(s) and not of MDPI and/or the editor(s). MDPI and/or the editor(s) disclaim responsibility for any injury to people or property resulting from any ideas, methods, instructions or products referred to in the content. |
© 2025 by the authors. Licensee MDPI, Basel, Switzerland. This article is an open access article distributed under the terms and conditions of the Creative Commons Attribution (CC BY) license (http://creativecommons.org/licenses/by/4.0/).
Copyright: This open access article is published under a Creative Commons CC BY 4.0 license, which permit the free download, distribution, and reuse, provided that the author and preprint are cited in any reuse.


