Submitted:
20 September 2025
Posted:
23 September 2025
You are already at the latest version
Abstract
Classical Molecular Dynamics simulations were used to investigate the interfacial adsorption of ethane on ultrathin molten polyethylene films. We investigated the interfacial adsorption of supercritical ethane on ultrathin molten polyethylene films at various temperatures (298.15 - 448.15 K) and pressures (0.28 - 13.17 MPa). Ethane was found to accumulate preferentially at the film's interfaces rather than dissolving into the film's core. The ultra-thin, metastable films, studied at their mechanical stability limit, are composed of two overlapping interfaces. The films show some fractions of interfacial chains transiently desorbing from the film surface and entering the gas phase, which facilitates the accumulation of ethane at the interfaces. At 373.15 K and pressures between 0.29 and 9.65 MPa, the combined film interfaces adsorb between 4.8 and 8.6 times more ethane than the amount solubilized in the central, bulk region of the film. Interfacial tension decreases exponentially with increasing gas pressure. Interfacial tension is primarily governed by inter-chain interactions at the interface. Minor contributions arise from the vibrational dynamics of polyethylene chain fractions that transiently desorb from the film surface. Furthermore, the solubility of ethane in the film's bulk region exhibits a temperature-dependent inversion: at 298.15 K, the ethane density in the film's center slightly exceeds that of the bulk gas, but this trend reverses at 373.15 K and becomes more pronounced as the temperature increases. This indicates a potential solubility transition temperature between 298.15 and 373.15 K.
Keywords:
thin films
; polyethylene
; ethane
; interfacial adsorption
; interfacial tension
1. Introduction
Polymer-based coatings solve multiple technological problems beyond surface insulation. In addition to protecting commercial products [1,2,3] or large surfaces like building components, these coatings also provide specialized functions such as waterproofing, fire resistance, and thermal insulation [4,5,6].
Polymeric structures are also employed as adsorbent materials. Specifically, bulk polyethylene (PE) in its linear (HDPE and LLDPE) and branched (LDPE) structures, has been extensively studied for its ability to store and separate various gases of industrial interest, such as H₂, CO₂, ethylene, and light alkanes [7,8,9], as well as environmental pollutants like CO₂, polycyclic aromatic hydrocarbons, and polychlorinated biphenyls [10,11,12]. PE is widely used due to a combination of low cost, excellent processability, high chemical inertness, remarkable durability and flexibility, low moisture absorption, biocompatibility, and electrical insulation properties [13,14,15].
Experimental studies, corroborated by the Statistical Associating Fluid Theory (SAFT), have investigated the capacity of bulk LLDPE to adsorb and dissolve light gases such as ethylene, propene, but-1-ene, and propane [16,17]. At temperatures where LLDPE is in a molten state (413.15−473.15K), the dissolution capacity for these gases is considerable and increases with the gas's molecular weight. At 413.5 K, the solubility slightly exceeds 200 g per 1000 g of LLDPE at gas phase pressures of approximately 25.0 MPa (ethene), 5.3 MPa (propene), and 2.5 MPa (but-1-ene). For propane, the only alkane studied, achieving the same solubility required a slightly higher pressure (~ 6.5 MPa), which suggests that smaller alkenes like ethylene may be more soluble than its corresponding alkane (ethane). This trend of solubility as a function of gas molecular weight has also been reported in experimental studies comparing the solubilities of n-pentane at 423.65 K [18] and propane at 443.15 K [16], which has been corroborated by close SAFT predictions [19]. Studies on the solubility of ethylene in different bulk PE structures at temperatures between 333.15 and 423.15 K have found that the degree of crystallinity plays a significant role: higher crystallinity leads to lower solubility [20].
Experimental investigations of PE films have shown that the solubility of pure ethylene increases exponentially with gas pressure, while the solubility of methane and nitrogen increases asymptotically. Methane / ethylene mixtures at 50% by weight behave similarly to pure ethylene [9]. The maximum observed solubility was low, at approximately 67 g of ethylene per 1000 g of PE, at 9 MPa and 298.15 K. The PE films used in these studies were pre-treated with n-heptane, and their thickness was not determined, potentially influencing the reported solubilities [21]. The solubility of CO₂ and H₂ has also been studied experimentally in HDPE films without determining their thickness, finding high CO₂ solubilities (624.3g / 1000g of HDPE) at 0.3 MPa and 303.15 K, while H₂ reached only 36.1g / 1000g of HDPE [7].
In previous work, we used classical Molecular Dynamics (MD) simulations to characterize linear PE films of 200 monomers at their stability limit [22,23]. This allowed us to determine the critical thickness at which a PE film becomes unstable by developing pores. Above this critical thickness, large pores of instability develop and typically self-heal within picoseconds. Below it, they grow, causing the film to fragment into aerosol droplets [24,25]. The limiting thicknesses obtained with MD are a few nanometers, slightly lower than those obtained in subsequent state-of-the-art experimental studies where PE films are produced through careful stretching processes to prevent rupture [26]. The pores that destabilize the PE film become more pronounced as the thickness approaches the critical stability value. These pores can be filled with smaller species that are affine to PE, with the goal of increasing stability and potentially further reducing the critical thickness. Alternatively, they can be used as storage sites for problematic light gases or for those of specific commercial interest.
Here, we study the storage capacity of supercritical ethane adsorbed in very thin, self-standing molten PE films at thicknesses at their stability limit. The following sections detail the classical MD methodology used and present the results and their discussion. We include analyses of the total storage capacity, estimates of ethane solubility in the PE film, the large adsorption of ethane at the interfaces, the volumetric properties of the ethane gas, the interfacial properties of the film with dissolved and adsorbed ethane gas, and their dependence on gas pressure and system temperature. The article concludes with a summary of the main findings and future work.
2. Methodology
Classical MD simulations were used to study the interfacial adsorption and solubility of supercritical ethane in thin films formed by molten PE chains. The study focused on films at their mechanical stability limit and at temperatures of 298.15 K, 373.15 K, and 448.15 K. This method is commonly used to simulate various properties of polymeric systems [27,28,29]. We used the MD code implemented in the Large-scale Atomic / Molecular Massively Parallel Simulator (LAMMPS) [30]. The simulations were performed within a periodic simulation cell with a rectangular parallelepiped shape. The film was positioned in the center of the simulation cell, oriented along the smallest square face of the parallelepiped. The sides of this face were long enough to contain a PE chain of 200 monomers, stretched in each square direction. Previous simulations have demonstrated that this designated interfacial area is large enough to accurately predict the density and interfacial properties of molten polyethylene at temperatures between 373.15 K and 673.15 K [22,23]. The initial conformation of the chains formed a film that completely covered the face of the simulation cell and evolved into a cohesive, self-standing film. The periodicity along the normal direction resulted in a central film that is periodically repeated along the normal axis.
A molten PE film in contact with 938 to 7938 ethane molecules was placed in a rectangular parallelepiped simulation cell with dimensions A = 14.5 × 14.5 nm² and Lz = 48.4 nm. This setup allowed us to simulate a thin layer of polyethylene in contact with different ethane gas phase densities (ρet,g) ranging from 4.10 × 10⁻³ to 7.97 × 10⁻² g/ml at 373.15 K. Additional simulations were conducted by progressively reducing Lz to 12.4 nm while keeping the number of ethane molecules constant (7938), which allowed us to reach ρet,g values of 1.36 × 10⁻¹ g/ml. The reduction of Lz was performed in stages, at a rate of 0.2 nm every 100 ps, with remapping of the coordinates of the entire system, which prevented the system from losing stability. The varying Lz values ensured sufficient separation between the central layer and its periodic images to render inter-layer interactions negligible. The systems were also simulated at 298.15 K and 448.15 K starting from equilibrated configurations at 373.15 K and changing the temperature of the system in several steps. The ethane - PE systems were simulated using the NVT ensemble, where the number of particles and the volume of the simulation cell were kept constant while the temperature fluctuated around a constant value, for which the Nosé thermostat [31] was used with a time step of 1 fs.
The inter-chain interactions (van der Waals) and those due to intra-chain vibrations (bond distance, bond angles, and dihedral angles) were calculated using the Transferable Potentials for Phase Equilibria (TraPPE) force field [32]. This force field uses sites that represent the different monomers along with the Lennard-Jones potential to calculate interaction forces between sites of different chains and also for interactions between sites of the same chain but separated by more than four bonds. Coarse-grained force fields have been widely used to describe the structural properties of polymers [33,34], but the resolution of the components of the pressure profiles , , is in the range of a few Å [35], which is difficult to resolve when the interaction sites have diameters of several Å. Bond distance and angle vibrations were calculated using harmonic potentials, while dihedral angle vibrations were calculated using a cosine function [36]. Interactions between sites of different chains were calculated using a large cutoff radius, 7.5 times the value of σCH3−CH3. The parameter σCH3−CH3 is a Lennard-Jones potential parameter specific for interactions between two terminal -CH₃ groups of two different chains. This radius was wide enough to consider all significant inter-chain interactions, reproduce experimental interfacial properties (tension), and avoid the use of long-range corrections during and after simulations in systems fully described only with Lennard-Jones potentials [24,37] or even in more complex systems with partial electric charges (ionic) [38,39]. The TraPPE potential has been used to simulate C50 and C192 PE chains, and these simulations have reproduced their experimental properties, such as melting temperature [40] and glass transition temperature [41].
We calculated the density profiles, ρ(z), and the components of ), using sub-cells with a thickness of 0.1 Å along the normal direction. The pressure tensor components were calculated using the Harasima contours [42], a function available in LAMMPS [30], which arbitrarily distributes the tension of two interacting sites between the two sub-cells in the normal direction that originate the interactions. Although local pressure lacks a unique definition, the Harasima contours accurately describe interfacial pressures in flat interfaces for systems at thermodynamic equilibrium [35]. From the total pressure profiles, we calculated the interfacial tension, γ, using its mechanical definition:
where is the
component in the normal direction, while the other two are the components
lateral to the surfaces that form the interfaces. Equation 1 considers the
existence of two interfaces.
3. Results and Discussion
Figure 1 shows the
equilibrium conformations of the molten PE films in contact with supercritical
ethane at 373.15 K. The visualizations correspond to the low and high ρet,g
studied in this work. These conformations were taken after 10 ns of initial
simulation to reach equilibrium conformations. The thin polyethylene layer
widens as ρet,g increases, a phenomenon that likely reduces
the PE film density. At high ρet,g, ethane molecules
accumulate at the polymer / gas interfaces at densities greater than those in
the center of the film.
3.1. Density Profiles
The ρ(z) for each component (PE and ethane) and the
sum of both (total) along the axis normal to the interfacial surfaces, were
calculated over a period of 5 ns after an initial 10 ns of equilibration. The
density profiles for the 94 PE chains at 373.15 K are shown in Figure 2, while the density profiles for ethane
are shown in Figure 3. To show the data
dispersion, Figure 2 and Figure 3 also show the
ρ(z) averaged every 0.1 ns and the overall average over 5 ns. The PE
profiles (Figure 2) generally show low
data dispersion, with maximum differences in the center of the layer of up to
0.015, 0.020, and 0.030 g/ml for the system without ethane molecules, and the
systems with ethane at ρet,g of 4.10
× 10-3 g/ml and 1.36 × 10⁻¹ g/ml, respectively. Figure 2 also shows the density profile of the
PE chains before coming into contact with supercritical ethane at the same
temperature. In previous reports we show that the maximum value for the density
is almost independent of the width of the film for systems dominated by van der
Waals forces [22,25]. The ρ(z) show
that the molten film widens in the presence of ethane, and that the film’s
central density decreases as ρet,g increases, similar to a
surfactant effect. Similar effects have been found in phase equilibrium systems
of binary mixtures of long-chain alkanes like n-decane in thermodynamic
equilibrium with short-chain alkanes like methane and ethane [44,45,46].
We defined the layer thickness formed only by PE chains, as
the separation between interfacial points where the PE density (Figure 2) was half its maximum central value.
Using this criterion, we found that the PE film did not widen when it was put
in contact with ethane at the lowest ρet,g studied (4.10 × 10⁻³
g/ml). However, it did widen by approximately 30% when it was put in contact
with the gas phase with the highest ρet,g studied (1.36 × 10⁻¹
g/ml). Considering also only the PE chains, the maximum density at the center
of the layer is reduced by less than 1% for the lowest ρet,g
studied and approximately 22% for the highest ρet,g studied.
The ρ(z) corresponding to ethane (Figure 3) shows a pronounced adsorption of
ethane at the interfaces, which manifests as adsorption peaks near the surfaces
of the PE film. Similar adsorption peaks have also been reported in previous
studies of low molecular weight gases in liquid / vapor equilibrium with long
alkane chains [47,48,49], and are also present in
many systems with polar and non-polar components [50].
The ρ(z) show that as ρet,g increases, the maximum
density of the ethane adsorption peaks, ρet,m, also grows,
and can reach values as high as approximately ⅓ of the density values of the PE
chains in the center of the PE film. The widening of the polyethylene film as ρet,g
increases is also reflected in the separation of the ethane adsorption peaks at
the interfaces. This separation widens from approximately 2.82 nm (ρet,g
= 4.10 × 10⁻³ g/ml) to approximately 4.31 nm (ρet,g = 1.36 ×
10-1 g/ml), representing an increase of approximately 52%. In the center of the
film, the average ethane density, ρet,c, reaches values
similar to ρet,g for the system with the lowest ρet,g
studied at 373.15 K. In the system with the highest ρet,g
studied, ρet,c decreases to approximately ⅔ of the ρet,g
value, which could indicate that a saturation process for ethane adsorption is
in progress in the center of the PE layer, but not in the adsorption peaks,
which continue to grow as ρet,g increases.
The total ρ(z), including both components of the
system, are shown in Figure 4. Compared
to the PE profiles, a less pronounced decrease in density is observed in the
center of the layers. For the system with ρet,g = 4.10 × 10⁻³
g/ml, there is no density reduction. However, for the system with ρet,g
= 1.36 × 10⁻¹ g/ml, the reduction is only 8.8%, which is probably
due to the solubility of ethane molecules in the PE film. The widening of the
layer, is due to the progressive widening of the adsorbed ethane layers at the
interfaces, but is also due to a reduction in the PE chains density, we find
that for the system with the lowest ρet,g studied, the
widening is insignificant, but for the system with the highest ρet,g
studied, the widening is significant, approximately 60%, estimated from the
total ρ(z) positions where the density begins to deviate from the
average ρet,g.
3.2. Pressure Profiles
The in the normal () and lateral ( and ) directions were calculated for all systems, and with them, we estimated the average pressure in the ethane gas phase, , and calculated the
interfacial tension, γ. The pressure component profiles from the
simulations at 373.15 K, at the limit values of the ρet,g
range studied, are shown in Figure 5.
These profiles are compared with those obtained for the pristine PE film,
without being exposed to ethane molecules. The effect of ethane in the PE film
reduces the magnitude of the peaks and valleys of the 3 pressure components.
The presence of ethane makes the PE film less cohesive. This might seem
counterintuitive, as one might expect a small molecule like ethane to fill the
natural pores in the films [22] and increase
stability. For comparison, interstitial carbon atoms in steel form a solid
solution, creating a harder but more fragile system [51].
However, in our simulations, ethane appears to have the opposite effect,
suggesting its main influence is at the interfaces, making the film more
'fragile'.
The show a behavior corresponding to a metastable system. At the ethane gas phase, the pressure is in equilibrium and is isotropic. Its 3 components have equal average values, which is not the case in the center of the PE layer, where one would expect the development of an isotropic phase similar to a liquid. However, this isotropy is not achieved. The lateral pressure components and are equal and indicate cohesive conformations, but they differ from the normal component , which has positive, non-cohesive values. This pressure difference causes the system not to be in mechanical equilibrium. The mechanical imbalance will eventually cause these systems to transform into more stable systems, which could occur through the film breaking and the formation of an aerosol [24,52,53]. The stability of these molten films depends on many external factors. Although classical MD simulations without external perturbations have shown long periods of stability, up to 0.1 s, with potentials based
on interaction sites of -CH₂- and -CH₃ functional groups [22], and with mesoscale simulations [54].
The in the interfacial region show more cohesive states in the lateral directions than in the normal direction, which is natural and gives rise to the development of γ. This difference is a result of the inhomogeneity of the system in the normal direction. The studied self-standing PE film is basically interfacial; there is no region that we can identify as a bulk liquid, in which the three pressure components should develop with isotropic and positive values to maintain mechanical equilibrium with the ethane gas phase. If we compare the change in pressures between the minimum value at the interfaces and its corresponding maximum in the center of the layer, we see that the magnitude of the change is the same in the three components. Such large changes in the normal direction are not expected in wider layers [38], which probably indicates interference of the opposite interfaces. In wider layers, the expected deviations from a constant are considerably lower than those observed in the lateral directions, and the small deviations are due to the way the interactions in the are accumulated in the
Harasima profiles.
Based on the obtained, we calculated the profiles of the function . These profiles, which
are shown in Figure 5d, once integrated,
are used to calculate γ (Eq. 1). Compared to the profiles of the
pristine PE film without ethane, the presence of ethane causes the maximums of
the interfacial peaks to reduce their magnitude. Furthermore, when ρet,g
is high enough, non-cohesive regions appear in the outermost part of the
interfaces, which could be investigated in the future using a code implemented
in such a way that it allows for the separate calculation of the contributions
of each component to the profiles, and in this way determine if these values
are due to the PE chains or the ethane molecules. This is not possible today
with the MD implementation used [30]. Figure 5d also shows that the system is
composed of two overlapping interfacial regions, with no central bulk liquid
exhibiting isotropic pressures. This is because the influence tails of the two
interfacial peaks overlap in the center of the layer.
Figure 6 shows the profiles of the main contributions (van der Waals inter-chain interactions, bond distance vibrations, and bond angle vibrations) to the function , along with the total profile and the profiles for the pristine PE film. In the pristine film, it is shown that the vibrations contribute mainly in the outermost parts of the interfaces, while the inter-chain interactions (van der Waals forces) are divided between regions that have positive and negative contributions. The negative contributions, like the vibrations, are located in the outermost part of the interfaces, followed by the positive regions in the center of the film. The positive contributions due to vibrations are greater than the effect of the negative contributions due to inter-chain interactions in the outermost regions of the interfaces. The due to bond distance
and bond angle vibrations do show an isotropic region that develops in an
internal sub-layer located at the center of the film, with a thickness of ~1.4
nm. The thickness of this isotropic region increases slightly at higher ρet,g.
The contributions due to inter-chain interactions do not show any isotropic
region at the center of the film.
3.3. Pressure - Density of Supercritical Gas Ethane
We related , which represents the average value of the three components in the homogeneous regions away from the film and its interfaces, where the density varies around a constant value. Figure 7 shows the values obtained for along with its
corresponding ρet,g, as well as the corresponding values for ρet,c
and ρet,m. The results are also shown at temperatures of
298.15 K and 448.15 K, to have a more global view of the behavior of these
systems. Previous work with pristine PE films had shown that at higher
temperatures, a greater number of chains was needed to keep the film stable for
long simulation periods (100 ns). We found that the systems at 448.15 K
remained stable, during the short simulation period studied (15 ns), probably
because we started from configurations with the ethane molecules, which gives
some sort of ‘strength’ to the film.
Figure 7 also shows experimental isotherms [55] of the - ρet,g relationship for pure supercritical ethane at the 3 studied temperatures. The used potential reproduces the experimental ethane - ρet,g relationship well. There are slight over-predictions at high ρet,g, with maximum errors of 6.25% within the - ρet,g region studied. The behavior between these variables is monotonically increasing, although at 298.15 K, and slightly higher ρet,g, the experimental increases exponentially, or viewed another way, there is a saturation of at higher ρet,g.
ρet,m and ρet,c grow with ρet,g,
although ρet,m grows asymptotically and ρet,c
grows linearly, which could indicate that the phenomenon that is entering a
saturation behavior in this studied density range is the phenomenon of ethane
adsorption at the interfaces, while the solubility in the center of the film
has not really started a saturation process. ρet,m presents
magnitudes up to 2.4 times greater than ρet,c, although it is
not clear if the isotherms could connect at higher ρet,g. At
298.15 K, the densities of ρet,c are greater than ρet,g,
but at higher temperatures, there is an inversion in this relationship that
also becomes more pronounced as the temperature increases, which is probably
related to the melting temperature for pure PE occurring in this range of
temperatures [56].
3.4. Interfacial Tension
We calculated γ by integrating the profiles of the function . For this, we used the total values of . The γ values obtained are reported in Figure 8 for the 3 temperatures studied. We found that as increases, γ decreases, and this negative growth fits well to the behavior of an exponential decay function. It has been previously reported that this potential reproduces the experimental γ of pure PE films [23], finding an independence of γ with the thickness of the PE film. Therefore, γ is independent of whether the film is metastable or stable. Ethane has the effect of a surfactant on the metastable molten PE film, and its effect is more pronounced at low temperatures. At 298.15 K, γ drops on average by 17.5% with each MPa increase in , while at 448.15 K the
decrease is ~4.8% for each MPa.
The three isotherms reach similar γ values at high , while at the lowest , the curves behave as expected; γ values at zero depend only on the temperature of the pristine PE film. The literature has widely documented that in liquid / vapor thermodynamic equilibrium systems, γ is minimally affected by pressure but greatly influenced by liquid density [57]. Given that at the highest studied, the only difference between the 3 systems is the temperature (the cell volume and the overall density are the same), we compared the average PE densities at the different temperatures and the change they underwent from the pristine systems at = 0 MPa. Compared to the pristine PE films, the films in contact with methane at high take lower total
densities of 0.768 (298.15 K), 0.7383 (373.15 K), and 0.694 g/ml (448.15 K),
while the corresponding percentage reductions were more or less constant, of
9.49 %, 8.99 %, and 10.23 %, respectively. This probably indicates that the
dependence of γ should probably be related to the change in the
magnitude and not to the total value of the film PE density, as commonly occurs
in bulk phases under thermodynamic equilibrium.
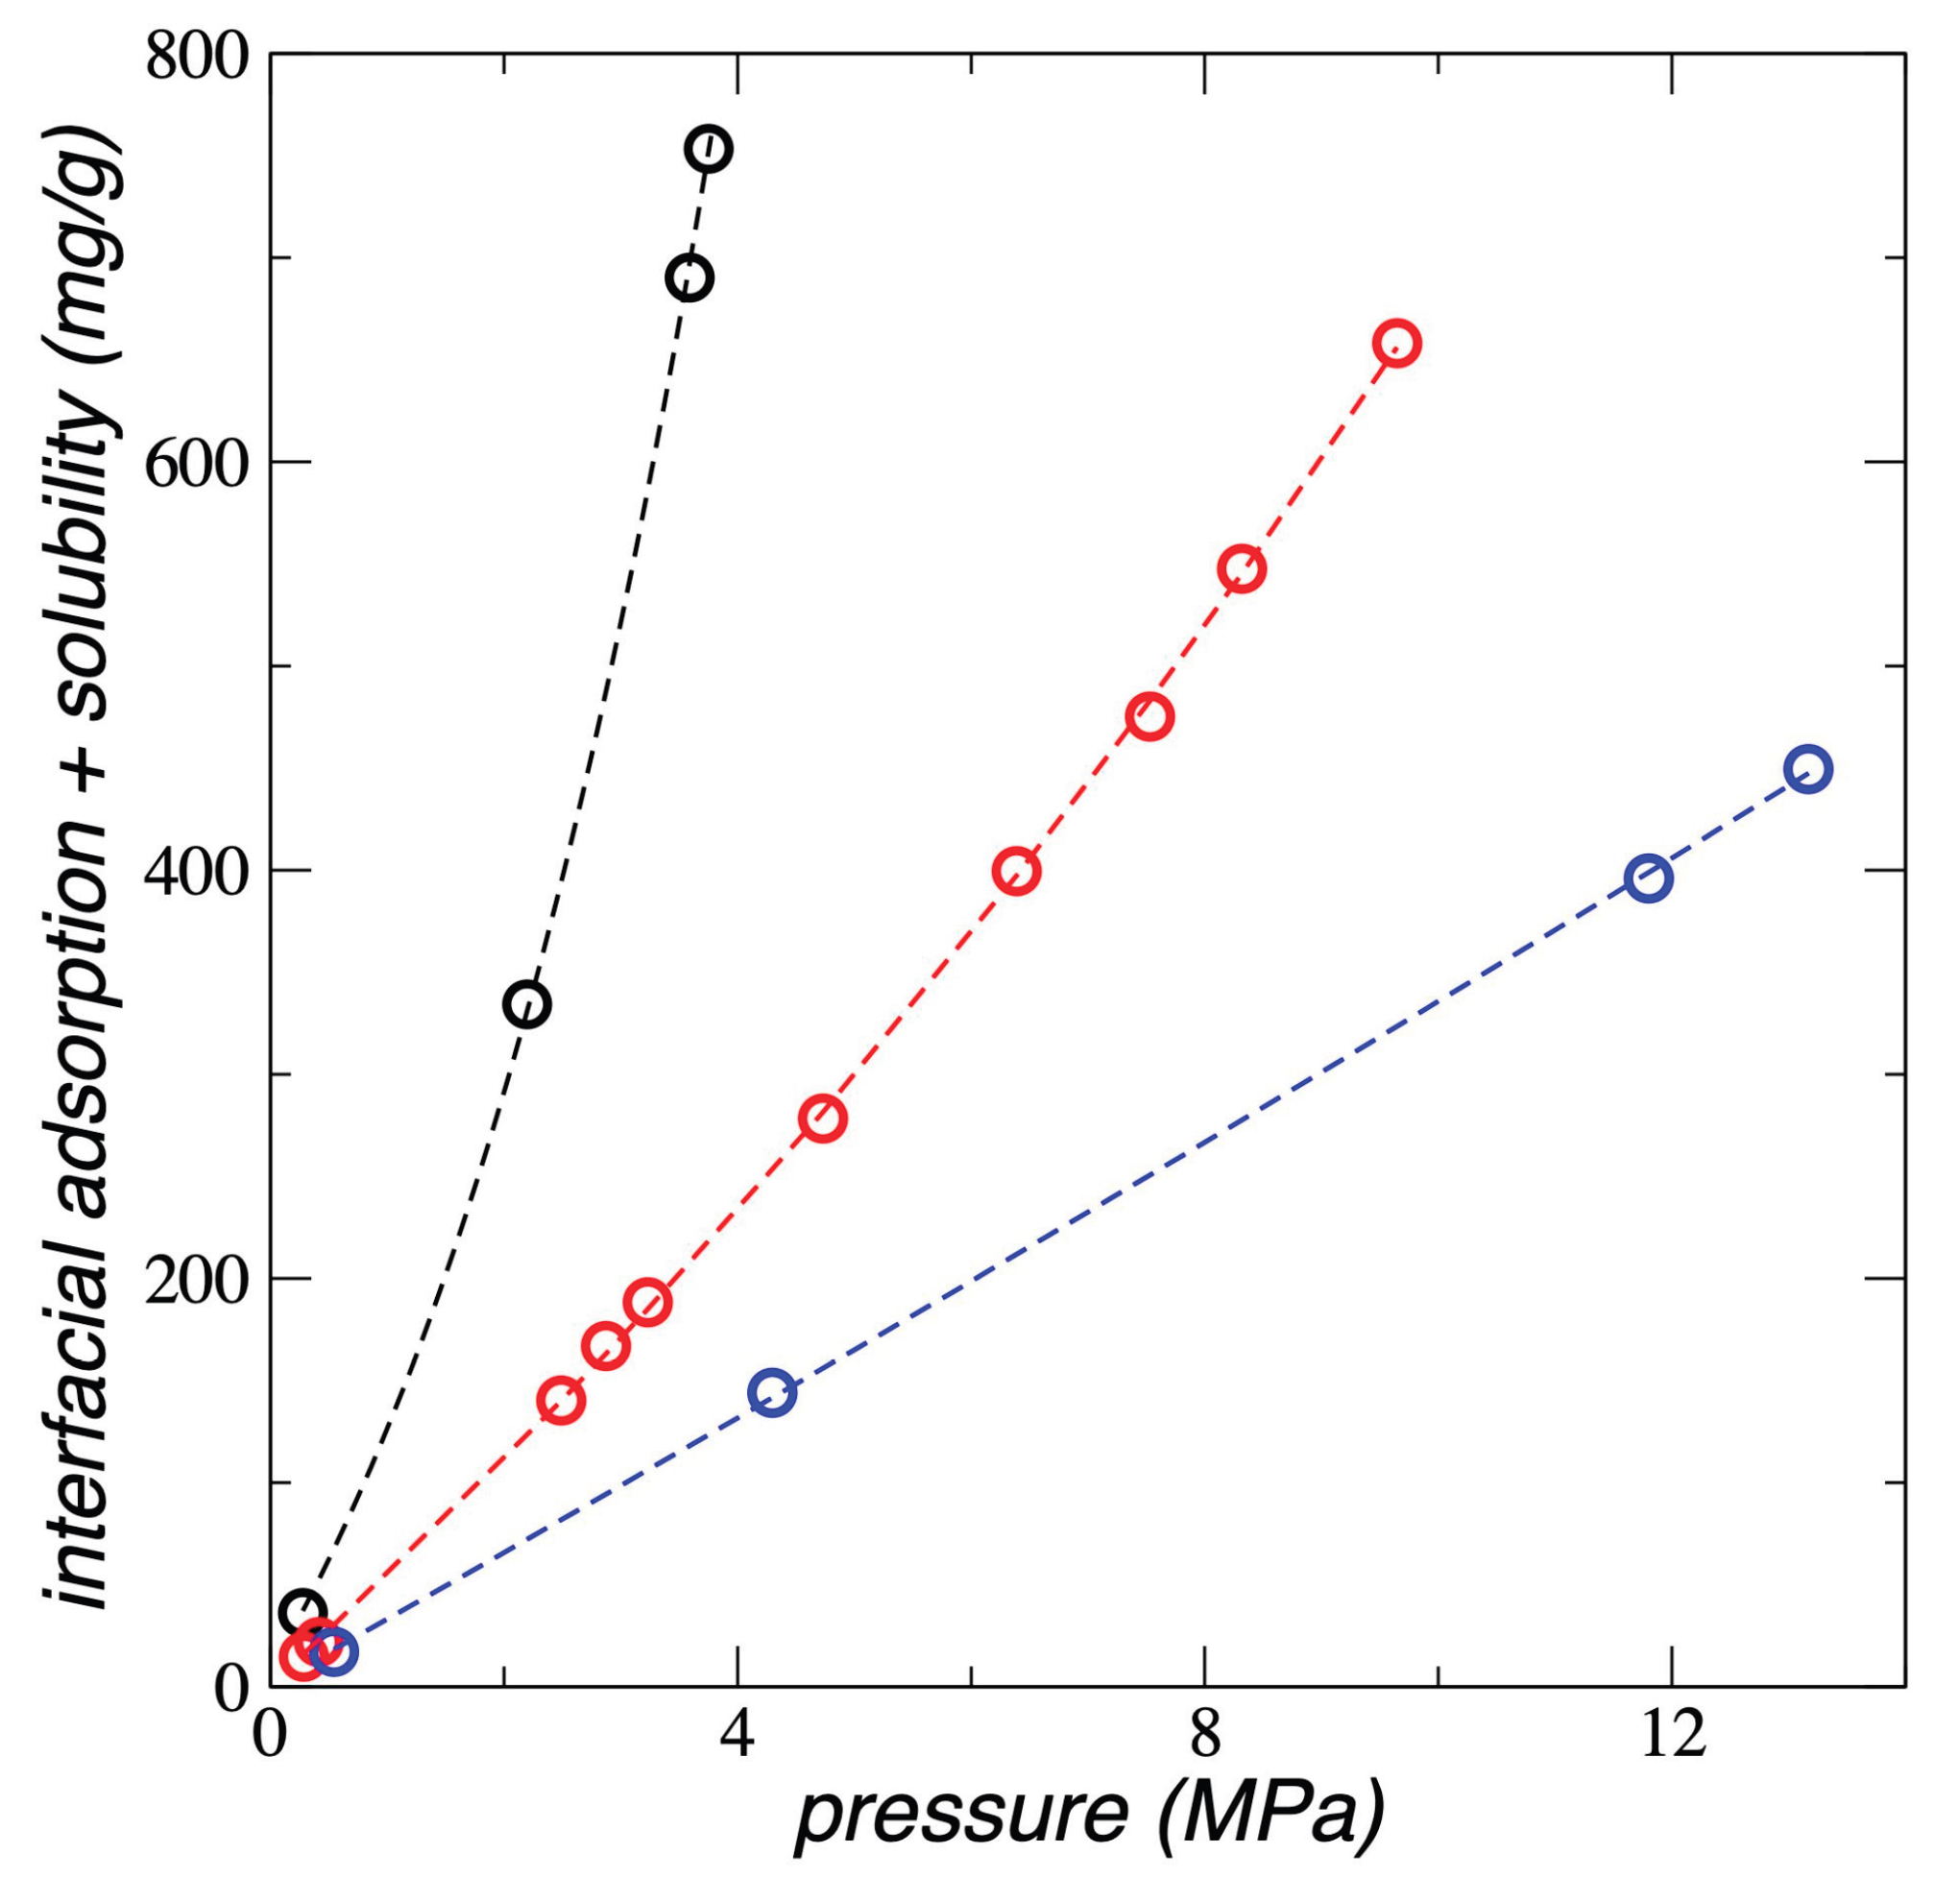
3.5. Interfacial and Soluble Load
We calculated how much ethane the PE film can accumulate, , sum of both what is dissolved in the center of the film, , and what is adsorbed at the interfaces, , and the results are shown in Figure 9 for all the temperatures studied. at all temperatures studied grows exponentially with , and the growth rate decreases as the temperature increases. Experimental studies [16] and numerical calculations using SAFT [17,19,20], have found a similar behavior for in systems composed of different forms of PE exposed to supercritical gases like n-pentane, propane, ethene, propene, but-1-ene, and ethylene. These studies were carried out with bulk PE where the interfacial adsorption part plays an insignificant role. However, for PE in film form, interfacial adsorption is very significant, as can be seen in the of ethane (Figure 3). No reported studies were found in
the literature of ethane adsorbed in any form of PE.
Studies with PE films at 298.15 K have also found that the - trend reported in this
work is the same when the PE film was in contact with supercritical ethylene,
but the trend changed to an asymptotic behavior when the PE was exposed to a
lighter gas like supercritical methane [9];
this has also been reported for combinations of heavier supercritical alkanes
in bulk PE [19]. The experimental results
reported in the literature with PE films [9,21]
cannot be directly compared with the results of this work, since in the
experiments the PE films are pre-treated with n-heptane and the
thickness of the experimental films was not reported, which can affect the
degree of adsorption and solubility of ethane. The values obtained in this work
using pristine, untreated PE films at the stability limit thickness accumulated
up to 40 times what was observed experimentally at 4 MPa with films pre-treated
with n-heptane and without knowledge of their thickness [9].
We estimated the solubility of ethane in the PE films by considering that there is a region in the center of the liquid that exhibits mechanical stability, at least in terms of the vibrations of the chain sites (Figure 6), but not in their inter-chain interactions due to van der Waals forces. We found that reaches values of 2.94 and 74.8 g per 1000 g of PE for the systems at 373.15 K and of 0.29 and 9.65 MPa, respectively. These values show that varies between 4.8 and 8.6 times the value when varies between 0.29 and
9.65 MPa, at 373.15 K.
4. Conclusions
We carried out classical Molecular Dynamics simulations to
understand how supercritical ethane molecules accumulate, distinguishing
between the ethane that dissolves and that which accumulates at the polymer /
gas interface of a polyethylene film at its stability limit thickness. Results
at temperatures of 298.15 K, 373.15 K, and 448.15 K, and pressures up to 13.17
MPa, show that the total ethane load grows exponentially as the pressure of the
ethane in the gas phase increases. This is similar to what has been found in
experiments with polyethylene in film and bulk form in equilibrium with light
gases in supercritical state. No experimental studies on ethane were found that
would allow us to compare our results, not even with bulk polyethylene. The
accumulation capacity of ethane in these two regions decreases as the system
temperature increases. We estimate that the increase due to interfacial ethane
adsorption can be between 4.8 and 8.6 times the solubility that ethane
naturally exhibits when absorbed in bulk polyethylene at 373.15 K and pressures
up to 9.65 MPa. The high adsorption at the interfaces, compared to its
solubility in the bulk, suggests the development of multiple polyethylene film
arrangements as a promising strategy for developing adsorbents for problematic
light gases in various industrial and environmental processes.
The films at thei mechanical limit of stability are
metastable; while contributions to surface tension from chain vibrations
exhibit mechanical stability and the systems remain stable for up to 15 ns,
they are not mechanically stable with respect to inter-chain van der Waals
interactions. This is likely because these systems are mainly composed of two
interfaces whose influence tails overlap in the center of the film. Thicker
films are necessary to prevent the interfaces from interacting and make the systems
mechanically stable. The interfacial tension exhibits an exponential decay with
the pressure of the gas phase, and the rate of decay slows as temperature
increases.
The solubility of ethane in the polyethylene film changes
with the temperature. At 298.15 K, the density of dissolved ethane is greater
than that of the gas phase. This relationship reverses at 373.15 K and becomes
more pronounced with increasing temperature, which is probably related to the
melting temperature of polyethylene films. It will be interesting to
investigate if both transitions occur at the same temperature.
Future work will determine if the limit of mechanical
stability is reduced in the presence of ethane, as well as how selective are
these films for the adsorption capacity of certain problematic light gases.
Author Contributions
Conceptualization, R.G.G. and J.L.R.; methodology, M.L.S. and J.L.R.; validation, J.L.R.; formal analysis, M.L.S. and J.L.R.; investigation, M.L.S., A.L.S., J.L.R. and R.G.G.; data curation, A.L.S. and J.L.R.; writing original draft preparation, A.L.S., J.L.R. and M.L.S.; writing review and editing, A.L.S. and J.L.R.; visualization, M.L.S.; supervision, J.L.R. and R.G.G.; project administration, J.L.R. All authors have read and agreed to the published version of the manuscript.
Funding
This research was funded by CONACYT–México (Grant INFR-2016-01-268652) and Universidad Michoacana de San Nicolás de Hidalgo.
Institutional Review Board Statement
Not applicable.
Data Availability Statement
The data presented in this study are available on request from the corresponding author.
Conflicts of Interest
The authors declare no conflict of interest.
References
- Wu, Q.; Qin, K.-X.; Gan, M.-X.; Xu, J.; Li, Z.-L.; Li, Z.-C. Recyclable Biomass-Derived Polyethylene-Like Materials as Functional Coatings for Commercial Fabrics: Toward Upcycling of Waste Textiles. ACS Sustain. Chem. Eng. 2022, 10, 17187–17197. [Google Scholar] [CrossRef]
- Guermazi, N.; Elleuch, K.; Ayedi, H.F.; Zahouani, H.; Kapsa, Ph. Susceptibility to Scratch Damage of High Density Polyethylene Coating. Mater. Sci. Eng. A 2008, 492, 400–406. [Google Scholar] [CrossRef]
- Martínez, K.I.; González-Mota, R.; Soto-Bernal, J.J.; Rosales-Candelas, I. Evaluation by IR Spectroscopy of the Degradation of Different Types of Commercial Polyethylene Exposed to UV Radiation and Domestic Compost in Ambient Conditions. J. Appl. Polym. Sci. 2021, 138, 50158. [Google Scholar] [CrossRef]
- Shen, J.; Liang, J.; Lin, X.; Lin, H.; Yu, J.; Yang, Z. Recent Progress in Polymer-Based Building Materials. Int. J. Polym. Sci. 2020, 2020, 8838160. [Google Scholar] [CrossRef]
- Thakur, A.; Kumar, A. Chemical and Physical Properties of Nano-Hybrid Smart Coatings. In Nano-Hybrid Smart Coatings: Advancements in Industrial Efficiency and Corrosion Resistance; ACS Symposium Series; American Chemical Society, 2024; Vol. 1469, pp. 59–94. [Google Scholar]
- Tian, Y.; Huang, H.; Wang, W.; Ma, Y.; He, X.; Zhang, L.; Sheng, X.; Zhang, X. Chapter 24 - Corrosion Resistant Nanoscale Polymer-Based Coatings. In Polymer-Based Nanoscale Materials for Surface Coatings; Thomas, S., George, J.S., Eds.; Elsevier; pp. 547–584. [Google Scholar]
- Nareswari, C.; Zulfiani, U.; Junaidi, A.; Gunawan, T.; Widiastuti, N. Adsorption of CO2 and H2 on the Polymer-Based Membrane from High-Density Polyethylene (HDPE) Plastic. South Afr. J. Chem. Eng. 2024, 49, 105–113. [Google Scholar] [CrossRef]
- Yang, Y.; Narayanan Nair, A.K.; Sun, S. Adsorption and Diffusion of Methane and Carbon Dioxide in Amorphous Regions of Cross-Linked Polyethylene: A Molecular Simulation Study. Ind. Eng. Chem. Res. 2019, 58, 8426–8436. [Google Scholar] [CrossRef]
- Li, N.N.; Long, R.B. Permeation through Plastic Films. AIChE J. 1969, 15, 73–80. [Google Scholar] [CrossRef]
- Fries, E.; Zarfl, C. Sorption of Polycyclic Aromatic Hydrocarbons (PAHs) to Low and High Density Polyethylene (PE). Environ. Sci. Pollut. Res. 2012, 19, 1296–1304. [Google Scholar] [CrossRef] [PubMed]
- Rios*, L.M.; Jones, P.R.; Moore, C.; Narayan, U.V. Quantitation of Persistent Organic Pollutants Adsorbed on Plastic Debris from the Northern Pacific Gyre’s “Eastern Garbage Patch. ” J. Environ. Monit. 2010, 12, 2226–2236. [Google Scholar] [CrossRef] [PubMed]
- Wang, T.; Yu, C.; Chu, Q.; Wang, F.; Lan, T.; Wang, J. Adsorption Behavior and Mechanism of Five Pesticides on Microplastics from Agricultural Polyethylene Films. Chemosphere 2020, 244, 125491. [Google Scholar] [CrossRef]
- Norton, M.G. Chance. In Ten Materials That Shaped Our World; Norton, M.G., Ed.; Springer Nature Switzerland: Cham, 2025; ISBN 978-3-031-91647-2. [Google Scholar]
- Sand, A.; Vyas, A.; Tuteja, J. Introductory Chapter: Polyethylene – Its Properties and Application in Industry and in Households. In Polyethylene - New Developments and Applications; Sand, A., Tuteja, J., Eds.; IntechOpen: Rijeka, 2024; ISBN 978-1-83769-436-5. [Google Scholar]
- Wang, Y.; Feng, G.; Lin, N.; Lan, H.; Li, Q.; Yao, D.; Tang, J. A Review of Degradation and Life Prediction of Polyethylene. Appl. Sci. 2023, 13, 3045. [Google Scholar] [CrossRef]
- Heuer, T.; Peuschel, G.-P.; Rätzsch, M.; Wohlfarth, Ch. Untersuchungen Zur Löslichkeit von Ethen, Propan, Propen Und But-1-En in Schmelzen von Oligomeren Des Polyethylens Bzw. (Ethen-Vinylacetat)-Copolymeren Bei Temperaturen Bis 473,15 k Und Drücken Bis 30 MPA. Teil I. Apparaturen Und Ergebnisse. Acta Polym. 1989, 40, 272–278. [Google Scholar] [CrossRef]
- Haslam, A.J.; von Solms, N.; Adjiman, C.S.; Galindo, A.; Jackson, G.; Paricaud, P.; Michelsen, M.L.; Kontogeorgis, G.M. Predicting Enhanced Absorption of Light Gases in Polyethylene Using Simplified PC-SAFT and SAFT-VR. Fluid Phase Equilibria 2006, 243, 74–91. [Google Scholar] [CrossRef]
- Surana, R.K.; Danner, R.P.; de Haan, A.B.; Beckers, N. New Technique to Measure High-Pressure and High-Temperature Polymer-Solvent Vapor-Liquid Equilibrium. Fluid Phase Equilibria 1997, 139, 361–370. [Google Scholar] [CrossRef]
- von Solms, N.; Michelsen, M.L.; Kontogeorgis, G.M. Prediction and Correlation of High-Pressure Gas Solubility in Polymers with Simplified PC-SAFT. Ind. Eng. Chem. Res. 2005, 44, 3330–3335. [Google Scholar] [CrossRef]
- Chmelař, J.; Smolná, K.; Haškovcová, K.; Podivinská, M.; Maršálek, J.; Kosek, J. Equilibrium Sorption of Ethylene in Polyethylene: Experimental Study and PC-SAFT Simulations. Polymer 2015, 59, 270–277. [Google Scholar] [CrossRef]
- Long, R.B. Liquid Permeation through Plastic Films. Ind. Eng. Chem. Fundam. 1965, 4, 445–451. [Google Scholar] [CrossRef]
- González-Mijangos, J.A.; Lima, E.; Guerra-González, R.; Ramírez-Zavaleta, F.I.; Rivera, J.L. Critical Thickness of Free-Standing Nanothin Films Made of Melted Polyethylene Chains via Molecular Dynamics. Polymers 2021, 13, 3515. [Google Scholar] [CrossRef]
- Ramírez-Zavaleta, F.I.; Torres-Dominguez, V.M.; Viramontes-Gamboa, G.; Rivera, J.L. Interfacial Forces in Free-Standing Layers of Melted Polyethylene, from Critical to Nanoscopic Thicknesses. Polymers 2022, 14, 3865. [Google Scholar] [CrossRef]
- Rivera, J.L.; Douglas, J.F. Reducing Uncertainty in Simulation Estimates of the Surface Tension through a Two-Scale Finite-Size Analysis: Thicker Is Better. RSC Adv. 2019, 9, 35803–35812. [Google Scholar] [CrossRef]
- Rivera, J.L.; Douglas, J.F. Influence of Film Thickness on the Stability of Free-Standing Lennard-Jones Fluid Films. J. Chem. Phys. 2019, 150, 144705. [Google Scholar] [CrossRef]
- Li, R.; Wang, Z.; Sun, W.; Zhang, H.; Zeng, Y.; Zhao, X.; Hu, W.; Deng, H.; Loh, K.P.; Fu, Q. Scalable Production of Critically Thin Polyethylene Films via Multistep Stretching. Nat. Chem. Eng. 2024, 1, 702–709. [Google Scholar] [CrossRef]
- Lew, J.H.; Hue, K.Y.; Matar, O.K.; Müller, E.A.; Luckham, P.F.; Santos, A.S.; Myo Thant, M.M. Atomic Force Microscopy and Molecular Dynamic Simulation of Adsorption of Polyacrylamide with Different Chemistries onto Calcium Carbonate. Polymers 2024, 16, 494. [Google Scholar] [CrossRef]
- Huang, H.; Liu, B.; Zheng, D.; Xin, F.; Shi, X. Transport Property of Hydrogen Sulfide in Amorphous Polyethylene Using Grand Canonical Monte Carlo and Molecular Dynamics Simulations. Fuel 2024, 360, 130532. [Google Scholar] [CrossRef]
- López-Chávez, E.; Peña-Castañeda, Y.A.; Garcia-Quiroz, A.; Góngora, J.A.I.D.; de Landa Castillo-Alvarado, F. Thermophysical Properties of Graphene Reinforced with Polymethyl Methacrylate Nanoparticles for Technological Applications: A Molecular Model. J. Mol. Model. 2025, 31, 52. [Google Scholar] [CrossRef] [PubMed]
- Thompson, A.P.; Aktulga, H.M.; Berger, R.; Bolintineanu, D.S.; Brown, W.M.; Crozier, P.S.; in ’t Veld, P.J.; Kohlmeyer, A.; Moore, S.G.; Nguyen, T.D.; et al. LAMMPS - a Flexible Simulation Tool for Particle-Based Materials Modeling at the Atomic, Meso, and Continuum Scales. Comput. Phys. Commun. 2022, 271, 108171. [Google Scholar] [CrossRef]
- Nosé, S. A Unified Formulation of the Constant Temperature Molecular Dynamics Methods. J. Chem. Phys. 1984, 81, 511–519. [Google Scholar] [CrossRef]
- Martin, M.G.; Siepmann, J.I. Transferable Potentials for Phase Equilibria. 1. United-Atom Description of n-Alkanes. J. Phys. Chem. B 1998, 102, 2569–2577. [Google Scholar] [CrossRef]
- Wagner, R.J.; Silberstein, M.N. A Foundational Framework for the Mesoscale Modeling of Dynamic Elastomers and Gels. J. Mech. Phys. Solids 2025, 194, 105914. [Google Scholar] [CrossRef]
- Zerze, H.; Gupta, A.; Baksi, A.; Chakraborty, D.; Vekilov, P.G.; Rimer, J.D.; Zerze, G.H. A Coarse-Graining Approach to Model Molecular Liquids for Mesoscale Problems. AIChE J. 2025, 71, e18700. [Google Scholar] [CrossRef]
- Shi, K.; Smith, E.R.; Santiso, E.E.; Gubbins, K.E. A Perspective on the Microscopic Pressure (Stress) Tensor: History, Current Understanding, and Future Challenges. J. Chem. Phys. 2023, 158, 040901. [Google Scholar] [CrossRef] [PubMed]
- Jorgensen, W.L.; Madura, J.D.; Swenson, C.J. Optimized Intermolecular Potential Functions for Liquid Hydrocarbons. J. Am. Chem. Soc. 1984, 106, 6638–6646. [Google Scholar] [CrossRef]
- Trokhymchuk, A.; Alejandre, J. Computer Simulations of Liquid/Vapor Interface in Lennard-Jones Fluids: Some Questions and Answers. J. Chem. Phys. 1999, 111, 8510–8523. [Google Scholar] [CrossRef]
- Rivera, J.L.; Molina-Rodríguez, L.; Ramos-Estrada, M.; Navarro-Santos, P.; Lima, E. Interfacial Properties of the Ionic Liquid [Bmim][Triflate] over a Wide Range of Temperatures. RSC Adv. 2018, 8, 10115–10123. [Google Scholar] [CrossRef]
- Arroyo-Valdez, J.A.; Viramontes-Gamboa, G.; Guerra-Gonzalez, R.; Ramos-Estrada, M.; Lima, E.; Rivera, J.L. Cation Folding and the Thermal Stability Limit of the Ionic Liquid [BMIM+][BF4−] under Total Vacuum. RSC Adv. 2021, 11, 12951–12960. [Google Scholar] [CrossRef]
- Zhang, W.; Larson, R.G. A Metastable Nematic Precursor Accelerates Polyethylene Oligomer Crystallization as Determined by Atomistic Simulations and Self-Consistent Field Theory. J. Chem. Phys. 2019, 150, 244903. [Google Scholar] [CrossRef] [PubMed]
- Ramos, J.; Vega, J.F.; Martínez-Salazar, J. Molecular Dynamics Simulations for the Description of Experimental Molecular Conformation, Melt Dynamics, and Phase Transitions in Polyethylene. Macromolecules 2015, 48, 5016–5027. [Google Scholar] [CrossRef]
- Harasima, A. Molecular Theory of Surface Tension. In Advances in Chemical Physics; Advances in Chemical Physics; 1957; pp. 203–237. [Google Scholar]
- Humphrey, W.; Dalke, A.; Schulten, K. VMD: Visual Molecular Dynamics. J. Mol. Graph. 1996, 14, 33–38. [Google Scholar] [CrossRef]
- Mejía, A.; Cartes, M.; Chaparro, G.; Feria, E.; Blas, F.J.; Míguez, J.M.; Algaba, J.; Müller, E.A. Phase Equilibria and Interfacial Properties of Selected Methane + N-Alkane Binary Mixtures. J. Mol. Liq. 2021, 341, 116918. [Google Scholar] [CrossRef]
- Nourozieh, H.; Kariznovi, M.; Abedi, J. Vapor–Liquid Equilibrium Measurement and Thermodynamic Modeling of Binary Systems (Methane + n-Tetradecane). Fluid Phase Equilibria 2012, 318, 96–101. [Google Scholar] [CrossRef]
- Lopez, J.; Trejos Montoya, V.; Cardona, C.A. Objective Functions Analysis in the Minimization of Binary VLE Data for Asymmetric Mixtures at High Pressures. Fluid Phase Equilibria 2006, 248, 147–157. [Google Scholar] [CrossRef]
- Morrow, B.H.; Harrison, J.A. Interfacial Properties of Linear Alkane/Nitrogen Binary Mixtures: Molecular Dynamics Vapor–Liquid Equilibrium Simulations. J. Phys. Chem. B 2022, 126, 4379–4388. [Google Scholar] [CrossRef] [PubMed]
- Garrido, J.M.; Cartes, M.; Mejía, A. Coarse-Grained Theoretical Modeling and Molecular Simulations of Nitrogen + n-Alkanes: (N-Pentane, n-Hexane, n-Heptane, n-Octane). J. Supercrit. Fluids 2017, 129, 83–90. [Google Scholar] [CrossRef]
- Qiu, Y.; Molinero, V. Strength of Alkane–Fluid Attraction Determines the Interfacial Orientation of Liquid Alkanes and Their Crystallization through Heterogeneous or Homogeneous Mechanisms. Crystals 2017, 7, 86. [Google Scholar] [CrossRef]
- Clint, J.H. Adsorption at Liquid Interfaces. In Surfactant Aggregation; Clint, J.H., Ed.; Springer Netherlands: Dordrecht, 1992; ISBN 978-94-011-2272-6. [Google Scholar]
- Grange, R.A. Estimating the Hardenability of Carbon Steels. Metall. Trans. 1973, 4, 2231–2244. [Google Scholar] [CrossRef]
- Rabinowitz, J.D.; Wensley, M.; Lloyd, P.; Myers, D.; Shen, W.; Lu, A.; Hodges, C.; Hale, R.; Mufson, D.; Zaffaroni, A. Fast Onset Medications through Thermally Generated Aerosols. J. Pharmacol. Exp. Ther. 2004, 309, 769–775. [Google Scholar] [CrossRef]
- Myers, D.J.; Timmons, R.D.; Lu, A.T.; Hale, R.L.; Solas, D.W.; Soni, P.; Rabinowitz, J.D. The Effect of Film Thickness on Thermal Aerosol Generation. Pharm. Res. 2007, 24, 336–342. [Google Scholar] [CrossRef]
- Wu, C. Critical Thicknesses of Free-Standing Thin Films of Molten Polymers: A Multiscale Simulation Study. J. Phys. Chem. B 2022, 126, 6500–6510. [Google Scholar] [CrossRef]
- Bücker, D.; Wagner, W. A Reference Equation of State for the Thermodynamic Properties of Ethane for Temperatures from the Melting Line to 675 K and Pressures up to 900 MPa. J. Phys. Chem. Ref. Data 2006, 35, 205–266. [Google Scholar] [CrossRef]
- Mohammadi, H.; Vincent, M.; Marand, H. Investigating the Equilibrium Melting Temperature of Linear Polyethylene Using the Non-Linear Hoffman-Weeks Approach. Polymer 2018, 146, 344–360. [Google Scholar] [CrossRef]
- Rice, O.K. The Effect of Pressure on Surface Tension. J. Chem. Phys. 1947, 15, 333–335. [Google Scholar] [CrossRef]
Figure 1.
Equilibrium configurations of a polyethylene film at 373.15 K in equilibrium with supercritical ethane at a) 4.10 × 10⁻³ g/ml and c) 1.36 × 10⁻¹ g/ml. Ethane molecules are shown in yellow and the polyethylene film in blue. Panels b) and d) show the same systems with the polyethylene chains removed for clarity. The figures were generated with the VMD visualizer [43].
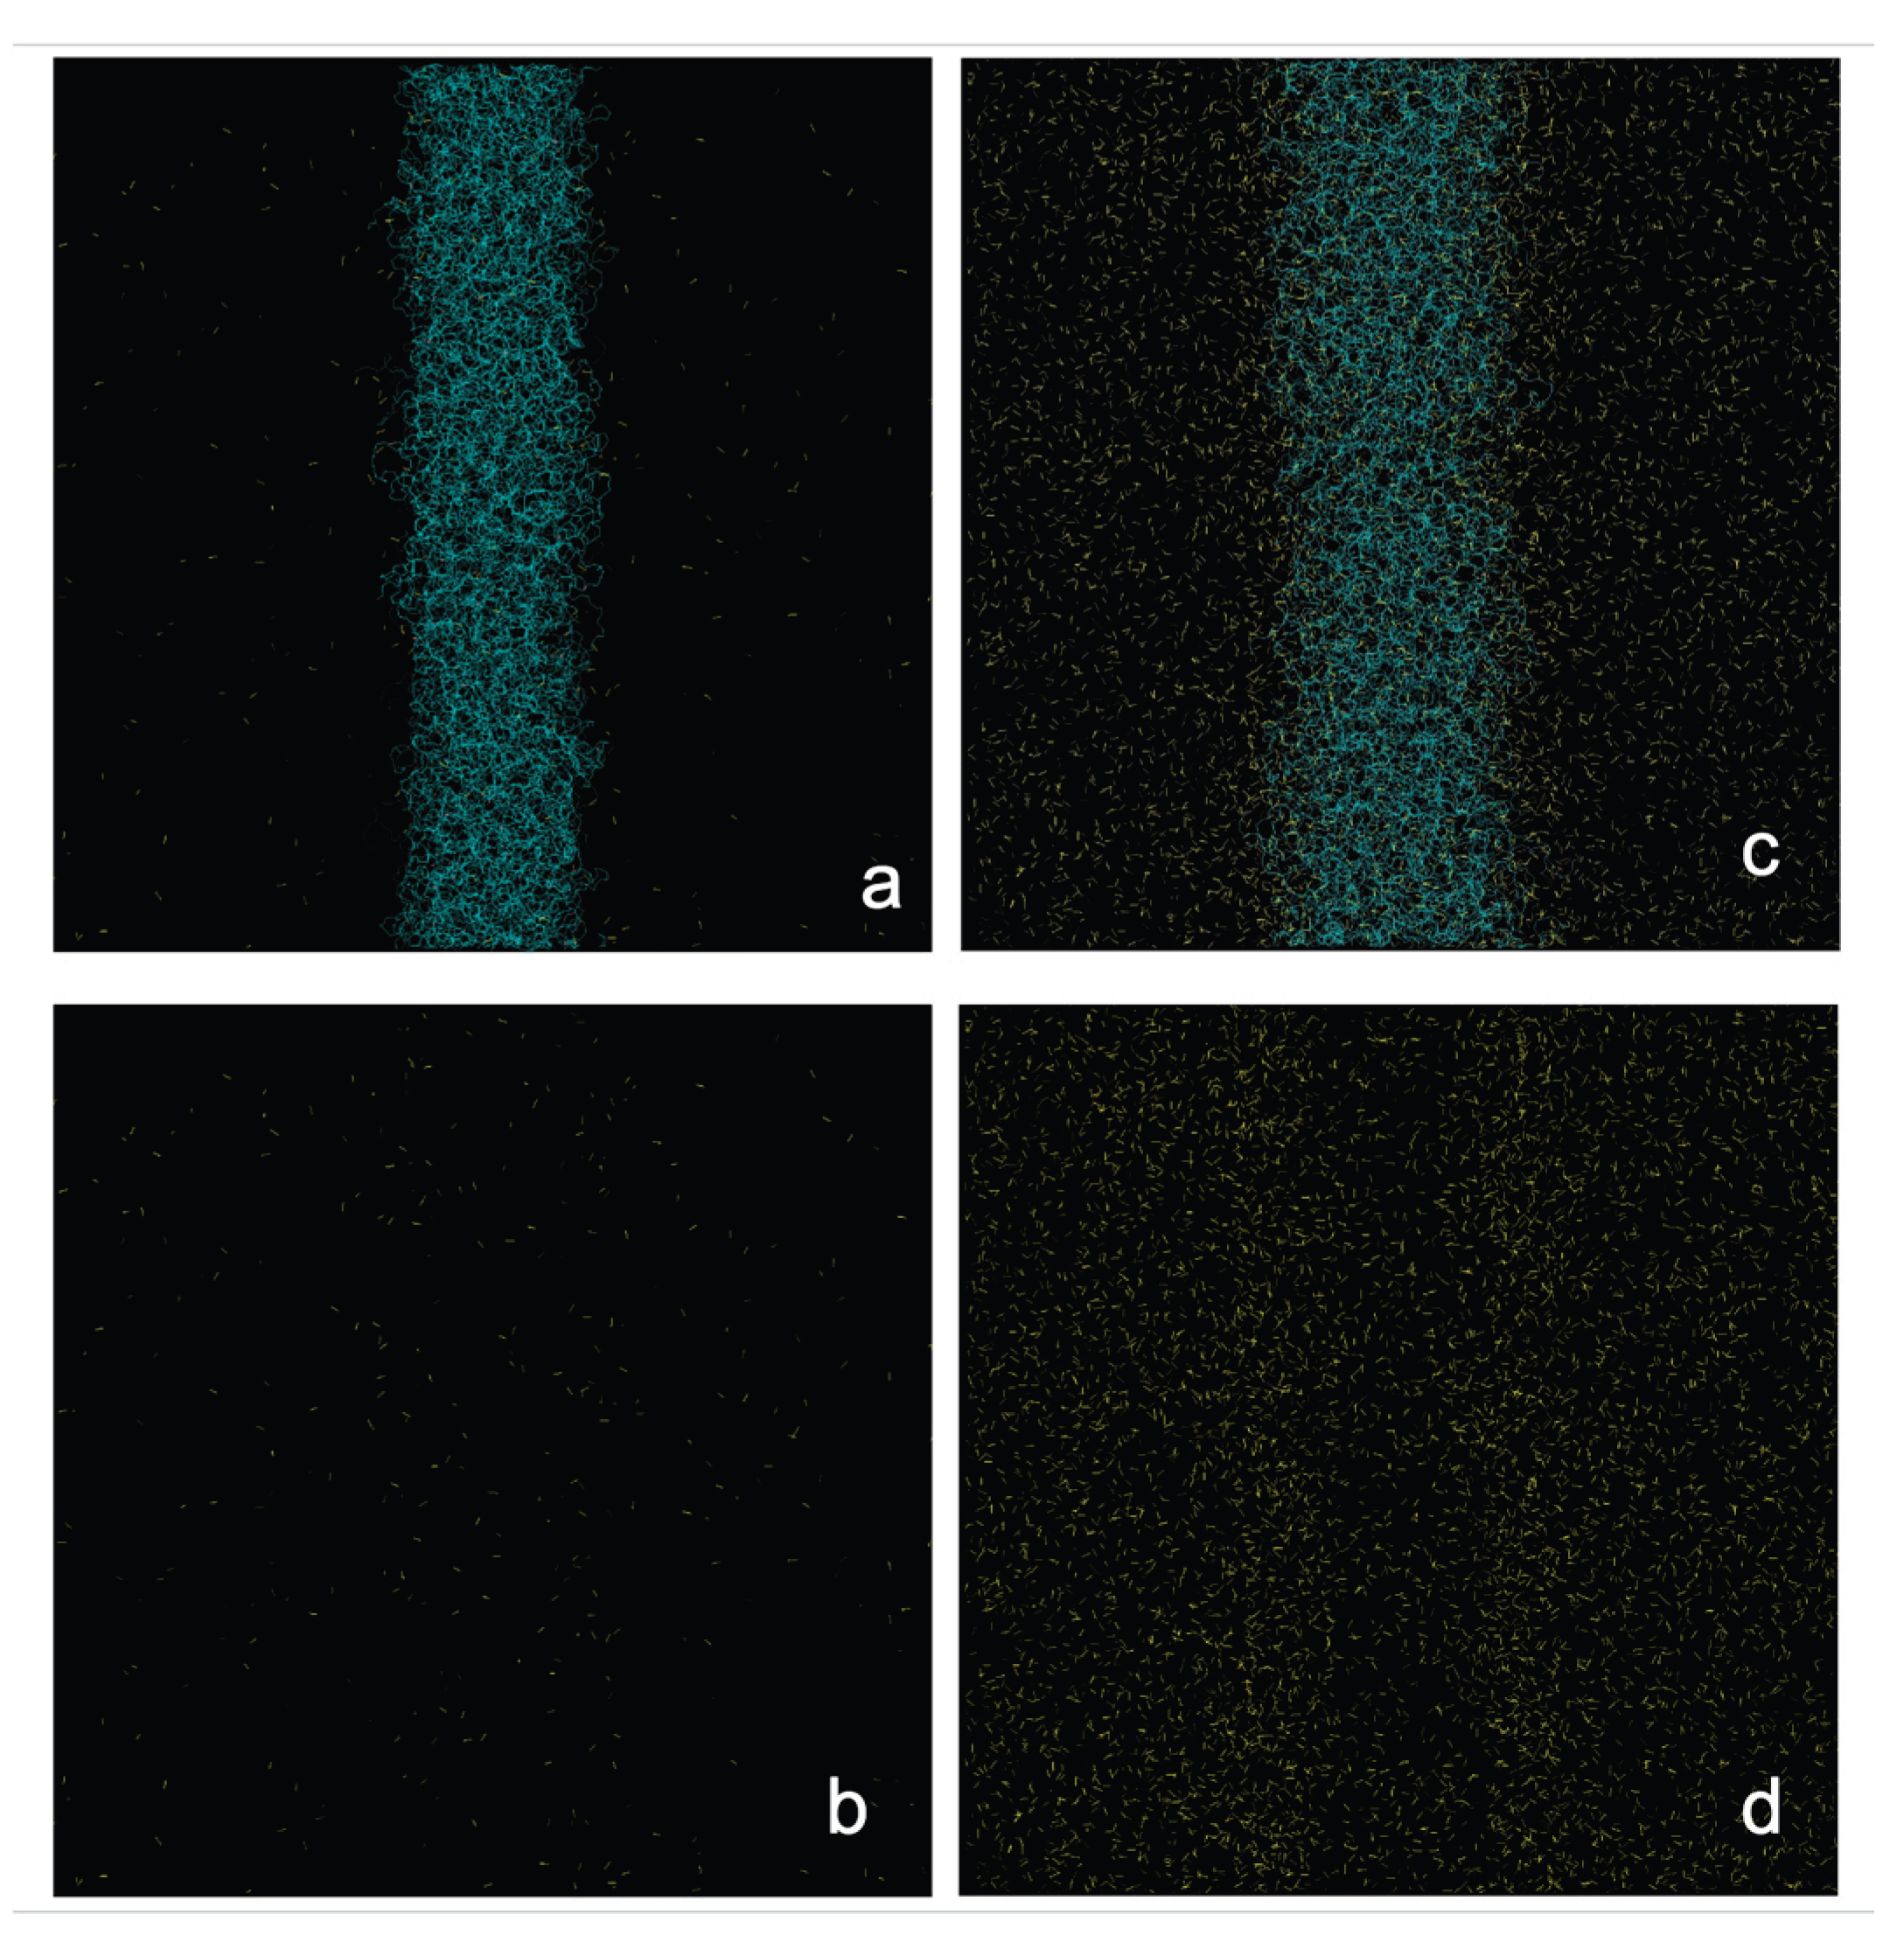
Figure 2.
Polyethylene density profiles at 373.15 K. Profiles correspond to polyethylene films in equilibrium with supercritical ethane having gas densities of a) 4.10 × 10⁻³ g/ml and b) 1.36 × 10⁻¹ g/ml. c) shows the density profiles for a pristine polyethylene film. Profiles averaged every 0.1 ns are shown with black dots, and the overall average over a 5 ns period in red dots.
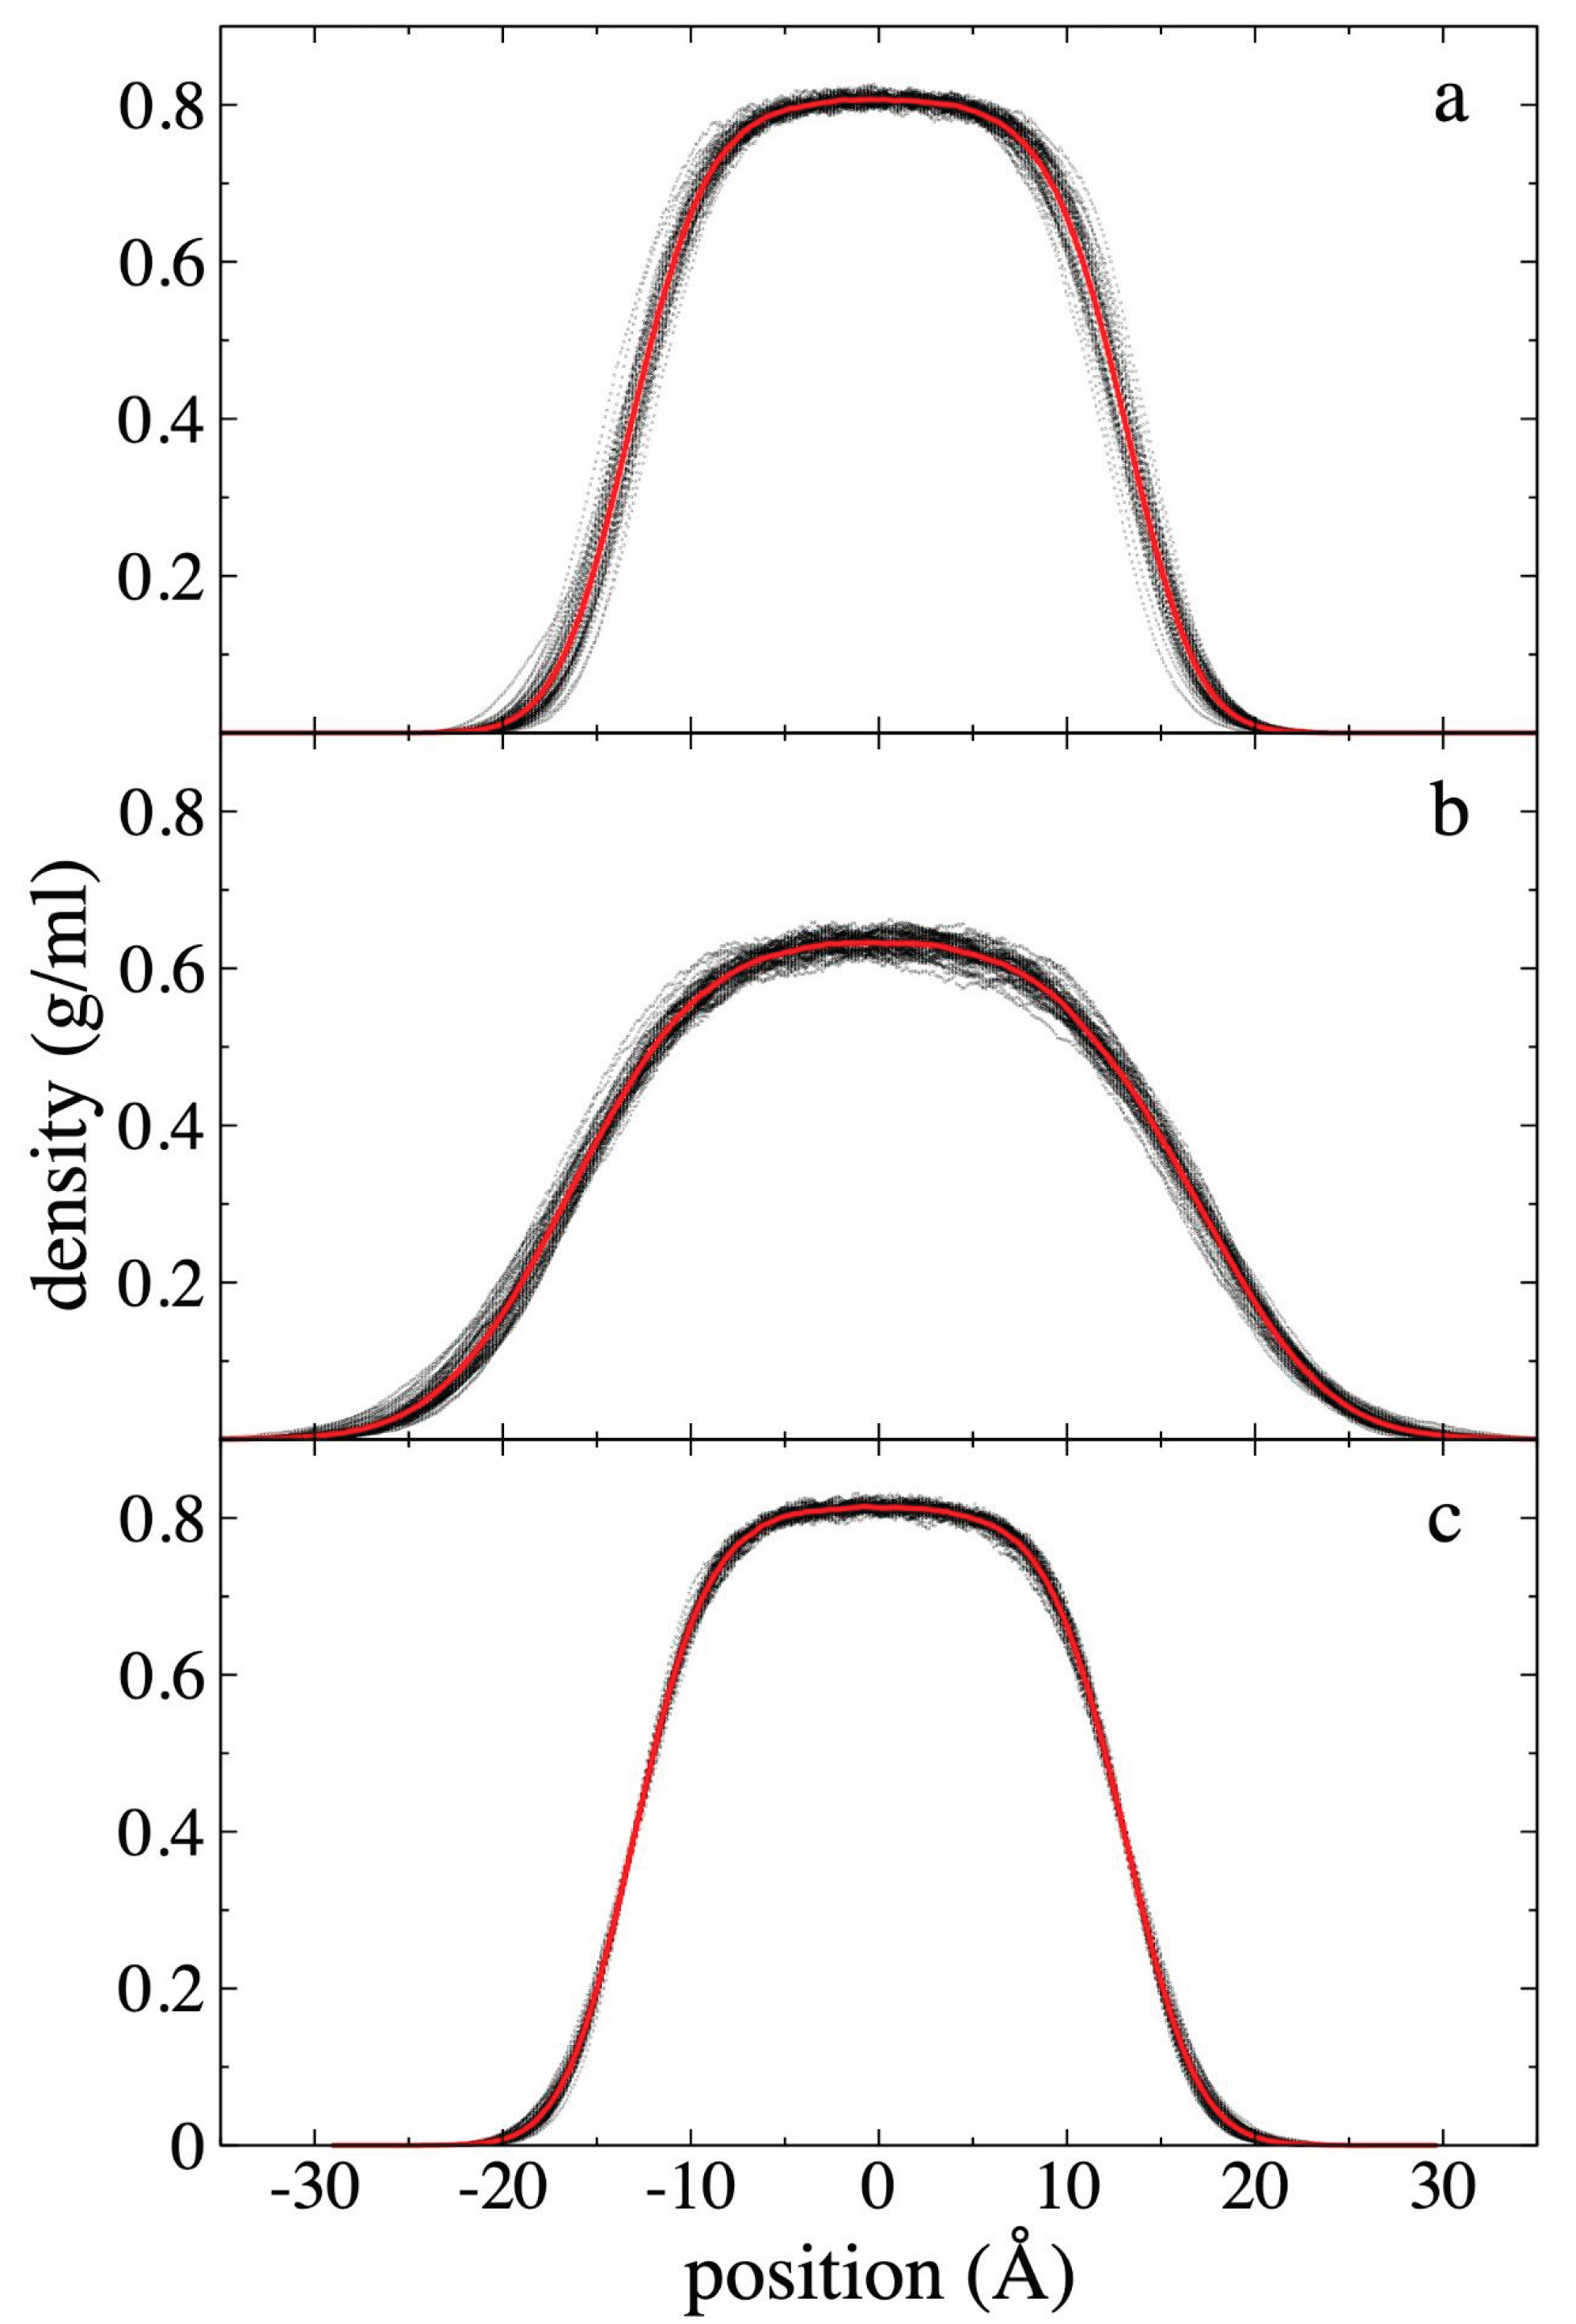
Figure 3.
Ethane density profiles at 373.15 K. Profiles correspond to polyethylene films in equilibrium with supercritical ethane having gas densities of a) 4.10 × 10⁻³ g/ml and b) 1.36 × 10⁻¹ g/ml. Profiles averaged every 0.1 ns are shown with black dots, and the overall average over a 5 ns period in red dots.
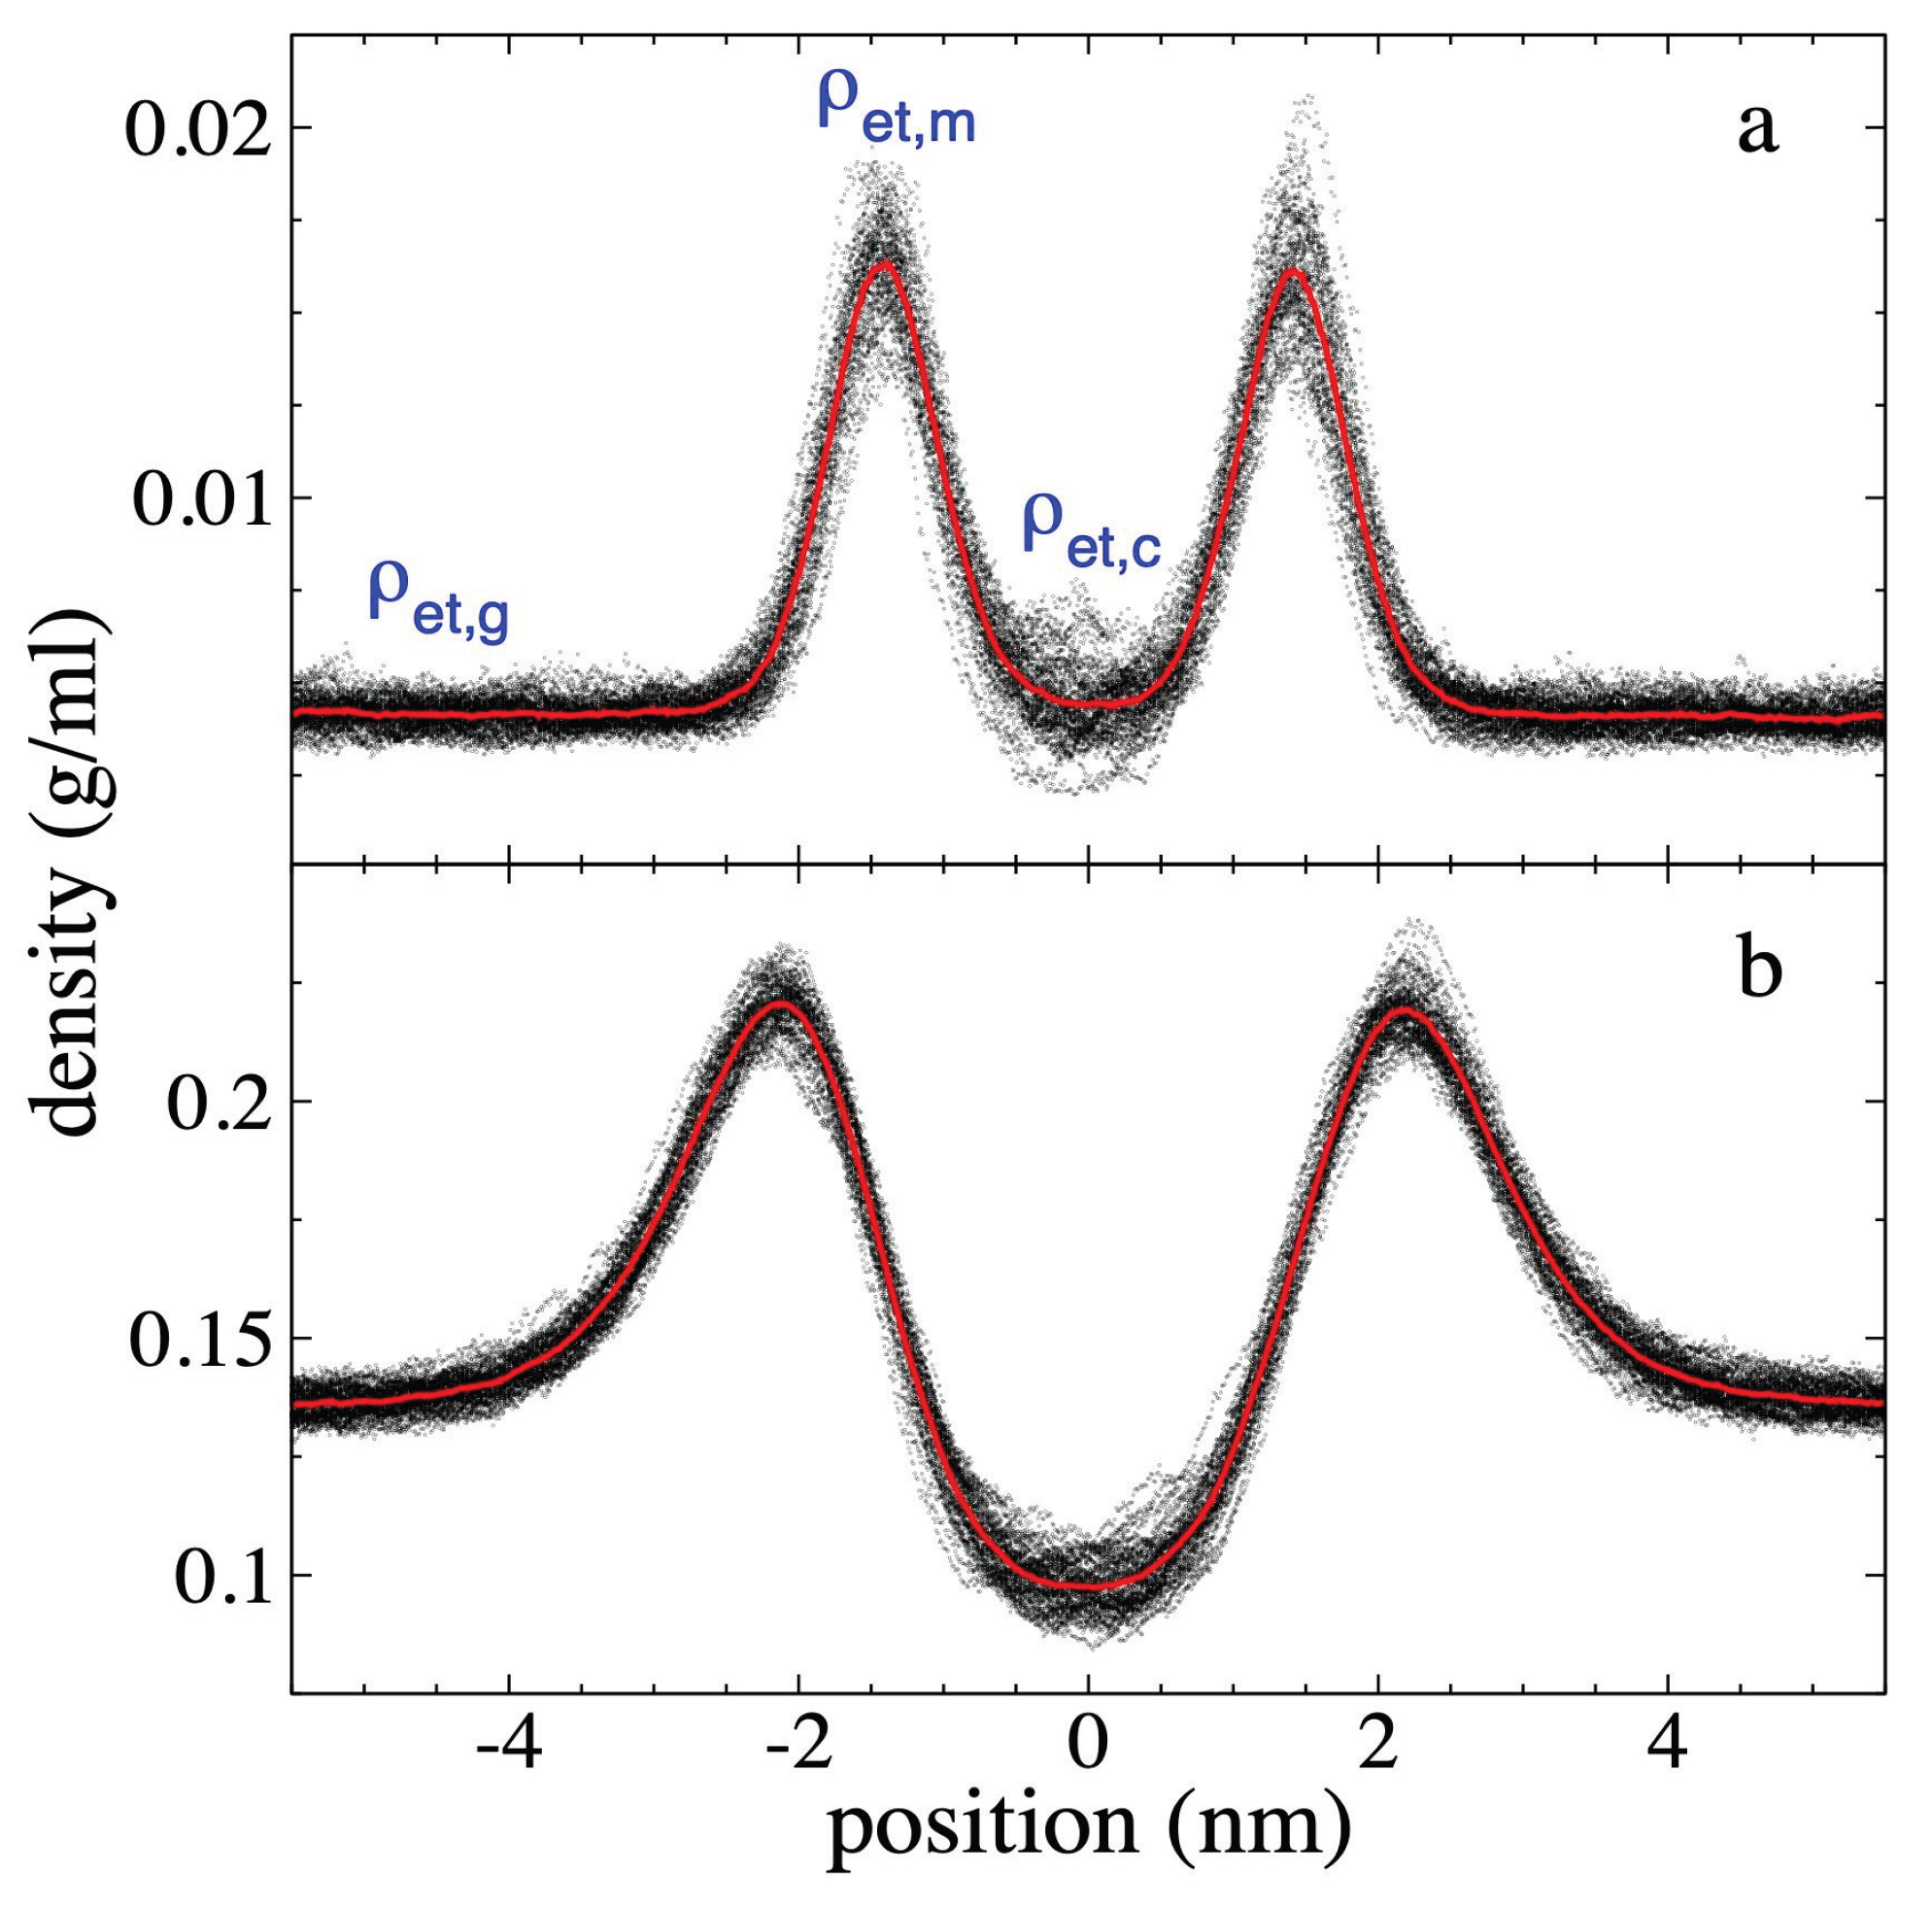
Figure 4.
Total density profiles at 373.15 K. Profiles correspond to polyethylene films in equilibrium with supercritical ethane having gas densities of a) 4.10 × 10⁻³ g/ml and b) 1.36 × 10⁻¹ g/ml. Profiles averaged every 0.1 ns are shown with black dots, and the overall average over a 5 ns period in red dots. Blue lines represent the limits of the polyethylene film with the adsorbed interfacial ethane layers.
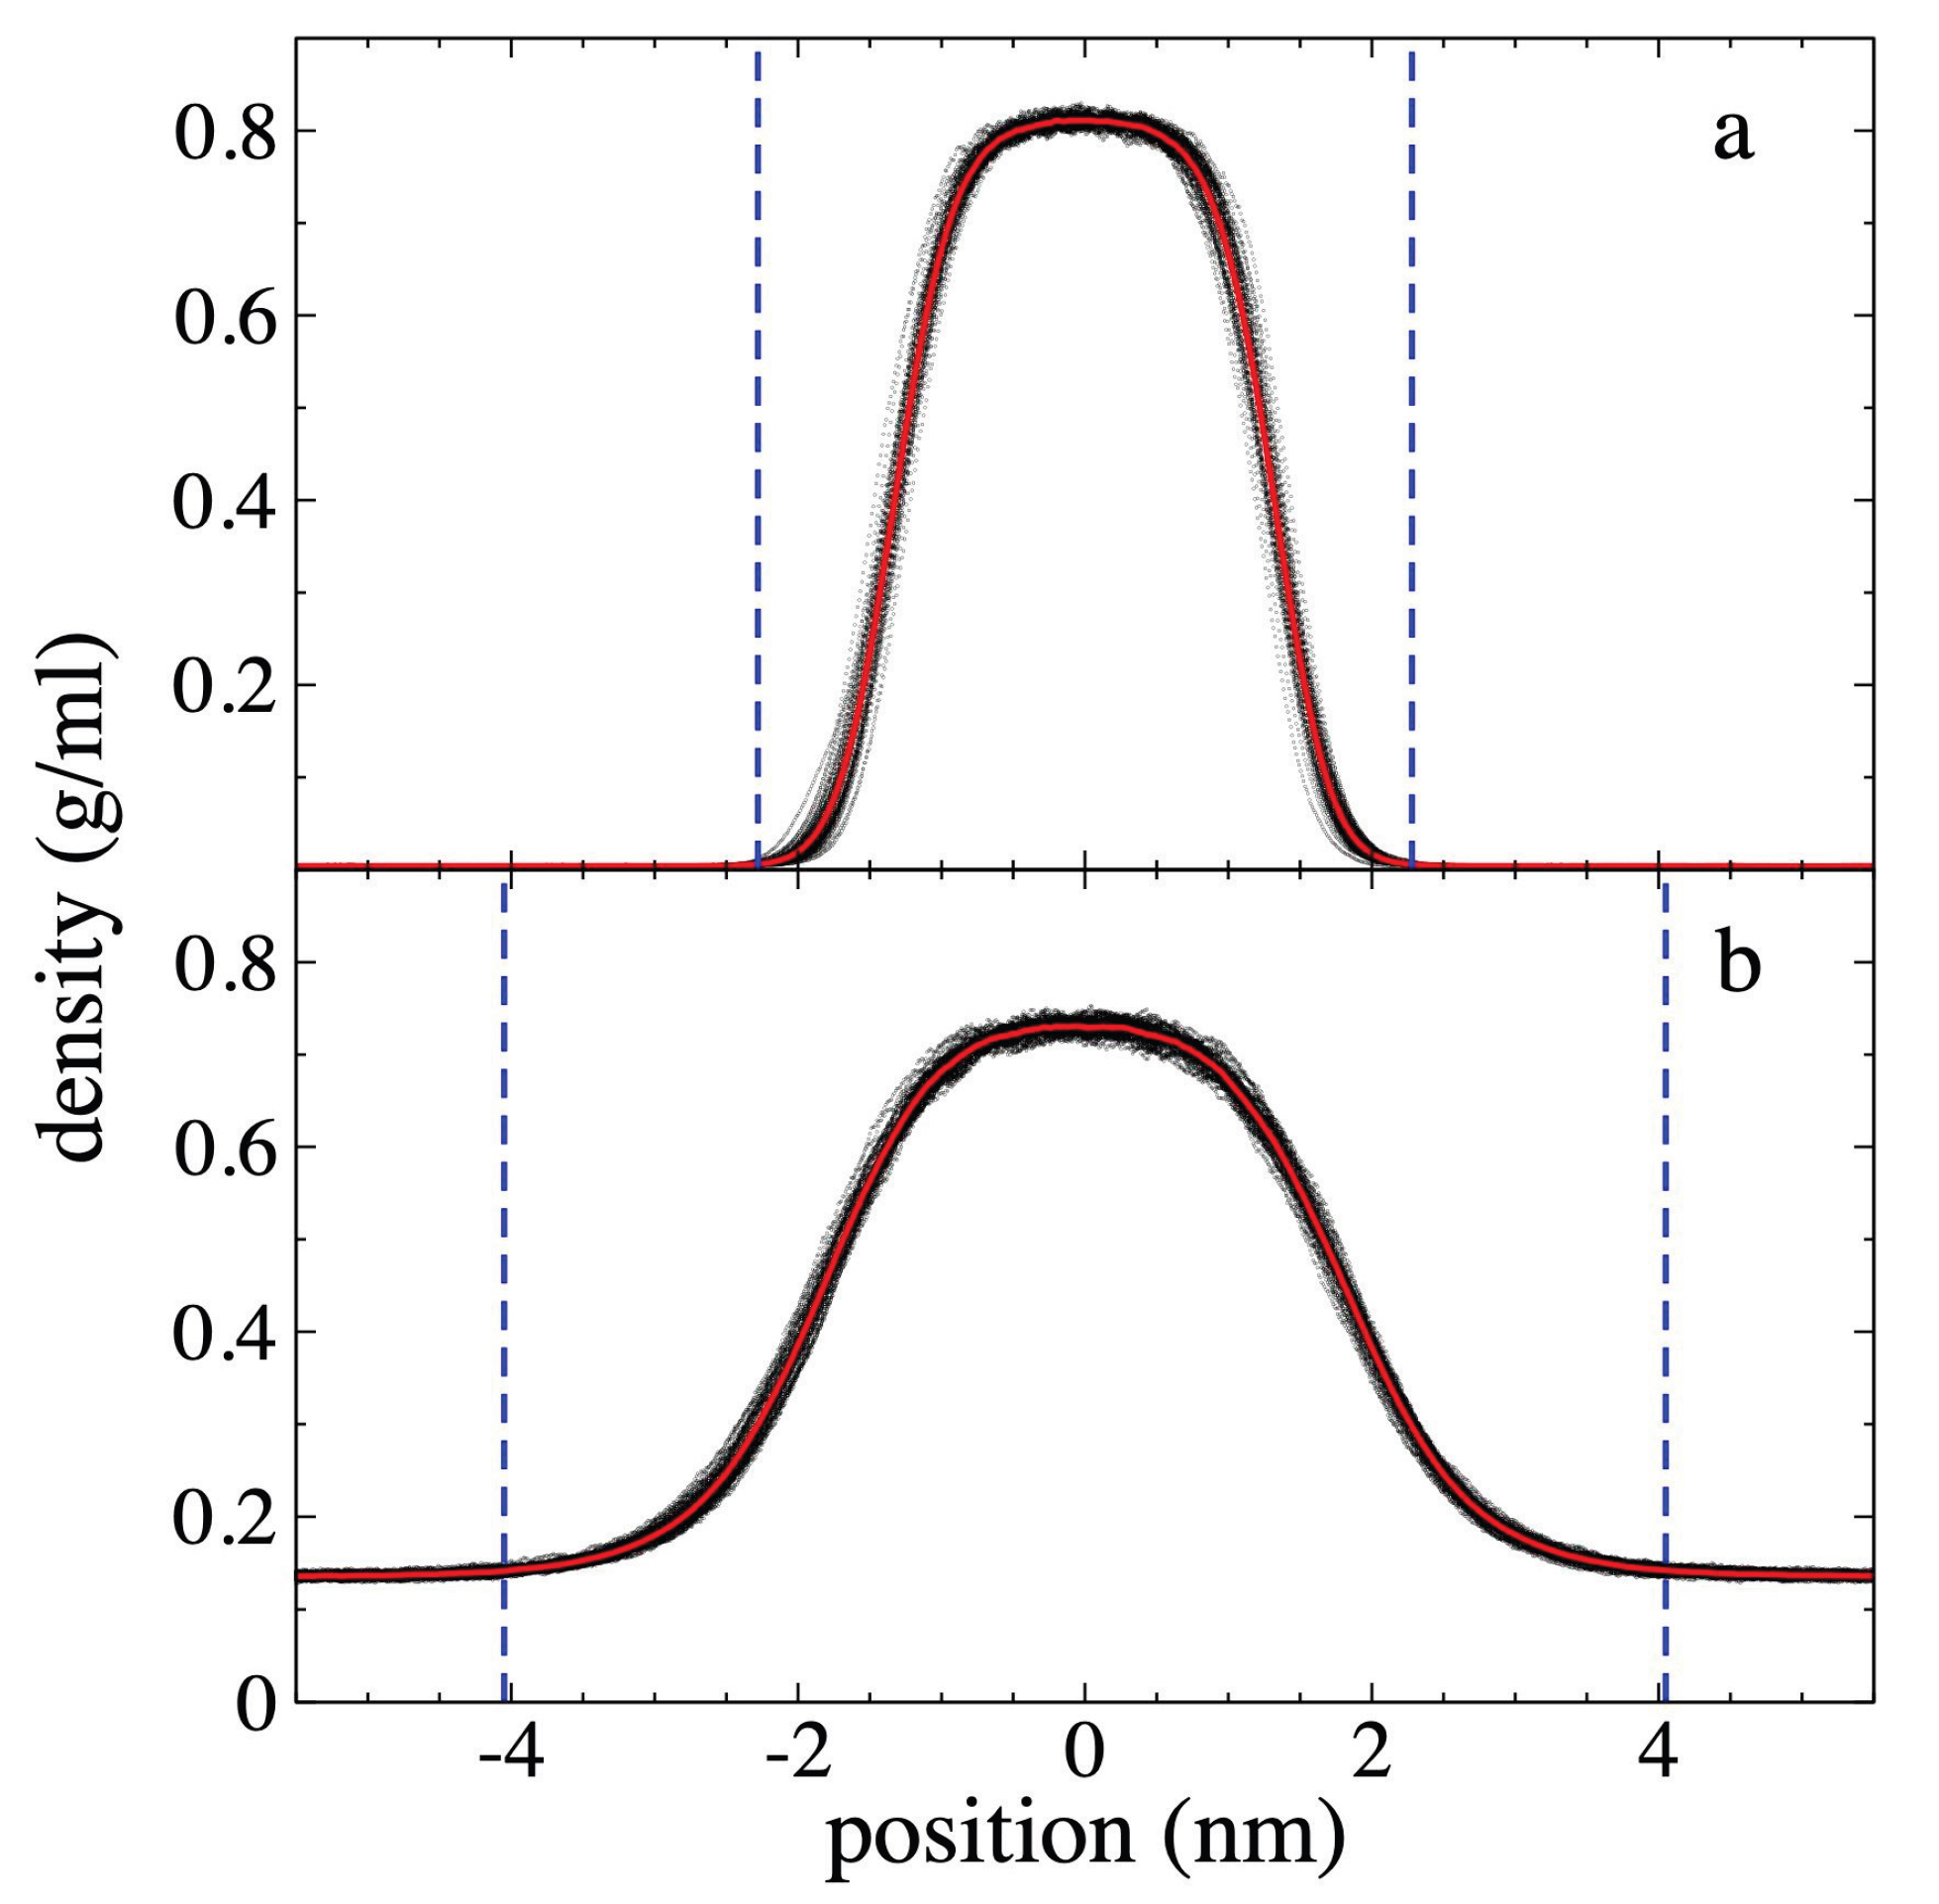
Figure 5.
Lateral and normal pressures profiles at 373.15 K, for systems representing a) the pristine polyethylene films, and the film in equilibrium with supercritical ethane having gas densities of b) 4.10 × 10⁻³ g/ml and c) 1.36 × 10⁻¹ g/ml. The two lateral pressures (black and red) and the normal pressure (green) are shown. d) Profiles of the function corresponding to systems a) blue dots, b) brown dots, and c) orange dots, respectively.

Figure 6.
Profiles of the main contributions to the function at 373.15 K, for systems representing a) the pristine polyethylene films, and the film in equilibrium with supercritical ethane having gas densities of b) 4.10 × 10⁻³ g/ml and c) 1.36 × 10⁻¹ g/ml. The sum of all contributions are plotted with black dots, the contributions of inter-chain interactions with red dots, bond vibrations with green dots, and angle vibrations with blue dots. The contributions due to bond vibrations from a) are also shown in b) with orange dots for comparison.
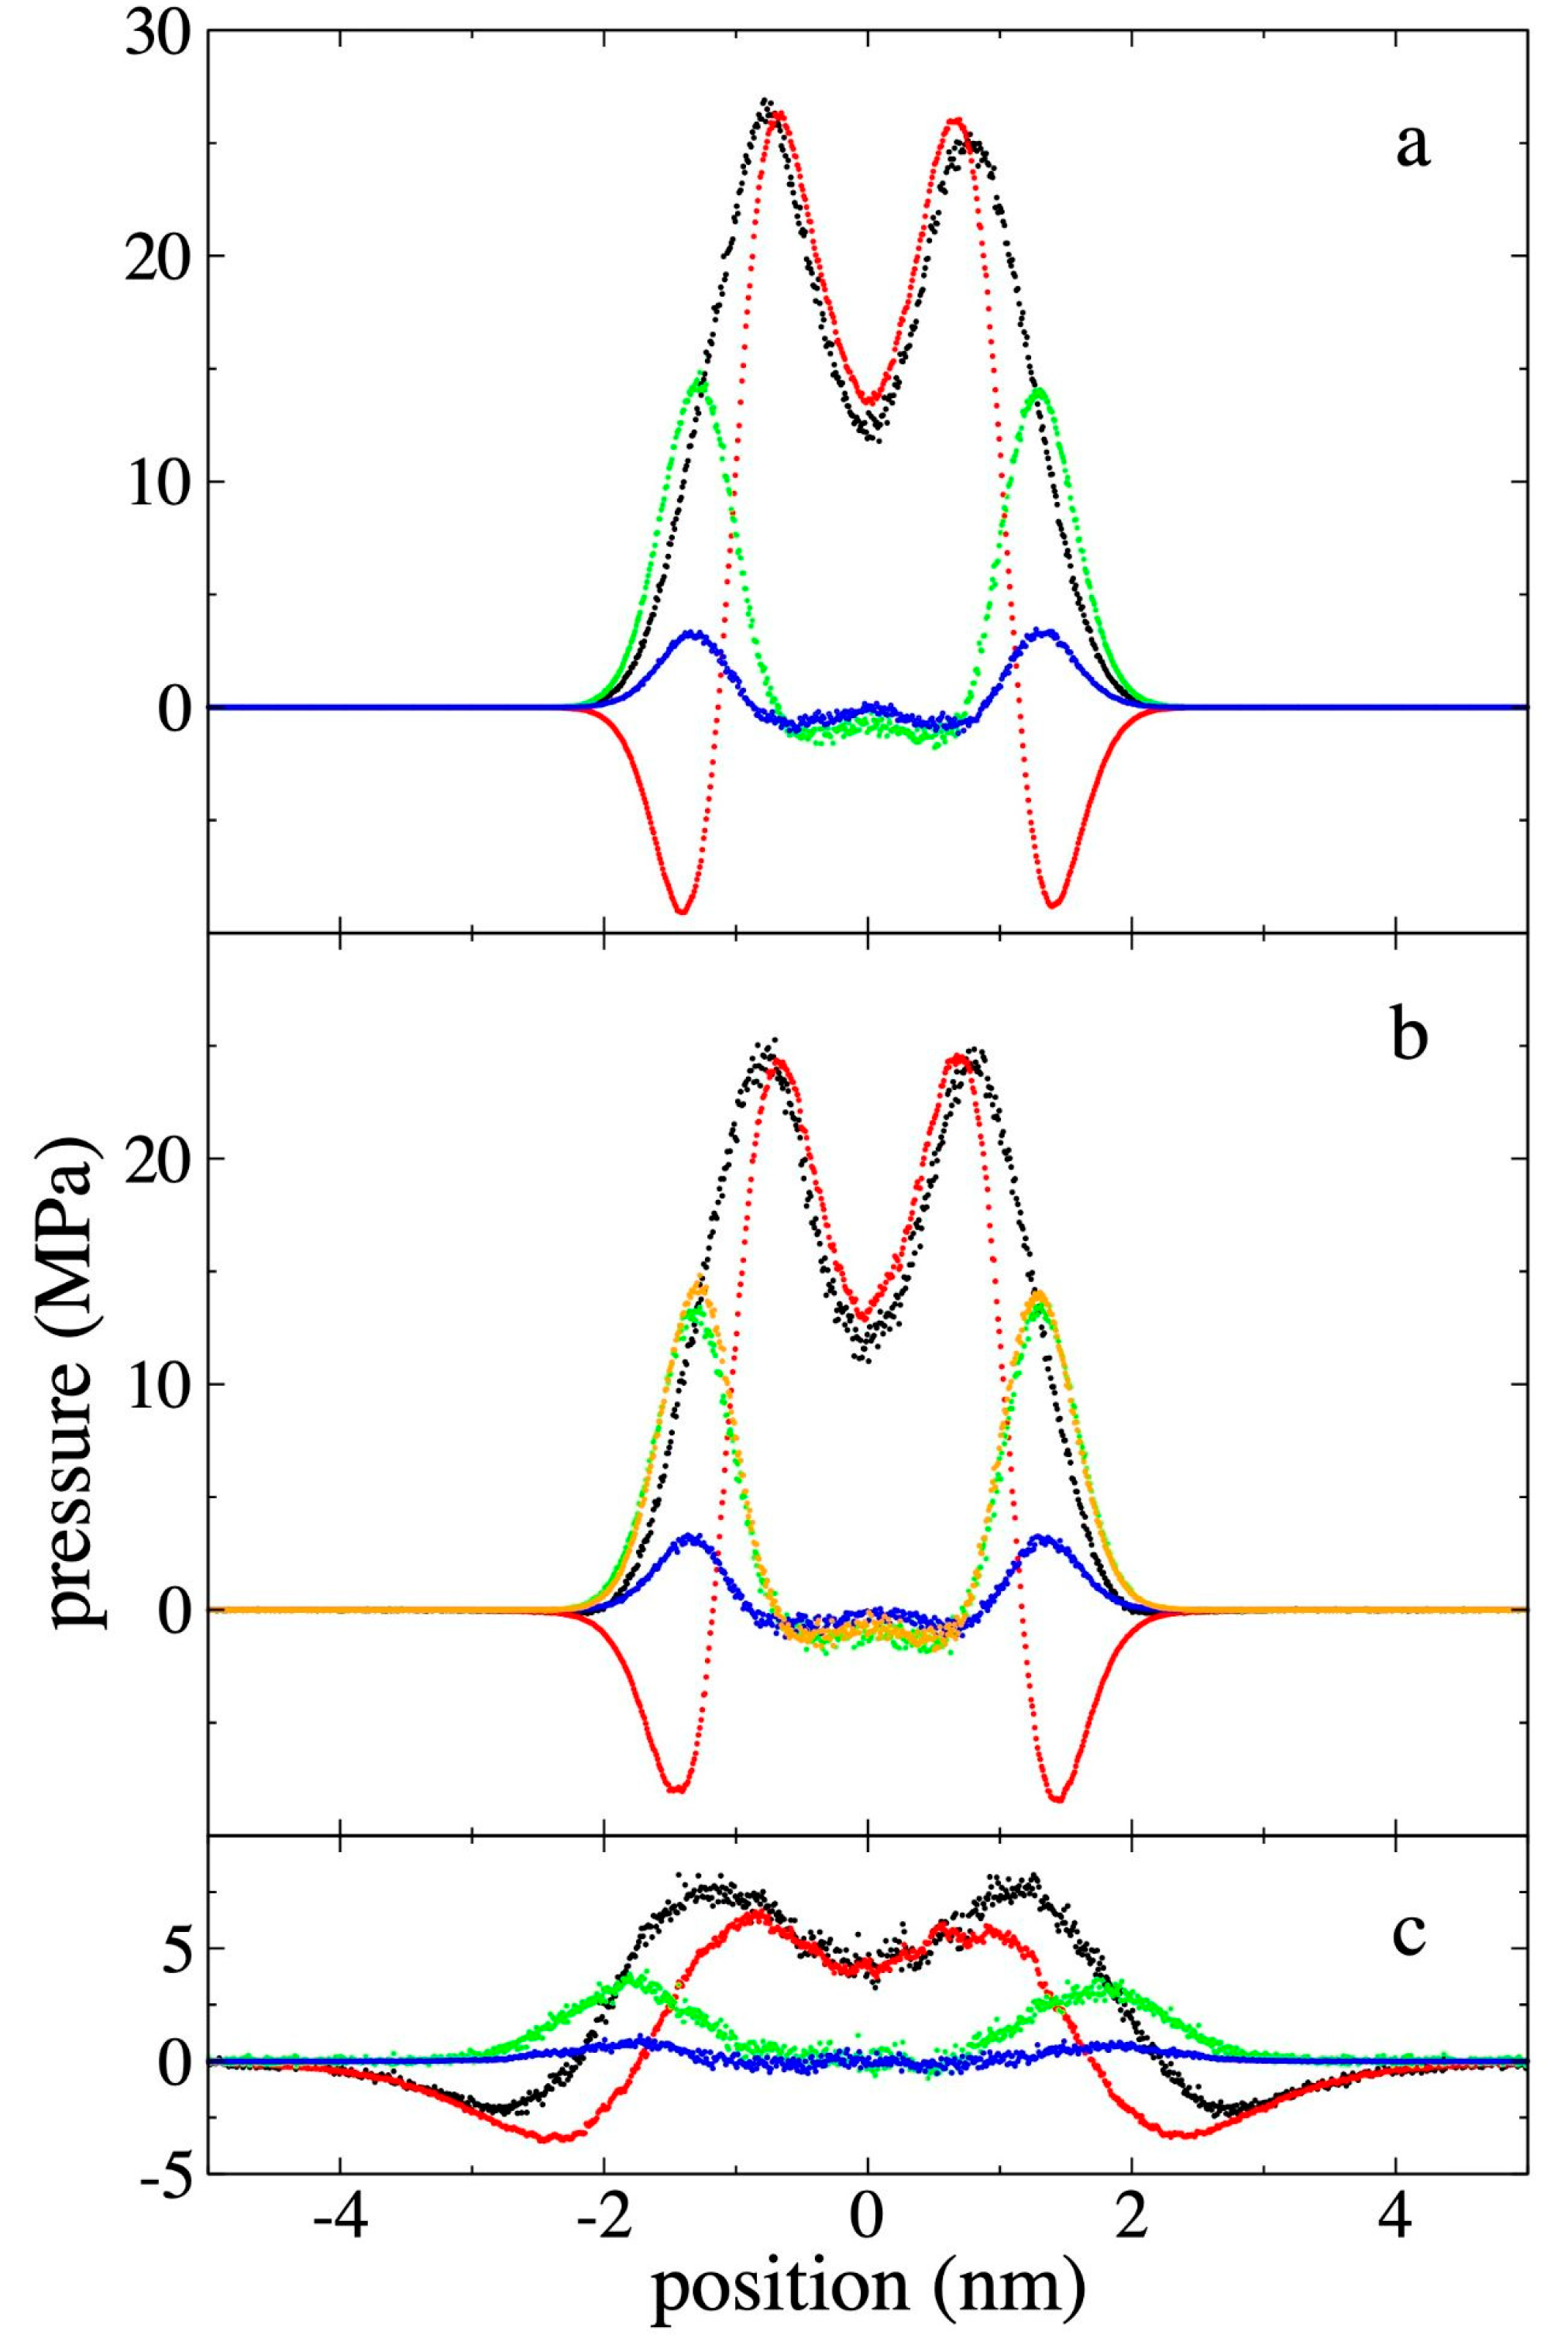
Figure 7.
Gas density - pressure isotherms for supercritical ethane in equilibrium with the polyethylene film at a) 298.15, b) 373.15 and c) 448.15 K. Data points represent the average density of bulk ethane gas (black circles), maximum adsorption peak density (blue circles), and average ethane density at the film's center (red circles). Solid black lines indicate experimental data [55]. Red lines represent linear regressions.
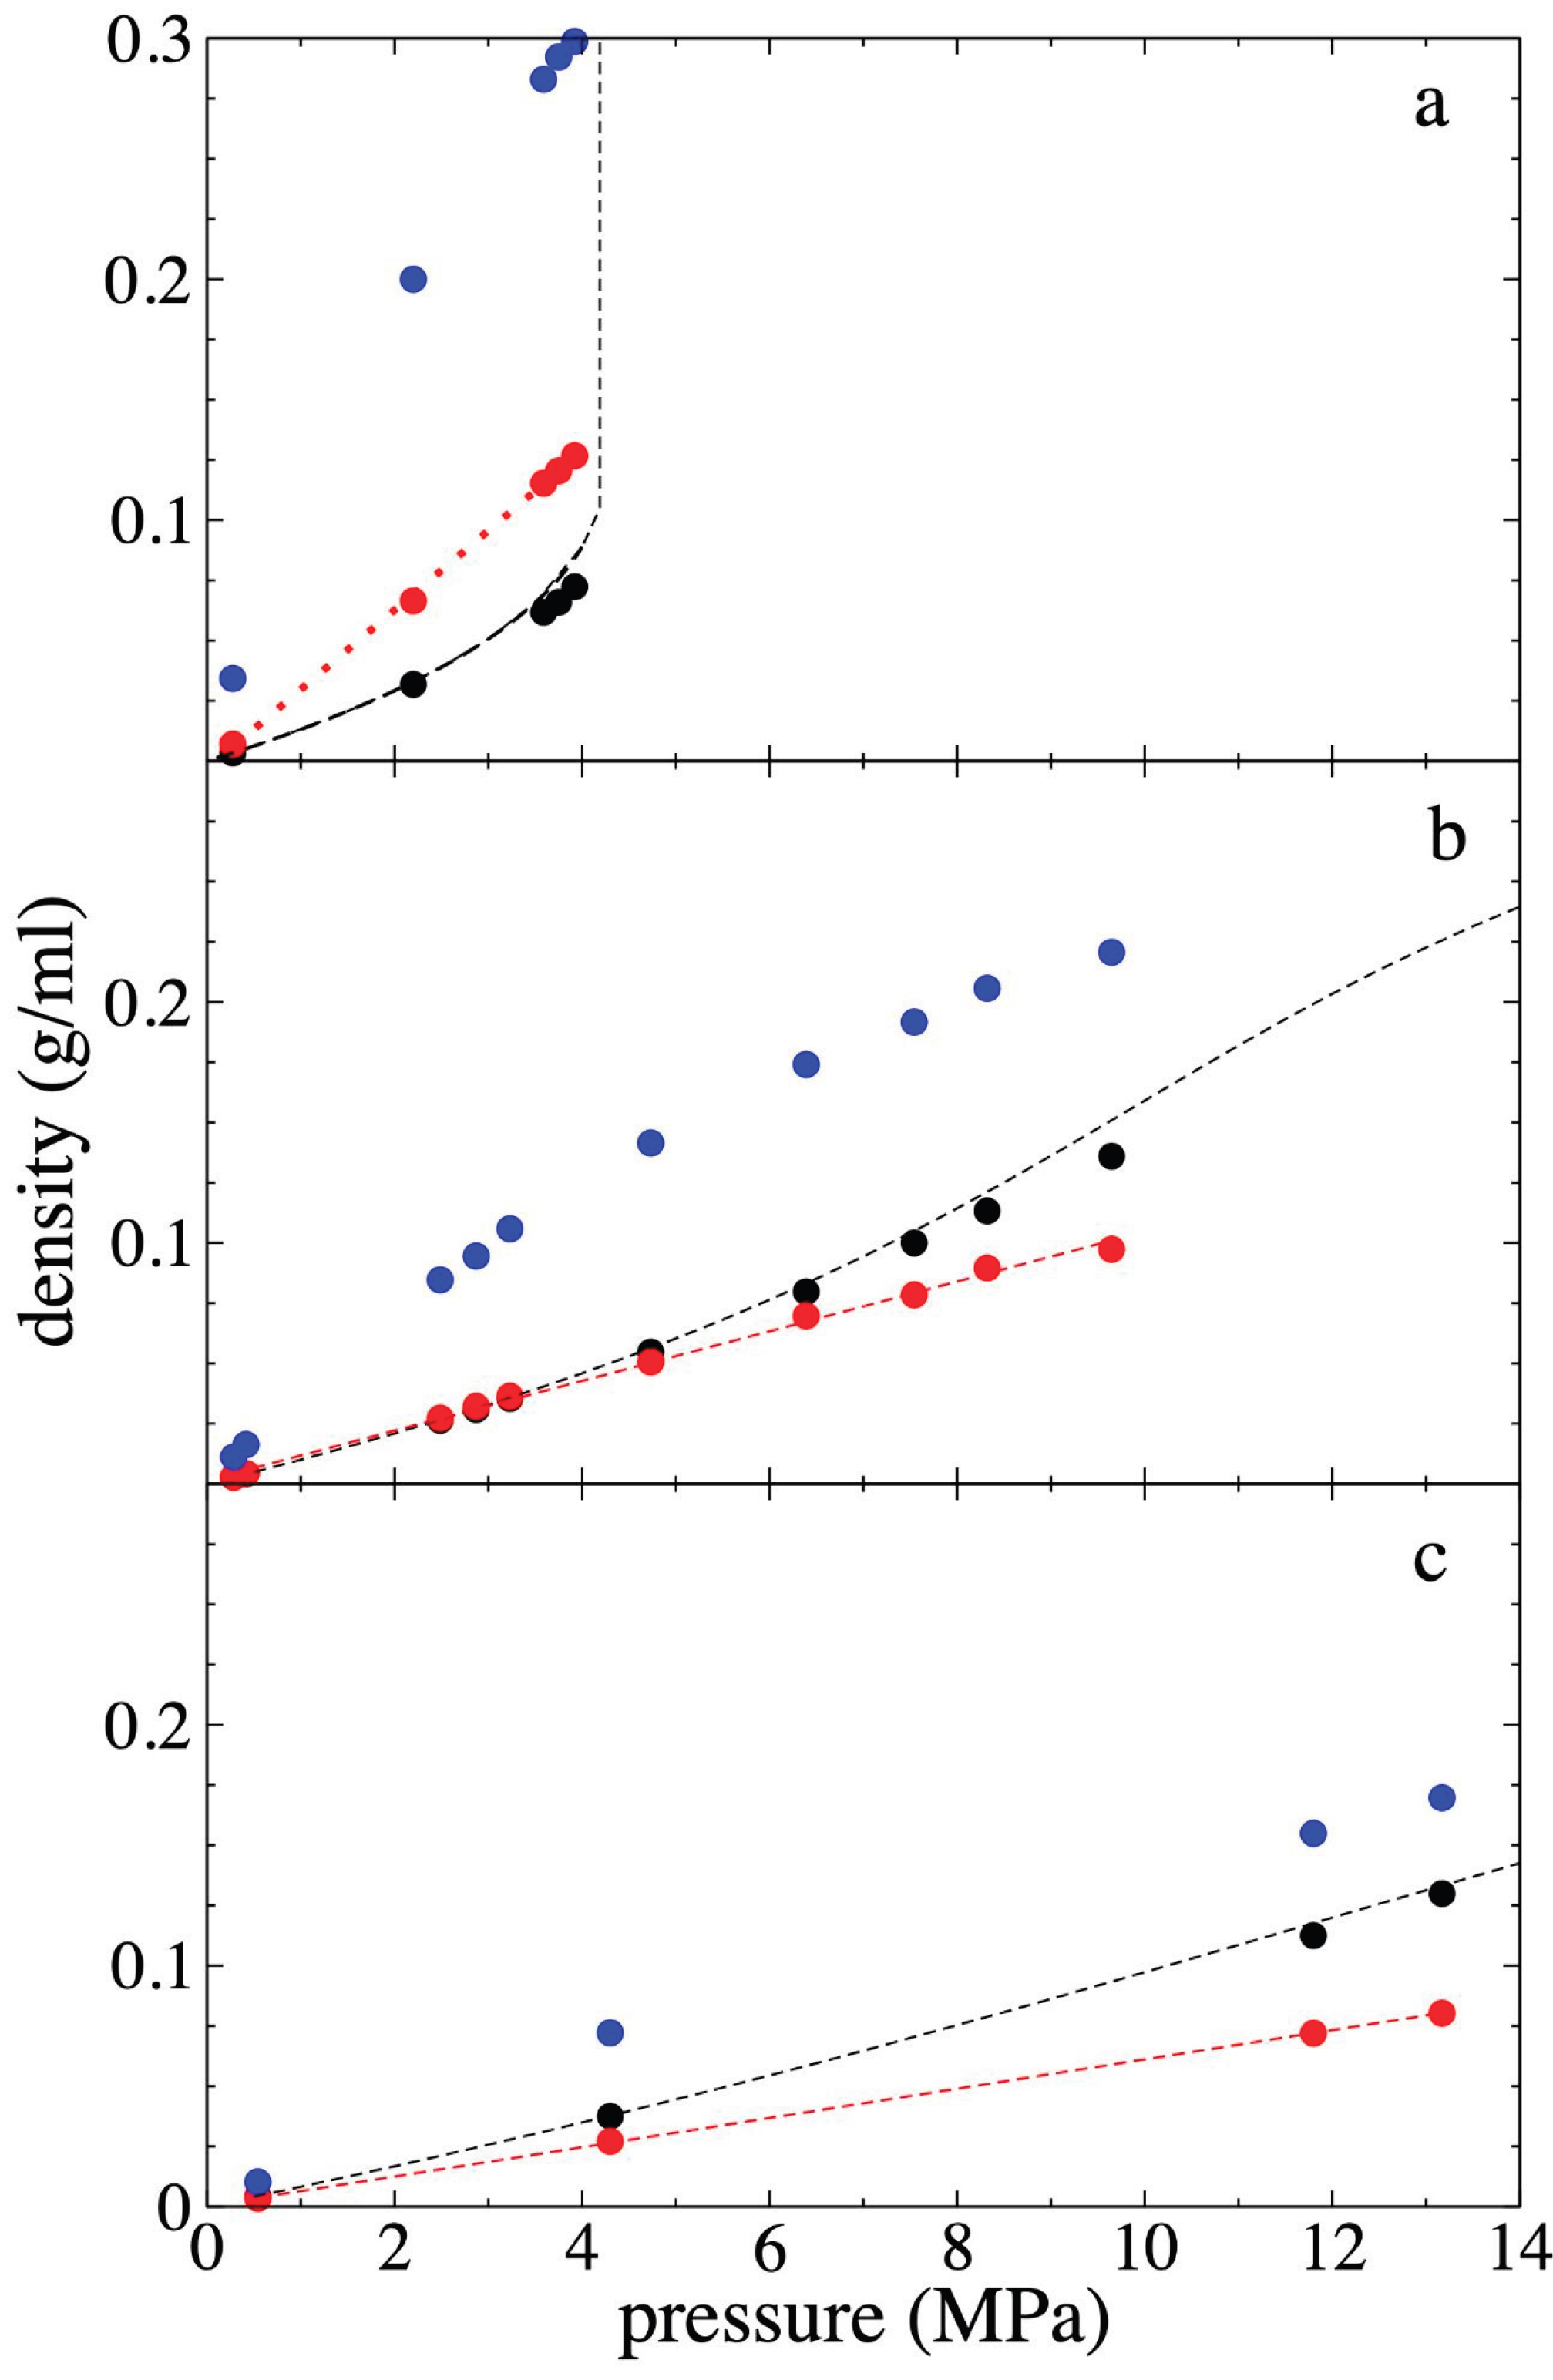
Figure 8.
Interfacial tension as a function of the bulk pressure of the gas ethane, for systems representing polyethylene films in equilibrium with supercritical ethane, at temperatures of a) 298.15 (black circles), b) 373.15 (red circles) and c) 448.15 K (blue circles). The corresponding lines represent the fitting to an exponential decay function.
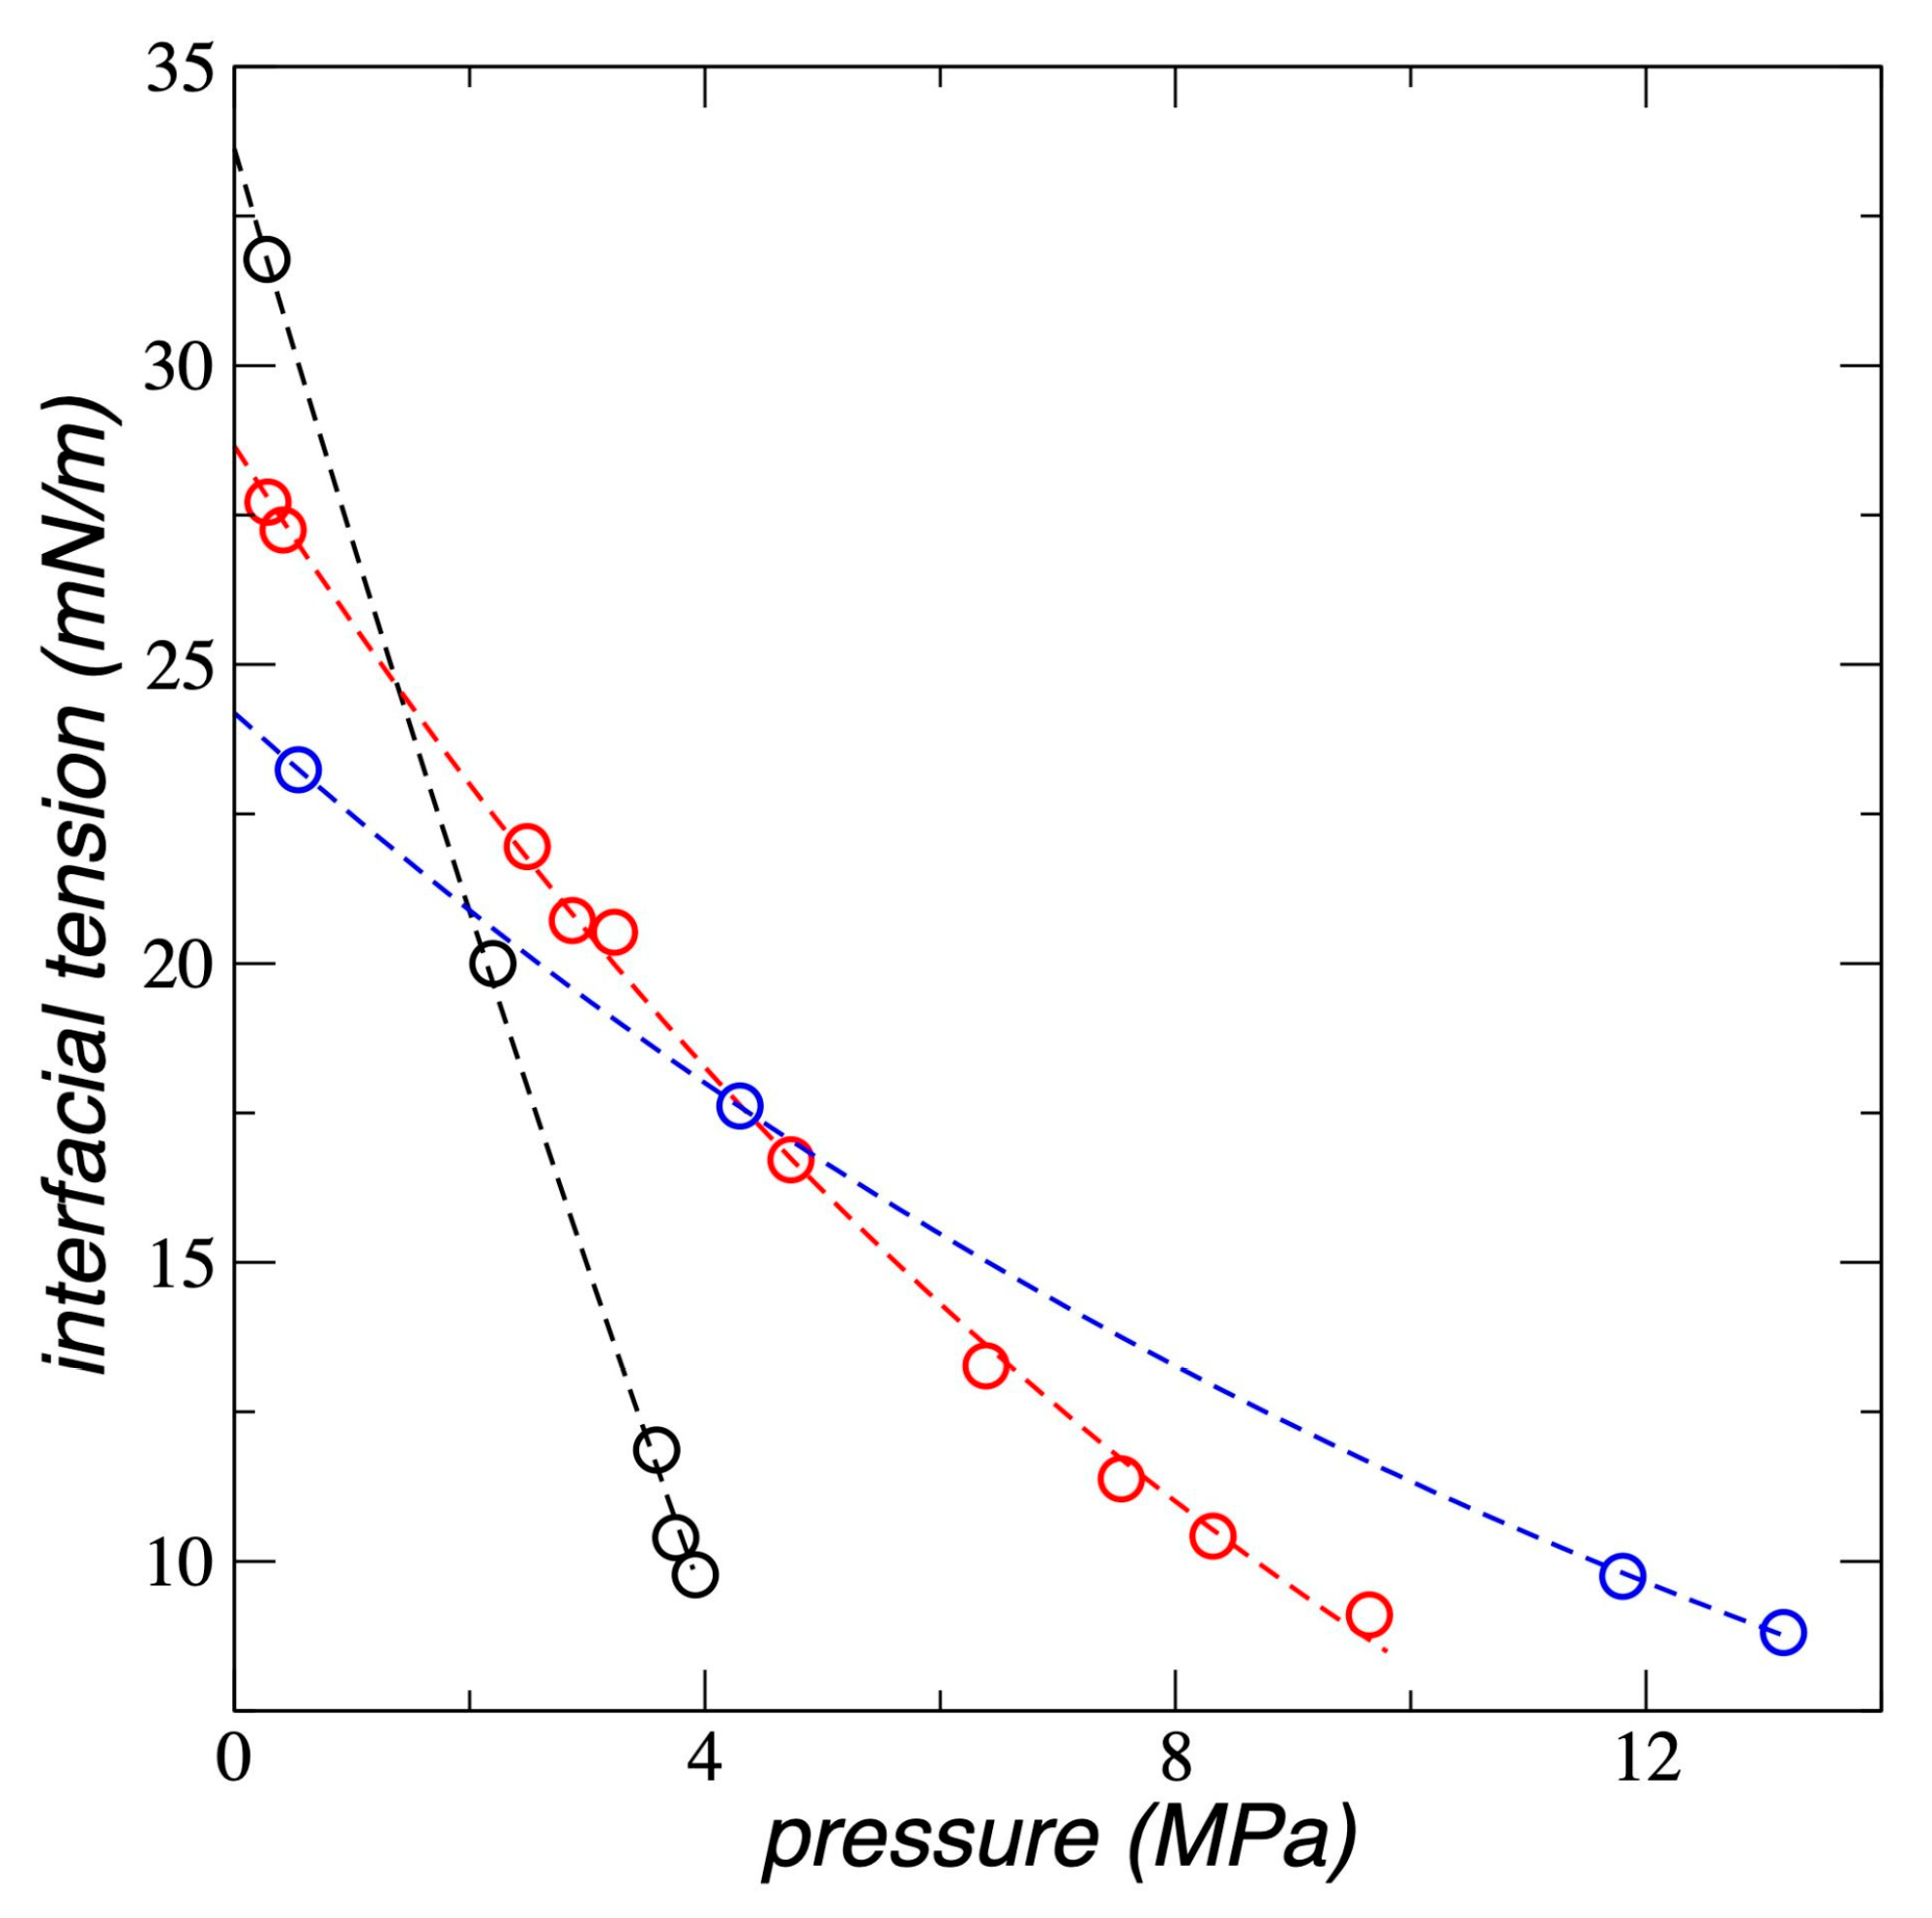
Figure 9.
Total load as a function of the bulk gas pressure for polyethylene films in equilibrium with supercritical ethane, at a) 298.15 K (black circles), b) 373.15 K (red circles) and c) 448.15 K (blue circles). The corresponding lines represent the fitting to exponential growth functions.
Figure 9.
Total load as a function of the bulk gas pressure for polyethylene films in equilibrium with supercritical ethane, at a) 298.15 K (black circles), b) 373.15 K (red circles) and c) 448.15 K (blue circles). The corresponding lines represent the fitting to exponential growth functions.
Disclaimer/Publisher’s Note: The statements, opinions and data contained in all publications are solely those of the individual author(s) and contributor(s) and not of MDPI and/or the editor(s). MDPI and/or the editor(s) disclaim responsibility for any injury to people or property resulting from any ideas, methods, instructions or products referred to in the content. |
© 2025 by the authors. Licensee MDPI, Basel, Switzerland. This article is an open access article distributed under the terms and conditions of the Creative Commons Attribution (CC BY) license (http://creativecommons.org/licenses/by/4.0/).
Copyright: This open access article is published under a Creative Commons CC BY 4.0 license, which permit the free download, distribution, and reuse, provided that the author and preprint are cited in any reuse.


