
Submitted:
21 September 2025
Posted:
22 September 2025
You are already at the latest version
Abstract
Coeliac disease (CeD) is a gastrointestinal enteropathy triggered by the consumption of gluten in predisposed individuals. Only around 50% of CeD genetic risk is understood, with the majority of risk attributed to the HLA loci. We investigated the butyrophilin family of immunomodulators as novel CeD risk loci. We sequenced the butyrophilin loci of 48 CeD and 46 control patients and carried out gene-based burden testing on the captured single nucleotide polymorphisms (SNPs). We found significantly increased BTN2A1 gene burden in CeD patients. To validate these results, the SNP data of 3094 CeD patients and 29 762 control participants from the UK Biobank database were subjected to single variant analyses. Fourteen BTN2A1, 10 BTN3A1, and 13 BTN3A2 SNPs were significantly associated with CeD status. Twenty of the 37 SNPs above were associated with CeD status independent of the risk associated HLA genotypes. All twenty of these SNPs, alongside a novel SNP not included in the above SNPs were associated with CeD in HLA-DQ2.5-matched case-control groups. This study reaffirmed the association of the BTN3A2 locus with CeD risk, and identified BTN2A1 and BTN3A1 as putative novel CeD risk loci.
Keywords:
coeliac disease
; butyrophilin family
; hypervariable region 4 (HV4)
; UK Biobank
1. Introduction
Coeliac disease (CeD) is a T-cell mediated autoimmune enteropathy triggered by the consumption of gluten, a protein found in wheat, rye, and barley [1]. During active CeD, individuals with underlying genetic risk suffer from small intestinal inflammation after the consumption of dietary gluten [2]. This chronic inflammation causes villous atrophy, that can lead to symptoms including abdominal pain, diarrhoea, malabsorption, and malnutrition [3]. Currently the only treatment for CeD is eliminating gluten from the diet of patients with CeD predisposition [4].
The genetic background of CeD predisposition is still not fully understood, as only 50% of the genetic risk has been explored [1]. The most well established CeD risk loci is the human leukocyte antigen (HLA) complex [1,5,6,7,8,9,10]. The HLA-DQ2.5, HLA-DQ2.2, and HLA-DQ8 heterodimers are present in more than 80% of CeD patients [11,12,13,14,15]. In contrast, about 20-30% of healthy controls have the CeD associated risk HLA genotypes [11,12,16]. These HLA genotypes were estimated to explain about 30-40% of the total CeD genetic risk [17,18]. Recent evidence has shown the butyrophilin family of genes to be non-HLA CeD risk loci of interest [19,20,21].
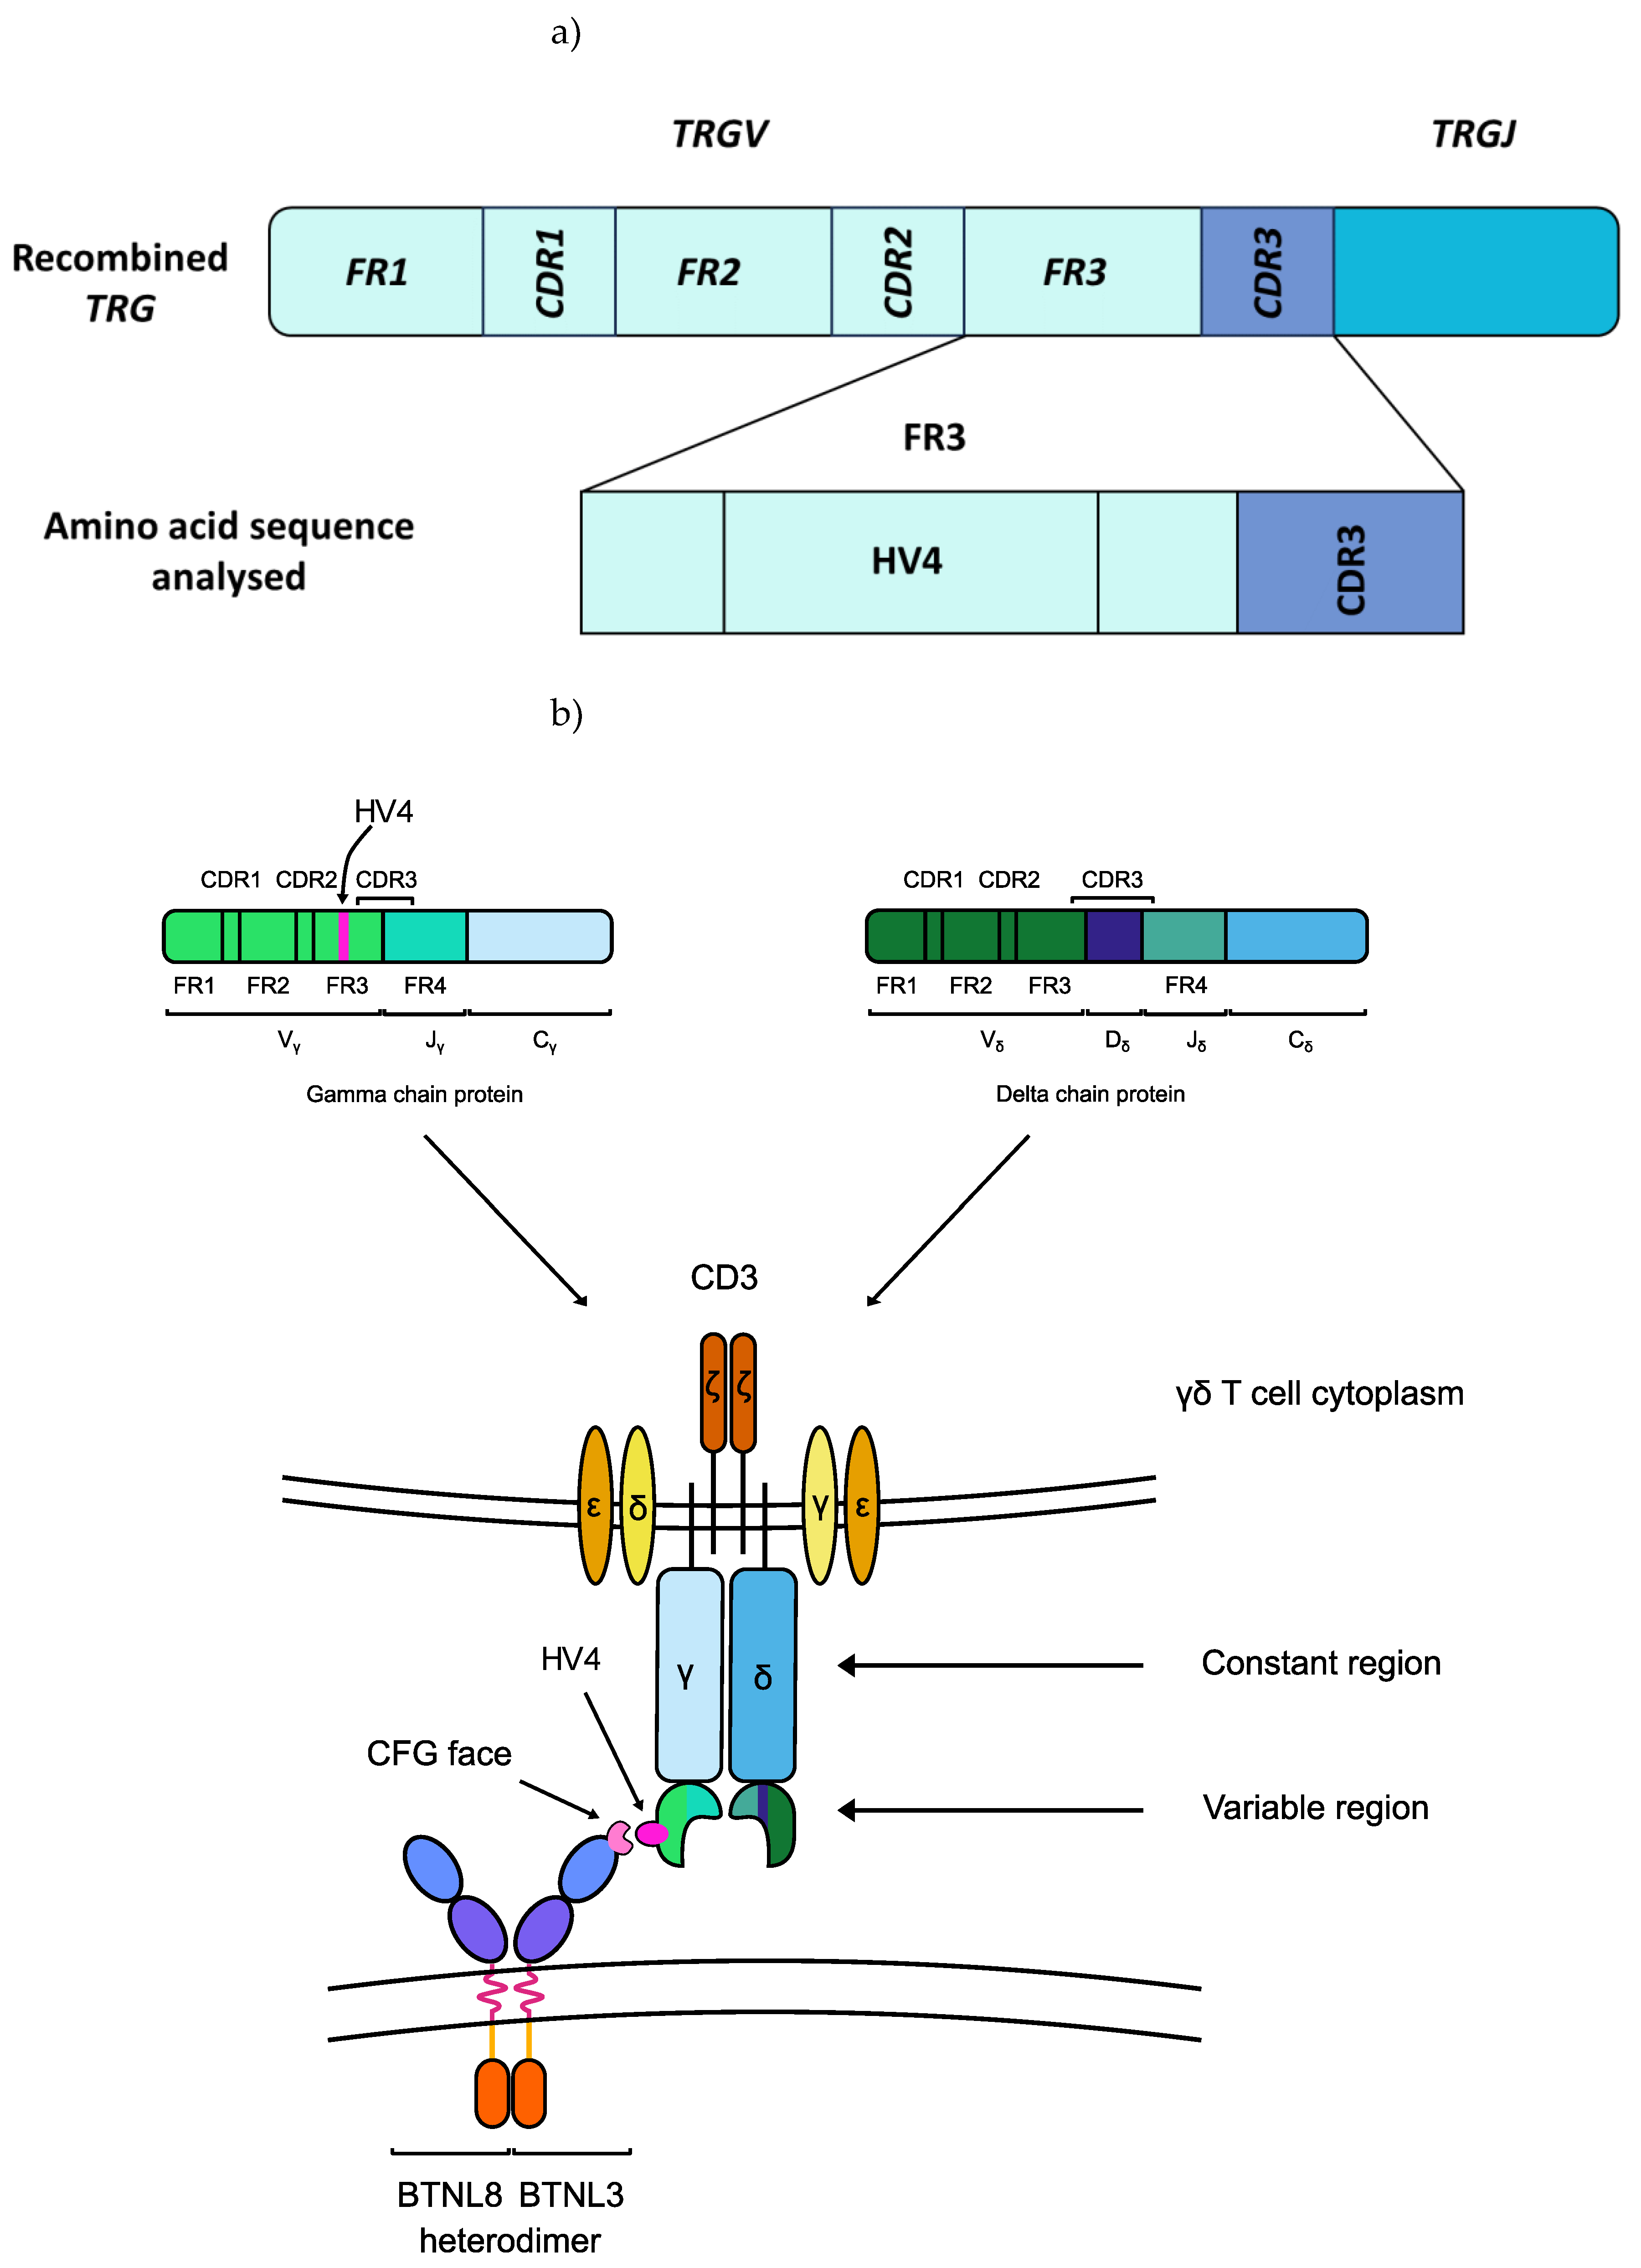
The butyrophilin proteins are a family of immunoglobulin-like cell surface receptors that have been shown to regulate both innate and adaptive immunity, including the activity of dendritic cells (DC), natural killer (NK) cells, αβ T cells, and γδ T cells [22,23,24,25,26]. Members of the butyrophilin family were found to maintain local γδ T-cell compartments in the blood and epithelia of both mice and humans (Table 1) [27,28,29,30,31,32,33]. Hayday and Vantourout [34] hypothesised that butyrophilin proteins serve as a steady state signal that maintains the local γδ T-cell population in a quiescent or inactive state. In the duodenum, the BTNL3/BTNL8 heterodimers act as the ligand for Vγ4+/Vδ1+ γδ intraepithelial lymphocytes (IELs) (Figure 1) [21,27,28]. Specifically, the BTNL3/BTNL8 heterodimer binds the germline-encoded hypervariable region 4 (HV4) of T cell receptor gamma (TCR-γ), when the variable (V) gene segment encoding that TCR-γ is the TRGV4 gene.

Table 1.
Butyrophilins maintain and activate the γδ T-cell compartments of mice and humans. Human butyrophilin family members are shortened with all letters capitalised, while only the first letter of mouse butyrophilins is capitalised [24].
Table 1.
Butyrophilins maintain and activate the γδ T-cell compartments of mice and humans. Human butyrophilin family members are shortened with all letters capitalised, while only the first letter of mouse butyrophilins is capitalised [24].
| Butyrophilins | γδT-cell subset | Role of butyrophilins | References | |
| Peripheral blood | Mouse unidentified | Unidentified | Unidentified | NA |
| Alpaca BTN3 | Vγ9Vδ2+ T cells | No interaction has been identified | [35,36] | |
| Human BTN3A homodimers/ heterodimers and BTN2A1 homodimer |
Vγ9Vδ2+ T cells | Phosphoantigen mediated, CDR3-independent γδ T-cell activation | [30,33,37,38] | |
| Skin | Mouse Skint1 and Skint2 | Vγ5Vδ1+ DETC | Thymic selection, tissue homing of dendritic epidermal T cells to the skin | [27,28,32] |
| Human ? | Vδ1+ T cells | Unidentified, unknown if there is butyrophilin involvement | [39] | |
| Intestinal epithelium | Mouse Btnl1 and Btnl6 | Vγ7+ IEL | Phenotypic maintenance of the intestinal IEL compartment | [27,28] |
| Human BTNL3 and BTNL8 | Vγ4Vδ1+ IEL | Phenotypic maintenance of the intestinal IEL compartment | [21,27,29] |
Figure 1.
The germline-encoded HV4 loop of the T cell receptor (TCR) of Vγ4+ γδ IELs directly binds to BTNL3. a) HV4 is located at amino acid positions 10-25 in the FR3 of the TRGV4 segment [31]. b) The HV4 of Vγ4+ γδ T cells binds to the C, C”, F, and G canonical immunoglobulin-fold β-strands (CFG face) of the BTNL3 protein [29]. Abbreviations: CDR: complementarity-determining region; FR: framework region; HV4: hypervariable region 4; TRGJ: T cell receptor γ joining region; TRGV: T cell receptor γ variable region.
During active CeD, these γδ T cells, alongside CD4+ and CD8+ αβ IELs are activated by dietary gluten [40]. Mayassi, et al. [21] showed the loss of interaction between BTNL3/BTNL8 heterodimers and the duodenal Vγ4+ γδ T cells as a characteristic of active CeD in a study of 62 active CeD, 57 gluten-free diet (GFD) treated CeD, and 99 control participants. During chronic inflammation induced by dietary gluten, the expression of the BTNL3/BTNL8 heterodimer was lost in the small intestine of patients having CeD predisposition. This was accompanied by the permanent loss of BTNL3/BTNL8-reactive Vγ4+/Vδ1+ γδ T cells. The chronic inflammation only subsided when patients followed a GFD. Although the BTNL3/BTNL8 expression recovered, the local γδ TCR repertoire was permanently reshaped: the innate-like Vγ4+/Vδ1+ γδ T cells and T cell receptor γ variable region 4 (TRGV4) gene transcripts were significantly decreased [21].
Recently, a common BTNL8*BTNL3 56-kb deletion copy number variant (CNV) was described by Aigner, et al. [41] in a cohort of more than 4000 samples. The BTNL3 and BTNL8 loci are segmental duplications and share a high sequence similarity. During meiosis, highly identical sequences are prone to recombination, which can give rise to CNVs. Aigner, et al. [41] reported 58.4% of their 346 samples of European ancestry had at least one BTNL8*BTNL3 deletion allele (Table 2). This CNV has been shown to encode a BTNL8*3 fusion protein, which consists of the transmembrane domain, the extracellular IgV and IgC domains of BTNL8, and the intracellular signalling domain of BTNL3. As the BTNL3-IgV domain is missing in the fusion protein, it is plausible that the BTNL8*3 fusion protein has an impaired ability to bind to the Vγ4Vδ1+ T cells in the small intestine [31]. As Mayassi, et al. [21] observed a permanent shift in the duodenal γδ TCR repertoire when the interaction between the T cells and the BTNL3/BTNL8 heterodimer was disrupted, this fusion protein could predispose carriers to CeD.
Table 2.
The BTNL8*BTNL3 copy number variation is present in 58.4% of individuals of European ancestry, as first described by Aigner, et al. [41]. Carriers are defined as individuals with at least one BTNL8*BTNL3 deletion allele. Abbreviations: CEU: Utah residents with Northern and Western European ancestry; HapMap: International HapMap Project; het.: heterozygous; HGDP: Human Genome Diversity Panel; hom.: homozygous; N: number.
| Population | Hom. for deletion | Het. for deletion | Hom. for full sequences | Deletion allele N | Deletion allele frequency | Group N | Carriers N |
Carriers % |
|
| HapMap | CEU | 17 | 56 | 68 | 90 | 0.319 | 141 | 73 | 51.8 |
| Toskani, Italia | 9 | 45 | 34 | 63 | 0.358 | 88 | 54 | 61.4 | |
| HGDP | France | 7 | 28 | 17 | 42 | 0.404 | 52 | 35 | 67.3 |
| Italy | 5 | 18 | 13 | 28 | 0.389 | 36 | 23 | 63.9 | |
| Italy (Bergamo) | 3 | 2 | 9 | 8 | 0.286 | 14 | 5 | 35.7 | |
| Orkney Islands | 1 | 11 | 3 | 13 | 0.433 | 15 | 12 | 80.0 | |
| Total | European ancestry | 42 | 160 | 144 | 244 | 0.353 | 346 | 202 | 58.4 |
Alongside BTNL3 and BTNL8, BTNL2 and BTN3A1 were also implicated in CeD risk. Goudey, et al. [19] have identified 14 SNPs associated with CeD, independent of the known CeD risk HLA loci in a study of 763 CeD and 1420 control samples. One of the SNPs was located in the proximity of BTNL2, a gene harbouring among the highest density of GWAS hits in autoimmune and inflammatory diseases from the butyrophilin family [42,43,44,45,46,47,48]. Goudey, et al. [19] showed that this SNP was marked as being an expression quantitative trait locus (eQTL) for the BTNL2 gene in RegulomeDB, a database annotating the function of non-coding SNPs [49,50]. Furthermore, RegulomeDB also reported high evidence for transcription factor binding for this eQTL [19].
In a separate a paediatric study of 26 active CeD, 5 treated CeD and 25 control subjects, BTN3A1 expression was associated with active CeD in children [20]. The study examined the differential expression of more than 25 defence-related genes in the three subject groups, demonstrating the upregulation of BTN3A1 mRNA and protein expression in the intestinal epithelial cells of children with active CeD. This is an intriguing finding, as BTN3A1 is required for the phosphoantigen (pAg)-induced activation of Vγ9Vδ2+ T cells in peripheral blood, a subset of γδ T cells not previously been implicated in CeD. These two studies indicate that the full functions and roles of the butyrophilin family of proteins in immunomodulation remain to be explored.
These findings raise a previously unexplored question about CeD risk. Do certain individuals co-inherit polymorphisms in their TRGV4 gene segments and their butyrophilin family genes that predispose them to CeD. In this study, using a 94 patient discovery cohort and the UK Biobank’s genome-wide genotyping dataset of 25 192 participants for validation, we show that 14 BTN2A1, 10 BTN3A1, and 13 BTN3A2 SNPs are significantly associated with CeD status.
2. Results
2.1. BTN2A1 SNPs Were Significantly Associated with CeD Risk in a Study of 94 Samples
To investigate the association between butyrophilin genes and CeD risk, a cohort of 48 CeD and 46 control patients was examined. The HLA loci and selected butyrophilin genes of interests were sequenced from patient samples. The following butyrophilin genes were selected as putative CeD risk loci based on their gene expression profile in the duodenum, small intestines and immune cells (Table E1-E2) and their role in immunomodulation: BTN2A1, BTN2A2, BTN3A1, BTN3A2, BTN3A3, BTNL2, BTNL3, BTNL8, ERMAP, and MOG.
2.1.1. Risk Associated HLA Genotypes Were Significantly More Frequent in CeD Patients
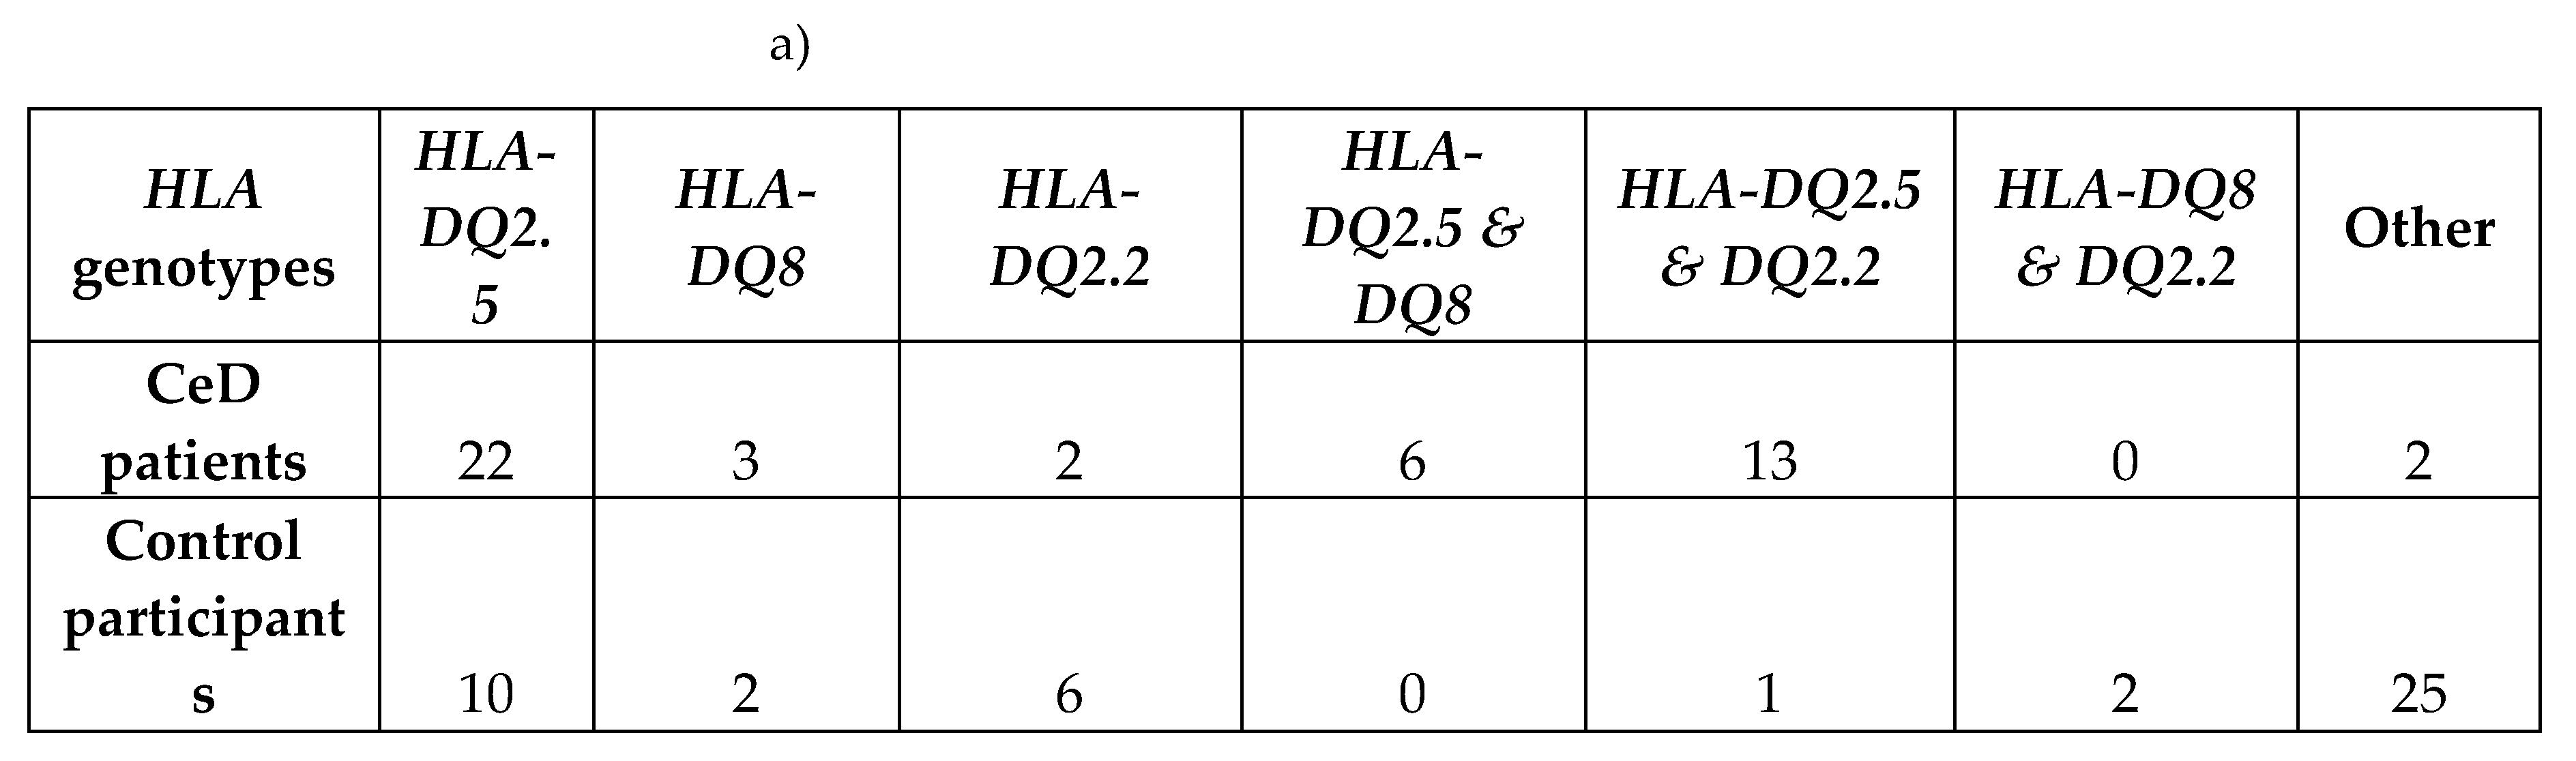
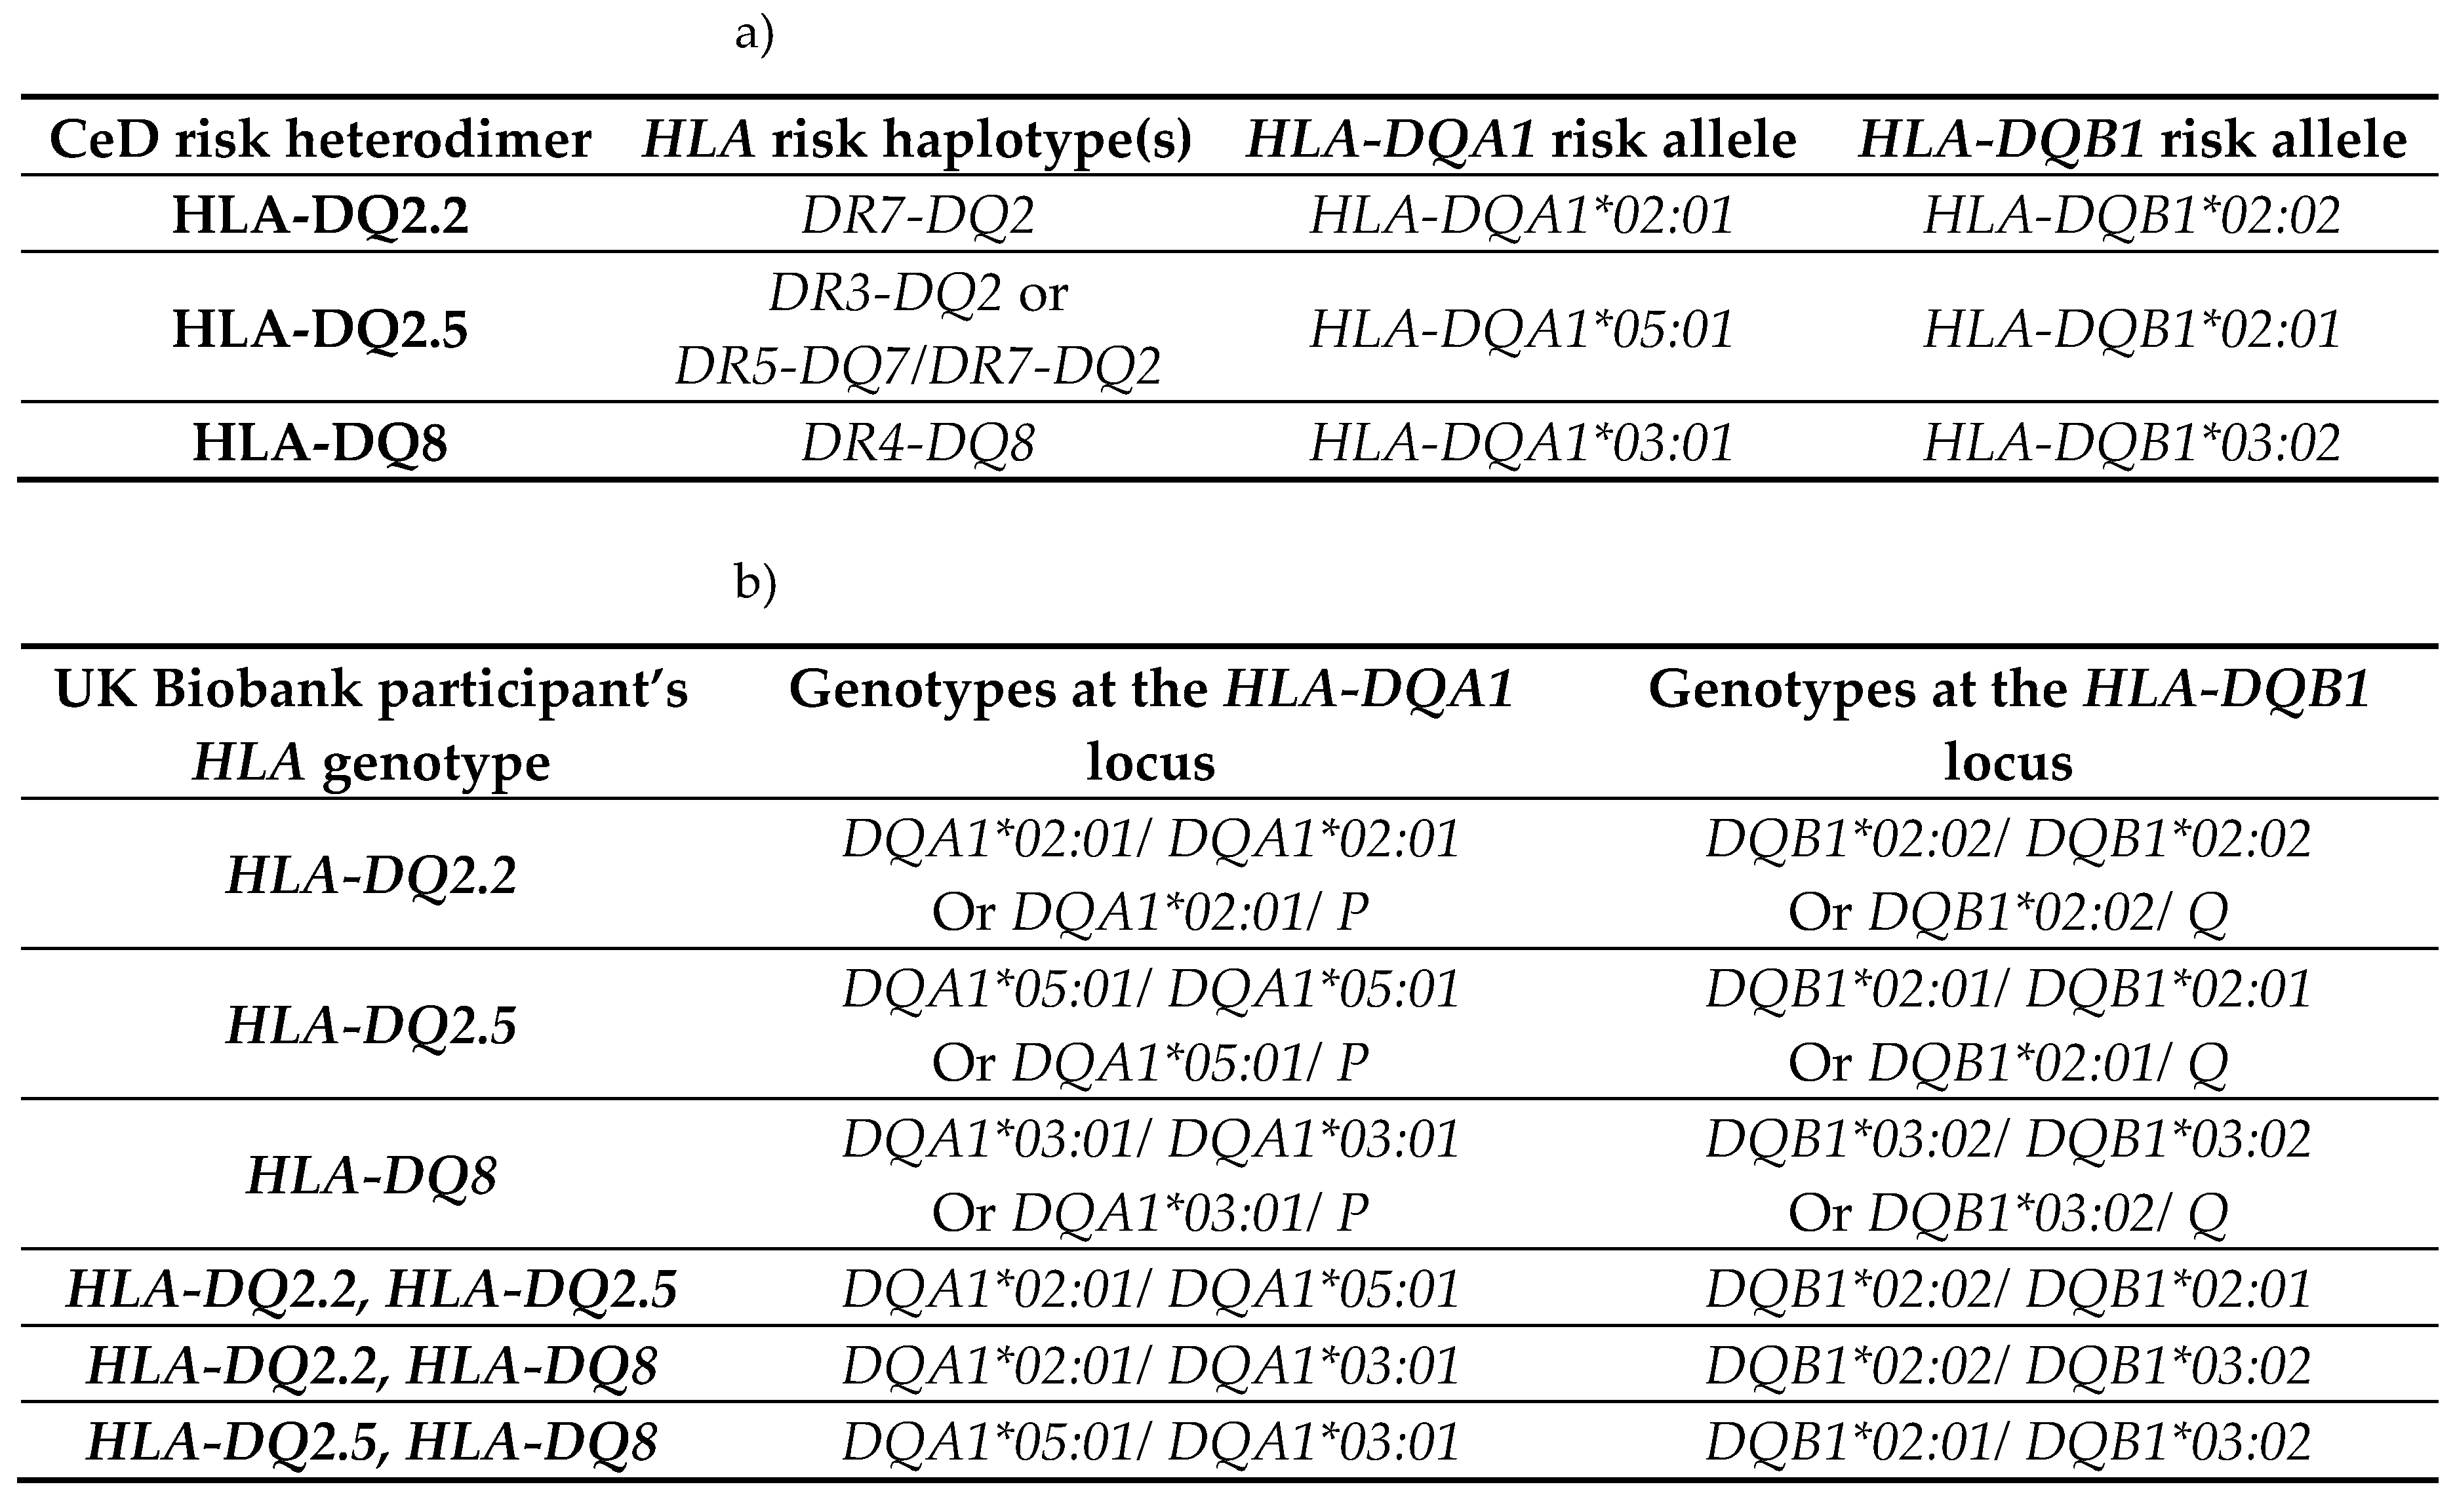
First, by way of data quality control, the HLA genotypes of the samples were examined. In accordance with previous literature, the majority of the CeD patients had CeD risk associated HLA genotypes (Table 3a) [11,13,51]. The percentage of individuals identified as having one or more HLA risk genotypes from the CeD group was 95.8% (46/48). Only two CeD patients had HLA genotypes other than the CeD risk associated ones (4.17%) (Table 3b). In contrast, non-risk HLA genotypes were the most frequent in the control group (54.3%, 25/46) (Figure A1, Fisher’s exact test, p = 5.5E-10). To summarise, CeD risk associated HLA genotypes were significantly more frequent in CeD patients than in the controls of this dataset.
Table 3.
CeD associated HLA genotypes were found in 95.8% of CeD patients (n = 48) and 45.7% of controls (n = 46). a) The CeD risk associated HLA genotypes were called using HLA-HD [52]. b) The HLA-DQA1 and HLA-DQB1 alleles of the two CeD patients, who did not have CeD risk associated HLA genotypes. The HLA-DQA1 allele of sample CD1 could not be typed by HLA-HD. CeD patients possessed a significantly higher proportion of risk HLA genotypes, when compared with controls in this dataset (Figure A1, Fisher’s exact test, p = 5.5e-10).
 |
 |
2.1.2. The BTNL8*BTNL3 Copy Number Variant Was not Associated with CeD
Next, the BTNL8-BTNL3 loci were examined for the presence of the deletion CNV. This CNV encodes a truncated fusion protein lacking the BTNL3-IgV extracellular domain required for maintaining the duodenal Vγ4+ γδ T cells, which we hypothesised could increase CeD risk [21,29,31,41].
The presence of the CNV was determined using a surrogate SNP. Dart, et al. [53] identified the rs72494581 minor allele to be associated with the presence of the deletion variant. Using this method, 58.3% (28/48) of the CeD patients and 47.8% (22/46) of the control participants were found to possess at least one deletion variant, which is in accordance with the findings of Aigner, et al. [41] (Table 4). Interestingly, 10.9% (5/46) of controls were homozygous for the BTNL8*BTNL3 deletion compared to only 4.2% (2/48) of CeD patients, but this did not reach statistical significance (Figure A2, Fisher’s exact test, p = 0.2144).
Table 4.
At least 47% of CeD patients (n = 48) and controls (n = 46) had the BTNL8*BTNL3 deletion variant using the rs72494581 surrogate SNP. The BTNL8*BTNL3 deletion variant encodes a truncated BTNL8-BTNL3 fusion protein [41]. Dart, et al. [53] identified rs72494581 in the intronic region of BTNL3, which serves as a surrogate SNP and the alleles are associated with the BTNL8*BTNL3 copy number variant. The major allele, the T allele, is associated with the full length BTNL3 and BTNL8 genes, while the minor allele, the C allele, is associated with the BTNL8*BTNL3 deletion. The differences between the frequencies in CeD and control individuals failed to reach statistical significance (Figure A2, Fisher’s exact test, p = 0.2144).
| rs72494581 genotype | TT | CT | CC |
| BTNL8-BTNL3genes | Homozygous for full length sequence | Heterozygous for BTNL8*BTNL3 deletion | Homozygous for BTNL8*BTNL3 deletion |
| Coeliac disease patients | 20 | 26 | 2 |
| Control participants | 24 | 17 | 5 |
2.1.3. BTN2A1 Gene Burden was Significantly Higher in CeD Patients
To determine whether any of the butyrophilin family variants were associated with CeD risk, gene-based burden testing, using the TRAPD program [54], was carried out on the non-synonymous coding variants identified in the CeD patients of the cohort. The variants identified in CeD samples were burden tested against variants present in the control samples.
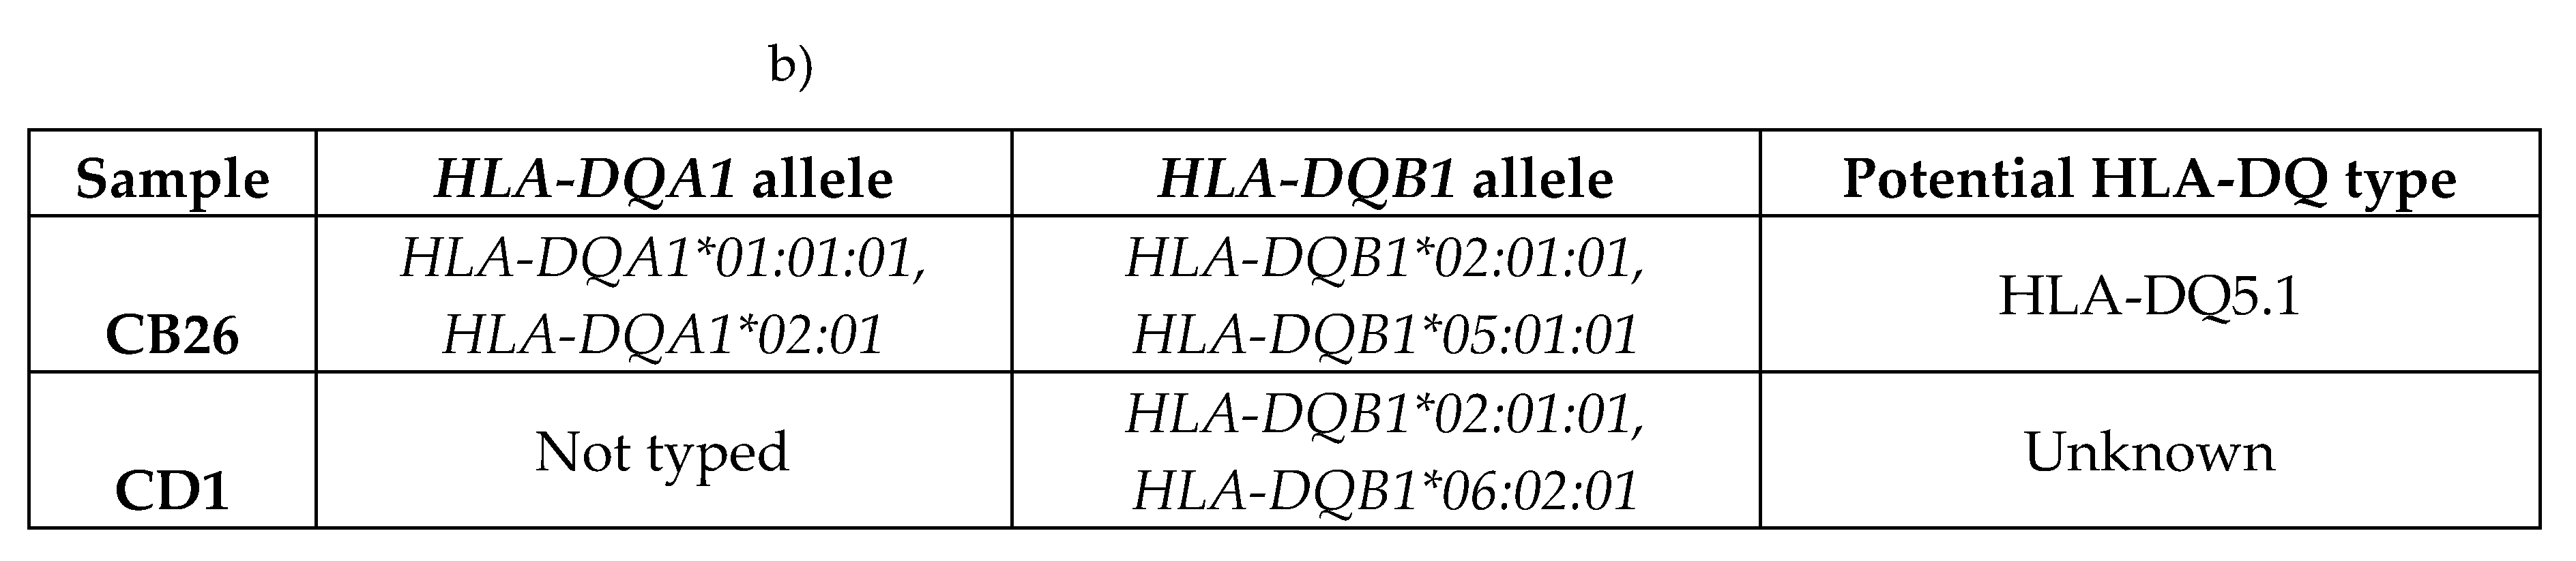
The analysis was carried out on the qualifying variants that passed read depth filtering. Of the 108 and 58 non-synonymous coding variants discovered in the CeD and control samples respectively, only 5 bi-allelic SNPs shared by both the CeD and control groups qualified for burden testing (Table 5, Table A1-A2). Only BTN2A1 variants were significantly associated with CeD risk gene burden in both the dominant (p = 1.46E-05) and the recessive (p = 3.70E-08) models, indicating that the presence of a single qualifying BTN2A1 SNP significantly increased CeD risk (Table 5b). BTN2A1 variants were more frequent in CeD patients, as 45.8% (22/48) of CeD participants had at least one qualifying BTN2A1 variant compared to 10.9% (5/46) of controls. To summarise, the gene burden analysis of butyrophilin genes in CeD patients compared with controls showed a significant association between BTN2A1 gene burden and CeD risk.
Table 5.
Gene-based burden testing of butyrophilin family non-synonymous coding variants in CeD patients (n = 48) against controls (n = 46) showed significant differences in the disease burden of BTN2A1 variants.
Table 5.
Gene-based burden testing of butyrophilin family non-synonymous coding variants in CeD patients (n = 48) against controls (n = 46) showed significant differences in the disease burden of BTN2A1 variants.
 |
Non-synonymous coding variants that were predicted to be pathogenic or had low minor allele frequencies were considered qualifying variants for burden testing. a) Burden tests were carried out using the TRAPD program [54] on butyrophilin family qualifying variants in CeD patients (n = 48) against controls (n = 46). Multiallelic sites were separated into bi-allelic SNPs, as required by the TRAPD documentation [55]. Only sites where more than 90% of samples had a read depth coverage of >10 were selected.
The dominant model defines carriers for gene burden as individuals with at least one qualifying variant within a gene, while the recessive model requires at least two or more qualifying variants. Significant results were highlighted in bold. A version of table a) with the percentage of individuals and alleles within the CeD and the control groups can be found in Table A2.
b) shows the BTN2A1 qualifying SNPs having significant burden in CeD samples. Count data of individuals and alleles are in parentheses after the percentage value in columns 6-9 and columns 10-11 respectively. The percentage and count data were calculated from the per sample genotypes found in Table A3.
Abbreviations: Alt allele: alternative or minor allele; CeD: coeliac disease; GRCh38: Genome Reference Consortium Human Build 38; HET: heterozygous, HOM ALT: homozygous for alternative allele; N(≥1 HET): number of individuals carrying at least one heterozygous qualifying variant within the gene; N(≥2 HET): number of individuals carrying at least two heterozygous qualifying variant within the gene; N(HOM ALT): number of individuals carrying at least one homozygous qualifying variant within the gene; qual: qualifying; SNP: single nucleotide polymorphism
Although these results were promising, due to the BTN2A1 gene being part of the extended MHC region and its close proximity (~4Mb) to the classical MHC region (6p21.3), we could not exclude the possibility that this significant association could be secondary to the risk associated HLA genotypes of the CeD patients [56,57]. Therefore, these results were validated in a larger cohort using the UK Biobank dataset, by single variant testing BTN3A1, BTN3A2, BTN2A1, BTNL3, and BTNL8 SNPs present in the 500,000 genome-wide genotyping dataset.
2.2. BTN3A1, BTN3A2, and BTN2A1 Genes Were significantly Associated with CeD in HLA-DQ2.5-Matched Participants of the UK Biobank Database
The UK Biobank dataset was used to validate the association between BTN2A1 and CeD risk, and to investigate the association between CeD and butyrophilin SNPs in potentially CeD-relevant genes. After removing participants with missing HLA imputation or genotype data, the final cohort consisted of 3094 CeD patients and 29 762 control participants (Appendix B).
2.2.1. Risk Associated HLA Genotypes Were Significantly More frequent In CeD Patients of the UK Biobank
First, as a means of quality control for CeD diagnosis, the HLA genotypes of the CeD and control participants of the UK Biobank were examined. The majority of participants selected from the 500,000 genome-wide genotyping dataset had CeD risk HLA genotypes regardless of their CeD status (Table 6, Figure C1). Risk HLA genotypes were found in 92.4% (2860/3094) of CeD patients and 57.6% (17 144/29 762) of controls. In both control and CeD participants, HLA-DQ2.5 was the most frequent HLA genotype at 21.6% (6416/29 762) and 53.4% (1652/3094) respectively. Interestingly, HLA-DQ8 was the second most frequent risk genotype in controls at 14.1% (4203/29 762). Meanwhile individuals heterozygous for HLA-DQ2.5/HLA-DQ8 were the second most frequent in the CeD group, with 19.6% (606/3094) of participants possessing that risk HLA genotype.
Table 6.
CeD associated HLA genotypes were found in 92.4% of CeD (n = 3094) and 57.6% of control (n = 29 762) participants from the UK Biobank’s 500,000 genome-wide genotyping dataset. The HLA genotype of selected participants from the 500,000 genome-wide genotyping dataset were called using the HLA imputation values provided by the UK Biobank. CeD risk HLA genotypes were significantly more frequent in CeD patients compared to control participants (X-squared = 4062.5, df = 6, p < 2.2E-16).
| HLA genotypes | HLA-DQ2.5 | HLA-DQ8 | HLA-DQ2.2 | HLA-DQ2.5 & DQ8 | HLA-DQ2.5 & DQ2.2 | HLA-DQ8 & DQ2.2 | Other |
| CeD participants | 1652 | 171 | 199 | 606 | 182 | 50 | 234 |
| Control participants | 6416 | 4203 | 4154 | 895 | 886 | 590 | 12618 |
To compare the proportion of CeD risk associated HLA genotypes in CeD and control participants in the 500,000 genome-wide genotyping dataset, a chi-square test of independence was used. Similar to the results from the targeted butyrophilin and HLA sequencing dataset, the CeD participants had significantly higher proportions of CeD risk HLA genotypes compared with controls (X-squared = 4062.5, df = 6, p < 2.2E-16).
Indeed, when the association between the CeD risk HLA genotypes and CeD status was investigated using a binomial regression model in the UK Biobank dataset, the association between the risk HLA genotypes and CeD status was confirmed. Interestingly in the regression analysis, all risk HLA genotypes were significantly associated with CeD (p ≤ 5.13E-04, Table C1) except the HLA-DQ8 genotype (p = 0.125).
2.2.2. BTN2A1, BTN3A1, and BTN3A2 SNPs Were Significantly Associated with CeD Status in the UK Biobank
Single variant analyses were carried out to test the association between CeD status and SNPs from the BTN3A1, BTN3A2, BTNL3, and BTNL8 genes in the UK Biobank [58]. Due to the genotyping array used by the UK Biobank, the genetic information of only a limited number of SNPs from each gene was available. A total of 101 butyrophilin SNPs were selected for analysis (Table 7). As the HLA loci were significantly associated with CeD risk [1], and the BTN3A1 and BTN3A2 loci are in close proximity [22,24], the CeD risk HLA genotypes were also taken into account for the single variant analyses by including the risk HLA genotypes in the binomial models, and analysing the association between butyrophilin SNPs and CeD status in HLA-matched case-control groups as well. The genetic associations were tested by building binomial regression models, where the association between each variable and CeD status was examined.
Table 7.
SNPs of selected butyrophilin genes present in the UK Biobank.
| Gene | SNPs in NCBI | Unique SNPs in NCBI | SNPs in UK Biobank |
| BTN2A1 | 7912 | 7605 | 30 |
| BTN3A1 | 5348 | 5164 | 27 |
| BTN3A2 | 5905 | 5611 | 21 |
| BTNL3 | 6164 | 5929 | 10 |
| BTNL8 | 18 889 | 18 197 | 13 |
Each of the 101 selected SNPs were individually tested for association with CeD status in the UK Biobank. Thirty-seven SNPs were significantly associated with CeD status in the UK Biobank: 14 BTN2A1, 10 BTN3A1, and 13 BTN3A2 SNPs (adjusted p-value ≤ 0.05, Table 8, Table C2-C3). Most of the significant SNPs were non-coding, with 25 of the 37 SNPs being located in intronic regions. Only one BTN3A1 (rs41266839), and 3 BTN2A1 (rs13195509, rs3734542, rs3734543) SNPs were missense variants and one BTN2A1 (rs13195402) SNP encoded a STOP codon. Of the 37 SNPs, the reference alleles of 30 SNPs were associated with a decreased CeD risk. No BTNL3 nor BTNL8 SNPs were significant in predicting CeD status in the UK Biobank dataset, after Bonferroni correction.
Table 8.
SNPs from BTN2A1, BTN3A1, and BTN3A2 genes were significantly associated with CeD status in the UK Biobank. The name of the SNPs in the UK Biobank database is a combination of the reference SNP ID (rsID) from the SNP database (dbSNP) and the reference allele. All BTN2A1, BTN3A1, BTN3A2, BTNL3, and BTNL8 SNPs in the UK Biobank were subjected to single variant testing to examine their association with CeD. Due to multiple testing, Bonferroni correction was applied. SNPs with a negative ln(OR) are associated with lower CeD risk in this binomial model, meaning that the reference allele is less frequent in CeD patients. SNPs in bold remained significantly associated with CeD in the binomial regression models that also took the HLA genotype into account. SNP count and allele count data for the significant SNPs is found in Table C3.
| Position (GRCh38) | SNP, reference allele | Gene | SNP consequence | CeD allele freq | Control allele freq | Total allele freq | ln(OR) | CeD risk | adjusted p-value |
| 6:26463347 | rs13195402 | BTN2A1 | STOP gained | 0.768 | 0.892 | 0.880 | -0.924 | decrease | 4.67E-158 |
| 6:26463432 | rs13195509 | BTN2A1 | missense | 0.754 | 0.879 | 0.867 | -0.857 | decrease | 1.61E-151 |
| 6:26475927 | rs1407045 | BTN2A1 | intronic | 0.584 | 0.516 | 0.522 | 0.273 | increase | 6.07E-22 |
| 6:26465807 | rs2273558 | BTN2A1 | intronic | 0.583 | 0.677 | 0.667 | -0.396 | decrease | 1.69E-41 |
| 6:26460493 | rs2893856 | BTN2A1 | intronic | 0.113 | 0.131 | 0.130 | -0.175 | decrease | 3.23E-03 |
| 6:26468098 | rs3734542 | BTN2A1 | missense | 0.753 | 0.878 | 0.867 | -0.855 | decrease | 8.59E-151 |
| 6:26468317 | rs3734543 | BTN2A1 | missense | 0.760 | 0.879 | 0.868 | -0.844 | decrease | 1.59E-140 |
| 6:26466954 | rs3799380 | BTN2A1 | intronic | 0.683 | 0.790 | 0.780 | -0.549 | decrease | 8.59E-77 |
| 6:26474343 | rs56296968 | BTN2A1 | intronic | 0.696 | 0.807 | 0.796 | -0.604 | decrease | 9.70E-89 |
| 6:26456215 | rs6456724 | BTN2A1 | 2kb upstream | 0.113 | 0.131 | 0.130 | -0.176 | decrease | 2.87E-03 |
| 6:26458037 | rs6929846 | BTN2A1 | 5’ UTR | 0.146 | 0.174 | 0.172 | -0.206 | decrease | 3.60E-06 |
| 6:26473816 | rs7773938 | BTN2A1 | intronic | 0.696 | 0.806 | 0.796 | -0.600 | decrease | 1.15E-87 |
| 6:26469647 | rs9358944 | BTN2A1 | intronic | 0.695 | 0.806 | 0.796 | -0.604 | decrease | 1.55E-89 |
| 6:26471886 | rs9358945 | BTN2A1 | intronic | 0.694 | 0.806 | 0.796 | -0.606 | decrease | 4.37E-90 |
| 6:26404730 | rs10456045 | BTN3A1 | intronic | 0.596 | 0.698 | 0.688 | -0.448 | decrease | 2.97E-57 |
| 6:26410572 | rs1796520 | BTN3A1 | intronic | 0.405 | 0.474 | 0.467 | -0.276 | decrease | 2.40E-22 |
| 6:26404146 | rs3799378 | BTN3A1 | intronic | 0.653 | 0.762 | 0.752 | -0.535 | decrease | 2.92E-75 |
| 6:26405825 | rs3857549 | BTN3A1 | intronic | 0.948 | 0.935 | 0.936 | 0.221 | increase | 1.53E-02 |
| 6:26409662 | rs41266839 | BTN3A1 | missense | 0.764 | 0.892 | 0.880 | -0.924 | decrease | 2.12E-168 |
| 6:26407180 | rs4609015 | BTN3A1 | intronic | 0.871 | 0.854 | 0.855 | 0.141 | increase | 3.82E-02 |
| 6:26412860 | rs6900725 | BTN3A1 | intronic | 0.870 | 0.853 | 0.855 | 0.139 | increase | 4.33E-02 |
| 6:26401210 | rs6912853 | BTN3A1 | 2kb upstream | 0.863 | 0.844 | 0.846 | 0.153 | increase | 7.85E-03 |
| 6:26413007 | rs6920986 | BTN3A1 | intronic | 0.870 | 0.854 | 0.856 | 0.138 | increase | 4.99E-02 |
| 6:26415409 | rs742090 | BTN3A1 | 500b downstream | 0.406 | 0.474 | 0.468 | -0.276 | decrease | 3.58E-22 |
| 6:26374321 | rs11758089 | BTN3A2 | intronic | 0.866 | 0.844 | 0.846 | 0.176 | increase | 6.30E-04 |
| 6:26372558 | rs12176317 | BTN3A2 | intronic | 0.744 | 0.867 | 0.856 | -0.809 | decrease | 6.72E-140 |
| 6:26366990 | rs12199613 | BTN3A2 | intronic | 0.514 | 0.612 | 0.602 | -0.400 | decrease | 1.76E-47 |
| 6:26377318 | rs1977 | BTN3A2 | 3’ UTR | 0.740 | 0.864 | 0.853 | -0.808 | decrease | 1.17E-136 |
| 6:26377363 | rs1979 | BTN3A2 | 3’ UTR | 0.743 | 0.867 | 0.855 | -0.809 | decrease | 8.23E-140 |
| 6:26375933 | rs1985732 | BTN3A2 | intronic | 0.595 | 0.698 | 0.688 | -0.457 | decrease | 2.87E-59 |
| 6:26374430 | rs2073526 | BTN3A2 | intronic | 0.370 | 0.442 | 0.435 | -0.295 | decrease | 9.15E-25 |
| 6:26363527 | rs9358934 | BTN3A2 | 2kb upstream | 0.744 | 0.866 | 0.855 | -0.803 | decrease | 2.34E-137 |
| 6:26364702 | rs9379855 | BTN3A2 | 2kb upstream | 0.743 | 0.866 | 0.855 | -0.804 | decrease | 8.85E-138 |
| 6:26367461 | rs9379858 | BTN3A2 | intronic | 0.743 | 0.866 | 0.855 | -0.802 | decrease | 3.19E-137 |
| 6:26369321 | rs9379859 | BTN3A2 | intronic | 0.744 | 0.867 | 0.855 | -0.803 | decrease | 5.37E-137 |
| 6:26373450 | rs9393713 | BTN3A2 | intronic | 0.743 | 0.868 | 0.856 | -0.814 | decrease | 1.07E-141 |
| 6:26373512 | rs9393714 | BTN3A2 | intronic | 0.743 | 0.868 | 0.856 | -0.813 | decrease | 6.99E-141 |
Abbreviations: CeD: coeliac disease; freq: frequency; GRCh38 Genome Reference Consortium Human Build 38; kb: kilobase, ln(OR): natural logarithm of the odds ratio; SNP: single nucleotide polymorphism; UTR: untranslated region.
2.2.3. Twenty Butyrophilin SNPs from the UK Biobank Remained Significantly Associated with CeD Status When the Participants’ risk HLA Genotypes Were Taken into Account
To investigate whether the butyrophilin SNPs in the UK Biobank remained significantly associated with CeD status when taking the HLA loci into account, a second set of binomial regression models was produced. Single variant models were built for each of the 101 SNPs of interest, that included the risk HLA genotypes of the UK Biobank participants as an additional predictor variable (Table C4). Only 7 BTN2A1, 2 BTN3A1, and 11 BTN3A2 SNPs remained significantly associated with CeD status after applying Bonferroni correction (adjusted p ≤ 0.05, Table 9). Similarly to the previous model, the majority of the significant SNPs were non-coding with the exception of a STOP gained SNP (rs13195402) and 3 missense SNPs (rs13195509, rs3734542, rs3734543) in the BTN2A1 gene. Out of the 17 non-coding SNPs, 11 SNPs were located in intronic regions. The reference alleles for all 20 SNPs were associated with a decreased CeD risk, meaning that the alternate alleles were more frequent in CeD patients. As the HLA loci were taken into account, these SNPs are likely to be real associations with CeD status, instead of being caused by linkage disequilibrium (LD) due to the proximity of the BTN and HLA loci on chromosome 6.
Table 9.
Twenty SNPs from BTN2A1, BTN3A1, and BTN3A2 genes were significantly associated with CeD status in the UK Biobank when HLA genotypes were included in the single variant testing models. BTN2A1, BTN3A2, BTNL3, and BTNL8 SNPs in the UK Biobank were subjected to single variant testing to examine their association with CeD. Due to multiple testing, Bonferroni correction was applied. SNPs with a negative ln(OR) are associated with lower CeD risk in this binomial model.
| SNP, reference allele | Gene | SNP consequence | ln(OR) | CeD risk | adjusted p-value |
| rs13195402 | BTN2A1 | STOP gained | -0.20727 | decrease | 8.15E-06 |
| rs13195509 | BTN2A1 | missense | -0.19239 | decrease | 1.62E-05 |
| rs3734542 | BTN2A1 | missense | -0.18831 | decrease | 2.94E-05 |
| rs3734543 | BTN2A1 | missense | -0.16744 | decrease | 8.23E-04 |
| rs56296968 | BTN2A1 | intronic | -0.11753 | decrease | 4.20E-02 |
| rs9358944 | BTN2A1 | intronic | -0.11786 | decrease | 3.83E-02 |
| rs9358945 | BTN2A1 | intronic | -0.12018 | decrease | 2.91E-02 |
| rs3799378 | BTN3A1 | intronic | -0.14327 | decrease | 7.04E-04 |
| rs41266839 | BTN3A1 | missense | -0.21469 | decrease | 1.06E-06 |
| rs12176317 | BTN3A2 | intronic | -0.1974 | decrease | 3.50E-06 |
| rs12199613 | BTN3A2 | intronic | -0.12296 | decrease | 3.31E-03 |
| rs1977 | BTN3A2 | 3’ UTR | -0.20238 | decrease | 2.06E-06 |
| rs1979 | BTN3A2 | 3’ UTR | -0.19756 | decrease | 3.40E-06 |
| rs1985732 | BTN3A2 | intronic | -0.10975 | decrease | 3.35E-02 |
| rs9358934 | BTN3A2 | 2kb upstream | -0.19286 | decrease | 7.53E-06 |
| rs9379855 | BTN3A2 | 2kb upstream | -0.19406 | decrease | 6.04E-06 |
| rs9379858 | BTN3A2 | intronic | -0.19156 | decrease | 8.99E-06 |
| rs9379859 | BTN3A2 | intronic | -0.19261 | decrease | 8.10E-06 |
| rs9393713 | BTN3A2 | intronic | -0.2056 | decrease | 9.27E-07 |
| rs9393714 | BTN3A2 | intronic | -0.20087 | decrease | 2.08E-06 |
Abbreviations: CeD: coeliac disease; ln(OR): natural logarithm of the odds ratio; SNP: single nucleotide polymorphism.
2.2.4. Twenty-One Butyrophilin SNPs Were Significantly Associated with CeD Status in HLA-DQ2.5-Matched Case-Control Groups of UK Biobank Participants
The final set of analyses were carried out to investigate whether the butyrophilin SNPs were significantly associated with CeD status in all of the CeD risk HLA genotype patients. Therefore, the UK Biobank participants were separated into risk HLA-matched CeD and control groups (Table 10). All 101 butyrophilin SNPs were single variant tested for their association to CeD status in the HLA-matched groups.
Table 10.
Single variant testing in HLA-matched groups from the UK Biobank dataset only identified significant SNPs associated with CeD status in individuals with HLA-DQ2.5 genotypes. The CeD and control participants of the UK Biobank dataset were divided into HLA-matched case-control groups for single variant testing. The association between BTN2A1, BTN3A1, BTN3A2, BTNL3, and BTNL8 SNPs and CeD status was investigated. Significant association between the SNPs and CeD status was only present in HLA-DQ2.5-matched individuals (in bold).
| HLA genotype of individuals in model | Number of CeD participants | Number of controls | Number of significant SNPs |
| HLA-DQ2.2 | 199 | 4154 | 0 |
| HLA-DQ2.5 | 1652 | 6416 | 21 |
| HLA-DQ8 | 171 | 4203 | 0 |
| HLA-DQ2.2, HLA-DQ2.5 | 606 | 895 | 0 |
| HLA-DQ2.2, HLA-DQ8 | 50 | 590 | 0 |
| HLA-DQ2.5, HLA-DQ8 | 182 | 886 | 0 |
| Other | 234 | 12618 | 0 |
HLA-DQ2.5 was the most common risk HLA genotype in CeD patients both in the UK Biobank, as well as in previous studies [11,12]. Interestingly, significant association between butyrophilin SNPs and CeD status was only present in the HLA-DQ2.5-matched UK Biobank participants. The BTN2A1, BTN3A1, and BTN3A2 SNPs significantly associated with CeD status in the HLA single variant testing models remained significant in the HLA-DQ2.5-matched tests as well (Table 11, Table C5). Interestingly, rs7773938, an intronic BTN2A1 SNP, is a novel SNP that was only significantly associated with CeD status in UK Biobank participants with the HLA-DQ2.5 genotype. The reference alleles of all 21 significant SNPs were more frequent in controls compared to CeD individuals, meaning that having the alternate allele at these loci significantly increases an individual’s CeD risk. These results imply that butyrophilin SNPs could only explain additional CeD risk in HLA-DQ2.5-matched individuals of the UK Biobank. As the presence of these reference alleles remained significantly associated with decreased CeD risk even after HLA-matching, the association with these SNPs was not likely to be caused by LD to the HLA loci. Therefore, the 21 butyrophilin SNPs identified were significantly associated with CeD status and contributed to further CeD risk in UK Biobank participants possessing the HLA-DQ2.5 genotype.
Table 11.
Butyrophilin SNPs only remained significantly associated with CeD status in the HLA-DQ2.5 restricted UK Biobank analysis. The name of the SNPs in the UK Biobank database are a combination of the SNP name and the reference allele. All BTN2A1, BTN3A1, BTN3A2, BTNL3, and BTNL8 SNPs in the UK Biobank were subjected to single variant testing to examine their association with CeD. Due to multiple testing, Bonferroni correction was applied. SNPs with a negative ln(OR) are associated with lower CeD risk in this binomial model. The SNP in bold was a novel SNP significantly associated with CeD unique to the HLA-DQ2.5 model, while the other SNPs were also significant in the non-HLA and the HLA models.
| SNP, reference allele | Gene | SNP consequence | CeD allele freq | Control allele freq | Total allele freq | ln(OR) | CeD risk | adjusted p-value |
| rs13195402 | BTN2A1 | STOP gained | 0.704 | 0.751 | 0.741 | -0.27812 | decrease | 5.10E-07 |
| rs13195509 | BTN2A1 | missense | 0.687 | 0.734 | 0.724 | -0.25542 | decrease | 1.75E-06 |
| rs3734542 | BTN2A1 | missense | 0.687 | 0.733 | 0.723 | -0.25235 | decrease | 2.52E-06 |
| rs3734543 | BTN2A1 | missense | 0.695 | 0.736 | 0.728 | -0.23279 | decrease | 5.43E-05 |
| rs56296968 | BTN2A1 | intronic | 0.640 | 0.673 | 0.666 | -0.15928 | decrease | 2.33E-02 |
| rs7773938 | BTN2A1 | intronic | 0.640 | 0.672 | 0.666 | -0.15755 | decrease | 2.66E-02 |
| rs9358944 | BTN2A1 | intronic | 0.638 | 0.671 | 0.664 | -0.16238 | decrease | 1.61E-02 |
| rs9358945 | BTN2A1 | intronic | 0.638 | 0.671 | 0.665 | -0.16499 | decrease | 1.26E-02 |
| rs3799378 | BTN3A1 | intronic | 0.596 | 0.637 | 0.628 | -0.18712 | decrease | 8.10E-04 |
| rs41266839 | BTN3A1 | missense | 0.697 | 0.747 | 0.737 | -0.28267 | decrease | 7.25E-08 |
| rs12176317 | BTN3A2 | intronic | 0.679 | 0.729 | 0.719 | -0.26575 | decrease | 2.82E-07 |
| rs12199613 | BTN3A2 | intronic | 0.459 | 0.500 | 0.491 | -0.1717 | decrease | 2.06E-03 |
| rs1977 | BTN3A2 | 3’ UTR | 0.676 | 0.726 | 0.716 | -0.268 | decrease | 2.99E-07 |
| rs1979 | BTN3A2 | 3’ UTR | 0.679 | 0.728 | 0.718 | -0.26376 | decrease | 3.63E-07 |
| rs1985732 | BTN3A2 | intronic | 0.539 | 0.574 | 0.567 | -0.15063 | decrease | 2.35E-02 |
| rs9358934 | BTN3A2 | 2kb upstream | 0.680 | 0.729 | 0.719 | -0.25825 | decrease | 8.85E-07 |
| rs9379855 | BTN3A2 | 2kb upstream | 0.680 | 0.728 | 0.718 | -0.25967 | decrease | 6.76E-07 |
| rs9379858 | BTN3A2 | intronic | 0.680 | 0.728 | 0.718 | -0.25566 | decrease | 1.18E-06 |
| rs9379859 | BTN3A2 | intronic | 0.681 | 0.729 | 0.719 | -0.26105 | decrease | 6.31E-07 |
| rs9393713 | BTN3A2 | intronic | 0.678 | 0.729 | 0.719 | -0.27313 | decrease | 1.06E-07 |
| rs9393714 | BTN3A2 | intronic | 0.679 | 0.729 | 0.719 | -0.26778 | decrease | 2.25E-07 |
Abbreviations: CeD: coeliac disease; freq: frequency; ln(OR): natural logarithm of the odds ratio; SNP: single nucleotide polymorphism.
2.3. HV4 Variation was Not Significantly Associated with CeD Risk in a Study of 379 Samples
2.3.1. TRGV Usage Was not Significantly Different Between CeD and Control Samples
Previous evidence by our group showed that the γδ T-cell repertoire is permanently altered in the duodenum of CeD patients [59]. Mayassi, et al. [21] also showed that the TRGV4 transcripts are lost and the γδ TCR repertoire is permanently reconfigured in the duodenum after active CeD.
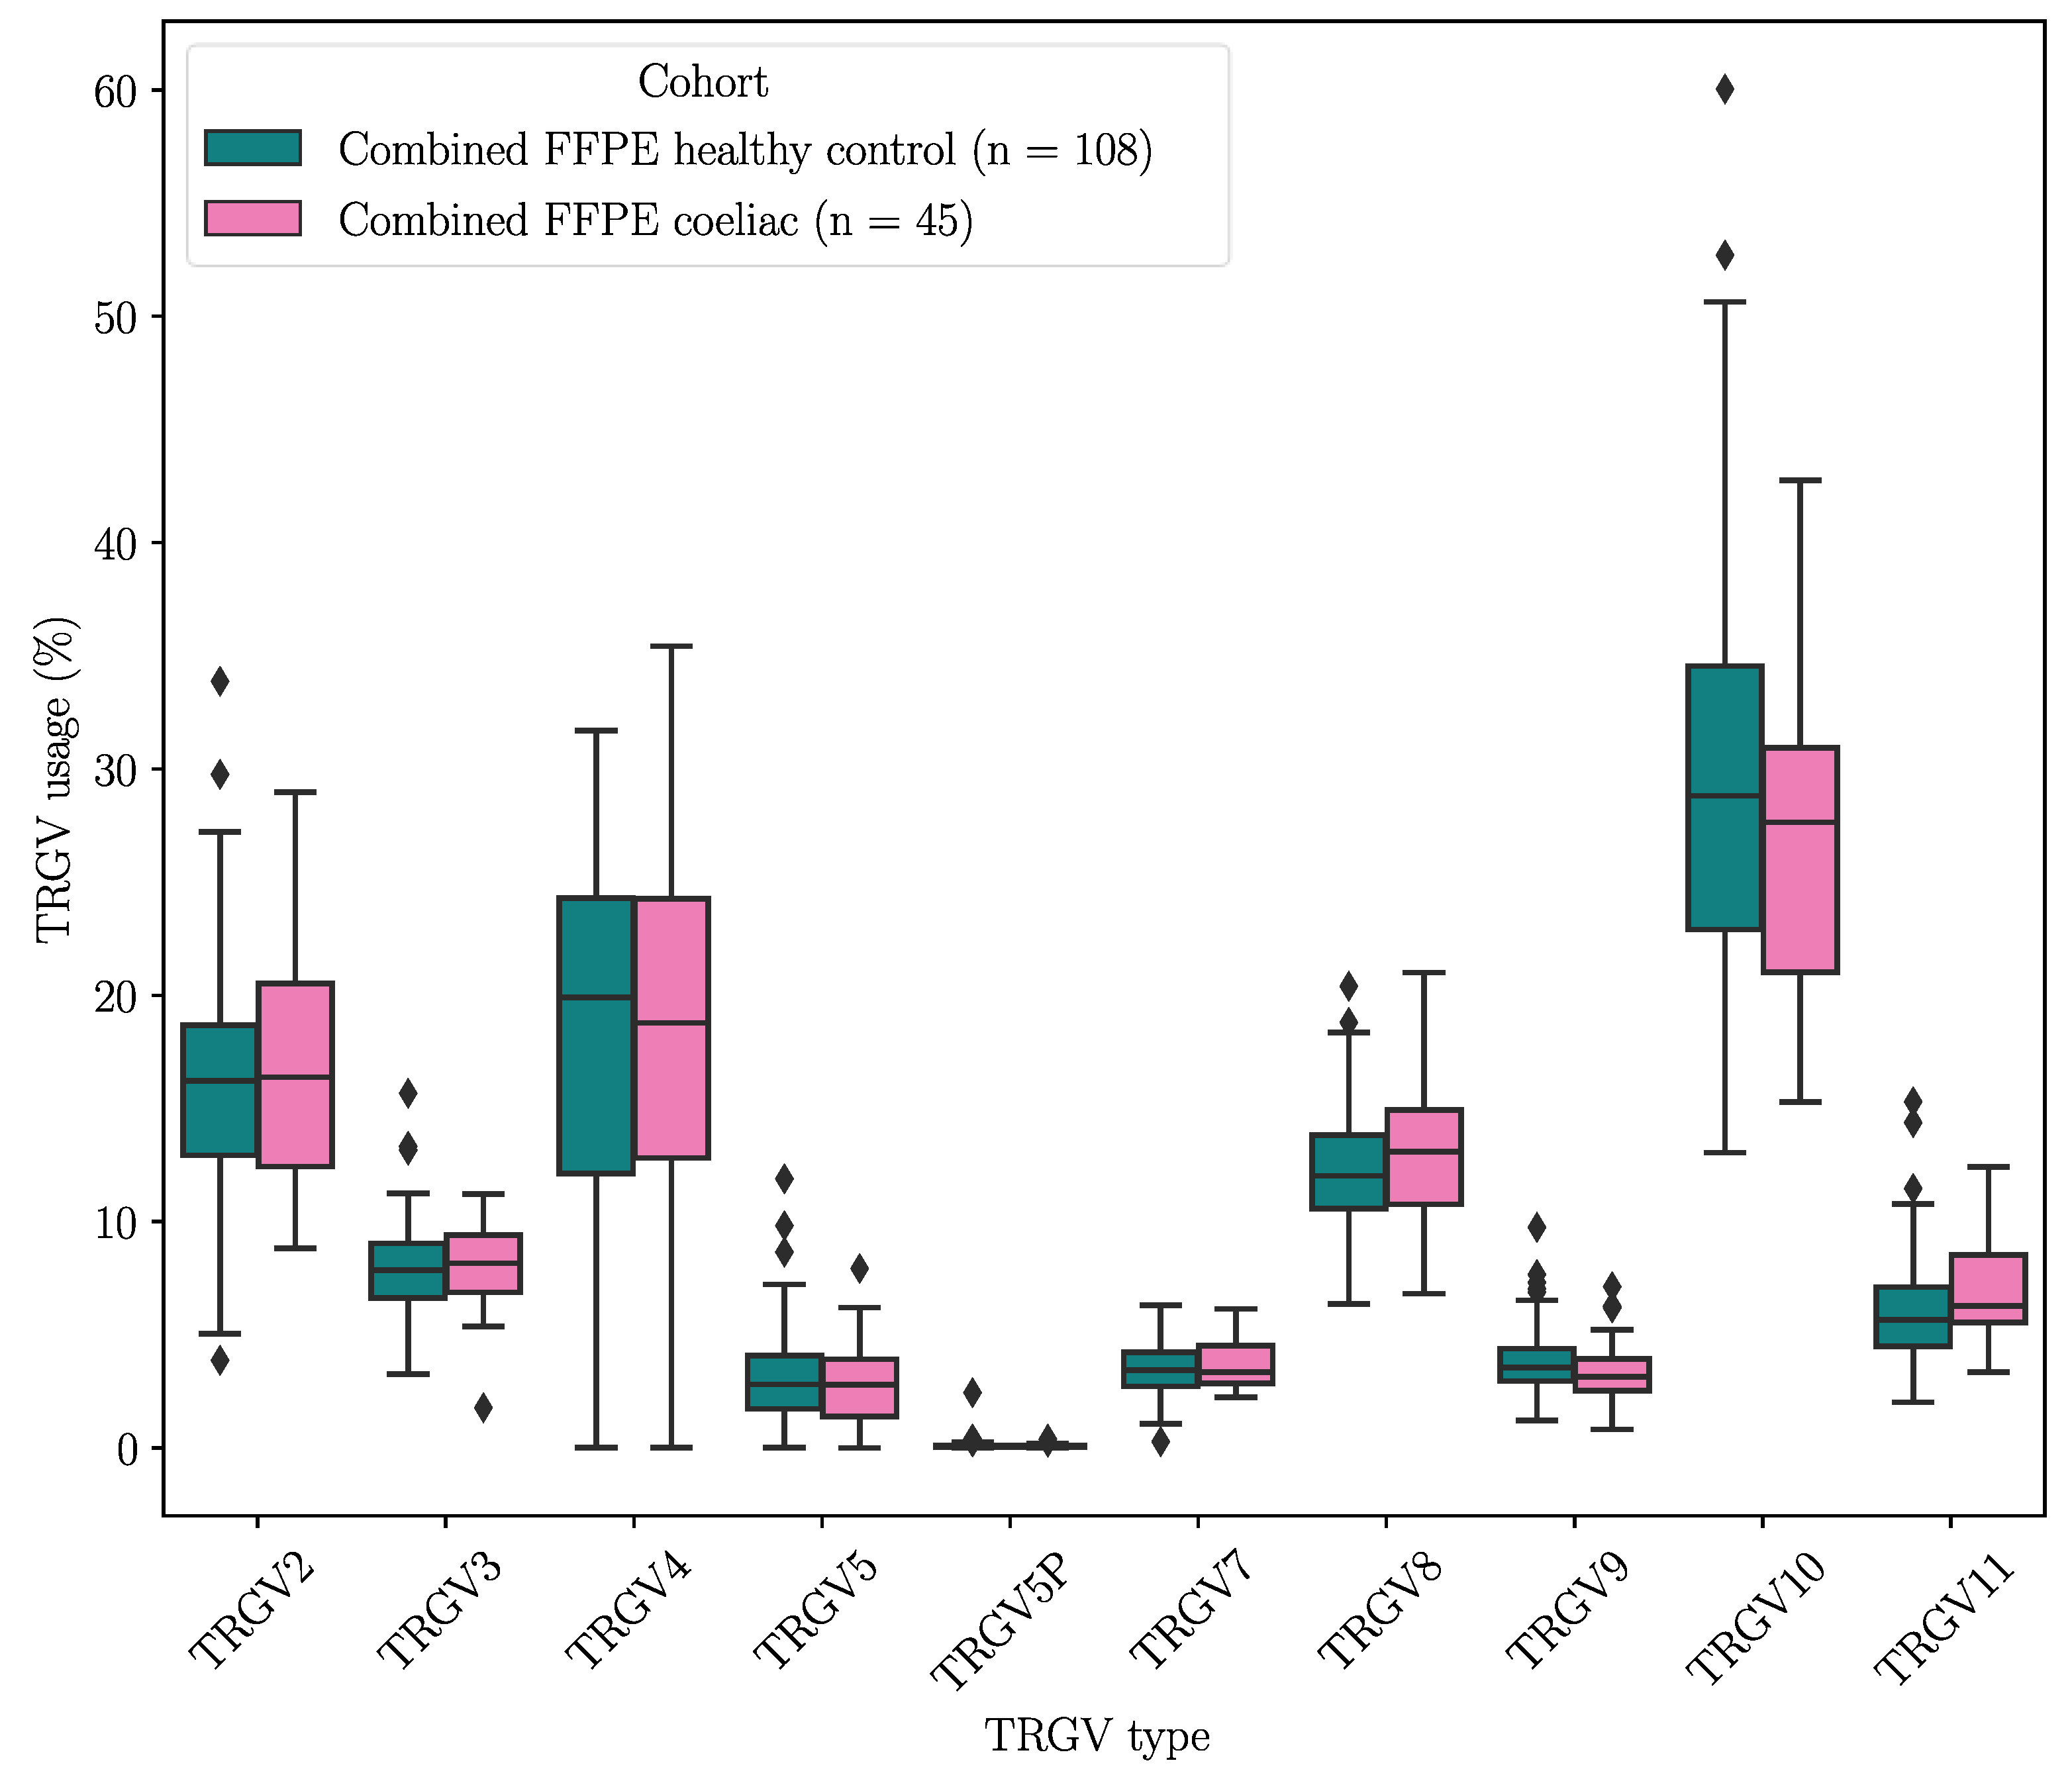
To verify these results, the duodenal TRG repertoires of 108 healthy controls and 45 CeD patients were examined for potential differences in TRGV usage, which was defined as the proportion of TRGV segment read counts present within the TCR repertoire of a tissue sample, using data derived from DNA extracted from formalin fixed, paraffin embedded (FFPE) duodenal samples and sequenced using the TRG Lymphotrack kit (Invivoscribe, Inc.) and a MiSeq platform (Illumina Inc.) (Table 14). The proportions of the TRGV genes present in duodenum samples from neither healthy controls nor CeD patients showed a normal distribution (Figure D1). The TRGV10, TRGV4, and TRGV2 variable (V) gene segments were the most frequent in this dataset. The mean usage proportion of the TRGV4 segment, which is capable of binding the BTNL3/BTNL8 heterodimer was 18.50% and 18.06% of the TRG repertoire in CeD and healthy control samples, respectively. When the proportion of TRGV segments was compared between the combined CeD and healthy control samples, no significant differences were found (Figure 2, Table D1).
Figure 2.
There were no significant differences in the TRGV usage of CeD (n = 45) and healthy control (n = 108) duodenal samples.
Figure 2.
There were no significant differences in the TRGV usage of CeD (n = 45) and healthy control (n = 108) duodenal samples.
2.3.2. HV4 Sequence Variation Was not Significantly Associated with CeD Risk
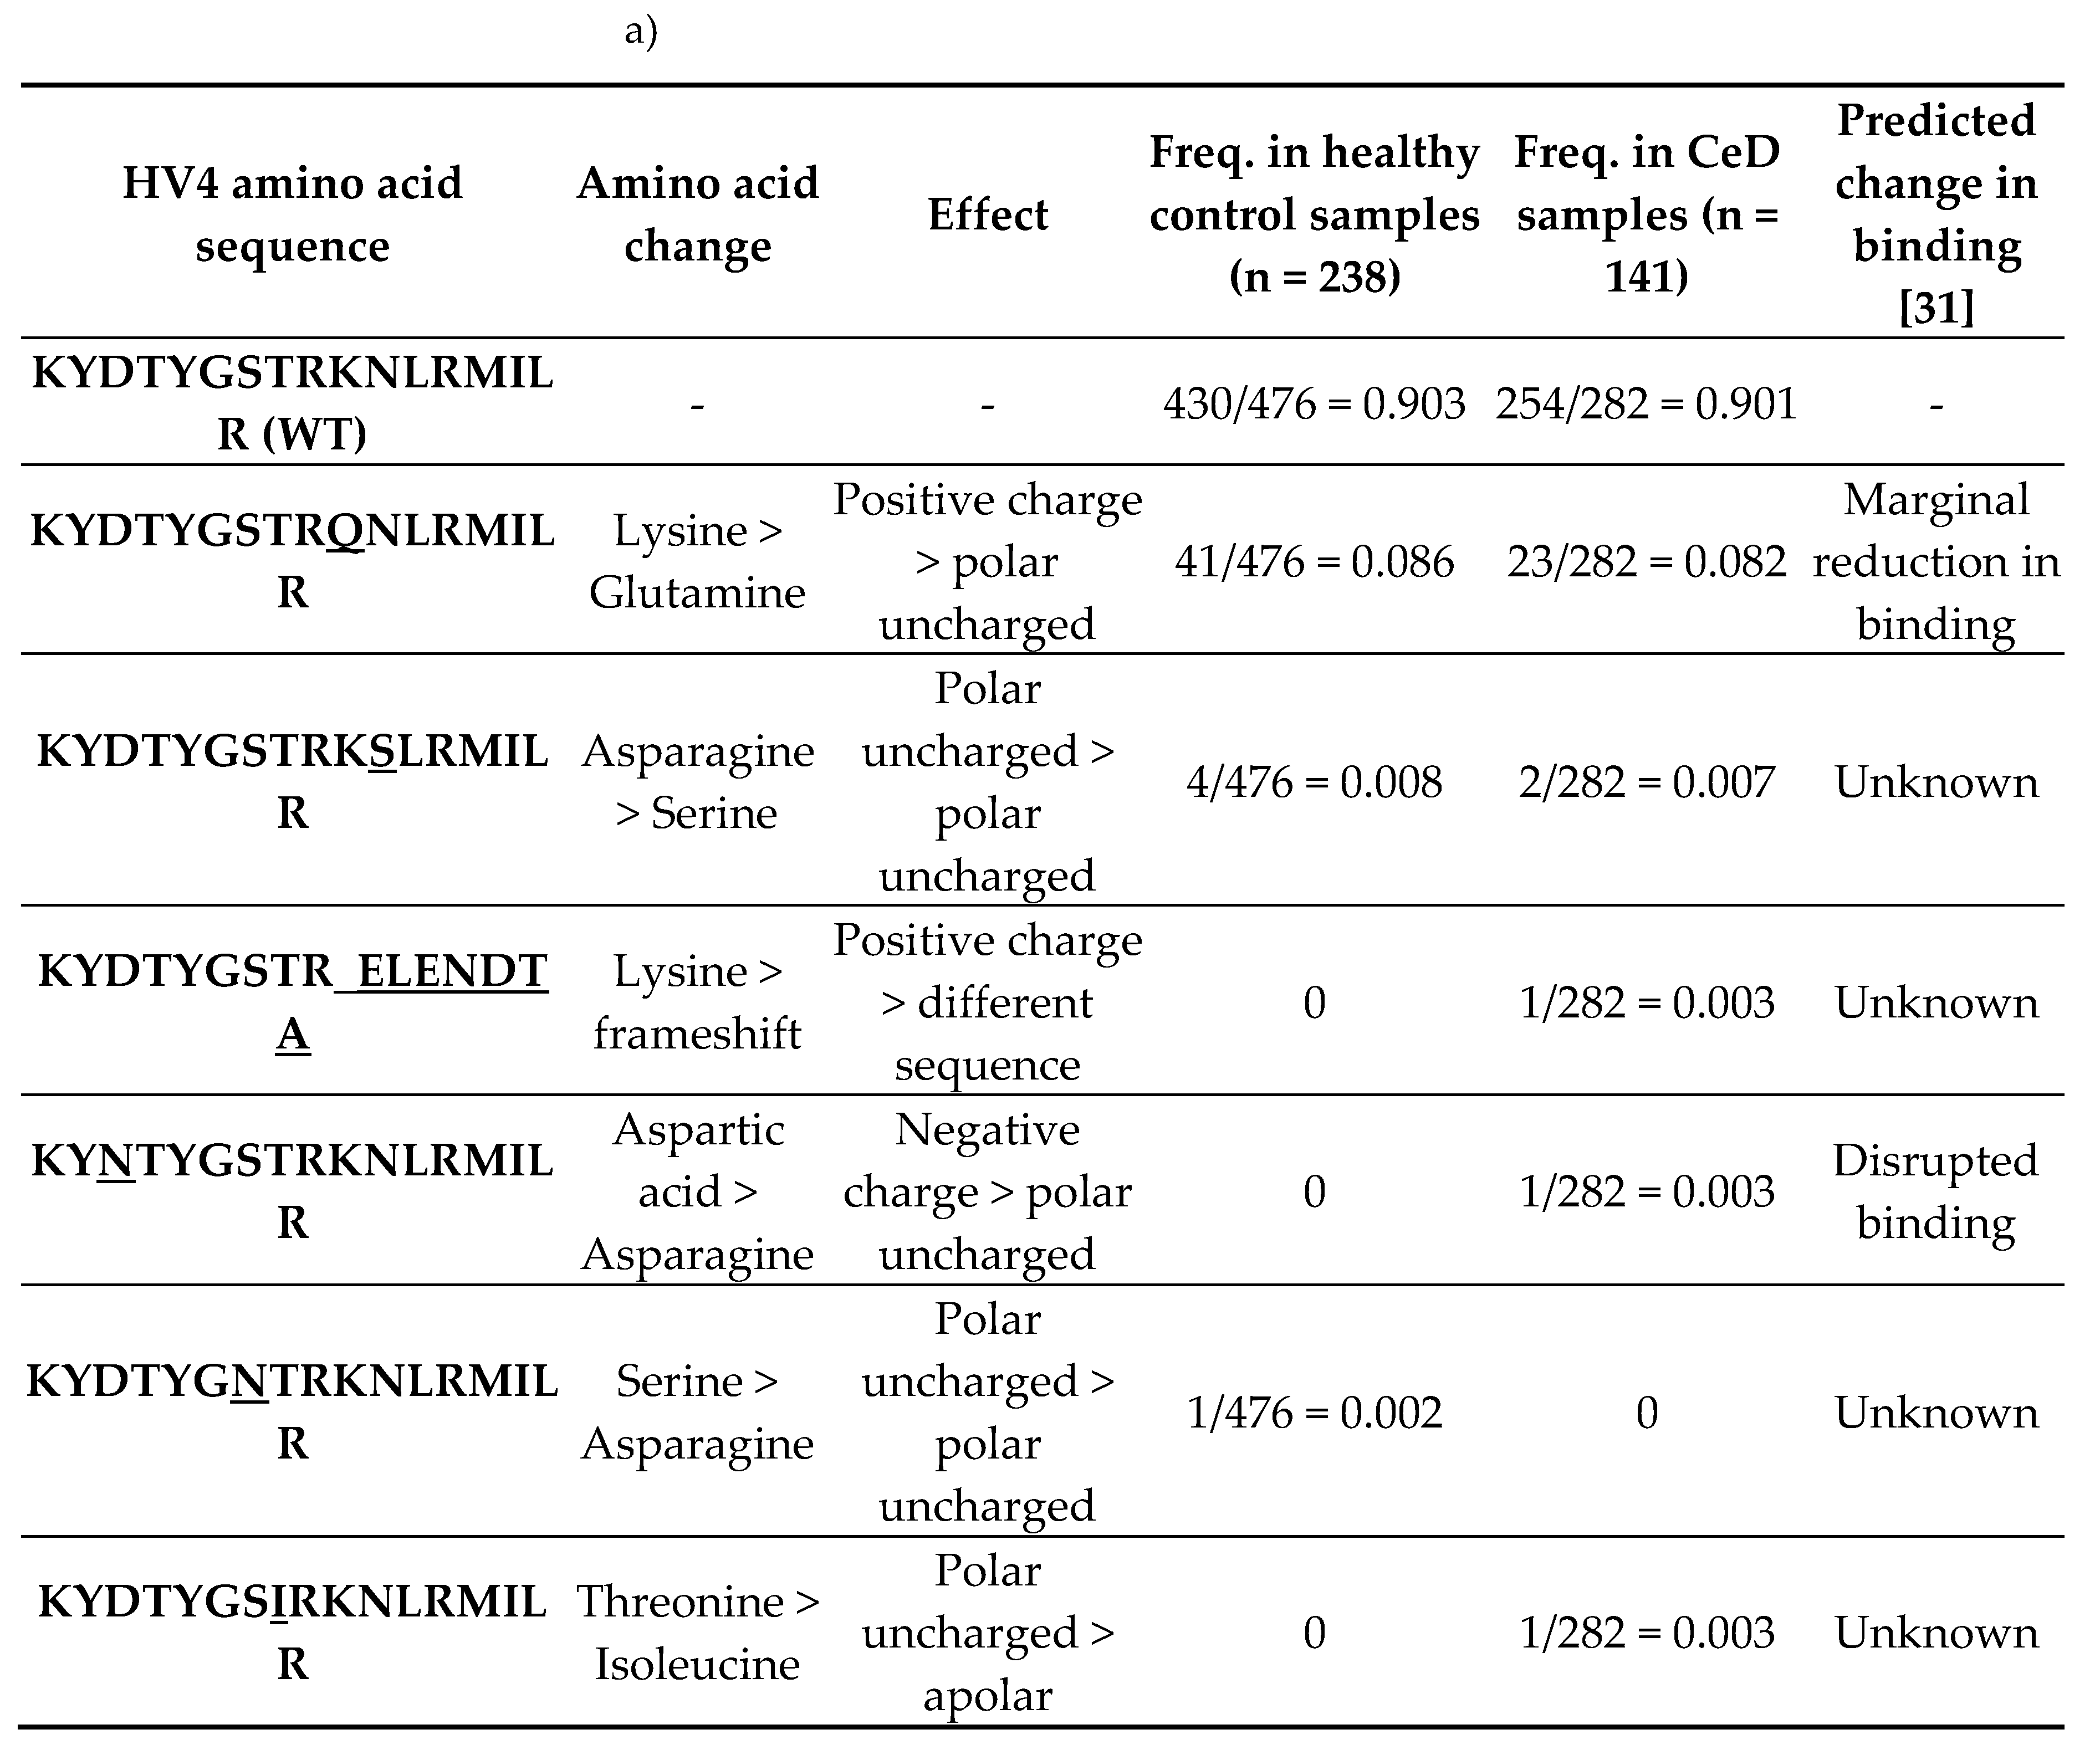
Next, the TRGV4-HV4 amino acid sequences were examined in 141 CeD and 238 healthy control samples (Table 14). The HV4 is germline-encoded, and is located in the FR3 of the TRGV4 gene. Neither the FR3 nor the HV4 undergo somatic recombination in T cells. As demonstrated by Melandri, et al. [29] and Willcox, et al. [31], only HV4 loops with the wild type (reference) KYDTYGSTRKNLRMILR amino acid sequence could directly bind BTNL3. Substitutions in the amino acids underlined (KYDTYGSTRKNLRMILR) were found to disrupt this direct binding between BTNL3 and Vγ4+ T cells, while substitutions in the following underlined amino acids (KYDTYGSTRKNLRMILR) only caused a marginal reduction in binding [31]. As the HV4 is germline-encoded and does not undergo recombination, we hypothesised that variations in the germline-encoded TRGV4-HV4 amino acid sequence could alter the binding of the Vγ4+ γδ T cells to BTNL3 protein in the duodenum, predisposing to CeD.
Seven unique HV4 amino acid sequences were identified in the dataset (Table 12). The reference HV4 sequence KYDTYGSTRKNLRMILR capable of binding the BTNL3 protein was the most frequent in both healthy control (95.8%, 228/238) and CeD (97.9%, 138/141) samples. Approximately 84.9% (202/238) of healthy control samples and 82.3% (116/141) of CeD were homozygous for the WT HV4 sequence. There were no significant differences in the HV4 amino acid sequence distribution between CeD and healthy control samples (Fisher’s exact test, p = 0.26, Figure 3, Table D2).
Table 12.
More than 95% of participants possessed at least one reference HV4 loop regardless of their CeD status. The dataset consisted of 238 healthy control and 141 CeD samples. a) Seven unique HV4 amino acid sequences were identified in the dataset. b) The homozygous WT HV4 phenotype was the most frequent in both healthy control and CeD groups.
 |
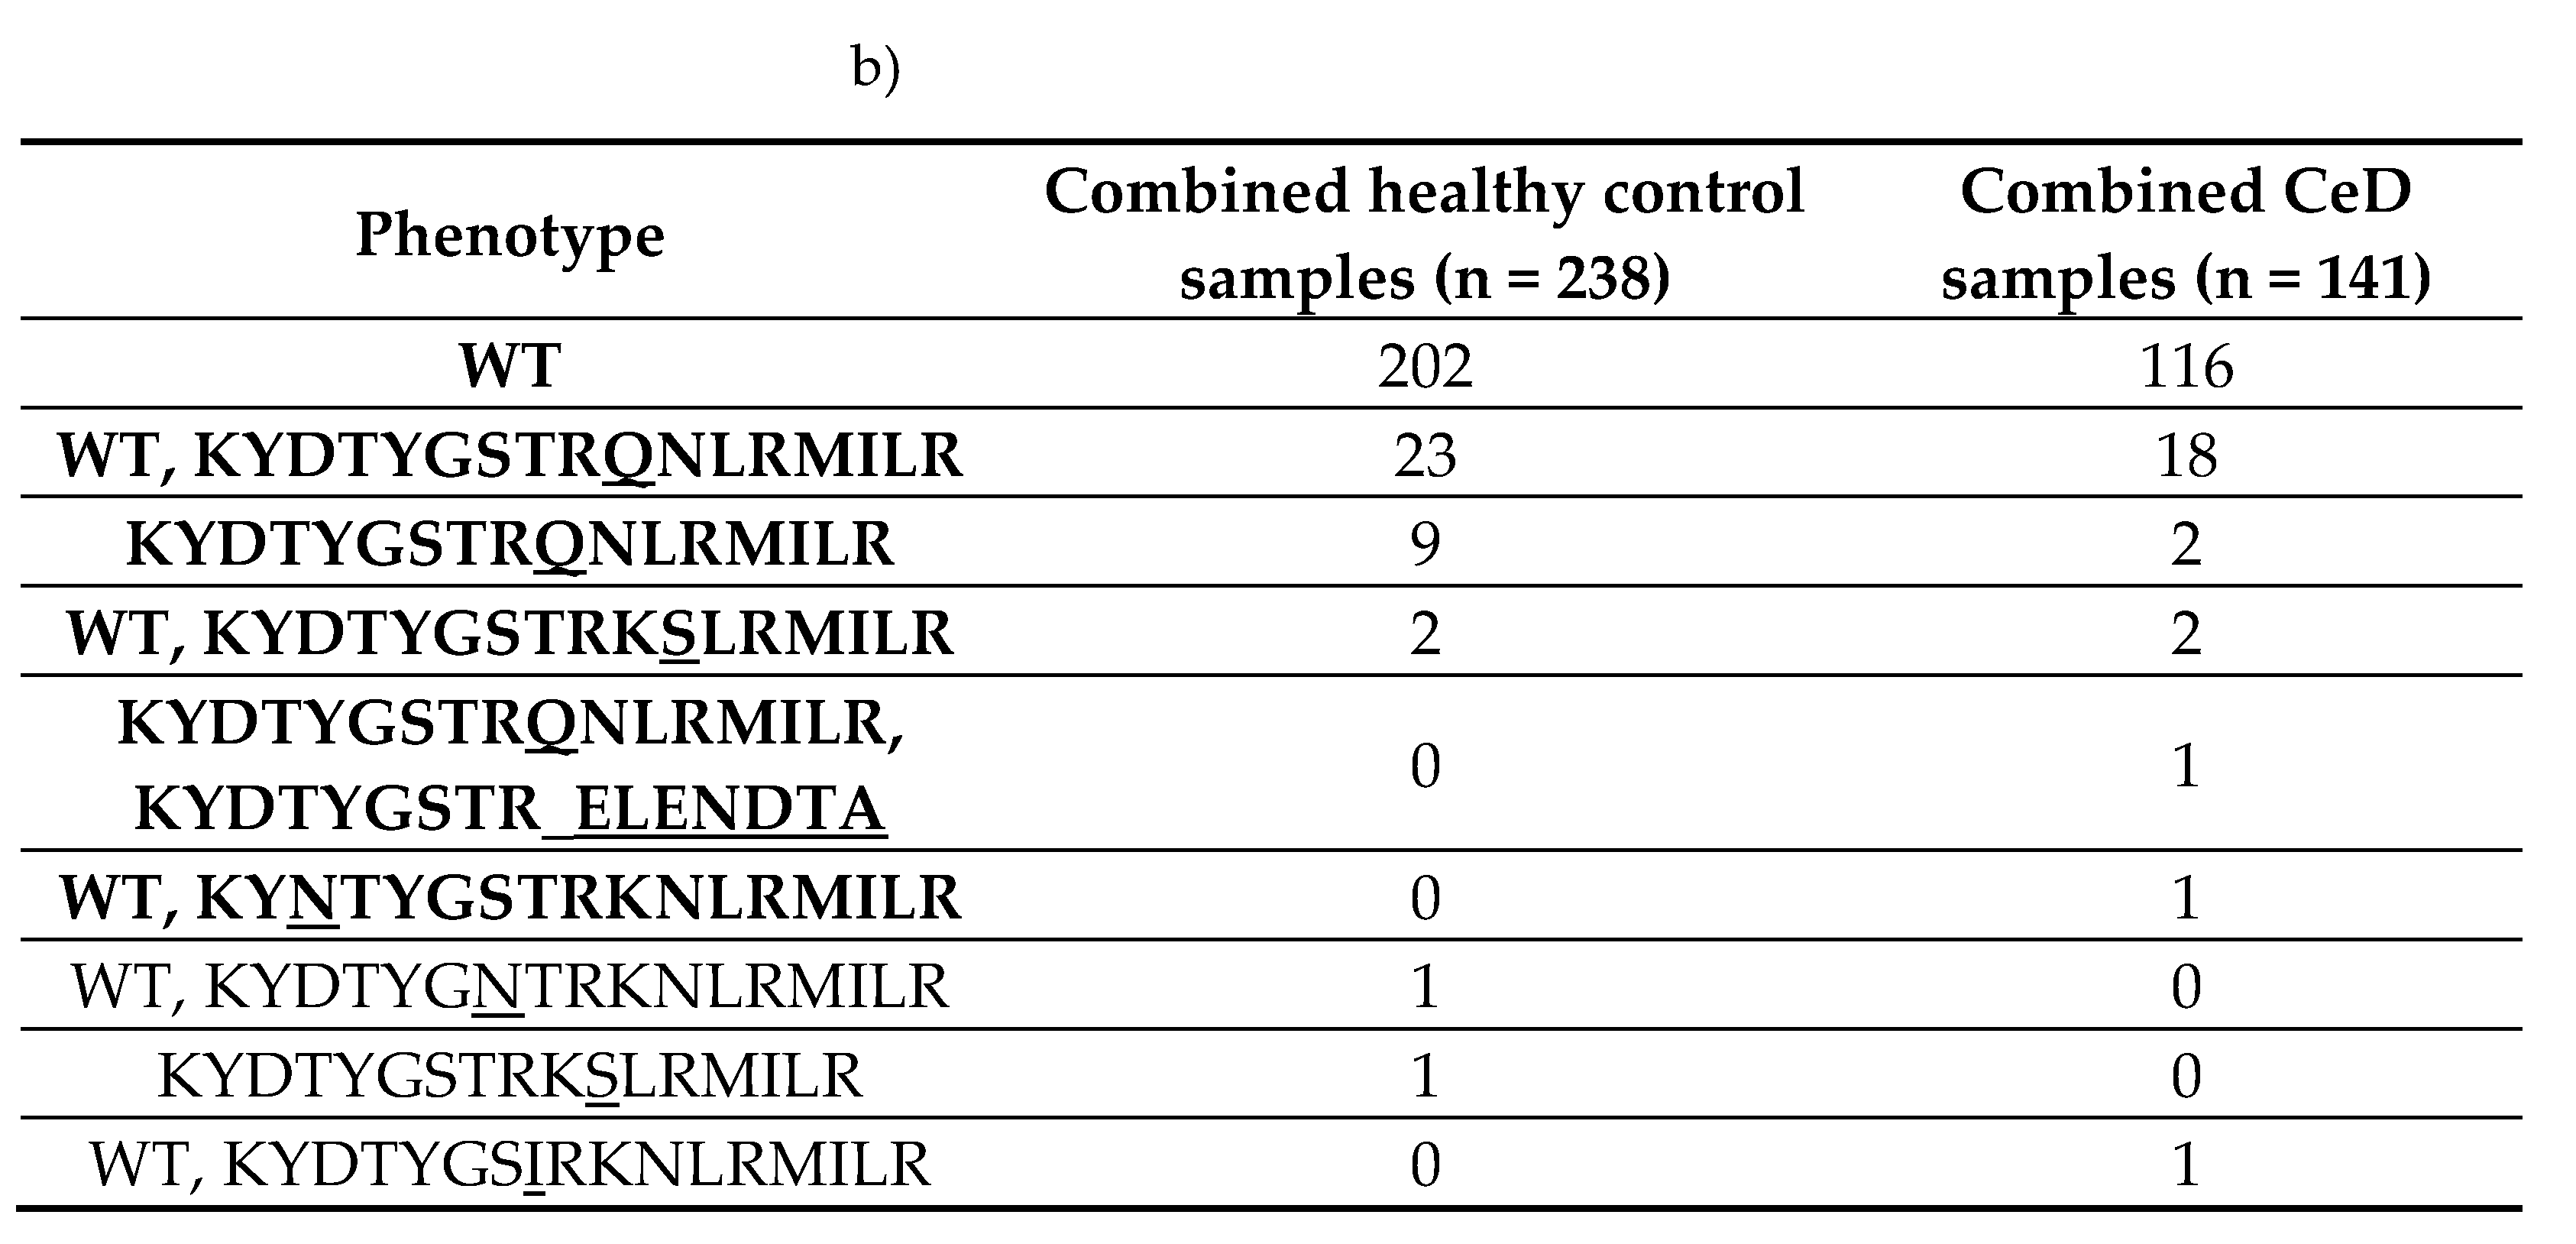 |
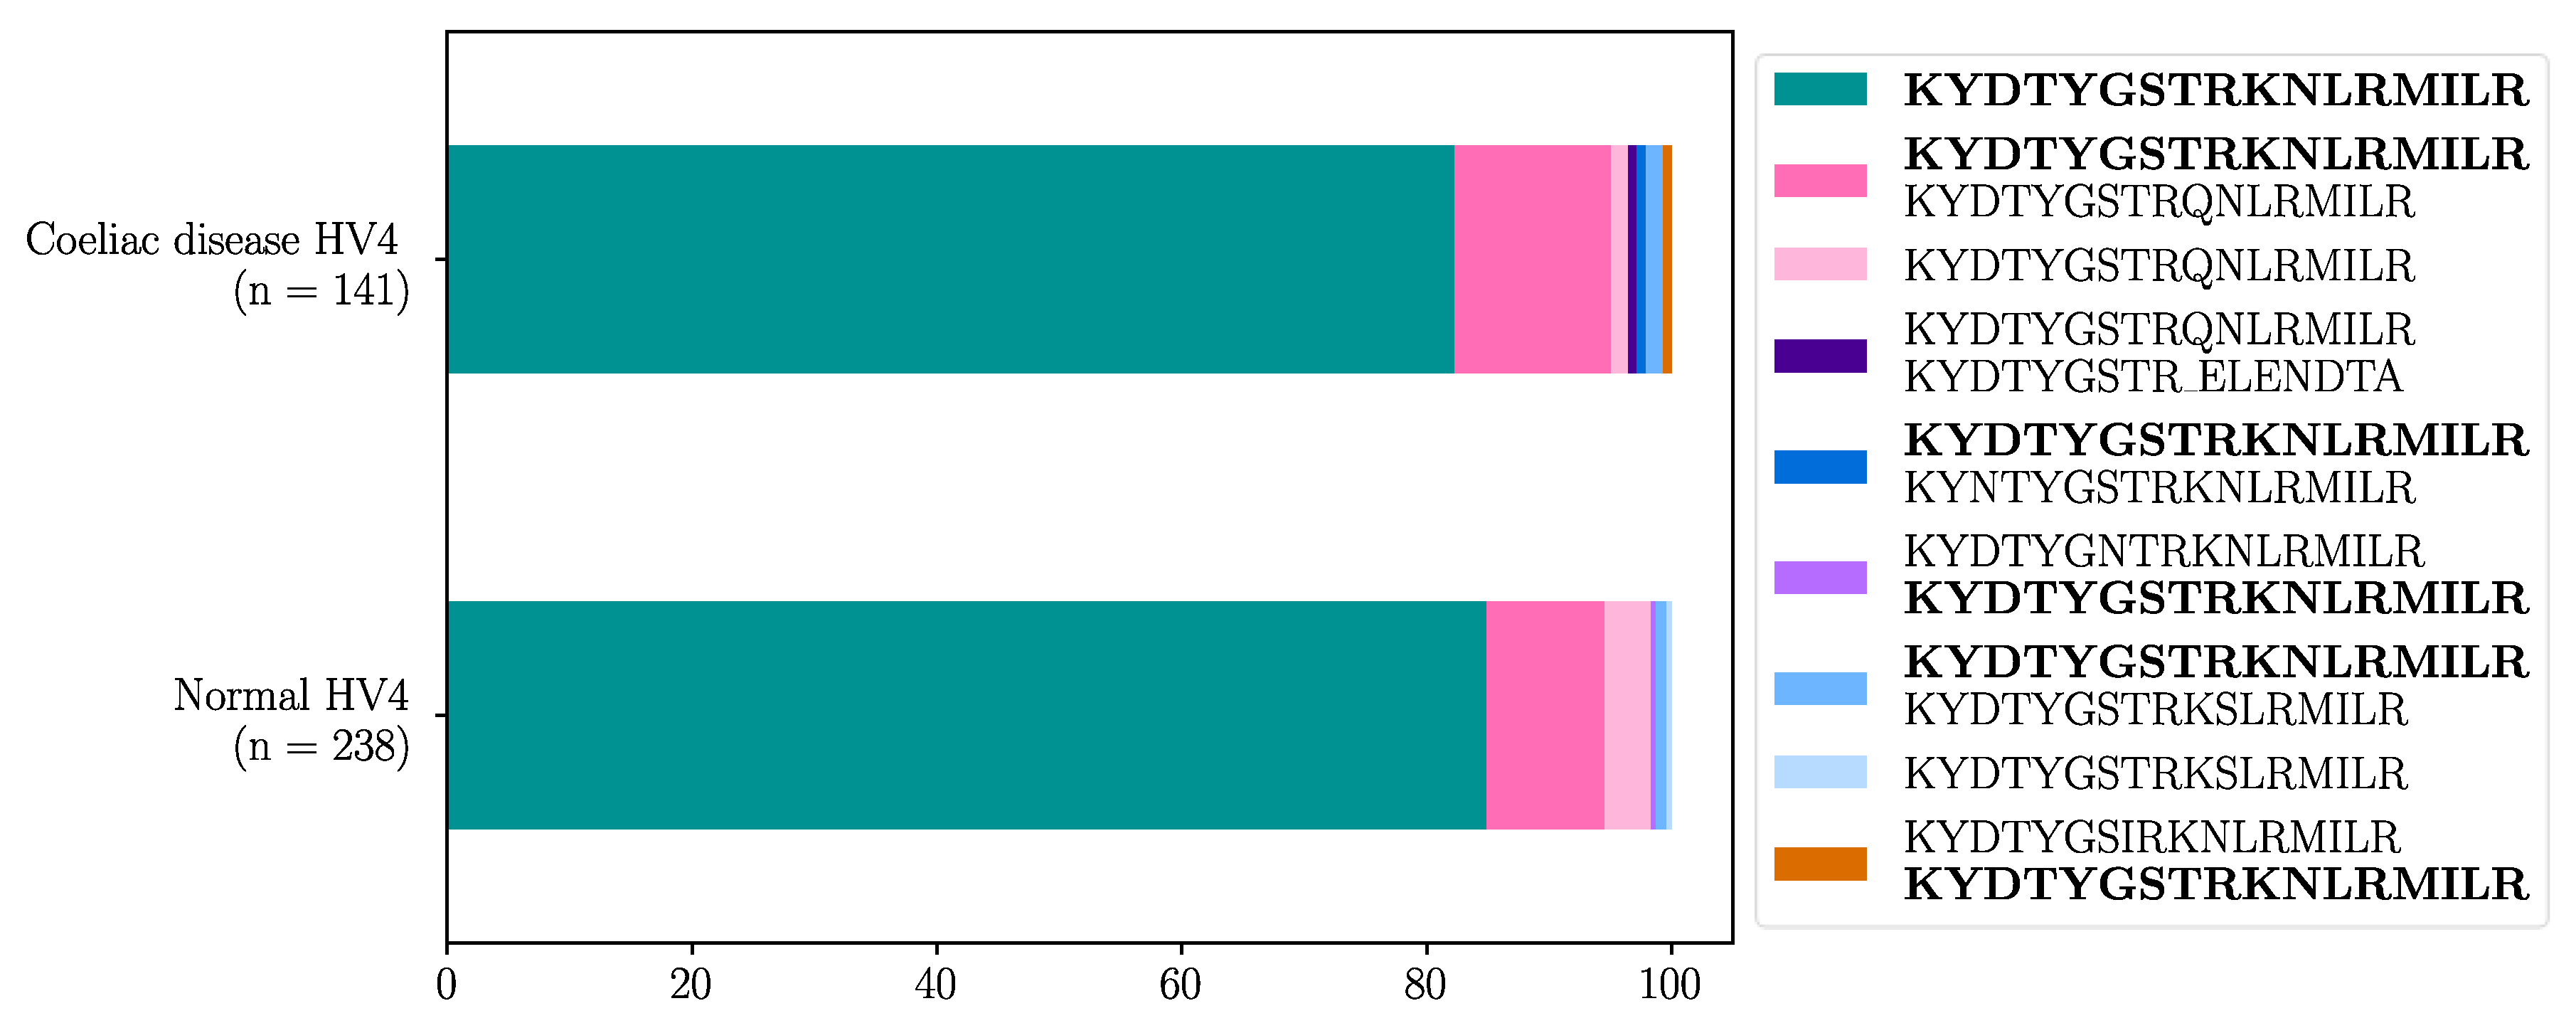
Figure 3.
More than 82% of both healthy control and CeD samples were homozygous for the reference HV4 amino acid sequence in the combined cohort. The HV4 analysis was carried out on a cohort of 238 healthy control and 141 CeD samples. The homozygous, reference HV4 sequence was the most common phenotype in both CeD and healthy control samples. Only 10 healthy control and 3 CeD samples did not have any WT HV4 sequences.
To summarise, TRGV usage and HV4 amino acid sequence variation could not explain CeD risk in a dataset of 379 samples.
3. Discussion
Coeliac disease (CeD) is a T-cell mediated enteropathy triggered by the consumption of gluten, which is the collective name of a group of proteins found in wheat, rye, and barley [1]. The genetic risk for CeD is not fully understood; an estimated 50% of genetic predisposition is still unexplored [60]. Around 30% of genetic risk can be explained by the HLA risk genotypes HLA-DQ2.5, HLA-DQ8, and HLA-DQ2.2, which were first connected to CeD risk in 1972 [17,18,61,62].
Recently, the butyrophilin family of genes were proposed as non-HLA CeD risk loci [19,20,21]. These genes encode transmembrane proteins that were implicated in regulating the activity of innate and adaptive immune cells, alongside maintaining characteristic epithelial γδ T-cell populations in mice and humans [22,24]. Prior to this study, four genes were associated with CeD: BTN3A1, BTNL2, BTNL3, and BTNL8 [19,20,21].
Therefore, we investigated the association of butyrophilin family gene variation to CeD risk via targeted sequencing of 46 healthy control and 49 CeD samples. The non-synonymous coding butyrophilin SNP data of the 94 samples were subjected to gene-based burden testing. Comparing the CeD and control SNPs, BTN2A1 gene burden was significantly higher in CeD patients in both the dominant (p = 1.46E-05) and the recessive models (p = 3.70E-08).
The significant association between BTN2A1 SNPs and CeD risk was validated using the UK Biobank 500,000 genome-wide genotyping dataset. Fourteen BTN2A1, 10 BTN3A1, and 13 BTN3A2 SNPs were significantly associated with CeD, the majority of which were non-coding variants. When the risk associated HLA genotypes of these participants were taken into account, only 7 BTN2A1, 2 BTN3A1, and 11 BTN3A2 SNPs remained significant, showing HLA independent associations with CeD risk. Finally, butyrophilin SNPs were single variant tested in CeD risk HLA-matched groups. The 20 SNPs above alongside a novel intronic BTN2A1 SNP were significant in predicting CeD status in 1652 CeD and 6416 control participants with the HLA-DQ2.5 genotype. UK Biobank validation indicated that the BTN3A1 and BTN3A2 non-synonymous coding SNPs were not significantly associated with CeD risk in the hybridization capture cohort, likely due to the majority of significantly associated SNPs being non-coding, and thus excluded from the burden testing analysis.
Due to the association between butyrophilin family members and CeD status, and the involvement of butyrophilin heterodimers in shaping γδ T-cell repertoires, CeD risk was also examined from the angle of the duodenal Vγ4+ γδ T cells [21,27,28]. To investigate any likely effects of polymorphisms in the TCR γ V segment, TRGV4, on the interaction between Vγ4+ γδ T cells and the BTNL3/BTNL8 heterodimer, the TRGV4-HV4 amino acid sequences of 379 samples were examined. Mutations in the reference HV4 sequence, KYDTYGSTRKNLRMILR, specifically in the DGKM residues in vitro were previously shown to decrease the direct binding between BTNL3 and Vγ4+ γδ T cells [31]. The aim of this analysis was to identify germline-encoded HV4 amino acid sequence variations, that were more frequent in CeD patients. The hypothesis was that individuals having HV4 variations, especially ones that affected the DGKM residues, had higher CeD risk due to the decreased BTNL3-HV4 binding affinity. There were no significant differences in the HV4 amino acid sequence variation between CeD and healthy control samples (p = 0.2648). It is possible that the HV4 sequence is conserved via stabilising selection due to its interaction with BTNL3, which serves as the maintenance signal for the Vγ4+ γδ T cells in the duodenum [21].
We thus identified BTN2A1 and BTN3A2 as novel CeD risk loci and corroborated BTN3A1 as a CeD risk locus. The association between BTN3A1 and CeD is in accordance with evidence showed by Pietz, et al. [20], who hypothesised that pAg presentation by intestinal epithelial cells in active CeD may contribute to IFN-γ production and T cell proliferation. Indeed, all three of these butyrophilin genes are involved in the pAg-mediated, innate-like activation of peripheral blood γδ T cells [37,38,63,64]. Taking these results together, we provide a new hypothesis for the role of butyrophilins in CeD (Figure 4).
Firstly, these results could imply that BTN2A1 and BTN3A2 could also act on the duodenal Vγ4+ γδ T cells, which is a novel hypothesis as these proteins have only been implicated in activating peripheral blood Vγ9Vδ2+ γδ T cells (Figure 4a). The nature of this interaction is unexplored, and whether these proteins are responsible for pAg-dependent activation of Vγ4Vδ1+ T cells requires further research. This hypothesis could explain why the BTNL8*BTNL3 deletion variant, which encodes a BTNL8*3 fusion protein but no full length BTNL3 or BTNL8 proteins, was not significantly associated with CeD risk in the cohort of 94 samples. Participants who are homozygous for the deletion can only express the BTNL8*3 fusion protein, which is not hypothesised to bind the Vγ4+ TCR. If BTN2A1, BTN3A1, or BTN3A2 could provide a survival signal to the Vγ4Vδ1+ IELs in the healthy small intestine, this could explain why controls could be homozygous for the BTNL3/BTNL8 deletion variant without having CeD.
Secondly, the findings of this project could suggest that BTN2A1 and BTN3 regulate duodenal immune cell activity in the context of CeD. BTN2A1 was identified as a novel ligand for the receptors of DCs, which are important cells in displaying the gluten antigen to CD4+ αβ T cells to induce CeD pathogenesis [24,25]. Although the function of this interaction was not explored, taken together with the results of this project, it could explain the association between BTN2A1 and CeD risk, as the protein could regulate the autoimmune response in CeD indirectly via DC activity (Figure 4b). Additionally, previous evidence has shown that BTN3 proteins can provide co-stimulatory signals to αβ T cells, increasing their production of interferon-γ (IFN-γ), a proinflammatory cytokine [26]. This same study showed the dual effect of butyrophilins on NK cell activity: BTN3A1 upregulated, while BTN3A2 downregulated IFN-γ production and NK cell activation (Figure 4c).
Figure 4.
BTN2A1, BTN3A1 and BTN3A2 may be involved in CeD pathogenesis by modulating T cell and innate immune cell activity. BTN2A1 gene burden was significantly higher in CeD patients in a cohort of 94 samples. Meanwhile, BTN2A1, BTN3A1, and BTN3A2 SNPs were significantly associated with CeD status in the UK Biobank database. Based on our results and evidence on the immunomodulatory role of butyrophilins on innate and adaptive immune cells, butyrophilins could contribute to CeD pathogenesis in multiple potential manners [25,26,37,38,63]. a) Via the novel, hypothesised pAg-dependent activation of Vγ4+ γδ T cells; b) via the interaction of BTN2A1 with dendritic cells through the DC-SIGN receptor on the DC cell surface; c) by increasing the co-stimulation and IFN-γ production of CD4+ αβ T cells, or by modulating the activity and IFN-γ production of NK cells depending on whether BTN3A1 or BTN3A2 is expressed predominantly on the surface of the NK cell; or d) via the pAg-dependent activation of potentially gut-homing Vγ9Vδ2+ γδ T cells in the small intestine.
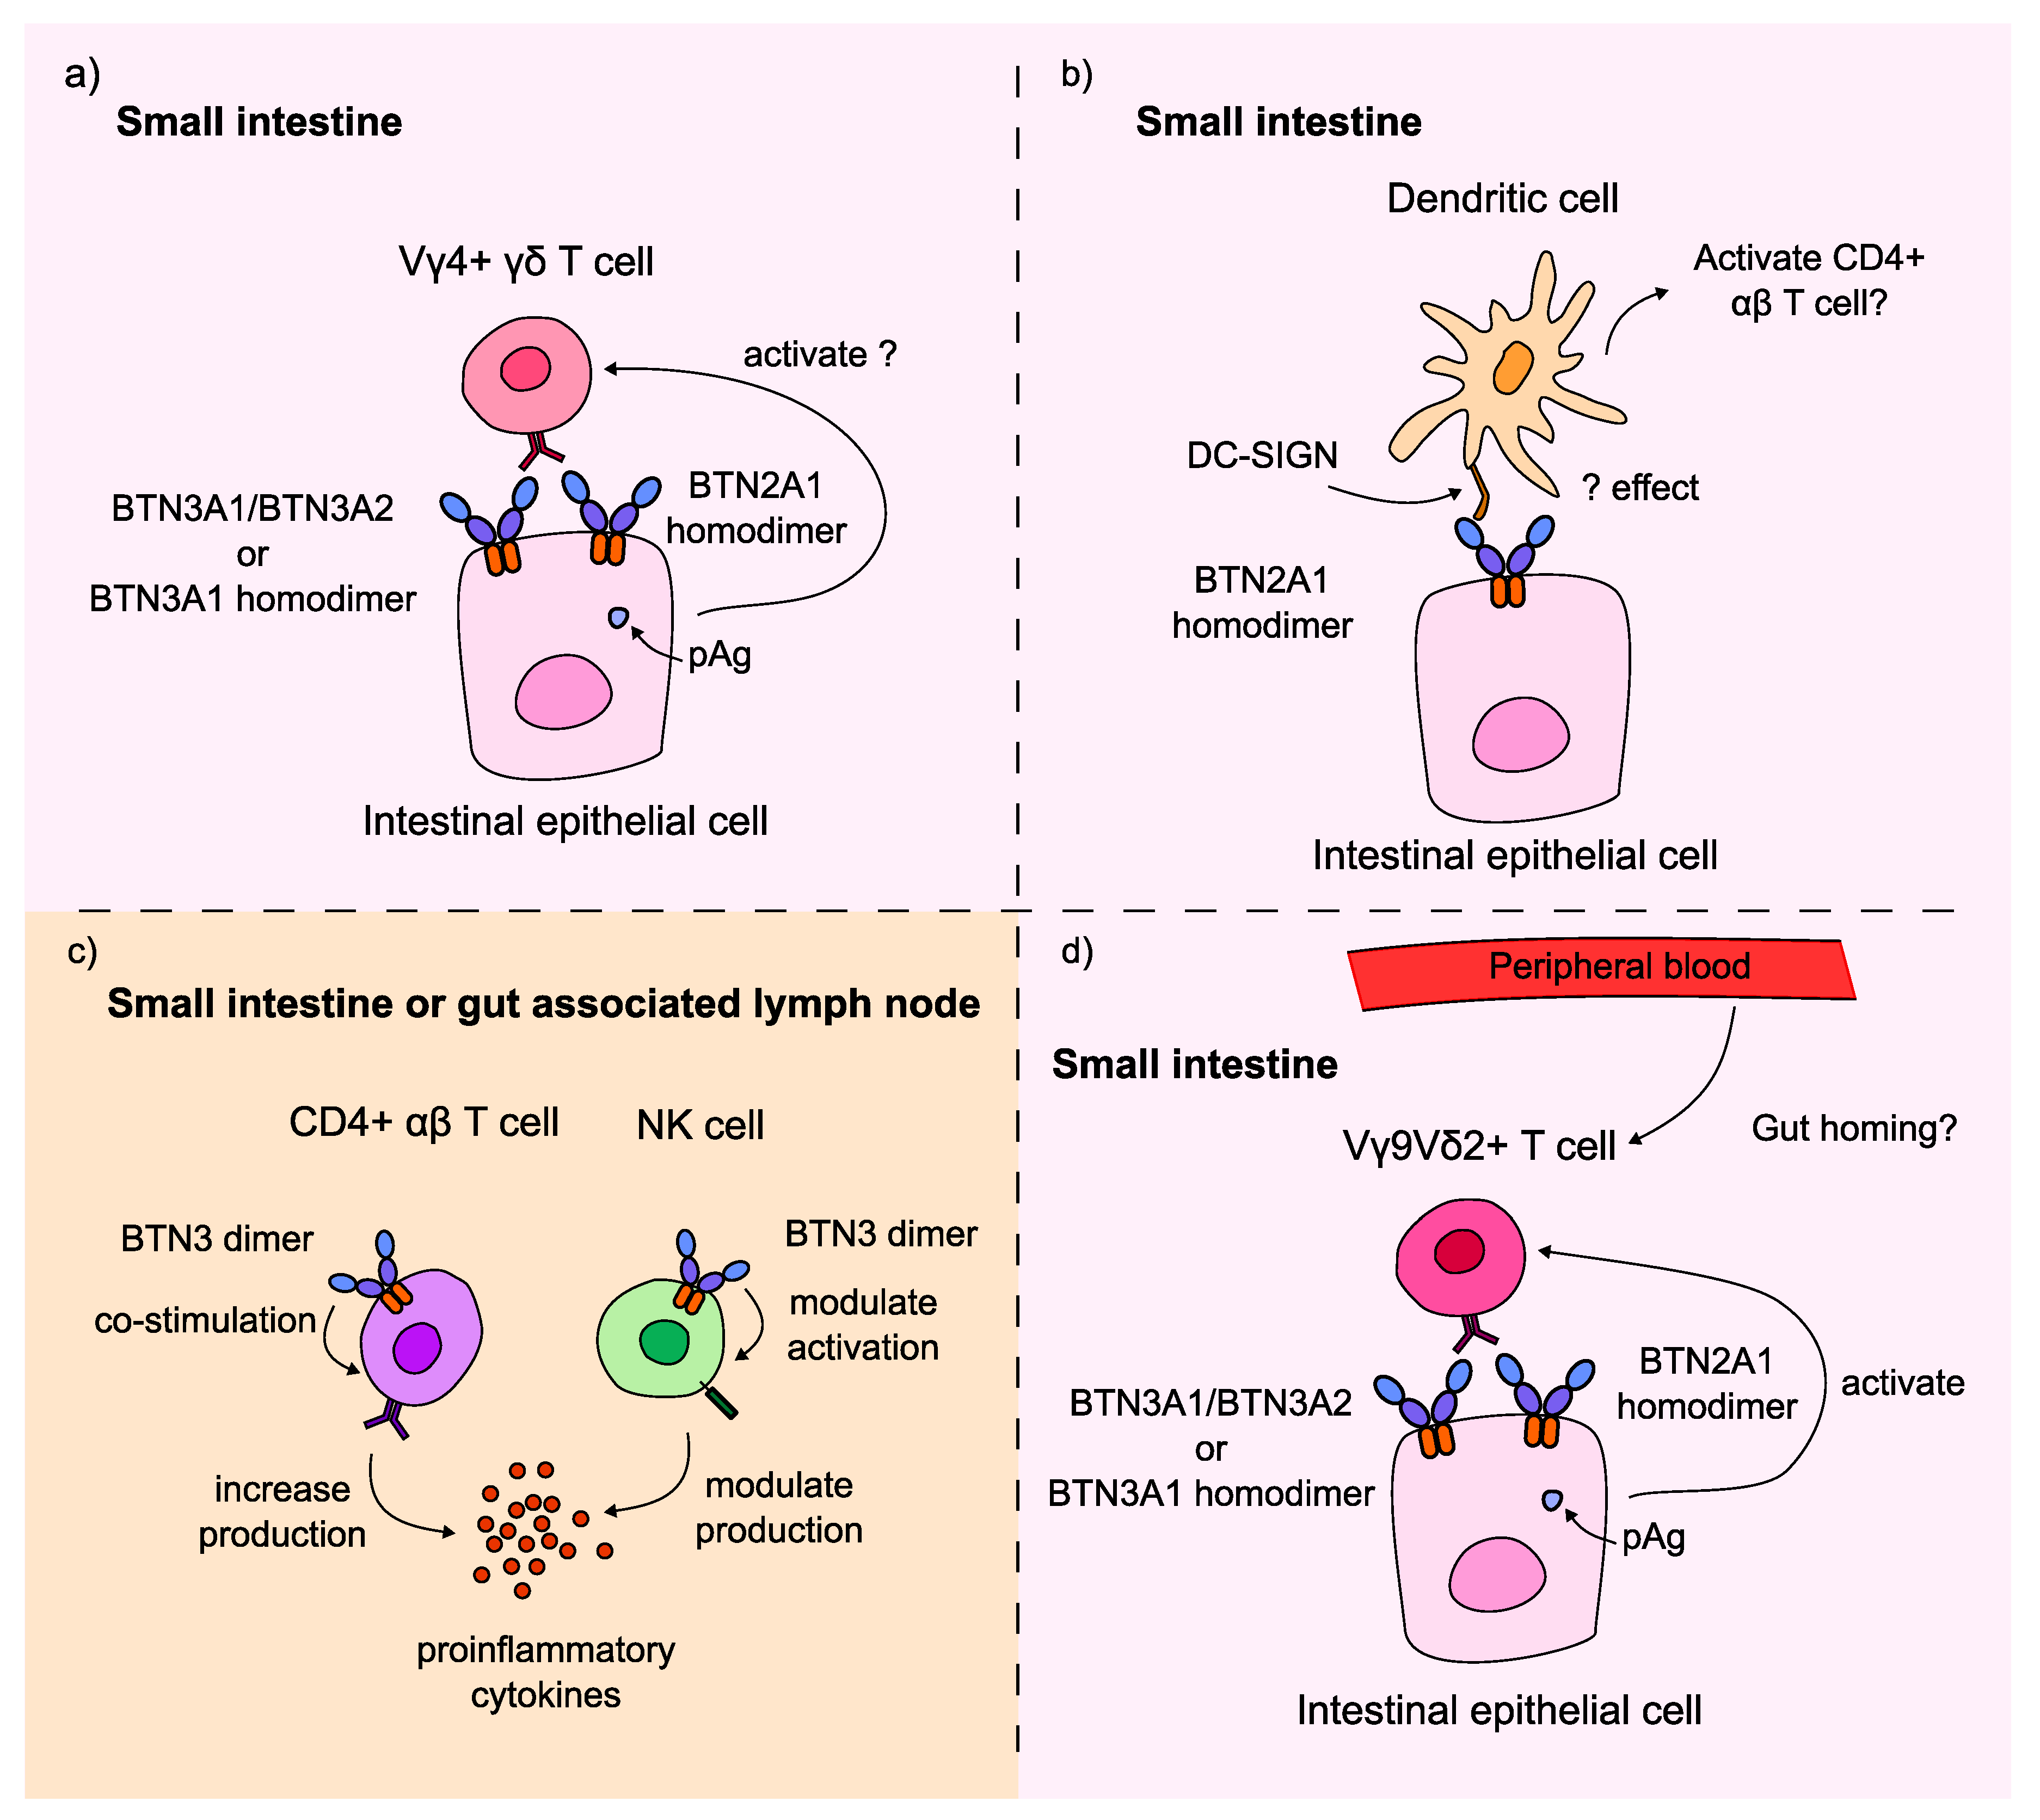
Thirdly, the results of this project could indicate the involvement of peripheral blood Vγ9Vδ2+ T cells in CeD (Figure 4d). Whether these T cells are recruited to infiltrate the small intestine from the peripheral blood or they contribute to CeD pathogenesis in a different way remains unclear. Interestingly, in the analysis of our cohort of 108 healthy control and 45 CeD duodenal samples, only 3-4% of γδ T cells were Vγ9+ T cells (Figure 2, Table 14,). There were no significant differences in the proportion of Vγ9+ T cells in CeD and healthy controls (p = 0.728). Further research is required to investigate the activity of these cells, and whether they interact with butyrophilins in the context of CeD.
In conclusion, the butyrophilin family of genes are promising immunomodulators involved in connecting the adaptive and innate immunity [24]. Our results provide evidence that the butyrophilin genes BTN2A1, BTN3A1, and BTN3A2 may be putative CeD risk loci. Due to their important roles in the maintenance, activation, and regulation of γδ T cells, the butyrophilins may be involved in the pathogenesis of other autoimmune and inflammatory disorders. Our work provides a clear rationale for further research into the role of the butyrophilin family of genes in CeD.
4. Materials and Methods
4.1. Participant Selection Criteria
All patient samples used in the HV4 analysis and the targeted sequencing cohort were collected, stored and fully anonymised in line with the Human Tissue Act (England and Wales), 2004, with full ethical approval by the Soilleux group (IRAS project ID: 162057, REC reference: 04/Q1604/21, PI: Prof. E. Soilleux).
CeD patient samples were selected using hospital records, while control samples were selected to exclude suspected CeD patients.
Control exclusion criteria:
- Has CeD diagnosis
- Malabsorption
- Anaemia
- Lymphocytosis
- On a GFD
- Diarrhoea
4.1.1. Participant Selection for the Butyrophilin Family Gene Sequencing
A total of 48 CeD samples and 46 control samples were sequenced for the butyrophilin family variance analysis (Table 13).
Table 13.
94 blood and duodenal samples were sequenced to investigate CeD risk loci. a) Samples were collected from diagnostic surplus samples. b) Both blood and FFPE duodenal samples were collected and sequenced.
Table 13.
94 blood and duodenal samples were sequenced to investigate CeD risk loci. a) Samples were collected from diagnostic surplus samples. b) Both blood and FFPE duodenal samples were collected and sequenced.
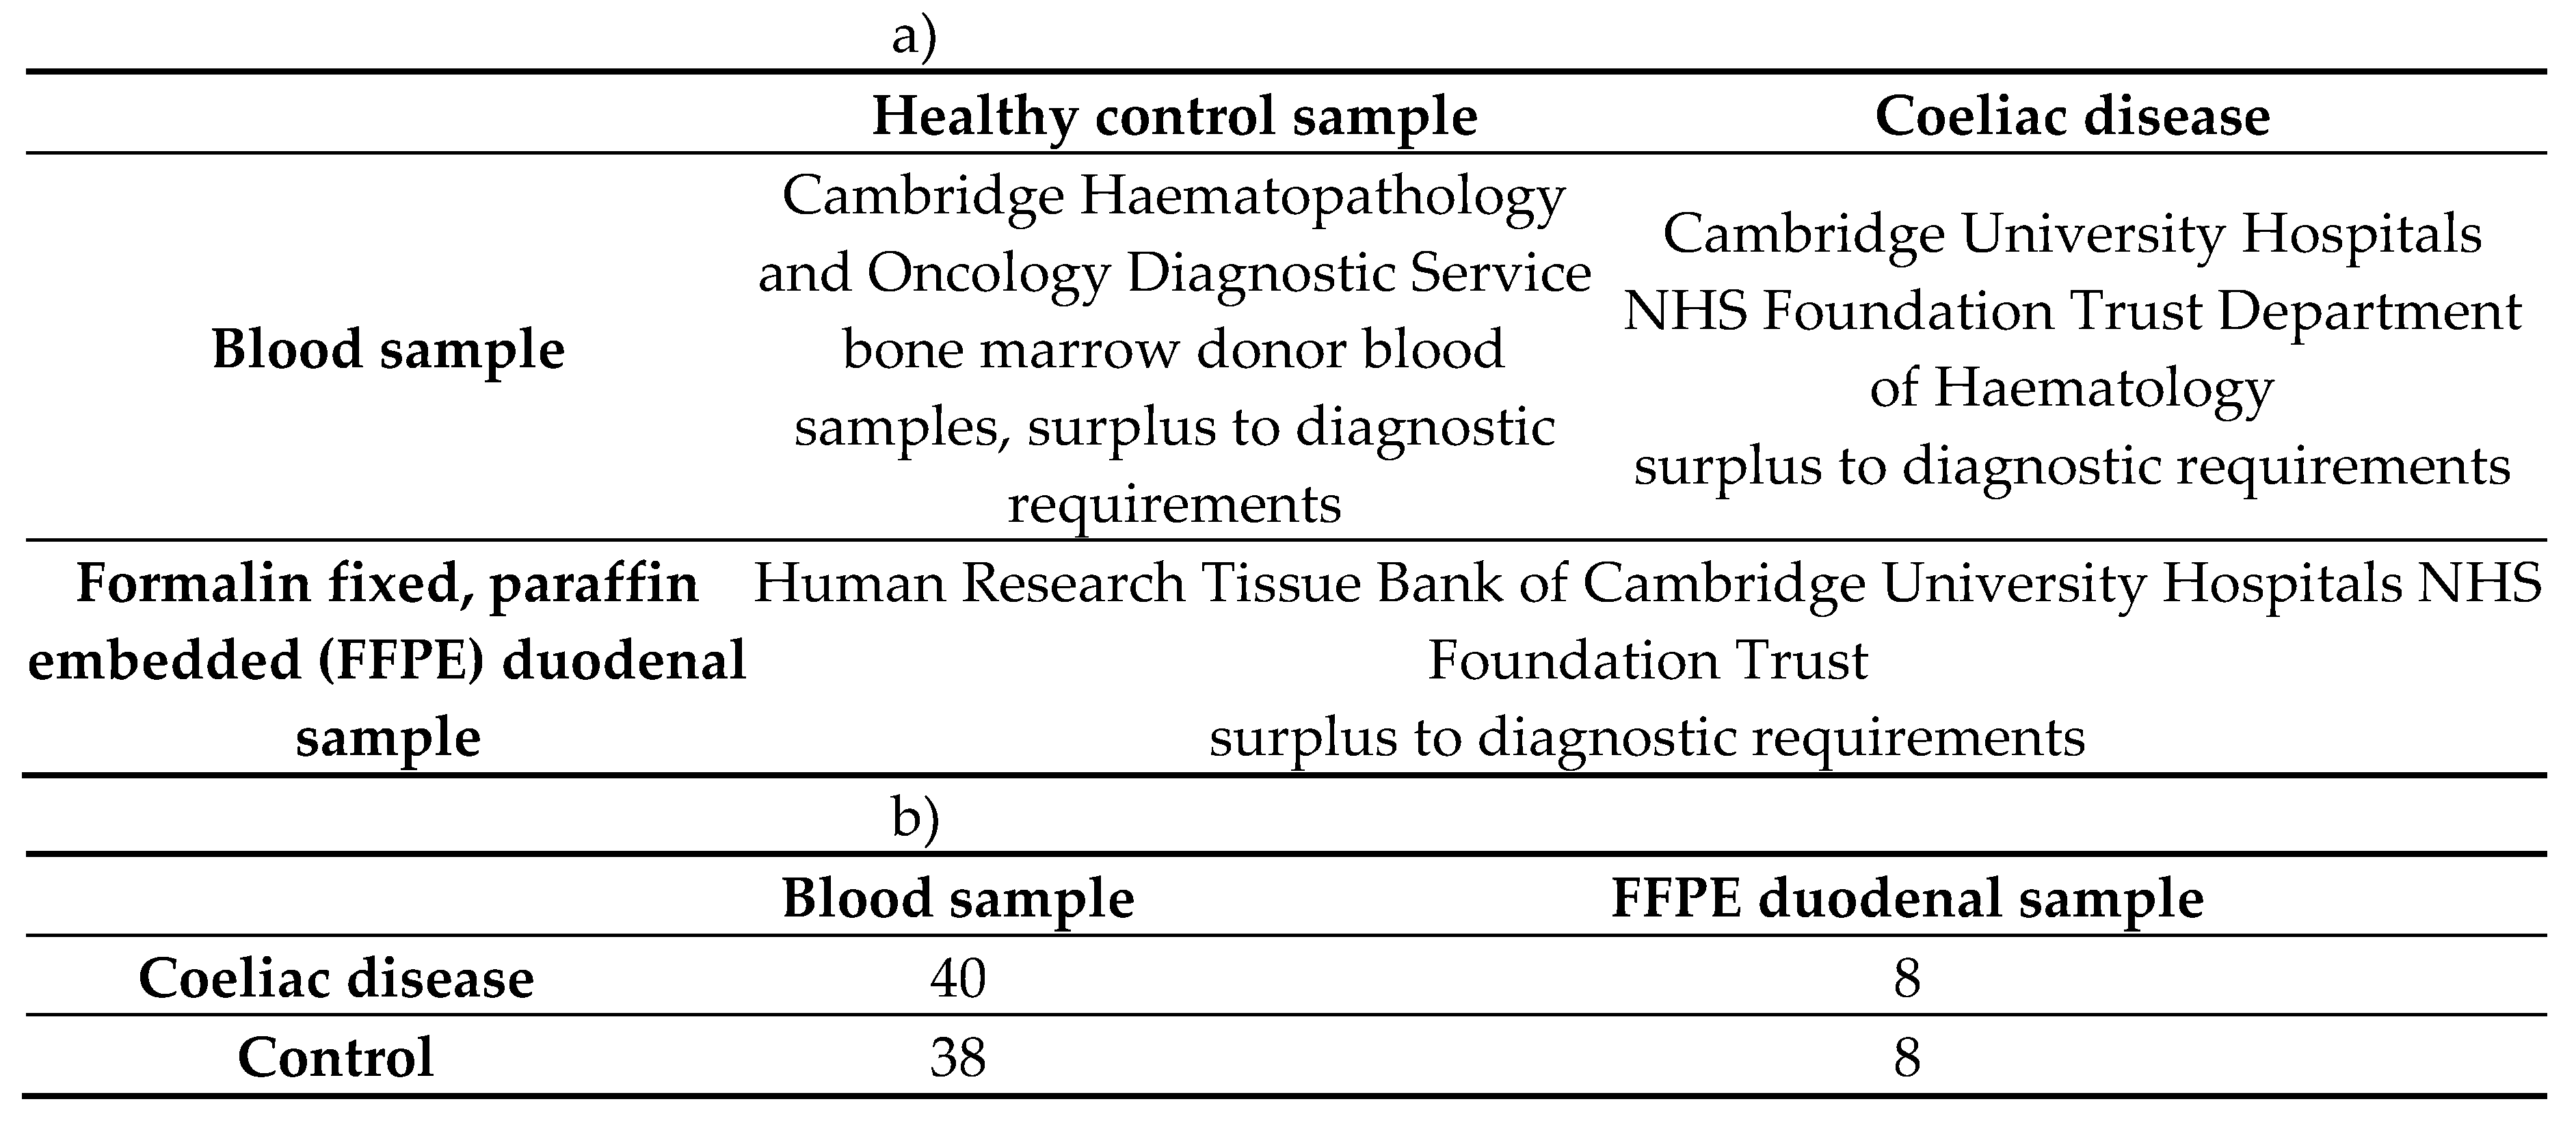 |
4.1.2. Participant Selection for the UK Biobank Single Variant Analysis
For the validation cohort, CeD patients and controls were selected from the anonymised UK Biobank online database using the online Research Analysis Platform (RAP, https://ukbiobank.dnanexus.com/, application ID: 18532). Participants’ sociodemographic, lifestyle, hospital record information, HLA imputation and genome-wide genotyping data were available from the UK Biobank online resource centre (https://biobank.ndph.ox.ac.uk/).
Control and CeD participants were identified using the Cohort Browser program on the RAP, which allowed the selection of participants using a graphical user interface. Control and CeD participants were selected based on their responses to the CeD online questionnaire (data-field 21068, https://biobank.ctsu.ox.ac.uk/crystal/field.cgi?id=21086), the dietary web questionnaire (data-field 20086, https://biobank.ctsu.ox.ac.uk/crystal/field.cgi?id=20086), and their health records, specifically, their hospital inpatient record (category 2000, https://biobank.ctsu.ox.ac.uk/crystal/label.cgi?id=2000) and their death record (category 100093, https://biobank.ctsu.ox.ac.uk/crystal/label.cgi?id=100093). All clinical data of participants were classified using the World Health Organisation’s International Classification of Diseases (ICD) system and made available by the UK Biobank [65]. Although most of the hospital inpatient data were coded in ICD-10, some of the participants, whose data was collected in Scotland before 1997 were described using ICD-9, as outlined in resource 138483 (https://biobank.ndph.ox.ac.uk/ukb/refer.cgi?id=138483).
Control exclusion criteria:
- Filled out CeD online questionnaire
- CeD mentioned in hospital inpatient record or death record
- Malabsorption
- Anaemia
- Lymphocytosis
- On a GFD
- Diarrhoea
Coeliac disease inclusion criteria:
- Hospital diagnosis record includes coeliac disease: ICD9 (5790), ICD10 (K90.0)
- Cause of death includes coeliac disease: ICD10 (K90.0)
After removing individuals with missing data, the finalised UK Biobank cohort consisted of 3094 CeD patients and 29 762 control participants.
4.1.3. Samples Selected for the HV4 Analysis
The sequencing data from three different datasets were used that were selected using the same criteria. A total of 141 CeD and 238 healthy control tissue samples were selected for the HV4 analysis (Table 14).
Table 14.
The coeliac disease and healthy control patient TRG datasets analysed for TRGV usage and HV4 sequence variations. FFPE: formalin fixed, paraffin embedded.
Table 14.
The coeliac disease and healthy control patient TRG datasets analysed for TRGV usage and HV4 sequence variations. FFPE: formalin fixed, paraffin embedded.
| Coeliac disease | Healthy control | Sequencing method | |
| Dataset 1 | 34 FFPE, 12 fresh frozen duodenal | 97 FFPE duodenal | Illumina Miseq micro |
| Dataset 2 | 11 FFPE duodenal | 11 FFPE duodenal | Illumina Miseq |
| Dataset 3 | 84 blood | 130 blood | Illumina NextSeq |
| Combined | 84 blood, 48 FFPE duodenal, 12 fresh frozen duodenal |
130 blood, 108 FFPE duodenal |
NA |
4.2. Analysis of Butyrophilin Family Variation in the Targeted Sequencing Cohort
4.2.1. Gene Selection and Hybridization Probe Design
The Human Protein Atlas (HPA), alongside previous evidence was used to select the butyrophilin family genes of interest to investigate their potential association with CeD predisposition. The expression profiles of the 15 butyrophilin family members outlined by Rhodes, et al. [24] were examined in the HPA in tissues and immune cells that could be involved in CeD pathology. The protein expression in the duodenum, small intestine, rectum, and colon were accessed, or their mRNA expression profiles for gene entries where only the latter was available at the time of analysis (Appendix E, Table E1). The mRNA expression of each butyrophilin gene was also accessed from the HPA in the following immune cell types: T cells, DCs, NK cells, macrophages, regulatory T-cells and γδ T cells (Table E2).
The reliability scores provided by the HPA for each entry was also considered, which is a value based on the reliability between the RNA sequencing and antibody staining data provided by the HPA.
The finalised list of 10 genes of interest were the following: BTN2A1, BTN2A2, BTN3A1, BTN3A2, BTN3A3, BTNL2, BTNL3, BTNL8, ERMAP, MOG.
The Genome Reference Consortium Human Build 38 patch release 12 (GRCh38.p12) genomic position of the 10 butyrophilin genes of interest were determined using the NCBI database [66]. The regions targeted by the hybridization probes included the non-coding and coding regions of the gene, as described by their NCBI entry at the time of creating the hybridization panel. The regions of interest were uploaded to the online Nonacus probe design platform (panel id: 890, Table 15) [67]. To ensure high coverage, 2x tiling was selected, so that each base was covered by 2 probes [68]. Gap fill was selected to cover any repetitive regions in the genes of interest. The submitted custom panel was generated by the best in class integrated algorithms of Nonacus Ltd. These algorithms created probe panels that maximised coverage of the target regions, while avoiding under or over sequencing any regions [69]. The finalised uniform coverage probe panel was approved and ordered for hybridization capture.
Table 15.
The GRCh38.p12 genomic location of the selected butyrophilin genes.
| Gene of interest | Location (GRCh38.p12) |
| BTN2A1 | chr6:26,457,955-26,476,622 |
| BTN2A2 | chr6:26,382,893-26,394,874 |
| BTN3A1 | chr6:26,402,269-26,415,216 |
| BTN3A2 | chr6:26,365,170-26,378,320 |
| BTN3A3 | chr6:26,440,504-26,453,415 |
| BTNL2 | chr6:32,393,339-32,408,879 |
| BTNL3 | chr5:180,988,846-181,006,727 |
| BTNL8 | chr5:180,899,097-180,952,166 |
| ERMAP | chr1:42,817,122-42,844,991 |
| MOG | chr6:29,657,092-29,672,365 |
4.2.2. Library Capture and Sequencing of HLA Loci and Selected Butyrophilin Genes
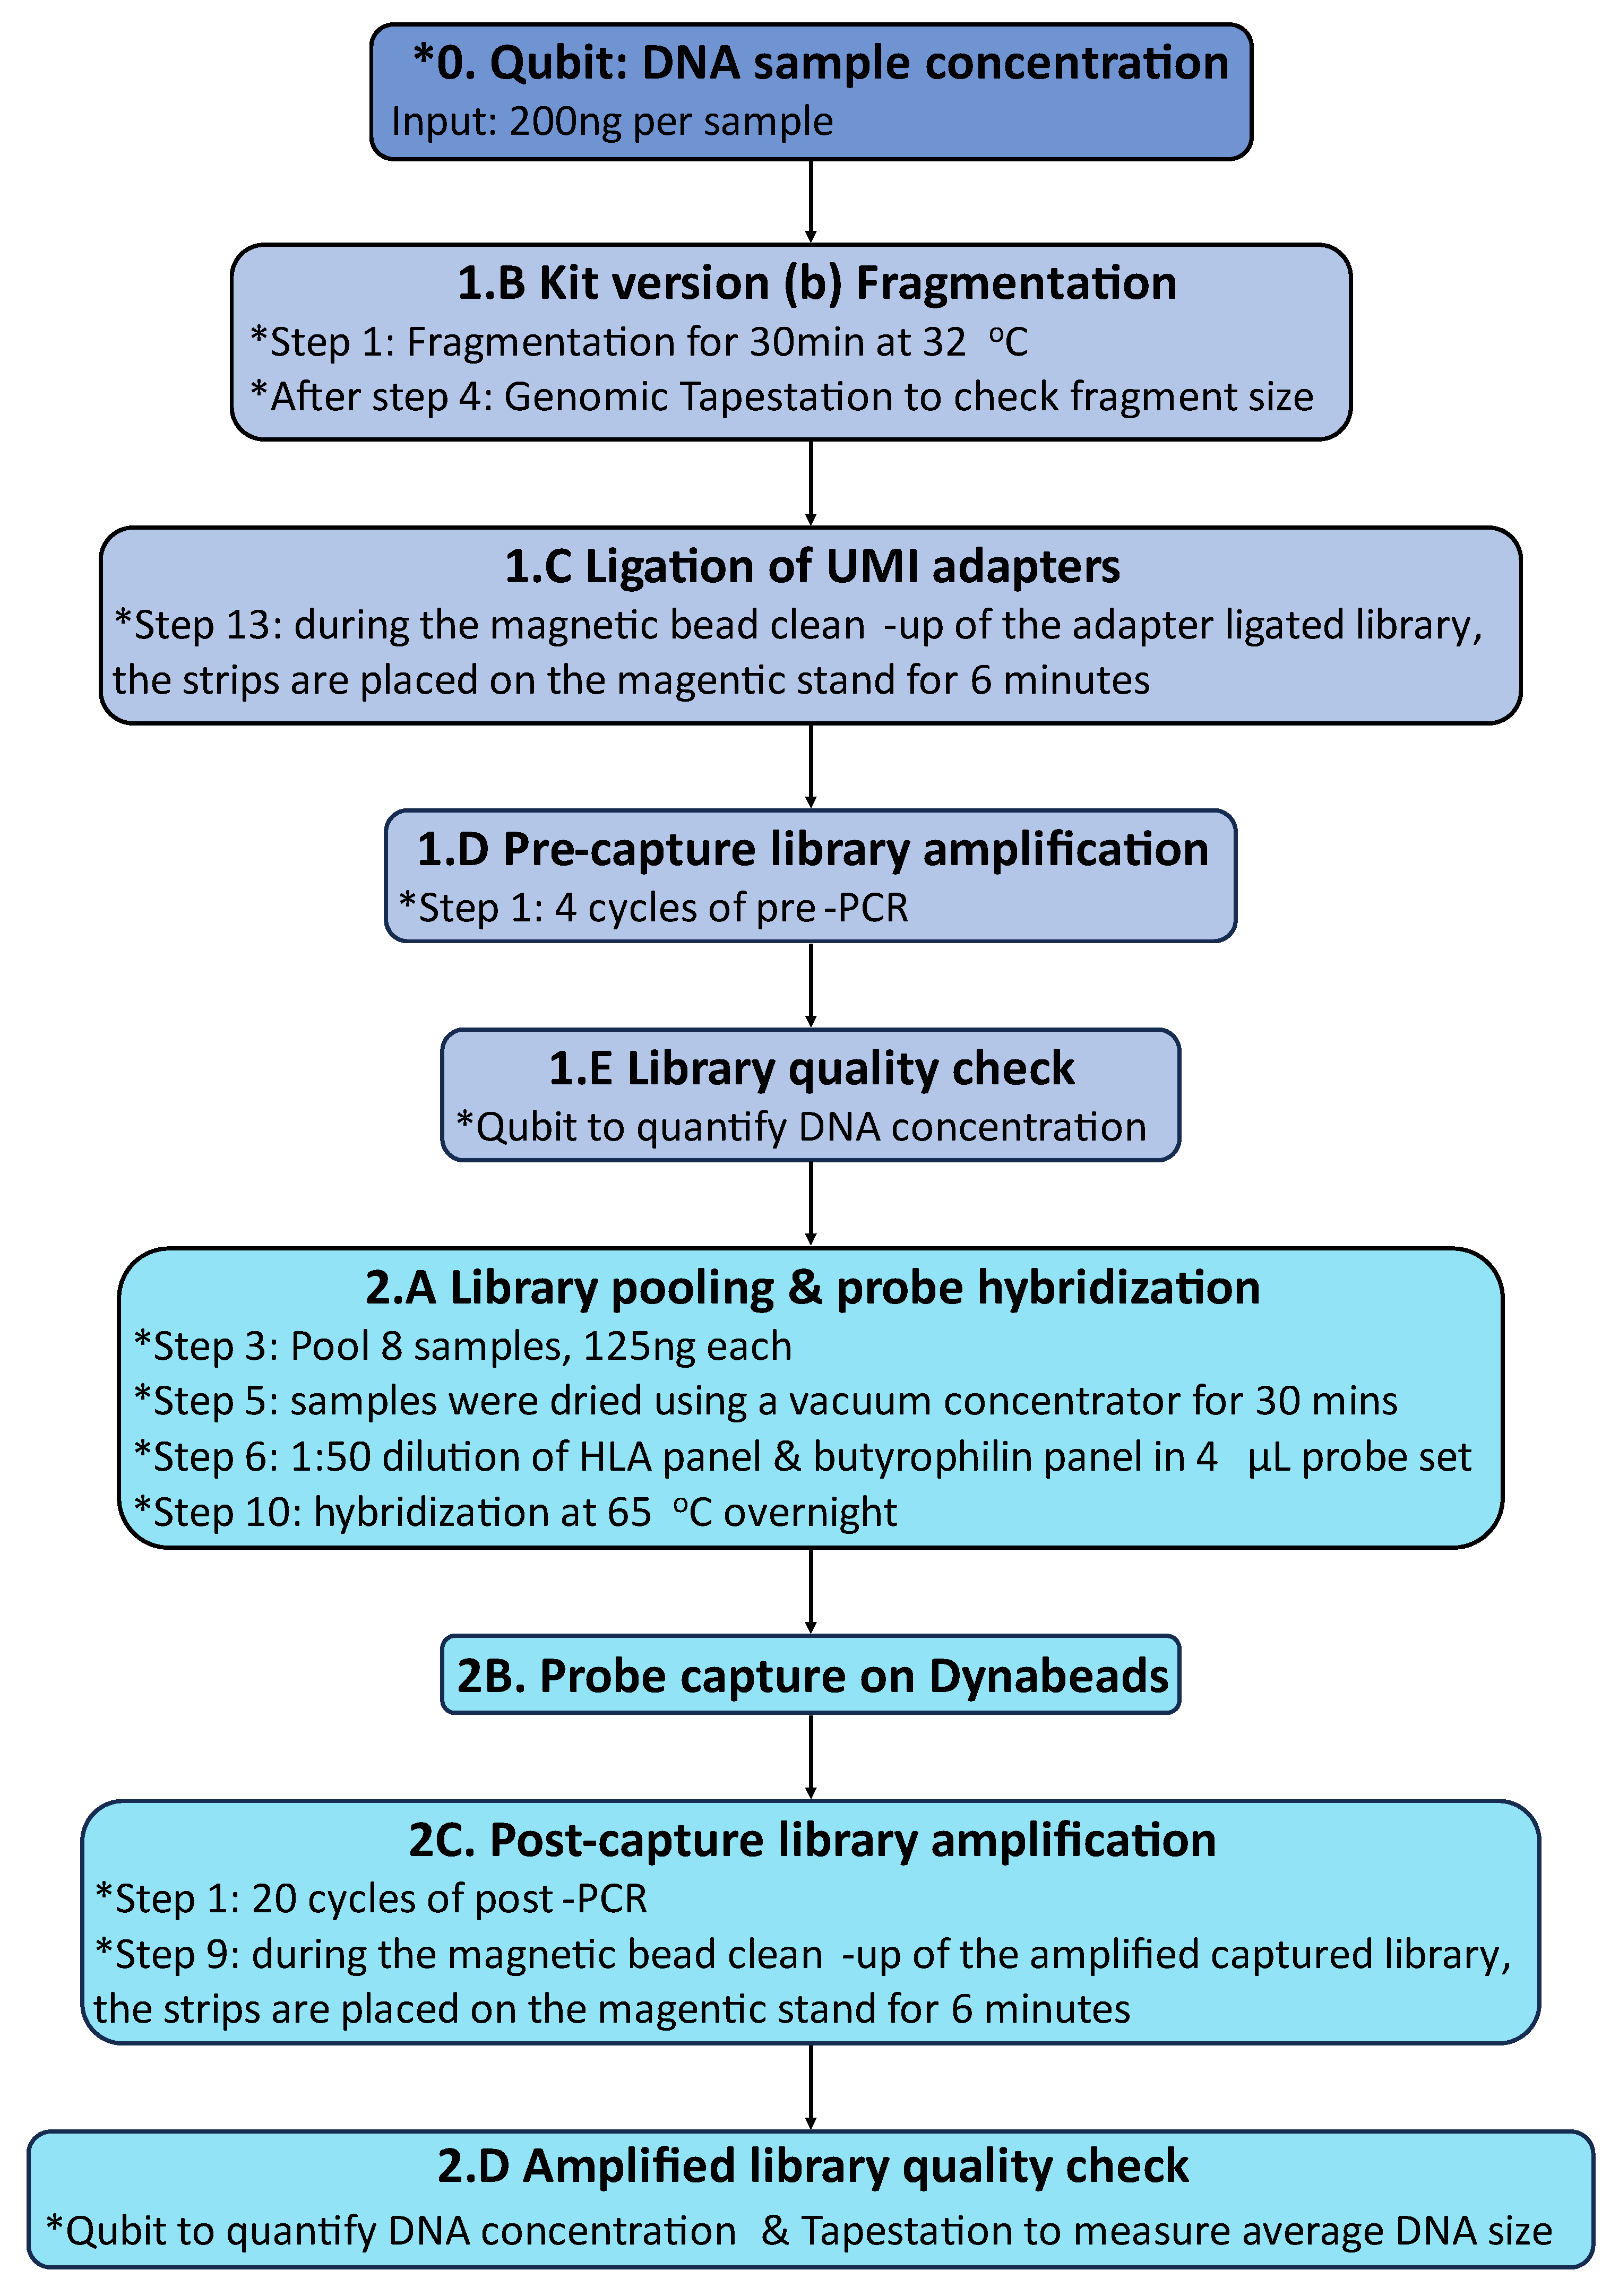
Hybridization capture of healthy control and CeD DNA samples were modified from the Nonacus Cell3 Target Hybridisation & Capture Kit (Nonacus) version (b) protocol (Figure 5, Appendix E.2-E.3). HLA hybridization probes were designed and provided by Nonacus Ltd. The captured butyrophilin and HLA loci library were sent to the Department of Biochemistry, University of Cambridge for sequencing using the Illumina MiSeq system. The targeted genome sequencing data of CeD and control samples are available here: https://zenodo.org/records/15203243.
Figure 5.
The Nonacus Cell3 capture hybridization capture method was modified for the HLA and butyrophilin sequencing panel. All modifications to the manufacturer’s protocol were noted with *. The HLA probes were provided by Nonacus Ltd.
Figure 5.
The Nonacus Cell3 capture hybridization capture method was modified for the HLA and butyrophilin sequencing panel. All modifications to the manufacturer’s protocol were noted with *. The HLA probes were provided by Nonacus Ltd.
4.2.3. Germline Short Variant Discovery and HLA Typing
The quality of the sequencing files was assessed using the default FastQC v0.11.9 settings, and the Illumina adapters were removed using Trimmomatic v0.39 [70,71].
The variant call pipeline was built by adapting the GATK best practices for germline short variant discovery [72], the analysis pipelines of Zhao, et al. [73], the Du group [74,75], and Matthews [76] (Appendix F). The code for the pipeline calling SNPs from the raw unmapped FASTQ sequencing files is available here: https://gitlab.developers.cam.ac.uk/path/soilleux/soilleux-group/ced_butyrophilin_phd/-/tree/dropbox/nonacus_miseq_analysis/variant_call
HLA typing of the sequencing data was carried out separately from the GATK pipeline using HLA-HD version 1.7.0. The adapter trimmed FASTQ files were used as input files, and the default settings were retained for each sample, as outlined in the documentation of the program [77]. The program called the alleles at each HLA locus, and wrote the results for each patient in a text file. Afterwards, the CeD risk associated HLA genotypes were called from the alleles. The code for the risk HLA genotyping is available here: https://gitlab.developers.cam.ac.uk/path/soilleux/soilleux-group/ced_butyrophilin_phd/-/tree/dropbox/nonacus_miseq_analysis/hla_typing
4.2.4. Copy Number Variation (CNV) Analysis of the BTNL8-BTNL3 Loci
The presence of the 56-kb deletion variant in the BTNL8-BTNL3 loci (chr5:180948027-181003596, GRCh38) was analysed by using a surrogate SNP. Dart, et al. [53] were the first to identify the T>C rs72494581 (chr5:181003797, GRCh38) BTNL3 intronic SNP to be associated with the CNV (Table 16). The study proposed that the major allele, the T allele, is associated with the full length BTNL3 and BTNL8 genes, while the minor allele, the C allele, is associated with the BTNL8*BTNL3 deletion. Fisher’s exact test was performed to investigate any significant differences in the presence of the BTNL8-BTNL3 CNV between the CeD and control cohorts of the hybridization capture dataset.
Table 16.
The rs72494581 surrogate SNP was used to infer the CNV at the BTNL8-BTNL3 region of chromosome 5.
Table 16.
The rs72494581 surrogate SNP was used to infer the CNV at the BTNL8-BTNL3 region of chromosome 5.
| rs72494581 genotypes | Associated CNV at BTNL8-BTNL3 region of chromosome 5 | |
| TT | Homozygous for reference allele | Full length BTNL8-BTNL3 region on both copies of chromosome 5 |
| CT | Heterozygous | 1 copy has full length BTNL8-BTNL3 region 1 copy has BTNL8*BTNL3 deletion |
| CC | Homozygous for alternative allele | BTNL8*BTNL3 deletion on both copies of chromosome 5 |
4.2.5. Burden Testing Analysis
The TRAPD program was used for burden testing the variants found in selected butyrophilin genes in samples of the targeted sequencing cohort [54]. To summarise, qualifying variants within a gene were selected, that had a low minor allele frequency or were predicted to be pathogenic. Any qualifying SNPs with more than two alleles, called multi-allelic sites, were split into SNPs with two alleles for the analysis: the reference allele and one of the alternative alleles. These variants are termed bi-allelic variants [55]. The disease risk burden, or the number of minor alleles, in the control and CeD cohorts was counted and compared. The burden testing was performed using dominant models and recessive models in TRAPD. The dominant model considers individuals as carriers for gene burden, if they have at least one qualifying variant from the selected sites within the gene, while the recessive model requires the presence of two or more variants to be labelled a carrier [55]. As gene burden is an additive value, the zygosity of the qualifying sites do not matter, only the number of qualifying variants. For example, in a gene with 3 qualifying sites, an individual who is homozygous for the alternate allele for one qualifying site carries the same amount of gene burden as an individual who is heterozygous for two of the qualifying sites. The analysis was modified from the one described by Guo [55], to adapt it to the this cohort, as the original pipeline used an external control dataset.
The GATK processed sequences were subjected to further preprocessing before being burden tested with TRAPD, as recommended by Guo [55]. First, multi-allelic variants were separated using BCFtools version 1.16, as required by the TRAPD manual [78]. Next, the control and CeD cohort sequencing files were annotated using Ensembl Variant Effect Predictor (VEP) 109.3, and the SNPs were filtered to contain only non-synonymous coding variants [79]. The hybridization capture sequencing files were then analysed after read depth filtering (Figure 6).
Figure 6.
The variants in the CeD cohort (n = 48) were burden tested via the controls (n = 46) using the TRAPD program. Test Rare vAriants with Public Data (TRAPD) was used to burden test the variants in the hybridization capture CeD cohort (n = 48) against the control cohort (n = 46) [54]. The annotated CeD and control files from the GATK pipeline were preprocessed as recommended by the manual [55]. The variants were burden tested after read depth filtering. Steps, in which the code was modified is marked with *.
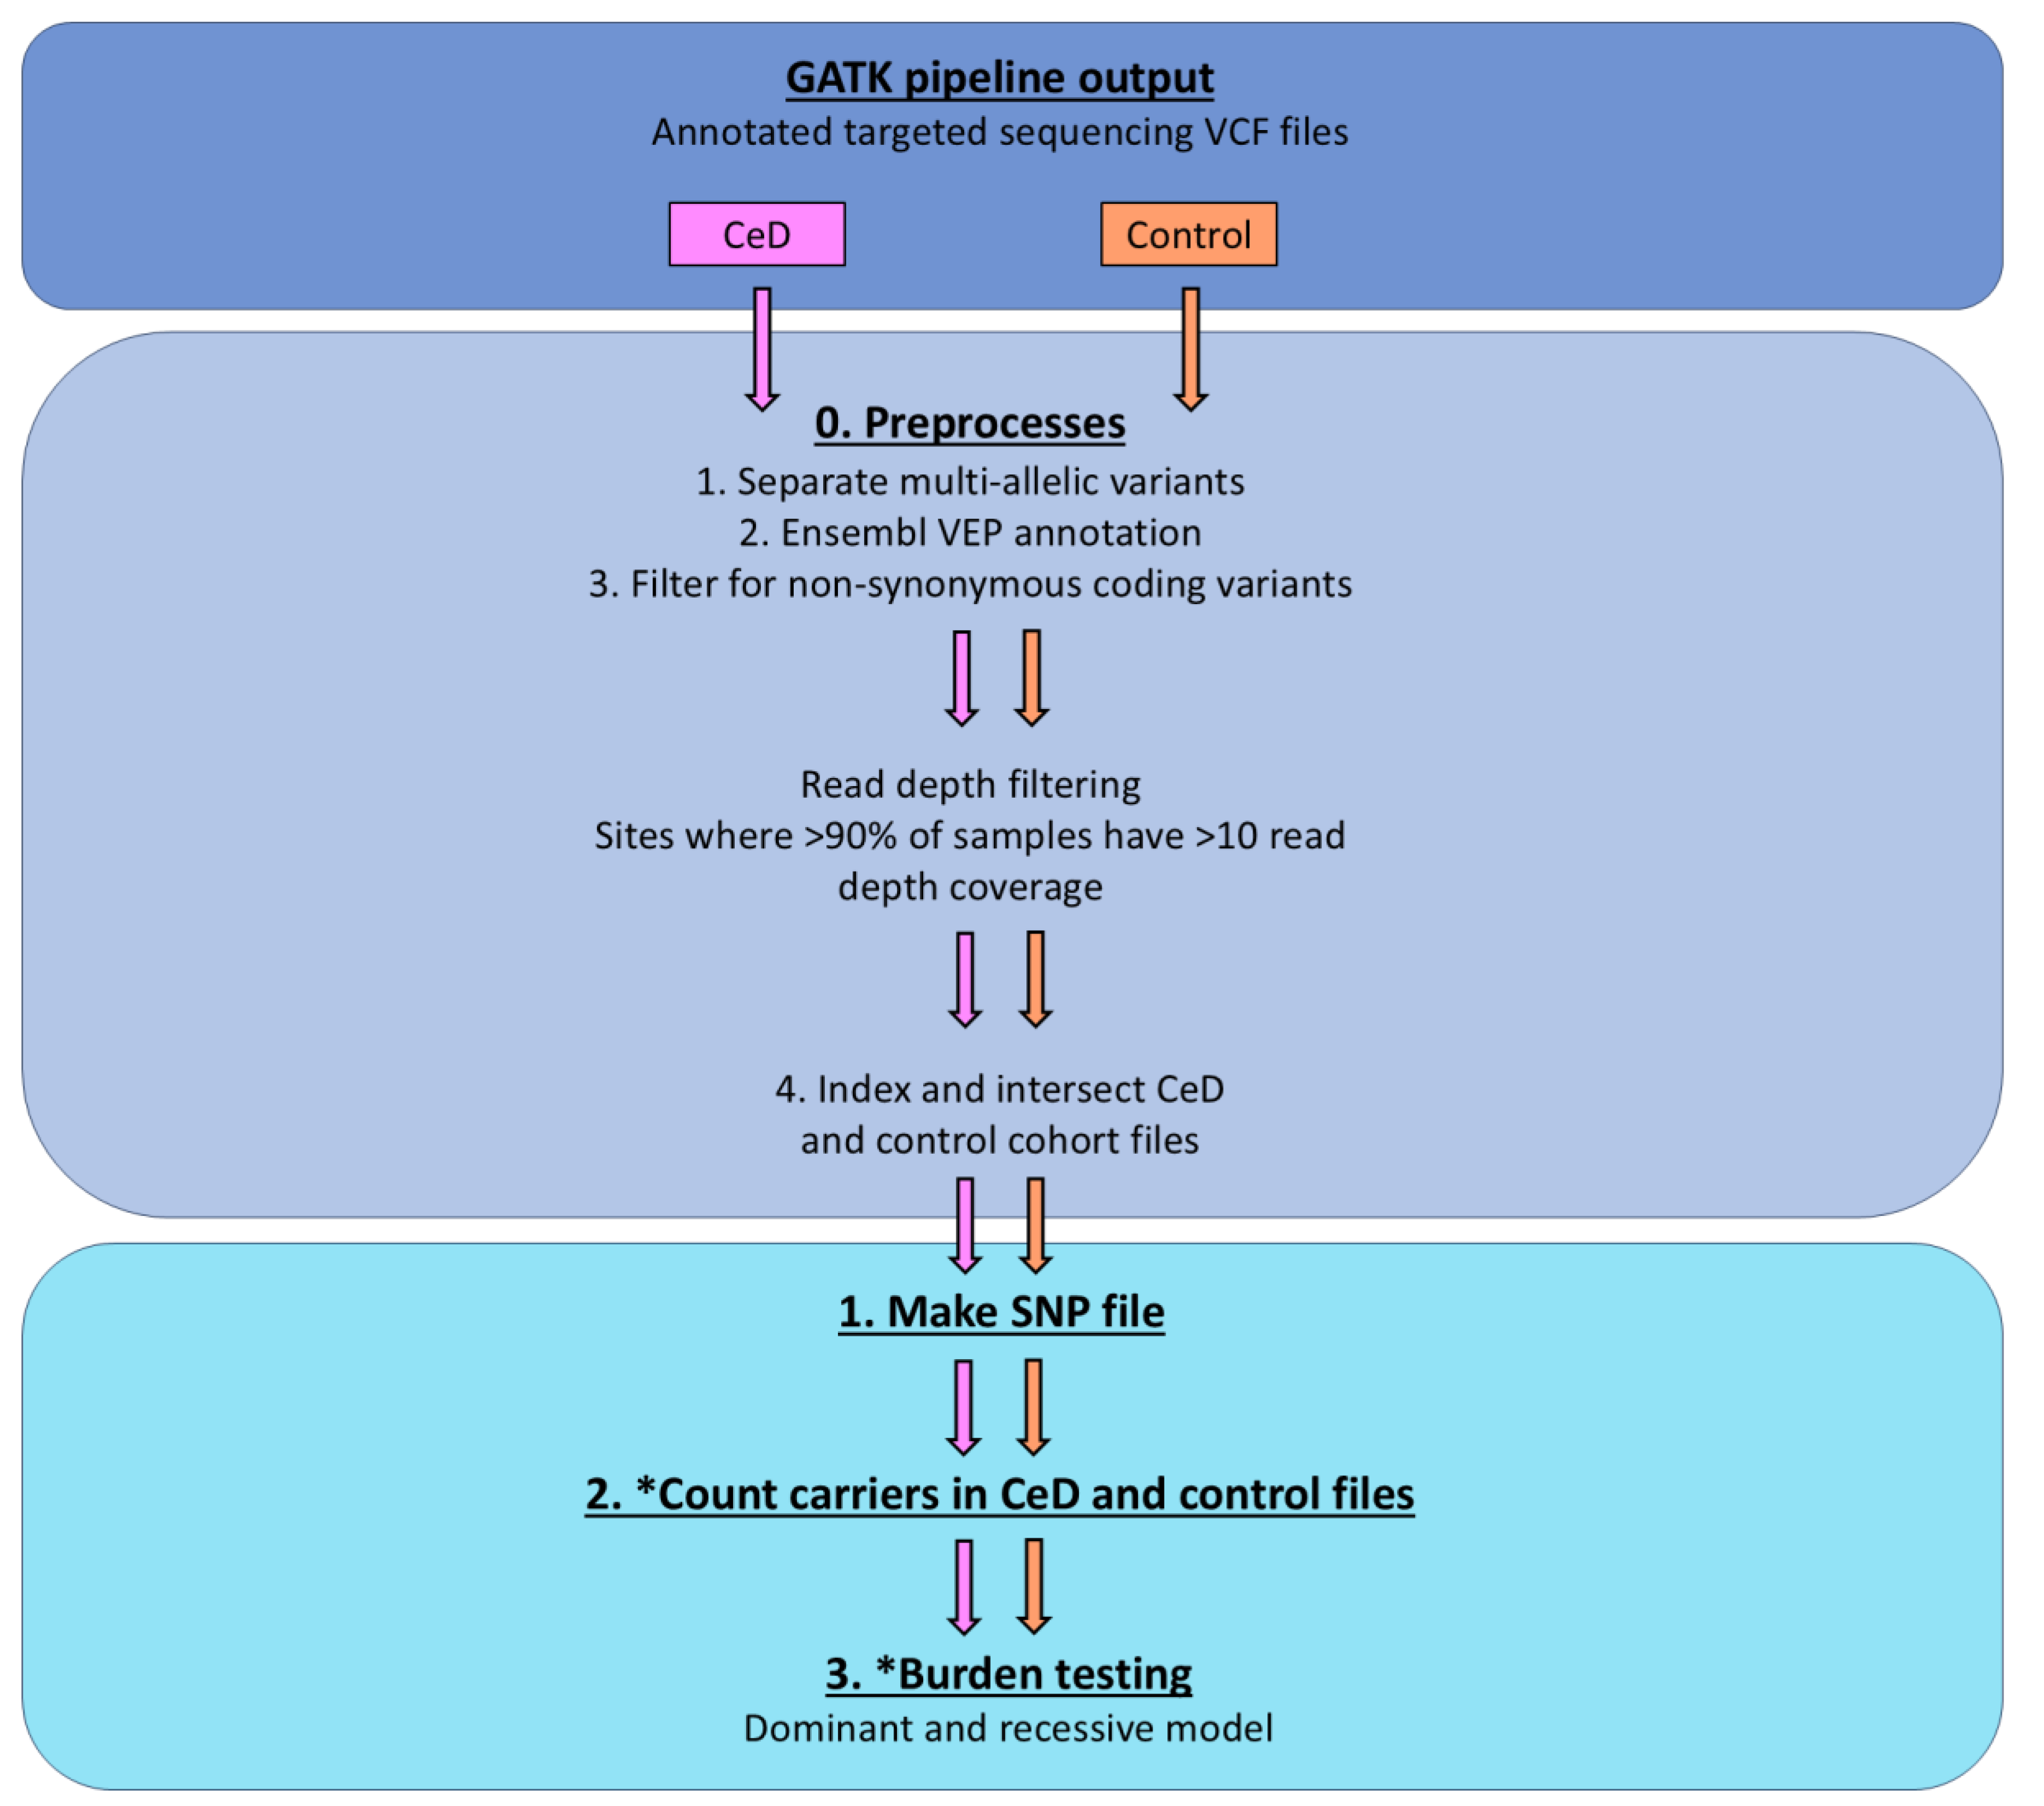
The cohort files were read depth filtered using VEP to select sites, where more than 90% of samples had a read depth coverage of >10. The final step of the preprocessing was to index and intersect the CeD and control sequencing files, to get the common SNPs between the two groups.
Following the preprocessing, the TRAPD code was applied using python 2.7 to create the SNP file from the CeD and the control cohort sequencing files using `make_snp_file.py`, which contains the qualifying variants from each gene. Carriers of the qualifying SNPs from both the control and the CeD files were counted using the `count_cases.py` file. The `burden.R` code was modified to adapt it to the targeted sequencing cohort, as the original pipeline used an external database as the control, while this analysis uses the control sequences from the same cohort. The variants in the CeD and control groups were burden tested using both the recessive and the dominant models.
The burden testing analysis codes are available here: https://gitlab.developers.cam.ac.uk/path/soilleux/soilleux-group/ced_butyrophilin_phd/-/tree/dropbox/nonacus_miseq_analysis/burden_testing/Code
4.3. Single Variant Testing Butyrophilin Family Variance in the UK Biobank Database
4.3.1. CeD Risk Associated HLA Genotyping Using the HLA Imputation Values of the UK Biobank 500,000 Genome-Wide Genotyping Cohort
The HLA typing code using the UK Biobank HLA imputation data is available here: https://gitlab.developers.cam.ac.uk/path/soilleux/soilleux-group/ced_butyrophilin_phd/-/tree/dropbox/ukbiobank_hla_typing/hla_imputation_only
To summarise, the code used the HLA imputation values from data-field 22182. These values describe the likelihood of each HLA genotype, of which 14 were HLA-DQA1 alleles and 18 were HLA-DQB1 alleles. The HLA alleles were imputed by the UK Biobank from SNP data using the HLA*IMP:02 program [80]. In resource 182 (https://biobank.ctsu.ox.ac.uk/crystal/refer.cgi?id=182), the UK Biobank suggested using a threshold value of 0.7. If any HLA allele had an imputation value below 0.7, it was treated as an absent allele. The code applied this posterior threshold on the HLA imputation data for each participant, and the output was a list of HLA alleles that each participant had.
Afterwards, the CeD risk associated HLA genotypes were called from the HLA allele data. The code calling CeD risk genotypes from the HLA imputation derived alleles is available here: https://gitlab.developers.cam.ac.uk/path/soilleux/soilleux-group/ced_butyrophilin_phd/-/blob/dropbox/ukbiobank_hla_typing/hla_imputation_only/ukbhla_fullcohort.ipynb.
To identify if a participant had CeD risk genotypes, the code looked for the presence of the risk alleles at the HLA-DQA1 and HLA-DQB1 loci (Table 17a). Participants who did not have alleles present at either locus were removed from the analysis. The participant was determined to have a CeD associated HLA risk genotype if at least one copy of the risk HLA-DQA1 and the HLA-DQB1 alleles were present. If there were alleles present for more than one HLA risk genotype, the participant was typed as possessing both HLA risk genotypes (Table 17b).
Table 17.
CeD risk associated HLA genotypes were called from the HLA-DQA1 and HLA-DQB1 alleles of UK Biobank participants. a) The CeD risk heterodimers and the HLA-DQA1 and HLA-DQB1 allele combinations encoding them. b) The UK Biobank participants’ potential HLA genotypes depending on their HLA-DQA1 and HLA-DQB1 allele combinations. In the table, P and Q stand for any other allele at the mentioned HLA-DQA1 and HLA-DQB1 loci respectively, where the P/Q alleles together do not encode any CeD risk HLA genotypes.
 |
 |
4.3.2. Single Variant Testing Using Binomial Regression Models
The single variant testing model was built in R version 4.2.1 by adapting the UK Biobank analysis of Yu, et al. [81]. The code for investigating the association between butyrophilin family SNPs and CeD risk in the UK Biobank is available here:
Of note, the UK Biobank individual SNP data was annotated using the reference SNP IDs (rsIDs) from the SNP database (dbSNP) and the reference allele for these SNPs from the Genome Reference Consortium Human Build 37 (GRCh37) [58]. As the SNPs were annotated using the dbSNP instead of their genomic position, and the dbSNP was updated to GRCh38 data at the time of this analysis, the SNP data could be used without further modification.
The individual SNP data in the UK Biobank was provided as the number of dbSNP reference alleles at each site, where 2 indicates that the individual is homozygous for the reference allele, while 1 indicates heterozygosity. If a participant had 0 reference alleles at a site, this could indicate homozygosity for the alternate allele or heterozygosity for two of the alternate alleles, depending on the number of potential alternate alleles. However, at the time of the analysis, the dataset did not provide information on which alternate allele was present.
To summarise the butyrophilin variant association analysis, firstly, the UK Biobank genome-wide genotyping dataset was curated and pre-processed for analysis. The downloaded per-chromosome UK Biobank genotyping data was loaded into R as a BEDMatrix object using the BGData R package [82]. Afterwards, the genotype and phenotype data for the selected UK Biobank participants were merged. Next, data for all SNPs recorded in the BTN2A1, BTN3A1, BTN3A2, BTNL3, BTNL8 human genes were obtained from the National Centre for Biotechnology Information (NCBI) SNP database [66,83]. These SNPs were intersected with the genome-wide genotyping data, to identify the butyrophilin SNPs present in the UK Biobank dataset, which were 27 BTN3A1, 21 BTN3A2, 10 BTNL3, 13 BTNL8, and 30 BTN2A1 SNPs. The final butyrophilin genotyping data in the UK Biobank dataset were provided as count data for the number of reference alleles at each SNP, identified by their rsIDs. Due to multiple testing, the resulting p-values were adjusted using Bonferroni correction.
Secondly, the association between butyrophilin variants and CeD risk was tested using binomial regression models, or binomial generalised linear models. In all of the linear models, the response variable was CeD status (CeD or no CeD, Table 18). The assumptions of the tests were that predictor variables were independent of each other. In the first test, the association between CeD risk HLA genotypes and CeD status was tested using one binomial model. In the second group of tests, individual binomial models were used to analyse the association between each butyrophilin family SNP and CeD risk. In the third group of tests, iterative binomial models were used that analysed the combined effect of butyrophilin family SNPs and HLA risk genotypes on CeD risk. In the fourth group of tests, the association between butyrophilin SNPs and CeD risk were analysed in HLA-matched groups.
Table 18.
The binomial models tested the association between HLA risk genotypes and/or the individual butyrophilin family SNPs. Due to multiple testing, the resulting p-values were adjusted using Bonferroni correction. Abbreviations: CeD: coeliac disease; HLA: human leukocyte antigen; SNP: single nucleotide polymorphism.
| Test/group number | Association being tested | Predictor variable(s) | Response variable |
| First test | Association between HLA risk genotypes and CeD risk |
HLA risk genotype: See Table 17 |
CeD status: CeD or control |
| Second group of tests (101 models) | Association between individual butyrophilin SNPs and CeD risk | Butyrophilin SNP: 2 reference alleles 1 reference allele 0 reference allele |
CeD status: CeD or control |
| Third group of tests (101 models) | Association between the combined effect of HLA genotypes and butyrophilin SNPs and CeD risk |
HLA risk genotype: See Table 17 Butyrophilin SNP: 2 reference alleles 1 reference allele 0 reference allele |
CeD status: CeD or control |
| Fourth group of tests | Association between butyrophilin SNPs and CeD risk in HLA-matched groups | Butyrophilin SNP: 2 reference alleles 1 reference allele 0 reference allele |
CeD status: CeD or control |
Thirdly, the risk ratio or odds ratio (OR), the p-value, and the 95% confidence intervals were calculated for each binomial model assessing the association between butyrophilin SNPs and CeD risk. The direction of each SNP was calculated from the natural logarithm of the OR values (ln(OR)). SNPs where ln(OR) < 1 indicated that the SNP decreased CeD risk. SNPs where ln(OR) >1 indicated that the SNP increased CeD risk. Due to multiple testing, Bonferroni correction was applied for each group of tests.
Finally, the rsnps R package was used to annotate the butyrophilin family SNPs in the UK Biobank significantly associated with CeD using the NCBI database [84].
4.4. Analysis of TRGV Usage and HV4 Variation in CeD and Control Samples
4.4.1. Processing Samples and TCR Sequencing
The methods of DNA extraction, bulk amplification, and sequencing of the TCR repertoires in dataset 1 and dataset 2 were described in Foers, et al. [59] (Table 14). The DNA from FFPE duodenal samples and from fresh frozen duodenal samples were extracted using the QiaAmp FFPE DNA kit (Qiagen) and the DNeasy Blood & Tissue Kit (Qiagen) respectively, according to manufacturer’s instructions.
Hybridization capture probes were designed for the targeted sequencing of the TCR repertoires of dataset 3. Capture probes were designed against the 3’ end of all productive V segments and the 5’ end of all productive J segments available on IMGT, according to their genomic position in the GRCh38.p13 reference genome [85]. Four capture probes (120 bp long) were designed for each productive segment, with the first probe to anneal 10 bp away from the junctional end, with subsequent probes 6 bp away from the previous one. The designed custom probe panel was sent for manufacturing to Nonacus Ltd.
Samples were prepared for hybridization capture using the Cell3 Target Library Preparation Kit (b) (Nonacus Ltd) according to the manufacturer’s instructions. DNA was extracted from the blood samples using the DNeasy Blood & Tissue Kit (Qiagen) according to manufacturer’s instructions. Hybridization capture of the pooled libraries were carried out in two stages using the Target Hybridisation & Capture Kit protocol (Nonacus Ltd). First, the J probes were incubated with the pooled library (95⁰C for 30 s, 65⁰C for 4 hours), followed by bead cleanup according to manufacturer’s instructions. The sequences were subjected to 20 cycles of PCR amplification, after which the DNA was quantified using the Qubit 2.0 fluorometer (Invitrogen). Next, 500 ng of the pooled library was captured using the V probes, subjected to bead clean up and further 10 cycles of PCR. The captured TCR repertoire libraries were Illumina MiSeq platforms according to standard protocols.
4.4.2. TRGV and HV4 Analysis Pipeline
All the sequencing files were subjected to the same TRGV and HV4 analysis pipeline. Due to the gene rearrangement of the TCR, each mature T cell was assumed to carry one unique TCR combination, encoded by a unique pairing of TRGV and TRGJ genes in that T cell’s genome. In the first step of the analysis pipeline, the paired-end FASTQ files containing the TRG sequencing data were analysed using MiXCR v4.0.0 (Figure 7). MiXCR is an immune profiling software that analyses raw T or B cell receptor repertoire NGS data [86,87]. At the time of analysis, the software had a built-in reference library, and could identify the clonotypes and gene segments used in the repertoire. The `analyze amplicon` was a one-step command that aligned the sequencing data, assembled and exported the clonotypes found in the TCR repertoire. For the purposes of analysing the germline HV4 sequence, the region of interest was set to include the FR3 of the TRGV genes (`--region-of-interest {FR3Begin:CDR3End}`). The resulting text file contained the nucleotide sequence (`targetSequences`), amino acid sequence (`aaSeq`), clone count (`cloneCount`), V and J segment usage (`allVHitsWithScore`, `allJHitsWithScore`) for each unique TRG sequence. The results from the MiXCR output were analysed using the pipeline available here:
Figure 7.
CeD and healthy control patient TRG sequencing data from three cohorts were used to analyse differences in TRGV usage and germline HV4 sequences.
Figure 7.
CeD and healthy control patient TRG sequencing data from three cohorts were used to analyse differences in TRGV usage and germline HV4 sequences.
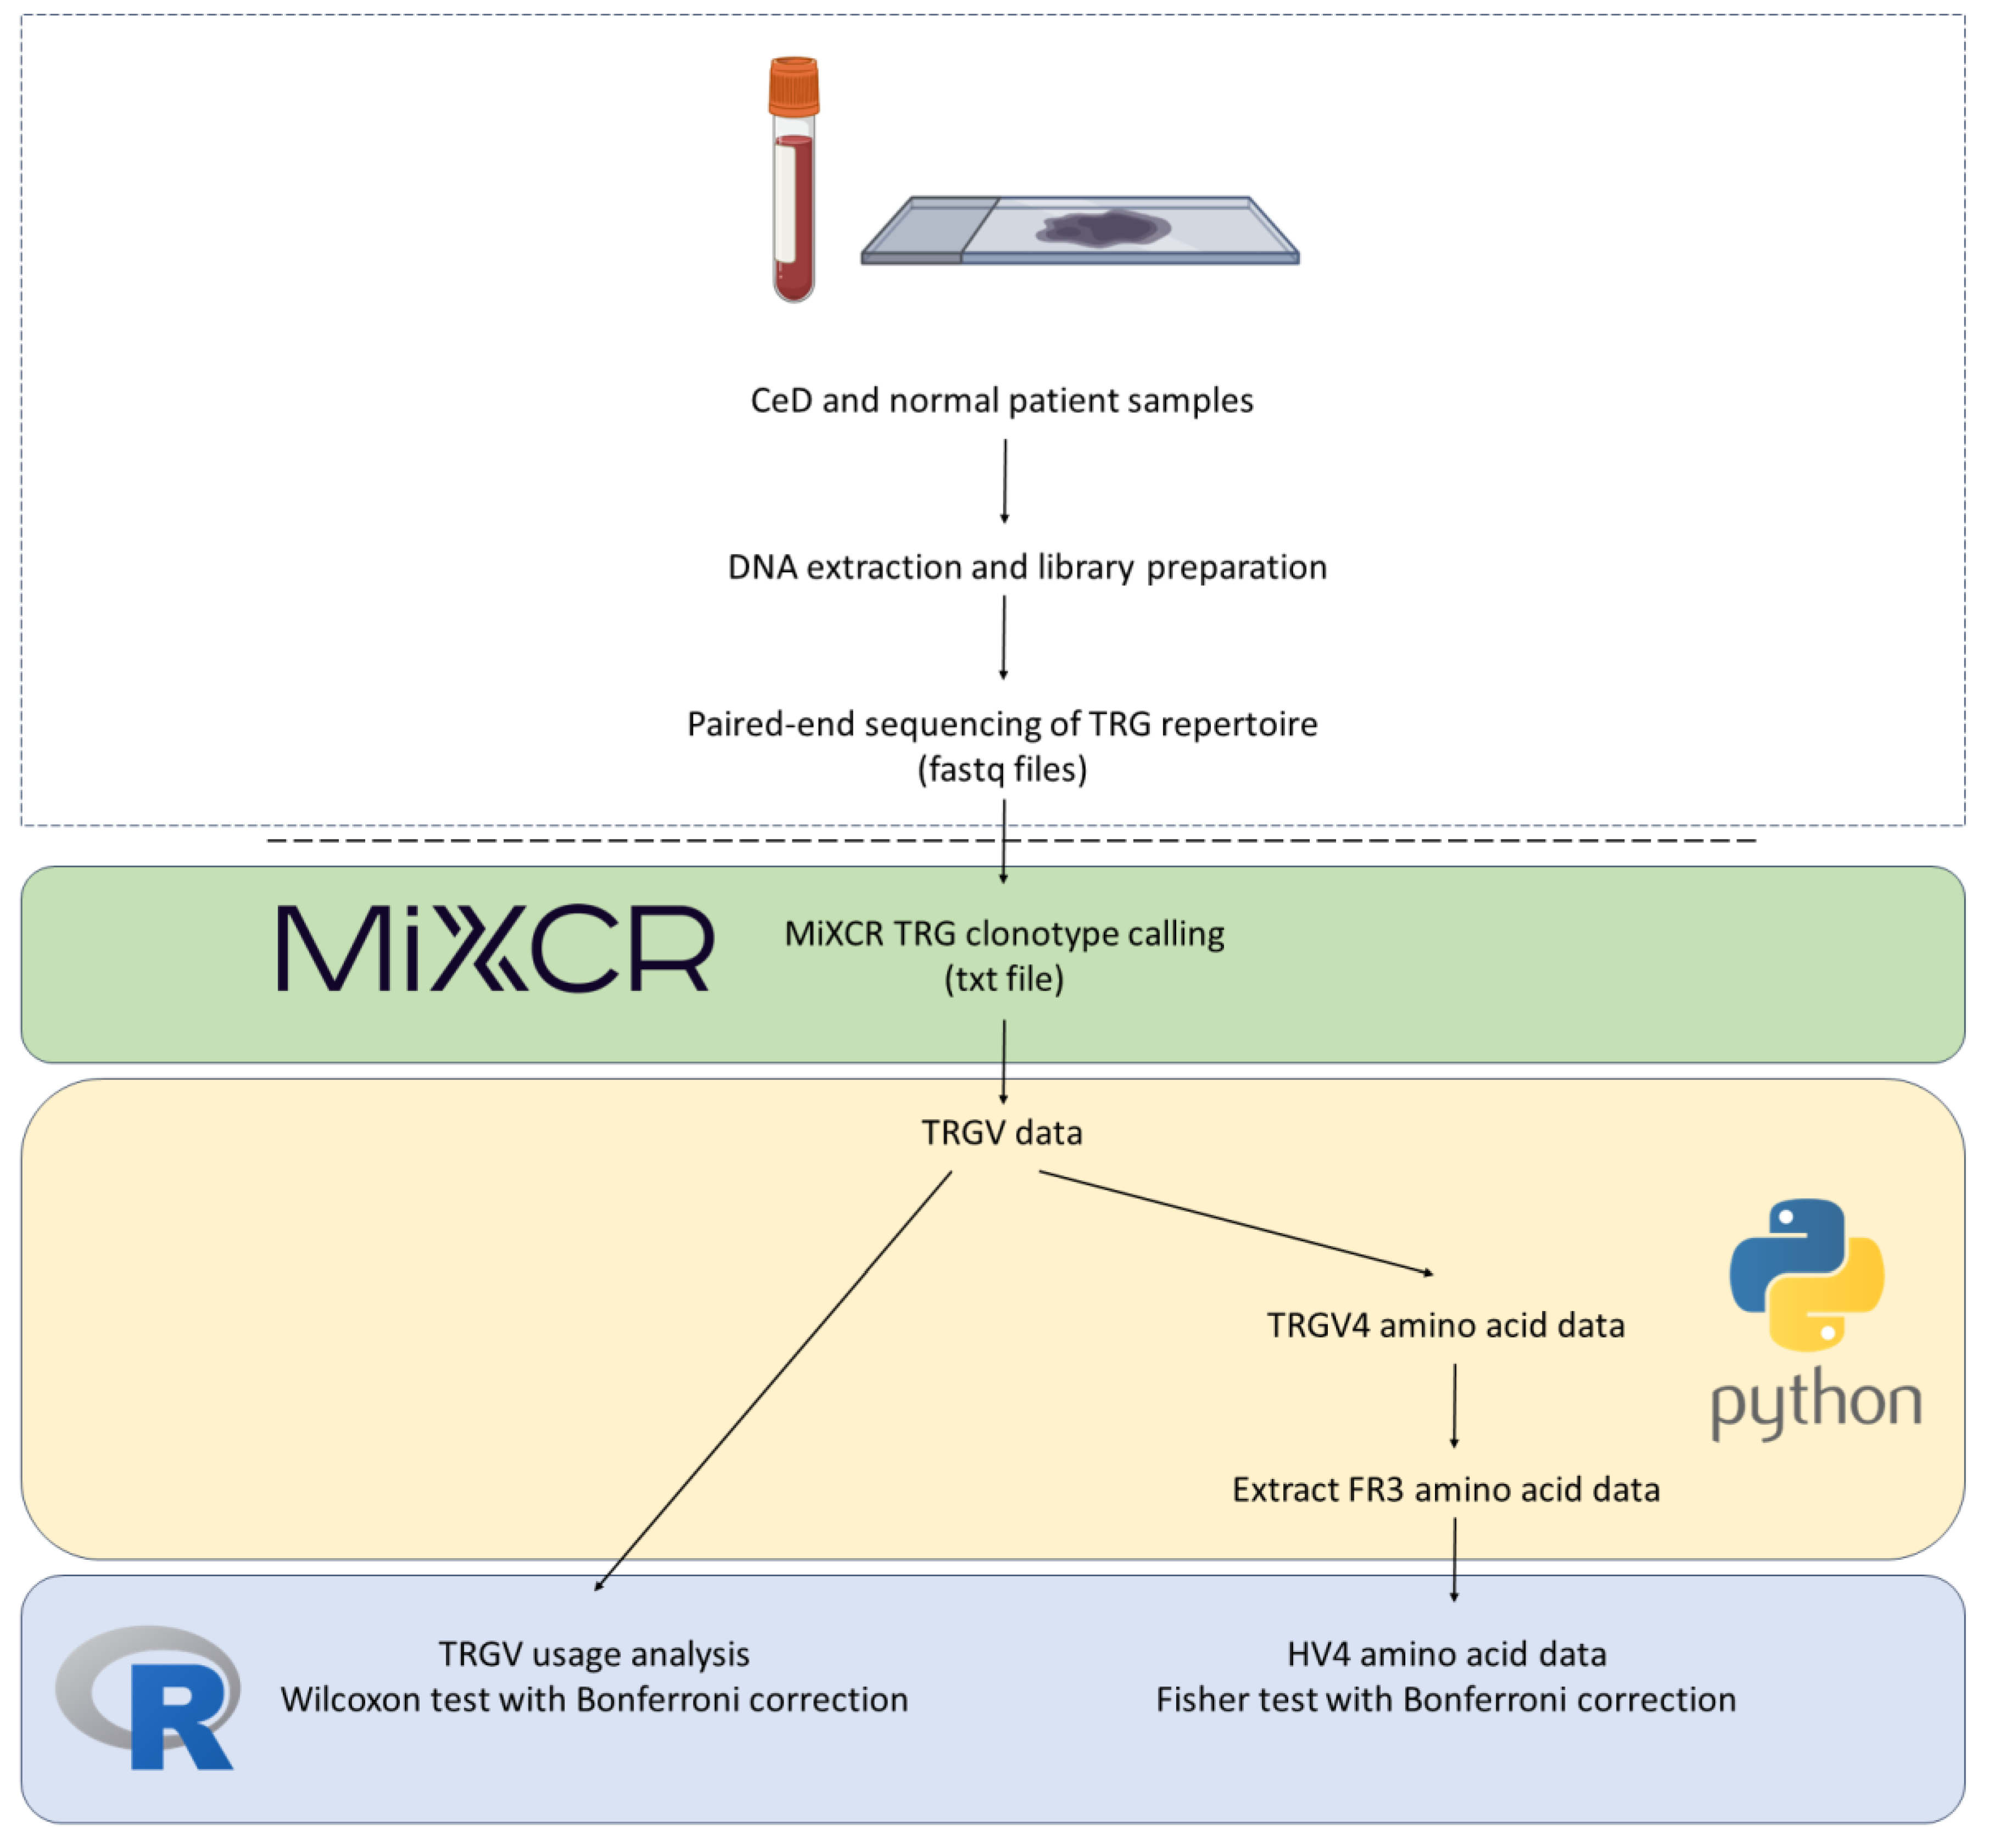
To identify the differences in the TRGV usage of the duodenal TRG repertoire, the read count of the TRGV section (`allVHitsWithScore`) from the MiXCR output was processed using Python 3. Only samples from the duodenum were analysed for TRGV usage. Therefore, TRGV data from blood samples were not subjected to TRGV usage analysis.
To examine if the TRGV usage was significantly different between duodenal sample types, pairwise Mann-Whitney U tests were carried out for each of the 10 TRGV segments. To eliminate any false positives due to multiple testing, Bonferroni correction was applied to the p-values. For each test, the proportion of the specific TRGV segment was compared between the different sample types.
The germline HV4 analysis was carried out using Python 3, by identifying variations in the amino acid sequence that directly binds BTNL3 [29,31]. The HV4 reference amino acid sequence “KYDTYGSTRKNLRMILR” was demonstrated to be capable of binding BTNL3 [29,31]. For brevity, the reference sequence was named the WT sequence. To summarise the HV4 analysis, clonotypes with TRGV4 segments were selected in each participant’s sequencing data. Next, the amino acid sequence of the germline FR3 was isolated. The HV4 was described as the amino acids 10-25 in the FR3 by Willcox, et al. [31], so these positions were used for further HV4 analysis. As the HV4 is encoded by the germline TRGV4 gene, each patient has two HV4 alleles. Therefore patients can be homozygous or heterozygous for the amino acid sequence of the HV4 loop. For this reason, CeD patient samples were grouped together regardless of their sample type (FFPE duodenum, or fresh frozen duodenum, or blood), as the source of the samples did not affect the germline-encoded HV4 alleles. The top two unique HV4 amino acid sequences were selected with the highest read counts in each sample. In some patients, there were more than two HV4 amino acid sequences present. This could be due to library preparation and sequencing errors. To avoid including artefacts in the analysis, the percentage of each HV4 sequence was calculated, and 10% was used as a cutoff percentage for heterozygosity. If the HV4 sequence with the second highest read count had less than 10% frequency, the sequence was excluded, and the patient was assigned as homozygous for the most frequent HV4 sequence.
Fisher’s exact test was applied to analyse if there were significant differences in the proportion of germline-encoded HV4 amino acid sequences between CeD and healthy control samples. As the sample size for all datasets were less than 1000, Fisher’s test was used instead of the chi-square test [88]. As this analysis required germline sequences, the tissue of origin of the samples did not matter. Therefore all samples could be subjected to HV4 analysis. Bonferroni correction was applied to eliminate false positives due to multiple testing.
Supplementary Materials
The following supporting information can be downloaded at the website of this paper posted on Preprints.org. Appendix A: Supplementary materials for Results section 2.1; Appendix B: Demographic data of the selected UK Biobank participants; Appendix C: Supplementary materials for Results section 2.2; Appendix D: Supplementary materials for Results section 2.3; Appendix E: Selecting and sequencing the butyrophilin genes of interest; Appendix F: Detailed germline short variant discovery protocol.
Author Contributions
Conceptualization, E.J.S.; methodology, K.N.L.H., S.E., H.K., K.D., L.S., K.P., A.F.; software, K.N.L.H., T.W., H.K., A.F.; validation, K.N.L.H., A.F. and E.J.S.; formal analysis, K.N.L.H., A.F.; investigation, K.N.L.H., K.D., S.E.; resources, E.J.S., A.F.; data curation, K.N.L.H., S.E., K.D.; writing—original draft preparation, K.N.L.H..; writing—review and editing, T.W., E.J.S.; visualization, K.N.L.H.; supervision, E.J.S.; project administration, E.J.S.; funding acquisition, E.J.S. All authors have read and agreed to the published version of the manuscript.
Funding
This research was funded by the PhD scholarship of the Department of Pathology, University of Cambridge, and a joint grant from Coeliac UK and Innovate UK to Nonacus Ltd and EJS (INOV01-18). KNLH also received a Sponsored Dissertation Grant from Coeliac UK. The Cambridge University Hospitals Human Research Tissue Bank is supported by the NIHR Cambridge Biomedical Research Centre (NIHR203312).
Institutional Review Board Statement
The study was conducted in accordance with the Declaration of Helsinki, and approved by the Oxfordshire Research ethics Committee A (IRAS project ID: 162057, REC reference: 04/Q1604/21, Principal Investigator: Professor E. Soilleux).
Informed Consent Statement
Study-specific patient consent was not required under the terms of our ethical approval.
Data Availability Statement
We encourage all authors of articles published in MDPI journals to share their research data. In this section, please provide details regarding where data supporting reported results can be found, including links to publicly archived datasets analyzed or generated during the study. Where no new data were created, or where data is unavailable due to privacy or ethical restrictions, a statement is still required. Suggested Data Availability Statements are available in section “MDPI Research Data Policies” at https://www.mdpi.com/ethics. Targeted sequencing data of selected butyrophilin family genes in a cohort of 94 samples (2.1): https://zenodo.org/records/1520324 γδ TCR sequencing data of 46 CeD and 97 healthy control duodenal samples (Dataset 1, Table 14): https://dataview.ncbi.nlm.nih.gov/object/PRJNA1330789?reviewer=sp7hjkohgpbo6mt3qv7thd57fp γδ TCR sequencing data of 11 CeD and 11 healthy control duodenal samples (Dataset 2, Table 14): https://dataview.ncbi.nlm.nih.gov/object/PRJNA1330746?reviewer=dcl0ipo3ftc3m83b637i0hjmpd γδ TCR sequencing data of 84 CeD and 130 healthy control blood samples (Dataset 3, Table 14): https://dataview.ncbi.nlm.nih.gov/object/PRJNA1330754?reviewer=uoqvavqemvh35apdc0ifn99585
Acknowledgments
We are grateful to the Haematopathology and Oncology Diagnostic Service (HODS), Cambridge University Hospitals NHS Foundation Trust, for provision of patient DNA samples. We thank the Cambridge University Hospitals NHS Foundation Trust Human Tissue Research Biobank (HTRB) for provision of patient tissue samples. We thank the patients, without whom this research would not have been possible. This research has been conducted using the UK Biobank Resource under Application Number 18532. We thank the participants of the UK Biobank.
Conflicts of Interest
L.S. and K.P. are employees of Nonacus Ltd. The other authors declare no conflicts of interest.
Abbreviations
The following abbreviations are used in this manuscript:
| BTN/BTNL | Butyrophilin/butyrophilin-like |
| CeD | Coeliac disease |
| CNV | Copy number variation |
| DC | Dendritic cell |
| GFD | Gluten-free diet |
| FFPE | Formalin fixed, paraffin embedded |
| HLA | Human leukocyte antigen |
| HPA | Human Protein Atlas |
| HV4 | Hypervariable region 4 |
| IEL | Intraepithelial lymphocyte |
| NK cell | Natural Killer cell |
| TRGV | T cell receptor γ variable region |
| SNP/SNV | Single nucleotide polymorphism/variation |
| WT | Wild type |
Appendix A – Supplementary Materials for Results Section 2.1
Figure A1.
CeD patients (n = 46) had significantly higher proportions of CeD risk HLA genotypes compared to controls (n = 48). The a) number and b) percentage of individuals with CeD risk associated HLA genotypes were significantly higher in CeD patients compared to controls in this dataset (Fisher’s exact test, p = 5.5e-10). The HLA genotypes for participants were called using HLA-HD [52].
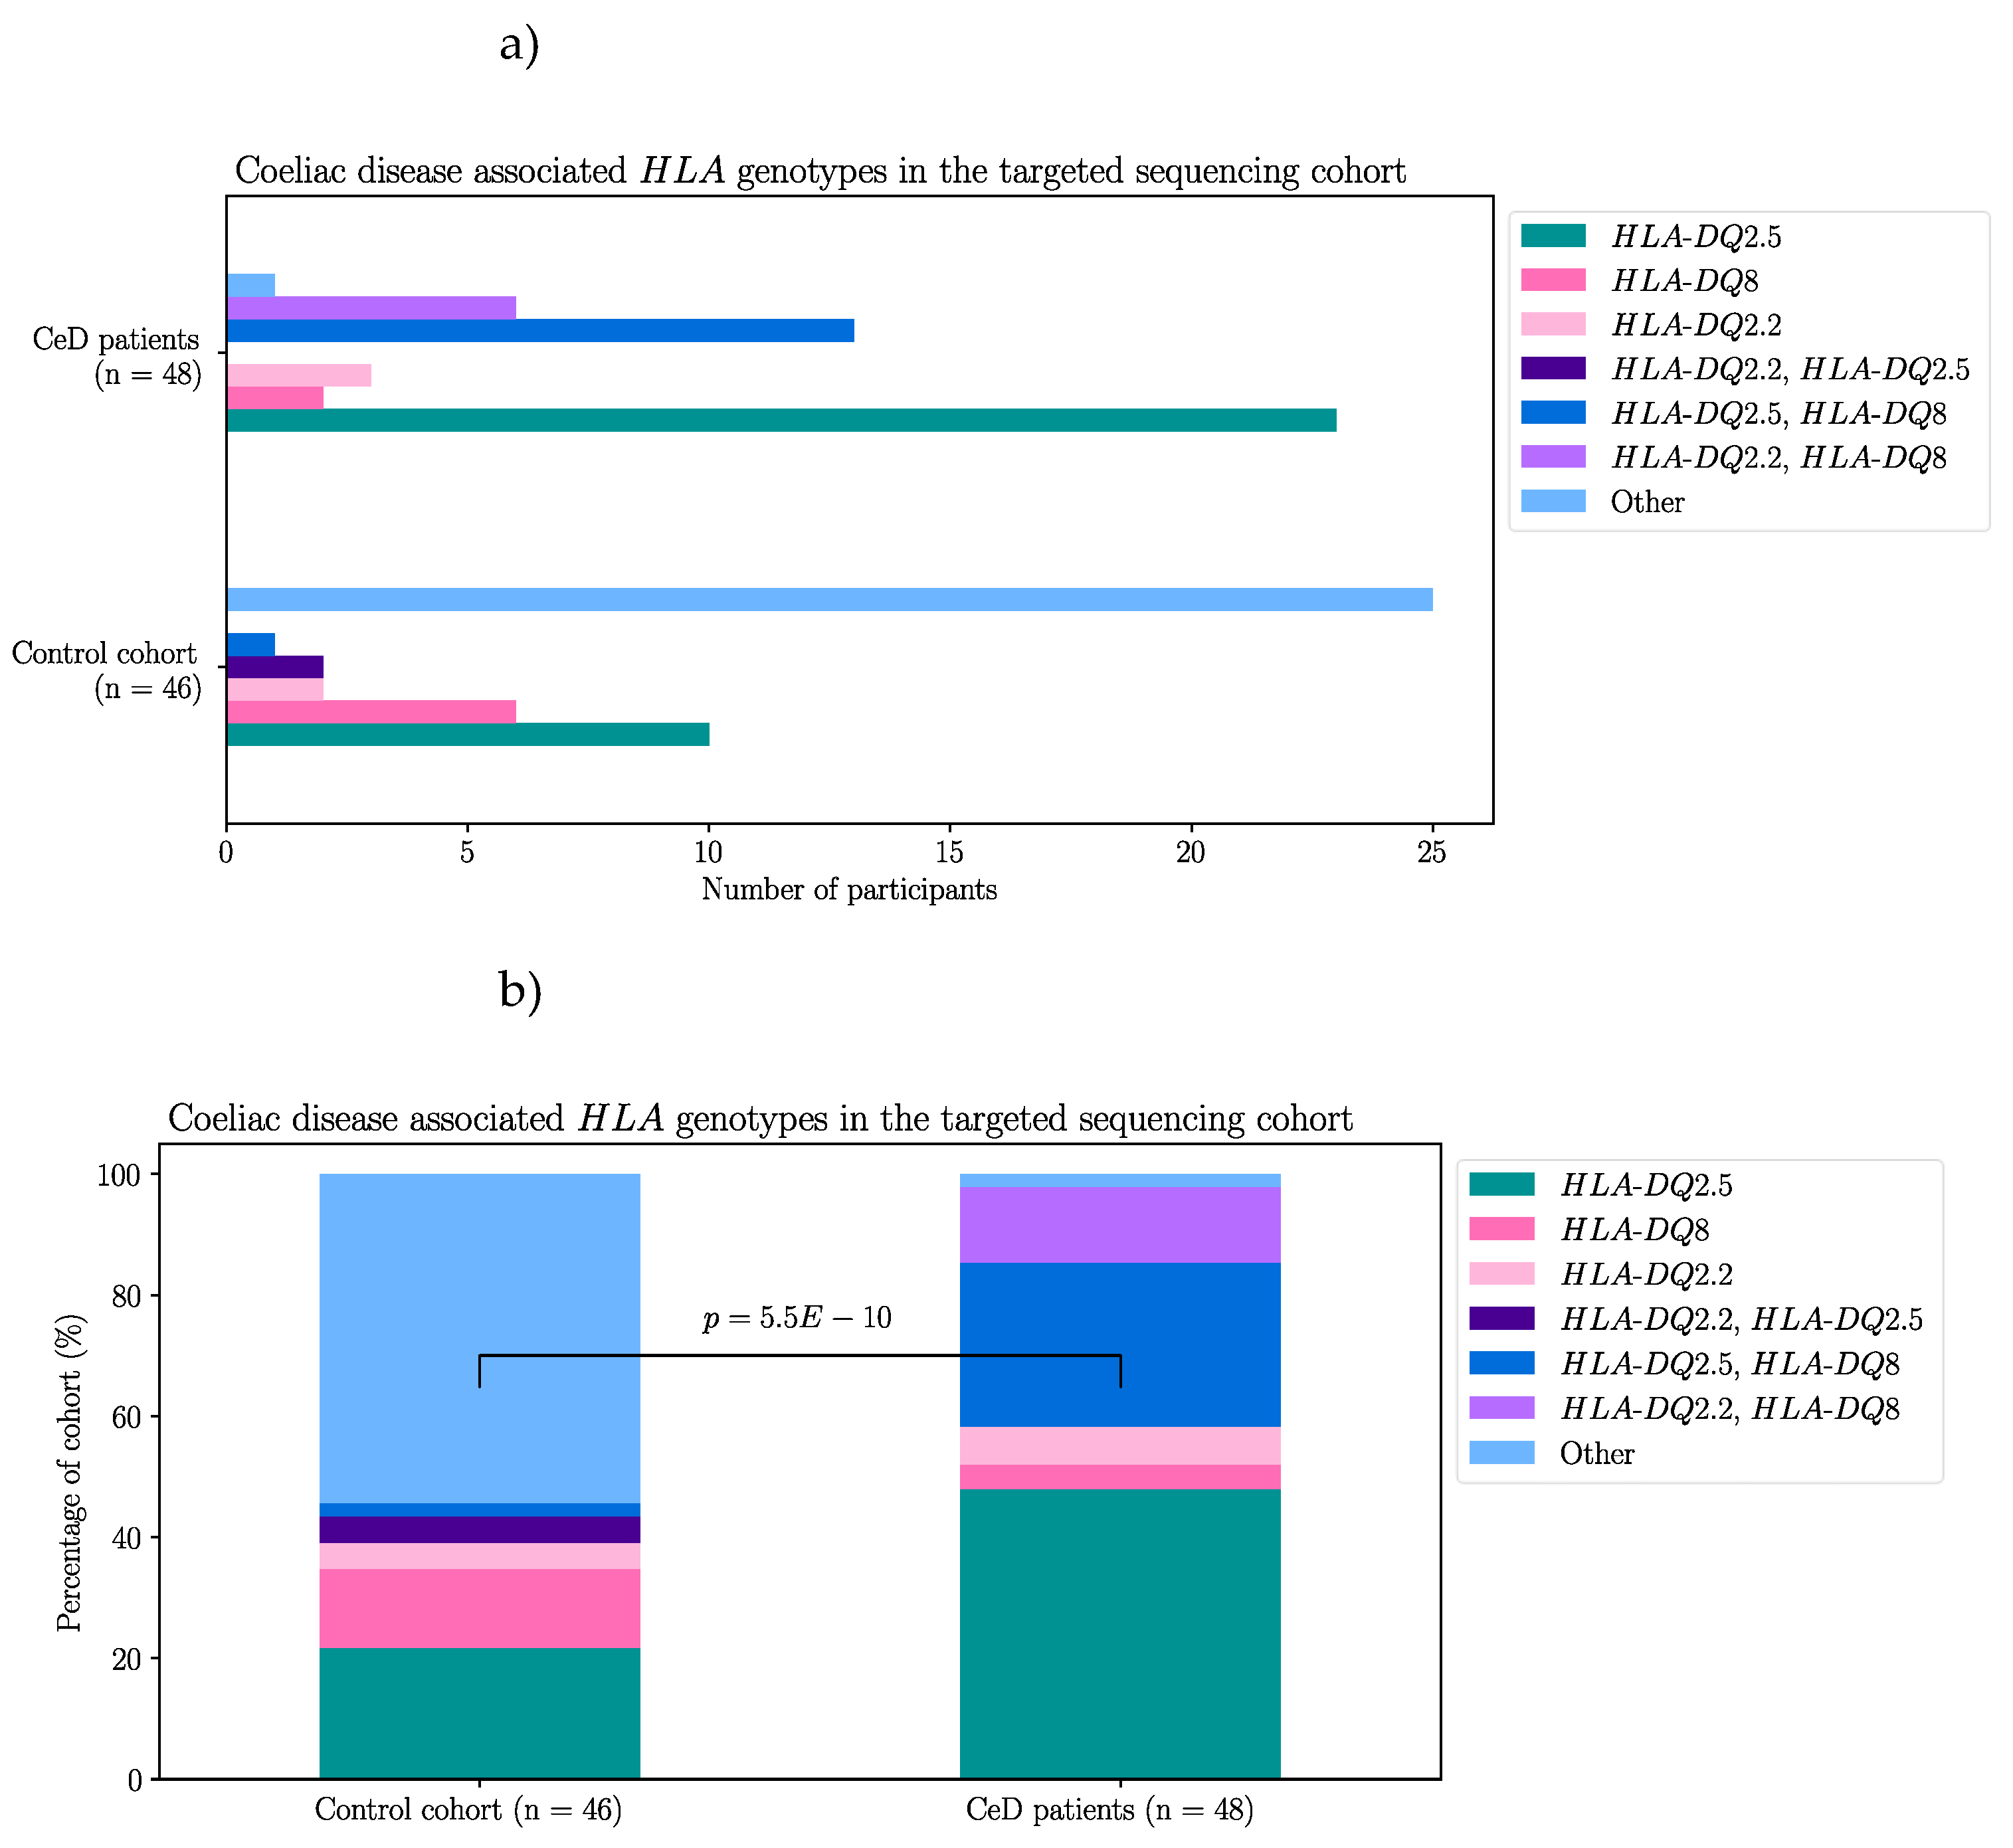
Figure A2.
There were no significant differences in the frequency of the BTNL8*BTNL3 copy number variants between CeD patients (n = 48) and controls (n = 46). The BTNL8*BTNL3 deletion variant encodes a truncated BTNL8-BTNL3 fusion protein [41]. Dart, et al. [53] identified rs72494581 in the intronic region of BTNL3, which serves as a surrogate SNP and the alleles are associated with the BTNL8*BTNL3 copy number variants. The major allele, the T allele, is associated with the full length BTNL3 and BTNL8 genes, while the minor allele, the C allele, is associated with the BTNL8*BTNL3 deletion. Fisher’s exact testing showed that there were no significant differences (p = 0.2144) in the frequency of the BTNL8*BTNL3 deletion variant associated rs72494581 genotypes in the CeD and control groups.
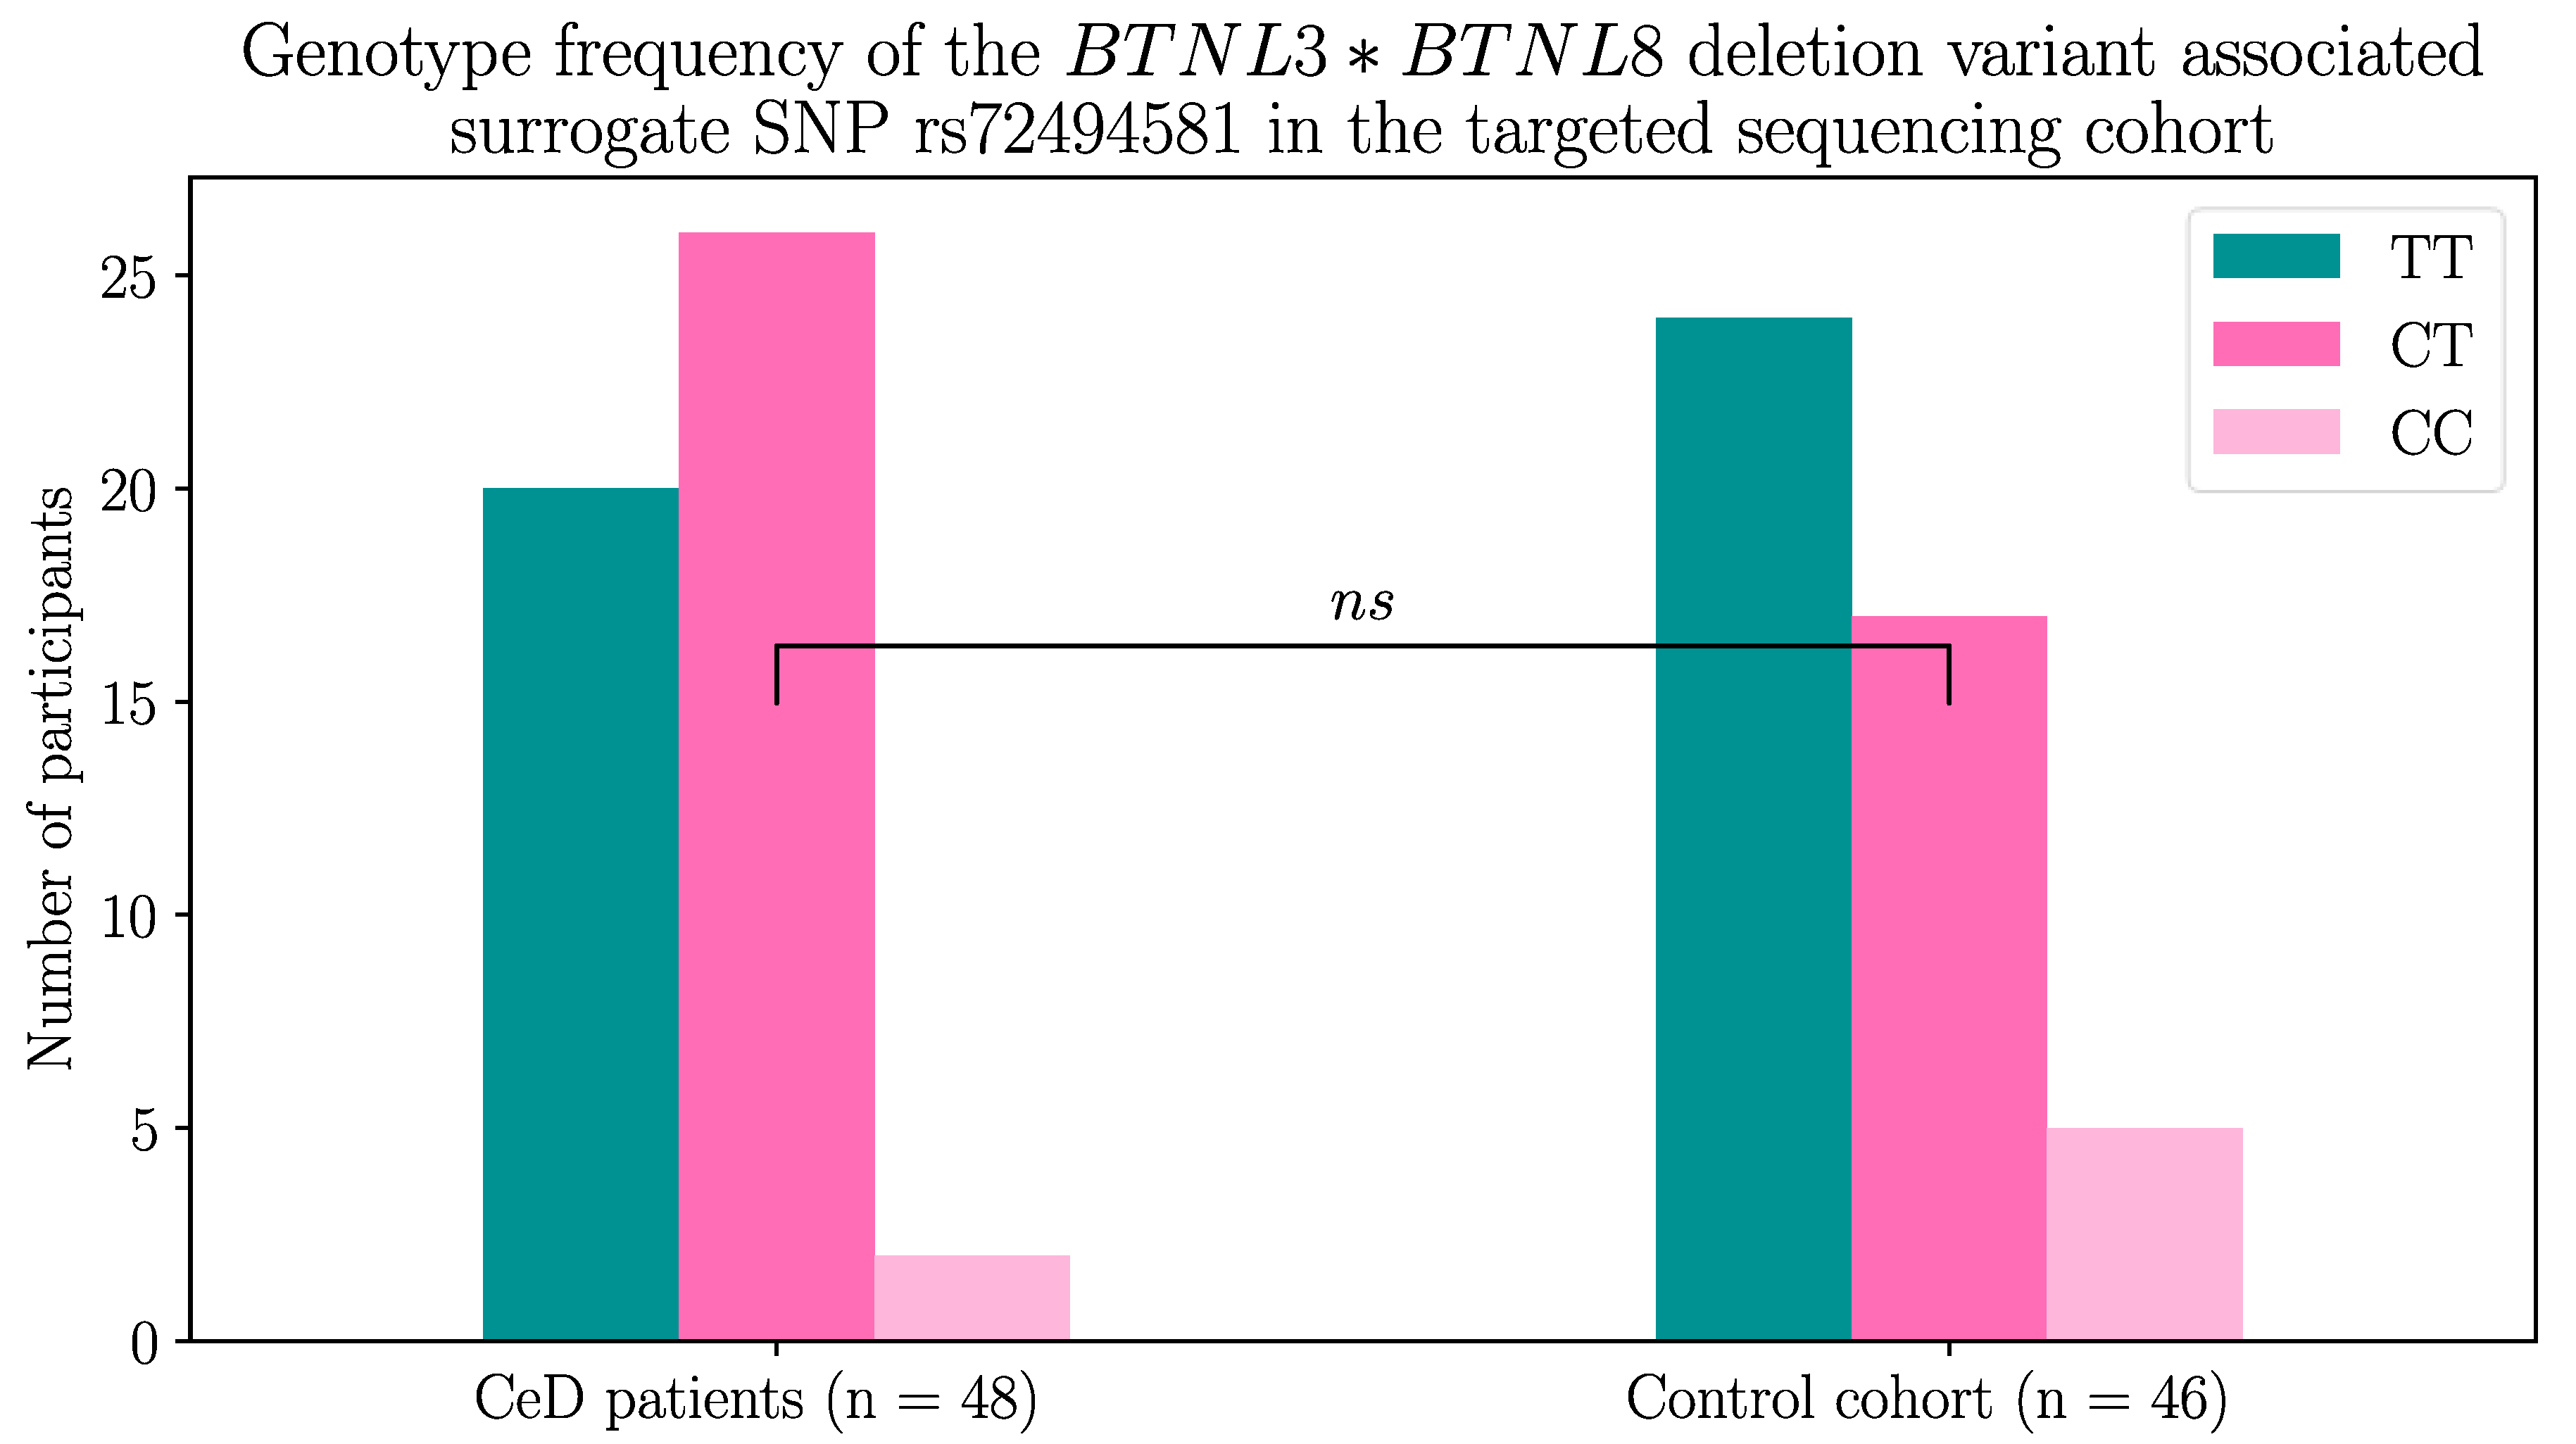
Table A1.
Less than 40% of sites found in CeD samples were shared with controls. Shared polymorphic sites between CeD and control samples in a) the whole hybridization capture dataset, b) in non-synonymous coding sites, c) in read depth filtered non-synonymous coding sites. Read depth was defined as the number of sequence reads per site. Read depth filtering was applied as a quality control step. Sites, where the read depth (dp) was more than 10, in more than 90% of the samples in each group passed the read depth filter. Sites described above can be multi-allelic, meaning they may have more than one alternative allele. Non-matching overlapping sites were defined as polymorphic sites, where the reference and/or alternate alleles identified in each group were different alleles. For example, a non-matching overlapping SNP would have the same base pair position on the chromosome with the same reference allele, but the alternate allele in one group is different from the other group’s. Comparisons were carried out using vcftools [89].
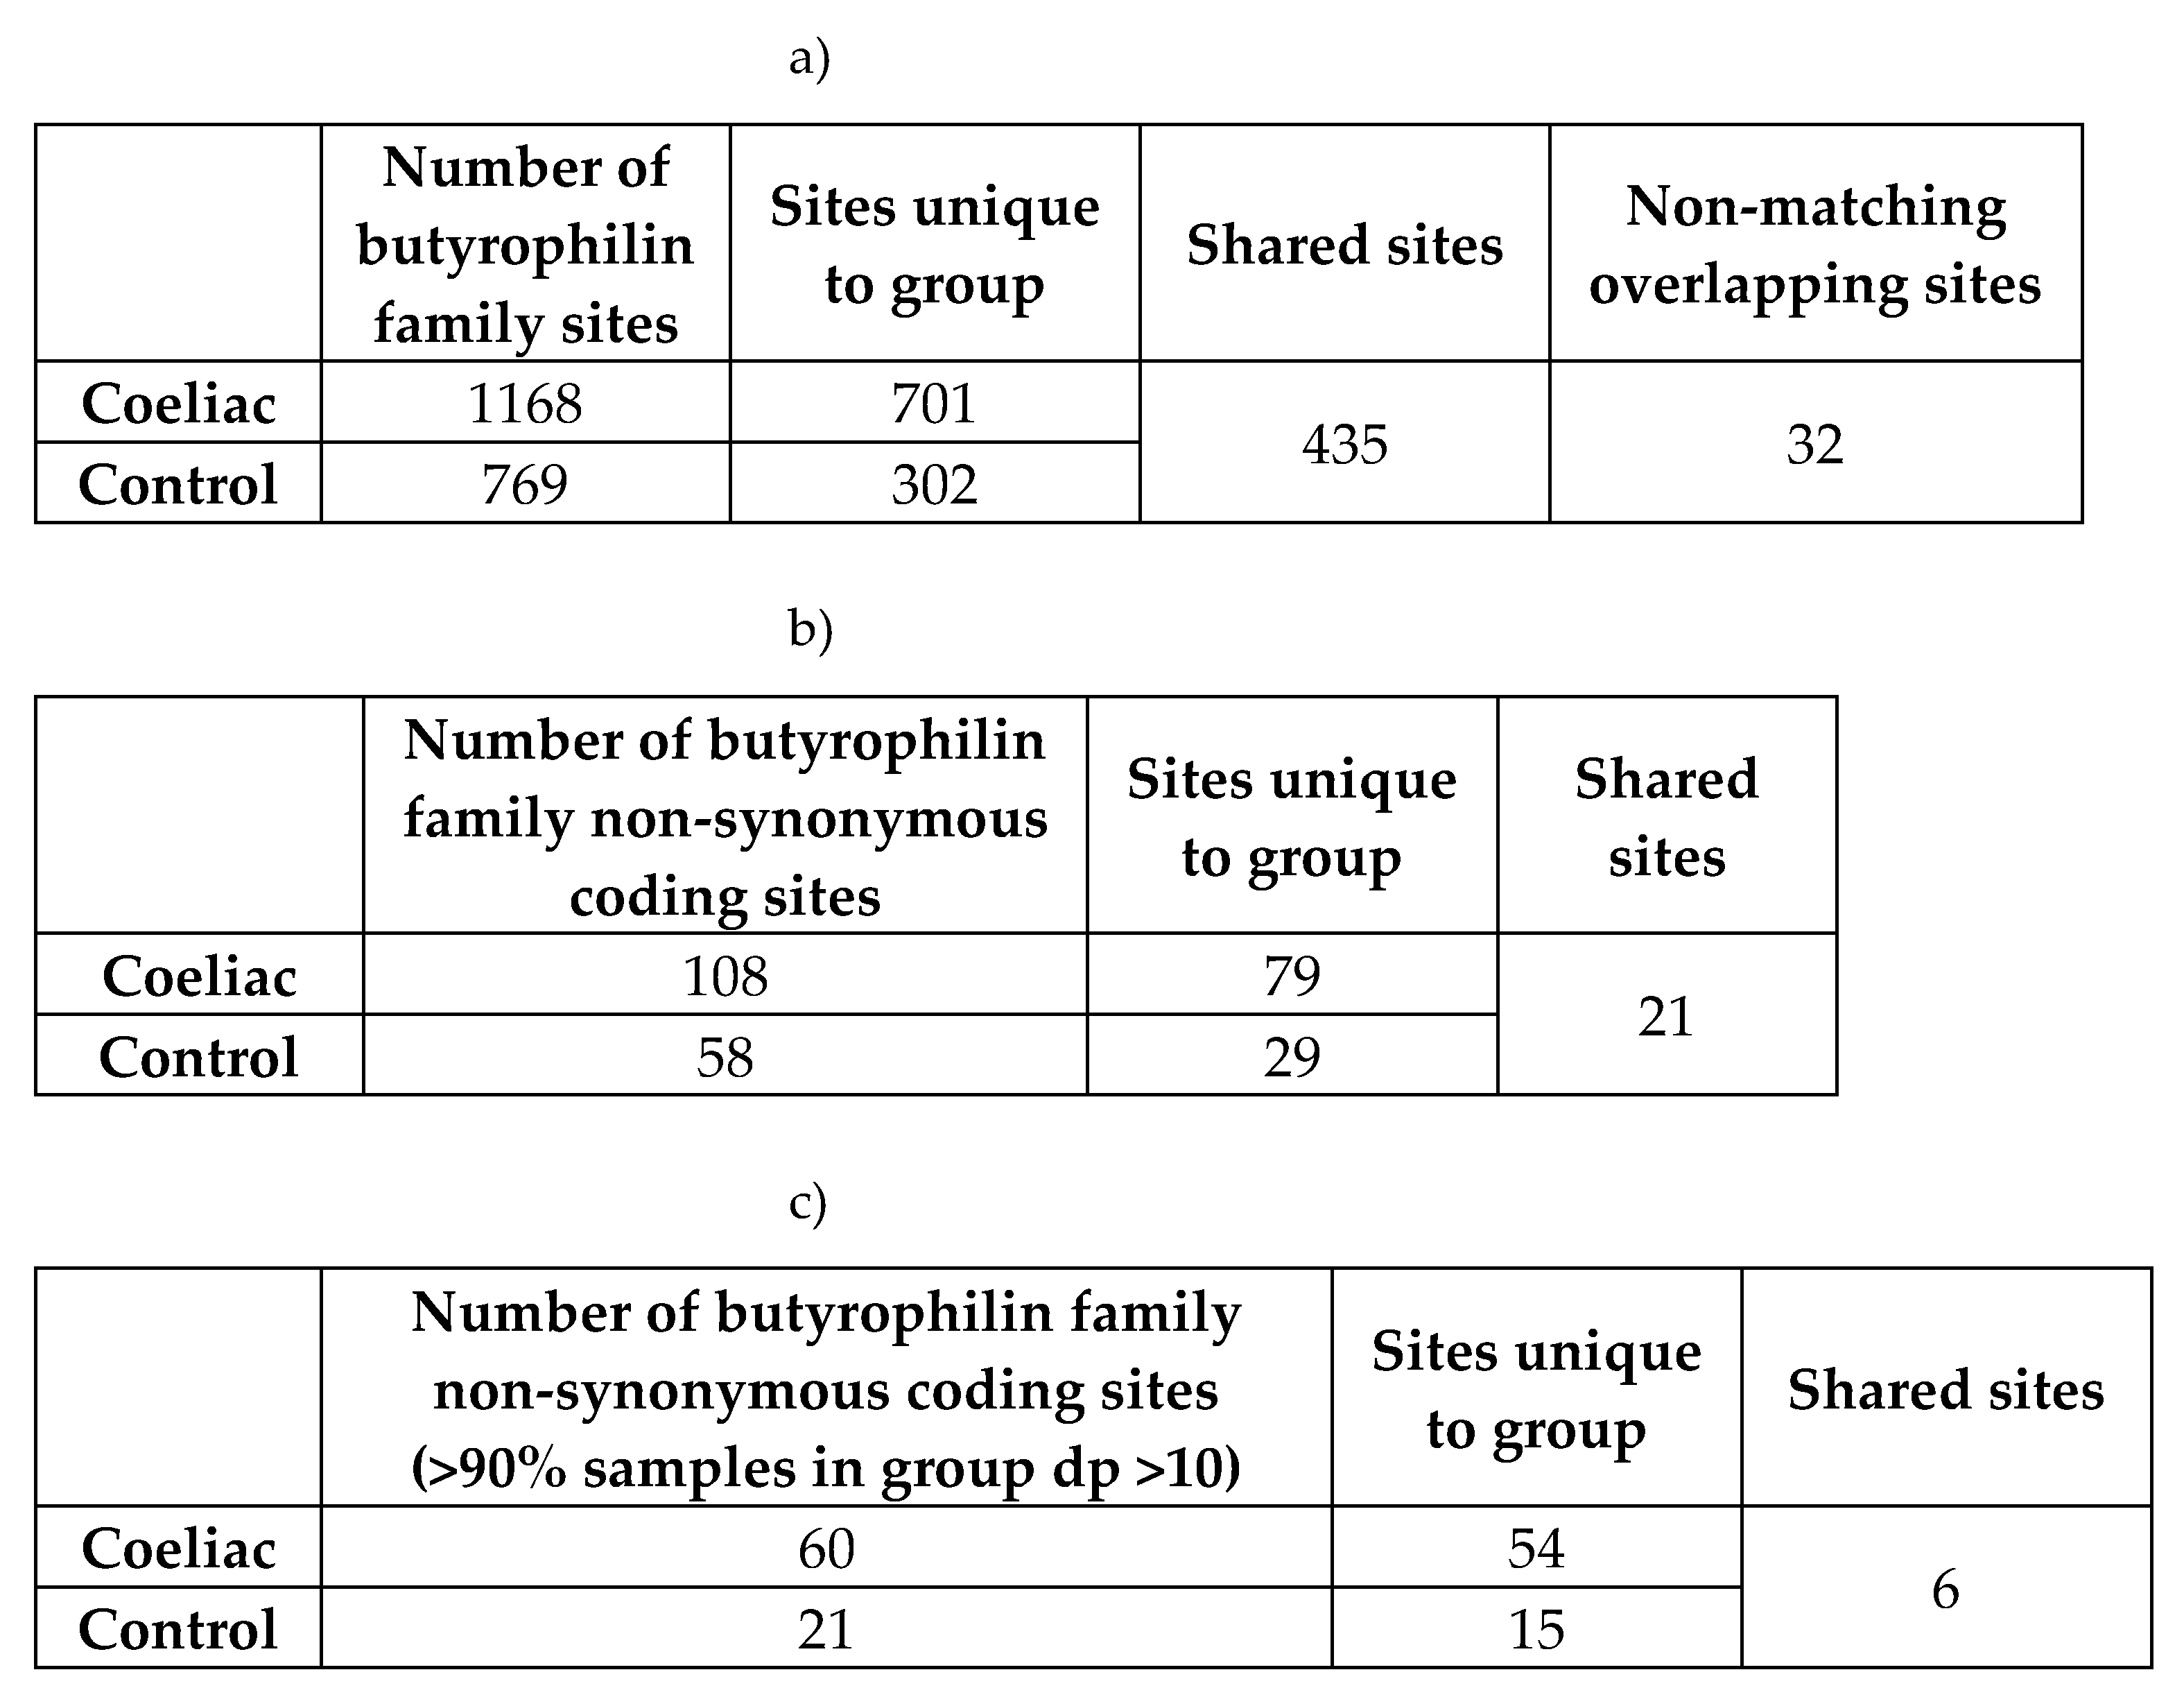 |
Table A2.
Percentage data of burden testing butyrophilin variants in CeD samples against controls from the hybridization capture dataset.
Table A2.
Percentage data of burden testing butyrophilin variants in CeD samples against controls from the hybridization capture dataset.
| Gene | Qual. SNPs | CeD %(≥1 HET) | CeD %(≥2 HET) | CeD %(HOM ALT) | CeD total qual. allele freq | Control %(≥1 HET) | Control %(≥2 HET) | Control %(HOM ALT) | Control total qual. allele freq | Dominant model p-value | Recessive model p-value |
| BTN2A1 | 3 | 45.8 | 43.8 | 6.3 | 0.281 | 10.9 | 8.7 | 0.0 | 0.047 | 1.46E-05 | 3.70E-08 |
| BTN3A2 | 1 | 10.4 | 0.0 | 2.1 | 0.073 | 19.6 | 0.0 | 2.2 | 0.120 | 0.929 | 0.946 |
| ERMAP | 1 | 43.8 | 0.0 | 16.7 | 0.385 | 43.5 | 0.0 | 15.2 | 0.370 | 0.516 | 0.988 |
Burden testing was carried out on butyrophilin variants in CeD samples against controls from the dataset with read depth filtering. During read depth filtering in only sites, where more than 90% of samples had a read depth coverage of >10, were selected. Percentage values in columns 3-5 and 7-9 show the percentage of individuals with each genotype within the CeD and the control groups of the dataset respectively. Significant results are highlighted in bold. Abbreviations: CeD: coeliac disease; freq: frequency; HET: heterozygous; HOM ALT: homozygous for the alternative allele; N: number; qual.: qualifying; SNP: single nucleotide polymorphism
Table A3.
Per sample genotype of participants at significant BTN2A1 qualifying SNPs from Table 5b Abbreviations: het: heterozygous; hom alt: homozygous for the alternative allele; hom ref: homozygous for the reference allele.
Table A3.
Per sample genotype of participants at significant BTN2A1 qualifying SNPs from Table 5b Abbreviations: het: heterozygous; hom alt: homozygous for the alternative allele; hom ref: homozygous for the reference allele.
 |
 |
 |
Appendix B – Demographic Data of the Selected UK Biobank Participants
Firstly, the age at recruitment of the participants were analysed. The distribution of the age at recruitment of neither controls nor of CeD patients followed normal distribution (Figure B1). The mean age at recruitment for controls was 62, which was significantly higher than that of CeD patients (t = 27.297, df = 3539.3, p < 2.2E-16), whose average age at recruitment was 58.
Figure 1.
CeD patients were significantly younger than control individuals when they were recruited for the initial UK Biobank study. The distribution of the age at recruitment of a) 29 762 control participants and b) 3094 CeD patients from the UK Biobank dataset did not follow normal distribution. c) The mean age at recruitment was significantly higher in control individuals (t = 27.297, df = 3539.3, p-value < 2.2E-16).

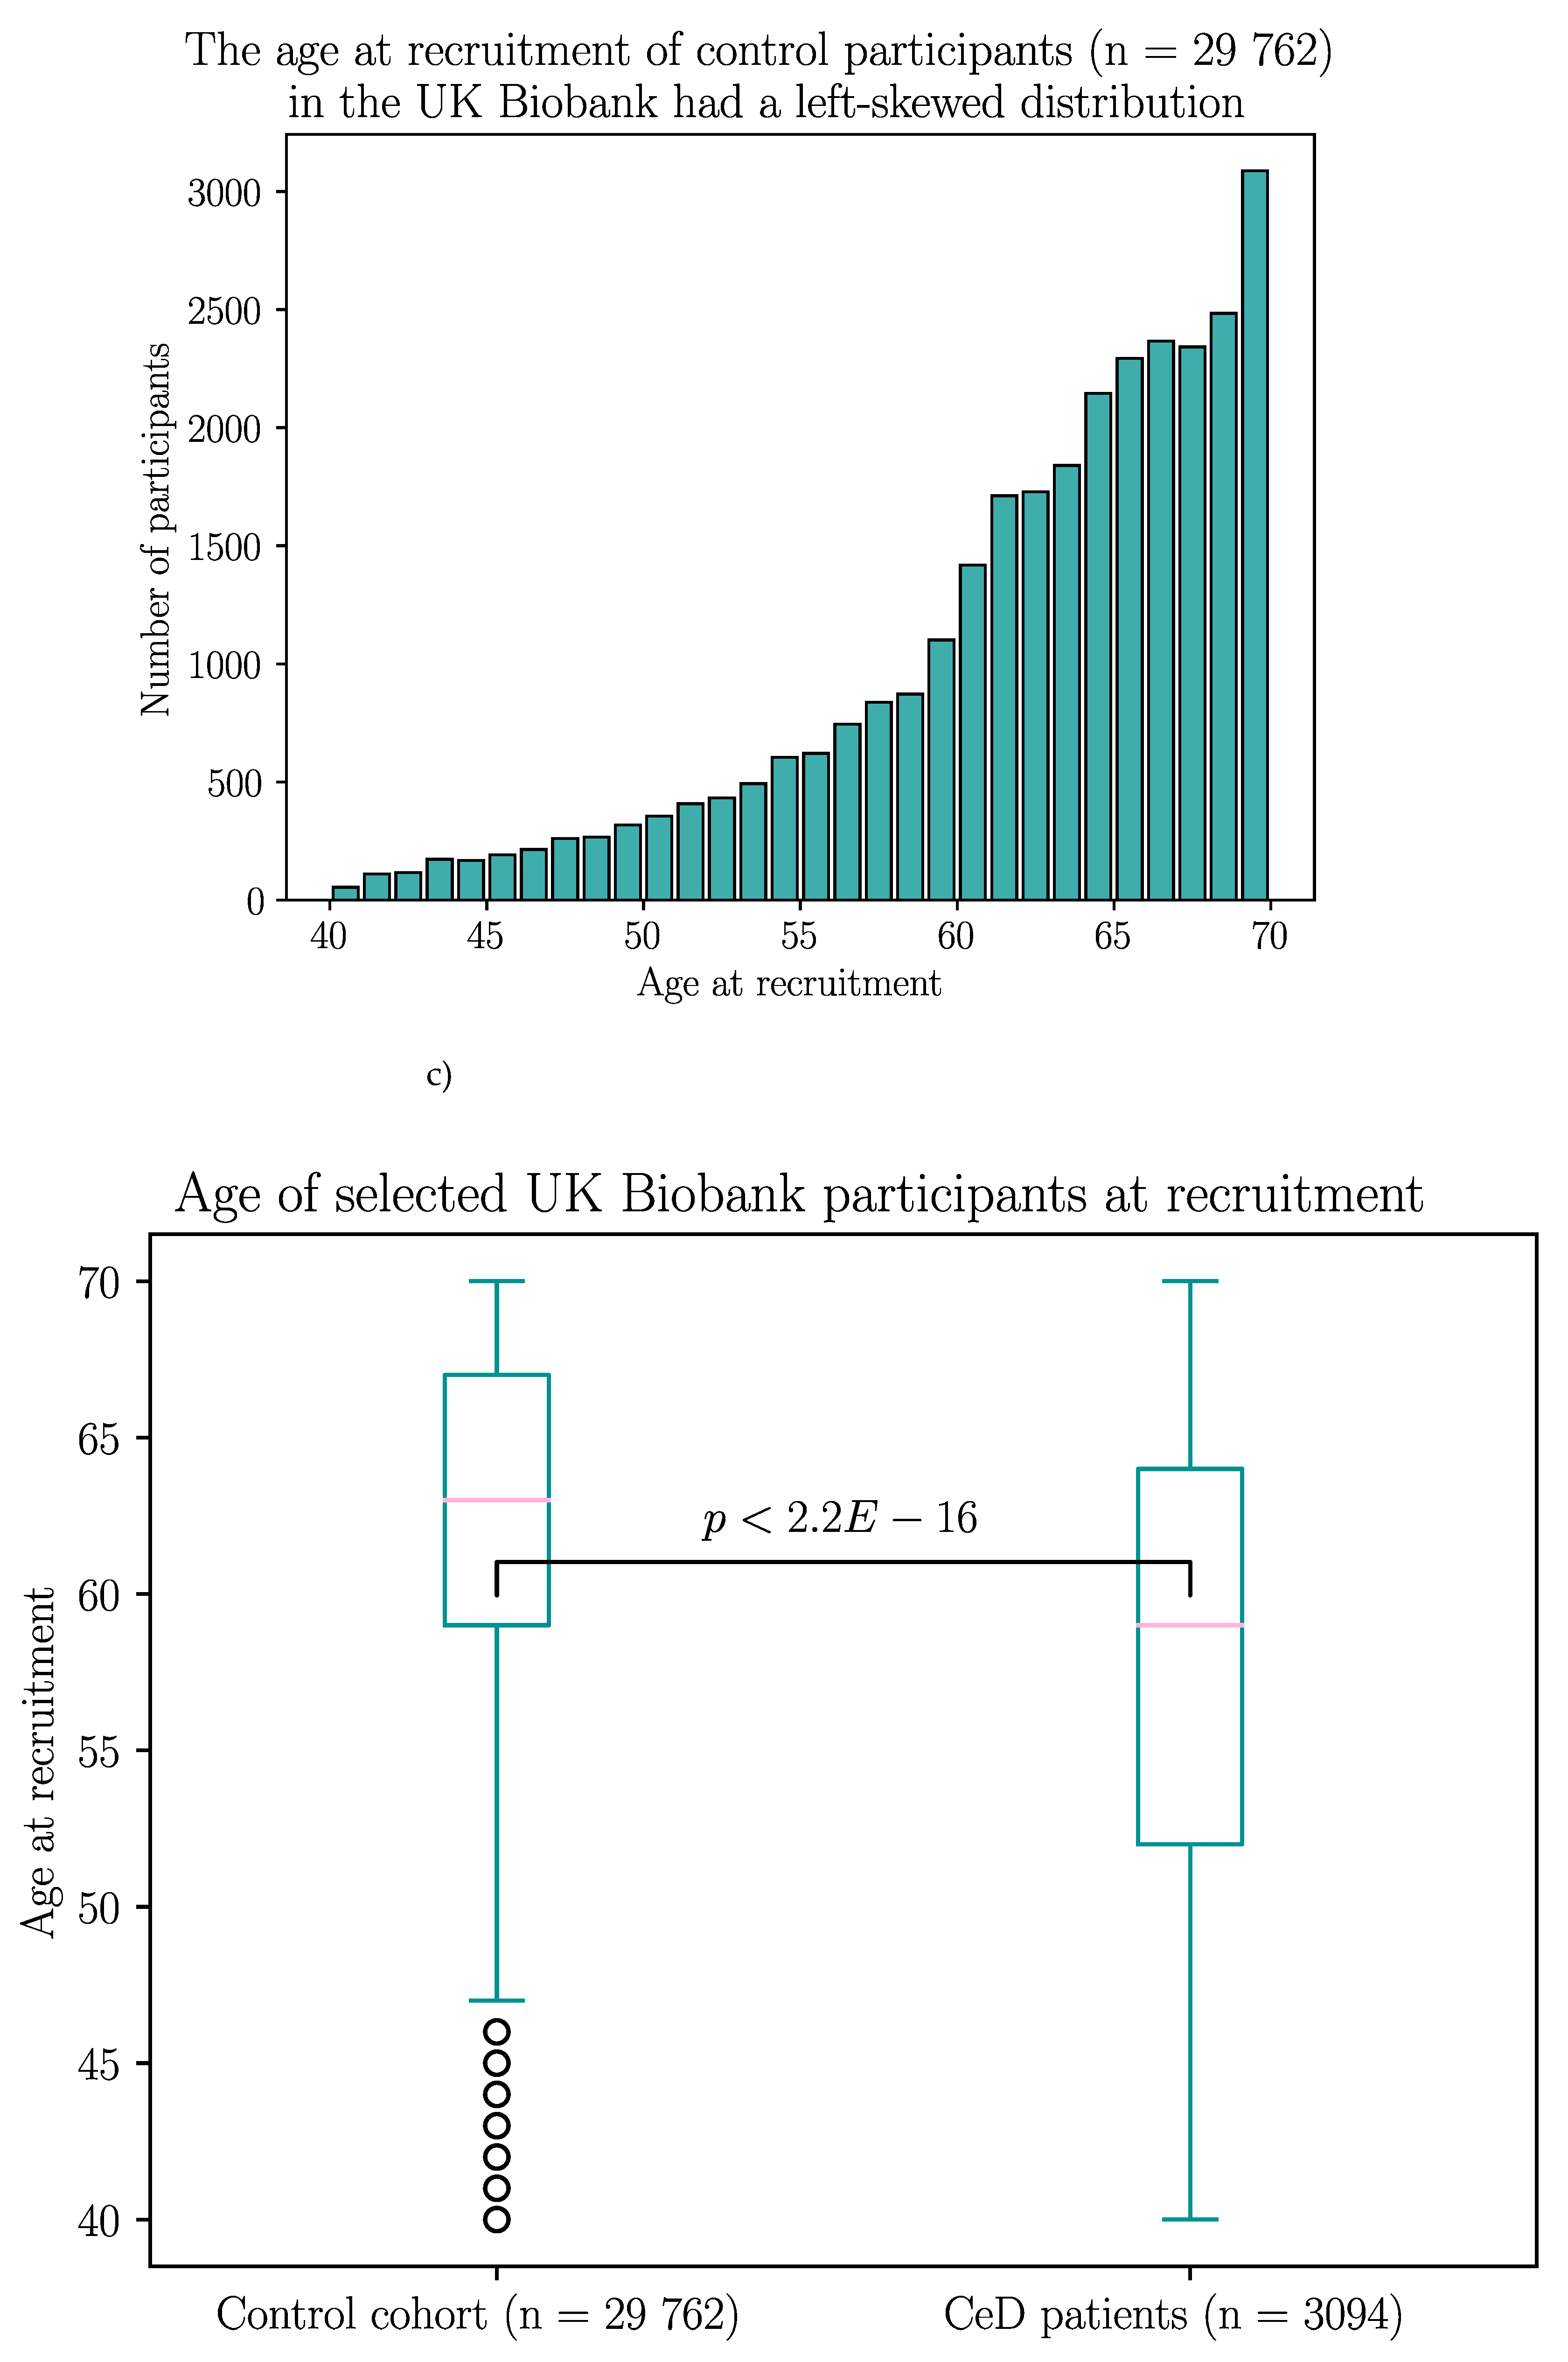
Secondly, the sex of CeD and control participants in the UK Biobank was investigated (Figure B2). Interestingly, the proportion of female participants was significantly higher in the CeD group ( 64.8%, 2005/3094) than in the control group (40.4%, 12 010/29 762) (X-squared = 683.91, df = 1, p < 2.2E-16).
Figure 2.
A significantly higher proportion of individuals diagnosed with CeD were female participants, compared with the control cohort in the UK Biobank dataset. The sex of 3094 CeD patients and 29 762 control participants was analysed from the UK Biobank. The figure shows the a) number and b) percentage of each sex for CeD and control participants. The CeD group in the UK Biobank had a significantly higher proportion of female participants (X-squared = 683.91, df = 1, p < 2.2E-16).
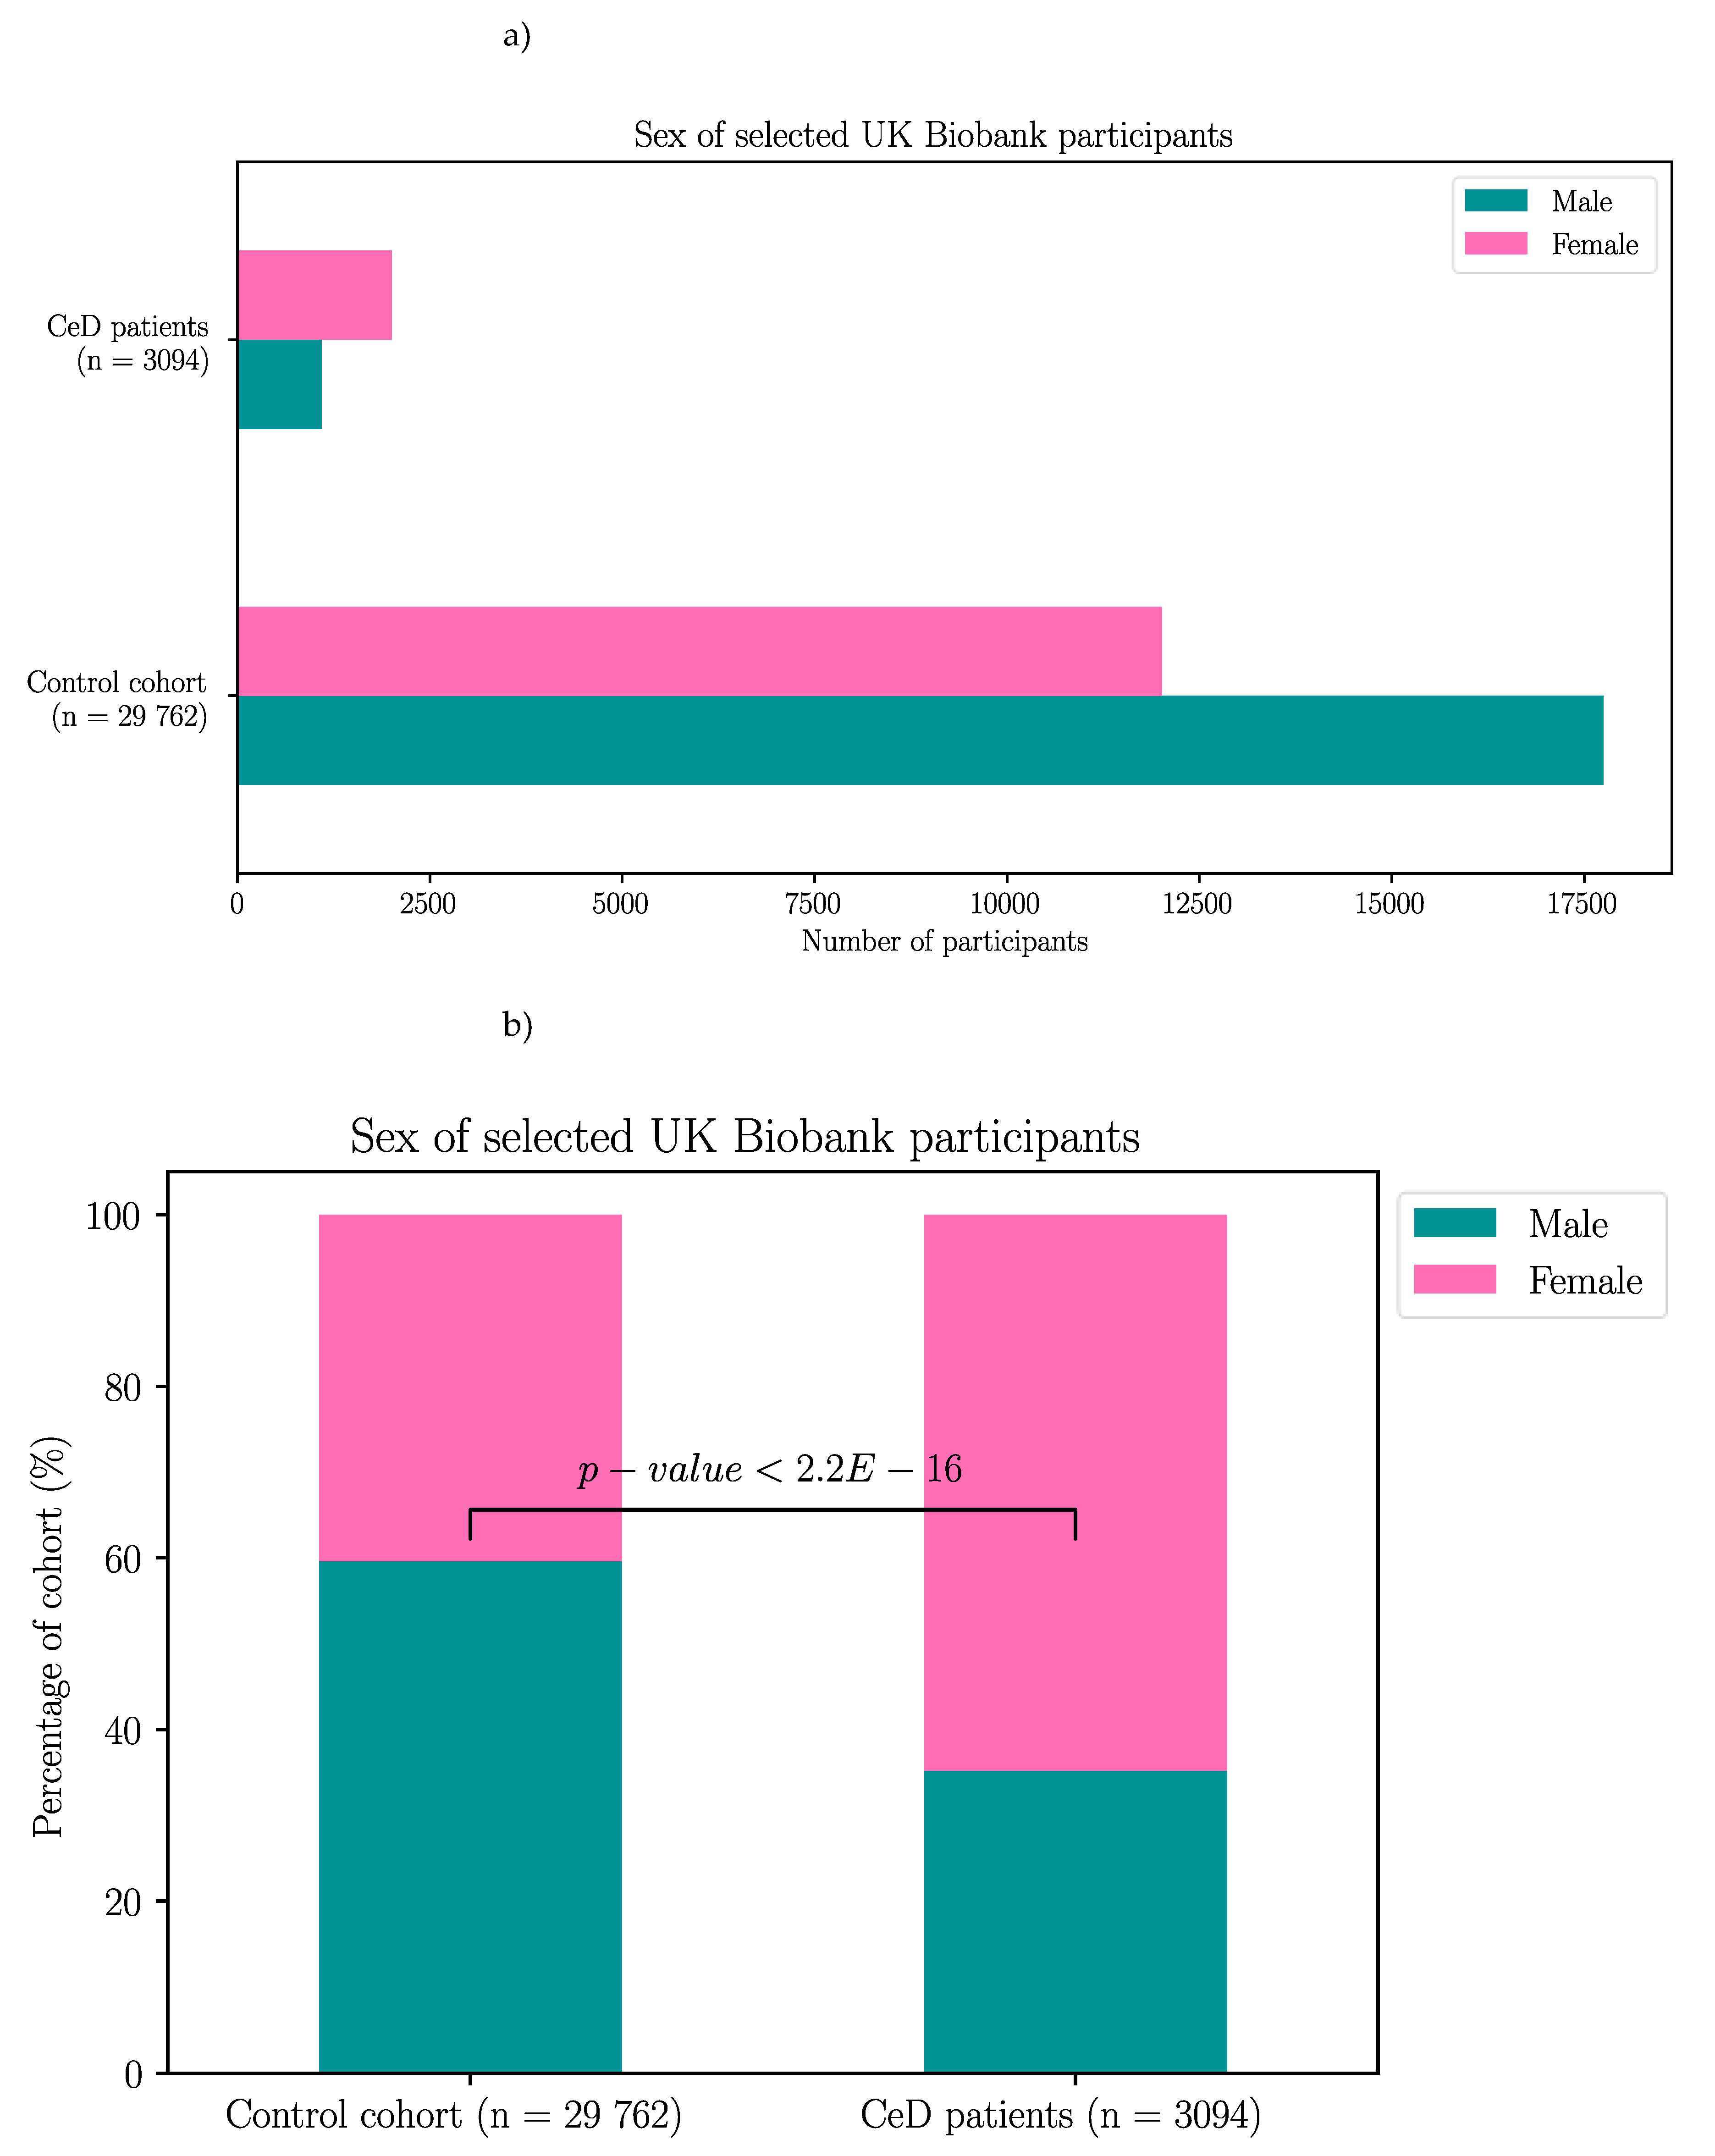
Thirdly, the ethnic background of the UK Biobank participants was analysed. In both CeD and control groups, the majority of participants had White British backgrounds, at 91.8% (26 850/29 762) and 90.2% (2841/3094) respectively (Figure B3). In both groups, Irish and any other white background were the second and third most frequent ethnic backgrounds respectively. When the ethnic background of CeD and control participants were compared (X-squared = 42.294, df = 21, p = 0.00384), no significant difference was present after Bonferroni correction for multiple testing (p > 0.05).
Figure 3.
White British was the most common ethnic background in the UK Biobank participants regardless of CeD status. The ethnic backgrounds of 3094 CeD patients and 29 762 control participants were analysed from the UK Biobank. There were no significant differences in the ethnic background of CeD and control participants after Bonferroni correction.
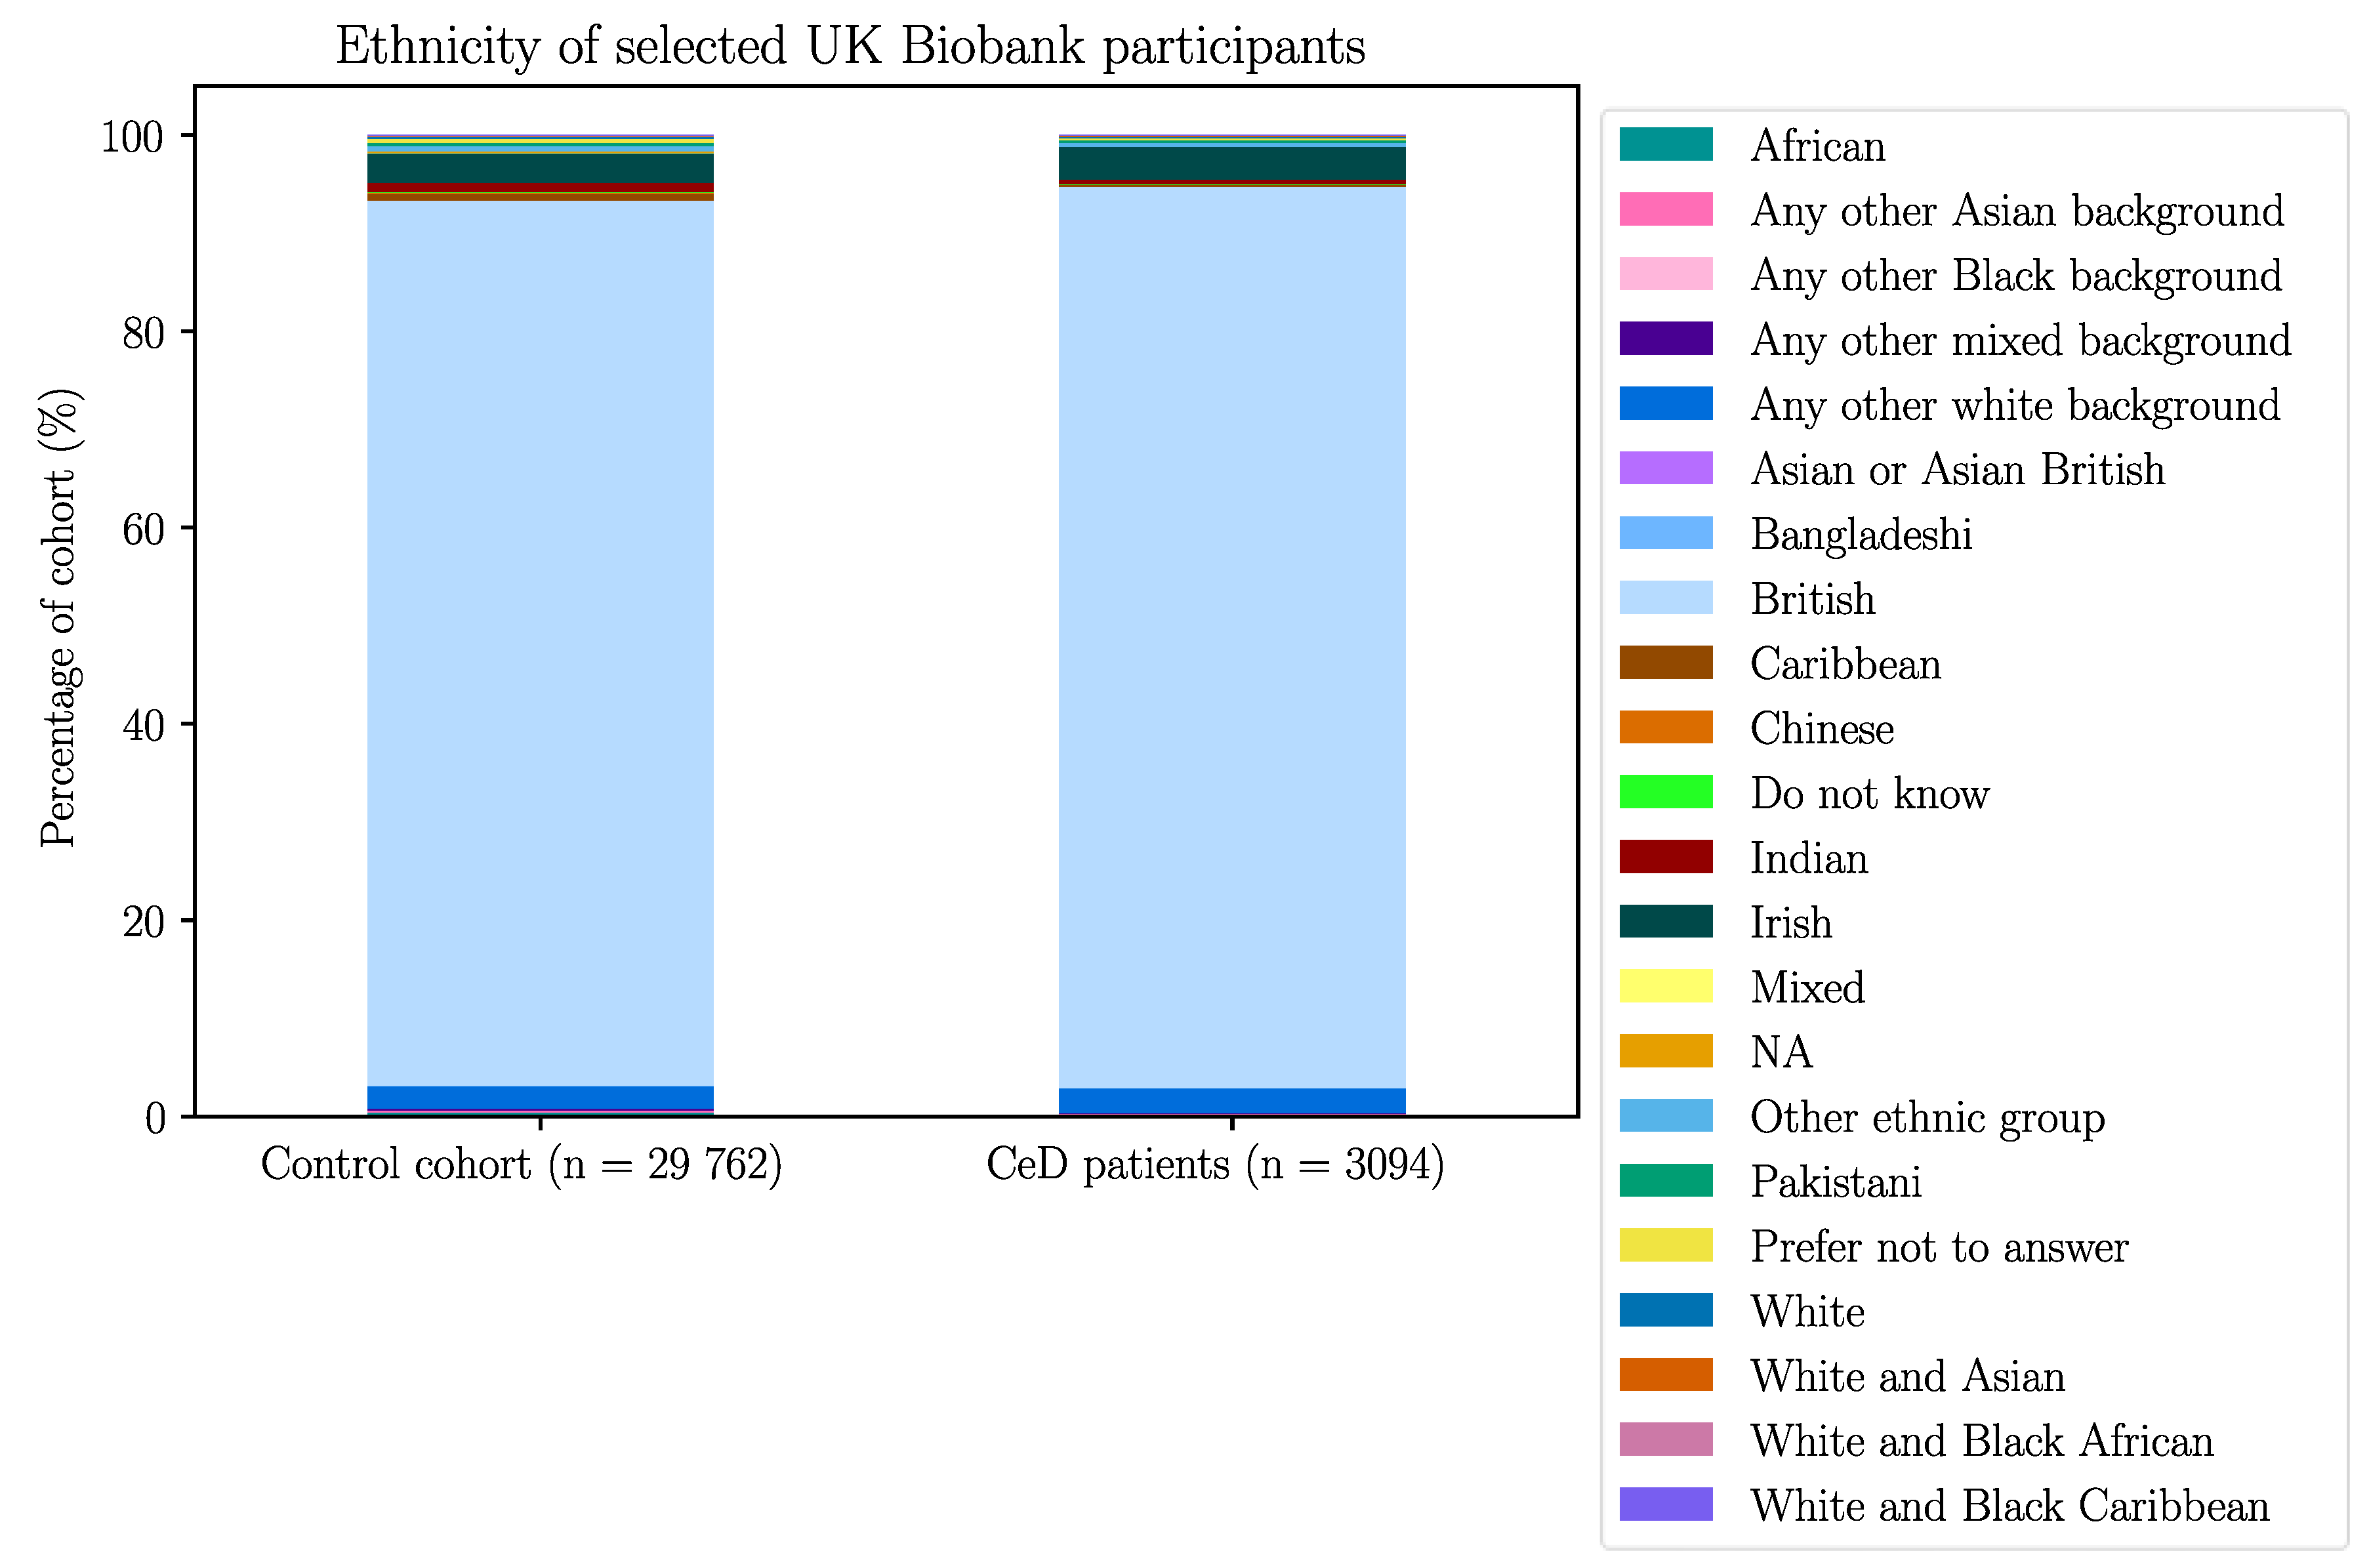
Finally, the dietary web questionnaire answers of CeD and control individuals were examined for any differences between the two groups. GFD was excluded from the statistical analysis of dietary differences between CeD and control individuals in the UK Biobank. Firstly, being on a GFD was one of the exclusion criteria for the control cohort, to exclude potential, undiagnosed CeD cases. Therefore this diet would have zero occurrences in the control group. Secondly, CeD patients generally follow a GFD, as it is currently the only treatment for CeD [4]. This created a higher occurrence of GFD in CeD patients compared to controls selected from the UK Biobank dataset. The majority of UK Biobank participants did not adhere to any special diet, with 94.7% of controls (28 185/29 762) and 71.2% of CeD patients (2204/3094) reporting no special diet (Figure B5). A low calorie diet was the most common special diet in controls (3.1%, 926/29 762).
A GFD was the most common special diet in CeD participants of the UK Biobank (22.2%, 686/3094), with an additional 3.6% (112/3094) of patients following a GFD in addition to other special diets. The second and third most common special diet in the CeD group was a combination of a GFD with a low calorie diet, and a GFD with a lactose-free diet, at 1.5% (45/3094) and 1.3% (40/3094) respectively. When any variation of a GFD was excluded from the CeD group, the most common diet was a low calorie diet (1.3%, 39/3094). Interestingly, 74.2% (2296/3094) of CeD participants did not follow a diet that excluded gluten.
When excluding a GFD from the analyses, the proportions of participants following the special diets within the control group was significantly different from the CeD group (X-squared = 23.303, df = 11, p = 0.01602). The lactose-free–low calorie, vegan, lactose-free–low calorie–vegetarian, lactose-free–vegetarian and lactose-free–low calorie–vegan diets were only found in the control group after excluding CeD patients adhering to a GFD. This could be due to CeD patients following the aforementioned diets in addition to being on a GFD (Table B1).
Figure 4.
The majority of UK Biobank participants reported no special diet in both control and CeD groups. The diet of 3094 CeD patients and 29 762 control participants was analysed from the UK Biobank. The majority of UK Biobank participants reported no special diet in both control (94.7%, 28 185/29 762) and CeD (71.2%, 2204/3094) groups. When participants following a gluten-free diet were excluded from the analysis, the proportions of participants following each special diet were significantly different between the CeD and control groups (X-squared = 23.303, df = 11, p = 0.01602). This was likely caused by having to exclude patients who followed multiple diets that included a gluten-free diet. Participants on a gluten-free diet were excluded from the control group.
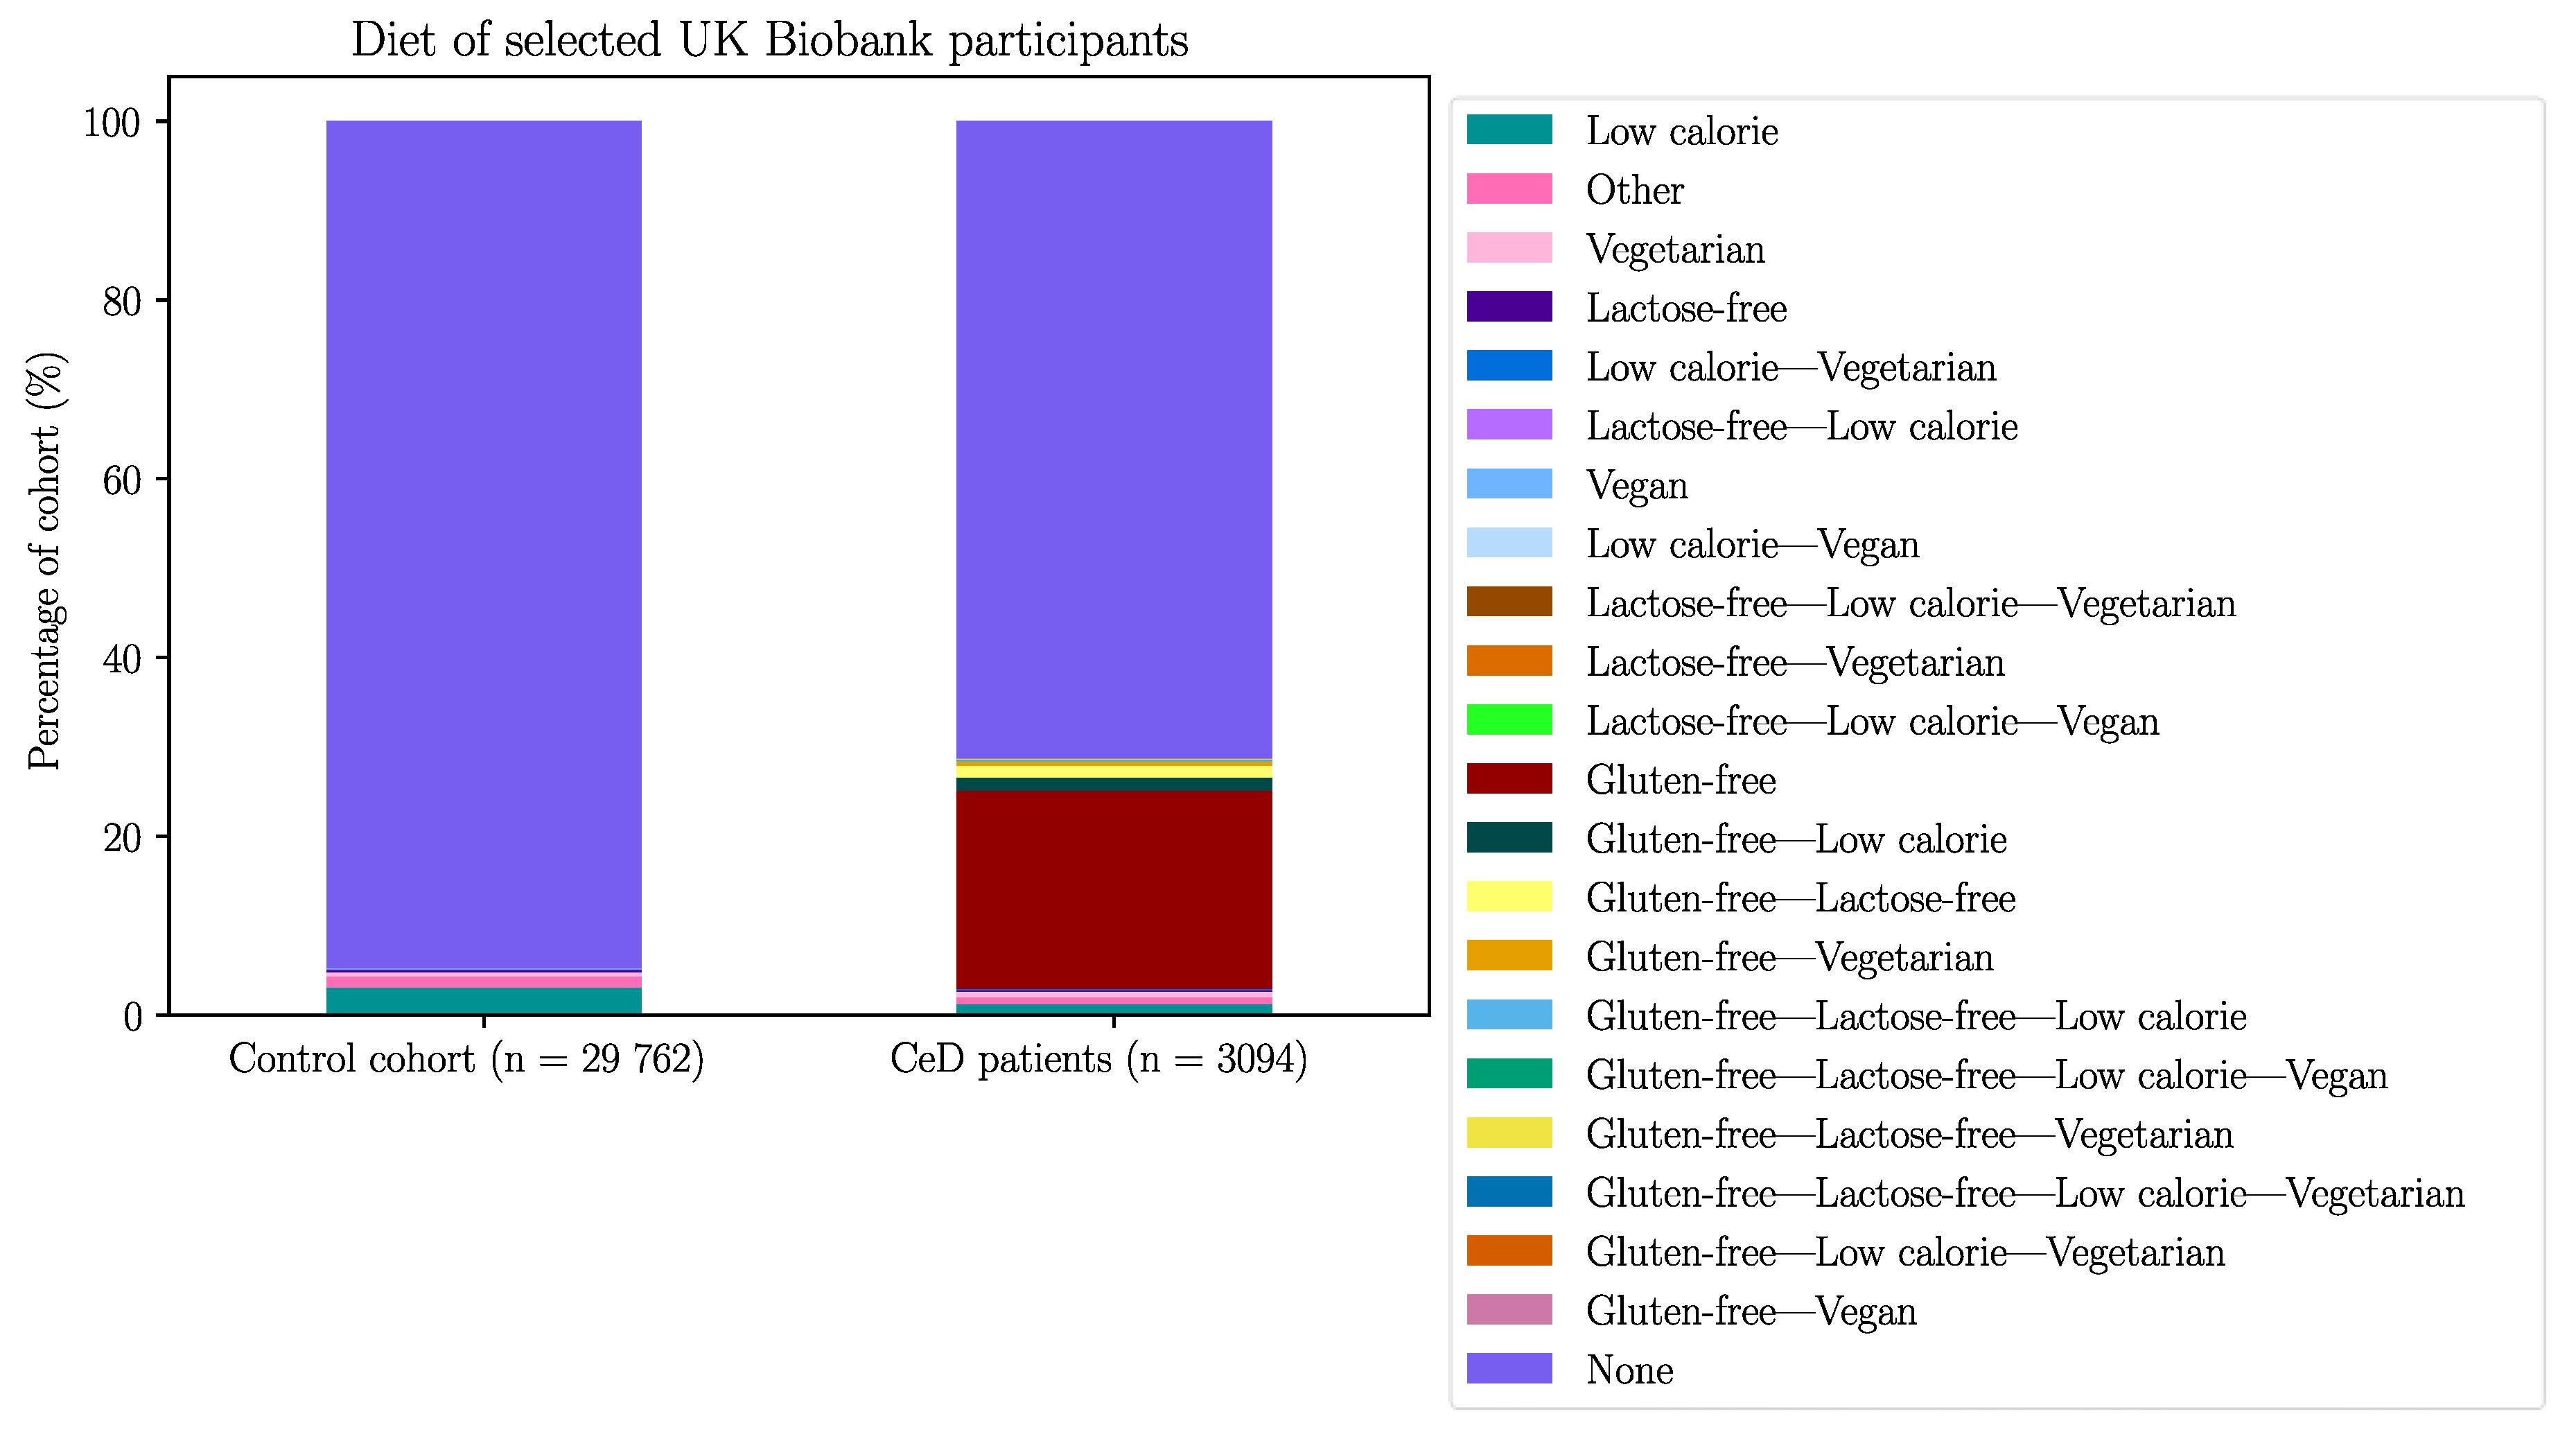
Table 1.
The significant difference between the special diets of controls (n = 29 762) and CeD participants not on a gluten-free diet (n = 2296) may stem from CeD patients following multiple diets in addition to following a gluten-free diet.
Table 1.
The significant difference between the special diets of controls (n = 29 762) and CeD participants not on a gluten-free diet (n = 2296) may stem from CeD patients following multiple diets in addition to following a gluten-free diet.
| Without GFD | With GFD | |||||
| Diet | N controls on diet | % Controls on diet | N CeD on diet | % CeD on diet (out of 2296) | N CeD on diet | % CeD on diet (out of 3094) |
| Lactose-free–low calorie | 20 | 0.067 | 0 | 0 | 5 | 0.162 |
| Vegan | 15 | 0.050 | 0 | 0 | 1 | 0.032 |
| Lactose-free–low calorie–vegetarian | 2 | 0.007 | 0 | 0 | 1 | 0.032 |
| Lactose-free–vegetarian | 2 | 0.007 | 0 | 0 | 1 | 0.032 |
| Lactose-free–low calorie–vegan | 1 | 0.003 | 0 | 0 | 2 | 0.065 |
Appendix C – Supplementary Materials for Results Section 2.2
Figure 1.
CeD patients (n = 3094) had significantly higher proportions of CeD risk associated HLA genotypes compared to controls (n = 29 762) in the UK Biobank’s 500,000 genome-wide genotyping dataset. The a) number and b) percentage of participants with CeD risk HLA genotypes were significantly more frequent in CeD patients compared to control participants (X-squared = 4062.5, df = 6, p < 2.2E-16). All participants’ HLA genotypes were called using the HLA imputation values provided by the UK Biobank.
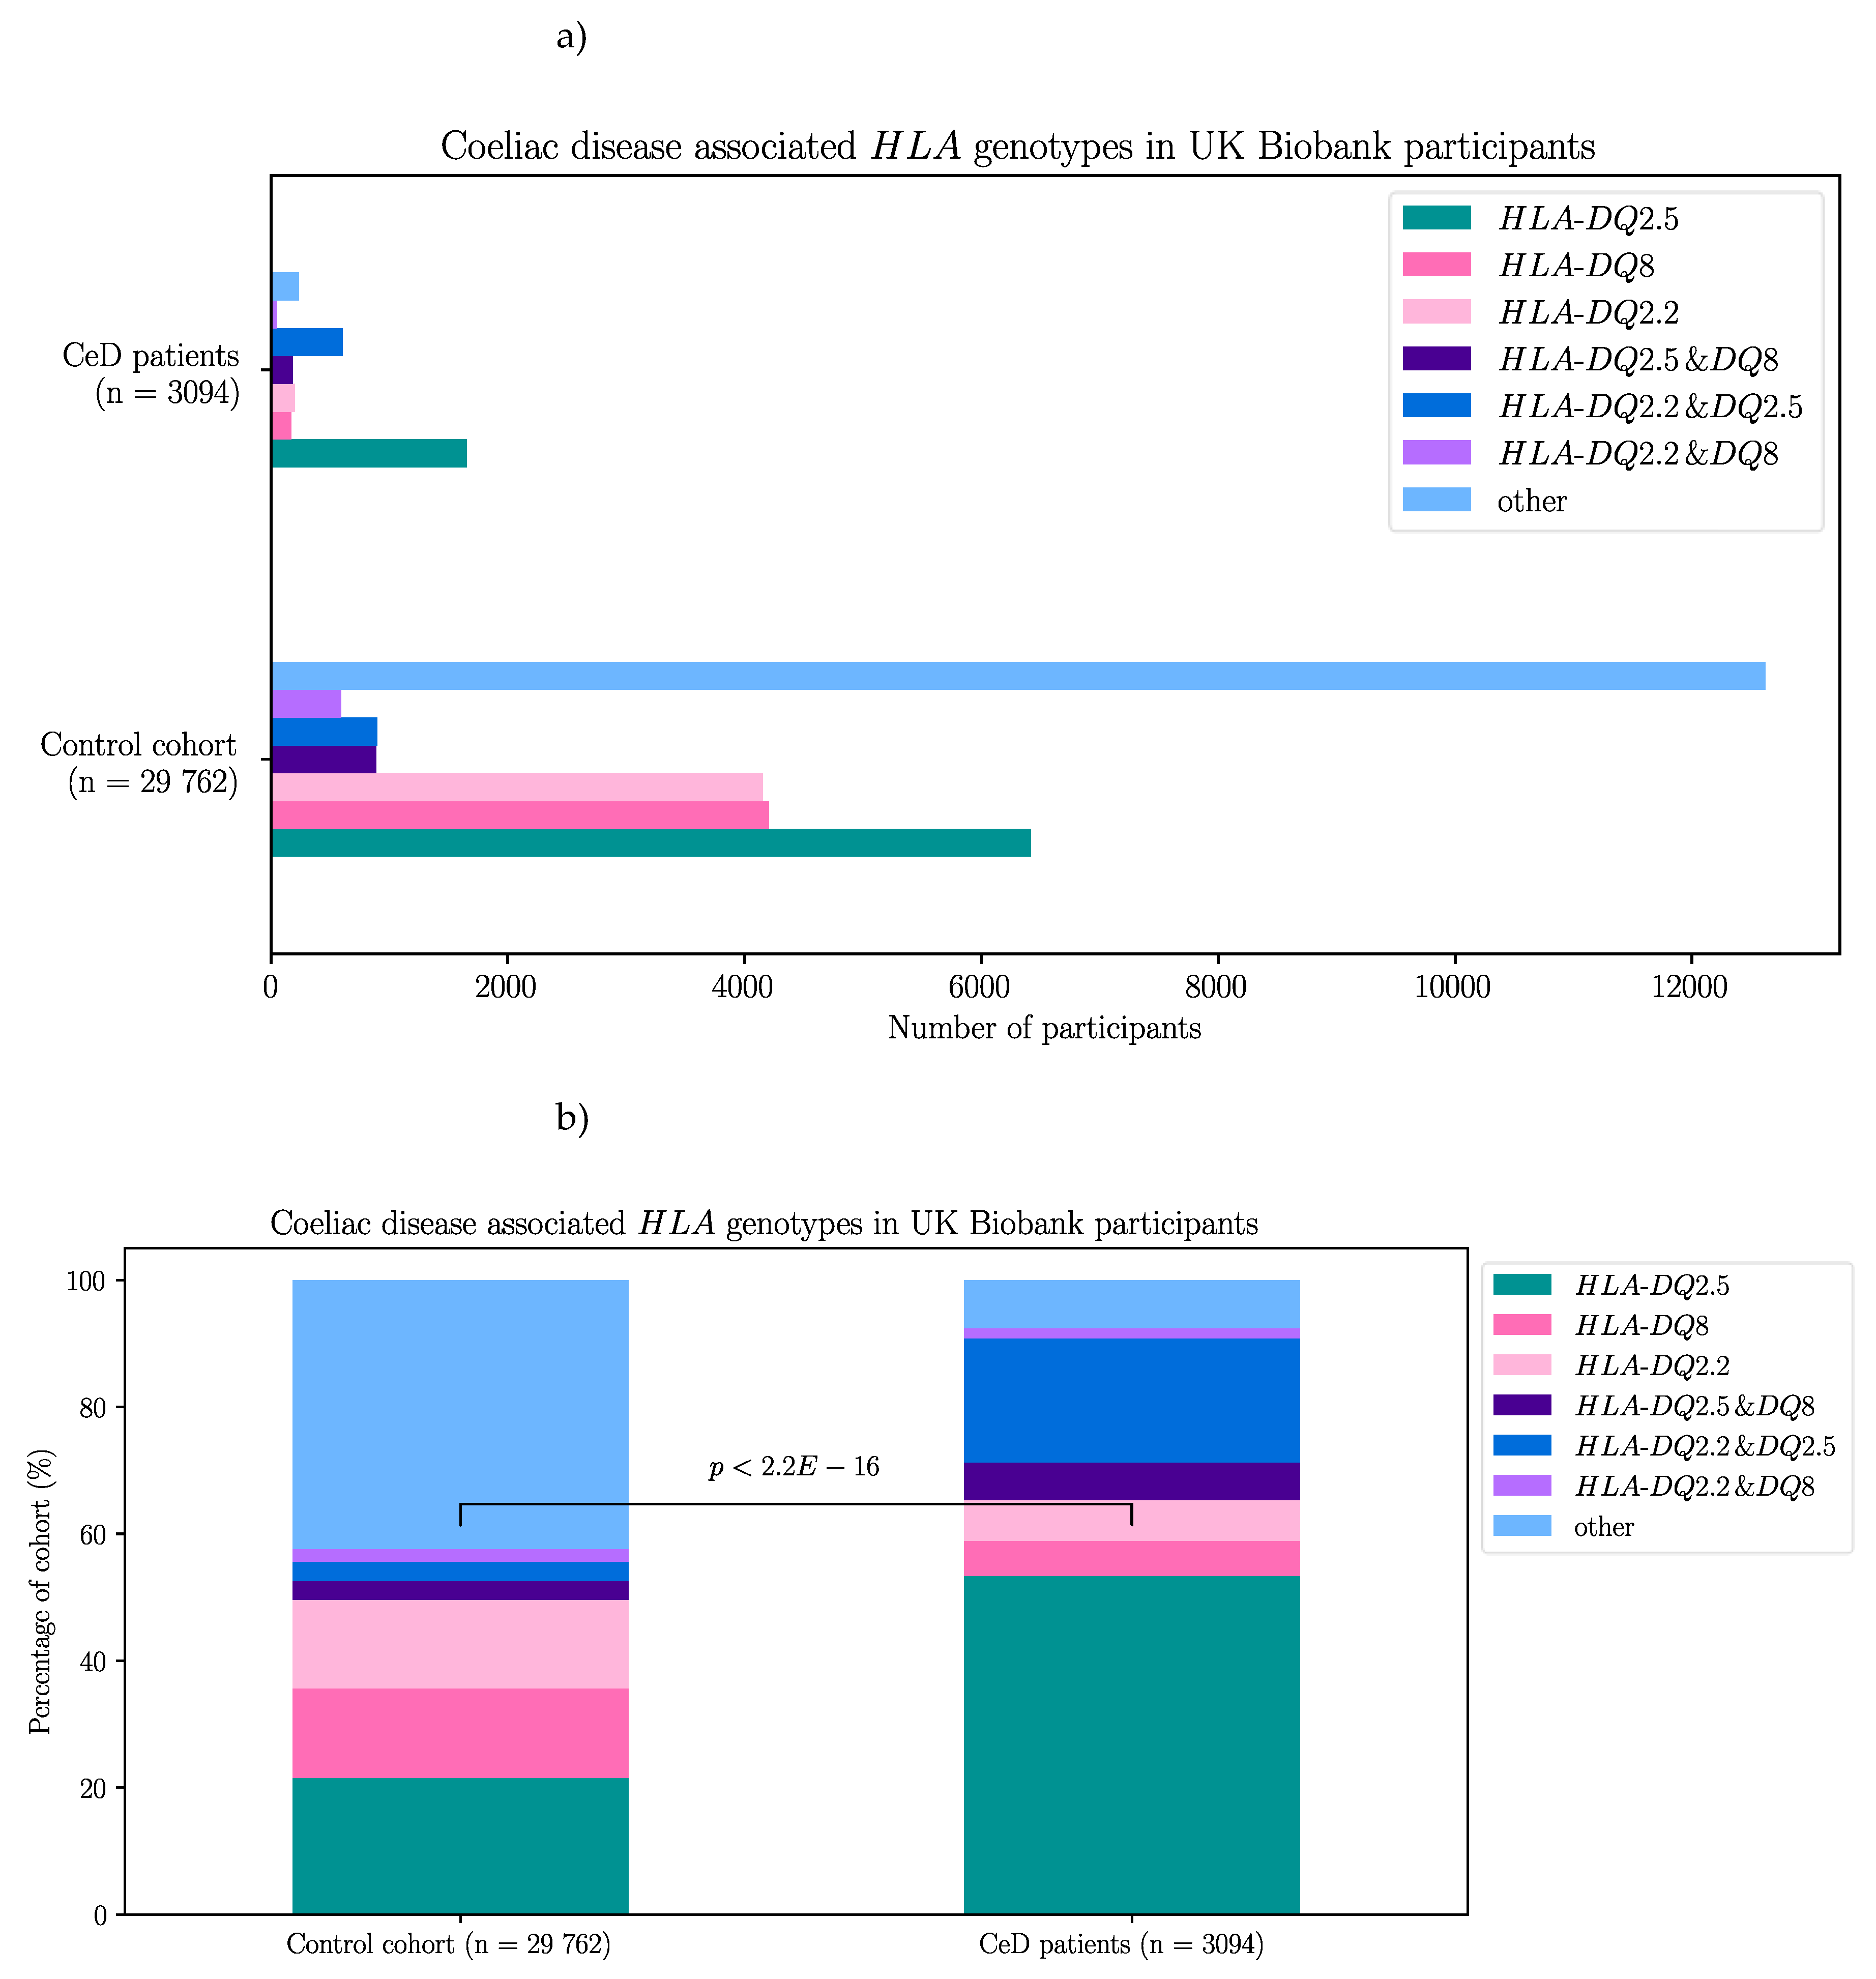
Table 1.
Coefficients of the binomial regression model investigating CeD risk HLA genotypes as a predictor variable for CeD status in the UK Biobank dataset. Results of the binomial generalised linear model testing the association between CeD status and CeD risk associated HLA genotypes in the UK Biobank dataset. Abbreviations: NA: not applicable; ns: not significant.
| HLAgenotype | Coefficient estimate | Standard error | z value | p-value | CeD risk |
| HLA-DQ2.2, HLA-DQ2.5 | 2.649 | 0.090 | 29.550 | < 2E-16 | Increase |
| HLA-DQ2.2, HLA-DQ8 | 0.570 | 0.164 | 3.474 | 5.13E-04 | Increase |
| HLA-DQ2.5 | 1.682 | 0.078 | 21.662 | < 2E-16 | Increase |
| HLA-DQ2.5, HLA-DQ8 | 1.456 | 0.109 | 13.352 | < 2E-16 | Increase |
| HLA-DQ8 | -0.163 | 0.107 | -1.533 | 0.125 | ns |
| Other HLA genotype | -0.949 | 0.098 | -9.677 | < 2E-16 | Decrease |
| Constant | -3.039 | 0.073 | -41.872 | < 2E-16 | NA |
Table 2.
Single variant analysis of butyrophilin SNPs and CeD status without taking the HLA loci into account using the UK Biobank dataset. SNPs significantly associated with CeD status are in bold. Bonferroni correction was applied due to multiple testing.
Table 2.
Single variant analysis of butyrophilin SNPs and CeD status without taking the HLA loci into account using the UK Biobank dataset. SNPs significantly associated with CeD status are in bold. Bonferroni correction was applied due to multiple testing.
| SNP name | Gene | OR | upper | lower | adjusted p-value | ln(OR) |
| rs10484441_G | BTN2A1 | 1.138386 | 1.249955 | 1.038835 | 0.60789 | 0.129612 |
| rs12660069_C | BTN2A1 | 1.106915 | 1.299592 | 0.948994 | 1 | 0.101577 |
| rs13195402_G | BTN2A1 | 0.397002 | 0.424644 | 0.371261 | 4.67E-158 | -0.92381 |
| rs13195509_G | BTN2A1 | 0.424358 | 0.45231 | 0.398239 | 1.61E-151 | -0.85718 |
| rs13437351_G | BTN2A1 | 1.485538 | 1.91326 | 1.176198 | 0.14151 | 0.395777 |
| rs1407045_A | BTN2A1 | 1.314112 | 1.385827 | 1.246309 | 6.07E-22 | 0.273161 |
| rs142951857_A | BTN2A1 | 1.391065 | 3.107641 | 0.723169 | 1 | 0.33007 |
| rs143104579_G | BTN2A1 | 1.14068 | 1.405753 | 0.935552 | 1 | 0.131625 |
| rs146399224_T | BTN2A1 | 10963.24 | NA | 0.003938 | 1 | 9.302303 |
| rs148111655_G | BTN2A1 | 1.130613 | 2.537072 | 0.583563 | 1 | 0.12276 |
| rs2273558_A | BTN2A1 | 0.673125 | 0.711994 | 0.636428 | 1.69E-41 | -0.39582 |
| rs2893856_T | BTN2A1 | 0.839708 | 0.911101 | 0.772766 | 0.0032259 | -0.1747 |
| rs2893857_C | BTN2A1 | 1.142895 | 1.255236 | 1.042695 | 0.48083 | 0.133565 |
| rs3734539_C | BTN2A1 | 4032.285 | NA | 0.007 | 1 | 8.302088 |
| rs3734542_G | BTN2A1 | 0.425283 | 0.453292 | 0.39911 | 8.59E-151 | -0.855 |
| rs3734543_G | BTN2A1 | 0.430012 | 0.458993 | 0.402974 | 1.59E-140 | -0.84394 |
| rs3799380_T | BTN2A1 | 0.577632 | 0.611726 | 0.545555 | 8.59E-77 | -0.54882 |
| rs56296968_C | BTN2A1 | 0.54644 | 0.579504 | 0.515375 | 9.70E-89 | -0.60433 |
| rs6456724_T | BTN2A1 | 0.838697 | 0.91004 | 0.771803 | 0.00287 | -0.17591 |
| rs6907857_T | BTN2A1 | 1.433106 | 1.834039 | 1.140956 | 0.29414 | 0.359844 |
| rs6911470_C | BTN2A1 | 1.472809 | 1.963726 | 1.132407 | 0.57829 | 0.387171 |
| rs6929846_T | BTN2A1 | 0.813898 | 0.875261 | 0.756001 | 3.60E-06 | -0.20592 |
| rs7773913_C | BTN2A1 | 1.433061 | 1.833981 | 1.14092 | 0.29439 | 0.359813 |
| rs7773938_C | BTN2A1 | 0.548927 | 0.582092 | 0.517765 | 1.15E-87 | -0.59979 |
| rs77870445_T | BTN2A1 | 1.219723 | 1.609943 | 0.942473 | 1 | 0.198624 |
| rs9348718_A | BTN2A1 | 1.267016 | 1.454243 | 1.109411 | 0.06114 | 0.236664 |
| rs9358943_C | BTN2A1 | 1.768069 | 31.86429 | 0.363137 | 1 | 0.569888 |
| rs9358944_A | BTN2A1 | 0.546443 | 0.579355 | 0.515512 | 1.55E-89 | -0.60432 |
| rs9358945_A | BTN2A1 | 0.54552 | 0.578367 | 0.514649 | 4.37E-90 | -0.60602 |
| rs9461254_G | BTN2A1 | 1.464419 | 1.953756 | 1.125151 | 0.66799 | 0.381458 |
| rs10456045_G | BTN3A1 | 0.638826 | 0.674371 | 0.605202 | 2.97E-57 | -0.44812 |
| rs10807008_G | BTN3A1 | 1.091584 | 1.192289 | 1.001092 | 1 | 0.087629 |
| rs12200782_C | BTN3A1 | 1.138999 | 1.250121 | 1.039809 | 0.56581 | 0.13015 |
| rs12207930_C | BTN3A1 | 1.147602 | 1.241418 | 1.062201 | 0.05418 | 0.137674 |
| rs12208447_C | BTN3A1 | 1.284779 | 1.624554 | 1.030908 | 1 | 0.250586 |
| rs12214924_T | BTN3A1 | 1.147514 | 1.241076 | 1.062324 | 0.05283 | 0.137597 |
| rs143476765_A | BTN3A1 | 1.108868 | 4.616795 | 0.396888 | 1 | 0.10334 |
| rs144114619_T | BTN3A1 | 1.212854 | 2.147941 | 0.740604 | 1 | 0.192976 |
| rs145059723_A | BTN3A1 | 1.412767 | 4.034311 | 0.629895 | 1 | 0.34555 |
| rs1741738_A | BTN3A1 | 1.144367 | 1.242176 | 1.05573 | 0.11623 | 0.134851 |
| rs17610161_G | BTN3A1 | 1.097034 | 1.199223 | 1.005306 | 1 | 0.09261 |
| rs1796520_C | BTN3A1 | 0.758646 | 0.800004 | 0.719297 | 2.40E-22 | -0.27622 |
| rs3799378_A | BTN3A1 | 0.585559 | 0.61957 | 0.553499 | 2.92E-75 | -0.53519 |
| rs3857549_C | BTN3A1 | 1.247408 | 1.401099 | 1.114594 | 0.01526 | 0.221068 |
| rs3902051_A | BTN3A1 | 1.090365 | 1.187959 | 1.002366 | 1 | 0.086513 |
| rs41266839_G | BTN3A1 | 0.396746 | 0.423498 | 0.37178 | 2.12E-168 | -0.92446 |
| rs4609015_T | BTN3A1 | 1.151594 | 1.245578 | 1.066033 | 0.03817 | 0.141147 |
| rs4712990_C | BTN3A1 | 1.101764 | 1.203269 | 1.010539 | 1 | 0.096912 |
| rs55676749_T | BTN3A1 | 1.13993 | 1.38368 | 0.948273 | 1 | 0.130967 |
| rs56161420_G | BTN3A1 | 1.138909 | 1.230815 | 1.055142 | 0.09381 | 0.130071 |
| rs6900725_T | BTN3A1 | 1.149401 | 1.242804 | 1.064341 | 0.04333 | 0.139241 |
| rs6912853_C | BTN3A1 | 1.16488 | 1.257236 | 1.080577 | 0.00785 | 0.152618 |
| rs6920986_C | BTN3A1 | 1.148238 | 1.241884 | 1.062975 | 0.04995 | 0.138228 |
| rs6921148_T | BTN3A1 | 1.165176 | 1.411589 | 0.971033 | 1 | 0.152872 |
| rs742090_A | BTN3A1 | 0.759078 | 0.800536 | 0.719639 | 3.58E-22 | -0.27565 |
| rs7770214_G | BTN3A1 | 1.145779 | 1.239155 | 1.060758 | 0.06048 | 0.136085 |
| rs80153343_G | BTN3A1 | 1.136899 | 1.439622 | 0.910733 | 1 | 0.128305 |
| rs11758089_T | BTN3A2 | 1.192878 | 1.288514 | 1.105674 | 0.00063 | 0.176369 |
| rs12176317_A | BTN3A2 | 0.445307 | 0.474099 | 0.41837 | 6.72E-140 | -0.80899 |
| rs12194095_C | BTN3A2 | 1.118798 | 1.235914 | 1.015164 | 1 | 0.112255 |
| rs12199613_C | BTN3A2 | 0.67037 | 0.706851 | 0.635751 | 1.76E-47 | -0.39993 |
| rs12205731_G | BTN3A2 | 1.114755 | 1.232063 | 1.011029 | 1 | 0.108634 |
| rs144016445_G | BTN3A2 | 81101.36 | NA | 217.0251 | 1 | 11.30346 |
| rs1977_A | BTN3A2 | 0.445697 | 0.474831 | 0.418455 | 1.17E-136 | -0.80811 |
| rs1979_G | BTN3A2 | 0.44537 | 0.474171 | 0.418426 | 8.23E-140 | -0.80885 |
| rs1985732_A | BTN3A2 | 0.63289 | 0.668226 | 0.599467 | 2.87E-59 | -0.45746 |
| rs2073526_G | BTN3A2 | 0.74435 | 0.785579 | 0.705115 | 9.15E-25 | -0.29524 |
| rs35183513_G | BTN3A2 | 1.102861 | 1.203659 | 1.012184 | 1 | 0.097908 |
| rs58367598_T | BTN3A2 | 1.234256 | 1.449383 | 1.057523 | 0.89091 | 0.210469 |
| rs7765566_G | BTN3A2 | 1.269787 | 1.499163 | 1.083157 | 0.39847 | 0.23885 |
| rs9104_G | BTN3A2 | 1.092904 | 1.187567 | 1.007255 | 1 | 0.088838 |
| rs9358934_G | BTN3A2 | 0.447824 | 0.476845 | 0.420678 | 2.34E-137 | -0.80335 |
| rs9379855_T | BTN3A2 | 0.447682 | 0.47666 | 0.420575 | 8.85E-138 | -0.80367 |
| rs9379858_T | BTN3A2 | 0.448449 | 0.477474 | 0.421299 | 3.19E-137 | -0.80196 |
| rs9379859_C | BTN3A2 | 0.447843 | 0.476903 | 0.420662 | 5.37E-137 | -0.80331 |
| rs9379861_G | BTN3A2 | 1.225507 | 1.619363 | 0.945713 | 1 | 0.203355 |
| rs9393713_G | BTN3A2 | 0.442958 | 0.471602 | 0.416159 | 1.07E-141 | -0.81428 |
| rs9393714_G | BTN3A2 | 0.443419 | 0.47214 | 0.416551 | 6.99E-141 | -0.81324 |
| rs186813312_C | BTNL3 | 0.103966 | NA | NA | NA | -2.26369 |
| rs199970076_G | BTNL3 | 0.544013 | 10.42476 | 0.087697 | 1 | -0.60878 |
| rs201534771_G | BTNL3 | 0.108957 | NA | NA | NA | -2.2168 |
| rs201813197_C | BTNL3 | 1.141842 | 4.74926 | 0.409599 | 1 | 0.132642 |
| rs35157246_C | BTNL3 | 1.069831 | 1.242264 | 0.926052 | 1 | 0.067501 |
| rs4700774_G | BTNL3 | 0.943446 | 0.999778 | 0.89061 | 1 | -0.05822 |
| rs59220426_C | BTNL3 | 1.006054 | 1.132599 | 0.896669 | 1 | 0.006036 |
| rs73815153_G | BTNL3 | 1.009988 | 1.138564 | 0.899028 | 1 | 0.009938 |
| rs7713324_A | BTNL3 | 1.004294 | 1.130736 | 0.895001 | 1 | 0.004284 |
| rs7726604_C | BTNL3 | 1.004751 | 1.13121 | 0.895444 | 1 | 0.00474 |
| rs112469887_G | BTNL8 | 1.084234 | 1.330225 | 0.893133 | 1 | 0.080874 |
| rs113071395_G | BTNL8 | 0.867372 | 1.006007 | 0.751681 | 1 | -0.14229 |
| rs113534626_A | BTNL8 | 1.019956 | 1.206531 | 0.868252 | 1 | 0.019759 |
| rs141492316_T | BTNL8 | 0.891806 | 1.095588 | 0.733483 | 1 | -0.11451 |
| rs145199317_A | BTNL8 | 0.907765 | 1.254932 | 0.673198 | 1 | -0.09677 |
| rs151174174_C | BTNL8 | 0.770441 | 0.932722 | 0.641625 | 0.63031 | -0.26079 |
| rs17704291_C | BTNL8 | 0.940216 | 0.996283 | 0.88763 | 1 | -0.06165 |
| rs200633883_C | BTNL8 | 0.311552 | 1.114968 | 0.108457 | 1 | -1.16619 |
| rs201214790_T | BTNL8 | 4044.713 | NA | 1.08E-07 | 1 | 8.305166 |
| rs201891387_G | BTNL8 | 0.62355 | 2.663098 | 0.210953 | 1 | -0.47233 |
| rs2276995_A | BTNL8 | 0.983681 | 1.038422 | 0.931987 | 1 | -0.01645 |
| rs2619739_C | BTNL8 | 1.101246 | 1.212402 | 1.002386 | 1 | 0.096442 |
| rs7724813_G | BTNL8 | 1.078621 | 1.169543 | 0.996169 | 1 | 0.075683 |
Table 3.
SNP and allele count data for the significant SNPs from the non-HLA model. These SNPs were significantly associated with CeD status in single variant testing of the UK Biobank dataset. The SNPs in bold remained significantly associated with CeD status in the binomial regression models that took the HLA genotype of individuals into account.
| SNP, reference allele | Gene | Number of the SNP in control | Number of the SNP in CeD | Total allele count in control | Total allele count in CeD | Total number of the SNP in the UK Biobank | Total allele count in UK Biobank |
| rs13195402_G | BTN2A1 | 52060 | 4631 | 58392 | 6028 | 56691 | 64420 |
| rs13195509_G | BTN2A1 | 52271 | 4654 | 59474 | 6176 | 56925 | 65650 |
| rs1407045_A | BTN2A1 | 30596 | 3603 | 59306 | 6172 | 34199 | 65478 |
| rs2273558_A | BTN2A1 | 34599 | 3248 | 51134 | 5570 | 37847 | 56704 |
| rs2893856_T | BTN2A1 | 7815 | 697 | 59452 | 6182 | 8512 | 65634 |
| rs3734542_G | BTN2A1 | 52209 | 4656 | 59432 | 6180 | 56865 | 65612 |
| rs3734543_G | BTN2A1 | 52002 | 4644 | 59146 | 6114 | 56646 | 65260 |
| rs3799380_T | BTN2A1 | 46887 | 4213 | 59354 | 6164 | 51100 | 65518 |
| rs56296968_C | BTN2A1 | 47941 | 4295 | 59422 | 6170 | 52236 | 65592 |
| rs6456724_T | BTN2A1 | 7813 | 696 | 59418 | 6178 | 8509 | 65596 |
| rs6929846_T | BTN2A1 | 10355 | 903 | 59460 | 6180 | 11258 | 65640 |
| rs7773938_C | BTN2A1 | 47953 | 4289 | 59472 | 6162 | 52242 | 65634 |
| rs9358944_A | BTN2A1 | 47929 | 4294 | 59462 | 6182 | 52223 | 65644 |
| rs9358945_A | BTN2A1 | 47944 | 4292 | 59478 | 6182 | 52236 | 65660 |
| rs10456045_G | BTN3A1 | 41458 | 3680 | 59434 | 6174 | 45138 | 65608 |
| rs1796520_C | BTN3A1 | 28075 | 2504 | 59240 | 6176 | 30579 | 65416 |
| rs3799378_A | BTN3A1 | 45113 | 4017 | 59206 | 6152 | 49130 | 65358 |
| rs3857549_C | BTN3A1 | 55572 | 5848 | 59430 | 6170 | 61420 | 65600 |
| rs41266839_G | BTN3A1 | 52985 | 4720 | 59430 | 6178 | 57705 | 65608 |
| rs4609015_T | BTN3A1 | 50759 | 5371 | 59452 | 6170 | 56130 | 65622 |
| rs6900725_T | BTN3A1 | 50682 | 5378 | 59392 | 6182 | 56060 | 65574 |
| rs6912853_C | BTN3A1 | 50145 | 5329 | 59434 | 6176 | 55474 | 65610 |
| rs6920986_C | BTN3A1 | 50787 | 5381 | 59464 | 6182 | 56168 | 65646 |
| rs742090_A | BTN3A1 | 28172 | 2506 | 59438 | 6174 | 30678 | 65612 |
| rs11758089_T | BTN3A2 | 50176 | 5354 | 59432 | 6182 | 55530 | 65614 |
| rs12176317_A | BTN3A2 | 51604 | 4597 | 59488 | 6182 | 56201 | 65670 |
| rs12199613_C | BTN3A2 | 36321 | 3178 | 59396 | 6178 | 39499 | 65574 |
| rs1977_A | BTN3A2 | 50506 | 4497 | 58436 | 6074 | 55003 | 64510 |
| rs1979_G | BTN3A2 | 51551 | 4590 | 59448 | 6176 | 56141 | 65624 |
| rs1985732_A | BTN3A2 | 41492 | 3674 | 59442 | 6174 | 45166 | 65616 |
| rs2073526_G | BTN3A2 | 26272 | 2288 | 59434 | 6176 | 28560 | 65610 |
| rs9358934_G | BTN3A2 | 51477 | 4591 | 59412 | 6174 | 56068 | 65586 |
| rs9379855_T | BTN3A2 | 51458 | 4579 | 59392 | 6162 | 56037 | 65554 |
| rs9379858_T | BTN3A2 | 51474 | 4586 | 59422 | 6170 | 56060 | 65592 |
| rs9379859_C | BTN3A2 | 51530 | 4595 | 59452 | 6174 | 56125 | 65626 |
| rs9393713_G | BTN3A2 | 51601 | 4590 | 59472 | 6178 | 56191 | 65650 |
| rs9393714_G | BTN3A2 | 51581 | 4594 | 59456 | 6180 | 56175 | 65636 |
Table 4.
Single variant analysis of butyrophilin SNPs and CeD status in binomial regression models that took the HLA loci into account using the UK Biobank dataset. SNPs significantly associated with CeD status are in bold. Bonferroni correction was applied due to multiple testing.
Table 4.
Single variant analysis of butyrophilin SNPs and CeD status in binomial regression models that took the HLA loci into account using the UK Biobank dataset. SNPs significantly associated with CeD status are in bold. Bonferroni correction was applied due to multiple testing.
| SNP name | Gene | OR | upper | lower | adjusted p-value | ln(OR) |
| rs10484441_G | BTN2A1 | 0.979307 | 1.082186 | 0.887707 | 1 | -0.02091 |
| rs12660069_C | BTN2A1 | 0.987937 | 1.171444 | 0.837975 | 1 | -0.01214 |
| rs13195402_G | BTN2A1 | 0.812801 | 0.876887 | 0.753657 | 8.15E-06 | -0.20727 |
| rs13195509_G | BTN2A1 | 0.824983 | 0.886694 | 0.767819 | 1.62E-05 | -0.19239 |
| rs13437351_G | BTN2A1 | 1.359939 | 1.781839 | 1.056236 | 1 | 0.30744 |
| rs1407045_A | BTN2A1 | 1.061681 | 1.125065 | 1.001972 | 1 | 0.059854 |
| rs142951857_A | BTN2A1 | 1.189393 | 2.744421 | 0.589877 | 1 | 0.173443 |
| rs143104579_G | BTN2A1 | 1.045598 | 1.306706 | 0.844534 | 1 | 0.044589 |
| rs146399224_T | BTN2A1 | 2678.29 | NA | 0.001107 | 1 | 7.892934 |
| rs148111655_G | BTN2A1 | 1.06888 | 2.495456 | 0.522042 | 1 | 0.066611 |
| rs2273558_A | BTN2A1 | 0.924046 | 0.983637 | 0.868186 | 1 | -0.07899 |
| rs2893856_T | BTN2A1 | 0.978844 | 1.068109 | 0.895906 | 1 | -0.02138 |
| rs2893857_C | BTN2A1 | 0.983276 | 1.0868 | 0.891136 | 1 | -0.01687 |
| rs3734539_C | BTN2A1 | 12320.17 | NA | 2.26E-05 | 1 | 9.418993 |
| rs3734542_G | BTN2A1 | 0.828358 | 0.890318 | 0.770964 | 2.94E-05 | -0.18831 |
| rs3734543_G | BTN2A1 | 0.845824 | 0.910556 | 0.785966 | 0.000823 | -0.16744 |
| rs3799380_T | BTN2A1 | 0.906299 | 0.966317 | 0.850232 | 0.260718 | -0.09839 |
| rs56296968_C | BTN2A1 | 0.889118 | 0.949206 | 0.833053 | 0.042016 | -0.11753 |
| rs6456724_T | BTN2A1 | 0.975504 | 1.064451 | 0.892856 | 1 | -0.0248 |
| rs6907857_T | BTN2A1 | 1.296362 | 1.68837 | 1.012123 | 1 | 0.259562 |
| rs6911470_C | BTN2A1 | 1.225626 | 1.666065 | 0.92177 | 1 | 0.203452 |
| rs6929846_T | BTN2A1 | 0.956691 | 1.034347 | 0.884033 | 1 | -0.04427 |
| rs7773913_C | BTN2A1 | 1.29982 | 1.692843 | 1.014844 | 1 | 0.262226 |
| rs7773938_C | BTN2A1 | 0.892443 | 0.95269 | 0.83623 | 0.062934 | -0.11379 |
| rs77870445_T | BTN2A1 | 0.971098 | 1.300178 | 0.738108 | 1 | -0.02933 |
| rs9348718_A | BTN2A1 | 1.100624 | 1.274443 | 0.954703 | 1 | 0.095877 |
| rs9358943_C | BTN2A1 | 0.455962 | 8.266602 | 0.091903 | 1 | -0.78535 |
| rs9358944_A | BTN2A1 | 0.888825 | 0.948639 | 0.833001 | 0.038293 | -0.11786 |
| rs9358945_A | BTN2A1 | 0.886765 | 0.946407 | 0.831099 | 0.02906 | -0.12018 |
| rs9461254_G | BTN2A1 | 1.206876 | 1.642976 | 0.90642 | 1 | 0.188035 |
| rs10456045_G | BTN3A1 | 0.918688 | 0.975087 | 0.865666 | 0.527112 | -0.08481 |
| rs10807008_G | BTN3A1 | 0.94089 | 1.033981 | 0.857412 | 1 | -0.06093 |
| rs12200782_C | BTN3A1 | 0.987553 | 1.090084 | 0.896183 | 1 | -0.01253 |
| rs12207930_C | BTN3A1 | 0.994811 | 1.081946 | 0.91566 | 1 | -0.0052 |
| rs12208447_C | BTN3A1 | 0.971864 | 1.246094 | 0.767755 | 1 | -0.02854 |
| rs12214924_T | BTN3A1 | 0.997777 | 1.08479 | 0.918712 | 1 | -0.00223 |
| rs143476765_A | BTN3A1 | 0.541997 | 2.391824 | 0.175983 | 1 | -0.61249 |
| rs144114619_T | BTN3A1 | 0.937876 | 1.708275 | 0.552209 | 1 | -0.06414 |
| rs145059723_A | BTN3A1 | 0.851224 | 2.534279 | 0.356178 | 1 | -0.16108 |
| rs1741738_A | BTN3A1 | 1.055187 | 1.152999 | 0.966854 | 1 | 0.053718 |
| rs17610161_G | BTN3A1 | 0.948685 | 1.04337 | 0.863865 | 1 | -0.05268 |
| rs1796520_C | BTN3A1 | 0.925332 | 0.980491 | 0.873166 | 0.877114 | -0.0776 |
| rs3799378_A | BTN3A1 | 0.866517 | 0.922476 | 0.814111 | 0.000704 | -0.14327 |
| rs3857549_C | BTN3A1 | 1.20727 | 1.366146 | 1.0703 | 0.249929 | 0.188361 |
| rs3902051_A | BTN3A1 | 0.947893 | 1.038919 | 0.865991 | 1 | -0.05351 |
| rs41266839_G | BTN3A1 | 0.806793 | 0.868508 | 0.749711 | 1.06E-06 | -0.21469 |
| rs4609015_T | BTN3A1 | 0.999771 | 1.087084 | 0.920447 | 1 | -0.00023 |
| rs4712990_C | BTN3A1 | 0.953022 | 1.047148 | 0.8686 | 1 | -0.04812 |
| rs55676749_T | BTN3A1 | 1.055136 | 1.295119 | 0.867029 | 1 | 0.05367 |
| rs56161420_G | BTN3A1 | 1.003319 | 1.090026 | 0.92446 | 1 | 0.003313 |
| rs6900725_T | BTN3A1 | 0.998519 | 1.085343 | 0.919613 | 1 | -0.00148 |
| rs6912853_C | BTN3A1 | 1.060948 | 1.150125 | 0.979684 | 1 | 0.059162 |
| rs6920986_C | BTN3A1 | 0.997232 | 1.08425 | 0.918167 | 1 | -0.00277 |
| rs6921148_T | BTN3A1 | 1.075901 | 1.317605 | 0.885986 | 1 | 0.073159 |
| rs742090_A | BTN3A1 | 0.927391 | 0.982792 | 0.875004 | 1 | -0.07538 |
| rs7770214_G | BTN3A1 | 0.992737 | 1.079363 | 0.914026 | 1 | -0.00729 |
| rs80153343_G | BTN3A1 | 1.144379 | 1.465945 | 0.904679 | 1 | 0.134862 |
| rs11758089_T | BTN3A2 | 1.093163 | 1.188249 | 1.00675 | 1 | 0.089075 |
| rs12176317_A | BTN3A2 | 0.820862 | 0.880647 | 0.765377 | 3.50E-06 | -0.1974 |
| rs12194095_C | BTN3A2 | 0.971352 | 1.079478 | 0.875824 | 1 | -0.02907 |
| rs12199613_C | BTN3A2 | 0.884297 | 0.93714 | 0.834446 | 0.003312 | -0.12296 |
| rs12205731_G | BTN3A2 | 0.970415 | 1.079025 | 0.874528 | 1 | -0.03003 |
| rs144016445_G | BTN3A2 | 38750.66 | NA | 151.7424 | 1 | 10.5649 |
| rs1977_A | BTN3A2 | 0.816781 | 0.87678 | 0.761121 | 2.06E-06 | -0.20238 |
| rs1979_G | BTN3A2 | 0.820729 | 0.880499 | 0.765255 | 3.40E-06 | -0.19756 |
| rs1985732_A | BTN3A2 | 0.896055 | 0.951463 | 0.84398 | 0.033488 | -0.10975 |
| rs2073526_G | BTN3A2 | 0.925312 | 0.980986 | 0.872648 | 0.940603 | -0.07762 |
| rs35183513_G | BTN3A2 | 0.951537 | 1.044843 | 0.867784 | 1 | -0.04968 |
| rs58367598_T | BTN3A2 | 1.089293 | 1.290835 | 0.924221 | 1 | 0.085529 |
| rs7765566_G | BTN3A2 | 1.145085 | 1.363507 | 0.967785 | 1 | 0.135479 |
| rs9104_G | BTN3A2 | 0.945089 | 1.032973 | 0.86575 | 1 | -0.05648 |
| rs9358934_G | BTN3A2 | 0.824601 | 0.884767 | 0.76877 | 7.53E-06 | -0.19286 |
| rs9379855_T | BTN3A2 | 0.82361 | 0.883636 | 0.767905 | 6.04E-06 | -0.19406 |
| rs9379858_T | BTN3A2 | 0.825671 | 0.885867 | 0.769811 | 8.99E-06 | -0.19156 |
| rs9379859_C | BTN3A2 | 0.824802 | 0.885058 | 0.768893 | 8.10E-06 | -0.19261 |
| rs9379861_G | BTN3A2 | 1.039521 | 1.399242 | 0.785634 | 1 | 0.03876 |
| rs9393713_G | BTN3A2 | 0.814157 | 0.873453 | 0.759123 | 9.27E-07 | -0.2056 |
| rs9393714_G | BTN3A2 | 0.818022 | 0.877663 | 0.762671 | 2.08E-06 | -0.20087 |
| rs186813312_C | BTNL3 | 0.387143 | NA | NA | NA | -0.94896 |
| rs199970076_G | BTNL3 | 0.890096 | 19.02105 | 0.105649 | 1 | -0.11643 |
| rs201534771_G | BTNL3 | 0.373628 | NA | NA | NA | -0.98449 |
| rs201813197_C | BTNL3 | 0.906025 | 3.98319 | 0.295074 | 1 | -0.09869 |
| rs35157246_C | BTNL3 | 1.061269 | 1.243749 | 0.909647 | 1 | 0.059466 |
| rs4700774_G | BTNL3 | 0.953121 | 1.014114 | 0.896074 | 1 | -0.04801 |
| rs59220426_C | BTNL3 | 0.964396 | 1.094724 | 0.852069 | 1 | -0.03625 |
| rs73815153_G | BTNL3 | 0.979858 | 1.113514 | 0.864825 | 1 | -0.02035 |
| rs7713324_A | BTNL3 | 0.962434 | 1.092563 | 0.850278 | 1 | -0.03829 |
| rs7726604_C | BTNL3 | 0.963325 | 1.093541 | 0.851096 | 1 | -0.03736 |
| rs112469887_G | BTNL8 | 1.04641 | 1.299262 | 0.850631 | 1 | 0.045365 |
| rs113071395_G | BTNL8 | 0.908391 | 1.065436 | 0.777899 | 1 | -0.09608 |
| rs113534626_A | BTNL8 | 1.008072 | 1.204841 | 0.848563 | 1 | 0.00804 |
| rs141492316_T | BTNL8 | 0.930335 | 1.160408 | 0.752616 | 1 | -0.07221 |
| rs145199317_A | BTNL8 | 0.884686 | 1.250181 | 0.639686 | 1 | -0.12252 |
| rs151174174_C | BTNL8 | 0.828069 | 1.016412 | 0.679378 | 1 | -0.18866 |
| rs17704291_C | BTNL8 | 0.952291 | 1.013025 | 0.895481 | 1 | -0.04888 |
| rs200633883_C | BTNL8 | 0.419543 | 1.675223 | 0.123618 | 1 | -0.86859 |
| rs201214790_T | BTNL8 | 740.6942 | NA | 1.97E-08 | 1 | 6.607588 |
| rs201891387_G | BTNL8 | 0.495896 | 2.269513 | 0.147322 | 1 | -0.70139 |
| rs2276995_A | BTNL8 | 0.984754 | 1.043162 | 0.929755 | 1 | -0.01536 |
| rs2619739_C | BTNL8 | 1.078254 | 1.194765 | 0.974928 | 1 | 0.075343 |
| rs7724813_G | BTNL8 | 1.054983 | 1.150319 | 0.968751 | 1 | 0.053525 |
Table 5.
Single variant analysis of butyrophilin SNPs and CeD status using binomial regression models on the HLA-DQ2.5-matched case-control cohort of the UK Biobank database. SNPs significantly associated with CeD status are in bold. Bonferroni correction was applied due to multiple testing.
Table 5.
Single variant analysis of butyrophilin SNPs and CeD status using binomial regression models on the HLA-DQ2.5-matched case-control cohort of the UK Biobank database. SNPs significantly associated with CeD status are in bold. Bonferroni correction was applied due to multiple testing.
| SNP name | gene | OR | upper | lower | adjusted p-value | ln(OR) |
| rs10484441_G | BTN2A1 | 1.026879 | 1.182655 | 0.894513 | 1 | 0.026524 |
| rs12660069_C | BTN2A1 | 0.954382 | 1.207579 | 0.761803 | 1 | -0.04669 |
| rs13195402_G | BTN2A1 | 0.757206 | 0.831328 | 0.689864 | 5.10E-07 | -0.27812 |
| rs13195509_G | BTN2A1 | 0.77459 | 0.846648 | 0.708837 | 1.75E-06 | -0.25542 |
| rs13437351_G | BTN2A1 | 1.400742 | 2.090478 | 0.973921 | 1 | 0.337002 |
| rs1407045_A | BTN2A1 | 1.080193 | 1.170756 | 0.996977 | 1 | 0.07714 |
| rs142951857_A | BTN2A1 | 1.287748 | 4.431929 | 0.486536 | 1 | 0.252895 |
| rs143104579_G | BTN2A1 | 1.331616 | 1.885897 | 0.963027 | 1 | 0.286393 |
| rs146399224_T | BTN2A1 | 0.25741 | NA | NA | NA | -1.35708 |
| rs148111655_G | BTN2A1 | 0.944297 | 4.178925 | 0.294481 | 1 | -0.05731 |
| rs2273558_A | BTN2A1 | 0.892885 | 0.971388 | 0.820718 | 0.848901 | -0.1133 |
| rs2893856_T | BTN2A1 | 0.927404 | 1.048809 | 0.818043 | 1 | -0.07537 |
| rs2893857_C | BTN2A1 | 1.040565 | 1.199279 | 0.905854 | 1 | 0.039764 |
| rs3734539_C | BTN2A1 | 27166.76 | NA | 9.99E-14 | 1 | 10.20975 |
| rs3734542_G | BTN2A1 | 0.77697 | 0.849181 | 0.711073 | 2.52E-06 | -0.25235 |
| rs3734543_G | BTN2A1 | 0.792317 | 0.867952 | 0.723463 | 5.43E-05 | -0.23279 |
| rs3799380_T | BTN2A1 | 0.869548 | 0.945573 | 0.799787 | 0.107572 | -0.13978 |
| rs56296968_C | BTN2A1 | 0.852755 | 0.928301 | 0.783513 | 0.02331 | -0.15928 |
| rs6456724_T | BTN2A1 | 0.924581 | 1.045479 | 0.815654 | 1 | -0.07841 |
| rs6907857_T | BTN2A1 | 1.401132 | 2.091061 | 0.974192 | 1 | 0.33728 |
| rs6911470_C | BTN2A1 | 1.565436 | 2.679723 | 0.978088 | 1 | 0.448164 |
| rs6929846_T | BTN2A1 | 0.870873 | 0.973832 | 0.777255 | 1 | -0.13826 |
| rs7773913_C | BTN2A1 | 1.408409 | 2.10183 | 0.979326 | 1 | 0.34246 |
| rs7773938_C | BTN2A1 | 0.854233 | 0.929778 | 0.784985 | 0.026611 | -0.15755 |
| rs77870445_T | BTN2A1 | 1.022451 | 1.530146 | 0.704151 | 1 | 0.022203 |
| rs9348718_A | BTN2A1 | 1.308813 | 1.636793 | 1.057849 | 1 | 0.26912 |
| rs9358943_C | BTN2A1 | 0.257602 | NA | NA | NA | -1.35634 |
| rs9358944_A | BTN2A1 | 0.850121 | 0.924966 | 0.781482 | 0.016059 | -0.16238 |
| rs9358945_A | BTN2A1 | 0.847905 | 0.922571 | 0.77943 | 0.012607 | -0.16499 |
| rs9461254_G | BTN2A1 | 1.565001 | 2.678973 | 0.977818 | 1 | 0.447886 |
| rs10456045_G | BTN3A1 | 0.872024 | 0.944198 | 0.805371 | 0.074344 | -0.13694 |
| rs10807008_G | BTN3A1 | 0.988264 | 1.128972 | 0.867514 | 1 | -0.01181 |
| rs12200782_C | BTN3A1 | 0.969241 | 1.112166 | 0.84719 | 1 | -0.03124 |
| rs12207930_C | BTN3A1 | 1.059407 | 1.19361 | 0.94228 | 1 | 0.05771 |
| rs12208447_C | BTN3A1 | 1.183033 | 1.71485 | 0.838562 | 1 | 0.168081 |
| rs12214924_T | BTN3A1 | 1.059617 | 1.192843 | 0.943249 | 1 | 0.057908 |
| rs143476765_A | BTN3A1 | 0.385935 | 2.931895 | 0.063895 | 1 | -0.95209 |
| rs144114619_T | BTN3A1 | 0.800306 | 1.80142 | 0.391948 | 1 | -0.22276 |
| rs145059723_A | BTN3A1 | 1.546934 | 29.22579 | 0.264012 | 1 | 0.436275 |
| rs1741738_A | BTN3A1 | 1.126398 | 1.288465 | 0.987689 | 1 | 0.119025 |
| rs17610161_G | BTN3A1 | 0.999336 | 1.142965 | 0.876283 | 1 | -0.00066 |
| rs1796520_C | BTN3A1 | 0.901974 | 0.977599 | 0.831877 | 1 | -0.10317 |
| rs3799378_A | BTN3A1 | 0.829346 | 0.900397 | 0.763968 | 0.00081 | -0.18712 |
| rs3857549_C | BTN3A1 | 1.307821 | 1.557482 | 1.105147 | 0.217446 | 0.268362 |
| rs3902051_A | BTN3A1 | 0.979611 | 1.113404 | 0.864043 | 1 | -0.0206 |
| rs41266839_G | BTN3A1 | 0.753767 | 0.824792 | 0.68903 | 7.25E-08 | -0.28267 |
| rs4609015_T | BTN3A1 | 1.055122 | 1.187787 | 0.939241 | 1 | 0.053657 |
| rs4712990_C | BTN3A1 | 1.009758 | 1.153906 | 0.886126 | 1 | 0.00971 |
| rs55676749_T | BTN3A1 | 1.356015 | 1.867802 | 1.007293 | 1 | 0.30455 |
| rs56161420_G | BTN3A1 | 1.060354 | 1.193295 | 0.944184 | 1 | 0.058603 |
| rs6900725_T | BTN3A1 | 1.061349 | 1.194313 | 0.945175 | 1 | 0.059541 |
| rs6912853_C | BTN3A1 | 1.087423 | 1.216203 | 0.974151 | 1 | 0.08381 |
| rs6920986_C | BTN3A1 | 1.062734 | 1.196651 | 0.9458 | 1 | 0.060845 |
| rs6921148_T | BTN3A1 | 1.340282 | 1.834522 | 1.000858 | 1 | 0.29288 |
| rs742090_A | BTN3A1 | 0.903554 | 0.979423 | 0.833241 | 1 | -0.10142 |
| rs7770214_G | BTN3A1 | 1.053031 | 1.185369 | 0.937421 | 1 | 0.051673 |
| rs80153343_G | BTN3A1 | 0.979216 | 1.347528 | 0.724804 | 1 | -0.021 |
| rs11758089_T | BTN3A2 | 1.191327 | 1.352007 | 1.052499 | 0.618146 | 0.175068 |
| rs12176317_A | BTN3A2 | 0.766628 | 0.836949 | 0.702371 | 2.82E-07 | -0.26575 |
| rs12194095_C | BTN3A2 | 0.943672 | 1.092386 | 0.818034 | 1 | -0.05798 |
| rs12199613_C | BTN3A2 | 0.842231 | 0.911373 | 0.77819 | 0.002057 | -0.1717 |
| rs12205731_G | BTN3A2 | 0.933998 | 1.081909 | 0.809117 | 1 | -0.06828 |
| rs144016445_G | BTN3A2 | 73914.07 | NA | 1.75E-06 | 1 | 11.21066 |
| rs1977_A | BTN3A2 | 0.764904 | 0.835801 | 0.700168 | 2.99E-07 | -0.268 |
| rs1979_G | BTN3A2 | 0.76816 | 0.838582 | 0.70381 | 3.63E-07 | -0.26376 |
| rs1985732_A | BTN3A2 | 0.860169 | 0.932012 | 0.793857 | 0.023502 | -0.15063 |
| rs2073526_G | BTN3A2 | 0.90252 | 0.979048 | 0.831612 | 1 | -0.10256 |
| rs35183513_G | BTN3A2 | 1.000653 | 1.140268 | 0.880486 | 1 | 0.000652 |
| rs58367598_T | BTN3A2 | 1.153984 | 1.470445 | 0.915197 | 1 | 0.143221 |
| rs7765566_G | BTN3A2 | 1.171754 | 1.497136 | 0.928192 | 1 | 0.158502 |
| rs9104_G | BTN3A2 | 1.010674 | 1.145196 | 0.894134 | 1 | 0.010617 |
| rs9358934_G | BTN3A2 | 0.772404 | 0.843549 | 0.707423 | 8.85E-07 | -0.25825 |
| rs9379855_T | BTN3A2 | 0.771306 | 0.842174 | 0.706564 | 6.76E-07 | -0.25967 |
| rs9379858_T | BTN3A2 | 0.774407 | 0.845625 | 0.709352 | 1.18E-06 | -0.25566 |
| rs9379859_C | BTN3A2 | 0.770242 | 0.841254 | 0.705384 | 6.31E-07 | -0.26105 |
| rs9379861_G | BTN3A2 | 0.987622 | 1.586757 | 0.639198 | 1 | -0.01246 |
| rs9393713_G | BTN3A2 | 0.760996 | 0.830868 | 0.697149 | 1.06E-07 | -0.27313 |
| rs9393714_G | BTN3A2 | 0.765074 | 0.835356 | 0.700859 | 2.25E-07 | -0.26778 |
| rs186813312_C | BTNL3 | 0.257602 | NA | NA | NA | -1.35634 |
| rs199970076_G | BTNL3 | 0.272926 | 6.904492 | 0.010788 | 1 | -1.29856 |
| rs201534771_G | BTNL3 | 0.273671 | NA | NA | NA | -1.29583 |
| rs201813197_C | BTNL3 | 0.514697 | 3.715301 | 0.100372 | 1 | -0.66418 |
| rs35157246_C | BTNL3 | 1.03751 | 1.287524 | 0.842551 | 1 | 0.036824 |
| rs4700774_G | BTNL3 | 0.978837 | 1.065525 | 0.899706 | 1 | -0.02139 |
| rs59220426_C | BTNL3 | 1.017762 | 1.216405 | 0.856252 | 1 | 0.017606 |
| rs73815153_G | BTNL3 | 1.02474 | 1.225825 | 0.861442 | 1 | 0.024438 |
| rs7713324_A | BTNL3 | 1.018119 | 1.216841 | 0.856546 | 1 | 0.017957 |
| rs7726604_C | BTNL3 | 1.020763 | 1.219953 | 0.85881 | 1 | 0.02055 |
| rs112469887_G | BTNL8 | 1.002918 | 1.333287 | 0.765187 | 1 | 0.002914 |
| rs113071395_G | BTNL8 | 0.93155 | 1.162634 | 0.752338 | 1 | -0.07091 |
| rs113534626_A | BTNL8 | 0.9371 | 1.185234 | 0.747845 | 1 | -0.06496 |
| rs141492316_T | BTNL8 | 0.963798 | 1.314391 | 0.718601 | 1 | -0.03687 |
| rs145199317_A | BTNL8 | 1.12544 | 1.912393 | 0.697448 | 1 | 0.118174 |
| rs151174174_C | BTNL8 | 0.729764 | 0.953457 | 0.564223 | 1 | -0.31503 |
| rs17704291_C | BTNL8 | 0.969451 | 1.055155 | 0.891212 | 1 | -0.03103 |
| rs200633883_C | BTNL8 | 0.171372 | 1.035119 | 0.022558 | 1 | -1.76392 |
| rs201214790_T | BTNL8 | 0.256248 | NA | NA | NA | -1.36161 |
| rs201891387_G | BTNL8 | 0.171476 | 1.035747 | 0.022572 | 1 | -1.76331 |
| rs2276995_A | BTNL8 | 1.002057 | 1.084332 | 0.926283 | 1 | 0.002055 |
| rs2619739_C | BTNL8 | 0.966968 | 1.107812 | 0.846435 | 1 | -0.03359 |
| rs7724813_G | BTNL8 | 1.041603 | 1.171988 | 0.927725 | 1 | 0.040761 |
Table 6.
SNP and allele count of the SNPs significantly associated with CeD in UK Biobank participants with the HLA-DQ2.5 genotype. These SNPs were significantly associated with CeD status in the HLA-DQ2.5-matched single variant testing of the UK Biobank dataset.
Table 6.
SNP and allele count of the SNPs significantly associated with CeD in UK Biobank participants with the HLA-DQ2.5 genotype. These SNPs were significantly associated with CeD status in the HLA-DQ2.5-matched single variant testing of the UK Biobank dataset.
| Participants with the HLA-DQ2.5 genotype | |||||||
| SNP, reference allele | Gene | Number of the SNP in controls with HLA-DQ2.5 | Number of the SNP in CeD with HLA-DQ2.5 | Total allele count in control with HLA-DQ2.5 | Total allele count in CeD with HLA-DQ2.5 | Total number of the SNP in the UK Biobank with HLA-DQ2.5 | Total allele count in UK Biobank with HLA-DQ2.5 |
| rs13195402_G | BTN2A1 | 9398 | 2256 | 12514 | 3206 | 11654 | 15720 |
| rs13195509_G | BTN2A1 | 9408 | 2265 | 12820 | 3296 | 11673 | 16116 |
| rs3734542_G | BTN2A1 | 9386 | 2266 | 12808 | 3300 | 11652 | 16108 |
| rs3734543_G | BTN2A1 | 9366 | 2265 | 12722 | 3258 | 11631 | 15980 |
| rs56296968_C | BTN2A1 | 8609 | 2107 | 12798 | 3290 | 10716 | 16088 |
| rs7773938_C | BTN2A1 | 8606 | 2106 | 12804 | 3290 | 10712 | 16094 |
| rs9358944_A | BTN2A1 | 8603 | 2108 | 12818 | 3304 | 10711 | 16122 |
| rs9358945_A | BTN2A1 | 8607 | 2106 | 12818 | 3302 | 10713 | 16120 |
| rs3799378_A | BTN3A1 | 8129 | 1959 | 12768 | 3286 | 10088 | 16054 |
| rs41266839_G | BTN3A1 | 9577 | 2298 | 12820 | 3298 | 11875 | 16118 |
| rs12176317_A | BTN3A2 | 9347 | 2242 | 12826 | 3302 | 11589 | 16128 |
| rs12199613_C | BTN3A2 | 6396 | 1515 | 12802 | 3300 | 7911 | 16102 |
| rs1977_A | BTN3A2 | 9135 | 2197 | 12574 | 3248 | 11332 | 15822 |
| rs1979_G | BTN3A2 | 9330 | 2242 | 12808 | 3302 | 11572 | 16110 |
| rs1985732_A | BTN3A2 | 7353 | 1777 | 12816 | 3294 | 9130 | 16110 |
| rs9358934_G | BTN3A2 | 9333 | 2240 | 12810 | 3292 | 11573 | 16102 |
| rs9379855_T | BTN3A2 | 9324 | 2239 | 12802 | 3294 | 11563 | 16096 |
| rs9379858_T | BTN3A2 | 9321 | 2242 | 12804 | 3296 | 11563 | 16100 |
| rs9379859_C | BTN3A2 | 9340 | 2244 | 12806 | 3296 | 11584 | 16102 |
| rs9393713_G | BTN3A2 | 9345 | 2237 | 12812 | 3298 | 11582 | 16110 |
| rs9393714_G | BTN3A2 | 9346 | 2241 | 12818 | 3300 | 11587 | 16118 |
Appendix D – Supplementary Materials for Results Section 2.3
Figure 1.
The TRGV usage of a) healthy control (n = 108), and b) CeD FFPE duodenal samples (n = 45) was not normally distributed in the duodenal samples subjected to TRGV usage analysis.
Figure 1.
The TRGV usage of a) healthy control (n = 108), and b) CeD FFPE duodenal samples (n = 45) was not normally distributed in the duodenal samples subjected to TRGV usage analysis.
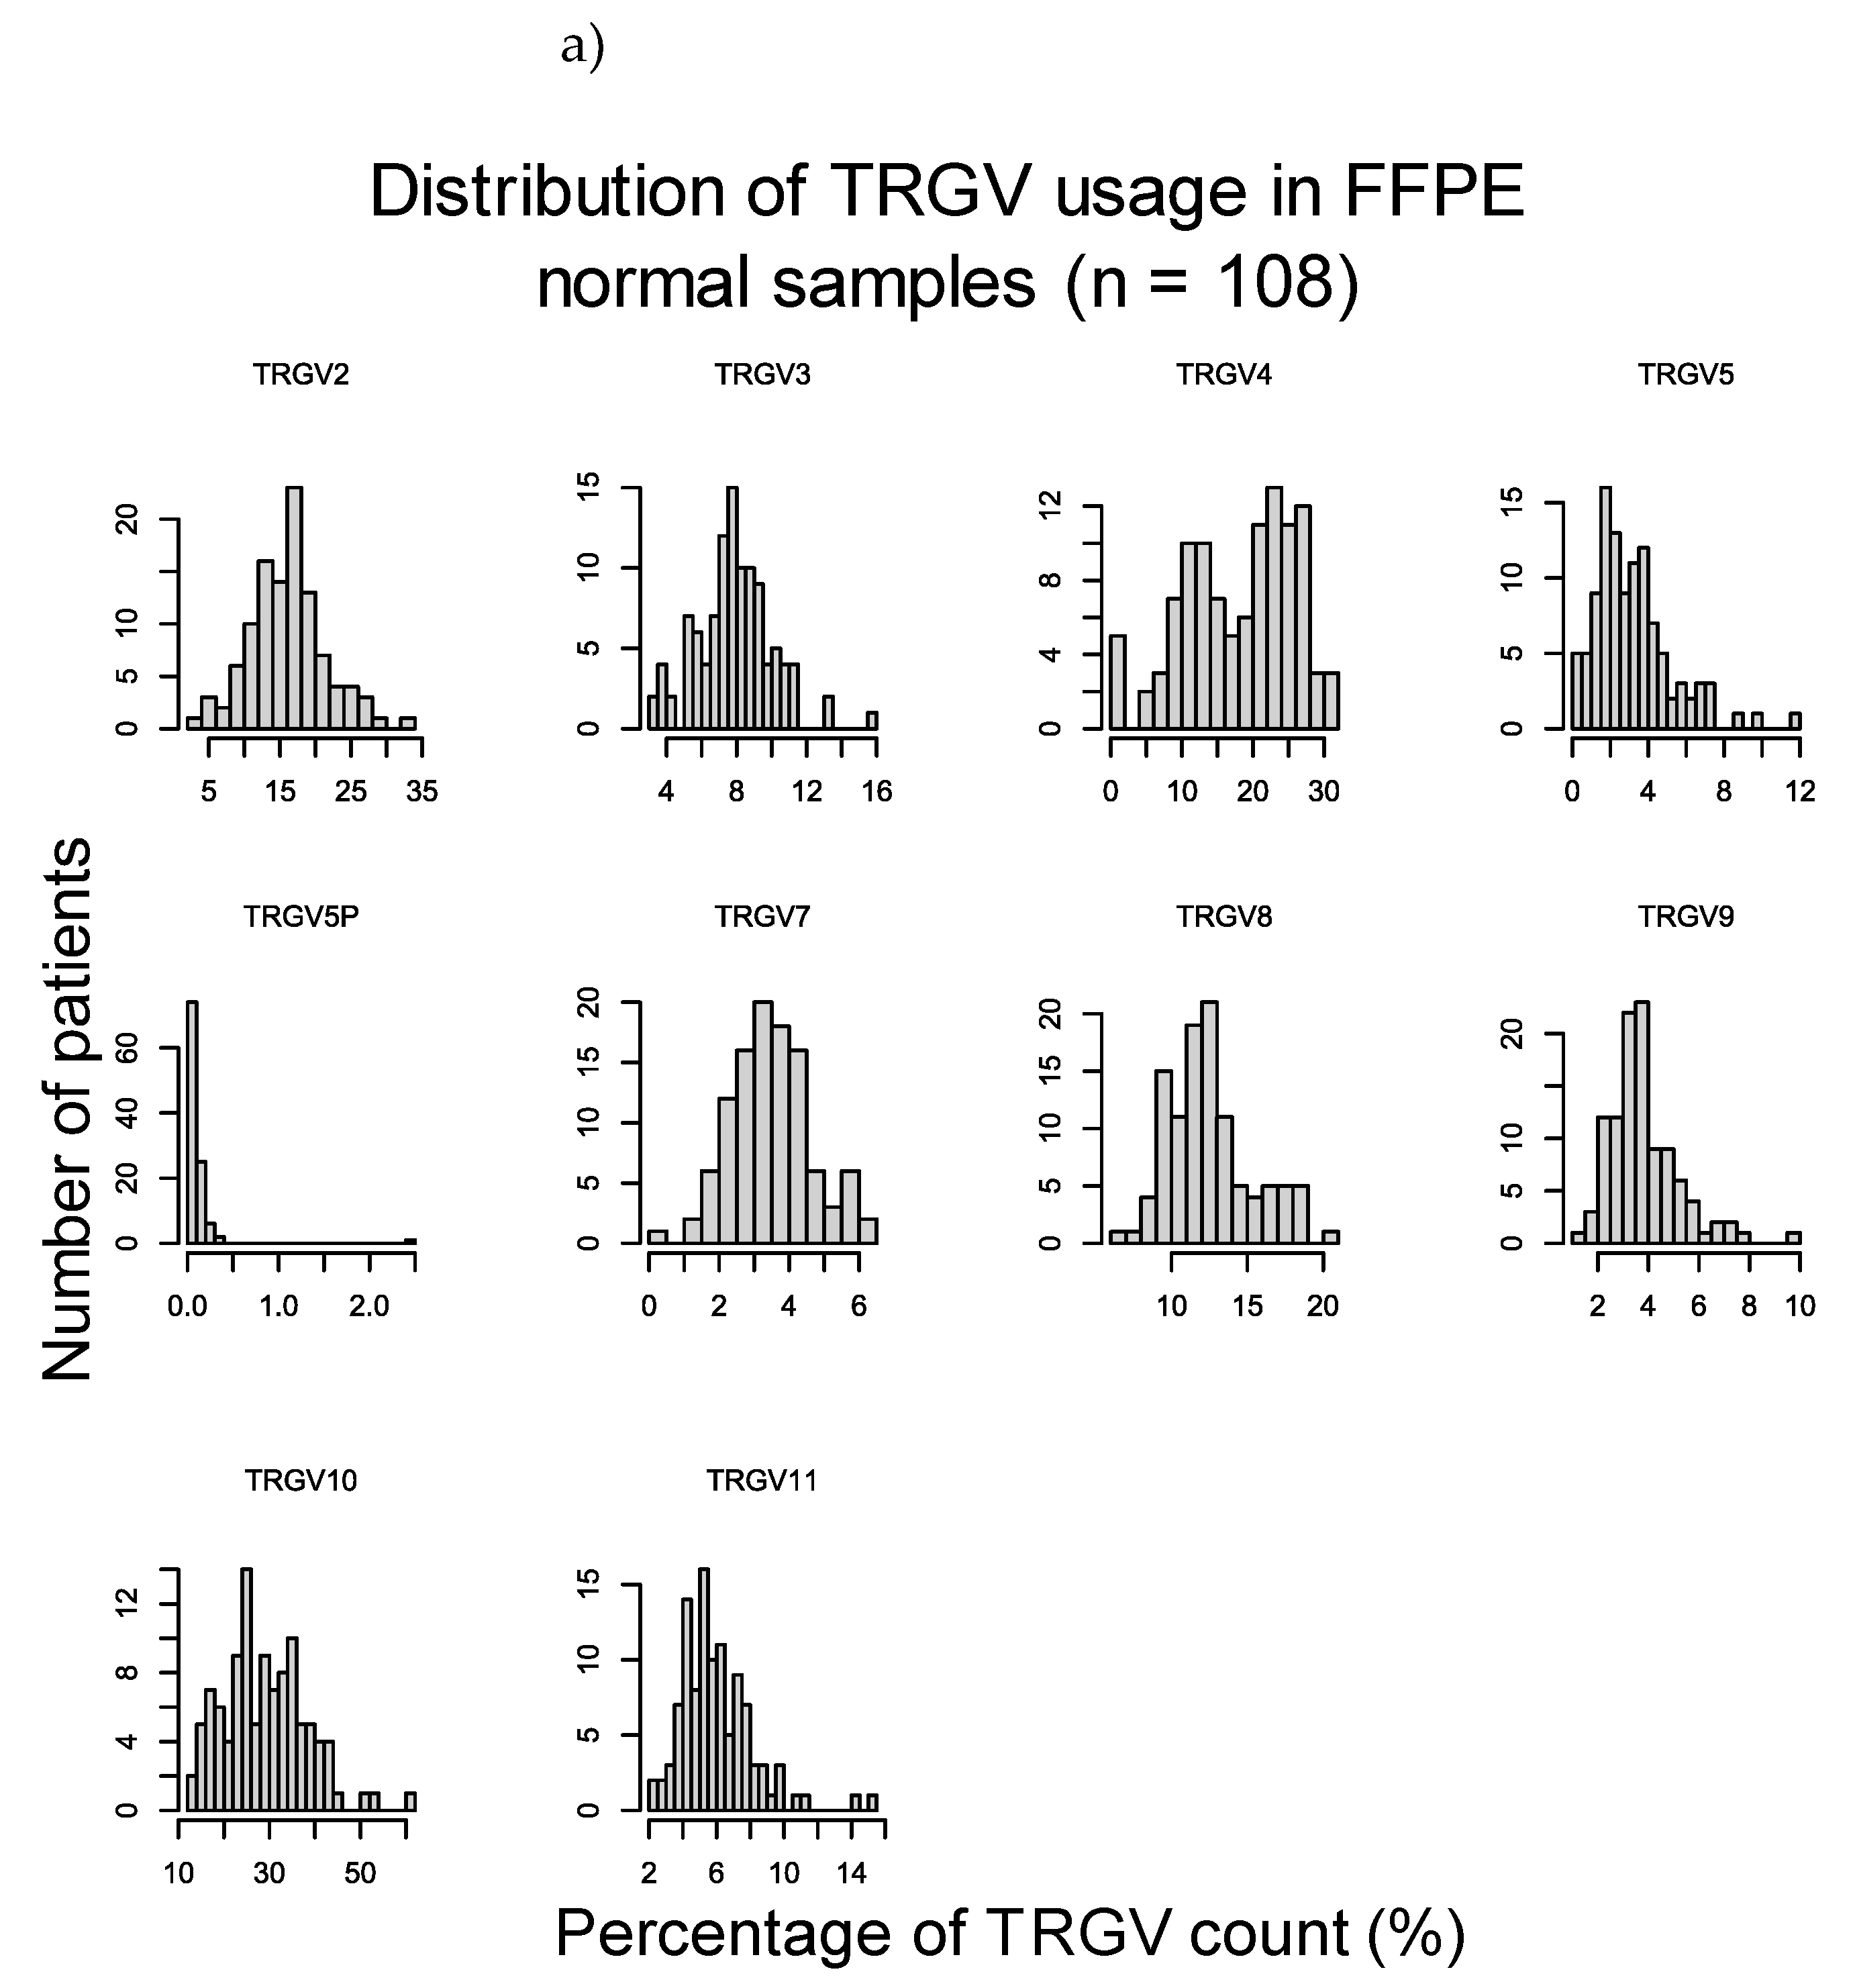
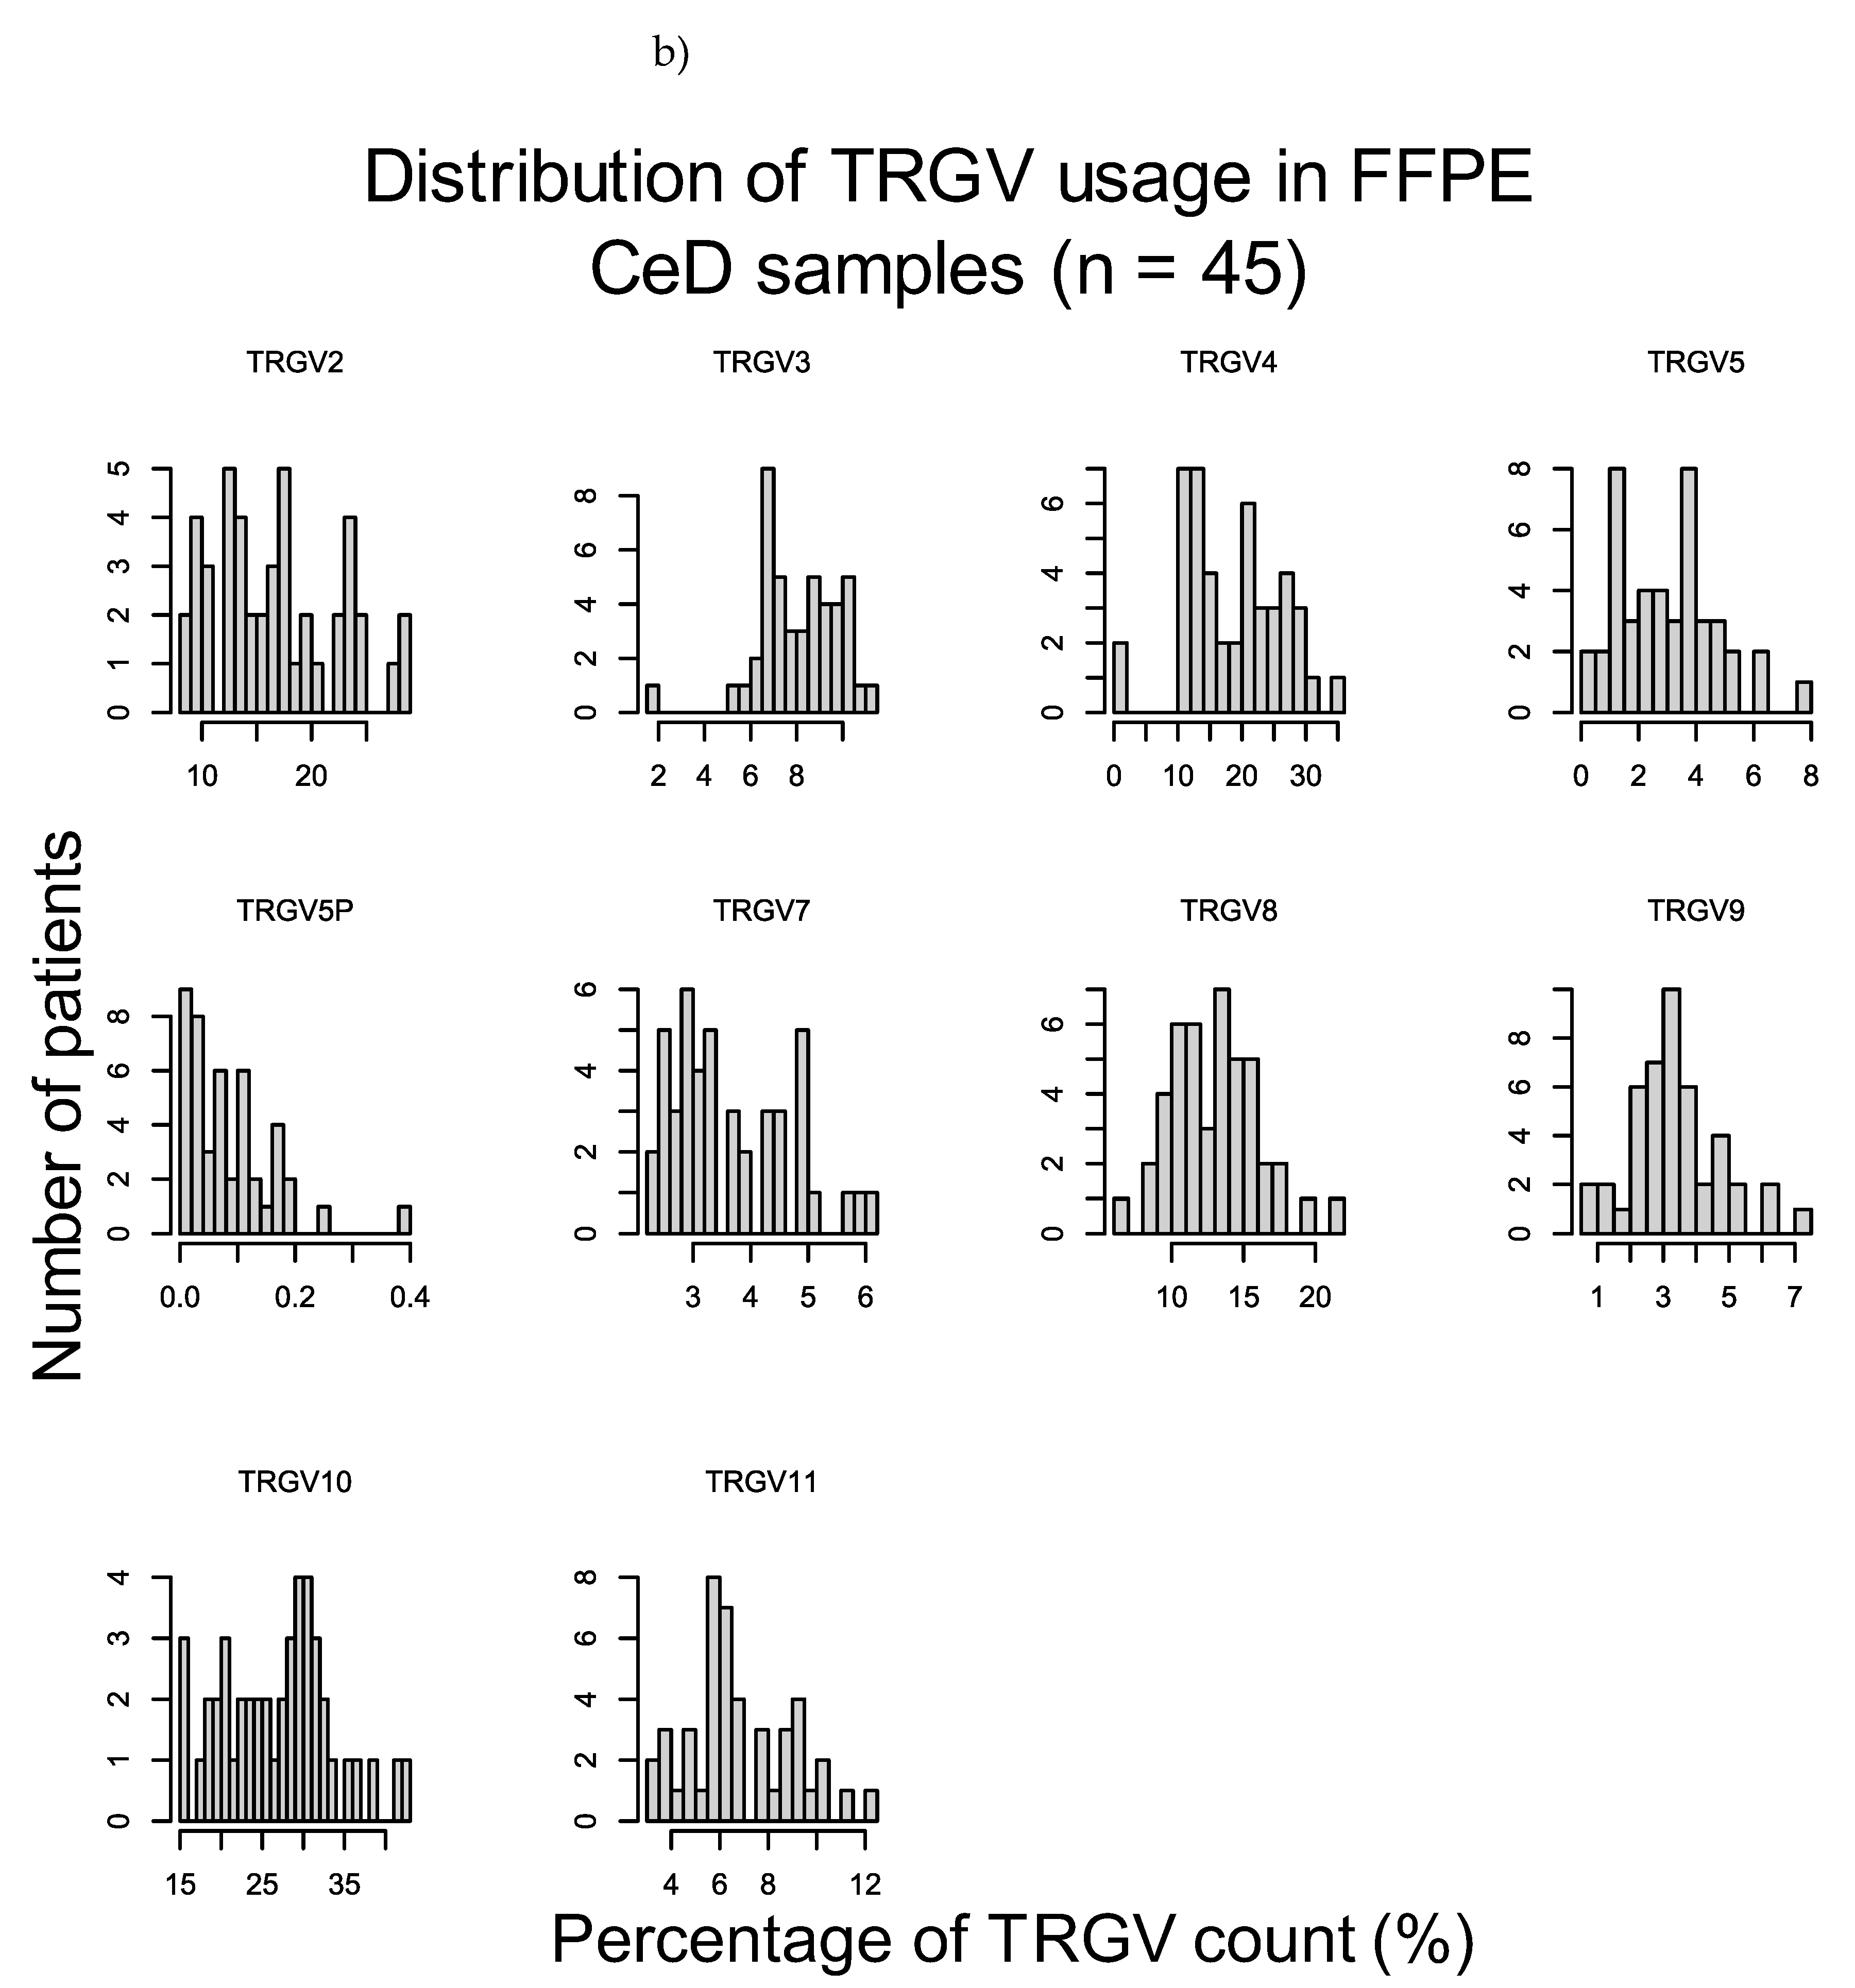
Table 1.
There were no significant differences in the TRGV usage of FFPE CeD (n = 45) and healthy control (n = 108) samples after Bonferroni correction was applied. Raw p-values from Mann-Whitney U (MWU) tests were adjusted using Bonferroni correction to account for false positives due to multiple testing.
| FFPE CeD (n = 45) vs FFPE healthy control (n = 108) | ||
| Raw p-value (MWU) | Adjusted p-value | |
| TRGV2 | 0.775 | 1 |
| TRGV3 | 0.411 | 1 |
| TRGV4 | 0.812 | 1 |
| TRGV5 | 0.906 | 1 |
| TRGV5P | 0.684 | 1 |
| TRGV7 | 0.566 | 1 |
| TRGV8 | 0.382 | 1 |
| TRGV9 | 0.070 | 0.70 |
| TRGV10 | 0.248 | 1 |
| TRGV11 | 0.025 | 0.25 |
Table 2.
There were no significant differences in the HV4 distribution between healthy controls (n = 238) and CeD patients (n = 141). The reference amino acid sequence KYDTYGSTRKNLRMILR is noted as WT in the table. Sequences with amino acid substitutions are provided in full. Pairwise Fisher’s exact test with Bonferroni correction was applied on the different HV4 phenotypes in CeD and healthy control patients.
| 141 CeD vs 238 healthy control samples | ||
| Raw p-values (Fisher) | Adjusted p-values | |
| WT vs WT, KYDTYGSTRQNLRMIL | 0.3925 | 1 |
| WT vs KYDTYGSTRQNLRMILR | 0.3392 | 1 |
| WT vs KYDTYGSTRQNLRMILR, KYDTYGSTR_ELENDTA | 0.3668 | 1 |
| WT vs WT, KYNTYGSTRKNLRMILR | 0.3668 | 1 |
| WT vs KYDTYGNTRKNLRMILR, WT | 1 | 1 |
| WT vs WT, KYDTYGSTRKSLRMILR | 0.6258 | 1 |
| WT vs KYDTYGSTRKSLRMILR | 1 | 1 |
| WT vs WT, KYDTYGSIRKNLRMILR | 0.3668 | 1 |
| WT, KYDTYGSTRQNLRMILR vs KYDTYGSTRQNLRMILR | 0.1697 | 1 |
| WT, KYDTYGSTRQNLRMILR vs KYDTYGSTRQNLRMILR, KYDTYGSTR_ELENDTA | 0.4524 | 1 |
| WT, KYDTYGSTRQNLRMILR vs WT, KYNTYGSTRKNLRMILR | 0.4524 | 1 |
| WT, KYDTYGSTRQNLRMILR vs WT, KYDTYGNTRKNLRMILR | 1 | 1 |
| WT, KYDTYGSTRQNLRMILR vs WT, KYDTYGSTRKSLRMILR | 1 | 1 |
| WT, KYDTYGSTRQNLRMILR vs KYDTYGSTRKSLRMILR | 1 | 1 |
| WT, KYDTYGSTRQNLRMILR vs WT, KYDTYGSIRKNLRMILR | 0.4524 | 1 |
| KYDTYGSTRQNLRMILR vs KYDTYGSTRQNLRMILR, KYDTYGSTR_ELENDTA | 0.25 | 1 |
| KYDTYGSTRQNLRMILR vs WT, KYNTYGSTRKNLRMILR | 0.25 | 1 |
| KYDTYGSTRQNLRMILR vs WT, KYDTYGNTRKNLRMILR | 1 | 1 |
| KYDTYGSTRQNLRMILR vs WT, KYDTYGSTRKSLRMILR | 0.5165 | 1 |
| KYDTYGSTRQNLRMILR vs KYDTYGSTRKSLRMILR | 1 | 1 |
| KYDTYGSTRQNLRMILR vs WT, KYDTYGSIRKNLRMILR | 0.25 | 1 |
| KYDTYGSTRQNLRMILR, KYDTYGSTR_ELENDTA vs WT, KYNTYGSTRKNLRMILR | 1 | 1 |
| KYDTYGSTRQNLRMILR, KYDTYGSTR_ELENDTA vs WT, KYDTYGNTRKNLRMILR | 1 | 1 |
| KYDTYGSTRQNLRMILR, KYDTYGSTR_ELENDTA vs WT, KYDTYGSTRKSLRMILR | 1 | 1 |
| KYDTYGSTRQNLRMILR, KYDTYGSTR_ELENDTA vs KYDTYGSTRKSLRMILR | 1 | 1 |
| KYDTYGSTRQNLRMILR, KYDTYGSTR_ELENDTA vs WT, KYDTYGSIRKNLRMILR | 1 | 1 |
| WT, KYNTYGSTRKNLRMILR vs WT, KYDTYGNTRKNLRMILR | 1 | 1 |
| WT, KYNTYGSTRKNLRMILR vs WT, KYDTYGSTRKSLRMILR | 1 | 1 |
| WT, KYNTYGSTRKNLRMILR vs KYDTYGSTRKSLRMILR | 1 | 1 |
| WT, KYNTYGSTRKNLRMILR vs WT, KYDTYGSIRKNLRMILR | 1 | 1 |
| WT, KYDTYGNTRKNLRMILR vs WT, KYDTYGSTRKSLRMILR | 1 | 1 |
| WT, KYDTYGNTRKNLRMILR vs KYDTYGSTRKSLRMILR | 1 | 1 |
| WT, KYDTYGNTRKNLRMILR vs WT, KYDTYGSIRKNLRMILR | 1 | 1 |
| WT, KYDTYGSTRKSLRMILR vs KYDTYGSTRKSLRMILR | 1 | 1 |
| WT, KYDTYGSTRKSLRMILR vs WT, KYDTYGSIRKNLRMILR | 1 | 1 |
| KYDTYGSTRKSLRMILR vs WT, KYDTYGSIRKNLRMILR | 1 | 1 |
Appendix E – Selecting and Sequencing the Butyrophilin Genes of Interest
Appendix E.1: HPA Expression Profiles of Butyrophilin Family Genes
Table 1.
The expression of the butyrophilin family members in intestinal tissues provided by the HPA. Butyrophilin protein expression in a) the duodenum and in b) the small intestine, colon and rectum was extracted from the Tissue section of the Human Protein Atlas database [90,91]. The reliability score of each entry was provided by the HPA. The score was based on the reliability between the RNA sequencing and antibody staining data. For most genes, the HPA provided immunohistochemical evidence for the protein expression of the genes. Only RNA sequencing data were available for BTNL2, BTNL3, and BTNL9 expression, denoted with *. Evidence linking the butyrophilins to immune cell function and CeD risk were also used to determine inclusion in the custom sequencing panel [19,21,30]. The expression of butyrophilin family members in b) is shown only for the genes that were selected for the custom probe panel. [Data accessed in 2021].
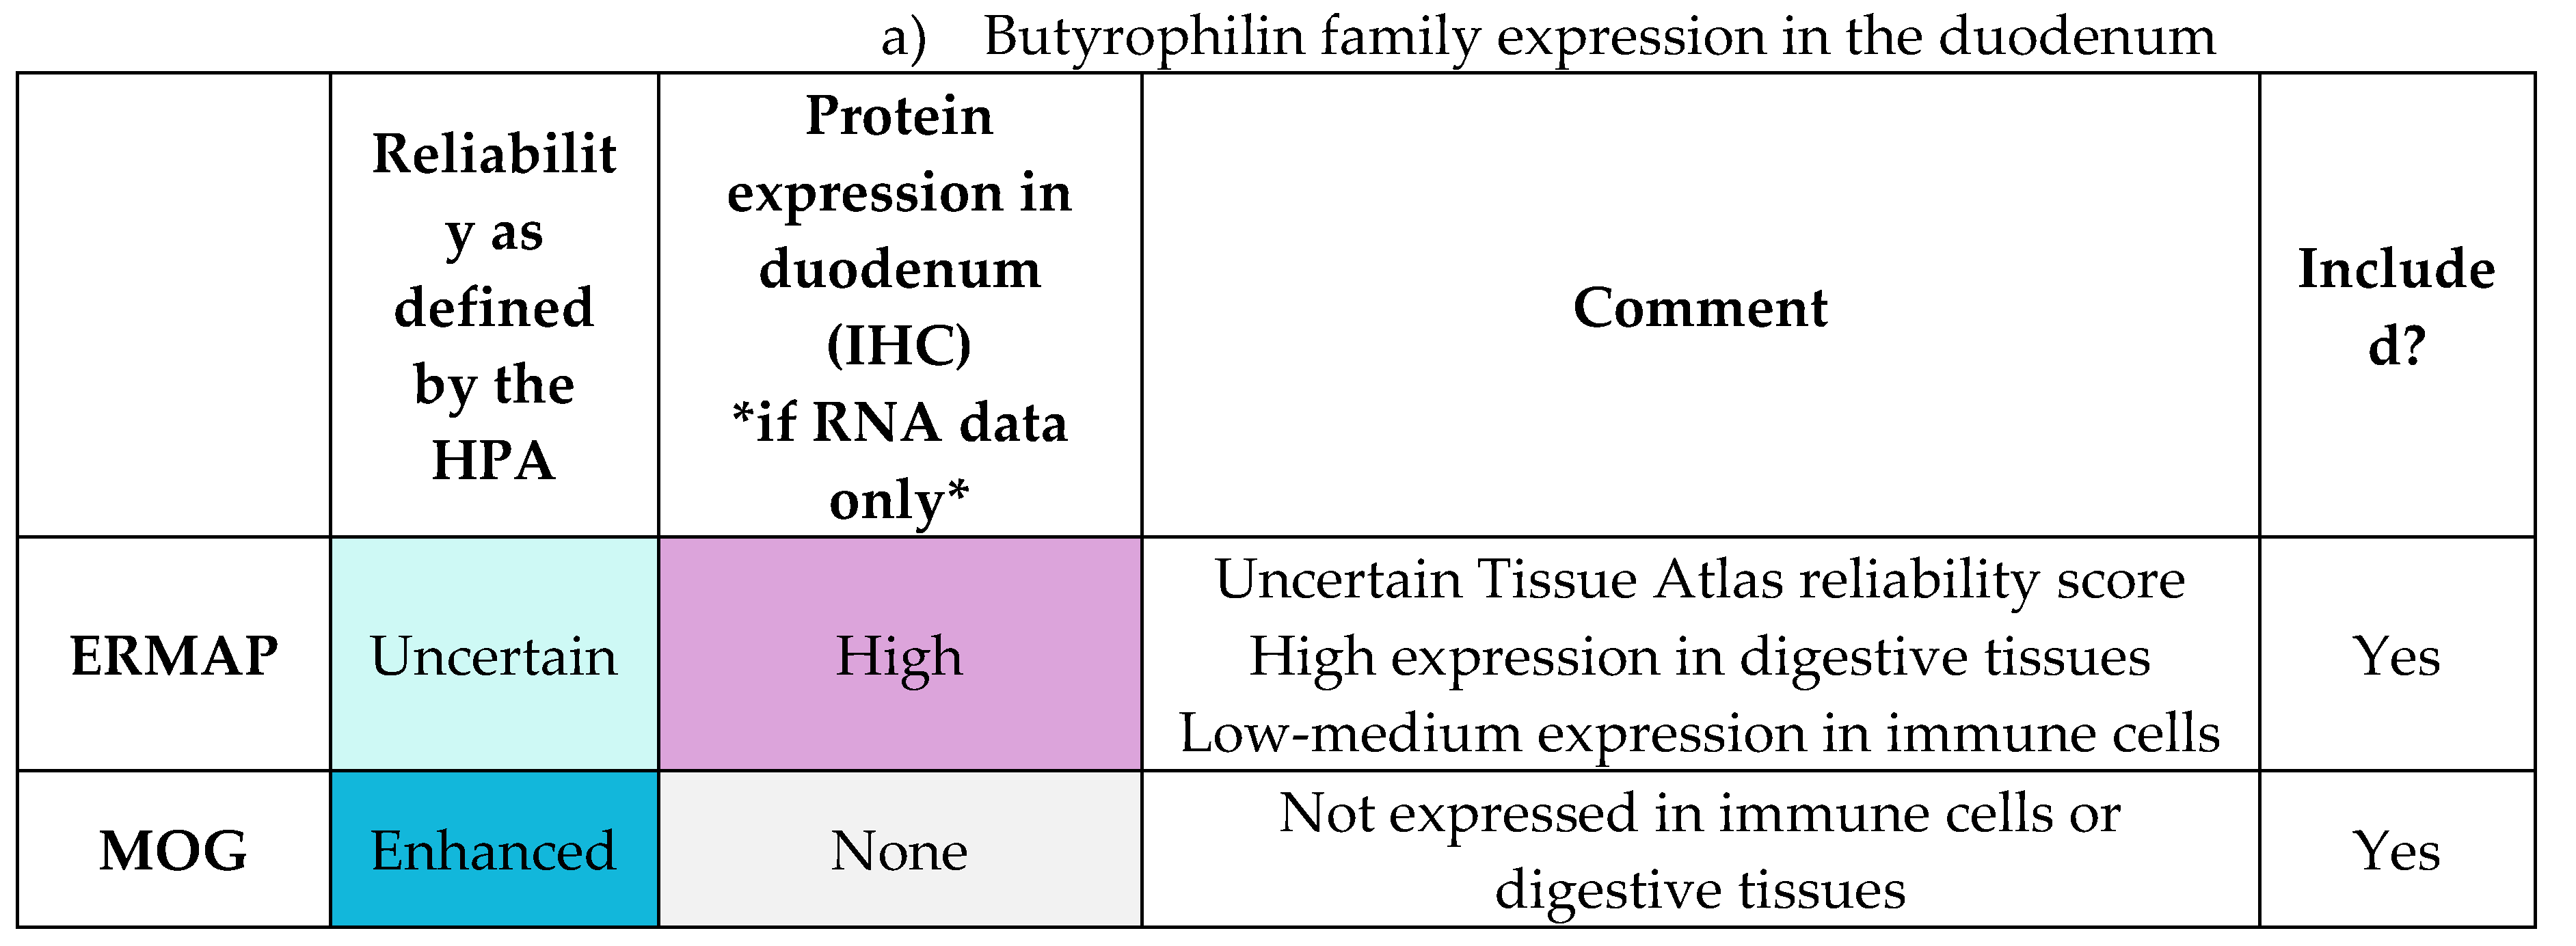 |
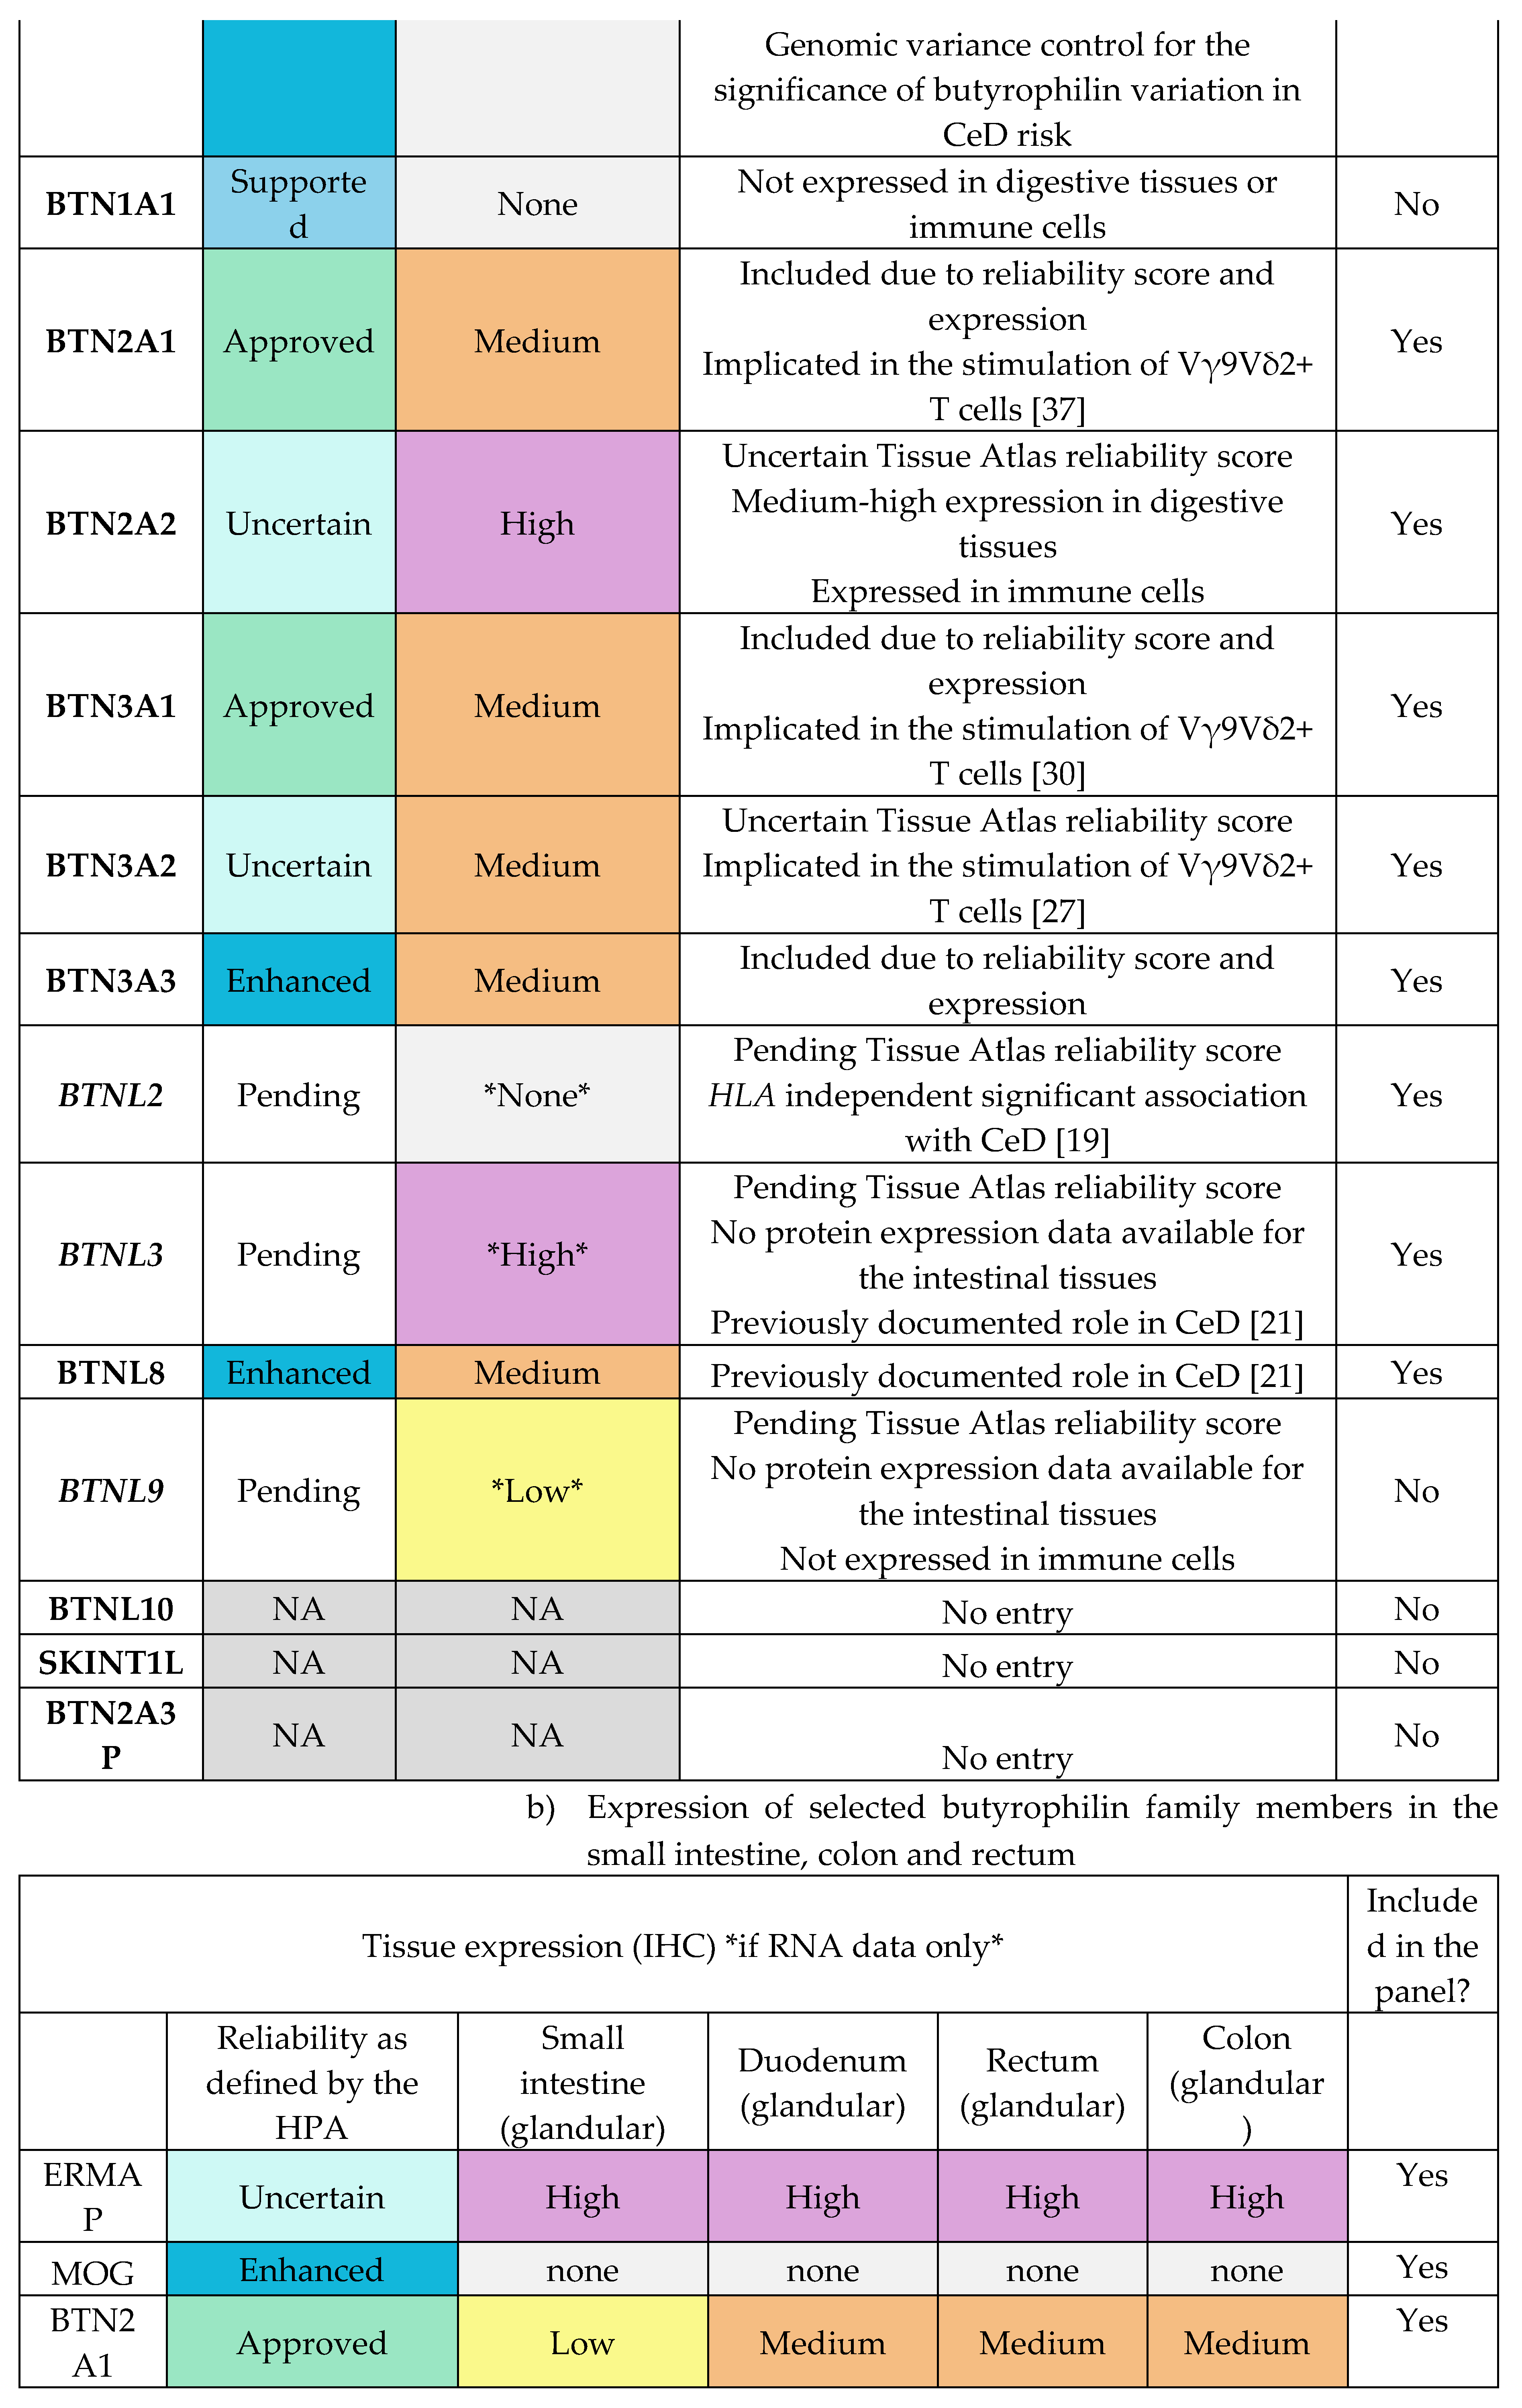 |
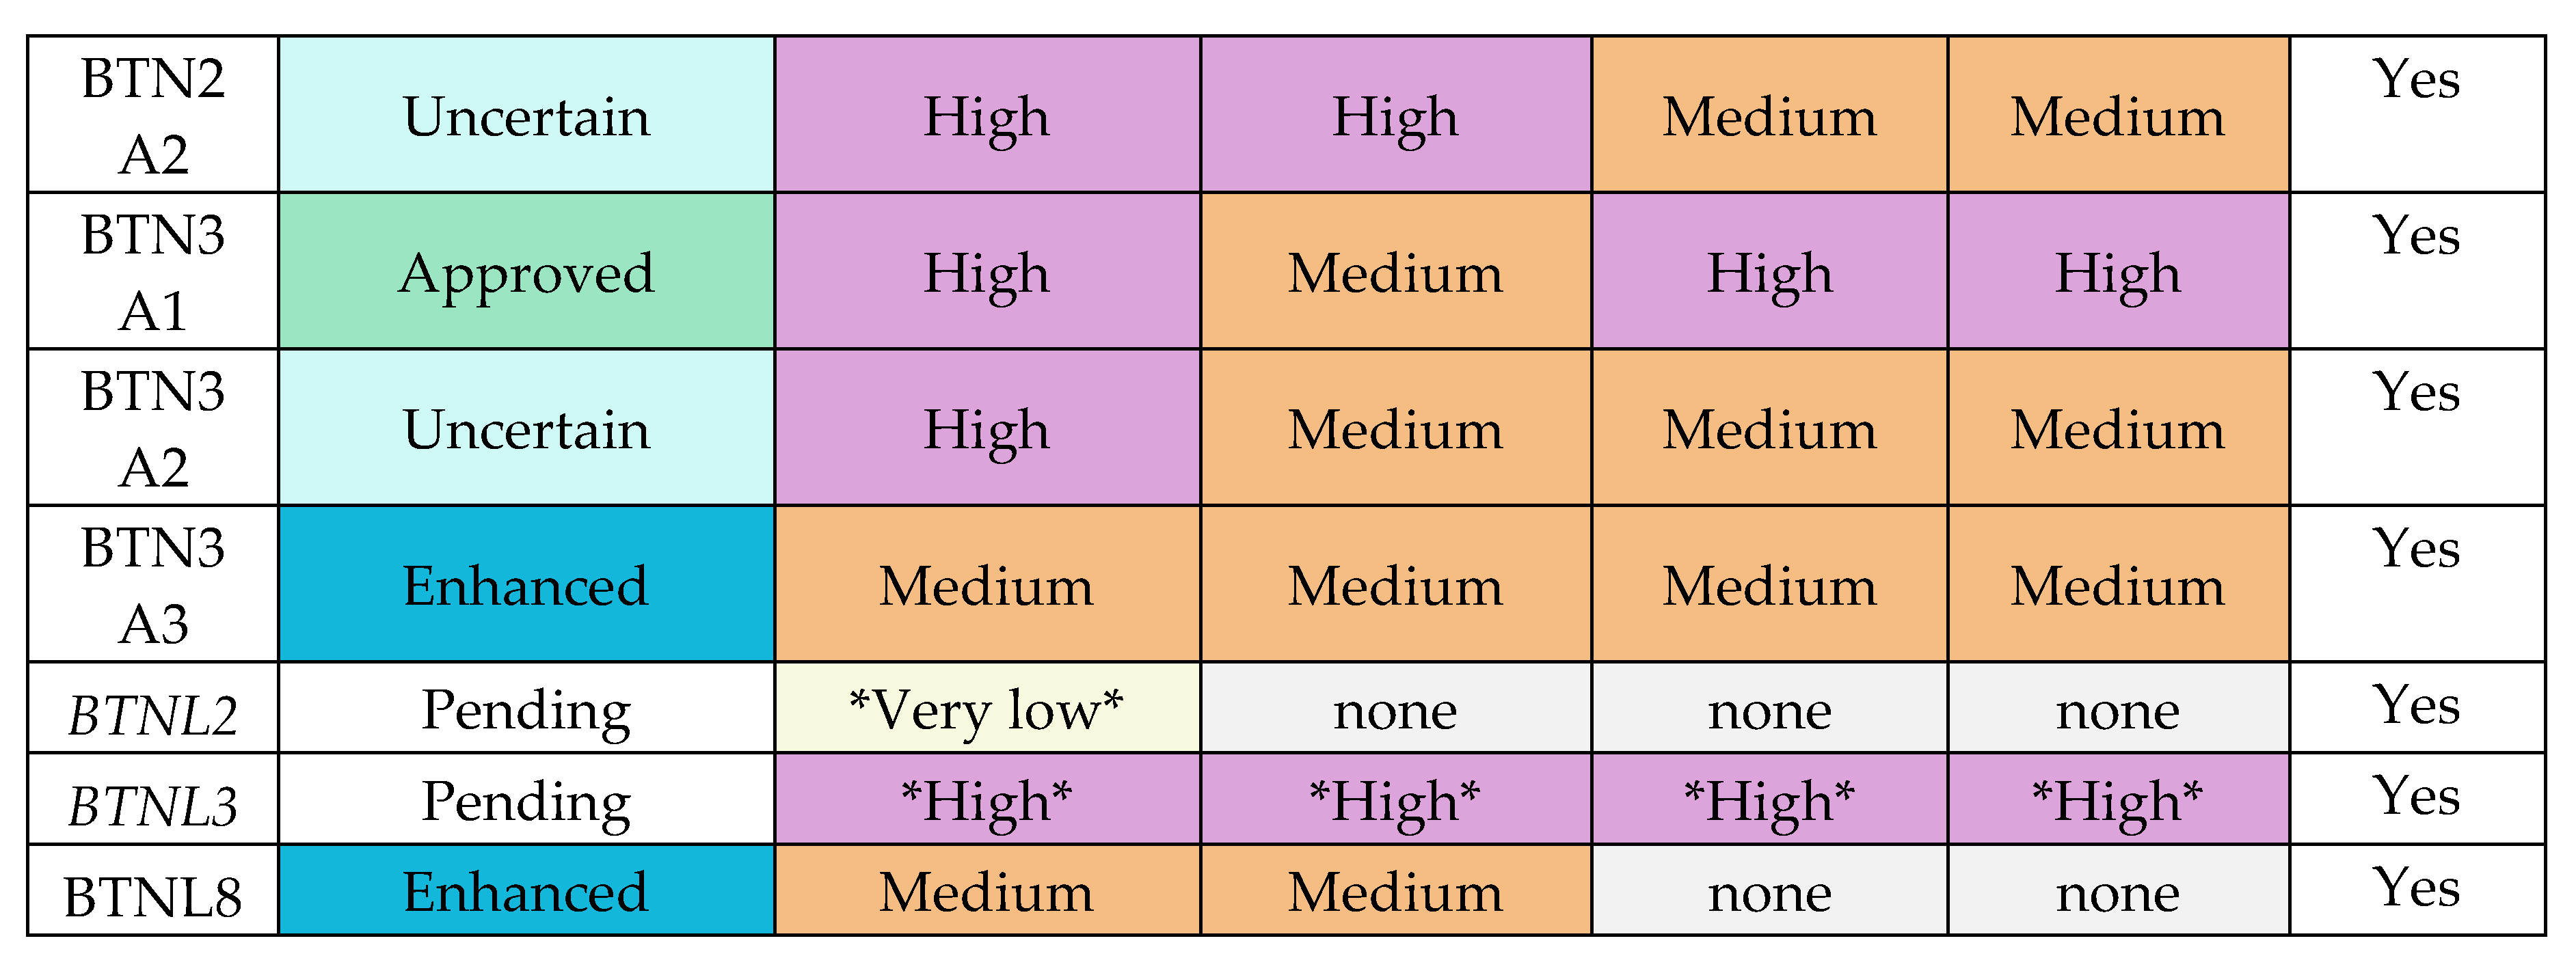 |
Table 2.
The expression of butyrophilin family genes of interest in immune cells provided by the HPA. The butyrophilin family mRNA expression data in immune cells were accessed from the Human Protein Atlas (HPA) [90,91]. The reliability score of each entry was provided by the HPA. The score was based on the reliability between the RNA sequencing and antibody staining data. The RNA expression data from T cells, DCs, NK cells, and macrophages were selected from the Single cell type section of the gene entries. The RNA expression data from T-regs and γδ T cells were accessed from the Immune cell type section of the gene entries. [Data accessed in 2021]
| Immune cell expression (RNA sequencing) | Included in the panel? | |||||||
| Reliability as defined by the HPA | γδ T cells | T cells | T-reg | DCs | Macrophages | NK cells | ||
| ERMAP | Uncertain | Low | Medium | Medium | Medium | Medium | Low | Yes |
| MOG | Enhanced | Very low | None | Very low | None | None | None | Yes |
| BTN2A1 | Approved | Medium | Medium | Medium | Medium | High | Low | Yes |
| BTN2A2 | Uncertain | Low | Medium | Medium | High | High | Medium | Yes |
| BTN3A1 | Approved | High | High | High | Low | Medium | High | Yes |
| BTN3A2 | Uncertain | High | High | High | Medium | High | High | Yes |
| BTN3A3 | Enhanced | High | High | High | Medium | Medium | High | Yes |
| BTNL2 | Pending | None | None | None | None | None | None | Yes |
| BTNL3 | Pending | None | None | None | None | None | None | Yes |
| BTNL8 | Enhanced | None | None | None | None | None | None | Yes |
Appendix E.2: Modified Nonacus Cell3 Hybridization Capture and Illumina Sequencing
To summarise the modified protocol, the DNA quality of all samples were measured initially, to acquire 200ng input DNA for the fragmentation step (1.B) of the hybridization capture protocol. Fragmentation time in step 1.B was modified to 30 minutes to achieve 200bp DNA fragments. Afterwards, the Genomic Tapestation kit (Agilent Technologies) was used to check the correct fragment size.
Next in step 1.C, unique molecular identifier (UMI) adapters were ligated to the DNA fragments. During the magnetic bead clean up using NGS Target Pure Clean-Up Beads (Nonacus) the adapter ligated DNA fragments were incubated for 6 minutes on the magnetic strip. Nuclease free water was used in the final step of the clean-up.
The pre-hybridization PCR in step 1.D was carried out for 4 cycles. Afterwards, the DNA concentration of each reaction was measured in step 1.E. Samples with DNA concentrations lower than 10 ng/μL were subjected to additional rounds of amplification, and steps 1.D and 1.E were repeated. CB22, CB24, CB26, CB27 and CB30 had low DNA concentration after the amplification step, therefore they were subjected to 5 additional cycles of PCR. Sample NB7 was also subjected to 6 more cycles of PCR.
In step 2.A, the samples were pooled together, each library containing DNA fragments from 8 patients. For each sample, 125ng of DNA was used, and the pooled libraries were dried using a vacuum concentrator for 30 minutes. Each pooled library was hybridized overnight at 65 °C with the designed butyrophilin probes and a 1:50 dilution of HLA probes provided by Nonacus.
In step 2.B, the hybridized library was captured on Dynabeads M-270 Streptavidin beads (Invitrogen/Thermo Fisher Scientific). Post-hybridization PCR was carried out for 20 cycles in step 2.C. This was followed by bead clean up using NGS Target Pure Clean-Up Beads. Similarly to step 1.C, the beads and the amplified captured library were incubated for 6 minutes on the magnetic strip. Nuclease free water was used in the final step of the clean-up.
In step 2D, the concentration of the captured library was measured using Qubit, and the size of the DNA fragments in each hybridisation library was quantified using Tapestation.
Illumina MiSeq sequencing required each captured hybridisation library to be diluted to 10nM concentration. The concentration of each sample in nM was calculated using the following equation:
where the concentration (ng/μL) was the DNA concentration of the captured library as quantified by Qubit, and the DNA fragment size (bp) was the average DNA fragment size as measured by Tapestation.
After each of the 12 hybridized libraries were diluted to 10nm, 2μL of each diluted library were mixed together. Afterwards, 10μL was sent to the Department of Biochemistry for sequencing using the Illumina MiSeq system.
Appendix E.3: Measuring DNA Quantity and Fragment Size
Qubit 2.0 fluorometer (Invitrogen) was used to measure nucleic acid quantity, using the Qubit dsDNA High Sensitivity Quantification Assay kit (Invitrogen) according to manufacturers’ instructions.
The 4200 Tapestation System (Agilent Technologies) was used to measure the fragment size of DNA samples. The Genomic DNA ScreenTape Analysis kit (Agilent Technologies) was used to measure the fragment sizes of DNA samples after step 1.B of the Nonacus hybridization capture protocol (Nonacus). The D1000 ScreenTape Assay kit (Agilent Technologies) was used to measure the DNA sizes of the pooled hybridization libraries in step 2.D of the Nonacus hybridization capture protocol.
Appendix F – Detailed Germline Short Variant Discovery Protocol
Appendix F.1: Per Sample Preprocesses and Variant call Using GATK
The variant discovery process for the targeted sequencing cohort was split into two parts. In the first part, each patient sample was processed separately. The variants were called per sample as recommended by the GATK v4.2.6.0 documentation. In the second part of the variant discovery process, the variant-called samples were consolidated, and genotyping was performed jointly for the whole cohort (Appendix F.2).
The workflow management software Snakemake was used to orchestrate the per-sample preprocessing and variant calling part of the pipeline (Figure F1) [92].
Figure 1.
The genetic variants were called per sample for the hybridization capture samples by adapting GATK best practices. Each box symbolises a step or rule in the Snakemake workflow [92]. The directed acyclic graph was created using the Snakemake software’s built in commands.
Figure 1.
The genetic variants were called per sample for the hybridization capture samples by adapting GATK best practices. Each box symbolises a step or rule in the Snakemake workflow [92]. The directed acyclic graph was created using the Snakemake software’s built in commands.
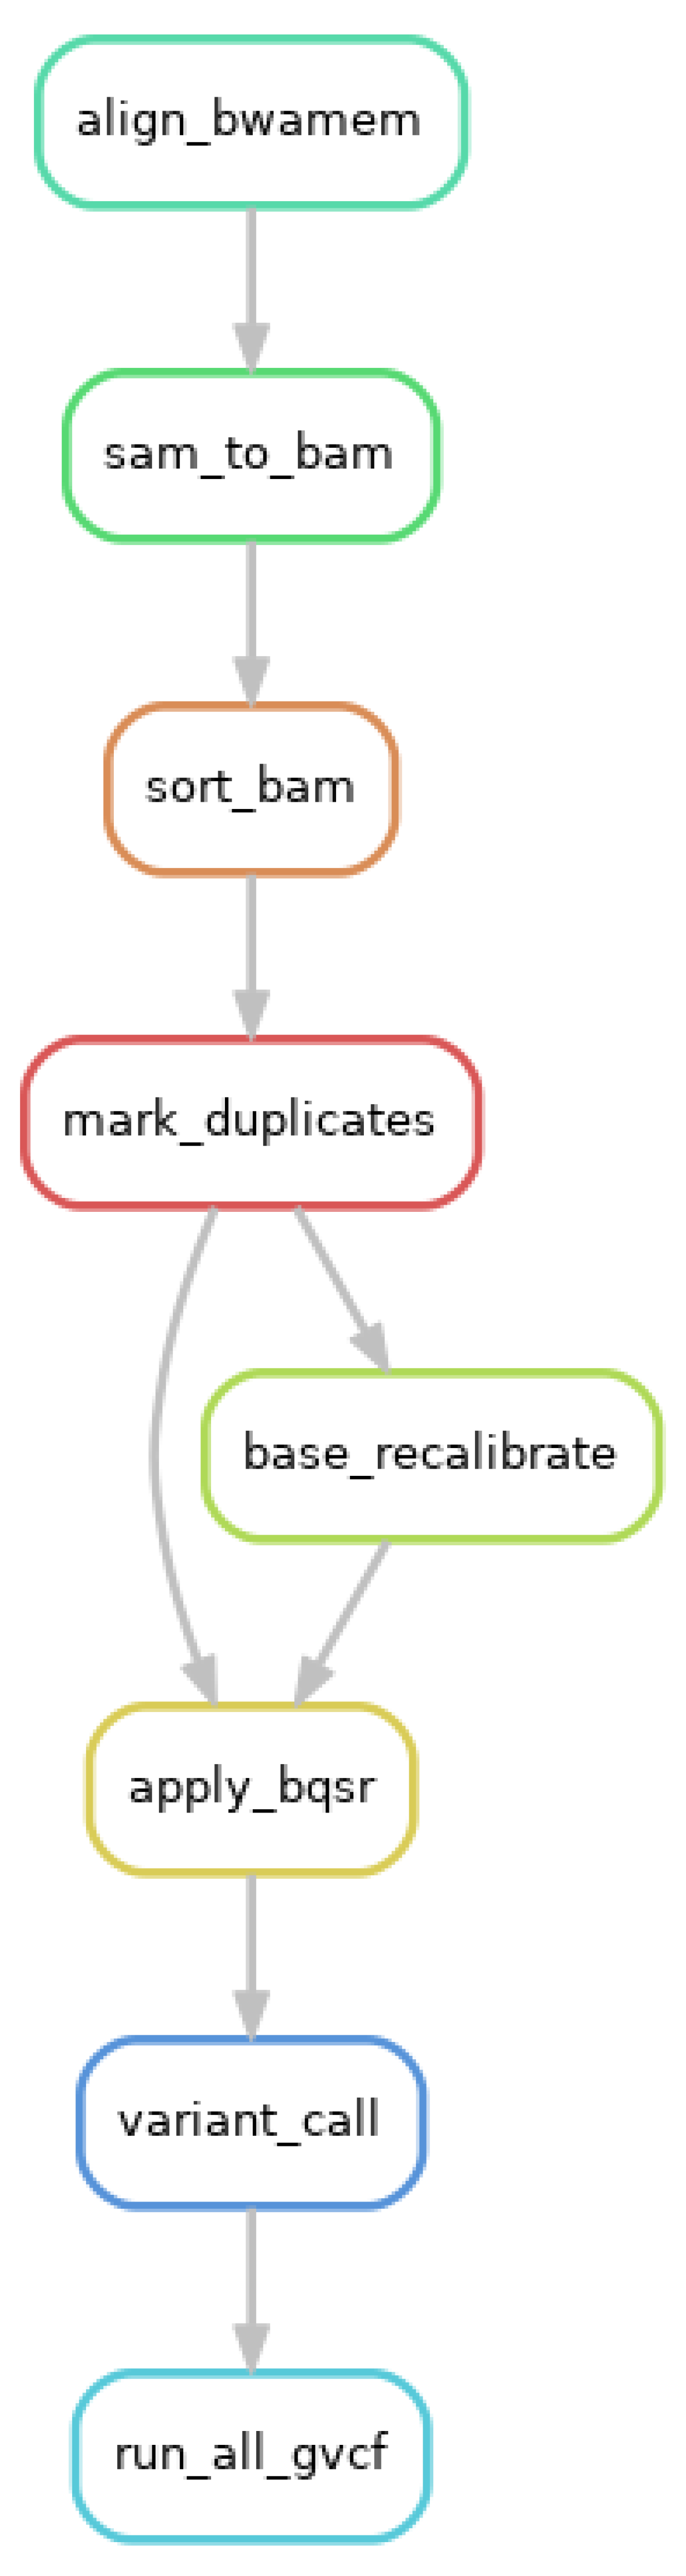
Based on the preprocessing methods of Cucco, et al. [74,75], the adapter trimmed raw sequencing files were mapped to the Genome Reference Consortium Human Build 38 (GRCh38) human reference genome using the Burrow-Wheeler Aligner (bwa) v0.7.17 program in the `align_bwamem` rule [93,94]. The resulting sequence alignment map (SAM) files were converted to binary alignment maps (BAM) (`sam_to_bam`), then sorted (`sort_bam`) and indexed using the SAMtools version 1.16.1 program [78]. The mapping efficiency of the sorted BAM files were assessed using the command `samtools stats`.
Next, we used GATK v4.2.6.0 to carry out germline short-variant discovery in accordance with GATK best practices [72]. First, any duplicate reads that were derived from the same original DNA sample were marked using the MarkDuplicates tool (`mark_duplicates`). This was followed by calculating (`base_recalibrate`) and correcting any errors detected in the base quality scores (`apply_bqsr`) using the BaseRecalibrator and ApplyBQSR tools respectively. Following these preprocessing steps, the SNP and indel variants were called for each sample using the HaplotypeCaller tool in GVCF mode (`variant_call`).
Appendix F.2: Joint Genotyping Using GATK and Variant Annotation Using Vcftools and ANNOVAR
In the second part of the variant discovery process, the samples that had undergone variant calling were subjected to consolidation, followed by joint genotyping. Here the samples were separated into CeD and control groups before consolidating the samples into a joint dataset.
The joint genotyping was carried out using GATK programs with default settings (Figure F2). First, the germline cohort data was created by consolidating the per-sample genomic variant call format (GVCF) files created by the HaplotypeCaller tool as described above. The sample consolidation step was carried out by the GenomicsDBImport tool (`consolidate_gvcfs`). The resulting cohort database was passed to the GenotypeGVCFs joint genotyping tool (`jointcall_cohort`). Next, the raw variants were filtered in a two-step process. First the variant quality scores on the log-odds scale (VQSLOD) were calculated using the VariantRecalibrator tool (`variant_recalibration`). A filtering threshold was applied to these variant quality scores to produce a set of high quality variant calls using the ApplyVQSR tool (`applyvqsr`). The output of the above joint cohort processes was a recalibrated VCF file, that contained all genotyping data of the cohort. The recalibrated VCF files were annotated by applying VCFtools v0.1.17 in frequency (`run_vcffreq`), count (`run_vcfcounts`) and comparison (`compare_vcf`) mode [89]. Variant annotation was also carried out using the table_annovar program from ANNOVAR version 2020Jun08 with default settings (`table_annovar`) [95].
Figure 2.
The samples of the targeted sequencing cohort (n = 94) were jointly genotyped and the variants were annotated using an adapted GATK workflow. Each box symbolises a step or rule in the Snakemake workflow [92]. The directed acyclic graph was created using the Snakemake software’s built in commands.
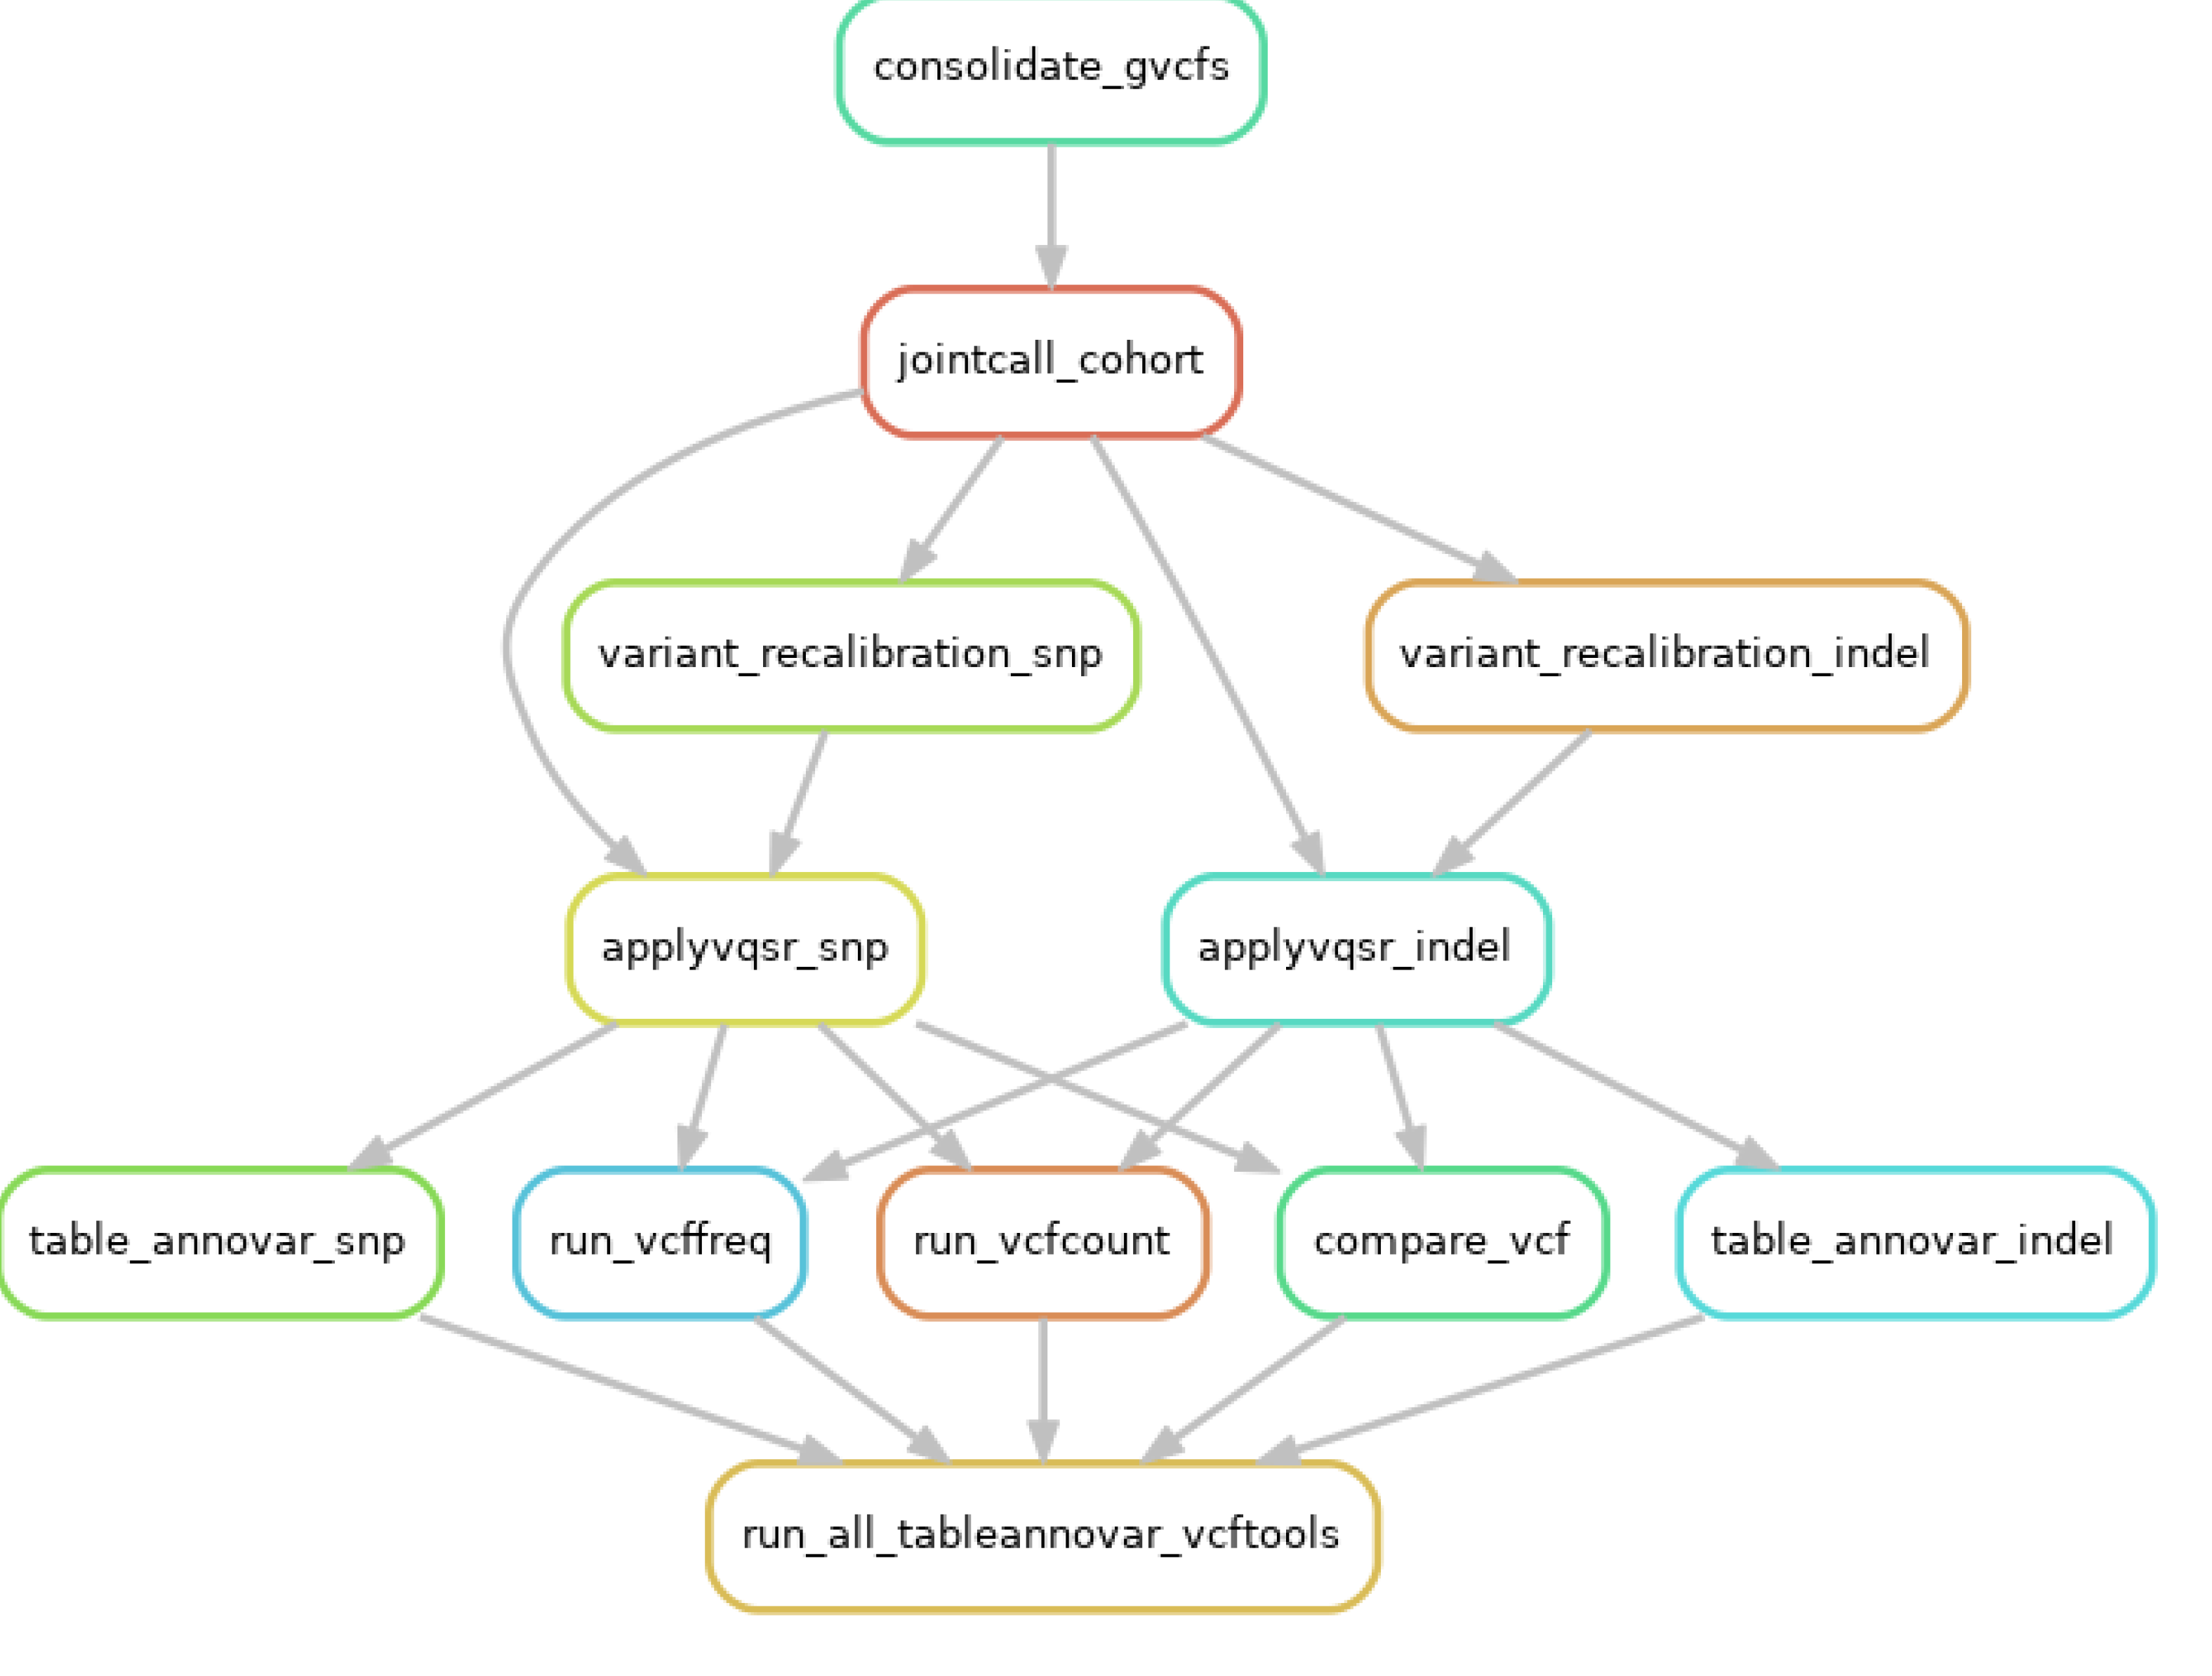
References
- Abadie, V.; Sollid, L.M.; Barreiro, L.B.; Jabri, B. Integration of genetic and immunological insights into a model of celiac disease pathogenesis. Annual Review of Immunology 2011, 29, 493-525. [CrossRef]
- Jabri, B.; Sollid, L.M. Tissue-mediated control of immunopathology in coeliac disease. Nat Rev Immunol 2009, 9, 858-870. [CrossRef]
- Trier, J.S. Diagnosis of celiac sprue. Gastroenterology 1998, 115, 211-216. [CrossRef]
- NICE. Coeliac disease: recognition, assessment and management. Available online: https://www.nice.org.uk/guidance/ng20/chapter/Recommendations (accessed on 27th November 2020).
- Al-Toma, A.; Goerres, M.S.; Meijer, J.W.; Pena, A.S.; Crusius, J.B.; Mulder, C.J. Human leukocyte antigen-DQ2 homozygosity and the development of refractory celiac disease and enteropathy-associated T-cell lymphoma. Clin Gastroenterol Hepatol 2006, 4, 315-319. [CrossRef]
- Ayesh, B.M.; Zaqout, E.K.; Yassin, M.M. HLA-DQ2 and -DQ8 haplotypes frequency and diagnostic utility in celiac disease patients of Gaza strip, Palestine. Autoimmun Highlights 2017, 8, doi:ARTN 1110.1007/s13317-017-0099-0.
- Björck, S.; Brundin, C.; Lörinc, E.; Lynch, K.F.; Agardh, D. Screening detects a high proportion of celiac disease in young HLA-genotyped children. J Pediatr Gastr Nutr 2010, 50, 49-53. [CrossRef]
- Karell, K.; Louka, A.S.; Moodie, S.J.; Ascher, H.; Clot, F.; Greco, L.; Ciclitira, P.J.; Sollid, L.M.; Partanen, J.; European Genetics Cluster on Celiac, D. HLA types in celiac disease patients not carrying the DQA1*05-DQB1*02 (DQ2) heterodimer: results from the European Genetics Cluster on Celiac Disease. Hum Immunol 2003, 64, 469-477. [CrossRef]
- Karhus, L.L.; Thuesen, B.H.; Skaaby, T.; Rumessen, J.J.; Linneberg, A. The distribution of HLA DQ2 and DQ8 haplotypes and their association with health indicators in a general Danish population. United Eur Gastroent 2018, 6, 866-878. [CrossRef]
- Murad, H.; Jazairi, B.; Khansaa, I.; Olabi, D.; Khouri, L. HLA-DQ2 and -DQ8 genotype frequency in Syrian celiac disease children: HLA-DQ relative risks evaluation. BMC Gastroenterol 2018, 18, 70. [CrossRef]
- Sollid, L.M.; Thorsby, E. HLA susceptibility genes in celiac disease: genetic mapping and role in pathogenesis. Gastroenterology 1993, 105, 910-922. [CrossRef]
- Sollid, L.M. Molecular basis of celiac disease. Annu Rev Immunol 2000, 18, 53-81. [CrossRef]
- Sollid, L.M.; Markussen, G.; Ek, J.; Gjerde, H.; Vartdal, F.; Thorsby, E. Evidence for a primary association of celiac disease to a particular HLA-DQ alpha/beta heterodimer. J Exp Med 1989, 169, 345-350. [CrossRef]
- Sollid, L.M.; Thorsby, E. The primary association of celiac disease to a given HLA-DQ alpha/beta heterodimer explains the divergent HLA-DR associations observed in various Caucasian populations. Tissue Antigens 1990, 36, 136-137. [CrossRef]
- Rubio-Tapia, A.; Hill, I.D.; Kelly, C.P.; Calderwood, A.H.; Murray, J.A.; American College of, G. ACG clinical guidelines: diagnosis and management of celiac disease. Am J Gastroenterol 2013, 108, 656-676; quiz 677. [CrossRef]
- Djilali-Saiah, I.; Caillat-Zucman, S.; Schmitz, J.; Chaves-Vieira, M.L.; Bach, J.F. Polymorphism of antigen processing (TAP, LMP) and HLA class II genes in celiac disease. Hum Immunol 1994, 40, 8-16. [CrossRef]
- Hunt, K.A.; Zhernakova, A.; Turner, G.; Heap, G.A.; Franke, L.; Bruinenberg, M.; Romanos, J.; Dinesen, L.C.; Ryan, A.W.; Panesar, D.; et al. Newly identified genetic risk variants for celiac disease related to the immune response. Nat Genet 2008, 40, 395-402. [CrossRef]
- Dubois, P.C.; van Heel, D.A. Translational mini-review series on the immunogenetics of gut disease: immunogenetics of coeliac disease. Clin Exp Immunol 2008, 153, 162-173. [CrossRef]
- Goudey, B.; Abraham, G.; Kikianty, E.; Wang, Q.; Rawlinson, D.; Shi, F.; Haviv, I.; Stern, L.; Kowalczyk, A.; Inouye, M. Interactions within the MHC contribute to the genetic architecture of celiac disease. PLoS One 2017, 12, e0172826. [CrossRef]
- Pietz, G.; De, R.; Hedberg, M.; Sjoberg, V.; Sandstrom, O.; Hernell, O.; Hammarstrom, S.; Hammarstrom, M.L. Immunopathology of childhood celiac disease-Key role of intestinal epithelial cells. PLoS One 2017, 12, e0185025. [CrossRef]
- Mayassi, T.; Ladell, K.; Gudjonson, H.; McLaren, J.E.; Shaw, D.G.; Tran, M.T.; Rokicka, J.J.; Lawrence, I.; Grenier, J.C.; van Unen, V.; et al. Chronic inflammation permanently reshapes tissue-resident immunity in celiac disease. Cell 2019, 176, 967-981. [CrossRef]
- Rhodes, D.A.; Stammers, M.; Malcherek, G.; Beck, S.; Trowsdale, J. The cluster of BTN genes in the extended major histocompatibility complex. Genomics 2001, 71, 351-362. [CrossRef]
- Arnett, H.A.; Viney, J.L. Immune modulation by butyrophilins. Nat Rev Immunol 2014, 14, 559-569. [CrossRef]
- Rhodes, D.A.; Reith, W.; Trowsdale, J. Regulation of immunity by butyrophilins. Annu Rev Immunol 2016, 34, 151-172. [CrossRef]
- Malcherek, G.; Mayr, L.; Roda-Navarro, P.; Rhodes, D.; Miller, N.; Trowsdale, J. The B7 homolog butyrophilin BTN2A1 is a novel ligand for DC-SIGN. J Immunol 2007, 179, 3804-3811. [CrossRef]
- Messal, N.; Mamessier, E.; Sylvain, A.; Celis-Gutierrez, J.; Thibult, M.L.; Chetaille, B.; Firaguay, G.; Pastor, S.; Guillaume, Y.; Wang, Q.; et al. Differential role for CD277 as a co-regulator of the immune signal in T and NK cells. Eur J Immunol 2011, 41, 3443-3454. [CrossRef]
- Di Marco Barros, R.; Roberts, N.A.; Dart, R.J.; Vantourout, P.; Jandke, A.; Nussbaumer, O.; Deban, L.; Cipolat, S.; Hart, R.; Iannitto, M.L.; et al. Epithelia use butyrophilin-like molecules to shape organ-specific gamma delta T cell compartments. Cell 2016, 167, 203-218. [CrossRef]
- Jandke, A.; Melandri, D.; Monin, L.; Ushakov, D.S.; Laing, A.G.; Vantourout, P.; East, P.; Nitta, T.; Narita, T.; Takayanagi, H.; et al. Butyrophilin-like proteins display combinatorial diversity in selecting and maintaining signature intraepithelial gammadelta T cell compartments. Nat Commun 2020, 11, 3769. [CrossRef]
- Melandri, D.; Zlatareva, I.; Chaleil, R.A.G.; Dart, R.J.; Chancellor, A.; Nussbaumer, O.; Polyakova, O.; Roberts, N.A.; Wesch, D.; Kabelitz, D.; et al. The γδ TCR combines innate immunity with adaptive immunity by utilizing spatially distinct regions for agonist selection and antigen responsiveness. Nat Immunol 2018, 19, 1352-1365. [CrossRef]
- Vantourout, P.; Laing, A.; Woodward, M.J.; Zlatareva, I.; Apolonia, L.; Jones, A.W.; Snijders, A.P.; Malim, M.H.; Hayday, A.C. Heteromeric interactions regulate butyrophilin (BTN) and BTN-like molecules governing gammadelta T cell biology. Proc Natl Acad Sci U S A 2018, 115, 1039-1044. [CrossRef]
- Willcox, C.R.; Vantourout, P.; Salim, M.; Zlatareva, I.; Melandri, D.; Zanardo, L.; George, R.; Kjaer, S.; Jeeves, M.; Mohammed, F.; et al. Butyrophilin-like 3 Directly Binds a Human Vγ4(+) T Cell Receptor Using a Modality Distinct from Clonally-Restricted Antigen. Immunity 2019, 51, 813-825 e814. [CrossRef]
- Lewis, J.M.; Girardi, M.; Roberts, S.J.; Barbee, S.D.; Hayday, A.C.; Tigelaar, R.E. Selection of the cutaneous intraepithelial γδ+ T cell repertoire by a thymic stromal determinant. Nat Immunol 2006, 7, 843-850. [CrossRef]
- Cano, C.E.; Pasero, C.; De Gassart, A.; Kerneur, C.; Gabriac, M.; Fullana, M.; Granarolo, E.; Hoet, R.; Scotet, E.; Rafia, C.; et al. BTN2A1, an immune checkpoint targeting Vγ9Vδ2 T cell cytotoxicity against malignant cells. Cell Rep 2021, 36, 109359. [CrossRef]
- Hayday, A.C.; Vantourout, P. The innate biologies of adaptive antigen receptors. Annu Rev Immunol 2020, 38, 487-510. [CrossRef]
- Karunakaran, M.M.; Gobel, T.W.; Starick, L.; Walter, L.; Herrmann, T. Vγ9 and Vδ2 T cell antigen receptor genes and butyrophilin 3 (BTN3) emerged with placental mammals and are concomitantly preserved in selected species like alpaca (Vicugna pacos). Immunogenetics 2014, 66, 243-254. [CrossRef]
- Fichtner, A.S.; Karunakaran, M.M.; Gu, S.; Boughter, C.T.; Borowska, M.T.; Starick, L.; Nohren, A.; Gobel, T.W.; Adams, E.J.; Herrmann, T. Alpaca (Vicugna pacos), the first nonprimate species with a phosphoantigen-reactive Vγ9Vδ2 T cell subset. Proc Natl Acad Sci U S A 2020, 117, 6697-6707. [CrossRef]
- Rigau, M.; Ostrouska, S.; Fulford, T.S.; Johnson, D.N.; Woods, K.; Ruan, Z.; McWilliam, H.E.G.; Hudson, C.; Tutuka, C.; Wheatley, A.K.; et al. Butyrophilin 2A1 is essential for phosphoantigen reactivity by gammadelta T cells. Science 2020, 367. [CrossRef]
- Sandstrom, A.; Peigne, C.M.; Leger, A.; Crooks, J.E.; Konczak, F.; Gesnel, M.C.; Breathnach, R.; Bonneville, M.; Scotet, E.; Adams, E.J. The intracellular B30.2 domain of butyrophilin 3A1 binds phosphoantigens to mediate activation of human Vγ9Vδ2 T cells. Immunity 2014, 40, 490-500. [CrossRef]
- Hu, W.; Shang, R.; Yang, J.; Chen, C.; Liu, Z.; Liang, G.; He, W.; Luo, G. Skin γδ T tells and their function in wound healing. Front Immunol 2022, 13, 875076. [CrossRef]
- Han, A.; Newell, E.W.; Glanville, J.; Fernandez-Becker, N.; Khosla, C.; Chien, Y.H.; Davis, M.M. Dietary gluten triggers concomitant activation of CD4+ and CD8+ alphabeta T cells and gammadelta T cells in celiac disease. Proc Natl Acad Sci U S A 2013, 110, 13073-13078. [CrossRef]
- Aigner, J.; Villatoro, S.; Rabionet, R.; Roquer, J.; Jimenez-Conde, J.; Marti, E.; Estivill, X. A common 56-kilobase deletion in a primate-specific segmental duplication creates a novel butyrophilin-like protein. Bmc Genet 2013, 14, doi:Artn 6110.1186/1471-2156-14-61.
- Mitsunaga, S.; Hosomichi, K.; Okudaira, Y.; Nakaoka, H.; Kunii, N.; Suzuki, Y.; Kuwana, M.; Sato, S.; Kaneko, Y.; Homma, Y.; et al. Exome sequencing identifies novel rheumatoid arthritis-susceptible variants in the BTNL2. J Hum Genet 2013, 58, 210-215. [CrossRef]
- Sirota, M.; Schaub, M.A.; Batzoglou, S.; Robinson, W.H.; Butte, A.J. Autoimmune disease classification by inverse association with SNP alleles. PLoS Genet 2009, 5, e1000792. [CrossRef]
- Orozco, G.; Eerligh, P.; Sanchez, E.; Zhernakova, S.; Roep, B.O.; Gonzalez-Gay, M.A.; Lopez-Nevot, M.A.; Callejas, J.L.; Hidalgo, C.; Pascual-Salcedo, D.; et al. Analysis of a functional BTNL2 polymorphism in type 1 diabetes, rheumatoid arthritis, and systemic lupus erythematosus. Hum Immunol 2005, 66, 1235-1241. [CrossRef]
- Traherne, J.A.; Barcellos, L.F.; Sawcer, S.J.; Compston, A.; Ramsay, P.P.; Hauser, S.L.; Oksenberg, J.R.; Trowsdale, J. Association of the truncating splice site mutation in BTNL2 with multiple sclerosis is secondary to HLA-DRB1*15. Hum Mol Genet 2006, 15, 155-161. [CrossRef]
- Hippich, M.; Beyerlein, A.; Hagopian, W.A.; Krischer, J.P.; Vehik, K.; Knoop, J.; Winker, C.; Toppari, J.; Lernmark, A.; Rewers, M.J.; et al. Genetic contribution to the divergence in type 1 diabetes risk between children from the general population and children from affected families. Diabetes 2019, 68, 847-857. [CrossRef]
- Johnson, S.B.; Lynch, K.F.; Roth, R.; Lundgren, M.; Parikh, H.M.; Akolkar, B.; Hagopian, W.; Krischer, J.; Rewers, M.; She, J.X.; et al. First-appearing islet autoantibodies for type 1 diabetes in young children: maternal life events during pregnancy and the child’s genetic risk. Diabetologia 2021, 64, 591-602. [CrossRef]
- He, C.; Hamon, S.; Li, D.; Barral-Rodriguez, S.; Ott, J.; Diabetes Genetics, C. MHC fine mapping of human type 1 diabetes using the T1DGC data. Diabetes Obes Metab 2009, 11 Suppl 1, 53-59. [CrossRef]
- Boyle, A.P.; Hong, E.L.; Hariharan, M.; Cheng, Y.; Schaub, M.A.; Kasowski, M.; Karczewski, K.J.; Park, J.; Hitz, B.C.; Weng, S.; et al. Annotation of functional variation in personal genomes using RegulomeDB. Genome Res 2012, 22, 1790-1797. [CrossRef]
- Dong, S.; Zhao, N.; Spragins, E.; Kagda, M.S.; Li, M.; Assis, P.; Jolanki, O.; Luo, Y.; Cherry, J.M.; Boyle, A.P.; et al. Annotating and prioritizing human non-coding variants with RegulomeDB. bioRxiv 2022. [CrossRef]
- Spurkland, A.; Sollid, L.M.; Polanco, I.; Vartdal, F.; Thorsby, E. HLA-DR and -DQ genotypes of celiac disease patients serologically typed to be non-DR3 or non-DR5/7. Hum Immunol 1992, 35, 188-192. [CrossRef]
- Kawaguchi, S.; Higasa, K.; Shimizu, M.; Yamada, R.; Matsuda, F. HLA-HD: An accurate HLA typing algorithm for next-generation sequencing data. Hum Mutat 2017, 38, 788-797. [CrossRef]
- Dart, R.J.; Zlatareva, I.; Vantourout, P.; Theodoridis, E.; Amar, A.; Kannambath, S.; East, P.; Recaldin, T.; Mansfield, J.C.; Lamb, C.A.; et al. Conserved gammadelta T cell selection by BTNL proteins limits progression of human inflammatory bowel disease. Science 2023, 381, eadh0301. [CrossRef]
- Guo, M.H.; Plummer, L.; Chan, Y.M.; Hirschhorn, J.N.; Lippincott, M.F. Burden Testing of Rare Variants Identified through Exome Sequencing via Publicly Available Control Data. Am J Hum Genet 2018, 103, 522-534. [CrossRef]
- Guo, M.H. Burden testing against public controls. Available online: https://github.com/mhguo1/TRAPD (accessed on.
- Viken, M.K.; Blomhoff, A.; Olsson, M.; Akselsen, H.E.; Pociot, F.; Nerup, J.; Kockum, I.; Cambon-Thomsen, A.; Thorsby, E.; Undlien, D.E.; et al. Reproducible association with type 1 diabetes in the extended class I region of the major histocompatibility complex. Genes and Immunity 2009, 10, 323-333. [CrossRef]
- Horton, R.; Wilming, L.; Rand, V.; Lovering, R.C.; Bruford, E.A.; Khodiyar, V.K.; Lush, M.J.; Povey, S.; Talbot, C.C., Jr.; Wright, M.W.; et al. Gene map of the extended human MHC. Nat Rev Genet 2004, 5, 889-899. [CrossRef]
- Bycroft, C.; Freeman, C.; Petkova, D.; Band, G.; Elliott, L.T.; Sharp, K.; Motyer, A.; Vukcevic, D.; Delaneau, O.; O’Connell, J.; et al. The UK Biobank resource with deep phenotyping and genomic data. Nature 2018, 562, 203-209. [CrossRef]
- Foers, A.D.; Shoukat, M.S.; Welsh, O.E.; Donovan, K.; Petry, R.; Evans, S.C.; FitzPatrick, M.E.; Collins, N.; Klenerman, P.; Fowler, A.; et al. Classification of intestinal T-cell receptor repertoires using machine learning methods can identify patients with coeliac disease regardless of dietary gluten status. J Pathol 2021, 253, 279-291. [CrossRef]
- Lindfors, K.; Ciacci, C.; Kurppa, K.; Lundin, K.E.A.; Makharia, G.K.; Mearin, M.L.; Murray, J.A.; Verdu, E.F.; Kaukinen, K. Coeliac disease. Nat Rev Dis Primers 2019, 5, 3. [CrossRef]
- Falchuk, Z.M.; Rogentine, G.N.; Strober, W. Predominance of histocompatibility antigen HL-A8 in patients with gluten-sensitive enteropathy. J Clin Invest 1972, 51, 1602-1605. [CrossRef]
- Stokes, P.L.; Asquith, P.; Holmes, G.K.; Mackintosh, P.; Cooke, W.T. Histocompatibility antigens associated with adult coeliac disease. Lancet 1972, 2, 162-164. [CrossRef]
- Karunakaran, M.M.; Willcox, C.R.; Salim, M.; Paletta, D.; Fichtner, A.S.; Noll, A.; Starick, L.; Nohren, A.; Begley, C.R.; Berwick, K.A.; et al. Butyrophilin-2A1 directly binds germline-encoded regions of the Vγ9Vδ2 TCR and is essential for phosphoantigen sensing. Immunity 2020, 52, 487-498 e486. [CrossRef]
- Rhodes, D.A.; Chen, H.C.; Price, A.J.; Keeble, A.H.; Davey, M.S.; James, L.C.; Eberl, M.; Trowsdale, J. Activation of human gammadelta T cells by cytosolic interactions of BTN3A1 with soluble phosphoantigens and the cytoskeletal adaptor periplakin. J Immunol 2015, 194, 2390-2398. [CrossRef]
- Sudlow, C.; Gallacher, J.; Allen, N.; Beral, V.; Burton, P.; Danesh, J.; Downey, P.; Elliott, P.; Green, J.; Landray, M.; et al. UK Biobank: an open access resource for identifying the causes of a wide range of complex diseases of middle and old age. PLoS Med 2015, 12, e1001779. [CrossRef]
- Sayers, E.W.; Bolton, E.E.; Brister, J.R.; Canese, K.; Chan, J.; Comeau, D.C.; Connor, R.; Funk, K.; Kelly, C.; Kim, S.; et al. Database resources of the National Center for Biotechnology Information. Nucleic Acids Res 2022, 50, D20-D26. [CrossRef]
- Nonacus. Nonacus Probe Design Tool. Available online: https://mynonacus.nonacus.com/view-panel-designs (accessed on 8th February 2021).
- Simms, V. 5 Tips for using the Nonacus Panel Design Tool. Available online: https://nonacus.com/blog-get-great-coverage-for-the-genes-you-care-about/ (accessed on.
- Nonacus. Custom NGS Panel Design Tool. Available online: https://nonacus.com/panel-design/ (accessed on.
- Andrews, S. FastQC: A quality control analysis tool for high throughput sequencing data. Available online: https://www.bioinformatics.babraham.ac.uk/projects/fastqc/ (accessed on.
- Bolger, A.M.; Lohse, M.; Usadel, B. Trimmomatic: a flexible trimmer for Illumina sequence data. Bioinformatics 2014, 30, 2114-2120. [CrossRef]
- Van der Auwera, G.A.; O’Connor, B.D. Genomics in the Cloud: Using Docker, GATK, and WDL in Terra, 1st ed.; O’Reilly Media: 2020.
- Zhao, S.; Agafonov, O.; Azab, A.; Stokowy, T.; Hovig, E. Accuracy and efficiency of germline variant calling pipelines for human genome data. Sci Rep 2020, 10, 20222. [CrossRef]
- Cucco, F.; Barrans, S.; Sha, C.; Clipson, A.; Crouch, S.; Dobson, R.; Chen, Z.; Thompson, J.S.; Care, M.A.; Cummin, T.; et al. Distinct genetic changes reveal evolutionary history and heterogeneous molecular grade of DLBCL with MYC/BCL2 double-hit. Leukemia 2020, 34, 1329-1341. [CrossRef]
- Cucco, F.; Clipson, A.; Kennedy, H.; Sneath Thompson, J.; Wang, M.; Barrans, S.; van Hoppe, M.; Ochoa Ruiz, E.; Caddy, J.; Hamid, D.; et al. Mutation screening using formalin-fixed paraffin-embedded tissues: a stratified approach according to DNA quality. Lab Invest 2018, 98, 1084-1092. [CrossRef]
- Matthews, J. A snakemake pipeline for analysing (cancer) DNA sequencing data. Available online: https://gitlab.com/jdm204/dnaseq_snakemake (accessed on.
- Kawaguchi, S. HLA-HD. Available online: https://w3.genome.med.kyoto-u.ac.jp/HLA-HD/ (accessed on.
- Danecek, P.; Bonfield, J.K.; Liddle, J.; Marshall, J.; Ohan, V.; Pollard, M.O.; Whitwham, A.; Keane, T.; McCarthy, S.A.; Davies, R.M.; et al. Twelve years of SAMtools and BCFtools. Gigascience 2021, 10. [CrossRef]
- McLaren, W.; Gil, L.; Hunt, S.E.; Riat, H.S.; Ritchie, G.R.; Thormann, A.; Flicek, P.; Cunningham, F. The Ensembl Variant Effect Predictor. Genome Biol 2016, 17, 122. [CrossRef]
- Dilthey, A.; Leslie, S.; Moutsianas, L.; Shen, J.; Cox, C.; Nelson, M.R.; McVean, G. Multi-population classical HLA type imputation. PLoS Comput Biol 2013, 9, e1002877. [CrossRef]
- Yu, Y.; Fedele, G.; Celardo, I.; Loh, S.H.Y.; Martins, L.M. Parp mutations protect from mitochondrial toxicity in Alzheimer’s disease. Cell Death Dis 2021, 12, 651. [CrossRef]
- Grueneberg, A.; de Los Campos, G. BGData - A Suite of R Packages for Genomic Analysis with Big Data. G3 (Bethesda) 2019, 9, 1377-1383. [CrossRef]
- NCBI. SNP. Available online: https://www.ncbi.nlm.nih.gov/snp (accessed on.
- Gustavsen, J.; Rüeger, S.; Chamberlain, S.; Ushey, K.; Zhu, H. rsnps: Get ‘SNP’ (‘Single-Nucleotide’ ‘Polymorphism’) Data on the Web, 2024.
- Lefranc, M.P.; Giudicelli, V.; Duroux, P.; Jabado-Michaloud, J.; Folch, G.; Aouinti, S.; Carillon, E.; Duvergey, H.; Houles, A.; Paysan-Lafosse, T.; et al. IMGT(R), the international ImMunoGeneTics information system(R) 25 years on. Nucleic Acids Res 2015, 43, D413-422. [CrossRef]
- Bolotin, D.A.; Poslavsky, S.; Mitrophanov, I.; Shugay, M.; Mamedov, I.Z.; Putintseva, E.V.; Chudakov, D.M. MiXCR: software for comprehensive adaptive immunity profiling. Nat Methods 2015, 12, 380-381. [CrossRef]
- Bolotin, D.A.; Poslavsky, S.; Davydov, A.N.; Frenkel, F.E.; Fanchi, L.; Zolotareva, O.I.; Hemmers, S.; Putintseva, E.V.; Obraztsova, A.S.; Shugay, M.; et al. Antigen receptor repertoire profiling from RNA-seq data. Nat Biotechnol 2017, 35, 908-911. [CrossRef]
- McDonald, J.H. Handbook of Biological Statistics, 3rd ed.; Sparky House Publishing: Baltimore, Maryland, 2014.
- Danecek, P.; Auton, A.; Abecasis, G.; Albers, C.A.; Banks, E.; DePristo, M.A.; Handsaker, R.E.; Lunter, G.; Marth, G.T.; Sherry, S.T.; et al. The variant call format and VCFtools. Bioinformatics 2011, 27, 2156-2158. [CrossRef]
- Human Protein Atlas, P. Human Protein Atlas. Available online: http://www.proteinatlas.org (accessed on 20th April 2021).
- Uhlen, M.; Fagerberg, L.; Hallstrom, B.M.; Lindskog, C.; Oksvold, P.; Mardinoglu, A.; Sivertsson, A.; Kampf, C.; Sjostedt, E.; Asplund, A.; et al. Tissue-based map of the human proteome. Science 2015, 347, 1260419. [CrossRef]
- Mölder, F.; Jablonski, K.; Letcher, B.; Hall, M.; Tomkins-Tinch, C.; Sochat, V.; Forster, J.; Lee, S.; Twardziok, S.; Kanitz, A.; et al. Sustainable data analysis with Snakemake [version 1; peer review: 1 approved, 1 approved with reservations]. F1000Research 2021, 10. [CrossRef]
- Schneider, V.A.; Graves-Lindsay, T.; Howe, K.; Bouk, N.; Chen, H.C.; Kitts, P.A.; Murphy, T.D.; Pruitt, K.D.; Thibaud-Nissen, F.; Albracht, D.; et al. Evaluation of GRCh38 and de novo haploid genome assemblies demonstrates the enduring quality of the reference assembly. Genome Res 2017, 27, 849-864. [CrossRef]
- Li, H. Aligning sequence reads, clone sequences and assembly contigs with BWA-MEM. 2013. [CrossRef]
- Wang, K.; Li, M.; Hakonarson, H. ANNOVAR: functional annotation of genetic variants from high-throughput sequencing data. Nucleic Acids Res 2010, 38, e164. [CrossRef]
Disclaimer/Publisher’s Note: The statements, opinions and data contained in all publications are solely those of the individual author(s) and contributor(s) and not of MDPI and/or the editor(s). MDPI and/or the editor(s) disclaim responsibility for any injury to people or property resulting from any ideas, methods, instructions or products referred to in the content. |
© 2025 by the authors. Licensee MDPI, Basel, Switzerland. This article is an open access article distributed under the terms and conditions of the Creative Commons Attribution (CC BY) license (http://creativecommons.org/licenses/by/4.0/).
Copyright: This open access article is published under a Creative Commons CC BY 4.0 license, which permit the free download, distribution, and reuse, provided that the author and preprint are cited in any reuse.


