
Submitted:
18 September 2025
Posted:
19 September 2025
You are already at the latest version
Preprints on COVID-19 and SARS-CoV-2
Abstract
The changes in charge distribution caused by mutations in the spike protein may play a crucial role in balancing infectivity and immune evasion during the evolution of SARS-CoV-2. To explore how charge increments in spike protein variants influence viral evolution, a statistical analysis was conducted on 57 SARS-CoV-2 variants, examining relationships between charge distribution, lineage divergence, ACE2 affinity, immune evasion, and RBD expression. A phylogenetic tree was also reconstructed using only the charge properties of mutation sites. Results indicated that with increasing lineage divergence, overall positive charge initially rose sharply and then more gradually. Partitioning the spike protein into three domains—the RBD, the N-terminal flanking region (B-RBD), and the C-terminal flanking region (A-RBD)—revealed distinct patterns: positive charge increased in the RBD and A-RBD, whereas the B-RBD accumulated negative charge. Charge increments were negatively associated with ACE2 affinity and RBD expression but positively correlated with immune evasion. The k-mer–based tree derived from charge-reduced sequences showed a topology consistent with the whole-genome tree. These findings suggest that charge distribution in spike proteins is closely linked to viral evolution, with the opposing trends in the RBD and B-RBD potentially reflecting a balance between infectivity and immune escape.
Keywords:
SARS-CoV-2
; spike protein
; mutation
; charge change
; evolution
1. Introduction
Since its identification in late 2019, SARS-CoV-2 has continued to evolve and spread globally for more than five years. Based on Nextstrain data available as of December 2024, the evolutionary rate of SARS-CoV-2 has been estimated at approximately 29 substitution sites per year [1]. The extensive accumulation of mutations has provided a valuable basis for exploring the evolutionary characteristics of the virus. Among these mutations, those occurring in the spike (S) protein appear to have played a particularly important role in the rapid evolution of SARS-CoV-2 and have therefore become a central focus in studies of viral adaptation [2,3,4,5,6,7]. The S protein represents the principal antigenic component among the structural proteins of SARS-CoV-2. In contrast to other functional proteins, it mediates receptor recognition, cell adhesion, and membrane fusion during the infection process [3]. Viral entry is initiated when the S protein binds to the host angiotensin-converting enzyme 2 (ACE2) receptor [4].
The wild-type S protein exhibits a negatively charged stem region (S2 domain), whereas the tip region (S1 domain), particularly the receptor-binding domain (RBD), is primarily positively charged across a wide pH range [5,6]. During viral evolution, alterations in the charge distribution on the S protein surface have been suggested to influence infectivity and transmissibility [5,6,7,8,9,10,11,12,13,14,15,16,17]. Zhang et al. [7] reported that most mutations within the RBD increase surface positive charge or polarity, thereby enhancing binding affinity to ACE2 and facilitating immune evasion. Cotten and Phan proposed that increased positive charge in the S protein may enhance viral transmissibility [8]. Jawad et al. observed that such mutations strengthen electrostatic interactions between the RBD and ACE2, which may contribute to increased infectivity and transmissibility [9]. Božič and Podgornik further noted that, with the emergence of Omicron, the trend toward higher positive charge in SARS-CoV-2 variants was interrupted, and sublineages displayed greater heterogeneity in ionizable amino acid composition [10]. Uneven charge distribution has also been considered to stabilize the crown-like trimeric structure of the S protein and to promote adhesion of viral particles to negatively charged receptors and membrane surfaces [5], thereby supporting nonspecific electrostatic interactions between the virus and charged macromolecules or extracellular matrices in the surrounding environment [11,12]. Lu et al. [13], analyzing data up to January 2023, reported that positive charge covered nearly the entire interaction surface of the Omicron RBD and Furin cleavage site, which was interpreted as an indication that the potential for further accumulation of positive charges at these interfaces may be limited, possibly constraining additional gains in infectivity.
With the emergence of new variants such as JN.1, KP.2, and XEC, questions remain as to whether the statistical trend of charge accumulation in the S protein will shift, whether regional charge increments will follow distinct evolutionary patterns, and how binding affinity to ACE2 and immune evasion may be influenced by such changes. The present study seeks to address these questions by statistically examining the relationship between lineage divergence and charge increments across different regions of the S protein. In addition, a phylogenetic tree reflecting evolutionary lineages was reconstructed through a simplified reduction of S protein variant sequences. The findings are expected to provide further insight into the evolutionary dynamics of SARS-CoV-2.
2. Materials and Methods
2.1. Data Collection
The mutation data for the spike (S) protein of 57 SARS-CoV-2 variants were obtained from the Outbreak.info database [18] (https://outbreak.info/, accessed September 15, 2024). These variants included both early major lineages and more recent subvariants, such as JN.1 and XEC. For each selected variant, information on mutation sites in the S protein was extracted together with the date of the earliest global sampling. Lineage divergence data for the same 57 variants were obtained from Nextstrain [1] (https://nextstrain.org/, accessed September 15, 2024). Data describing changes in RBD expression levels caused by mutations, as well as their relationship with ACE2 affinity, were derived from the experimental results reported by Starr et al. (2020) [19] (https://jbloomlab.github.io/SARS-CoV-2-RBD_DMS/). Additional experimental data concerning mutation-induced changes in RBD–ACE2 affinity, along with the effects of single amino acid substitutions in the wild-type RBD on immune escape from the antibody LY-CoV1404, were taken from Starr et al. (2022) [20]. Codon-level mutation information for the spike protein coding sequences was obtained from the SARS-CoV-2 CoCoPUT database [21] (https://dnahive.fda.gov/hivecuts/sarscov2/).
2.2. SARS-CoV-2 Spike Protein Domains
The full-length spike (S) protein of SARS-CoV-2 consists of 1,273 amino acid residues and is organized into two major domains, S1 and S2. To examine changes in charge increments across different regions of the S protein with increasing lineage divergence, the protein was partitioned into three regions relative to the receptor-binding domain (RBD), as illustrated in Figure 1. Residues 1–330 were designated as the N-terminal flanking region of the RBD (B-RBD), residues 331–531 as the RBD itself, and residues 532–1,273 as the C-terminal flanking region of the RBD (A-RBD).
2.3. Evolutionary Macro-Lineage Definition of SARS-CoV-2
According to the classification of SARS-CoV-2 variant macro-lineages proposed by Luo and Lv [22], variants predating Omicron (e.g., Alpha, Beta, Gamma, Delta) have been designated as the N-lineage. Early Omicron strains (e.g., BA.1, BA.2, BA.5) have been categorized as the O-lineage, whereas more recently emerging Omicron subvariants (e.g., JN.1, KP.2, XEC) have been grouped into the P-lineage.
2.4. Definition of Charge Increment
At a physiological pH of approximately 7.4, lysine (Lys, K), arginine (Arg, R), and histidine (His, H) are generally positively charged, whereas aspartic acid (Asp, D), glutamic acid (Glu, E), and tyrosine (Tyr, Y) are typically negatively charged; the remaining residues are considered electrically neutral. To quantify charge changes in variants relative to the wild type, a simplified scheme was applied in which positively charged residues were assigned a value of +1, negatively charged residues a value of −1, and neutral residues a value of 0. The charge increment at a single mutation site was defined as the difference between the charge of the mutated residue and that of the wild-type residue. For mutations involving residue deletion, the charge increment for removing a positively charged residue is -1; for removing a negatively charged residue, it is +1; and for removing a neutral residue, it is 0. The charge increment for a designated region is the algebraic sum of the charge increments of all mutated sites within that region. Table 1 presents the Pango lineage names, number of mutation sites, lineage divergence, earliest sampling dates, and charge increments (for B-RBD, RBD, A-RBD, and the full spike protein) of 57 SARS-CoV-2 variants. The number of mutation sites and earliest sampling dates were obtained from Outbreak.info, where lineage-specific mutations are defined as non-synonymous substitutions or deletions present in more than 75% of sequences within a lineage [17]. Lineage divergence was defined as the total number of genomic nucleotide mutations relative to the phylogenetic root [1].
2.5. Phylogenetic Tree Construction Scheme
2.5.1. Based on Full-Length S Protein Sequences
An encoding scheme was designed for each variant’s full-length S protein amino acid sequence to reflect mutation status and the resulting charge changes. In this scheme, unmutated sites were encoded as 0, mutated sites with no change in charge as 1, mutated sites with a positive charge increment as 2, and mutated sites with a negative charge increment as 3. In this way, the 20-letter amino acid sequence was reduced to a four-character sequence {0, 1, 2, 3}.
For the ith and jth variants, the reduced sequences were denoted as Xi= {xi1, xi2, ..., xiN}and Xj= {xj1, xj2, ..., xjN}, where i, jϵ (1, 2, ..., M=57). The Euclidean distance between them was calculated as:
The complete distance matrix D constructed from all reduced sequences was expressed as:
Based on this distance matrix, a phylogenetic tree was constructed using the Unweighted Pair Group Method with Arithmetic Mean (UPGMA) [23].
When the reduced sequence itself was directly used as the variant representation, N = 1273. Alternatively, when k-mer frequencies of the reduced sequence were used, N = wk, where w represents the number of character types in the reduced sequence. Since the characters were {0, 1, 2, 3}, w = 4. For k = 2, this resulted in N = 4² = 16. In this case, the 2-mer representation of the reduced sequence was X = {x1, x2, ..., xN}, where each xi represented the frequency of a specific 2-mer (e.g., "00," "01," "02") in the reduced sequence.
2.5.2. Based on Mutated Sites of the S Protein
The above tree construction was based on all 1,273 amino acid positions of the S protein. Alternatively, a phylogenetic tree was also constructed using only the mutated sites [22]. By taking the union of all mutated sites across the 57 variants, a sequence of N = 131 mutated positions was obtained. For each variant, a reduced sequence of length 131 was generated according to the positions of its mutated sites, using the same encoding method described above.
For example, the B.1.1.7 variant contained ten mutated sites at positions {69, 70, 144, 501, 570, 614, 681, 716, 982, 1118}. Applying the encoding scheme, its reduced sequence was represented as: {000000000000000031000000000000000000000000000000000000000000000000000000000000000000000000000000000000000000000000000000000000000000000000000000300003002000000000000000000000100000200}. This reduced sequence was then used to construct a phylogenetic tree following the method described in Section 5.1.
All statistical computations were performed in R [24]. Cluster analysis was conducted using the hclust (method = "average") function for the UPGMA method. Phylogenetic trees were visualized using the plot () function, and additional figures were generated with ggplot ().
3. Results
3.1. Relationship Between Spike Protein Charge Increment and Lineage Divergence
Based on the three defined regions of the spike protein, a statistical analysis was conducted to examine the relationship between charge increments within each region and lineage divergence, as summarized in Figure 2.
Figure 2A illustrates the overall charge increment of the spike protein in relation to lineage divergence. The fitted curve was obtained through local polynomial regression smoothing, with the shaded area indicating the 95% confidence interval. The analysis suggests that within a divergence range of approximately 0–60, the spike protein acquires positive charges in a rapid and nearly linear manner, with an estimated slope of +0.1 charge increment per unit divergence. According to the data in Table 1, this interval corresponds to all N-lineage variants and the early variant of the O-lineage. When divergence extends from about 60 to 120, the rate of positive charge accumulation decreases substantially, with the slope reduced to approximately +0.01. This interval includes BA.2 and subsequent O-lineage variants. A further change appears between divergence values of 120 and 160, where the accumulation of positive charge shows a slight increasing trend again, reflected by a slope of roughly +0.02. This range encompasses all P-lineage variants.
Figure 2B depicts charge increments distributed across the three regions of the spike protein—B-RBD, RBD, and A-RBD—along the axis of lineage divergence. A continuous linear increase in positive charge is observed in the RBD region, accompanied by a comparable, though slightly weaker, upward trend in the A-RBD region. In contrast, the B-RBD region demonstrates a steady decline in net charge with divergence, suggesting a progressive accumulation of negative charges.
Earlier studies [12,13,15] emphasized the global charge increment of the spike protein during evolution, concluding that positive charge increases initially and then tends to stabilize as lineage divergence grows. Although the present dataset incorporates more recent variants (e.g., XEC, first identified in June 2024), the previously reported conclusions appear to remain broadly consistent when viewed at the level of the entire spike protein. However, the region-specific analysis presented here, which differentiates A-RBD, RBD, and B-RBD, highlights an opposing evolutionary trajectory of net charge between RBD and B-RBD (Figure 2B). This pattern resembles the antagonistic trends in net charge evolution between the NTD and RBD regions that were described by Quaranta et al. [25].
3.2. Correlation Analysis of Spike Protein Charge Increment, Immune Escape, Affinity, and Expression Levels Across Different Macro-Lineages
Recent studies have suggested that two major forces may be shaping the evolution of SARS-CoV-2: intrinsic transmissibility, largely determined by ACE2 binding affinity, and immune escape, achieved through reduced susceptibility to neutralizing antibodies [26]. To explore how these evolutionary pressures may be associated with changes in spike protein charge, charge increments in the three regions of the spike protein were examined alongside RBD–ACE2 binding affinity, RBD expression levels, and immune escape across the N, O, and P macro-lineages. In addition, potential relationships among lineage-dependent affinity, immune escape, RBD expression levels, and RBD charge increments were evaluated. The results are summarized in Figure 3 and Table 2.
Charge increments were calculated as described in the Materials and Methods: +1 was assigned to positively charged residues, –1 to negatively charged residues, and 0 to neutral residues. The charge increment per mutation was defined as the difference between the charge of the mutant and that of the corresponding wild-type residue. Experimental data from Starr et al. [19,20] on single-point mutation affinity, immune escape, and expression levels were used, and mean values across all mutation sites per variant were computed to represent each variant’s affinity, immune escape capacity, and RBD expression level.
As illustrated in Figure 3A,B, and summarized in Table 2, charge increments tended to increase in the RBD and A-RBD regions from the N to the P lineage, whereas a decline was observed in the B-RBD region. Besides, within the RBD–ACE2 binding interface, charge increments appeared broadly comparable between the O and P lineages, with values slightly exceeding those observed in the N lineage (data not shown).
Figure 3C presents the distribution of RBD–ACE2 binding affinity. The N lineage displays a median value of approximately 0.02, whereas the O and P lineages both show medians near –0.12, suggesting a progressive reduction in binding affinity during evolution. Figure 3D illustrates immune escape capacity, which appears to increase gradually across lineages, with median values of approximately 0.0028 for N, 0.034 for O, and 0.031 for P. Among the 32 O-lineage variants, two distinct clusters are observed: one group of 15 earlier Omicron variants (including BA.1, BA.2, and BA.4) exhibits immune escape levels similar to those of the N lineage, whereas the other group of 17 later variants (such as the XBB series and EG.5.1) shows levels closer to those of the P lineage. The similarity between later Omicron variants and the P lineage may reflect a progressive strengthening of immune escape during viral evolution.
Figure 3E shows the distribution of RBD expression levels. The median value is around 0.0 for the N lineage, –0.21 for the O lineage, and –0.15 for the P lineage, suggesting a general decrease in expression levels throughout evolution.
Figures 3F–H further indicate that as the positive charge in the RBD region increases, RBD–ACE2 binding affinity and expression levels tend to decrease, while immune escape capacity increases. Within the N and O lineages, RBD–ACE2 affinity appears to correlate positively with charge increment, although no comparable association is evident in the P lineage. RBD expression levels show a positive correlation with charge increment only within the N lineage, whereas no such relationship is apparent in the O or P lineages. By contrast, immune escape capacity demonstrates a positive correlation with charge increment across all three lineages (N, O, and P).
Taken together, these statistical results suggest that during viral evolution, the RBD region accumulates positive charge, while the B-RBD region (or NTD) accumulates negative charge. At the same time, the affinity between SARS-CoV-2 and ACE2 appears to weaken, whereas immune escape capacity tends to increase. These results are also consistent with the observations of Quaranta et al. [25]. Although correlation does not imply causation, the observed associations between spike protein charge variation and both binding affinity and immune escape may provide insights into the evolutionary mechanisms of SARS-CoV-2.
3.3. Analysis of the Correlation Between Codon Usage Characteristics of SARS-CoV-2 Variants and Spike Protein Charge Increment
At the codon level, linear correlations were examined between charge increment and the Codon Adaptation Index (CAI), the Effective Number of Codons (ENC), and GC content (including GC1, GC2, and GC3) across different lineages. The results are presented in Table 3.
From Table 3, it may be observed that, for all variants combined, the charge increment of the spike protein exhibits a positive correlation with ENC (0.49) but negative correlations with GC2 (-0.60) and GC (-0.40), while no meaningful correlation is detected with CAI, GC1, or GC3. Examination of different evolutionary lineages reveals lineage-specific patterns between the charge increment and codon usage of the corresponding genes. In the N lineage, positive correlations are observed with GC1 (0.74) and GC (0.65), whereas negative correlations are found with CAI (-0.56). In the O lineage, a negative correlation is evident with GC2 (-0.50) and GC (-0.49). In the P lineage, negative correlations are present with ENC (-0.62) and GC3 (-0.69).
To conclude, although certain statistical associations are present between codon usage in the S gene and the charge increment of the S protein, these correlations appear generally weak, and changes in several codon-level features during S protein evolution seem to be limited. As noted by Lu et al. [13], such minor changes may not be expected to exert discernible biological effects.
3.4. Phylogenetic Tree Construction Based on the Charge Properties of Mutation Sites in the Spike Protein Sequence
Mutations in the spike protein are considered central to the evolutionary dynamics of SARS-CoV-2. Consequently, the reconstruction of phylogenetic relationships among variants might be achieved using only spike protein variant sequences. Luo and Lv [22] proposed a method employing a four-letter sequence to represent amino acid mutations in the spike protein, which was subsequently used to infer phylogenetic relationships through an n-distance algorithm. This approach accounted for the binding affinity between the RBD and ACE2 but did not incorporate the charge properties of mutation sites into the encoding system.
In the present study, the amino acid sequence was reduced based solely on the charge characteristics of the mutation sites. The reduced sequences were then encoded using three distinct feature vector construction strategies: 1) direct positional representation of the reduced spike protein sequence with single-letter codes, 2) representation by 3-mer frequencies, and 3) representation by 2-mer frequencies of the reduced mutation-site sequence. The UPGMA algorithm was subsequently applied to construct the phylogenetic tree, and the results are presented in Figure 4.
Figure 4A presents the tree constructed directly from the position-based single-letter representation of the full-length reduced spike protein sequence. The topology is divided into three major branches (highlighted in different colors), which correspond to the three macro-lineages. Within the O lineage, further subdivision into three groups is observed: BA.1-related subtypes, BA.2 and its derivatives (such as BA.2.75 and BA.2.12.1), and the XBB series (e.g., XBB.1.5, XBB.1.9). When the tree is reconstructed using only the reduced sequence of mutation sites, the resulting structure is essentially identical to that in Figure 4A.
Figure 4B illustrates the phylogenetic tree derived from the 3-mer frequency representation of the full-length reduced spike protein sequence, whereas Figure 4C shows the tree constructed from the 2-mer frequency representation of the reduced mutation-site sequence. The major topological framework in both is generally consistent with Figure 4A, with three principal branches corresponding to the macro-lineages. Some differences, however, are evident. In Figure 4B,C, the O lineage is divided into two branches, whereas in Figure 4A it is separated into three. Moreover, Figure 4A displays more detailed sub-branching, indicating a comparatively more complex structure.
By contrast, the trees in Figure 4B,C appear more simplified, emphasizing the relationships among the primary clades. These differences may be attributed to the distinct approaches used for sequence reduction. While k-mer frequency representation offers a convenient simplification, it may be accompanied by greater information loss.
For comparison, Figure 5 presents the unrooted phylogenetic tree based on full-genome sequences of SARS-CoV-2 variants obtained from the Nextstrain database [1]. This dataset comprises 3,889 globally representative variants sampled between December 2019 and November 2024 (https://nextstrain.org/, accessed December 3, 2024).
As shown in Figure 5, SARS-CoV-2 variants are clustered into three major branches, which align with the topology observed in the spike protein–based tree (Figure 4). On closer inspection, the Omicron clade is subdivided into three major groups: 21K (BA.1 and related subtypes), 21L (BA.2 and related subtypes), and 22F (XBB and related subtypes). This subdivision is highly consistent with the branching pattern of the O lineage observed in Figure 4A. Of note, BA.1 forms an early evolutionary branch distinct from other Omicron variants, which may be associated with its 11 unique mutations compared with later sublineages [27]. These mutations may have conferred distinctive evolutionary features that influenced viral transmission and adaptability.
In addition, two mutation-based sequence encoding strategies were applied to reduce the full-length amino acid sequence of the spike protein. In the first strategy, unmutated sites were encoded as 0, mutated sites without charge change as 1, and mutated sites involving charge changes as 2, generating a three-character sequence {0, 1, 2}. In the second strategy, unmutated sites were encoded as 0, and all mutated sites were uniformly encoded as 1, yielding a two-character sequence {0, 1}. Phylogenetic trees reconstructed using these reduced sequences (data not shown) produced topologies largely consistent with those derived from the original sequences. These results suggest that the proposed approach—phylogenetic reconstruction based on charge-informed sequence reduction of the spike protein—may represent a rational and efficient strategy. Furthermore, they imply that charge alterations within the spike protein could contribute to shaping the evolutionary dynamics of SARS-CoV-2 lineages.
4. Discussion
4.1. Evolutionary Trend of Spike Protein Charge Increment
Previous studies by Cotten and Phan [12], Lu et al. [13], and Božič and Podgornik [15] reported that the overall positive charge of the spike protein tended to increase with lineage divergence. However, this trend appeared to plateau with the emergence of the Omicron lineage. With the appearance of more recent variants, it remains uncertain whether the charge increment still follows the pattern of “initial increase followed by stabilization.” Analysis of a dataset that includes the latest variants indicates that this trend is maintained from the N to the O lineage. From the O to the P lineage, a slight acceleration in positive charge accumulation is observed; however, the magnitude of change is relatively small and does not appear to alter the underlying pattern of “increasing first and then stabilizing.”
A further observation is that the charge increment within the RBD amino-terminal domain (B-RBD) demonstrates an opposite trend compared with that of the RBD itself. Specifically, as the lineages evolve, the positive charge in the RBD increases, whereas the negative charge in the B-RBD region also increases. Figure 6 illustrates the electrostatic features of the spike protein in relation to ACE2 binding. Since the ACE2 binding surface is negatively charged, the accumulation of positive charge within the RBD is expected to enhance electrostatic attraction to ACE2, thereby favoring stronger binding affinity. Conversely, the accumulation of negative charge within the B-RBD region modifies the local surface electrostatic potential and may partially counteract the RBD–ACE2 interaction. This opposite trend in charge increments between the RBD and B-RBD regions may therefore reflect a structural and functional balance between viral infectivity and immune evasion.
4.2. Evolution of the Balance Between SARS-CoV-2 Viral Infectivity and Immune Escape
Several studies have suggested that the evolution of SARS-CoV-2 involves a dynamic balance between viral infectivity and immune escape [26,28,29,30,31]. In our analysis, the affinity between the RBD and ACE2 in the O and P lineages appeared markedly lower than that in the N lineage (Figure 3C), whereas immune escape capacity followed an opposite trend (Figure 3D). This observation may imply that SARS-CoV-2 initially favored high infectivity to ensure efficient transmission but, as host immune pressure increased, progressively adopted mutations that compromised infectivity while enhancing immune escape, thereby maintaining an adaptive balance between binding affinity and immune evasion.
To further examine this pattern, RBD expression levels and ACE2 binding changes resulting from additional mutations were also assessed [20]. The results indicated that the relationships among spike protein charge increment, ACE2 affinity, and expression levels generally followed a similar negative correlation to that shown in Figure 3. As early as 2021, Yuan et al. [28] reported that mutations such as K417N and Y505H did not increase ACE2 affinity and even impaired binding, while Xue et al. [29] noted that although epitope-specific mutations in the RBD were central drivers of immune escape, they often incurred an adaptive cost by reducing ACE2 affinity. Nonetheless, compensatory mutations (e.g., N501Y) were shown to partially restore ACE2 binding while remodeling antigenic sites, enabling a balance between immune evasion and receptor engagement. Ma et al. [26] further suggested that during the early stages of viral spread, mutations enhancing ACE2 binding were prevalent and likely contributed to higher transmission efficiency. However, with the rise of population immunity through vaccination and natural infection, selective pressure shifted toward immune escape, with mutations conferring stronger evasion becoming more critical for persistence. Recently, Yang et al. [30] compared BA.2.86 and JN.1 using surface plasmon resonance analysis, reporting that JN.1 exhibited substantially reduced ACE2 affinity but higher immune escape capability. Such a strategy of reduced binding accompanied by enhanced evasion may have allowed these variants to persist at low levels in distinct populations, potentially serving as reservoirs for further accumulation of immune escape mutations [28]. Collectively, these findings suggest that under heightened immune pressure, reduced ACE2 binding affinity may represent one of the adaptive trajectories in SARS-CoV-2 evolution, reflecting the virus’s attempt to balance infectivity and immune evasion.
It is also noteworthy that differences in RBD–ACE2 binding ability and expression levels were observed between the O and P lineages compared with the N lineage, suggesting that evolutionary strategies in these later lineages may rely more heavily on non-charge-related mechanisms. In contrast, the N lineage appeared more sensitive to charge-associated changes. This divergence underscores the possibility of lineage-specific adaptive strategies shaped by distinct evolutionary pressures. Furthermore, weaker RBD–ACE2 binding should not necessarily be equated with reduced transmissibility [30,31], as viral transmission may be influenced by multiple factors across the infection and replication cycle, including structural features of the spike trimer rather than a single RBD. For this reason, despite the lower binding affinity observed in O and P lineages compared with the N lineage, these lineages—particularly O—warrant close monitoring. The P lineage, in particular, may deserve careful attention, as many of its variants exhibit strong immune escape against widely used monoclonal antibodies, potentially raising transmission risks even within vaccinated populations [29].
Author Contributions
Conceptualization, J.L. and Y.Z.; methodology, J.L. and Y.M.; software, Y.M.; validation, Y.M., K.W. and M.C.; formal analysis, Y.M.; investigation, Y.M., K.W. and M.C.; resources, J.L. and Y.Z.; data curation, Y.M.; writing—original draft preparation, Y.M.; writing—review and editing, J.L., Y.M. and Y.Z.; visualization, Y.M.; supervision, J.L. and Y.Z.; project administration, J.L. and Y.Z.; funding acquisition, J.L. and Y.Z. All authors have read and agreed to the published version of the manuscript.
Funding
This research was funded by Natural Science Foundation of Inner Mongolia Autonomous Region of China (2024LHMS06018), and the Basic Scientific Research Operational Funds Project of Colleges and Universities Directly under the Inner Mongolia Autonomous Region (JY20250094).
Institutional Review Board Statement
Not applicable.
Informed Consent Statement
Not applicable.
Data Availability Statement
All data are available both in the article text.
Acknowledgments
We thank Professor Liaofu Luo from Inner Mongolia University for his valuable discussions and insights.
Conflicts of Interest
The authors declare no conflicts of interest.
References
- Hadfield, J.; Megill, C.; Bell, S.M.; Huddleston, J.; Potter, B.; Callender, C.; Sagulenko, P.; Bedford, T.; Neher, R.A. Nextstrain: Real-time tracking of pathogen evolution. Bioinformatics 2018, 34, 4121–4123. [Google Scholar] [CrossRef] [PubMed]
- Cocherie, T.; Zafilaza, K.; Leducq, V.; Marot, S.; Calvez, V.; Marcelin, A. G.; Todesco, E. Epidemiology and characteristics of SARS-CoV-2 variants of concern: The impacts of the spike mutations. Microorganisms 2022, 11, 30. [Google Scholar] [CrossRef]
- Huang, Y.; Yang, C.; Xu, X.F.; Xu, W.; Liu, S.W. Structural and functional properties of SARS-CoV-2 spike protein: Potential antivirus drug development for COVID-19. Acta Pharmacol Sin. 2020, 41, 1141–1149. [Google Scholar] [CrossRef]
- Yan, R.; Zhang, Y.; Li, Y.; Xia, L.; Guo, Y.; Zhou, Q. Structural basis for the recognition of SARS-CoV-2 by full-length human ACE2. Science. 2020, 367, 1444–1448. [Google Scholar] [CrossRef]
- Adamczyk, Z.; Batys, P.; Barbasz, J. SARS-CoV-2 virion physicochemical characteristics pertinent to abiotic substrate attachment. Curr Opin Colloid Interface Sci. 2021, 55, 101466. [Google Scholar] [CrossRef]
- Kucherova, A.; Strango, S.; Sukenik, S.; Theillard, M. Computational modeling of protein conformational changes—Application to the opening SARS-CoV-2 spike. J Comput Phys. 2021, 444, 110591. [Google Scholar] [CrossRef]
- Zhang, Z.; Zhang, J.; Wang, J. Surface charge changes in spike RBD mutations of SARS-CoV-2 and its variant strains alter the virus evasiveness via HSPGs: A review and mechanistic hypothesis. Front Public Health. 2022, 10, 952916. [Google Scholar] [CrossRef]
- Cotten, M.; Phan, M.V.T. Evolution of increased positive charge on the SARS-CoV-2 spike protein may be adaptation to human transmission. iScience. 2023, 26, 106230. [Google Scholar] [CrossRef]
- Jawad, B.; Adhikari, P.; Podgornik, R.; Ching, W.Y. Binding interactions between receptor-binding domain of spike protein and human angiotensin converting enzyme-2 in Omicron variant. J Phys Chem Lett. 2022, 13, 3915–3921. [Google Scholar] [CrossRef]
- Božič, A.; Podgornik, R. Evolutionary changes in the number of dissociable amino acids on spike proteins and nucleoproteins of SARS-CoV-2 variants. Virus Evol. 2023, 9, vead040. [Google Scholar] [CrossRef] [PubMed]
- Javidpour, L.; Božič, A.; Naji, A.; Podgornik, R. Electrostatic interactions between the SARS-CoV-2 virus and a charged electret fibre. Soft Matter. 2021, 17, 4296–4303. [Google Scholar] [CrossRef]
- Arbeitman, C.R.; Rojas, P.; Ojeda-May, P.; Garcia, M.E. The SARS-CoV-2 spike protein is vulnerable to moderate electric fields. Nat Commun. 2021, 12, 5407. [Google Scholar] [CrossRef]
- Lu, X.; Chen, Y.; Zhang, G. Functional evolution of SARS-CoV-2 spike protein: Maintaining wide host spectrum and enhancing infectivity via surface charge of spike protein. Comput Struct Biotechnol J. 2023, 21, 2068–2074. [Google Scholar] [CrossRef] [PubMed]
- Adhikari, P.; Jawad, B.; Podgornik, R.; Ching, W.Y. Mutations of Omicron variant at the interface of the receptor domain motif and human angiotensin-converting enzyme-2. Int J Mol Sci. 2022, 23, 2870. [Google Scholar] [CrossRef] [PubMed]
- Barroso da Silva, F.L.; Giron, C.C.; Laaksonen, A. Electrostatic features for the receptor binding domain of SARS-CoV-2 wildtype and its variants. Compass to the severity of the future variants with the charge-rule. J Phys Chem B. 2022, 126, 6835–6852. [Google Scholar] [CrossRef]
- Nie, C.; Sahoo, A.K.; Netz, R.R.; Herrmann, A.; Ballauff, M.; Haag, R. Charge matters: Mutations in Omicron variant favor binding to cells. Chembiochem. 2022, 23, e202100681. [Google Scholar] [CrossRef]
- Kim, S.H.; Kearns, F.L.; Rosenfeld, M.A.; Votapka, L.; Casalino, L.; Papanikolas, M.; Amaro, R.E. SARS-CoV-2 evolved variants optimize binding to cellular glycocalyx. Cell Rep Phys Sci. 2023, 4, 101346. [Google Scholar] [CrossRef]
- Gangavrapu, K.; Latif, A.A.; Mullen, J.L.; Alkuzweny, M.; Hufbauer, E.; Tsueng, G.; Haag, E.; Zeller, M.; et al. Outbreak.info genomic reports: Scalable and dynamic surveillance of SARS-CoV-2 variants and mutations. Nat Methods. 2023, 20, 512–522. [Google Scholar] [CrossRef] [PubMed]
- Starr, T.N.; Greaney, A.J.; Hilton, S.K.; Ellis, D.; Crawford, K.H.D.; Dingens, A.S.; Navarro, M.J.; Bowen, J.E.; Tortorici, M.A.; Walls, A.C.; et al. Deep mutational scanning of SARS-CoV-2 receptor binding domain reveals constraints on folding and ACE2 binding. Cell. 2020, 182, 1295–1310. [Google Scholar] [CrossRef]
- Starr, T.N.; Greaney, A.J.; Stewart, C.M.; Walls, A.C.; Hannon, W.W.; Veesler, D.; Bloom, J.D. Deep mutational scans for ACE2 binding, RBD expression, and antibody escape in the SARS-CoV-2 Omicron BA.1 and BA.2 receptor-binding domains. PLoS Pathog. 2022, 18, e1010951. [Google Scholar] [CrossRef]
- Padhiar, N.H.; Ghazanchyan, T.; Fumagalli, S.E.; DiCuccio, M.; Cohen, G.; Ginzburg, A.; Rikshpun, B.; Klein, A.; Santana-Quintero, L.; Smith, S.; Komar, A. A.; Kimchi-Sarfaty, C. SARS-CoV-2 CoCoPUTs: Analyzing GISAID and NCBI data to obtain codon statistics, mutations, and free energy over a multiyear period. Virus Evol. 2025, 11, veae115. [Google Scholar] [CrossRef]
- Luo, L.; Lv, J. An evolutionary theory on virus mutation in COVID-19. Virus Res. 2024, 344, 199358. [Google Scholar] [CrossRef]
- Nei, M.; Kumar, S. Molecular Evolution and Phylogenetics; Oxford University Press: 198 Madison Avenue, New York, 2000; pp. 87–113. [Google Scholar]
- R Core Team. R: A Language and Environment for Statistical Computing. 2025, R Foundation for Statistical Computing, Vienna, Austria. https://www.R-project.org.
- Quaranta, M.; Via, A.; Pascarella, S. Structural analysis of the SARS-CoV-2 spike N-terminal domain across wild-type and recent variants: a comparative study. Proteins 2025, 10.1002/prot.26855. [CrossRef]
- Ma, W.; Fu, H.; Jian, F.; Cao, Y.; Li, M. Immune evasion and ACE2 binding affinity contribute to SARS-CoV-2 evolution. Nat Ecol Evol. 2023, 7, 1457–1466. [Google Scholar] [CrossRef] [PubMed]
- Caputo, E.; Mandrich, L. Structural and phylogenetic analysis of SARS-CoV-2 spike glycoprotein from the most widespread variants. Life. 2022, 12, 1245. [Google Scholar] [CrossRef] [PubMed]
- Yuan, M.; Huang, D.; Lee, C.D.; Wu, N.C.; Jackson, A.M.; Zhu, X.; Liu, H.; Peng, L.; van Gils, M.J.; Sanders, R.W.; et al. Structural and functional ramifications of antigenic drift in recent SARS-CoV-2 variants. Science. 2021, 373, 818–823. [Google Scholar] [CrossRef] [PubMed]
- Xue, S.; Han, Y.; Wu, F.; Wang, Q. Mutations in the SARS-CoV-2 spike receptor binding domain and their delicate balance between ACE2 affinity and antibody evasion. Protein Cell. 2024, 15, 403–418. [Google Scholar] [CrossRef]
- Yang, S.; Yu, Y.; Xu, Y.; Jian, F.; Song, W.; Yisimayi, A.; Wang, P.; Wang, J.; Liu, J.; Yu, L.; et al. Fast evolution of SARS-CoV-2 BA.2.86 to JN.1 under heavy immune pressure. Lancet Infect Dis. 2024, 24, e70–e72. [Google Scholar] [CrossRef]
- Peng, C.; Zhu, Z.; Shi, Y.; Wang, X.; Mu, K.; Yang, Y.; Zhang, X.; Xu, Z.; Zhu, W. Computational insights into the conformational accessibility and binding strength of SARS-CoV-2 spike protein to human angiotensin-converting enzyme 2. J Phys Chem Lett. 2020, 11, 10482–10488. [Google Scholar] [CrossRef]
Figure 1.
Schematic representation of the regions within the SARS-CoV-2 spike protein. The N-terminal flanking region of the RBD (B-RBD, residues 1–330) comprises the signal sequence (residues 1–26), the N-terminal domain (NTD, residues 27–293), and the NTD-to-RBD (N2R) segment (residues 294–330). The receptor-binding domain (RBD) spans residues 331–531. The C-terminal flanking region of the RBD (A-RBD) extends from residues 532–1273.
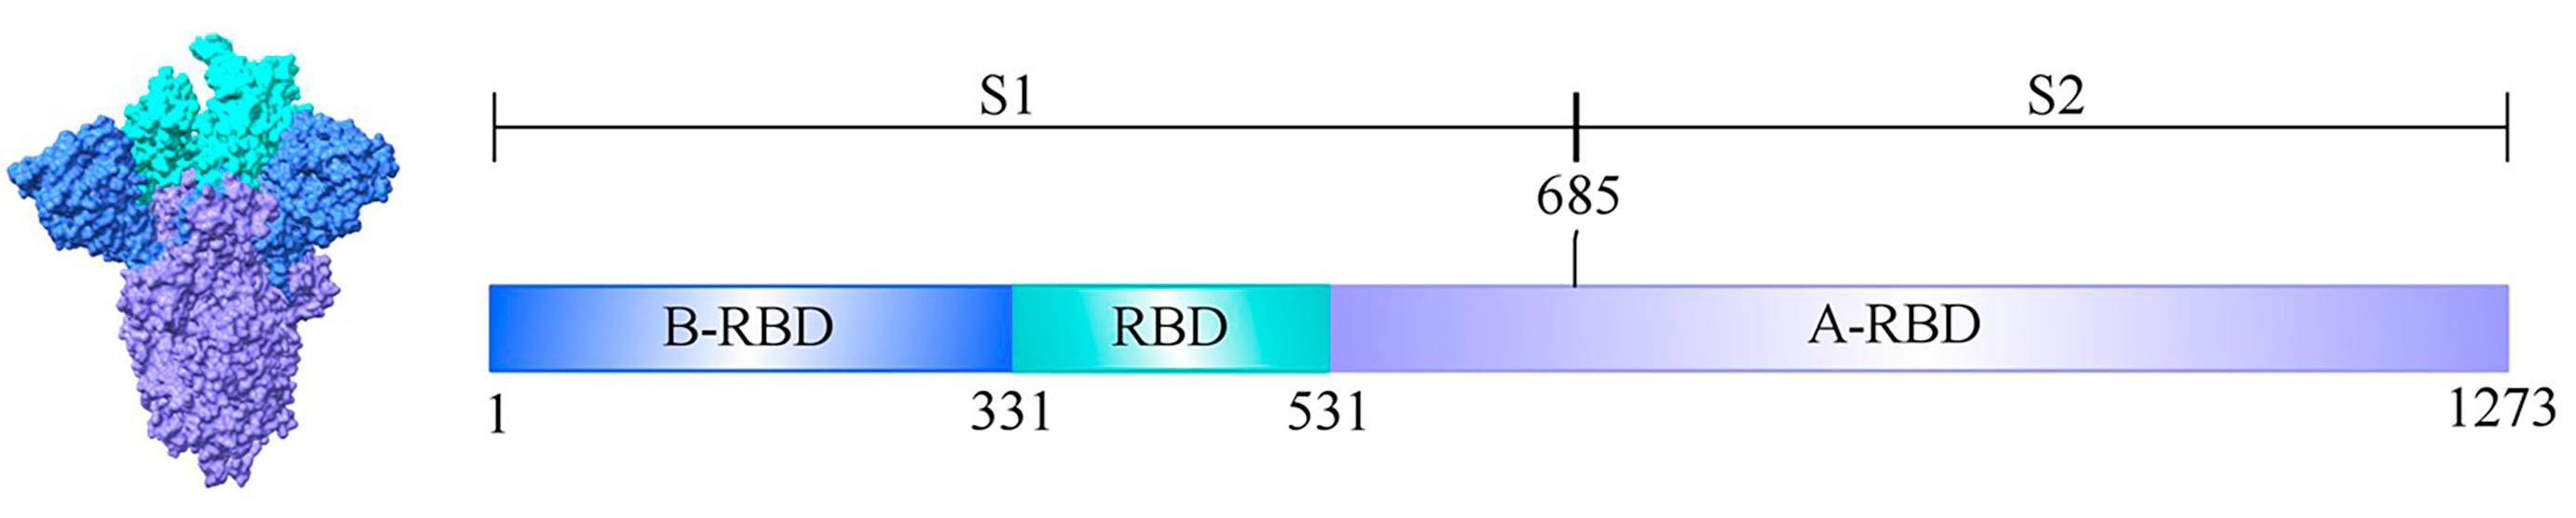
Figure 2.
Relationship between spike protein charge increments and lineage divergence. (A) Total charge increments of the spike protein in relation to lineage divergence. The trend appears nonlinear: an initial rapid increase is followed by a gradual reduction in growth rate, with a modest rebound at higher divergence levels. The curve was fitted using local polynomial regression, and the shaded area denotes the 95% confidence interval. (B) Regional patterns of charge increment across spike protein domains. Within the RBD region, charge increments exhibit a pronounced linear increase with divergence. A comparable but slower upward trend is observed in the A-RBD region. By contrast, the B-RBD region demonstrates a progressive decline in charge increment, shifting toward negative values as divergence increases. Marginal histograms on the right illustrate the distribution of charge increments for each region.
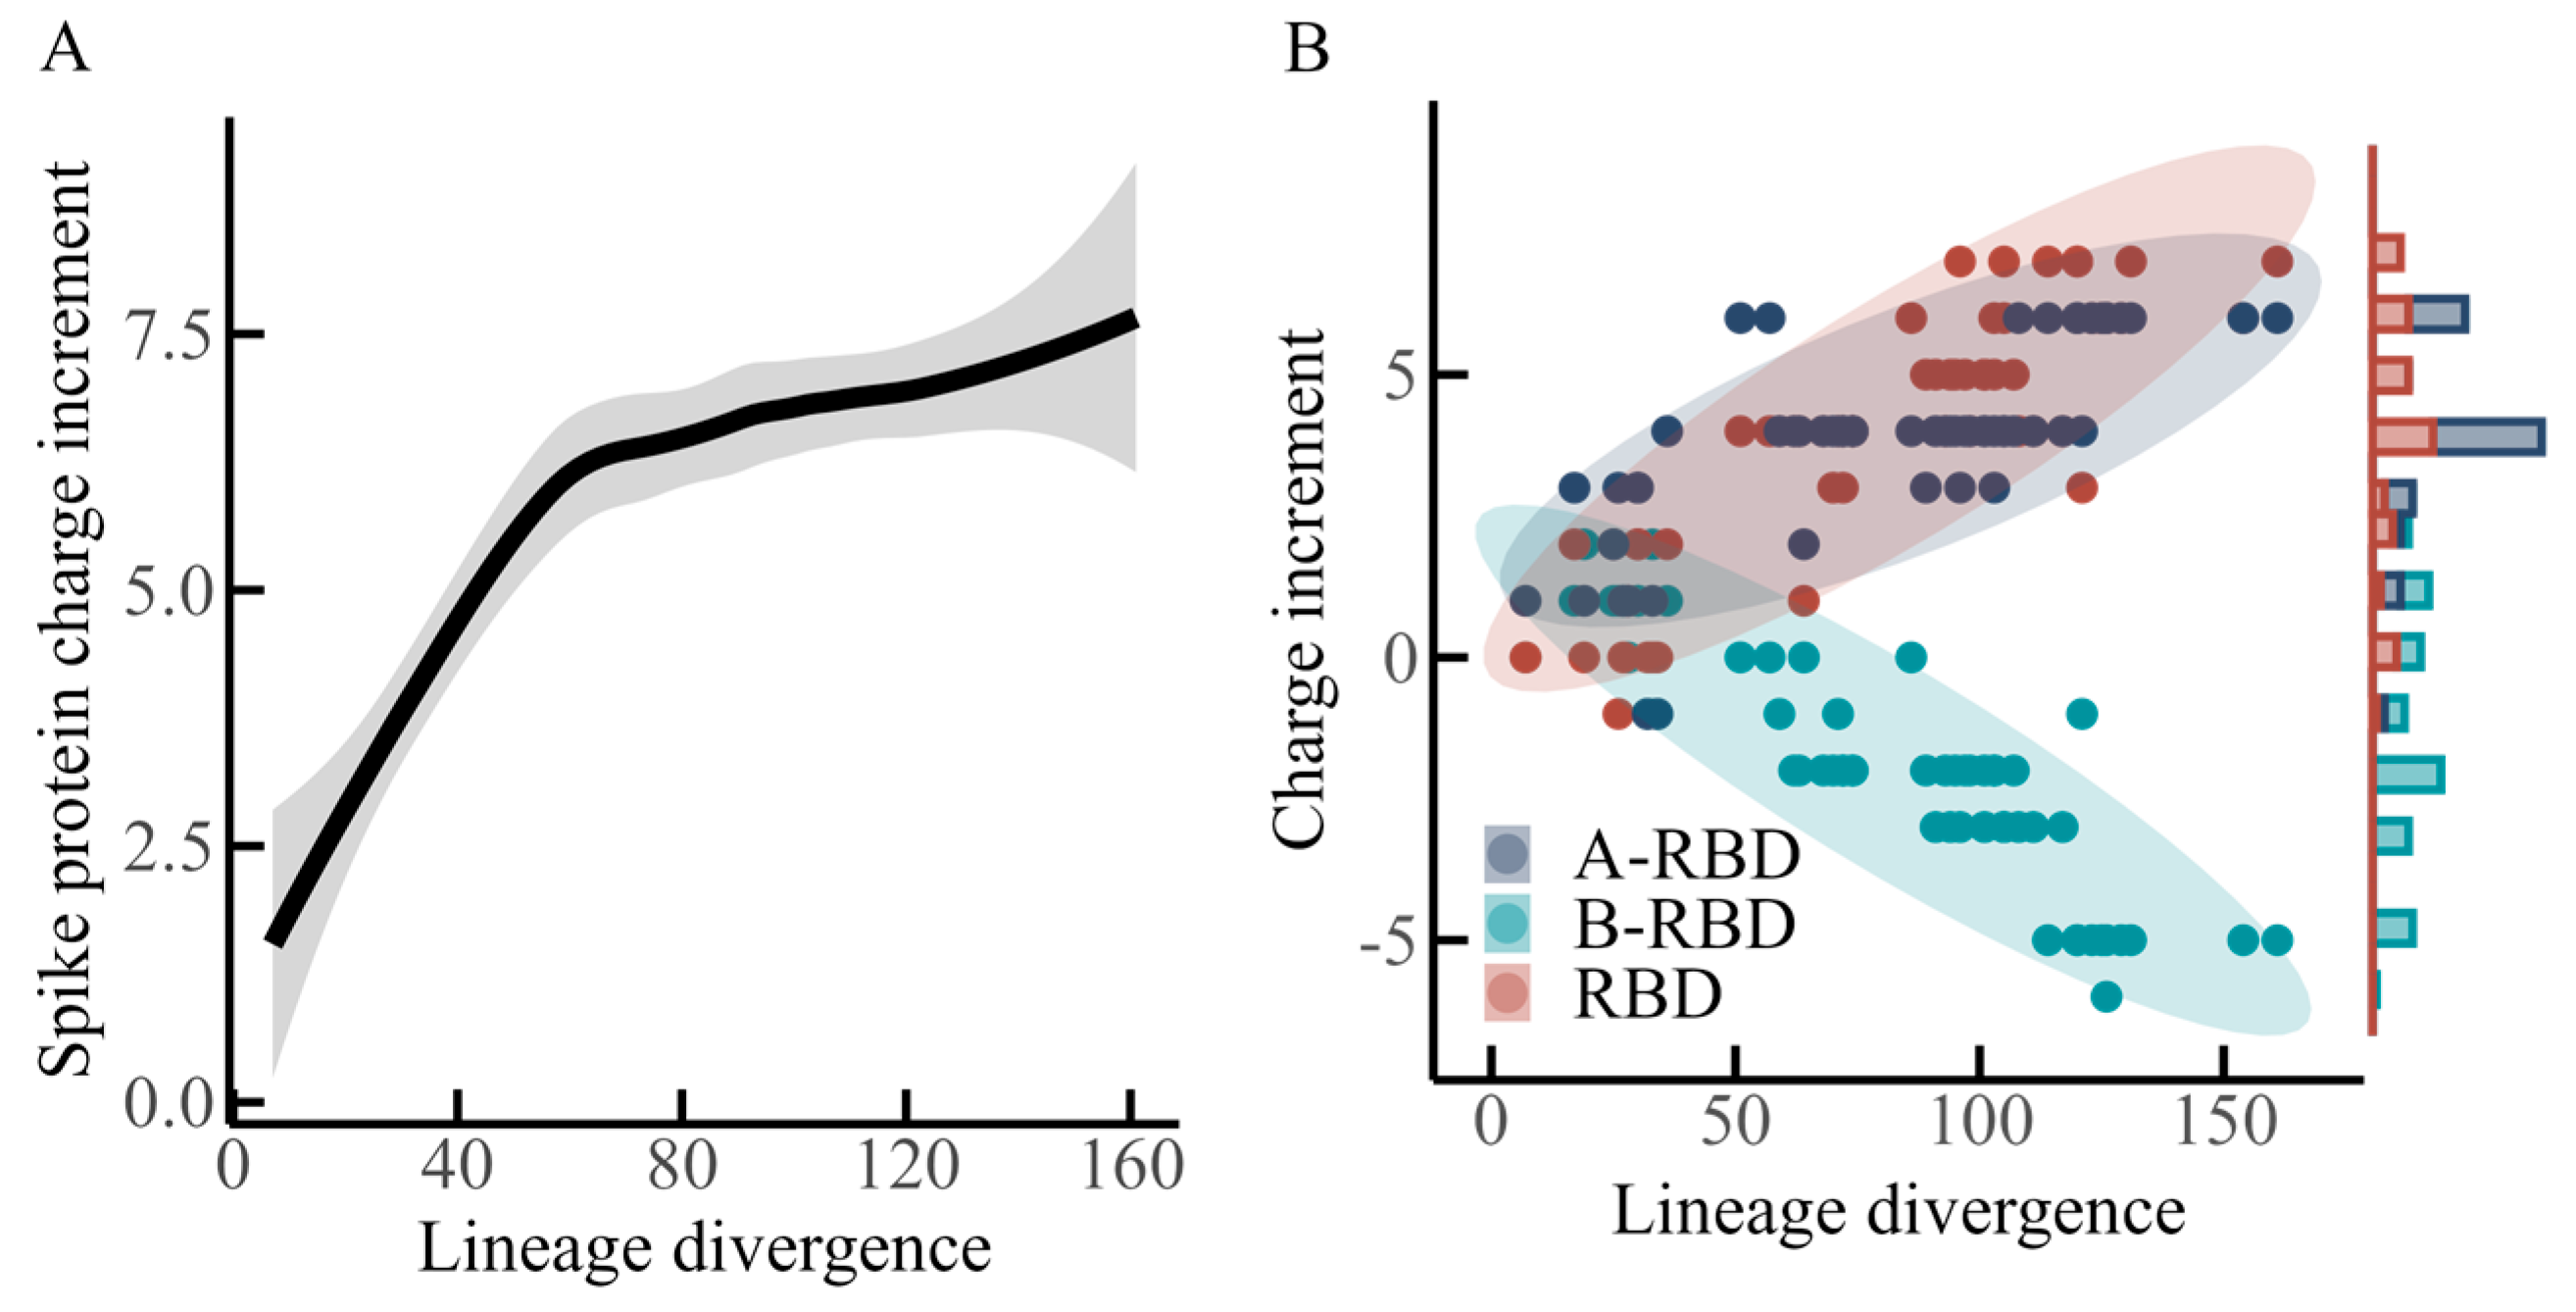
Figure 3.
Distribution of charge increments, binding affinity, immune escape, and expression levels of the spike protein across macro-lineages (macro-lineage classification proposed by Luo and Lv [22]). (A) Distribution of RBD charge increments. From lineage N to lineage P, the charge increment in the RBD region increases significantly. (B) Distribution of charge increments in A-RBD and B-RBD regions. Charge increments in the A-RBD region tend to rise from lineage N to lineage P, whereas those in the B-RBD region appear to decline. (C) Distribution of binding affinity. Binding affinity is generally lower in lineages O and P compared with lineage N, suggesting a decreasing trend across evolutionary lineages. (D) Distribution of immune evasion capacity. Relative to lineage N, lineages O and P display markedly greater immune evasion capacity. (E) Distribution of expression levels. RBD expression levels in lineages O and P are reduced compared with those in lineage N, indicating a potential downward trend during lineage evolution. (F) Correlation between binding affinity and RBD charge increment. Overall, the charge increment of the RBD exhibited a negative correlation with ACE2 binding affinity, but specifically for the three lineages, a positive correlation is observed in lineages N and O, whereas no clear association is detected in lineage P. (G) Correlation between immune evasion and RBD charge increment. Overall, immune evasion capacity shows a positive correlation with RBD charge increments. (H) Correlation between expression level and RBD charge increment. Overall, the charge increment of the RBD exhibited a negative correlation with expression level, but specifically for the three lineages, a positive correlation is apparent in lineage N, while no significant relationship is observed in lineages O and P.
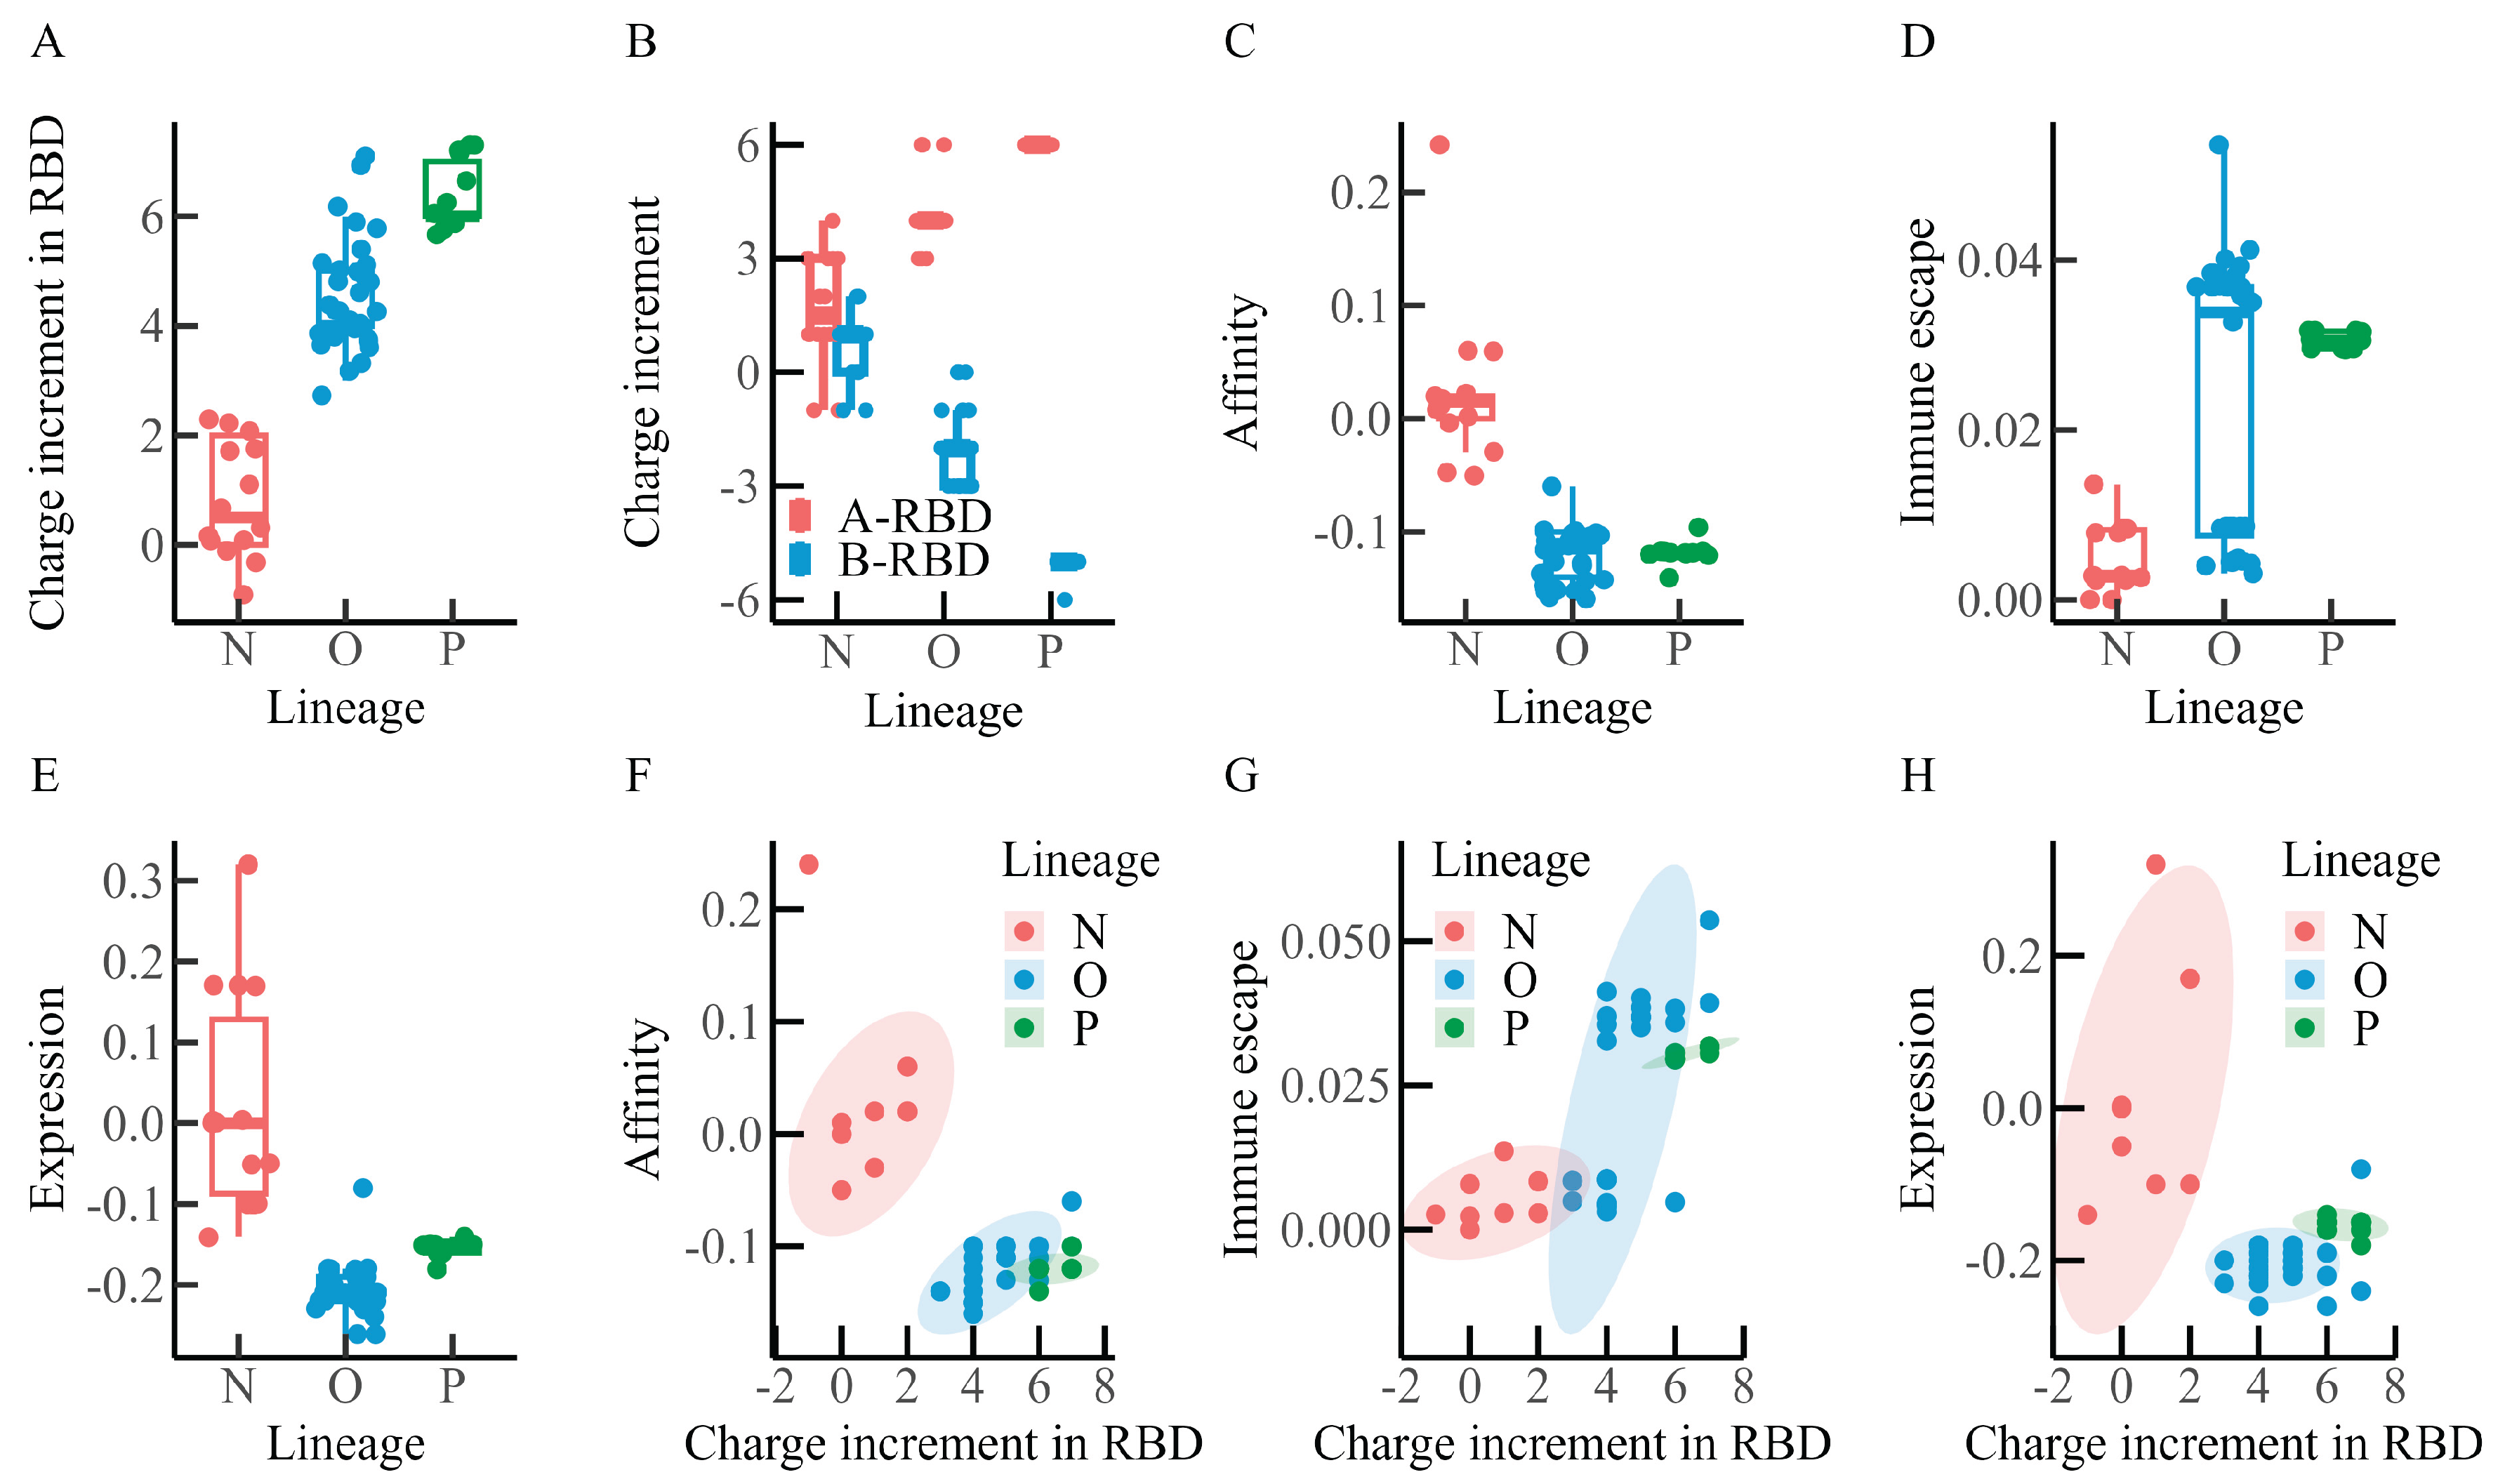
Figure 4.
Phylogenetic tree of 57 SARS-CoV-2 variants. (A) The phylogenetic tree is constructed from the single-letter sequence of spike protein mutation sites reduced according to charge properties, using the UPGMA method. Three major clades are distinguished, with additional resolution of evolutionary sub-branches such as BA.1, BA.2, and XBB within the O clade, suggesting a relatively fine-grained topological structure. (B) Phylogenetic tree based on the 3-mer frequency of the reduced spike protein sequence. The clustering pattern of the major clades appears largely consistent with that shown in panel A, although the internal topology of the O clade is simplified, with fewer resolved evolutionary branches. (C) Phylogenetic tree based on the 2-mer frequency of the reduced mutation-site sequence. The overall topological structure of the three clades is retained, while branch details are simplified, preserving the key evolutionary relationships.
Figure 5.
Rootless phylogenetic tree of SARS-CoV-2. The figure illustrates the phylogenetic relationships among 3,889 globally representative SARS-CoV-2 variants collected between December 2019 and November 2024. These variants are grouped into three major lineages: N lineage (blue), O lineage (green), and P lineage (red). The O lineage is further divided into three sub-branches: BA.1, BA.2, and XBB. The overall topology of this tree appears broadly consistent with that of the phylogenetic tree constructed from the reduced spike protein sequence shown in Figure 4. The original figure was obtained from Nextstrain (https://nextstrain.org/), licensed under CC-BY-4.0, with minor modifications applied.
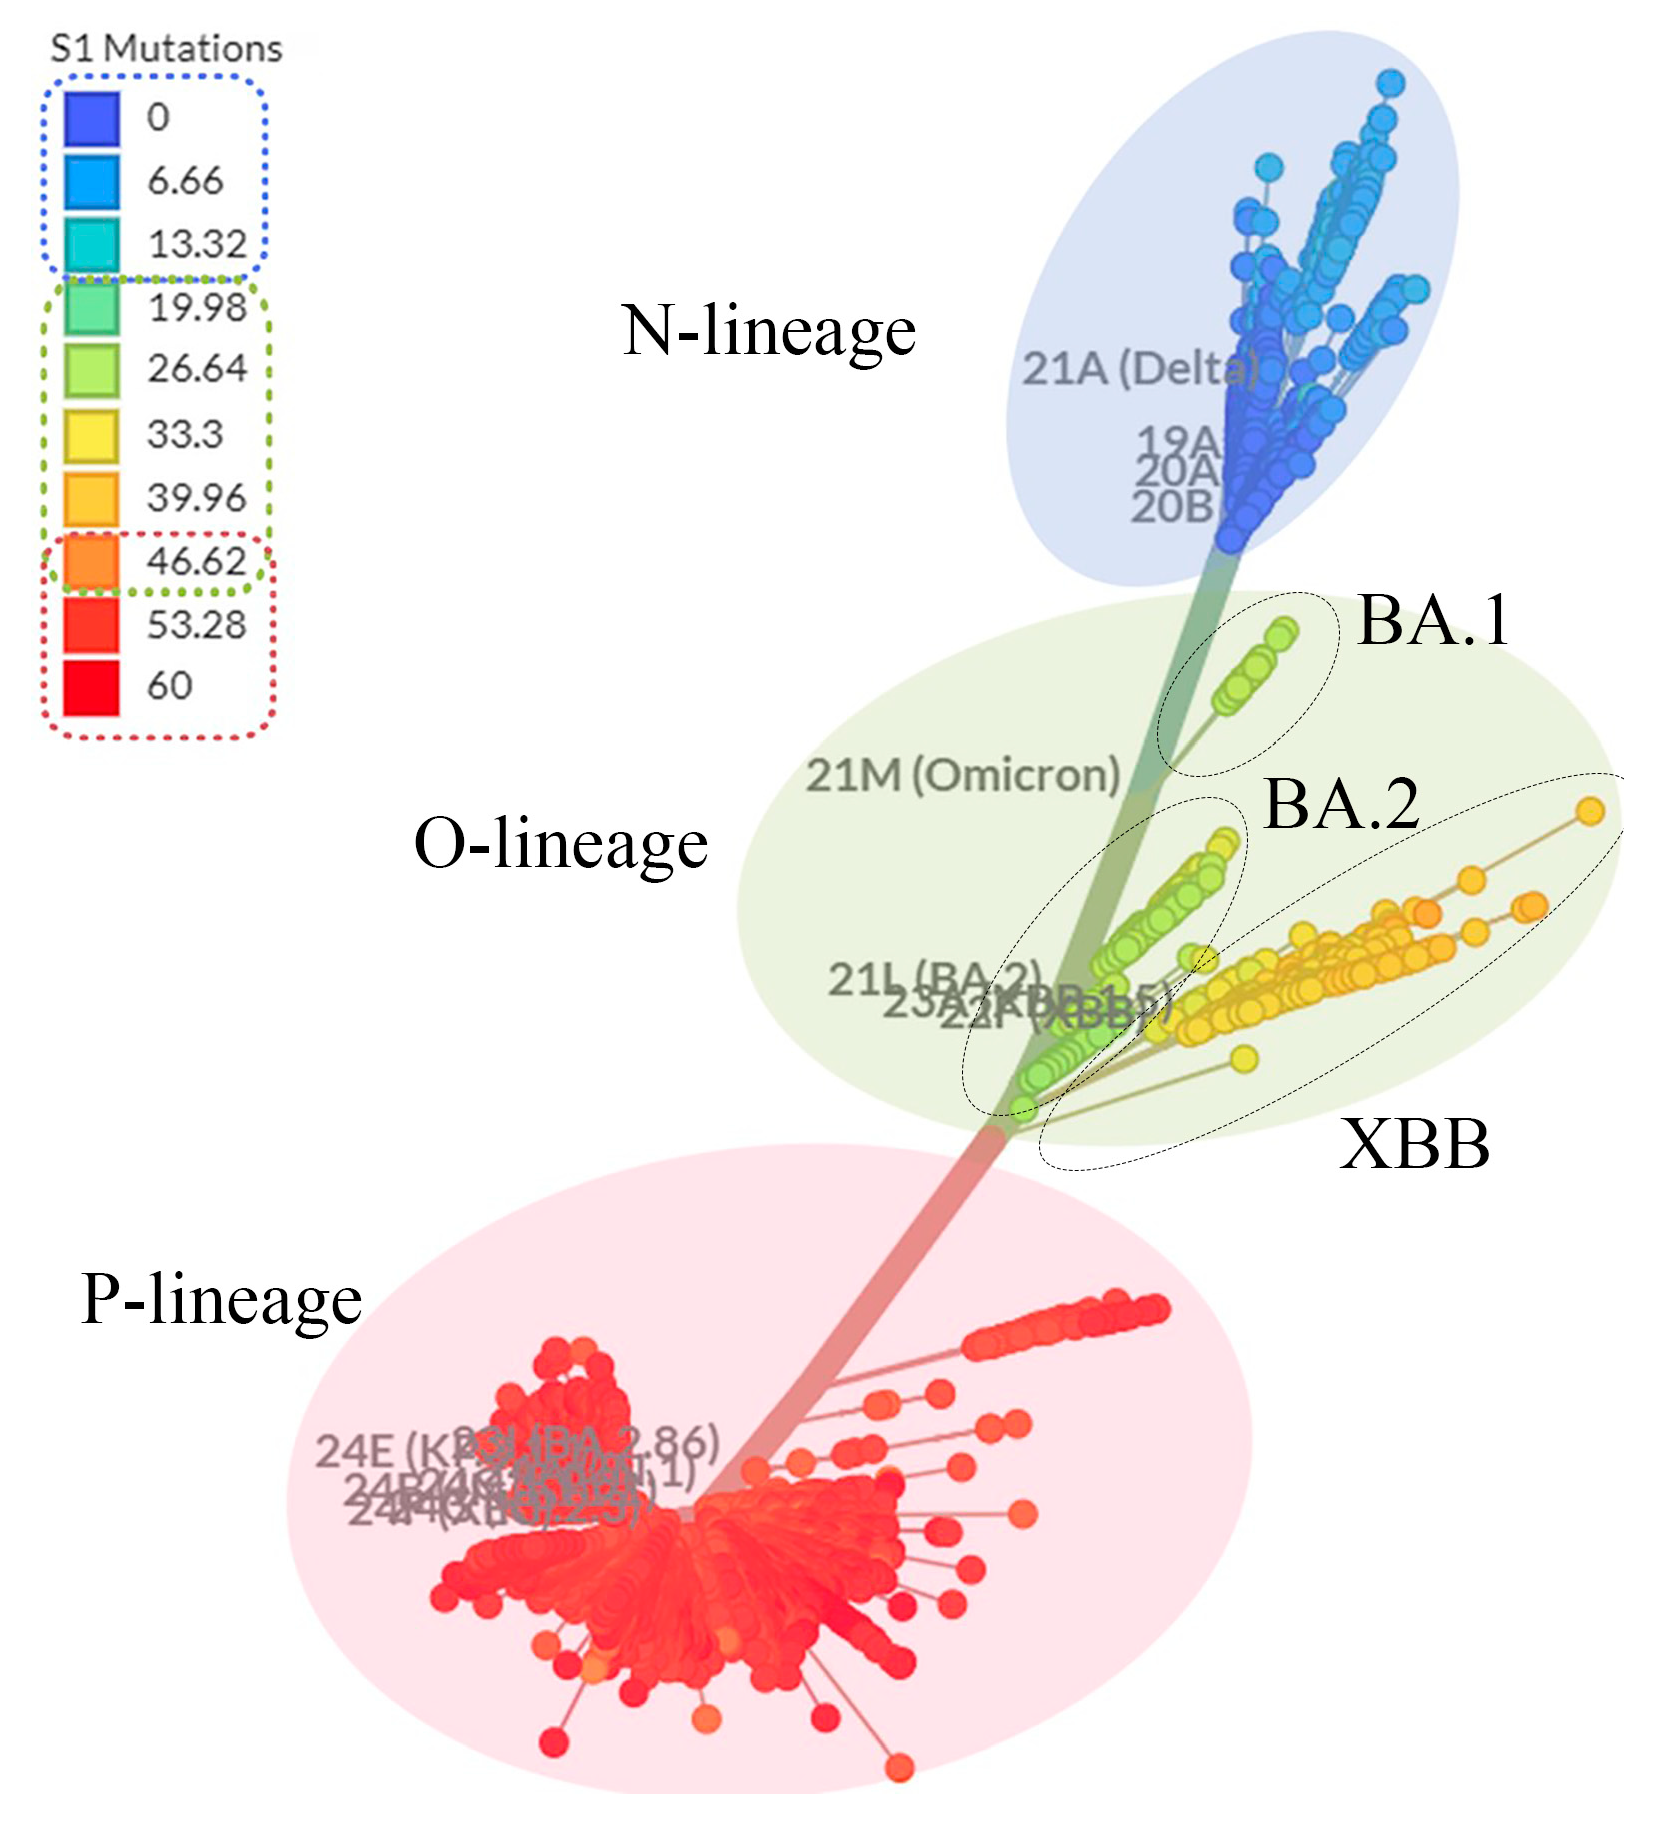
Figure 6.
Schematic diagram of the charged structural features of spike protein binding to ACE2. This figure depicts the binding of the SARS-CoV-2 spike protein (S) to the host receptor ACE2 through its receptor-binding domain (RBD). The accumulation of negative charges in the B-RBD region may generate electrostatic repulsion with ACE2, which could partially weaken the affinity between RBD and ACE2. Created in BioRender. Y, M. (2025) https://BioRender.com/b1tems8.

Table 1.
SARS-CoV-2 variant data.
| Macro-lineage | Variant | NMS1 on spike protein | Lineage divergence | Earliest date2 | Charge increment | |||
| B-RBD3 | RBD4 | A-RBD5 | Spike | |||||
| N-lineage | B.1 | 1 | 7 | 2020.01.15 | — | — | 1 | 1 |
| B.1.617.2 | 9 | 17 | 2020.10.15 | 1 | 2 | 3 | 6 | |
| B.1.351 | 10 | 19 | 2020.07.09 | 2 | 0 | 1 | 3 | |
| B.1.525 | 9 | 25 | 2020.12.11 | 1 | 2 | 2 | 5 | |
| B.1.1.7 | 10 | 26 | 2020.05.14 | 1 | -1 | 3 | 3 | |
| B.1.526 | 4 | 27 | 2020.11.15 | 1 | — | 1 | 2 | |
| B.1.429 | 4 | 28 | 2020.07.06 | 0 | 1 | 1 | 2 | |
| AY.4 | 10 | 30 | 2020.10.27 | 1 | 2 | 3 | 6 | |
| AY.103 | 9 | 30 | 2021.01.02 | 1 | 2 | 3 | 6 | |
| P.1 | 12 | 32 | 2020.09.11 | -1 | 0 | -1 | -2 | |
| B.1.351.3 | 11 | 33 | 2020.11.04 | 2 | 0 | 1 | 3 | |
| P.1.14 | 12 | 34 | 2020.11.03 | -1 | 0 | -1 | -2 | |
| AZ.2 | 6 | 36 | 2021.02.05 | 1 | 2 | 4 | 7 | |
| B.1.1.529 | 7 | 64 | 2021.04.15 | — | 1 | 2 | 3 | |
| O-lineage | BA.1 | 33 | 51 | 2021.01.27 | 0 | 4 | 6 | 10 |
| BA.1.1.2 | 37 | 57 | 2021.11.23 | 0 | 4 | 6 | 10 | |
| BA.2 | 31 | 59 | 2021.03.25 | -1 | 4 | 4 | 7 | |
| BA.5 | 34 | 62 | 2021.12.09 | -2 | 4 | 4 | 6 | |
| BA.5.5 | 35 | 63 | 2022.01.10 | -2 | 4 | 4 | 6 | |
| BA.4 | 34 | 68 | 2022.01.06 | -2 | 4 | 4 | 6 | |
| BF.7 | 35 | 70 | 2022.01.24 | -2 | 3 | 4 | 5 | |
| BA.2.12.1 | 33 | 71 | 2021.09.28 | -1 | 4 | 4 | 7 | |
| BA.4.6 | 36 | 72 | 2022.01.03 | -2 | 3 | 4 | 5 | |
| BQ.1 | 36 | 72 | 2022.01.11 | -2 | 4 | 4 | 6 | |
| DY.1 | 35 | 74 | 2022.11.25 | -2 | 4 | 4 | 6 | |
| BA.4.1 | 35 | 74 | 2021.12.14 | -2 | 4 | 4 | 6 | |
| BA.2.75 | 30 | 86 | 2021.12.31 | 0 | 6 | 4 | 10 | |
| CH.1.1 | 41 | 89 | 2022.05.12 | -2 | 5 | 3 | 6 | |
| XBB.1.5 | 42 | 91 | 2022.06.12 | -3 | 5 | 4 | 6 | |
| BN.1.1 | 41 | 93 | 2022.07.27 | -2 | 4 | 4 | 6 | |
| XBB.1.9 | 40 | 94 | 2022.10.12 | -3 | 5 | 4 | 6 | |
| XBB.2.3 | 43 | 95 | 2022.12.21 | -2 | 5 | 4 | 7 | |
| BJ.1 | 36 | 96 | 2022.06.15 | -3 | 7 | 3 | 7 | |
| GE.1 | 45 | 97 | 2023.03.08 | -2 | 5 | 4 | 7 | |
| BN.1 | 40 | 98 | 2022.01.24 | -2 | 4 | 4 | 6 | |
| FL.1.5.1 | 44 | 101 | 2023.01.03 | -3 | 5 | 4 | 6 | |
| XBB.1.16 | 43 | 101 | 2023.01.04 | -2 | 5 | 4 | 7 | |
| EG.5.1 | 44 | 103 | 2023.01.31 | -2 | 5 | 3 | 6 | |
| HV.1 | 46 | 103 | 2023.01.29 | -2 | 6 | 4 | 8 | |
| JB.2 | 44 | 105 | 2023.05.29 | -3 | 6 | 4 | 7 | |
| FE.1 | 41 | 105 | 2023.01.26 | -3 | 7 | 4 | 8 | |
| HK.1 | 44 | 107 | 2023.04.12 | -2 | 5 | 4 | 7 | |
| GA.4.1 | 47 | 108 | 2023.05.09 | -3 | 4 | 6 | 7 | |
| JE.1 | 45 | 111 | 2023.08.08 | -3 | 4 | 4 | 5 | |
| XBC.1.6 | 41 | 121 | 2023.02.10 | -1 | 3 | 4 | 6 | |
| DV.7.1 | 45 | 117 | 2023.05.29 | -3 | 4 | 4 | 5 | |
| P-lineage | BA.2.86 | 58 | 114 | 2023.03.11 | -5 | 7 | 6 | 8 |
| JN.1 | 60 | 120 | 2023.01.13 | -5 | 7 | 6 | 8 | |
| JN.1.4 | 60 | 120 | 2023.10.20 | -5 | 7 | 6 | 8 | |
| KQ.1 | 62 | 123 | 2024.01.10 | -5 | 6 | 6 | 7 | |
| KP.1 | 63 | 125 | 2024.02.01 | -5 | 6 | 6 | 7 | |
| KS.1 | 64 | 126 | 2024.02.15 | -6 | 6 | 6 | 6 | |
| KP.2 | 59 | 126 | 2024.01.02 | -5 | 6 | 6 | 7 | |
| KR.1 | 62 | 129 | 2024.02.08 | -5 | 6 | 6 | 7 | |
| XDK.1 | 55 | 131 | 2023.12.22 | -5 | 7 | 6 | 8 | |
| XEC | 65 | 154 | 2024.06.28 | -5 | 6 | 6 | 7 | |
| XDV.1 | 61 | 161 | 2024.02.26 | -5 | 7 | 6 | 8 | |
1 Number of mutation sites; 2 The date of the first sample collection worldwide, data from the outbreak.info website [17]; 3 Residues 1–330 of the S protein sequence, designated as the N-terminal flanking region of the RBD (B-RBD); 4 Residues 331–531 of the S protein sequence, designated as the receptor-binding domain (RBD); 5 Residues 532–1273 of the S protein sequence, designated as the C-terminal flanking region of the RBD (A-RBD).
Table 2.
The medians of the distribution of charge increment, affinity, immune escape, and expression levels of the S protein in the three macro-lineages.
Table 2.
The medians of the distribution of charge increment, affinity, immune escape, and expression levels of the S protein in the three macro-lineages.
| Variable | Median | ||
| N-lineage | O-lineage | P-lineage | |
| Charge increment in B-RBD | 1.0 | -2.0 | -5.0 |
| Charge increment in RBD | 0.5 | 4.0 | 6.0 |
| Charge increment at the RBD-ACE2 binding interface | 0.0 | 1.0 | 1.0 |
| Charge increment in A-RBD | 1.5 | 4.0 | 6.0 |
| RBD-ACE2 binding affinity | 0.02 | -0.12 | -0.12 |
| Immune escape | 0.0028 | 0.034 | 0.031 |
| Expression level of RBD | 0.0 | -0.21 | -0.15 |
Table 3.
Pearson correlation coefficient between spike protein charge increment and codon usage features.
Table 3.
Pearson correlation coefficient between spike protein charge increment and codon usage features.
| Lineage | CAI | ENC | GC1 | GC2 | GC3 | GC |
| All | -0.04 (0.78) | 0.49 (<0.01) | -0.08 (0.58) | -0.60 (<0.01) | 0.02 (0.90) | -0.40 (<0.01) |
| N | -0.56 (0.04) | -0.23 (0.44) | 0.74 (<0.01) | 0.30 (0.32) | -0.13 (0.68) | 0.65 (0.02) |
| O | 0.01 (0.95) | 0.10 (0.58) | -0.13 (0.48) | -0.50 (<0.01) | -0.19 (0.27) | -0.49 (<0.01) |
| P | -0.22 (0.54) | -0.62 (0.05) | 0.37 (0.29) | -0.19 (0.59) | -0.69 (0.03) | -0.44 (0.20) |
Note: In the table, the value outside the parentheses in each cell denotes the Pearson correlation coefficient, whereas the value inside the parentheses denotes the corresponding p-value.
Disclaimer/Publisher’s Note: The statements, opinions and data contained in all publications are solely those of the individual author(s) and contributor(s) and not of MDPI and/or the editor(s). MDPI and/or the editor(s) disclaim responsibility for any injury to people or property resulting from any ideas, methods, instructions or products referred to in the content. |
© 2025 by the authors. Licensee MDPI, Basel, Switzerland. This article is an open access article distributed under the terms and conditions of the Creative Commons Attribution (CC BY) license (http://creativecommons.org/licenses/by/4.0/).
Copyright: This open access article is published under a Creative Commons CC BY 4.0 license, which permit the free download, distribution, and reuse, provided that the author and preprint are cited in any reuse.


