Submitted:
18 September 2025
Posted:
19 September 2025
You are already at the latest version
Abstract
Invasive alien species (IAS) are a significant threat to ecosystems worldwide, in par-ticular island ecosystems where ecological resilience is limited. Spatially explicit and locally informed strategies are crucial on small islands to effectively manage IAS. The present study uses an integrated approach to map and manage IAS on Rodrigues Is-land, Mauritius, using a combination of field surveys, participatory mapping and spa-tial analysis tools. Field data was collected in four sites of Rodrigues, namely Cascade Pigeon, Cascade St Louis, Mourouk Valley and Golden Bat Reserve supported by par-ticipatory mapping and Inverse Distance Weighting (IDW) of ArcGIS. Key invasion hotspots were identified, particularly in previously disturbed areas, where species such as Furcraea foetida, Leucaena leucocephala and Millettia pinnata co-occur. Grassland zones showed minimal invasion, potentially acting as buffer zones for conservation. The PGIS approach emphasized the importance of combining spatial tools with stake-holder input to inform site-based IAS management and highlight the need for adaptive monitoring strategies that take into consideration dynamic invasion trajectories. These findings provide a replicable framework for IAS management in other island envi-ronments facing similar ecological challenges while contributing to national and in-ternational biodiversity conservation efforts, including Sustainable Development Goal 15 – Life on Land.
Keywords:
invasive alien species
; GIS
; participatory mapping
; conservation
; Rodrigues
1. Introduction
Invasive alien species (IAS) are one of the most pressing threats to global biodiversity and ecosystem health [1]. IAS are species introduced, either intentionally or accidentally, to regions outside their native range, that negatively affect native biodiversity, ecosystem services and human well-being [2]. These species often proliferate rapidly, displacing native species, altering ecosystems and imposing significant social and economic costs [3]. The Convention on Biological Diversity (CBD) identifies IAS as one of the main drivers of species extinction globally, impacting around 40% of endangered species [4]. With the accelerating pace of globalization, land use change, and climate change, the effective management of IAS is now increasingly critical [1].
Worldwide, the ecological and economic impacts of IAS are massive. For example, the spread of lionfish (Pterois volitans and P. miles) in the Western Atlantic and Caribbean has resulted in the alarming decline in native reef fish populations, impacting coral reef resilience and food security for local communities [5]. Managing IAS has proved to be very costly with estimates exceeding USD 1.4 trillion annually, reflecting losses in fisheries, agriculture, forestry and ecosystem services [6].
On islands, such as those in the Indian Ocean, native species suffer more from IAS impacts compared to continental species, as native species of islands lack morphological and behavioral characteristics to deal with IAS [7]. Consequently, islands account for a higher proportion of global extinctions caused by IAS compares to continental areas [4]. In the Galapagos Islands, for instance, the introduction of invasive rats, goats and plants has led to widespread habitat degradation and decline of unique species [8].
In the Western Indian Ocean region, IAS pose substantial threats to island nations’ biodiversity and ecosystem services that underpin local economies. On the island of Mauritius, also known as the Land of the Dodo, with its unique biodiversity and high rates of endemism, significant ecological losses have occurred as a result of IAS [9]. The introduction of the black rat (Rattus rattus) and strawberry guava (Psidium cattleianum) among other species, has devastated native habitats and species [10]. Rodrigues, a dependency of Mauritius, also faces similar challenges from IAS such as Leucaena leucocephala (white leadtree) that encroaches on native forests and agricultural lands and Vachellia nilotica (prickly acacia) whose widespread distribution has significantly affected the health of communities and led to socio-economic challenges [11]. Effective control and management of IAS are therefore necessary to protect these islands’ unique biodiversity and ensure the sustainability of their ecosystems.
The aim of this study was to enhance the management of IAS on Rodrigues Island, Mauritius, by integrating Participatory Geographic Systems (PGIS) into spatial analysis workflows. Given the limitations of top-down approaches and the value of local ecological knowledge [12], the research aimed to empower conservation practitioners to actively participate in identifying, mapping and monitoring the distribution of IAS on the island. Specifically, the research aimed to assess the current spatial distribution and spread patterns of priority IAS using field-based participatory mapping techniques, promote community-based engagement and awareness to foster locally adapted IAS management strategies and provide spatial decision-support tools to inform policymakers and conservation managers of targeted interventions, proper resource allocation and prioritizing management zones. By combining scientific spatial analysis with stakeholder participation, the study ultimately aimed to build a more inclusive, sustainable and adaptive framework for IAS management in small island contexts like Rodrigues [1].
2. Materials and Methods
2.1. Case Study Area
Rodrigues Island is a 108 km2 autonomous outer island of the Republic of Mauritius found some 560 km east of mainland Mauritius. It is of volcanic origin and together with Mauritius and Reunion forms part of the Mascarene Islands. It is recognized globally for its rich biodiversity and unique endemic species with 150 native plant species, of which 47 occur on the island only and 72 are Mascarene endemics [13]. Rodrigues has been heavily affected by the introduction and proliferation of floral IAS such as Lantana camara and Opuntia spp. which threaten native flora and disrupt local ecosystems [14,15,16]. IAS compete aggressively with native species for space, nutrients and light, and colonize native habitats. Given the unique ecological setting of Rodrigues, IAS impacts are more pronounced as natives are very vulnerable to habitat loss. Rodrigues, which was once covered with lush valleys of palm trees and ebonies, is now one of the most degraded tropical islands in the world as a result of IAS dominance following on from historic habitat destruction [17].
Figure 1.
Digital Elevation Model of the case study area, Rodrigues Island, in the south-west Indian Ocean, with selected sites for IAS distribution assessment namely Cascade Pigeon, Golden Bat Reserve, Mourouk Valley and Cascade St Louis.
Figure 1.
Digital Elevation Model of the case study area, Rodrigues Island, in the south-west Indian Ocean, with selected sites for IAS distribution assessment namely Cascade Pigeon, Golden Bat Reserve, Mourouk Valley and Cascade St Louis.
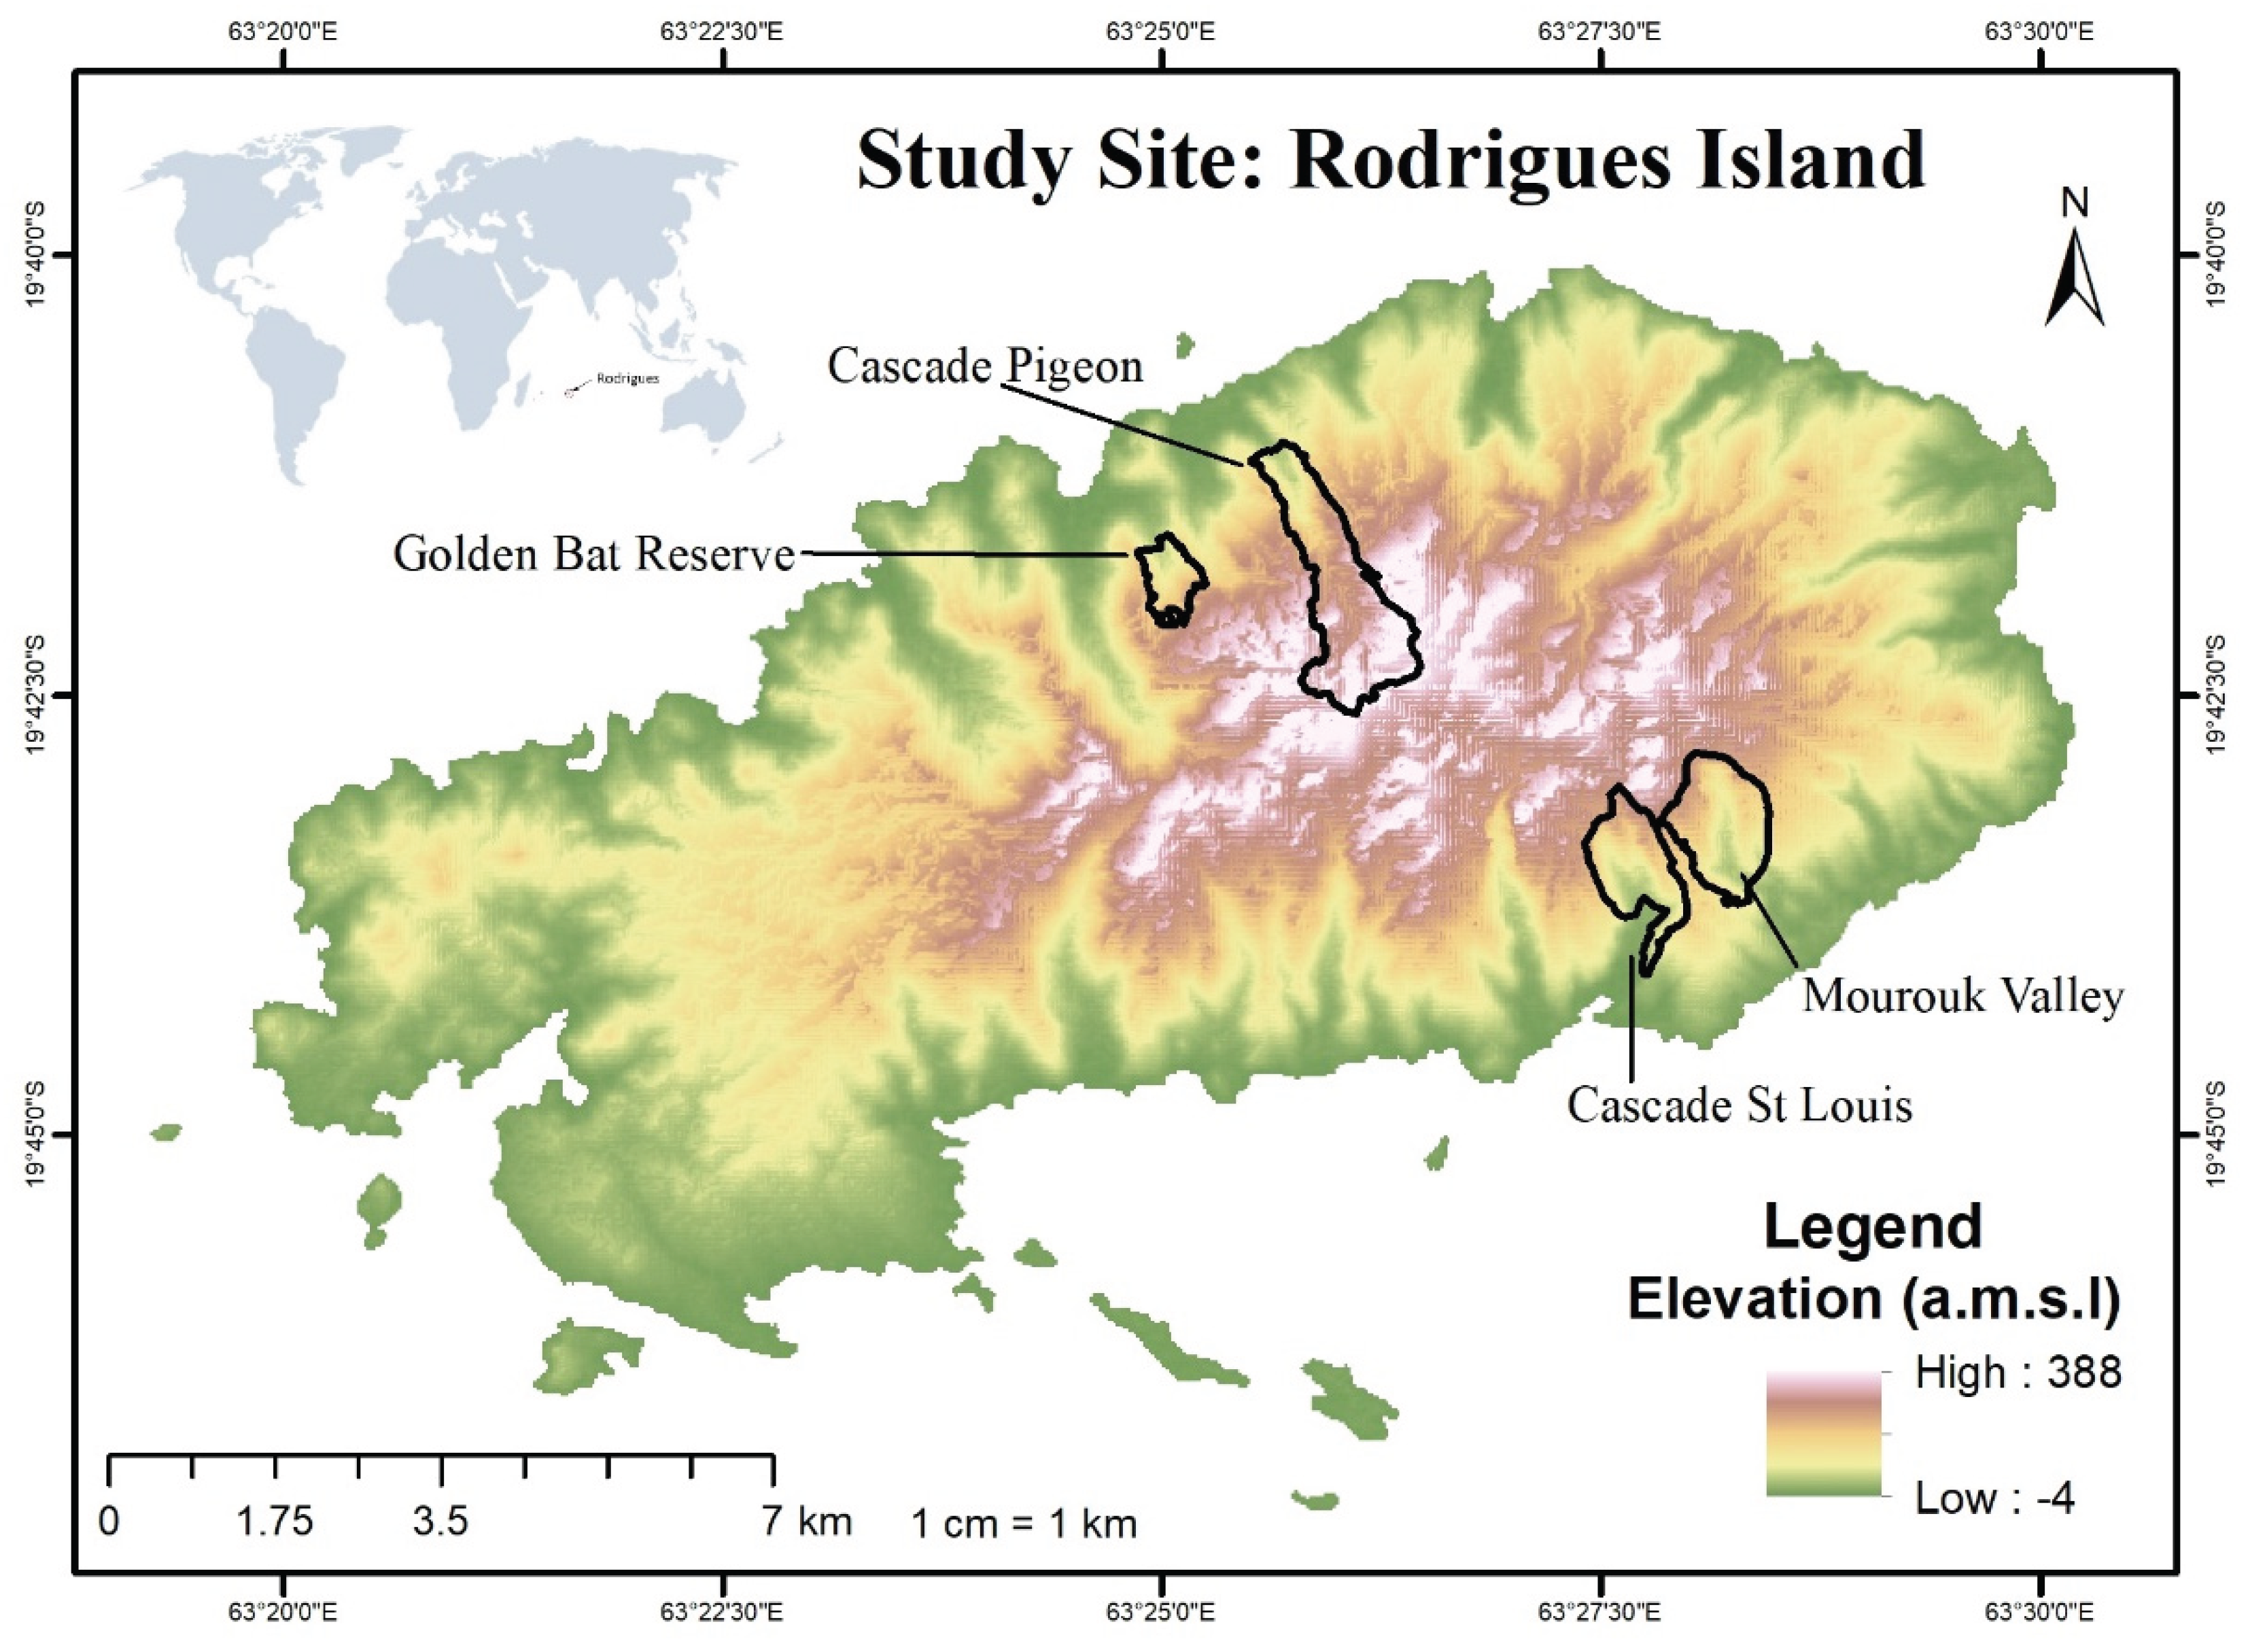
2.2. Site Selection
Four sites were selected for the assessment based on their ecological importance, conservation value and vulnerability to IAS encroachment as shown in Table 1. Mourouk Valley (77 ha), Cascade Pigeon (200 ha), Cascade St Louis (110 ha) and Golden Bat Reserve (141 ha), represent a diversity of habitats in Rodrigues with rare and endemic species, dry forest remnants and important faunal habitats [13]. As an example, some of Rodrigues’ native flora and fauna can still be found in the remaining patches of native forests at Cascade Pigeon and Cascade St Louis. In contrast, Mourouk Valley has suffered significant ecological degradation, yet, it is still home to species of conservation concern, providing opportunities for restoration. As for Golden Bat Reserve, designated for the protection of the endangered Rodrigues fruit bat (Pteropus rodricensis), it is a critical conservation area of the island, highlighting the need to manage IAS for the protection of its sensitive ecosystem [15].
2.3. Species Selection
Key stakeholders, including the Rodrigues Forestry Service, were consulted through an iterative process to select the IAS for the assessment. This collaborative approach was essential to ensure the selection of species reflected both scientific priorities and on-ground realities. The selection was guided by the following criteria:
- Importance: The significance of the species in terms of its rate of spread and overall impact on the ecosystem.
- Feasibility: Priority was given to species that could be easily identified during field surveys.
- Potential to Spread: Species with a high propensity to spread rapidly and widely were prioritized. This criterion also considered the mode of spread (e.g., via wind, animals, or human activity) and the species’ preferred habitats for invasion.
- Equilibrium Status: The extent to which the species has already established itself within the ecosystem.
This structured approach ensured the analysis focused on species that pose the most significant ecological threats. The selected species are listed in Table 2.
2.4. Field Surveys
The sites were surveyed on 21 to 25 October 2024 and GPS coordinates of each species were collected in the field with the mobile application GPS Waypoints Version 3.13 by Blue Cover Technologies. GPS coordinates were recorded at an accuracy level between 2.5 and 3 meters. Data collection was conducted along line transects, which followed tracks used to access the different sites. However, due to the inaccessibility of most of the areas, it was challenging to capture the necessary GPS points on the ground. To overcome this, a DJI FC3682 drone was deployed to survey valleys and mountain flanks. The drone operated with a focal length of 6.7 mm, a resolution of 9 megapixels, and a field of view of 73.7 degrees. Flights were conducted at an average altitude of approximately 330 m above sea level, with varying distances above ground at the different sites based on local topography. By capturing geotagged images, the drone ensured precise geospatial data for mapping. Still, due to adverse weather conditions encountered during fieldwork, the planned number of sample points could not be captured. This limitation highlights the often challenging gap between methodological framework and on-ground field conditions, where environmental and logistical constraints can hinder the implementation of ideal scientific sampling designs [18,19].
The software ExifTool version 13.11 was utilized to extract metadata from the drone images, including GPS coordinates. The software was operated through its command-line interface, allowing for efficient extraction and processing of metadata from multiple images simultaneously. This approach streamlined the workflow and ensured the accurate capture of geospatial information for subsequent analysis. All collected GPS coordinates were compiled and organized into a database and exported as KML files to ArcMap Desktop (ESRI, Redlands, California, version 10.6.1.) for spatial analysis.
2.5. Participatory GIS Mapping
Participatory GIS mapping sessions were organized with key conservation officers to integrate local knowledge into the spatial analysis process. These sessions provided a platform for stakeholders to share their insights on species distribution, and habitat conditions in the landscape, thereby enriching the accuracy and relevance of the mapping outputs.
The Google Earth Pro map was used as a base map, and stakeholders actively participated in identifying species location zones. Observed data collected during fieldwork and drone surveys were also presented to stakeholders for validation, allowing for the identification of discrepancies and adjustments to ensure alignment with on-ground realities. By incorporating stakeholder contributions, the participatory GIS mapping approach not only enhanced the precision of the maps but also fostered a sense of ownership and collaboration among participants, ensuring the practical applicability of the results for invasive alien species management.
2.6. Data Analysis
To ensure the validity and accuracy of the collected data, all GPS points obtained from field surveys and drone imagery were systematically overlaid onto Google Earth Pro for verification. This process allowed for a visual inspection of point locations to confirm their alignment with the designated study sites. Data cleaning was conducted to remove erroneous or misclassified points, including those that fell outside the study boundaries, were inaccurately georeferenced, or resulted from technical issues such as GPS drift and network errors. Points that were improperly recorded due to mobile application malfunctions or drone positioning inaccuracies were excluded. Additionally, duplicate points and outliers were identified and filtered to enhance dataset reliability. This validation process ensured that only high-quality, accurately georeferenced data were retained for subsequent spatial analysis, thereby improving the precision of species distribution mapping and ecological assessments.
ArcGIS version 10.6 was used to process the spatial data and generate detailed species distribution maps. All collected GPS points (field surveys, drone images) were overlaid onto the OpenStreet base map, and shapefiles were created with attributes ‘species scientific names’, ‘common names’, ‘latitude’, ‘longitude’, and ‘location descriptions’. The final shapefiles were developed to spatially represent the distribution of invasive alien species, enabling detailed mapping and analysis for informed decision-making. Then, the Inverse Distance Weighting (IDW) method was applied to estimate species presence at the selected sites. This interpolation technique assumes that points closer to the observed data carry more weight in influencing the estimated values compared to points farther away. The method was used where the number of observed points were two or more. A radius of 500 meters around each observed GPS point was applied to calculate the likelihood of species presence and a power of 2 was set, which is the common default mode in IDW that reflects a reasonable spatial decay, thereby emphasizing nearby observations with weights decreasing with the square of distance. The IDW method effectively filled gaps in the dataset by generating a continuous surface that predicted the potential spread of species into unsampled areas, offering valuable insights into their likely distribution across the landscape. Species distribution maps were developed by overlaying species zones identified through participatory mapping and the IDW interpolation method. To enhance accuracy and contextual understanding, additional features such as rivers, reservoirs, roads, tracks, and houses were incorporated into the maps.
The degree of error was also estimated using a proportional scaling method, where the GPS accuracy range of ±2.5 to 3 meters was used as a reference. The spatial error in meters was calculated by scaling the mean IDW values to the known precision range, assuming a linear relationship between these values and GPS errors. To achieve this, a scaling factor was applied, where the estimated error was determined using the formula:
Estimated Error (m) = Mean IDW Value × Scaling Factor
The scaling factor was adjusted based on the known GPS error, typically 3 meters per 0.001 deviation. This approach allowed for a consistent estimation of spatial errors, ensuring that variations in IDW values were proportionally translated into real-world positional inaccuracies.
The accuracy of the maps was assessed using the Root Mean Square Error (RMSE). RMSE measures the difference between the predicted values from the interpolation and the actual observed GPS points of species collected during field surveys. This was done by selecting a set of validation points, comparing their real-world recorded values with the estimated values from the IDW model, and calculating the RMSE value.
A lower RMSE value indicated a higher level of accuracy, ensuring that the interpolated maps closely reflected real-world species distributions. This method provided a quantitative measure of map reliability and helped refine the spatial analysis by adjusting interpolation parameters where necessary.
3. Results
A total of 515 data points were collected across four sites in Rodrigues as shown in Table 4.

Table 3.
Number of presence points of species collected at each site.
| Mourouk Valley | Cascade Pigeon | Cascade St Louis | Golden Bat Reserve |
|---|---|---|---|
| 231 | 39 | 47 | 198 |
The number of points collected for the 12 species at the different locations are listed below:
Table 4.
Number of points collected per species based on different methodologies.
| Species | Method | |
|---|---|---|
| Mobile Application | Drone | |
| Albizia lebbeck | 06 | 06 |
| Samanea saman | 02 | 06 |
| Eucalyptus | 04 | 05 |
| Furcraea foetida | 18 | 82 |
| Tabebuia pallida | 27 | 101 |
| Litsea sebifera | 07 | 79 |
| Leucaena leucocephala | 07 | 35 |
| Ravenala madagascariensis | 04 | - |
| Rubus madagascariensis | 02 | - |
| Syzygium jambos | 03 | - |
| Vachellia nilotica | 07 | 25 |
| Millettia pinnata | 12 | 77 |
Figure 2.
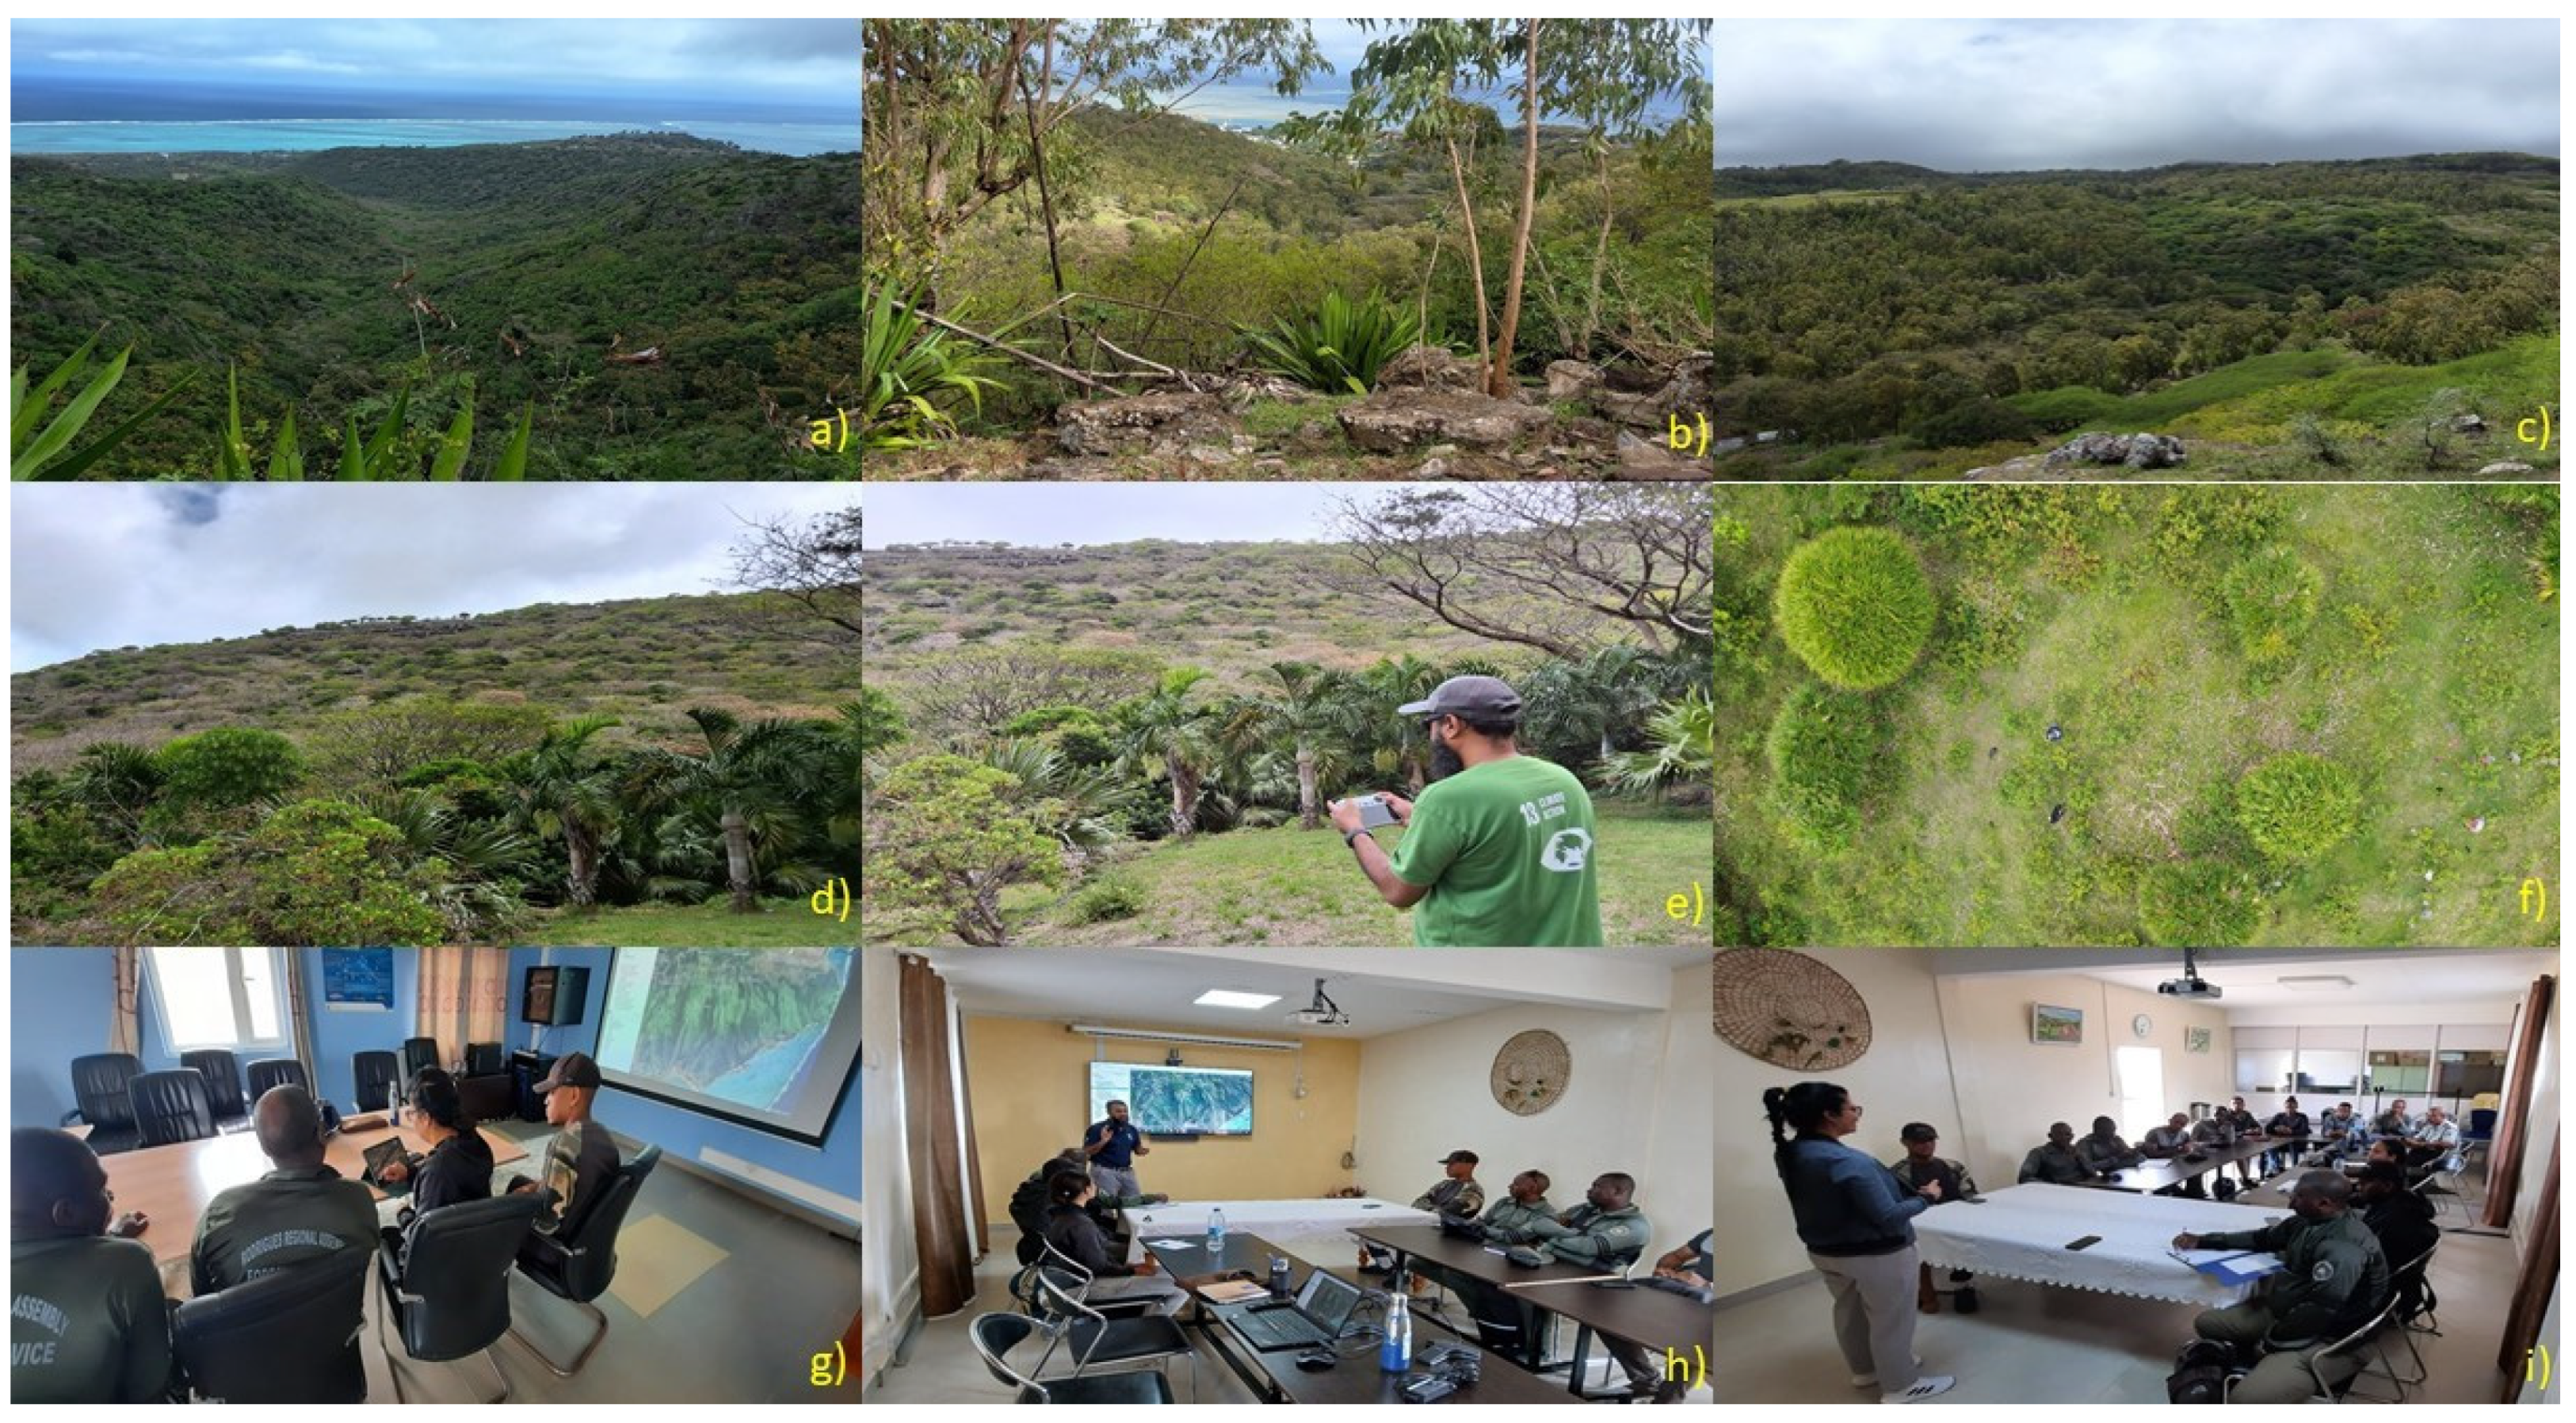
Field surveys and stakeholder consultation conducted in Rodrigues for mapping IAS spatial distribution. a) North face of Cascade St Louis with Vachellia stands in the southern section b) Eastern slope of Cascade Pigeon with visible Eucalyptus stands c) Eastern boundary of Golden Bat Reserve with Vachellia and Eucalyptus trees d) Western side of Mourouk Valley with Leucaena and Albizia stands e) Drone operation during field mapping at Mourouk Valley f) Aerial drone capture at Mourouk Valley g) Participatory mapping with Rodrigues forestry officers h)/i) Training of field officers in GPS and GIS mapping for IAS data collection. (Images Source: R.S (main author) and Sameer Kaudeer).
Figure 2.
Field surveys and stakeholder consultation conducted in Rodrigues for mapping IAS spatial distribution. a) North face of Cascade St Louis with Vachellia stands in the southern section b) Eastern slope of Cascade Pigeon with visible Eucalyptus stands c) Eastern boundary of Golden Bat Reserve with Vachellia and Eucalyptus trees d) Western side of Mourouk Valley with Leucaena and Albizia stands e) Drone operation during field mapping at Mourouk Valley f) Aerial drone capture at Mourouk Valley g) Participatory mapping with Rodrigues forestry officers h)/i) Training of field officers in GPS and GIS mapping for IAS data collection. (Images Source: R.S (main author) and Sameer Kaudeer).
3.1. Species Distribution Maps
Species distribution maps for all species at the respective sites were produced as shown in Figure 3. Estimated IAS presence intensity refers to the relative abundance or density of IAS at a particular site based on where the species was observed. Red in the color scheme of the legend refers to where the species was most observed and yellow areas with fewer observations. It is worth noting that intensity here is not a measure of count but rather an interpolated estimation.
At Cascade Pigeon, based on Figure 3, it can be seen that Furcraea shows a high density in the north-central area. Ravenala looks widespread, with a higher density in the southern tip, but the overall intensity is low. Similarly, Syzygium is mostly concentrated in the south of the site. Tabebuia seems to have a moderate distribution site-wise and a slightly higher intensity in the south. The results reflect the sampling methodology, which was focused on the eastern and southern regions of the site due to better accessibility.
As for Mourouk Valley, Albizia seems to be concentrated in the central region of the site. Furcraea, Millettia and Tabebuia dominate the northeastern area of the valley. Leucaena shows a strong central presence as does Litsea, though it is less widespread. Samanea is also most intense in the center and less distributed towards the sides of the valley.
Due to the low number of presence points collected at Cascade St Louis, the model was run for two species only. Based on the maps, it can be noted that Tabebuia is fairly widespread with a higher intensity in the north and lower density southwards. Vachellia also dominates the site with a stronger presence in the northeast region.
As for Golden Bat Reserve, Eucalyptus has a high concentration at the center and spreads outwards. Furcraea is mainly found in the north-central region. Litsea and Millettia show patchy presence in the north of the site. Samanea is fairly distributed across the landscape but more concentrated in the center. Tabebuia has a generally low intensity and peaks in the north. As for Vachellia, it is centered towards the northeast.
3.2. Model Accuracy
3.2.1. Mean Values
The mean values of the IDW interpolation method are shown in Table 5.
Most of the mean IDW values are extremely small (ranging between ±0.0001 and near-zero), indicating that the IDW interpolation closely approximated actual species distribution. Species with near-zero mean values (e.g., Albizia lebbeck, Litsea sebifera) exhibit highly accurate predictions, meaning that the interpolated surfaces align closely with observed field data. Negative mean values (e.g., Millettia pinnata - -8.03e-05) suggest that IDW interpolation may have underestimated species presence, likely due to data sparsity in those areas, while positive outlier values (e.g., Syzygium jambos) indicate minor overestimations but remain within an acceptable range for ecological mapping.
Species with consistently higher IDW values (e.g., Samanea saman) suggest a greater likelihood of presence in specific locations, whereas negative values do not necessarily indicate absence, but rather lower confidence in interpolation due to limited data points or uneven distribution. The overall low mean IDW values (close to 0) confirm high accuracy in spatial interpolation, with species showing small deviations (±0.0001 or lower) demonstrating reliable approximations of their actual locations. While the IDW method provided a robust estimation of species distribution, minor deviations in areas with sparse data suggest opportunities for further refinement and validation.
3.2.2. Estimated Degree of Error (Meters)
The results are shown in Table 6.
| 0.029 m (~3 cm) |
The estimated error analysis for species distribution mapping across Mourouk Valley, Cascade Pigeon, Cascade St Louis, and Golden Bat Reserve using the IDW interpolation method reveals generally high spatial accuracy, with most species exhibiting errors below 0.5 meters.
In Mourouk Valley, most species showed very low errors (≤0.3 m), indicating that the interpolated values closely align with actual GPS data. The species with the highest deviation was Samanea saman (26.61 m), suggesting significant spatial uncertainty likely caused by uneven sampling or species spread variability. Other species, such as Albizia lebbeck and Litsea sebifera, had negligible errors (≤0.01 m), confirming precise interpolation.
In Cascade Pigeon, species exhibited mostly low errors (≤0.5 m), which indicates moderate spatial deviation. These discrepancies suggest that interpolation accuracy for these species could be refined with more ground-truthing points or adjusted interpolation parameters.
In Cascade St Louis, the analysis revealed extremely low errors (~0.1 m or less) for most species, confirming high spatial accuracy in IDW predictions.
For Golden Bat Reserve, most species had highly accurate IDW estimations (≤0.1 m), reinforcing the reliability of the interpolation method. However, Eucalyptus had a significantly high error (12.72 m), likely due to sparse data points or complex species distribution patterns, making its predicted spatial coverage less reliable.
3.2.3. Root Mean Square Error (RMSE)
The Root Mean Square Error values are shown in Table 7.
The overall low RMSE values indicate that the IDW interpolation method performed well in estimating species distribution. Higher accuracy was observed in well-sampled areas, while species with fewer observed points showed slightly less reliable interpolations. Most RMSE values are extremely low (close to 0.0001 or lower), suggesting that the interpolated values closely match the observed data, thereby ensuring high accuracy in predicting species distribution.
However, some species exhibited slightly higher RMSE values, indicating areas where interpolation may be less precise.
Species with high RMSE values indicate less reliable interpolations, primarily due to uneven data distribution and fewer data points available for interpolation. Conversely, species with low RMSE values (e.g., Albizia lebbeck) suggest highly accurate predictions with minimal interpolation error.
Overall, the RMSE analysis confirms the reliability of the IDW interpolation for species distribution mapping, though areas with higher RMSE values highlight the need for denser sampling and improved data distribution to enhance accuracy.
3.3. Final IAS Distribution Maps
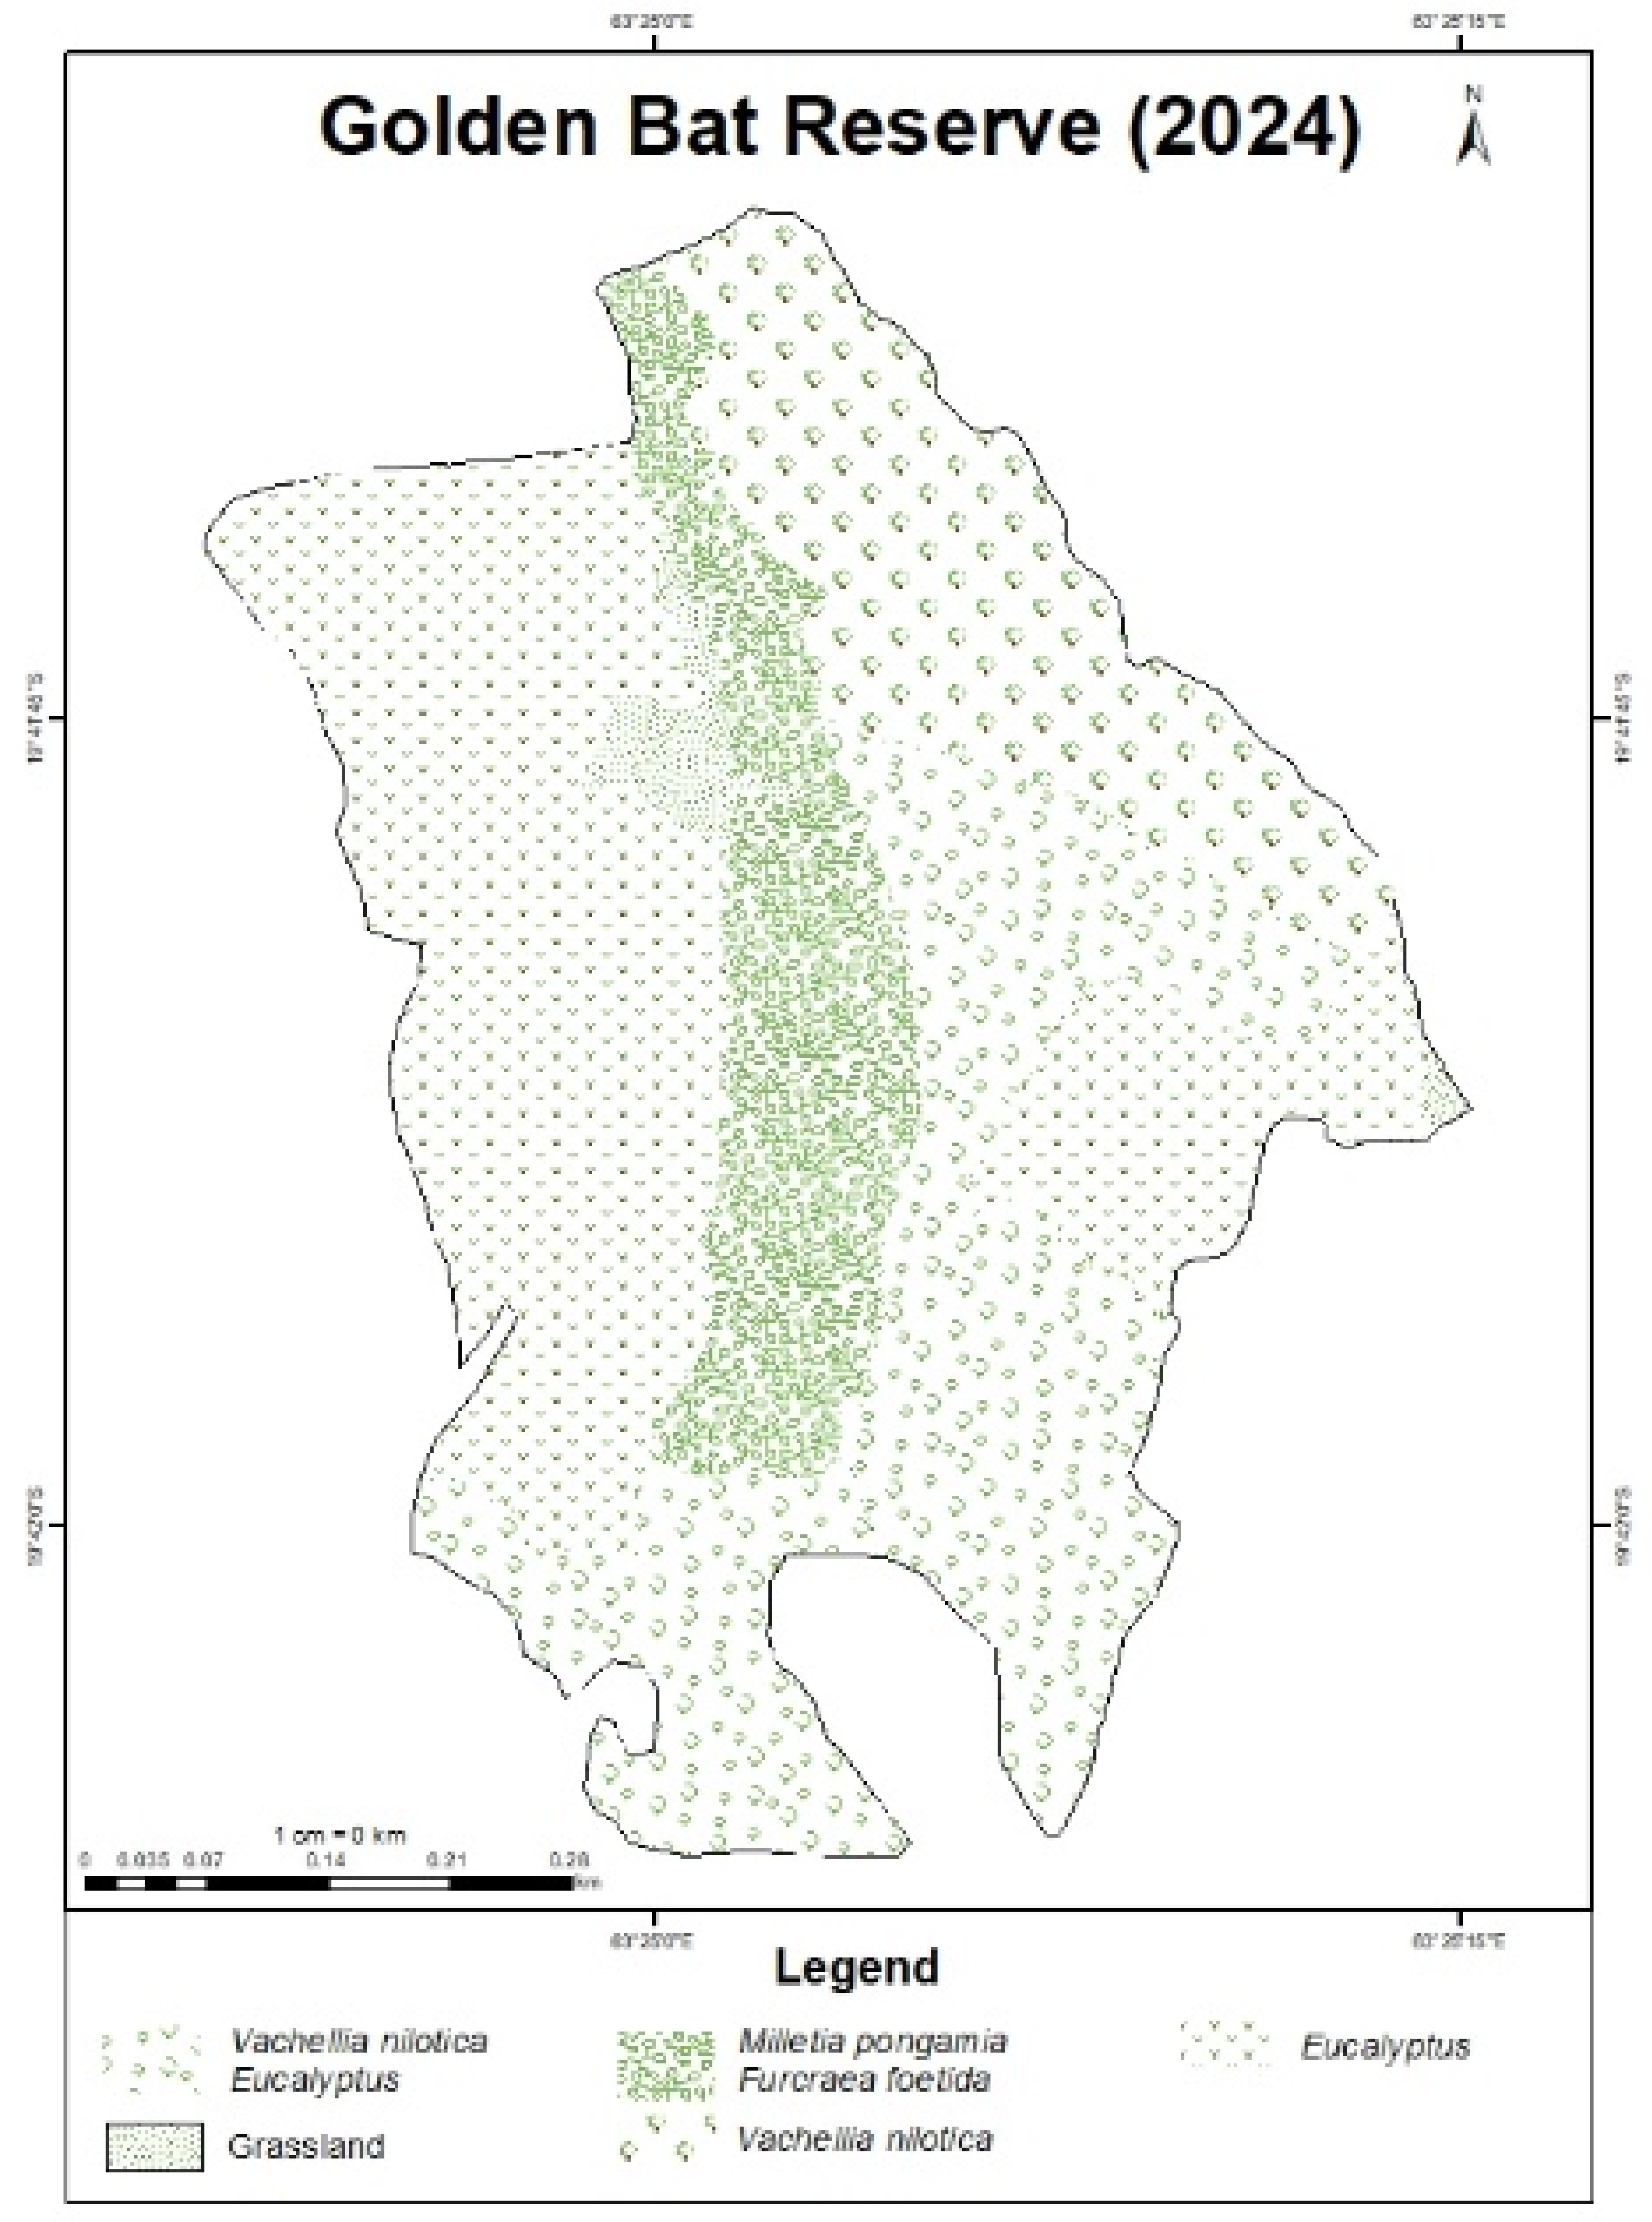
Once stakeholder input was incorporated, the maps were finalized as shown below.
From the map, it is observed that Ravenala and Syzygium dominate the southern half of the site. Furcraea and Tabebuia are scattered in the central northern region, while Rubus and Vachellia have a localized presence. Eucalyptus dominates the western and northern part of the site.
At Mourouk Valley, the valley is dominated by a mix of Millettia, Tabebuia, Litsea and Leucaena and Furcraea. Albizia and Samanea patches occur in localized regions. The outer tip of the valley is mainly dominated by Leucaena and Litsea.
At Cascade St Louis, Vachellia dominates the central west region while Leucaena, Millettia and Litsea appear to be widespread within the valley and on the eastern sides. Tabebuia and Samanea’s presence are more localized in the western and central regions respectively.
The dominant IAS at Golden Bat Reserve are Millettia, Furcraea and Vachellia which are located within and on the eastern outskirts of the valley. Eucalyptus is found in the northwest and in scattered patches.
Figure 4.
Species distribution map of IAS at Cascade Pigeon produced through IDW interpolation and participatory GIS.
Figure 4.
Species distribution map of IAS at Cascade Pigeon produced through IDW interpolation and participatory GIS.
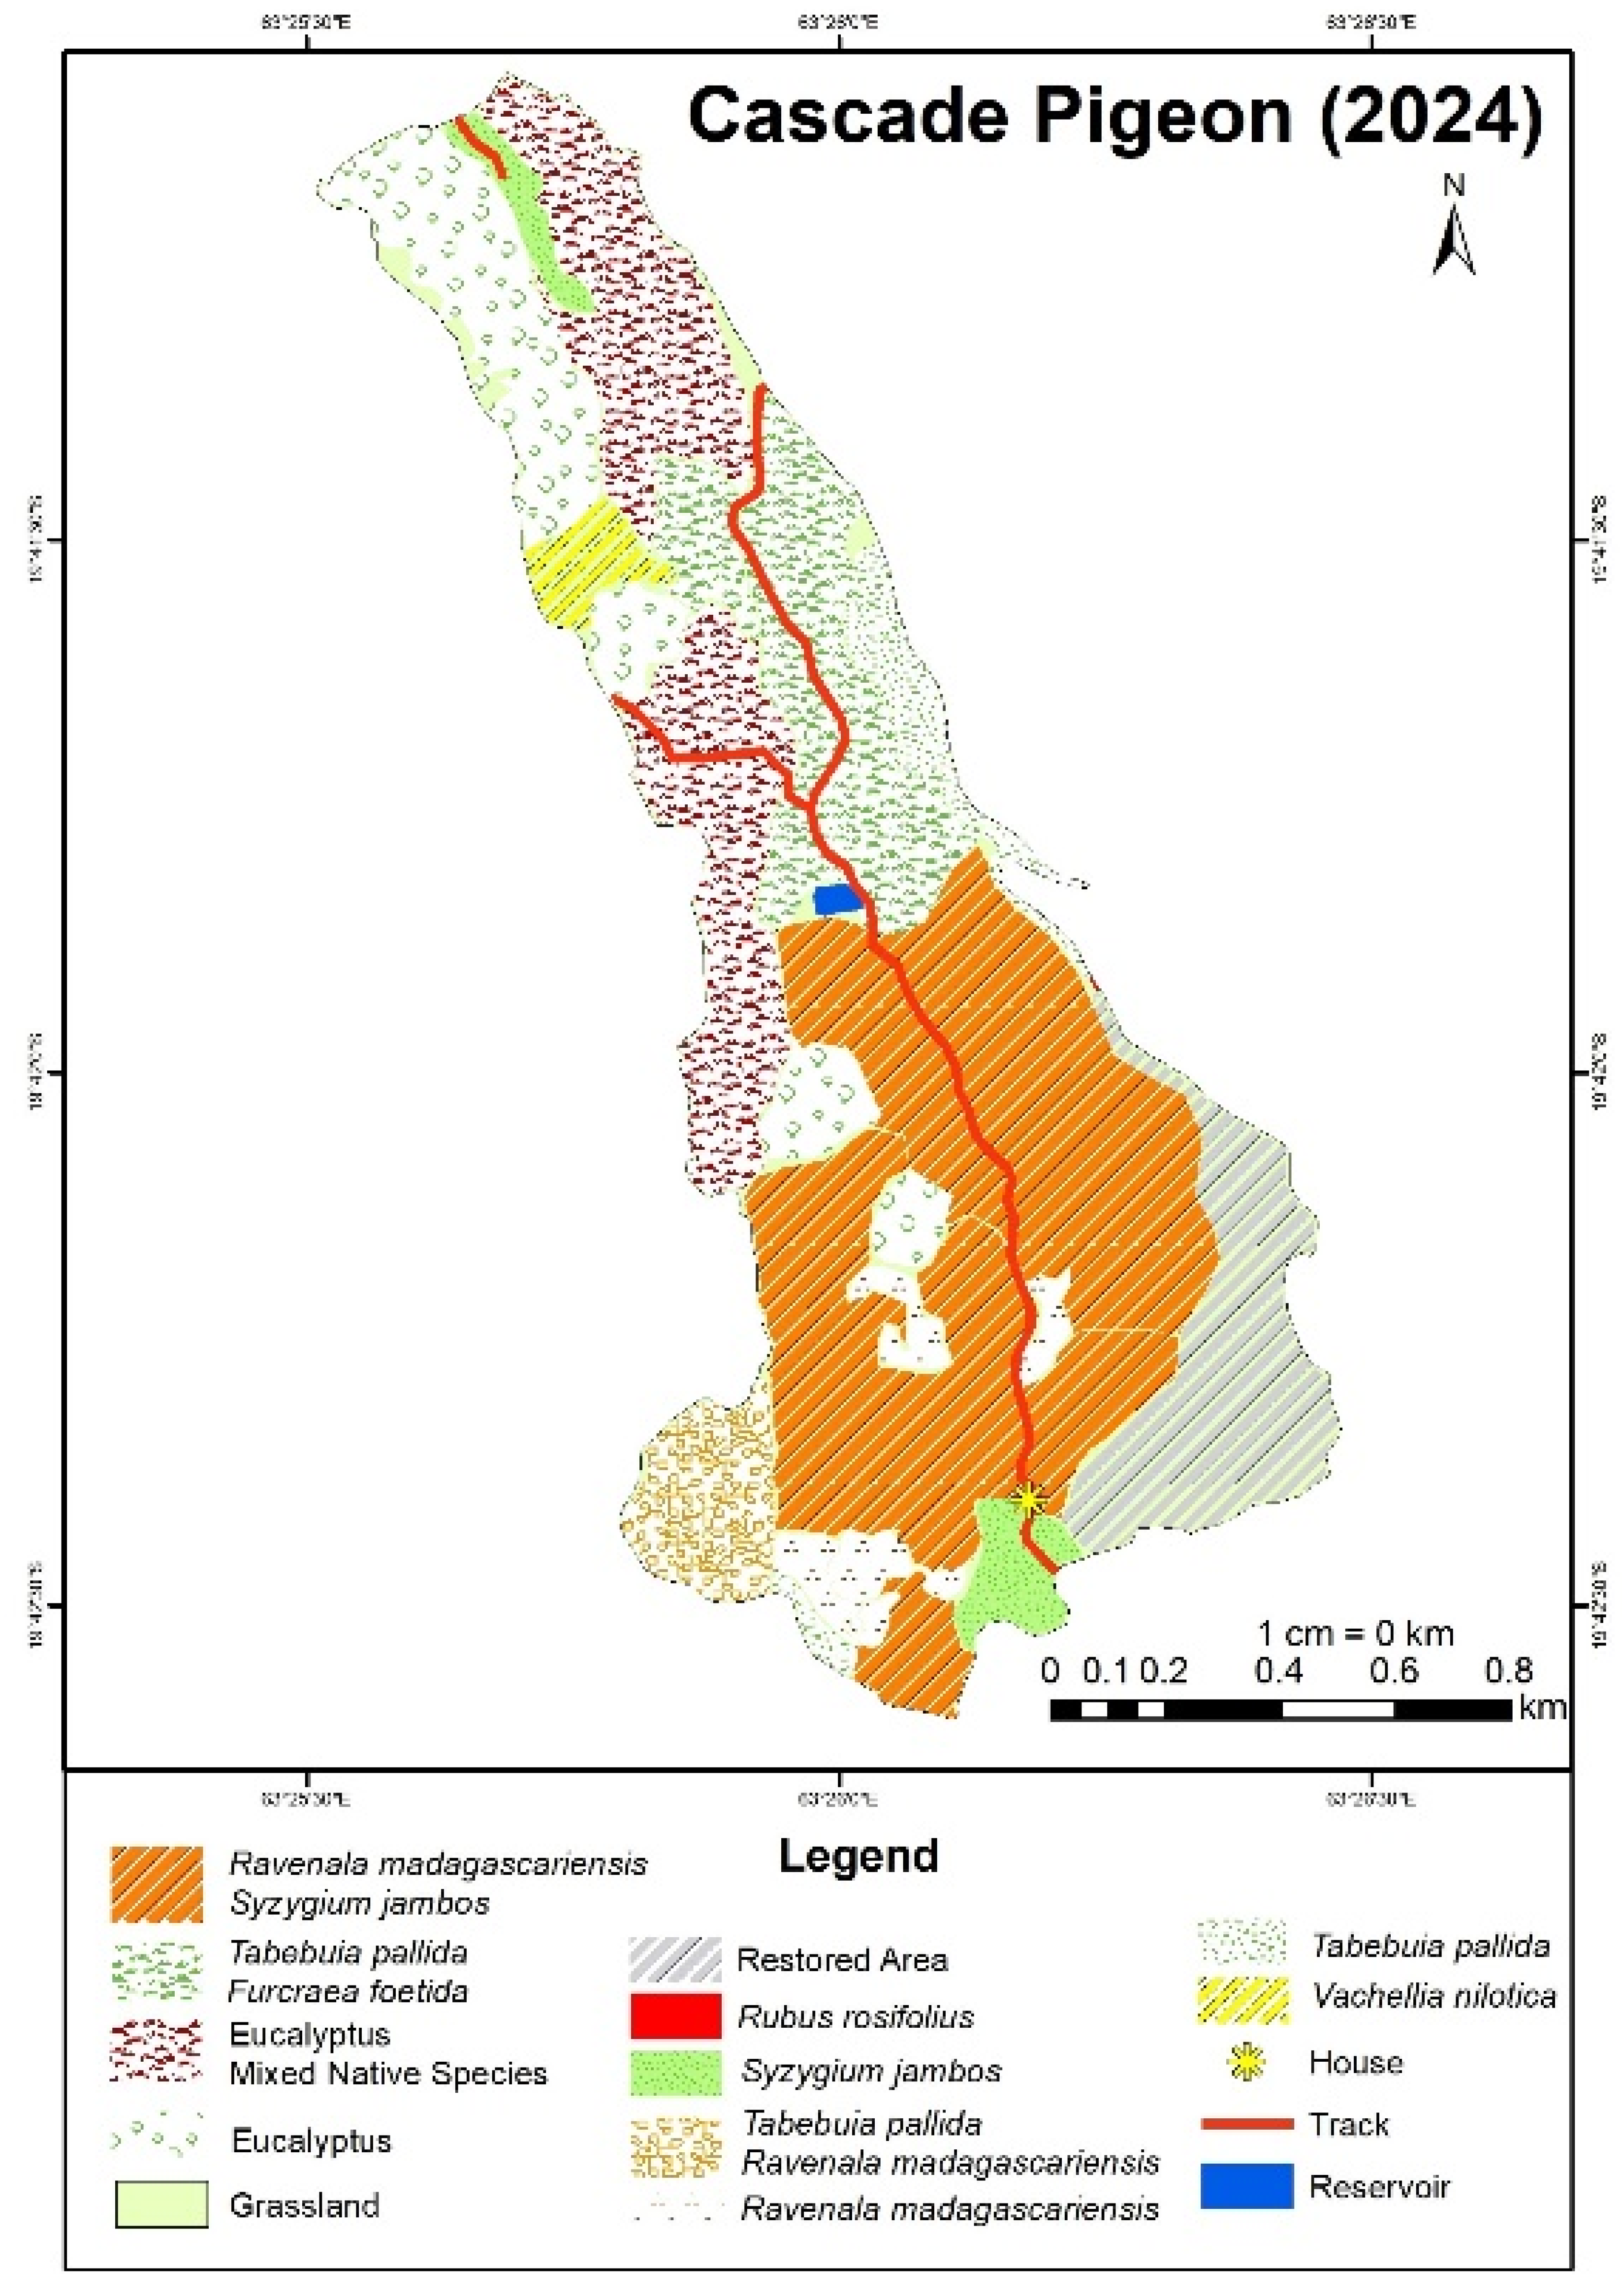
Figure 5.
Species distribution map of IAS at Mourouk Valley produced through IDW interpolation and participatory GIS.
Figure 5.
Species distribution map of IAS at Mourouk Valley produced through IDW interpolation and participatory GIS.

Figure 6.
Species distribution map of IAS at Cascade St Louis produced through IDW interpolation and participatory GIS.
Figure 6.
Species distribution map of IAS at Cascade St Louis produced through IDW interpolation and participatory GIS.
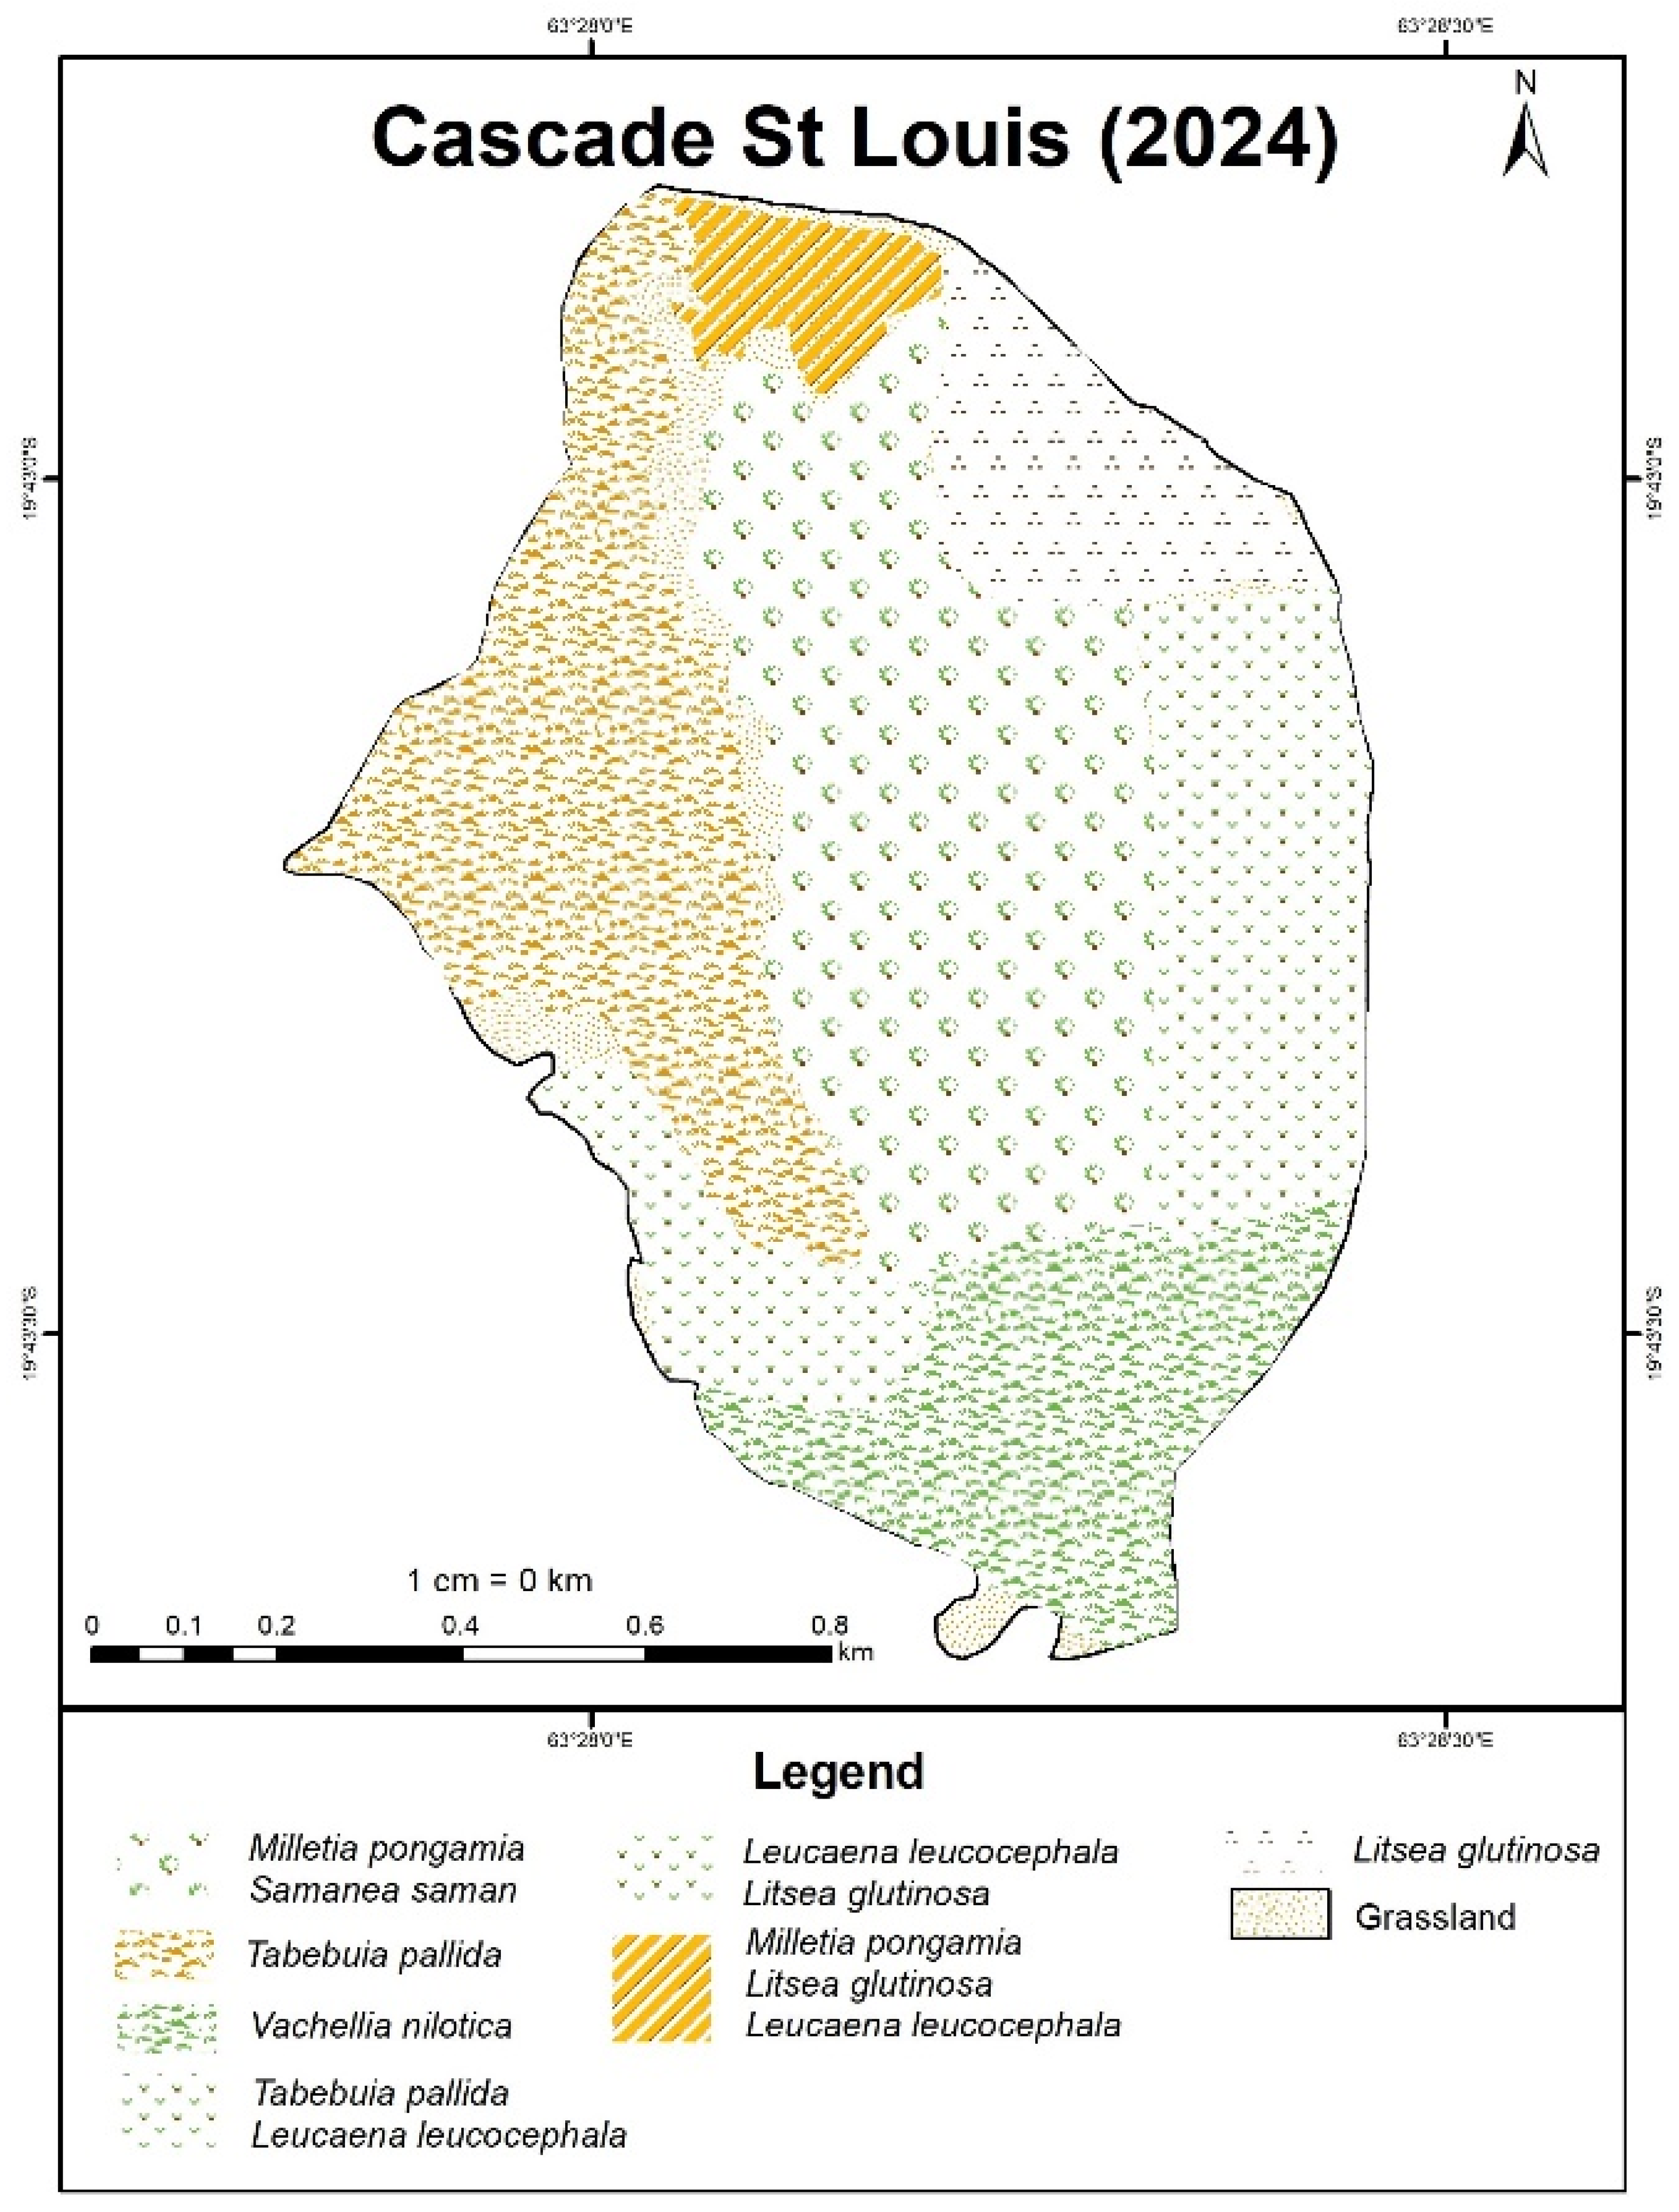
Figure 7.
Species distribution map of IAS at Golden Bat Reserve produced through IDW interpolation and participatory GIS.
Figure 7.
Species distribution map of IAS at Golden Bat Reserve produced through IDW interpolation and participatory GIS.
4. Discussion
4.1. Spatial Distribution Patterns of IAS at the Four Sites of Rodrigues Island
The present findings show clear spatial clustering of IAS across the four study sites of Rodrigues Island. It can be seen that the presence of IAS is especially pronounced in disturbed or secondary habitats like degraded slopes, road verges and scrublands - as represented by all the sites – which today dominate much of the island as a result of anthropogenic pressure [17]. In fact, Rodrigues’ environment, which is characterized by dry sub-humid to semi-arid climate, intensive land clearing, and a fragmented native forest system isolated into ridge crests and micro-reserves provides little resistance to invading species [14,16]. Species such as Tabebuia or Samanea, introduced as ornamental and for agroforestry purposes, have been able to colonize adjacent landscapes outside of their predetermined range, while nitrogen-fixing species such as Leucaena, Vachellia and Albizia have a competitive advantage on surrounding species through their capabilities to alter soil nutrient dynamics [20,21].
Of the twelve species mapped, Tabebuia and Furcraea were the most widespread occurring intensely in Cascade Pigeon and Mourouk Valley. As these sites are characterised by open scrubland with past agricultural use and disturbed forest edges, they provide ideal conditions for IAS spread. The spatial dominance of Furcraea in Mourouk Valley especially corresponds to zones with thin, eroded soils and livestock grazing activities which provide perfect ground for this drought-resistant species to spread particularly with its ability to reproduce by vegetative propagation [22]. Likewise, the spread of Leucaena and Albizia at Mourouk Valley and Cascade St Louis support the pattern of altered soil chemistry as mentioned above. The central region of Golden Bat Reserve also showed multiple invasions by Leucaena, Millettia and Samanea, reflecting the long-term disturbance history of the zone especially since it is a bat roosting site where bats could have played a significant role in seed dispersal [23]. At Cascade St Louis, Vachellia dominated the southern part and Litsea the degraded plateaus suggesting that past human activities could have facilitated the establishment of these species in disturbed zones. In contrast, species like Albizia and Samanea occurred in patches in Mourouk Valley suggesting limited dispersal capacity or more recent introductions. Eucalyptus species, introduced for timber and erosion control, now dominate Golden Bat Reserve and the northern region of Cascade Pigeon, raising ecological concerns due to the species’ allelopathic properties and ability to suppress understorey vegetation [23]. Ravenala and Syzygium, observed mainly at Cascade Pigeon, form dense thickets that possibly suppress native regeneration in such disturbed regions [24]. Additionally, species like Syzygium that produces fleshy fruits can attract animals that facilitate seed dispersion. Rubus, found in an isolated patch at Cascade Pigeon along road tracks and erosion prone slopes, suggests its preference for disturbed microhabitats but when established can be very problematic to control. Collectively, the twelve species mapped illustrate how historical introductions such as Eucalyptus and naturalized species like Syzygium exploit different ecological niches resulting in the observed invasion dynamics in Rodrigues. To be sure, the IAS patterns observed in this study aligns with other oceanic island ecosystems where IAS establish in ecotonal zones [25] thereby reflecting both ecological suitability and historical land use at each of the studied site.
4.2. Model Reliability and Participatory GIS Mapping
The accuracy and reliability of the IAS spatial distribution patterns observed in the present study was notably shaped by the number of GPS data collected, underscoring the influence of sampling bias on interpolation outputs. For instance, in Cascade Pigeon, higher sampling in the southern region due to accessibility constraints resulted in higher IAS presence intensity estimates through the IDW interpolation method. While the IDW methodology is useful, it is also sensitive to spatial sampling bias, with under-sampled regions such as the north of Cascade Pigeon, appearing as low-intensity zones irrespective of actual species presence [26,27]. Therefore, to check the reliability of the species distribution model, accuracy metrics including mean values, estimated spatial error and RMSE were calculated. The mean IDW values at the four sites (Cascade Pigeon, Cascade St Louis, Mourouk Valley, Golden Bat Reserve) were very small (±0.0001) indicating a strong agreement between interpolated surfaces of the model and actual presence points (Table 5). For example, the value for Litsea was almost near-zero indicating precise likely distribution. The minor negative values such as for Millettia, indicate slight underestimations possibly due to sparse data. Slightly positive deviations as for Syzygium reflect moderate overestimation likely arising from denser sampling. Similarly, the estimated error in meters was low at all the sites for most species reflecting the high spatial accuracy (Table 6), in particular at Cascade St Louis, where all errors were under 0.1 m for almost all species. In Mourouk Valley, errors for Furcraea and Leucaena ranged between 0.01-0.3 m, indicating minimal spatial deviation from actual collected data. Conversely, Samanea had a value of 26.61 m, directly reflecting sparse data due to accessibility reasons, a case which is also noted for Eucalyptus (value of 12.72 m) at Golden Bat Reserve, because of clustered occurrences, thus affecting local predictions. To further validate these findings, the RMSE values were very low (close to and less than 0.01) at the four sites for most species. For instance, Albizia had an RMSE value of 3.89e-07 in Mourouk Valley, confirming the reliability of the model. Again, Samanea and Eucalyptus had higher RMSE values, corroborating earlier observations. These results indicate the robustness of the IDW approach, particularly in well-sampled areas, while also indicating the need for even data collection to avoid under and over-estimations of species distributions [27].
Participatory GIS mapping was therefore a key tool to produce accurate IAS spatial distribution maps at the four sites based on both field observations and stakeholder knowledge as already shown in the literature [e.g., [28,29,30]]. These PGIS maps offered finer contextual understanding of species distribution as seen in Mourouk Valley, where the mapped distribution of Millettia, Leucaena and Litsea showed co-occurrence patterns and land-use histories in overlapping regions, which were previously used for agriculture and later abandoned, reflecting how historical land use continues to affect current invasion dynamics. Interestingly, at Cascade Pigeon, PGIS revealed distinct patches of Ravenala and Syzygium near former human infrastructure, details which were not captured in the IDW maps alone. At Golden Bat Reserve, IDW outputs showed high-intensity zones for Samanea and Furcraea, but the PGIS map highlighted their spatial overlap with grassland zones and bat roosting sites, thereby illustrating the value of overlaying PGIS and IDW results. At Cascade St Louis, the patterns of IDW interpolation were consistent with PGIS mapping for Tabebuia and Vachellia, aligning with zones of concentrated field sampling and visible invasion fronts. PGIS was critical to map IAS spatial distribution at Cascade St Louis, since field surveys were limited due to steep terrain, and where drone surveys could not be covered, resulting in the capture of few GPS species presence points. Local stakeholder knowledge was of prime importance to identify invasion hotspots and historical land-use patterns that would have been overlooked in the IDW model. Local forestry officers and conservation workers contributed significant site-specific knowledge based on their long-term observations and familiarity with the landscapes. Given the challenging accessibility of the studied sites, which consist mainly of steep terrain and rugged valleys with dense vegetation, thereby restraining systematic surveys, together with the lack of data on IAS spatial distribution, the PGIS approach was especially valuable to map invasion patterns [31,32]. Such input helped delineate discrete IAS zones with a level of spatial accuracy that would have been difficult to achieve with point-based sampling or even remote sensing techniques alone. By integrating the local ecological knowledge with geospatial tools, PGIS improved the accuracy of the IAS distribution maps in Rodrigues while at the same time fostering stakeholder ownership and support for management interventions [32]. This type of hybrid approach, aligns with current best practices in IAS monitoring, especially for island ecosystems, where data availability, field access and ecological complexity pose significant challenges [25,32,33].
4.3. Enhancing IAS Management on Rodrigues Island Using PGIS Mapping
The PGIS maps thus produced in the present study highlight the ongoing degradation of the sparse native vegetation on Rodrigues Island and the pressing need for site-specific management interventions, especially in ecologically sensitive sites like Mourouk Valley and Golden Bat Reserve. The combined effects of high-impact species like Leucaena, Millettia and Furcraea, which can significantly change soil dynamics, reduce native regeneration and disrupt trophic levels, is particularly alarming [34]. The functional traits of these species, such as nitrogen-fixing ability (Leucaena) and vegetative propagation (Furcraea), allow them to rapidly invade disturbed landscapes, resulting in ecological shifts.
The inner valley of Mourouk, where these species co-exist, reveals invasion hotspots necessitating immediate containment and restoration. In contrast, grassland patches at Cascade St Louis and Golden Bat Reserve showed lower IAS invasion, suggesting their potential as buffer zones. As it is, the reserves on Rodrigues are very small and embedded within a landscape that is already highly invaded, making them vulnerable to continual pressure from surrounding IAS-dominated habitats. Right now, the proportion of land area under formal protection in Rodrigues is far below international targets and even within these protected areas, invasive species largely dominate the landscapes thus limiting conservation value and ecological integrity [35]. It is therefore imperative to move beyond managing isolated reserves and adopting a more integrated landscape approach such as vegetation mapping in adjacent environments for more informed planning of long-term buffer zone management and for identifying more areas for potential reserve expansion. Reinforcing buffer zones with native species, creating firebreaks or excluding IAS vectors could potentially help maintain biodiversity reservoirs and prevent the spread of IAS from adjacent disturbed zones [36].
Nonetheless, as pointed out by Zhang et al. [37], shifting invasion trajectories and changing niche dynamics could render these grasslands vulnerable in the future, thereby requiring adaptive management strategies. The study’s spatial outputs also reveal that high IAS intensity zones often correspond with human infrastructure such as tracks, houses and degraded slopes as seen at Cascade Pigeon and Mourouk Valley, highlighting the role of anthropogenic corridors in aiding in propagule dispersal.
The results of this study highlight the urgent need to tackle IAS in Rodrigues, especially in eco-sensitive regions like Cascade Pigeon, Cascade St Louis, Mourouk Valley and Golden Bat Reserve. Several critical hotspots where species such as Leucaena, Furcraea and Millettia co-occur have been identified, often in previously degraded and abandoned pastoral land, requiring intensive management such as mechanical removal, ecological restoration with native species or even biocontrol trials [38]. Very importantly, to maintain the ecological integrity of non-invaded sites like grasslands, management interventions should focus on preventing IAS invasion by implementing early detection and rapid response systems. Since invasion patterns in Rodrigues are strongly influenced by past land uses, management actions must be site-specific and tailored to the local context [39]. For example, in Cascade Pigeon, species like Syzygium were closely associated with homestead zones suggesting the need for tailored outreach and more robust invasive plant removal programs which is currently being undertaken in the zone. In Cascade St Louis, stakeholder engagement was key in producing the highly accurate PGIS maps, underscoring the value of stakeholder input in designing effective IAS interventions. As continued collaboration with the forestry staff will be essential for long-term IAS management in Rodrigues, a workshop on GIS mapping of IAS was organised on the 27th of October 2024 to train staff on the use of the mobile application GPS Waypoints to collect data on ground. The training also included procedures for data storage, transferring to Google Earth for spatial visualization and saving GPS points for updating future maps. The initiative aimed to build local capacity to ensure the continued monitoring and management of IAS in Rodrigues.
5. Conclusions
The present study demonstrates the effectiveness of participatory mapping with spatial analysis tools like IDW interpolation to enhance the mapping and monitoring of IAS in remote and data-limited island environments like Rodrigues. By integrating local stakeholder knowledge with field surveys and geospatial modeling, the study produced detailed species distribution maps at Cascade Pigeon, Cascade St Louis, Mourouk Valley and Golden Bat Reserve in Rodrigues with each site reflecting site-specific invasion dynamics influenced by ecological disturbance. The findings reveal critical invasion hotspots where species such as Leucaena, Millettia and Furcraea pose significant threats to native systems. Less invaded sites like grassland identified as potential buffer zones hold conservation value requiring ecological restoration and management. The high accuracy of the IDW approach supported by low RMSE values and minimal spatial error, proves its usefulness while PGIS was critical in mapping species in inaccessible areas like Cascade St Louis.
The study also contributes to the theoretical understanding of invasion trajectories and niche dynamics, reflecting how IAS behaviour can change in space, thereby emphasizing the need for site-specific and adaptive management strategies. Since spatial invasion patterns are quite complex, where often tackling outlier populations may be more effective to prevent further spread compared to saturated dense cores, management approaches should be carefully tailored to local invasion contexts [40], drawing on mobile data collection and visualization tools for ongoing monitoring. Of prime importance in this study was the integration of a participatory and spatially explicit method, thereby providing a robust and scalable framework for IAS management in Small Island Developing States (SIDS). By strengthening the local capacity of field workers and institutionalizing these tools, the long-term resilience of Rodrigues’ unique ecosystems will be enhanced while contributing to international conservation goals such as SDG (Sustainable Development Goal) 15 – Life on Land.
6. Limitations and Recommendations
While the study provides valuable insights, some limitations must be acknowledged. Firstly, given time constraints, GPS presence points were not evenly collected due to the inaccessibility of most of the sites; the accuracy of the IDW outputs could have thus been influenced. As a result, regions with sparse data could have produced predictions with lower confidence, potentially underestimating species presence. It is therefore recommended to conduct systematic surveys in all regions, including hard-to-access areas, over appropriate time-scales, to increase the number of samples, which will also improve model accuracy. Secondly, while PGIS enhanced spatial coverage, it remains qualitative and is subject to bias from stakeholders’ familiarity with the terrain. Consequently, it is suggested that future studies follow a standardized approach with documentation from stakeholder input (including who provided the input, their level of familiarity with the terrain, the basis of their knowledge) and potential biases through data triangulation with field validation such as GPS ground-truthing and/or complementary quantitative data such as remote sensing products or ecological surveys to enhance replicability and credibility of participatory mapping. And lastly, because of time and resource constraints, species abundance data could not be included which would have added depth to the study. To better evaluate ecological impacts and prioritize control activities, it is recommended that future studies integrate species abundance and density data.
Additionally, it is highly recommended that a more integrated landscape approach be adopted to reinforce the resilience of Rodrigues’ unique ecosystems since current reserves are typically small and dominated by invasive species. Mapping adjacent landscapes will help guide long-term buffer zone management and identify opportunities for reserve expansion thereby creating more effective ecological networks. Such an approach would also be relevant to the nature reserves on mainland Mauritius Island which faces similar ecological pressures and are of similar sizes. What’s more, the present methodology could also be extended to larger protected areas like the approximately 67 km2 Black River Gorges National Park (BRGNP) in Mauritius to inform spatial planning within the park itself and surrounding buffer zones. A broader extension of this approach would allow for the proactive, adaptive management of IAS at multiple scales, thereby enhancing conservation outcomes in both Rodrigues and Mauritius.
Funding
This work was supported by the Global Environment Facility (GEF) Trust Fund through the United Nations Development Programme (UNDP) – GEF Project ID 9553.
Data Availability Statement
GPS coordinates collected and used in the study can be made available upon request. All software utilized in the assessment are detailed in the manuscript.
Acknowledgments
The author gratefully acknowledges Dr. John Mauremootoo for the valuable insights he brought to this study. Sincere thanks are also extended to the Rodrigues Regional Assembly field workers and forestry officers, especially Mr. Marla J. Lalen, Mr. Milazar J. Perleman, and Mr. Jacquelin Legentil, who supported the mission, shared critical knowledge on IAS spatial distribution in Rodrigues, and contributed to the validation of the maps. Special appreciation is further extended to Mr. Sameer Kaudeer and Mr. Seewajee Vicky Pandoo from the Mainstreaming IAS UNDP project team for organising and supporting the mission. Their collaboration and commitment were instrumental to the success of this work.
Conflicts of Interest
The author declares no conflicts of interest.
References
- Roy, H.E.; Pauchard, A.; Stoett, P.; Renard Truong, T.; Bacher, S.; Galil, B.S.; Hulme, P.E.; Ikeda, T.; Sankaran, K.V.; McGeoch, M.A.; et al. Summary for Policymakers of the Thematic Assessment Report on Invasive Alien Species and their Control of the Intergovernmental Science-Policy Platform on Biodiversity and Ecosystem Services. IPBES secretariat: Bonn, Germany, 2023. [Google Scholar] [CrossRef]
- IUCN. Invasive Alien Species and Climate Change. Issues Brief. 2025. Available online: https://iucn.org/sites/default/files/2025-03/invasive-alien-species-and-climate-change-feb.-2025-update.pdf (accessed on 10 April 2025).
- Wittenberg, R. Invasive alien species—a threat to global biodiversity and opportunities to prevent and manage them. In Western Corn Rootworm: Ecology and Management; Vidal, S., Kuhlmann, U., Edwards, C.R., Eds.; CAB International: Wallingford, UK, 2005; pp. 1–28. [Google Scholar]
- CBD. Convention on Biological Diversity: Invasive Alien Species. 2021. Available online: https://www.cbd.int/ (accessed on 27 January 2025).
- Côté, I.M.; Smith, N.S. The lionfish Pterois sp. invasion: Has the worst-case scenario come to pass? J. Fish Biol. 2018, 92, 660–689. [Google Scholar] [CrossRef]
- Pimentel, D.; Zuniga, R.; Morrison, D. Update on the environmental and economic costs associated with alien-invasive species in the United States. Ecol. Econ. 2005, 52, 273–288. [Google Scholar] [CrossRef]
- Russell, J.C.; Meyer, J.Y.; Holmes, N.D.; Pagad, S. Invasive alien species on islands: impacts, distribution, interactions and management. Environ. Conserv. 2017, 44, 359–370. [Google Scholar] [CrossRef]
- Mauchamp, A. Threats from alien plant species in the Galápagos Islands. Conserv. Biol. 1997, 11, 260–263. https://www.jstor.org/stable/2387299. [CrossRef]
- Cheke, A.S.; Hume, J.P. Lost Land of the Dodo: The Ecological History of Mauritius, Réunion, and Rodrigues; Yale University Press: New Haven, CT, USA, 2008. [Google Scholar]
- Baider, C.; Florens, F.B.V. Control of invasive alien weeds averts imminent plant extinction. Biol. Invasions 2011, 13, 2641–2646. [Google Scholar] [CrossRef]
- Sunkur, R.; Mauremootoo, J. Spatio-temporal Analysis of an Invasive Alien Species, Vachellia nilotica, on Rodrigues Island, Mauritius, Using Geographic Information Systems and Remote Sensing Techniques. Indones. J. Earth Sci. 2024, 4, A835. [Google Scholar] [CrossRef]
- Eicken, H.; Danielsen, F.; Sam, J.M.; Fidel, M.; Johnson, N.; Poulsen, M.K.; Lee, O.A.; Spellman, K.V.; Iversen, L.; Pulsifer, P.; Enghoff, M. Connecting top-down and bottom-up approaches in environmental observing. BioScience 2021, 71, 467–483. [Google Scholar] [CrossRef]
- CHM (Clearing-House Mechanism). Status and Threats – Terrestrial Biodiversity. Government of Mauritius. 2023. Available online: http://chm.govmu.org/status-and-threats/terrestrial (accessed on 10 April 2025).
- Strahm, W.A. Plant Red Data Book for Rodrigues; Mauritian Wildlife Foundation: Mauritius, 1999. [Google Scholar]
- Florens, F.B.V. Conservation in Mauritius and Rodrigues: Challenges and achievements from two decades of NGO work. In Lost Land of the Dodo: An Ecological History of Mauritius, Réunion & Rodrigues; Cheke, A.S., Hume, J.P., Eds.; T & AD Poyser: London, UK, 2008; pp. 336–349. [Google Scholar]
- Baider, C.; Florens, F.B.V.; Baret, S.; Beaver, K.; Matatiken, D.; Strasberg, D.; Kueffer, C. Status of plant conservation in oceanic islands of the Western Indian Ocean. In Proceedings of the 4th Global Botanic Gardens Congress, Dublin, Ireland; 2007. [Google Scholar]
- Republic of Mauritius. National Biodiversity Strategy and Action Plan 2017–2025; Ministry of Agro-Industry and Food Security: Mauritius, 2017; Available online: https://www.cbd.int/doc/world/mu/mu-nbsap-v2-en.pdf (accessed on 10 April 2025).
- Chambers, R. Whose Reality Counts? Putting the First Last; Intermediate Technology Publications: London, UK, 1997; https://www.jstor.org/stable/44257385.
- Yoccoz, N.G.; Nichols, J.D.; Boulinier, T. Monitoring of biological diversity in space and time. Trends Ecol. Evol. 2001, 16, 446–453. [Google Scholar] [CrossRef]
- Sharma, P.; Kaur, A.; Batish, D.R.; Kaur, S.; Chauhan, B.S. Critical insights into the ecological and invasive attributes of Leucaena leucocephala, a tropical agroforestry species. Front. Agron. 2022, 4, 890992. [Google Scholar] [CrossRef]
- CABI. Albizia lebbeck (sirisa). In Invasive Species Compendium; CAB International: Wallingford, UK, 2023. [Google Scholar] [CrossRef]
- Kueffer, C.; Daehler, C.C.; Torres-Santana, C.W.; Lavergne, C.; Meyer, J.-Y.; Otto, R.; Silva, L. A global comparison of plant invasions on oceanic islands. Perspect. Plant Ecol. Evol. Syst. 2010, 12, 145–161. [Google Scholar] [CrossRef]
- da Silveira, M.C.; Silveira, M.; Medeiros, L.S.; Aguiar, L.M. The role of feeding roosts in seed dispersal service bats provide in urban areas. Biotropica 2024, 56, e13291. [Google Scholar] [CrossRef]
- FAO. Global Forest Resources Assessment 2005: Thematic Study on Forest Restoration: Current Patterns and Future Opportunities; Forest Resources Assessment Programme, Working Paper 83; FAO: Rome, Italy, 2005; Available online: https://www.fao.org/4/y5901e/y5901e07.htm (accessed on 10 April 2025).
- Russell, J.C.; Innes, J.G.; Brown, P.H.; Byrom, A.E. Predator-Free New Zealand: Conservation Country. BioScience 2017, 67, 820–829. [Google Scholar] [CrossRef]
- Fourcade, Y.; Engler, J.O.; Rödder, D.; Secondi, J. Mapping species distributions with MAXENT using a geographically biased sample of presence data: a performance assessment of methods for correcting sampling bias. PLoS ONE 2014, 9, e97122. [Google Scholar] [CrossRef]
- Li, J.; Heap, A.D. Spatial interpolation methods applied in the environmental sciences: a review. Environ. Model. Softw. 2014, 53, 173–189. [Google Scholar] [CrossRef]
- Mataruse, T.P.; Nyikahadzoi, K.; Fallot, A.; Perrotton, A. Using participatory mapping for a shared understanding of deforestation dynamics in Murehwa district, Zimbabwe. Cah. Agric. 2024. [CrossRef]
- Chan, C.M.; Owers, C.J.; Fuller, S.; Hayward, M.W.; Moverley, D.; Griffin, A.S. Capacity and capability of remote sensing to inform invasive plant species management in the Pacific Islands region. Conserv. Biol. 2025, 39, e14344. [Google Scholar] [CrossRef]
- Azzurro, E.; Cerri, J. Participatory mapping of invasive species: A demonstration in a coastal lagoon. Mar. Policy 2021, 126, 104412. [Google Scholar] [CrossRef]
- Chambers, R. Participatory mapping and geographic information systems: Whose map? Who is empowered and who disempowered? Who gains and who loses? Electron. J. Inf. Syst. Dev. Ctries. 2006, 25, 1–11. [Google Scholar] [CrossRef]
- McCall, M.K.; Dunn, C.E. Geo-information tools for participatory spatial planning: Fulfilling the criteria for “good” governance? Geoforum 2012, 43, 81–94. [Google Scholar] [CrossRef]
- Shackleton, R.T.; Adriaens, T.; Brundu, G.; Dehnen-Schmutz, K.; Estévez, R.A.; Fried, J.; Larson, B.M.; Liu, S.; Marchante, E.; Marchante, H.; Moshobane, M.C. Stakeholder engagement in the study and management of invasive alien species. J. Environ. Manag. 2019, 229, 88–101. [Google Scholar] [CrossRef] [PubMed]
- Vujanović, D.; Losapio, G.; Milić, S.; Milić, D. The impact of multiple species invasion on soil and plant communities increases with invasive species co-occurrence. Front. Plant Sci. 2022, 13, 875824. [Google Scholar] [CrossRef]
- Mauremootoo, J. Personal communication by email, 12 May 2025.
- Pyšek, P.; Hulme, P.E.; Simberloff, D.; et al. Scientists’ warning on invasive alien species. Biol. Rev. 2020, 95, 1511–1534. [Google Scholar] [CrossRef] [PubMed]
- Zhang, L.; Zhu, M.; Wan, Y.; Liu, X. Multiple invasion trajectories induce niche dynamics inconsistency and increase risk uncertainty of a plant invader. Ecosphere 2023, 14, e4483. [Google Scholar] [CrossRef]
- Tataridas, A.; Jabran, K.; Kanatas, P.; Oliveira, R.S.; Freitas, H.; Travlos, I. Early detection, herbicide resistance screening, and integrated management of invasive plant species: a review. Pest Manag. Sci. 2022, 78, 3957–3972. [Google Scholar] [CrossRef] [PubMed]
- IUCN. Guidelines for Invasive Species Planning and Management on Islands; Compiled and edited by Alan Tye; IUCN: Cambridge, UK; Gland, Switzerland, 2018. [Google Scholar] [CrossRef]
- Republic of Mauritius. Good Practice Guide to Native Forest Restoration in Mauritius; Ministry of Agro Industry and Food Security: Port Louis, 2018. [Google Scholar]
Figure 3.
IAS distribution maps at Cascade Pigeon, Mourouk Valley, Cascade St Louis and Golden Bat Reserve based on observed field data and IDW approach using ArcGIS.
Figure 3.
IAS distribution maps at Cascade Pigeon, Mourouk Valley, Cascade St Louis and Golden Bat Reserve based on observed field data and IDW approach using ArcGIS.
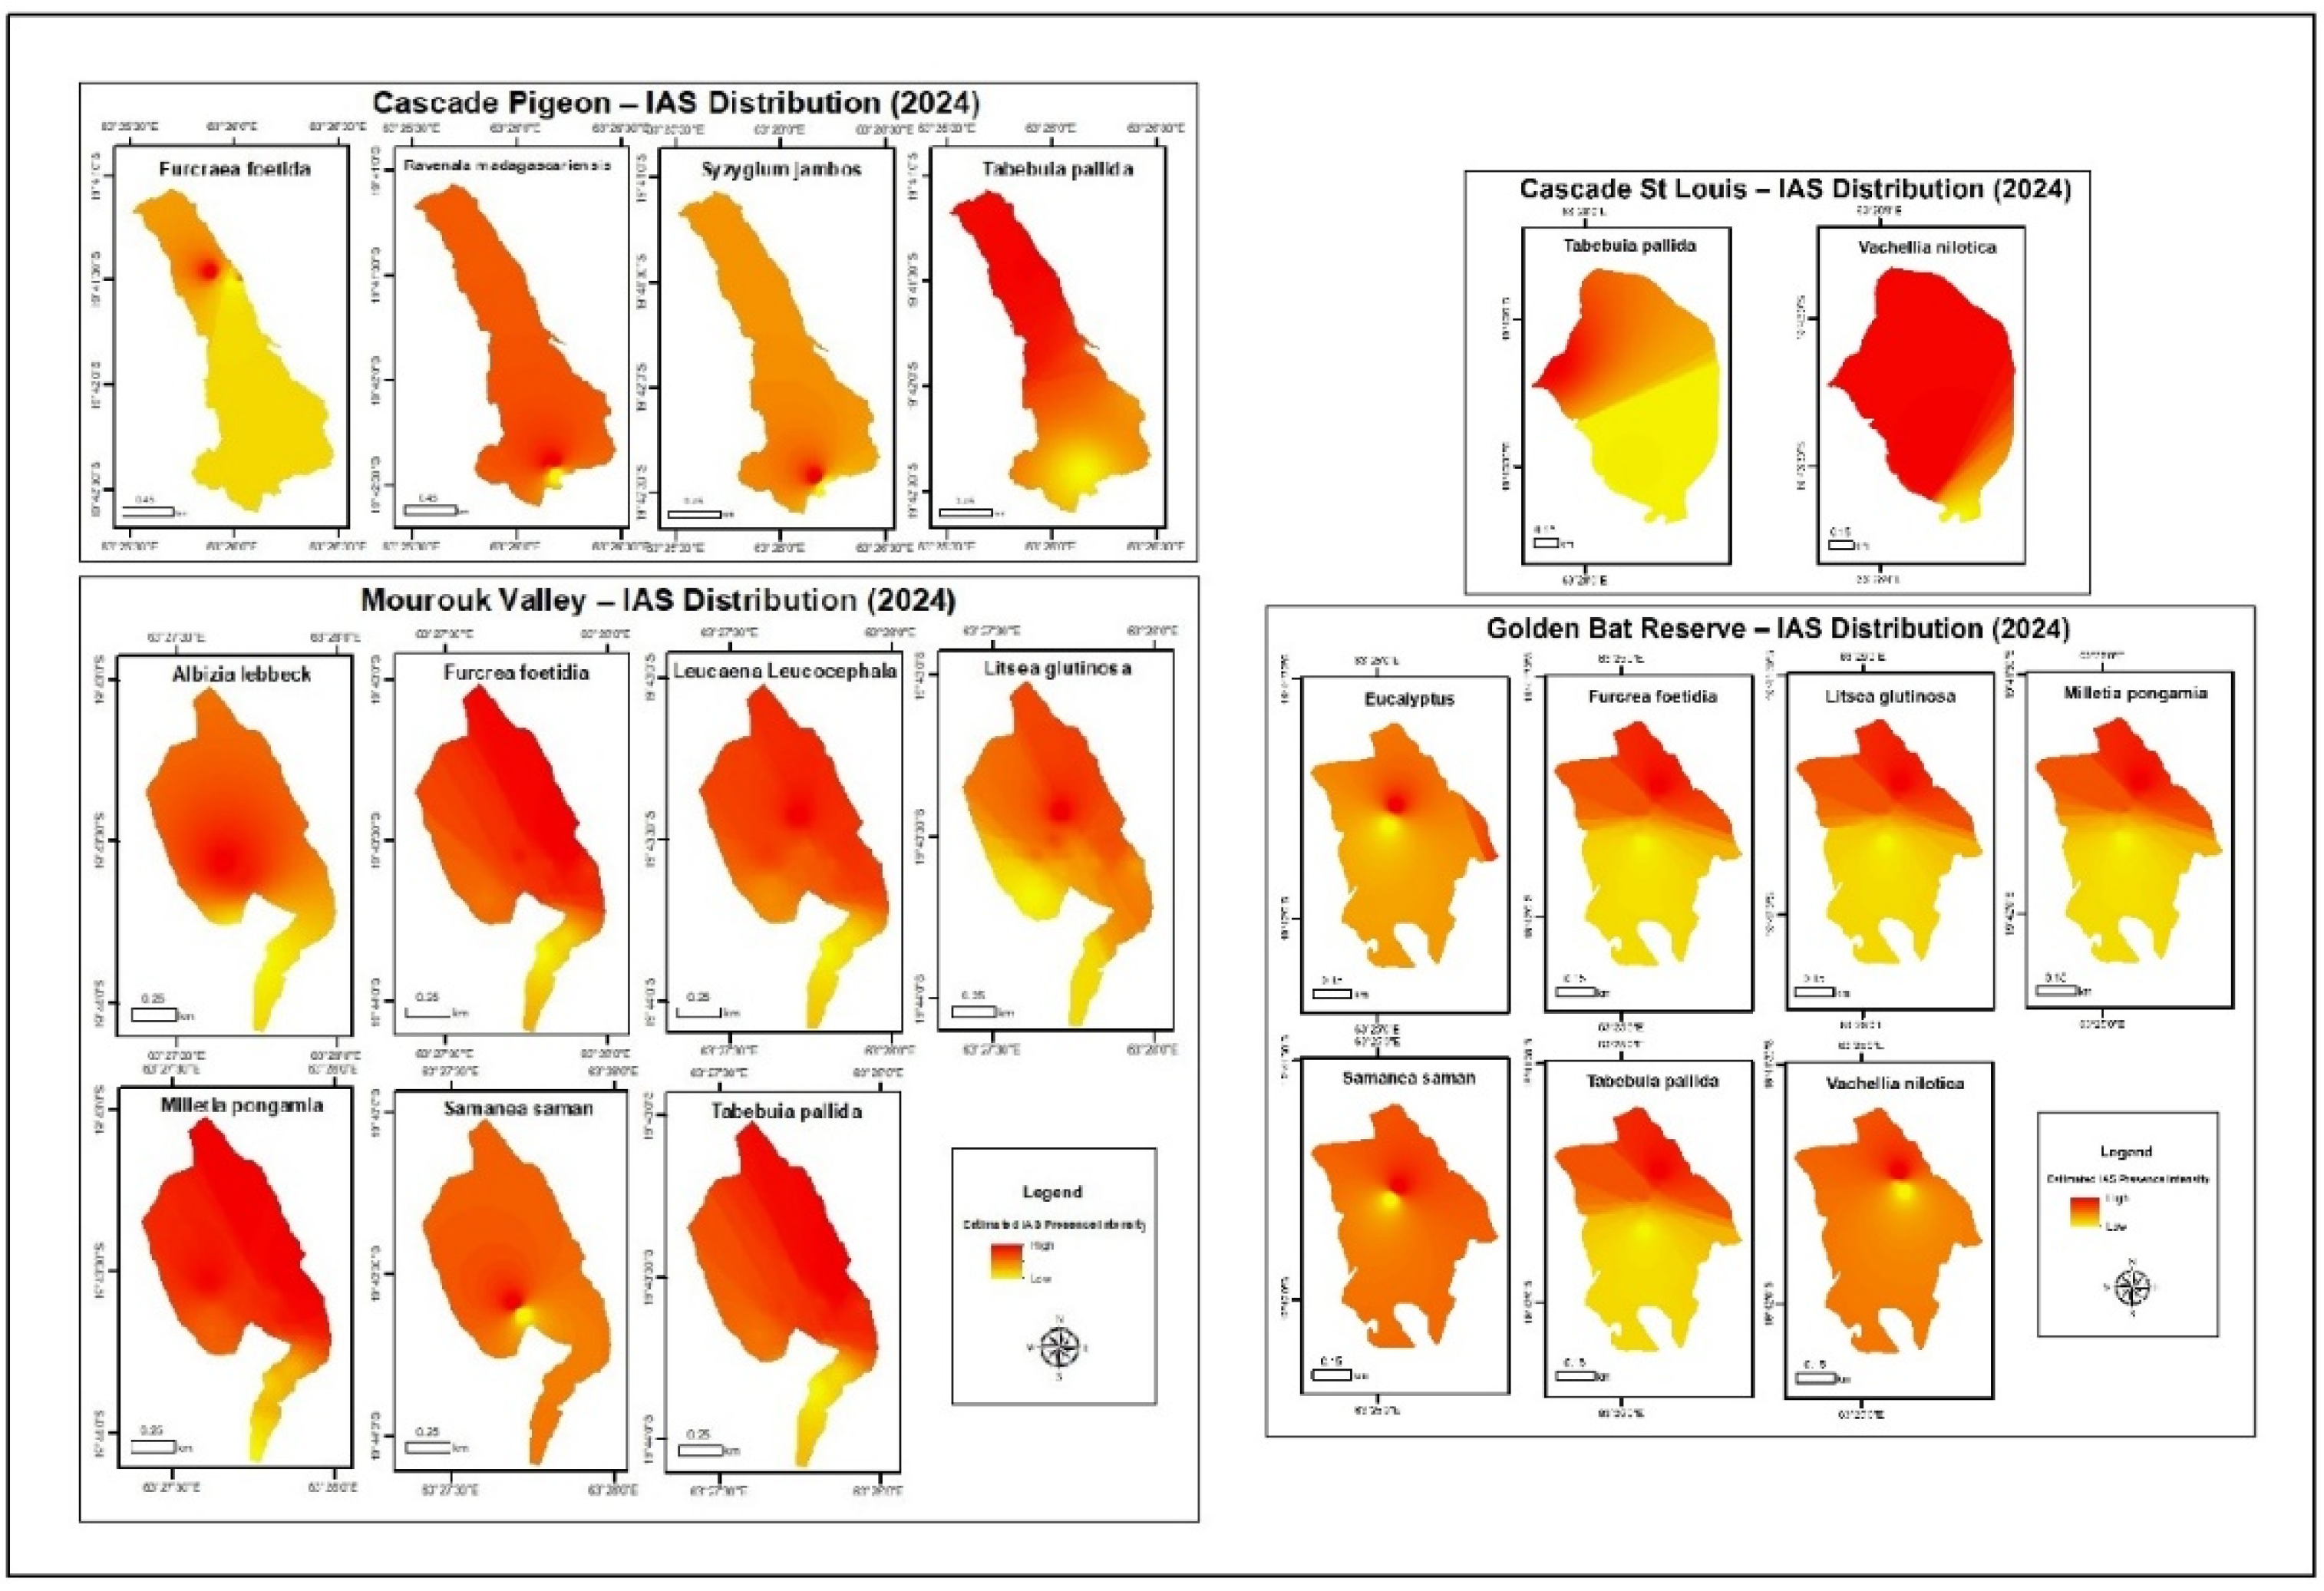
Table 1.
Sites selected for the assessment and the sizes in ha.
| Site | Size (ha) |
|---|---|
| Mourouk Valley | 77 |
| Cascade Pigeon | 200 |
| Cascade St Louis | 110 |
| Golden Bat Reserve | 141 |
Table 2.
Details of the selected invasive alien species for Rodrigues.
| SN | Scientific name | Common name | Occurrence region |
|---|---|---|---|
| 1 | Albizia lebbeck | Siris | Mourouk Valley, Golden Bat Reserve |
| 2 | Samanea saman | Monkey Pod Tree | Mourouk Valley, Golden Bat Reserve, Cascade St Louis |
| 3 | Eucalyptus | Eucalyptus | Cascade Pigeon, Golden Bat Reserve, Mourouk Valley |
| 4 | Furcraea foetida | Aloès | Cascade Pigeon, Golden Bat Reserve, Mourouk Valley |
| 5 | Tabebuia pallida | Tecoma | Cascade Pigeon, Cascade St Louis, Golden Bat Reserve, Mourouk Valley |
| 6 | Litsea sebifera | Bolly beech | Golden Bat Reserve, Mourouk Valley, Cascade St Louis |
| 7 | Leucaena leucocephala | Acacia | Mourouk Valley, Cascade St Louis |
| 8 | Ravenala madagascariensis | Ravenale | Cascade Pigeon |
| 9 | Rubus rosifolius | Framboise | Cascade Pigeon |
| 10 | Syzygium jambos | Jamrosa | Cascade Pigeon |
| 11 | Vachellia nilotica | Prickly Acacia | Cascade Pigeon, Cascade St Louis, Golden Bat Reserve |
| 12 | Millettia pinnata | Pongame | Golden Bat Reserve, Mourouk Valley, Cascade St Louis |
Table 5.
Mean values of the IDW interpolation method per species and site.
| Rodrigues | ||||
|---|---|---|---|---|
| Species | Mourouk Valley | Cascade Pigeon | Cascade St Louis | Golden Bat Reserve |
| Albizialebbeck | 1.55e-09 | - | - | - |
| Samaneasaman | 0.01 | - | - | 4.90 |
| Eucalyptus spp. | - | - | - | -0.01 |
| Furcraeafoetida | -6.06e-05 | 0.01 | - | -1.23e-05 |
| Tabebuiapallida | -5.74e-05 | -6.15e-05 | -9.72e-06 | -1.52e-05 |
| Litseasebifera | 5.23e-07 | - | - | -1.82e-05 |
| Leucaenaleucocephala | -7.83e-05 | - | - | |
| Ravenalamadagascariensis | - | -0.01 | - | - |
| Rubusrosifolius | - | - | - | - |
| Syzygiumjambos | - | 4.56e-05 | - | - |
| Vachellianilotica | - | - | -2.24e-05 | -3.39e-05 |
| Millettia pinnata | -8.03e-05 | - | - | -1.04e-05 |
Table 6.
Estimated Error in Meters based on the mean IDW values per species and site.
| Rodrigues | ||||
|---|---|---|---|---|
| Species | Mourouk Valley | Cascade Pigeon | Cascade St Louis | Golden Bat Reserve |
| Albizia lebbeck | 0.000005 m (~0 mm) | - | - | - |
| Samanea saman | 26.61 m | - | - | 0.15 m (~15 cm) |
| Eucalyptus | - | - | - | 12.72 m |
| Furcraea foetida | 0.18 m (~18 cm) | 0.31 m (~31 cm) | - | 0.037 m (~4 cm) |
| Tabebuia pallida | 0.17 m (~17 cm) | 0.18 m (~18 cm) | 0.029 m (~3 cm) | 0.045 m (~5 cm) |
| Litsea sebifera | 0.00157 m (~1.6 mm) | - | - | 0.054 m (~5 cm) |
| Leucaena leucocephala | 0.23 m (23 cm) | - | - | |
| Ravenala madagascariensis | - | 0.39 m (~39 cm) | - | - |
| Rubus rosifolius | - | - | - | - |
| Syzygium jambos | - | 0.14 m (~14 cm) | - | - |
| Vachellia nilotica | - | - | 0.067 m (~7 cm) | 0.102 m (~10 cm) |
| Millettia pinnata | 0.24 m (~24 cm) | - | - | 0.031 m (~3 cm) |
Table 7.
Root Mean Square Error values for the interpolation in per species and site.
| Rodrigues | ||||
|---|---|---|---|---|
| Species | Mourouk Valley | Cascade Pigeon | Cascade St Louis | Golden Bat Reserve |
| Albizia lebbeck | 3.89e-07 | - | - | - |
| Samanea saman | 0.02 | - | - | 8.49e-05 |
| Eucalyptus | - | - | - | 0.01 |
| Furcraea foetida | 0.01 | 0.01 | - | 6.73e-05 |
| Tabebuia pallida | 0.01 | 0.01 | 6.28e-05 | 6.46e-05 |
| Litsea sebifera | 0.01 | - | - | 6.2e-05 |
| Leucaena leucocephala | 0.01 | - | - | - |
| Ravenala madagascariensis | - | 0.01 | - | - |
| Rubus rosifolius | - | - | - | - |
| Syzygium jambos | - | 0.01 | - | - |
| Vachellia nilotica | - | - | 0.01 | 8.33e-05 |
| Millettia pinnata | 0.01 | - | 6.77e-05 | |
Disclaimer/Publisher’s Note: The statements, opinions and data contained in all publications are solely those of the individual author(s) and contributor(s) and not of MDPI and/or the editor(s). MDPI and/or the editor(s) disclaim responsibility for any injury to people or property resulting from any ideas, methods, instructions or products referred to in the content. |
© 2025 by the authors. Licensee MDPI, Basel, Switzerland. This article is an open access article distributed under the terms and conditions of the Creative Commons Attribution (CC BY) license (http://creativecommons.org/licenses/by/4.0/).
Copyright: This open access article is published under a Creative Commons CC BY 4.0 license, which permit the free download, distribution, and reuse, provided that the author and preprint are cited in any reuse.


