
Submitted:
16 September 2025
Posted:
17 September 2025
You are already at the latest version
Abstract
Trajectory traffic semantic understanding is fundamental to applications such as intelligent transportation and urban mobility analysis. While multimodal large language models (MLLMs) have recently advanced remote sensing scene understanding, current models remain focused on general remote sensing semantics and lack tailored designs for trajectory-specific tasks. To bridge this gap, we propose MM-RSTraj, the first remote sensing–assisted multimodal framework tailored for trajectory traffic semantic understanding. Built upon the LLaVA-OneVision architecture, MM-RSTraj adopts a two-stage fine-tuning strategy to enhance cross-modal interaction between remote sensing imagery and trajectory features. To support this process, we construct two high-quality instruction datasets: RSI-Instruct, an extension of RSICap providing multi-turn instruction–response supervision for general remote sensing semantics; and RSI-Traffic, a dataset designed for trajectory traffic semantic understanding, emphasizing key environmental semantics such as road structures, building layouts, and trajectory-related features. Experimental results demonstrate that MM-RSTraj achieves superior performance in remote sensing trajectory traffic semantic evaluation, while also attaining competitive results in general remote sensing semantic tasks such as RSIC and RSVQA. This work establishes a new paradigm for integrating environmental semantics with trajectory modeling through multimodal large language models (MLLMs).
Keywords:
remote sensing (RS)
; trajectory traffic semantic understanding
; vision language model (VLM)
; multimodal large language model (MLLM)
; remote sensing instruction datasets
; cross-modal interaction
1. Introduction
Modeling human mobility behavior aims to reveal individual and collective movement patterns through the analysis of trajectory data, which is of great importance for applications such as intelligent transportation, urban planning, and location-based services [1,2,3]. However, traditional approaches mainly rely on low-level GPS coordinate sequences, which fail to capture environmental semantics such as road structures and spatial layouts, thereby limiting their effectiveness in complex semantic understanding tasks [4,5]. As a powerful supplement, the development of remote sensing (RS) technologies has made it possible to extract fine-grained environmental information from high-resolution satellite and aerial imagery, including road morphology, building density, and land-use patterns, all of which are crucial for trajectory understanding [6,7]. To better exploit these opportunities, it is necessary to review recent advances and highlight the challenges in integrating environmental semantics with trajectory understanding.
Deep learning has achieved remarkable progress in both remote sensing (RS) image processing and trajectory data analysis, providing a solid foundation for diverse downstream applications. In the RS domain, it has been widely adopted for scene classification, object detection, and semantic segmentation [8,9,10]. Similarly, deep learning has advanced trajectory prediction and mobility pattern mining [11,12,13]. Despite these advances, most existing approaches remain unimodal and struggle to integrate environmental semantics and linguistic information, thereby limiting their ability to comprehend and reason about complex trajectory–environment interactions.
Large language models (LLMs) have achieved remarkable breakthroughs in natural language processing, demonstrating strong instruction-following, in-context learning, and reasoning capabilities [14,15,16,17,18,19]. However, since LLMs are inherently limited to processing discrete linguistic symbols, they lack the ability to perceive visual information, which constrains their effectiveness in multimodal tasks involving image–language interactions.
Consequently, vision–language models (VLMs) have been proposed, integrating computer vision and natural language processing into a unified framework to enable cross-modal understanding and reasoning. Existing VLMs can be broadly categorized into generative models (e.g., BLIP [20], VisualGPT [21]) and contrastive learning models (e.g., CLIP [22]), which have shown strong potential in remote sensing applications such as image captioning [23,24,25], visual question answering [26,27], and scene classification [28,29]. Nevertheless, most VLMs treat task instructions implicitly and regard language primarily as static image descriptions, resulting in limited reasoning and interaction capabilities in complex open scenarios.
In recent years, multimodal large language models (MLLMs) have advanced rapidly, aiming to integrate multiple modalities such as vision and language within a unified architecture to enable synergistic cross-modal representation and reasoning capabilities [30,31,32,33,34,35]. These models typically adopt an instruction tuning paradigm, equipping them with explicit instruction-following abilities and enabling flexible handling of diverse tasks—including visual question answering, caption generation, and language reasoning—in open-ended scenarios, thereby significantly enhancing interactivity and generalization [36,37,38]. Notably, VLMs can be broadly regarded as a subclass of MLLMs, as both aim to unify multimodal representation and reasoning. However, early VLMs were typically task-specific, lacking explicit instruction alignment and generalization capabilities, which limited their effectiveness in dialog and multi-turn reasoning tasks. In contrast, recent MLLMs overcome these constraints by enabling dynamic interaction and stronger multimodal reasoning [22,39].
High-quality instruction datasets are critical for enhancing model performance during fine-tuning, even when the dataset scale is relatively small [40,41,42,43]. However, in the remote sensing (RS) domain—particularly for trajectory traffic semantic understanding—the application of multimodal large language models remains at an early stage, constrained by the lack of task-specific instruction datasets and dedicated architectures. Existing RS image datasets are primarily designed for visual recognition and lack sufficient language annotations for cross-modal training. Although RSICap [44] provides high-quality human-annotated captions of RS images, covering rich scene details, object information, and reasoning knowledge, it still consists only of image–text pairs and is not optimized for trajectory semantics, leaving a critical gap in trajectory traffic semantic modeling.
To bridge this gap, we propose MM-RSTraj, the first remote-sensing-assisted multimodal large language model tailored for trajectory traffic semantic understanding. Built on the LLaVA-OneVision architecture, MM-RSTraj introduces a two-stage fine-tuning strategy to strengthen cross-modal semantic alignment between remote sensing imagery and trajectory features. To support this process, we construct two instruction-tuning datasets: RSI-Instruct, which extends RSICap for general remote sensing tasks, and RSI-Traffic, designed to address trajectory traffic semantic understanding.
Our contributions are summarized as follows:
- We construct the first multimodal instruction dataset system for remote sensing and trajectory traffic semantics. Specifically, we extend RSICap into RSI-Instruct with multi-turn dialogues for general remote sensing semantics, and develop RSI-Traffic, focusing on trajectory-related elements such as road structures and building layouts.
- We propose MM-RSTraj, the first remote-sensing-assisted multimodal large language model designed for trajectory traffic understanding. Built on the LLaVA-OneVision architecture, MM-RSTraj employs a two-stage strategy that combines general remote sensing pretraining with trajectory-specific fine-tuning, optimizing cross-modal semantic alignment.
- We validate MM-RSTraj on both trajectory semantic evaluation and general remote sensing tasks. The experiments show that MM-RSTraj achieves superior performance in trajectory-related evaluation while maintaining competitive results on RSIC and RSVQA.
2. Related Work
2.1. Vision-Language Models for Remote Sensing
In recent years, Vision-Language Models (VLMs) have emerged as a core paradigm for multimodal intelligence, achieving unified representation and cross-modal reasoning through large-scale image–text pretraining [45,46,47,48]. Compared to unimodal models, VLMs not only extract rich semantics from images but also leverage language to improve interpretability and generalization across diverse tasks. Existing VLMs can be broadly categorized into generative and contrastive approaches. Generative models (e.g., VisualGPT [21], BLIP [20]) generate natural language conditioned on visual inputs via image–text pretraining, while contrastive models (e.g., CLIP [22]) align image and text features in a joint semantic space, enabling zero-shot classification and retrieval. Inspired by these successes, researchers have applied VLMs to RS tasks including image captioning [23,24,25,49,50], VQA [26,27,51,52], cross-modal retrieval [53,54,55,56,57], text-to-image generation [58,59,60], and zero-shot classification [28,29,61], thereby advancing RS semantic understanding. However, most existing methods are still trained on static natural image–text pairs, without explicit instruction alignment or interactive reasoning, and thus fail to fully capture high-resolution structures and spatial semantics in RS imagery, particularly for complex tasks such as trajectory–environment semantic modeling.
2.2. Multimodal Large Language Models (MLLMs)
In recent years, Multimodal Large Language Models (MLLMs) have rapidly advanced, aiming to integrate multiple modalities—such as vision and language—within unified architectures for synergistic cross-modal representation and reasoning [30,32]. Compared with earlier Vision-Language Models (VLMs), MLLMs exhibit greater generality and interactivity, as VLMs are often task-specific, rely on static image–text alignment, and lack explicit instruction-following or transfer capabilities, resulting in limited performance in open-ended reasoning and multi-turn dialogue [22,39].
MLLMs typically adopt a paradigm centered on large language models augmented with modality-specific encoders, leveraging the strong language generation, zero-shot transfer, and in-context learning (ICL) [18] abilities of LLMs combined with high-quality visual representations for collaborative multimodal reasoning [62]. Proprietary models such as GPT-4 [15], GPT-4o [63], Gemini [64], and Claude-3.5 [65] demonstrate state-of-the-art performance across diverse tasks, while the open-source LLaVA series has pioneered efficient instruction tuning for multimodal dialogue and reasoning. In particular, LLaVA-OneVision [66] enhances visual semantic understanding via high-resolution feature extraction and hierarchical alignment, establishing itself as a leading open-source MLLM. Early research primarily focused on image–text understanding and generation, with representative models such as BLIP-2 [67], LLaVA [40], and MiniGPT-4 [68], and has since expanded into video–text (e.g., VideoChat [69], Video-ChatGPT [70]) and audio–text (e.g., QwenAudio [71]), laying the foundation for unified multimodal modeling.
In the remote sensing domain, the emergence of MLLMs is reshaping traditional paradigms. RSGPT [44] introduced one of the first VLMs for RS imagery and established a benchmark for image–text alignment. Subsequent works have further advanced RS multimodal modeling from different perspectives. For example, RS-LLaVA [72] adapts the LLaVA framework to RS scenarios and demonstrates effective instruction tuning for scene-level description and VQA. In contrast, RS-MoE [73] introduces a Mixture-of-Experts (MoE) based architecture specifically customized for remote sensing image captioning, incorporating an Instruction Router and multiple lightweight LLM experts to enhance caption diversity, specificity, and scalability. These approaches expand the landscape of RS-oriented multimodal modeling but still primarily focus on generic scene description and VQA, lacking specialized optimization for domain-specific applications such as traffic semantics and trajectory modeling.
2.3. Instruction Tuning in MLLMs
Instruction tuning is a pivotal technique for adapting multimodal large language models (MLLMs) to downstream tasks. Its core objective is to leverage explicit instruction–response pairs to enable models to follow natural language instructions for open-ended tasks [36,37]. Originally introduced in the natural language processing (NLP) domain, instruction tuning significantly improved the instruction-following and generalization capabilities of large language models (LLMs) such as GPT-3 [18], OPT [74], and T5 [75]. Representative efforts, including InstructGPT/ChatGPT [14,42], FLAN-T5 [76], and OPT-IML [77], substantially enhanced zero-shot and few-shot performance. This concept was subsequently extended to the multimodal domain. Early multimodal models such as Flamingo [78] demonstrated, for the first time, the feasibility of zero-shot task transfer and in-context learning on large-scale image–text pairs, opening a new paradigm for multimodal instruction learning. BLIP-2 [67] further explored image–text instruction alignment, integrating a vision encoder with a language model to achieve cross-modal reasoning. Building on this foundation, LLaVA [40] emerged as a pioneering work in visual instruction tuning: leveraging text-only GPT-4 outputs, it transformed COCO [79] bounding box–description data into multimodal instruction datasets encompassing conversational QA, fine-grained image description, and complex reasoning, thereby providing a paradigm for subsequent multimodal instruction-tuned models and large-scale datasets. InstructBLIP [80] extended this approach by introducing visual question answering (VQA) datasets tailored for academic benchmarks, further enhancing visual semantic understanding.
2.4. Remote Sensing Multimodal Datasets
In the remote sensing domain, early image captioning datasets such as UCM-Captions [81] and Sydney-Captions [81] were constructed from the UCM [82] and Sydney [83] datasets. However, these resources were limited in scale and provided only coarse textual descriptions. Subsequent datasets, including RSICD [84] and NWPU-Captions [85], expanded the number of image–text pairs and scene diversity, but their annotations remained short and lacked fine-grained semantics. With the rise of instruction tuning in vision–language modeling, two representative types of multimodal instruction datasets have been developed for remote sensing. The first is RSICap [44], which pioneered the provision of high-quality human-annotated captions covering scene details, object information, and visual reasoning, and also released the RSIEval benchmark for evaluation. However, RSICap remains limited to image–text pairs without instruction–response formatting, hindering its use in interactive tasks such as VQA or complex reasoning, and offering no optimization for trajectory-related semantics. The second is RS-Instructions [72], which reformulates existing captioning and VQA datasets into instruction–input–output triplets, supporting multi-task instruction learning across description and QA tasks. While this dataset enables broader instruction alignment, its scope is still restricted to generic RS scenes and does not incorporate semantic elements relevant to trajectories and traffic behavior. Overall, although these datasets have significantly advanced multimodal modeling in RS, notable gaps remain in fine-grained domains such as trajectory semantics and traffic scenarios.
3. Dataset Construction
Studies have shown that high-quality instruction datasets play a critical role in fine-tuning multimodal large language models (MLLMs), enabling significant performance improvements even with relatively small-scale data [40,41,86]. However, in the remote sensing domain—particularly for trajectory and traffic semantic understanding tasks—there remains a lack of task-specific instruction datasets. This limitation hampers the ability of general-purpose MLLMs to fully realize their potential in trajectory-related remote sensing semantic understanding and generation tasks.
To address this gap, we propose two novel instruction datasets: RSI-Instruct and RSI-Traffic. Distinct from conventional approaches that merely fine-tune or extend models on generic remote sensing imagery, we introduce a two-stage data construction strategy to achieve progressive transfer and enhancement from general spatial semantic perception to trajectory-specific semantic understanding and traffic scene reasoning. In the first stage, we construct the RSI-Instruct dataset by converting captions from the RSICap dataset into instruction format and augmenting them with multi-turn dialogues. This dataset supports preliminary cross-modal alignment and spatial cognition pretraining, laying a solid foundation for subsequent task-oriented semantic learning. In the second stage, we design and collect the RSI-Traffic dataset, which is specifically tailored for trajectory semantic understanding and traffic scene reasoning. Leveraging high-resolution remote sensing imagery, this dataset guides models to capture structural and semantic information closely related to urban mobility. It not only provides detailed annotations of static spatial features (e.g., road morphology, building density, functional regions) but also incorporates dynamic traffic semantics (e.g., peak-hour congestion bottlenecks, road accessibility) through instruction prompts, significantly enhancing the model’s capability in traffic behavior understanding and scene perception.
Inspired by insights from related studies [87,88], we focus on enhancing instruction diversity, task coverage, and semantic granularity in constructing both RSI-Instruct and RSI-Traffic, ensuring that the datasets not only achieve high quality and richness but also better support complex semantic understanding and reasoning tasks.
3.1. RSI-Instruct
3.1.1. Motivation and Dataset Foundation
To construct RSI-Instruct, a remote sensing image instruction-following dataset for general tasks, this study systematically extends the RSICap dataset [44] released by Peking University. RSICap, developed by remote sensing experts based on the DOTA training set, possesses several advantages: (1) diverse scenes and data sources, covering urban areas, rural regions, industrial zones, ports, and airports with images from various sensors and resolutions; (2) detailed and semantically rich annotations, including overall scene descriptions as well as target counts, categories, positions, and spatial relationships, further enriched with visual reasoning information; and (3) broad applicability, widely adopted in tasks such as remote sensing image semantic understanding, image-text matching, and image captioning.
However, RSICap lacks an instruction–response question-answer format and task-oriented content, limiting its potential in multimodal dialogue, visual question answering (VQA), and complex reasoning tasks. Moreover, its captions are primarily single-turn statements, insufficient for multi-turn interactions or higher-level semantic reasoning.
3.1.2. Multi-Turn Instruction-Response Construction
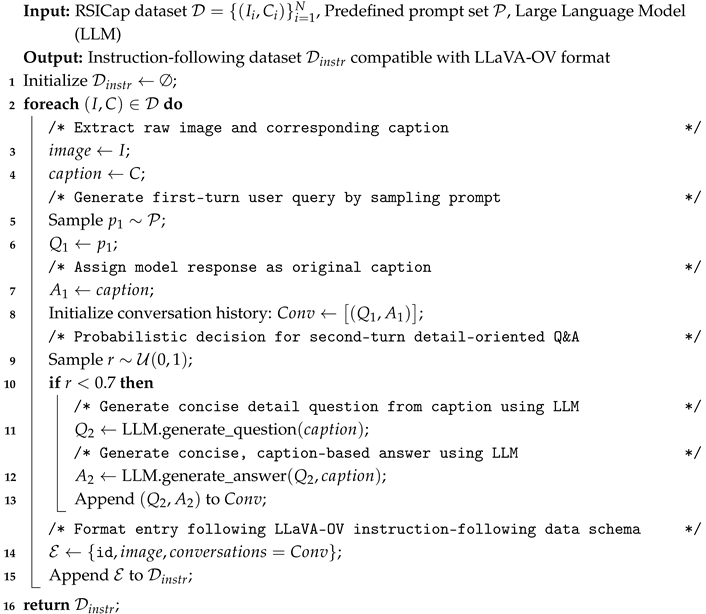
To address these limitations, we propose a structured expansion pipeline that transforms the original RSICap captions into instruction-following format while introducing multi-turn dialogue mechanisms to enrich semantic interaction. As shown in Algorithm 1, the process begins with designing 17 diverse and semantically rich prompts based on the images and their captions to guide first-round user queries (e.g., “Please identify and describe the main scene depicted in this image.”). This stage encourages the model to generate accurate global scene descriptions from multiple perspectives, enhancing semantic breadth and diversity. Building upon the first-round captions, second-round dialogue questions are automatically generated using the large language model Qwen3-32B [89], focusing on fine-grained semantic details such as object presence and quantity, color attributes, absolute and relative spatial positions, and image resolution or type. These questions and responses are strictly derived from caption content without introducing additional reasoning or external knowledge, ensuring objectivity and precision.
| Algorithm 1: Construction of RSI-Instruct Dataset |
 |
3.1.3. Semantic Diversity and Fine-Grained Attributes
To intuitively demonstrate the semantic richness and fine-grained attribute mining capabilities of RSI-Instruct, Figure 1 illustrates representative multi-turn dialogue examples. The first round showcases six of the 17 prompts, highlighting their role in eliciting diverse global scene semantics. The second round exemplifies the dataset’s ability to probe fine-grained attributes, including object existence, quantity, color, absolute and relative spatial relations, and image resolution/type. Together, these dialogues underscore the dataset’s potential for advancing complex semantic understanding and reasoning in remote sensing tasks.
Overall, this expansion process was applied to 2,585 high-quality remote sensing images. All automatically generated question–answer pairs underwent rigorous review and targeted revision by three remote sensing experts over five days, ensuring both the accuracy and professional reliability of the dataset, and providing a solid data foundation for building general-purpose remote sensing understanding and reasoning capabilities.
3.2. RSI-Traffic
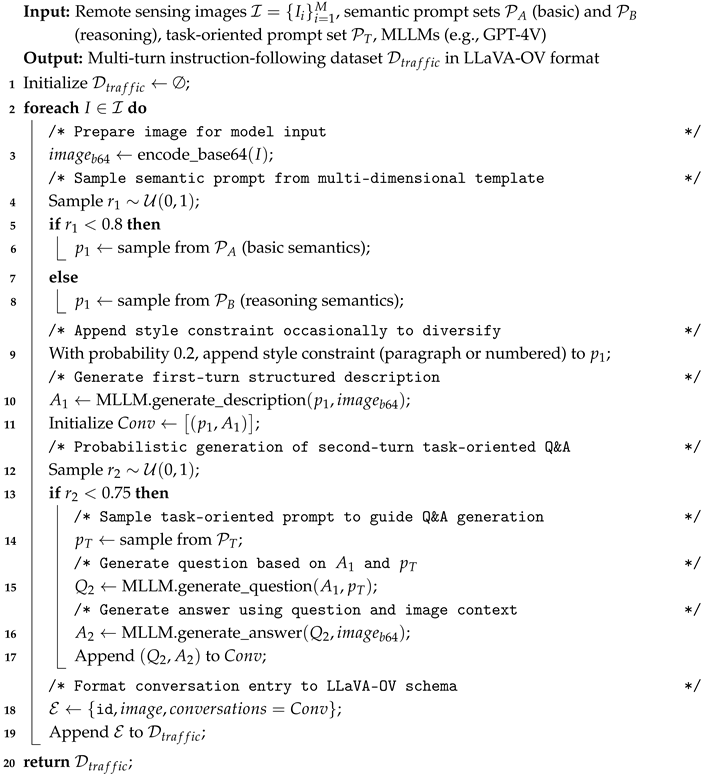
To enhance the spatial perception and semantic modeling capabilities of multimodal large language models (MLLMs) in urban trajectory understanding and traffic scenario reasoning, we build upon general remote sensing semantics and construct a specialized instruction dataset for trajectory semantic understanding and traffic reasoning tasks, termed RSI-Traffic. This dataset focuses on key spatial semantic elements related to urban mobility, encompassing both static structures (e.g., road morphology, building density, functional zoning) and dynamic traffic semantics (e.g., peak-hour congestion bottlenecks, road capacity potential). The complete construction process, including data collection, multi-round semantic annotation, and expert refinement, is systematically outlined in Algorithm 2, ensuring reproducibility and clarity of each processing stage. By providing high-quality supervision across the image–language–trajectory modalities, RSI-Traffic facilitates deeper multimodal joint modeling and reasoning.
| Algorithm 2: Construction of RSI-Traffic Dataset |
 |
3.2.1. Urban Remote Sensing Image Acquisition and Selection
To ensure representativeness and diversity, we curated RSI-Traffic from multiple public trajectory datasets and GIS platforms, selecting urban regions with characteristic traffic patterns and structural features. The selected areas span both developed and developing countries, covering well-planned urban cores and peripheral regions with complex traffic conditions. Specifically, we randomly sampled 5,000 representative trajectories from over 70,000 candidates, encompassing five typical cities such as Singapore, Los Angeles, Jakarta, and Beijing, which exhibit diverse road layouts, traffic densities, and functional distributions. Based on the trajectory centroids, we retrieved multi-scale remote sensing images via Google Earth Engine and the Google Maps Static API, using the Web Mercator projection and XYZ tiling scheme, and standardized each image to 512×512 pixels. Two zoom levels were adopted: Zoom 19 for capturing block-level details and Zoom 18 for depicting city-level road networks, thereby balancing local and global semantics. To ensure spatial alignment, multi-tile images were stitched and geometrically corrected to match trajectory extents. Image quality was assessed through a four-dimensional manual scoring system (readability, clarity, trajectory density, traffic structure representation) with scores ranging from 1 to 10. Images with trajectory drift or noise were rigorously excluded, resulting in 2,344 high-quality remote sensing images for subsequent dialogue generation.

Table 1.
Overview of Remote Sensing Image Data Across Different Regions
| Region | Data Source | #Images | Zoom 18/19 | Avg. Score | Feature Description |
|---|---|---|---|---|---|
| Los Angeles | LocalCBD | 650 | 220 / 483 | 9 | Complex and clear traffic structure in the urban core, well-planned layout. |
| Singapore | Grab-Posisi | 1,000 | 492 / 386 | 9 | Efficient transport network and high-density buildings with excellent image structure. |
| Beijing | GeoLife | 300 | 168 / 79 | 6 | Sparse trajectory distribution; weak semantic expression and lower resolution in some areas. |
| Jakarta | Grab-Posisi | 350 | 145 / 183 | 6 | Incomplete road system with evident traffic congestion. |
| UCI Area | UCI | 316 | 95 / 93 | 8 | Clear image structure, suitable for studies on urban fringe and mixed-use areas. |
3.2.2. Multi-Dimensional Prompt Design and Multi-Turn Semantic Dialogue Generation
Given that fully manual image description writing is not only time-consuming and labor-intensive but also suffers from inconsistent styles, limiting the scale and stability of data quality, we adopt a “MLLM-assisted generation + expert refinement” strategy to construct multi-turn traffic semantic dialogues. We first design a library of multi-dimensional prompts covering key elements such as road structure, building distribution, functional zoning, terrain features, and transportation facilities, categorized into two semantic levels based on cognitive depth. Basic semantic prompts (70% probability) focus on static spatial feature recognition and vision–language alignment, such as road network morphology, building density, and topographic characteristics. Reasoning-oriented prompts (30% probability) emphasize logical inference on road connectivity, zoning patterns, and spatial organization, aligning with urban traffic planning and evaluation tasks.
For each image, the first-turn dialogue is generated by randomly selecting one of these prompt types to guide GPT-4 in producing structured image descriptions, covering road morphology, building layout, terrain, and traffic nodes, with moderate incorporation of spatial reasoning. Building on this, the second-turn dialogue is probabilistically triggered (75%) using task-oriented question templates focusing on practical planning and reasoning scenarios, such as congestion bottleneck analysis, road optimization, traffic flow evaluation, or public transit improvement. GPT-4 then generates concise yet logically rigorous responses by leveraging both the image and the first-turn description. Finally, all dialogues—comprising the image, first-turn description, and second-turn question–answer pairs—are formatted according to the LLaVA-OneVision schema, yielding structured samples suitable for multimodal semantic understanding and reasoning tasks.
3.2.3. Manual Review and Quality Control
Even advanced large multimodal models such as GPT-4V may produce inaccurate descriptions or semantic hallucinations in remote sensing image generation tasks. To ensure semantic validity and task relevance, five experts and graduate researchers in transportation and remote sensing conducted systematic revisions of the model-generated descriptions and answers. The revision process prioritized semantic accuracy, structural clarity, and logical consistency, while following a “reasonable inference tolerance” principle—retaining plausible inferences grounded in urban logic even if not explicitly observable in the imagery. This approach enhances the model’s robustness and generalization in open-domain urban reasoning. Through this pipeline, we curated a total of 2,344 high-quality multi-turn remote sensing dialogue samples, comprising 200 expert-annotated examples and 2,144 semi-automatically generated samples refined through manual review.
3.2.4. Visualization of Data Quality
To intuitively demonstrate the quality and semantic richness of the constructed dataset, Figure 2 presents a comparative visualization of trajectory-aligned remote sensing images and their corresponding semantic dialogues. The comparison includes four representative semantic description datasets for remote sensing imagery: UCM-Captions, Sydney-Captions, RSICap, and RSI-Traffic (ours). Among them, UCM-Captions and Sydney-Captions mainly provide brief static factual statements, lacking structured expression and semantic hierarchy, which limits their ability to capture deeper insights such as traffic patterns and functional zoning. Although RSICap offers more detailed scene descriptions, it primarily focuses on object counting and positional listing, with insufficient characterization of traffic network structures and functional semantics. In contrast, RSI-Traffic (ours) not only comprehensively describes static features such as road structures, traffic hierarchies, and building layouts, but also integrates inferential portrayals of functional zoning, relative spatial relations, and traffic flow characteristics, fully highlighting RSI-Traffic’s advantages in enhancing semantic depth and traffic understanding capabilities.
It is noteworthy that the inherent complexity and uncertainty of urban structures in remote sensing imagery may lead to speculative semantics (e.g., functional zoning assumptions or intersection type misclassifications). Such phenomena reflect common challenges in remote sensing interpretation and highlight the necessity of multimodal reasoning models. Future work may integrate external information sources (e.g., POI data, street-view imagery) or guided dialogue strategies to further improve semantic certainty and modeling precision.
3.3. Statistical Analysis of RSI-Instruct and RSI-Traffic
We conducted a joint statistical analysis of two remote sensing instruction datasets—RSI-Instruct and RSI-Traffic—to comprehensively characterize their overall data properties. As shown in Figure 3(a), we plotted the probability density function (PDF) of caption length in terms of tokens. The distribution approximately follows a slightly right-skewed normal shape, with most captions falling within the range of 50 to 80 tokens, indicating consistency and sufficiency in caption length. Figure 3(b) presents the probability density distribution of the number of sentences per caption. We employed Kernel Density Estimation (KDE) to generate a smooth and continuous density curve, which better captures the underlying structure of the data. The results show that most captions contain 3 to 6 sentences, peaking around the fourth sentence, with the maximum reaching 15 sentences. The average number of sentences per caption is 5.02, reflecting not only high semantic density but also well-structured syntactic organization. Figure 3(c) summarizes key statistical indicators of the dataset. The total number of images is 4,929, with 2,585 from RSI-Instruct and 2,344 from RSI-Traffic. Overall, the dataset comprises 592,765 tokens and 47,798 sentences, with an average of 2.86 sentences per response and an average caption length of 67.45 tokens (corresponding to 5.02 sentences). Additionally, the average number of dialogue turns per image is 1.7, and 8.53% (200 out of 2,344) of the captions are annotated by domain experts, indicating a notable level of expert involvement. These statistical results highlight the high information density and structured language patterns found in the RSI-Instruct and RSI-Traffic datasets. Such characteristics offer fine-grained supervision signals for multimodal models, enabling a progressive transition from general remote sensing semantic perception to trajectory-level semantic understanding and traffic scene reasoning, thereby enhancing task-specific reasoning and representational capacity.
4. Method
4.1. Problem Statement
This study aims to develop a multimodal large language model for remote sensing trajectory–traffic semantic understanding. Let the input remote sensing image be represented as
where W and H denote the image width and height, and C the number of channels. The proposed model focuses on advancing trajectory–traffic semantic understanding to better capture urban mobility patterns and traffic structures, while also improving performance in downstream tasks such as Remote Sensing Image Captioning (RSIC) and Remote Sensing Visual Question Answering (RSVQA). Specifically, given an input image , the model produces descriptions and Q&A pairs for trajectory–traffic scenes, supporting deeper understanding of urban traffic structures and patterns.
Based on the complementary integration of visual semantics and trajectory spatiotemporal features, the model produces a set of structured semantic representations:
where each semantic unit effectively summarizes the semantic information of traffic scenes and trajectories, supporting improved reasoning and recognition in trajectory-related downstream tasks.
4.2. Overall Workflow
Our proposed framework follows a three-stage workflow, as illustrated in Figure 4.
(1) Dataset Construction. We first construct two instruction datasets to support remote sensing instruction understanding and trajectory–traffic reasoning. RSI-Instruct provides general-purpose remote sensing image understanding across diverse scenes and tasks, while RSI-Traffic is designed for trajectory semantics and traffic scene reasoning, incorporating high-resolution imagery to capture detailed urban spatial layouts and traffic structures.
(2) Two-Stage Fine-Tuning of MM-RSTraj. Based on these datasets, we perform a two-stage fine-tuning process to build MM-RSTraj, a multimodal large model for trajectory–traffic understanding. The model adopts the LLaVA-OneVision architecture as its backbone, built on its pre-training foundation. LLaVA-OneVision integrates the Higher AnyRes with Bilinear Interpolation strategy, which improves the handling of high-resolution and detail-sensitive inputs. This process facilitates cross-modal interaction and semantic representation learning for trajectory–traffic scenarios.
(3) Downstream Applications. We evaluate MM-RSTraj on trajectory–traffic semantic evaluation tasks, as well as standard benchmarks including Remote Sensing Image Captioning (RSIC) and Remote Sensing Visual Question Answering (RSVQA). In addition, we demonstrate an exploratory application that employs the visual encoder of MM-RSTraj to extract high-level semantic representations from remote sensing imagery. These representations are fused with spatio-temporal features from a trajectory model, forming a joint feature space for spatio-temporal–semantic reasoning in traffic analysis and supporting broader multimodal research in urban mobility.
4.3. Network Structure
The proposed MM-RSTraj model is built upon the LLaVA-OneVision [66] framework, inheriting its concise yet highly scalable design, fully leveraging the pre-trained capabilities of both the LLM and the vision encoder, and further optimizing performance through a two-stage fine-tuning process. As the latest open-source version in the LLaVA series, LLaVA-OneVision introduces high-resolution feature extraction and hierarchical cross-modal alignment mechanisms, significantly enhancing visual semantic understanding and multi-task transfer capabilities while maintaining efficient inference. These characteristics fit well with our high-resolution datasets RSI-Instruct and RSI-Traffic. The architecture of MM-RSTraj consists of three key components, as illustrated in Figure 5, and is refined through a two-stage fine-tuning process to strengthen cross-modal interaction and semantic representation capabilities.
4.3.1. Vision Encoder
We adopt SigLIP [90] as the vision encoder, serving as the core visual processing module of the MM-RSTraj model. Compared with the traditional CLIP, SigLIP employs a sigmoid loss function, which provides more stable performance across varying batch sizes, making it particularly suitable for large-scale training scenarios. In addition, SigLIP supports high-resolution input and demonstrates strong zero-shot capabilities, making it especially effective for detailed analysis of remote sensing trajectory and traffic scenarios, where it can accurately capture fine-grained information such as traffic structures and trajectory semantic features. The input remote sensing image is processed by this encoder to produce visual features , where denotes the encoding function parameterized by . SigLIP employs a patch size of and leverages grid features both before and after the final Transformer layer, thereby enhancing the representation of spatial patterns and laying a solid foundation for subsequent cross-modal tasks.
4.3.2. Projector
We employ a customized 2-layer MLP [91] (parameterized by ) as the projection layer, which transforms the visual features into a sequence of visual tokens aligned with the word embedding space of the large language model. This concise two-layer MLP structure achieves effective modality alignment while maintaining low computational cost, thereby facilitating deep fusion of visual and linguistic information. Compared with Q-Former-based approaches, such as BLIP-2, which use learnable query tokens to compress visual tokens for cross-modal interaction, the MLP-based design directly maps features to bridge the modality gap, offering a simpler architecture with higher computational efficiency—a design widely adopted in models like the LLaVA series.
4.3.3. LLM
We adopt Qwen-2.5 [92] as the language model , parameterized by , replacing the Qwen-2 used in the original architecture to improve language modeling and multimodal alignment. Compared with Qwen-2, Qwen-2.5 introduces several notable improvements. Its context length is extended from 32,768 tokens to 128,000 tokens, approximately four times longer, which effectively reduces information truncation and significantly improves semantic continuity when processing long-sequence remote sensing image descriptions or multi-turn dialogues. Through additional training for vision–language alignment, Qwen-2.5 achieves better synergy with vision encoders such as SigLIP, thereby enhancing performance on multimodal tasks. Moreover, the model incorporates domain-specific terminology for remote sensing and supports multiple languages, including Chinese transportation-related terms, while improving performance in low-resource languages, enabling the generation of outputs adapted to domain-specific requirements.
4.3.4. Higher AnyRes with Bilinear Interpolation
Higher AnyRes with Bilinear Interpolation is integrated into the MM-RSTraj model to optimize visual input representation, achieving a balance between performance and computational efficiency when processing high-resolution remote sensing images. This method can handle remote sensing images with varying high resolutions. It divides the input image into patches (crops), with each crop processed at a resolution compatible with the SigLIP encoder, while retaining a “base image” (global view) as the global feature input. The total number of visual tokens is calculated as
where T is the number of tokens for each crop (and the base image), determined by the SigLIP input size and patch size. When , a threshold is applied to adjust the token number per crop, reducing it via bilinear interpolation to
where is empirically set to 2000 in our experiments, balancing fine-grained feature capture and computational cost. The values of a and b are determined by the resolution of the input image and the desired grid partition, ranging from 1 to 6, allowing up to crops. For single-image scenarios, larger configurations with higher token allocations can simulate video-style representations, facilitating capability transfer to multi-image and video tasks, which aligns with the diverse instructions in RSI-Instruct.
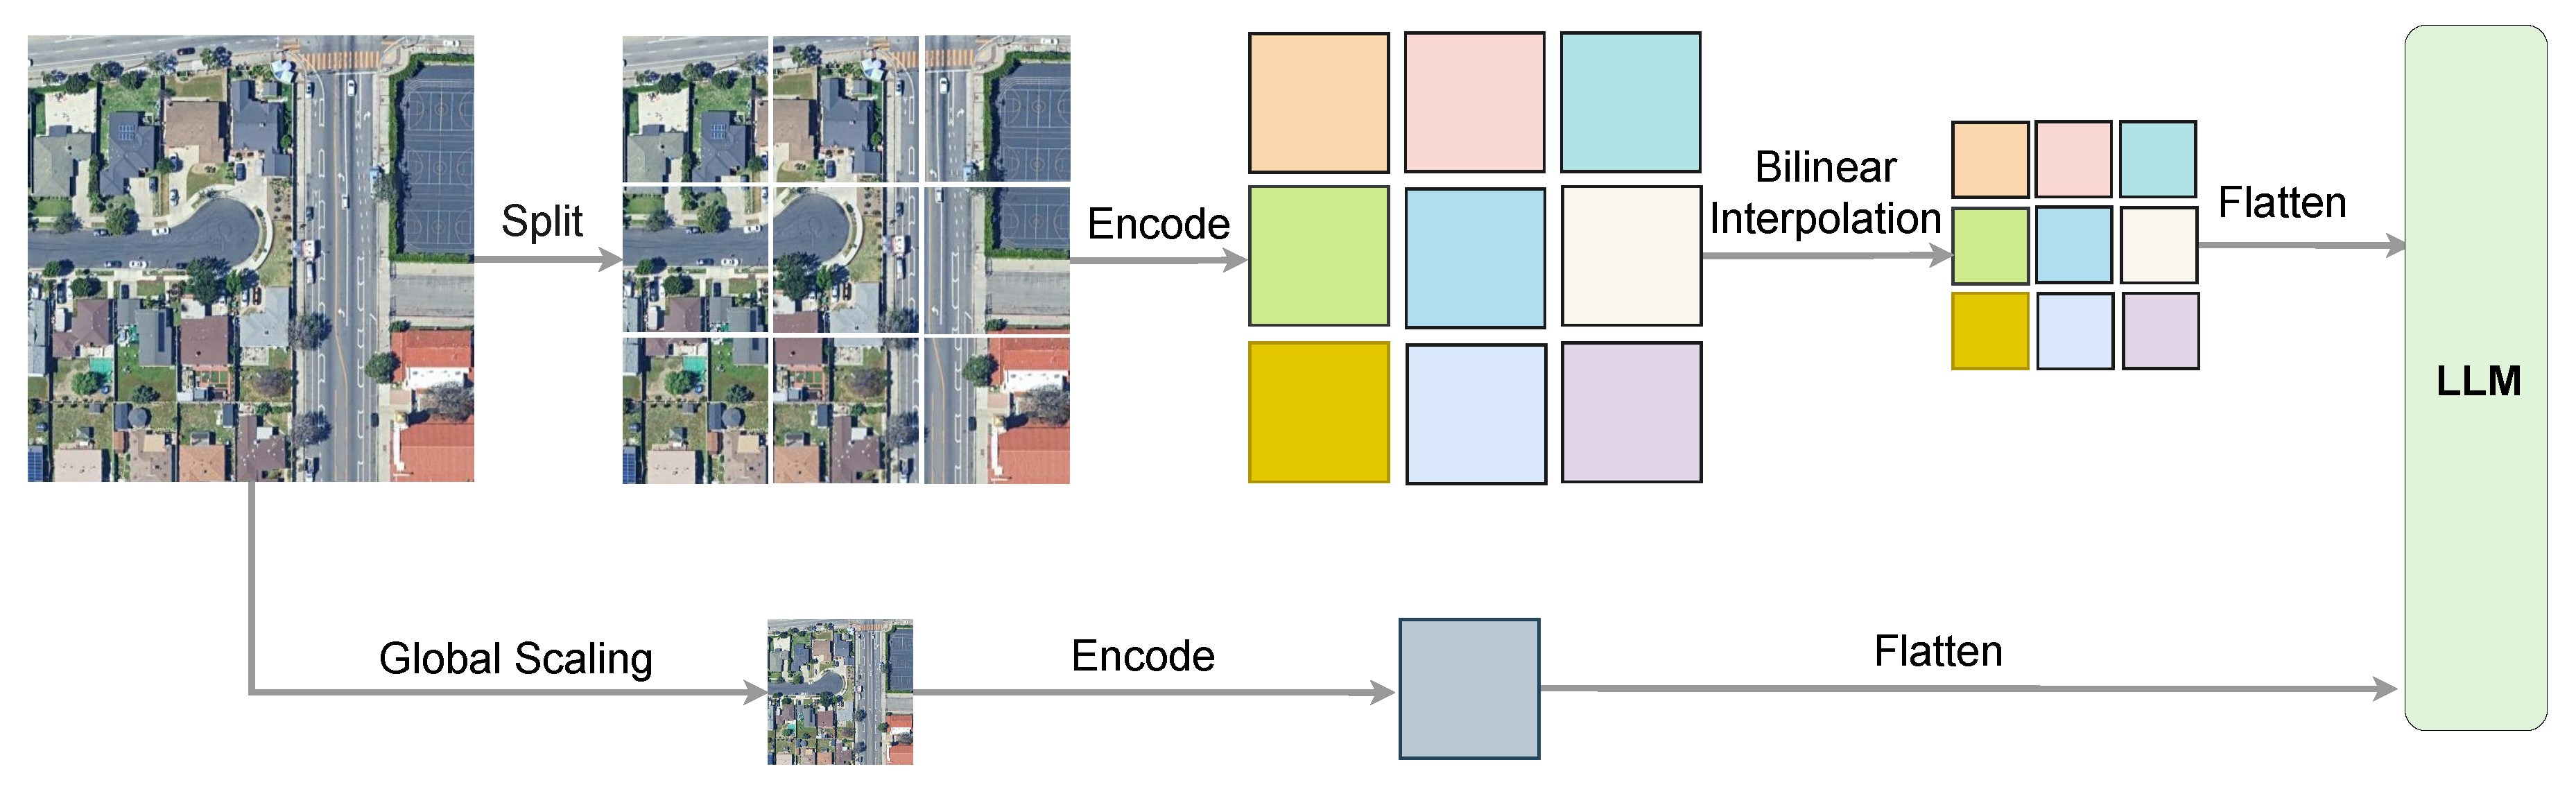
Figure 6.
Higher AnyRes with Bilinear Interpolation in MM-RSTraj encodes cropped and global views of high-resolution remote sensing images with SigLIP, using bilinear interpolation to balance detail and efficiency.
Figure 6.
Higher AnyRes with Bilinear Interpolation in MM-RSTraj encodes cropped and global views of high-resolution remote sensing images with SigLIP, using bilinear interpolation to balance detail and efficiency.
4.4. Training Strategy
Multimodal large language models (MLLMs) typically adopt the paradigm of multimodal pre-training (MM-PT) and multimodal instruction tuning (MM-IT) [62,93]. In the MM-PT stage, large-scale image–text data are used for cross-modal alignment and representation learning; in the MM-IT stage, the model is trained on human-annotated or synthetic instruction–response pairs, enabling it to follow natural language instructions and perform multiple tasks.
Our MM-RSTraj model inherits the backbone of LLaVA-OneVision [66], which has undergone extensive pre-training and visual instruction tuning on large-scale, high-quality datasets, including general-domain image–text pairs, carefully curated knowledge corpora, and diverse visual instruction data. Leveraging these training processes, LLaVA-OneVision demonstrates strong generalization ability in high-resolution understanding, fine-grained reasoning, and domain transfer, making it highly suitable for our remote sensing trajectory–traffic semantic understanding tasks.
To further adapt the model to domain-specific requirements, we conduct two-stage instruction fine-tuning on the RSI-Instruct and RSI-Traffic datasets. Since Qwen-2.5 already provides strong language modeling capacity for remote sensing and trajectory–traffic semantics, we freeze its parameters and fine-tune the vision encoder (SigLIP) and the projector. This strategy preserves the language modeling capacity of Qwen-2.5, while adapting the visual pathway to better align remote sensing and trajectory semantics with the LLM, thereby improving domain-specific responses in high-resolution, traffic-oriented scenarios.
Full-parameter fine-tuning of the entire model would involve an extremely large number of trainable parameters and incur prohibitively high computational costs. Therefore, we adopt the Low-Rank Adaptation (LoRA) method [94], injecting trainable low-rank matrices into the vision encoder and projector. LoRA significantly reduces the number of trainable parameters while retaining most of the original model’s representational capacity, enabling efficient adaptation to our specialized datasets without sacrificing performance.
5. Experiments
In this section, we evaluate the capabilities of the MM-RSTraj model, with the evaluation divided into two main parts. The first part focuses on assessing the model’s ability to understand general spatial semantics in remote sensing images, specifically tested through the tasks of Remote Sensing Image Captioning (RSIC) and Remote Sensing Visual Question Answering (RSVQA). The second part evaluates the model’s ability to understand and reason about complex trajectory semantics and traffic scenarios, particularly how the model infers traffic flow, urban planning, and potential transportation patterns by analyzing the spatial and functional structure of urban environments.
5.1. Implementation Details
The training process was conducted on 8 NVIDIA A100 GPUs, each equipped with 40GB of memory, and the model was fine-tuned for 3 epochs. The batch size per device was set to 1, with a gradient accumulation step of 1, resulting in an effective batch size of 8 across the 8 GPUs. We used the AdamW optimizer with parameters set to , , and a weight decay of 0.0. The initial learning rate was set to , with a warm-up phase (warmup ratio = 0.03) applied at 3% of the training steps, followed by a cosine decay schedule to gradually reduce the learning rate. Additionally, the learning rate for the vision tower was set to , and the learning rate for the multimodal projector was set to . To improve training efficiency, we enabled LoRA with a rank of 8 and an alpha value of 16, applying it to multimodal components including the vision tower and the projector. During training, mixed precision training with BF16 and TF32 was employed, combined with gradient checkpointing to manage GPU memory usage. The training configuration also included using DeepSpeed’s zero3 optimization strategy, and acceleration of Torch compilation was achieved using the "inductor" backend. To optimize memory usage, we employed lazy loading for data preprocessing.
5.2. Evaluation Metrics For RSIC
For the Remote Sensing Image Captioning (RSIC) task, we evaluate the model’s performance using the following seven metrics, each providing a different perspective on the quality of the generated captions.
BLEU-1 to BLEU-4 measure the precision of n-grams between the generated and reference captions. BLEU-1 evaluates unigram precision, while higher n-grams (BLEU-2, BLEU-3, and BLEU-4) assess bi-gram, tri-gram, and four-gram overlap, providing a more detailed evaluation of caption quality.
METEOR evaluates both precision and recall, considering exact word matches, synonyms, and word order, allowing for flexibility in comparing generated captions to human descriptions. It balances exact matches with semantic variations, making it useful for diverse expression tasks.
ROUGE-L measures the longest common subsequence (LCS) between the generated and reference captions, focusing on recall and rewarding captions that preserve key elements and structure, even if they do not match exactly.
CIDEr evaluates the consensus of n-grams between the generated and reference captions, giving more weight to frequent n-grams in human descriptions. It rewards captions that align closely with human-generated descriptions, making it effective for descriptive tasks.
5.3. General Semantic Evaluation for Remote Sensing
To validate the capability of our proposed MM-RSTraj model in general remote sensing spatial semantic perception, we conduct evaluations on two tasks: Remote Sensing Image Captioning (RSIC) and Remote Sensing Visual Question Answering (RSVQA).
5.3.1. RSIC Task on RSIEval
We first conducted experiments on the RSIEval dataset to evaluate the performance of the proposed model in the Remote Sensing Image Captioning (RSIC) task. The comparison models include several representative multimodal large models, including BLIP2-13B [67], MiniGPT4-13B [68], InstructBLIP-13B [80], RSGPT-13B [44], and two versions of RS-MoE (1B and 7B) [73]. Notably, RSGPT and the two versions of RS-MoE are specifically designed and optimized for general remote sensing tasks, which are optimized for remote sensing image understanding and generation. In contrast, our MM-RSTraj model emphasizes trajectory traffic semantic understanding within remote sensing contexts. To ensure consistency in the experimental setup, we adopted the training and evaluation settings publicly available from the RS-MoE work and reported the performance results of the comparison models under the same conditions. For evaluation, we employed commonly used image captioning metrics such as BLEU-1 to BLEU-4, METEOR, ROUGE-L, and CIDEr.
Results. From Table 2, it can be seen that the performance of MM-RSTraj-7B is comparable to some models, such as BLIP2-13B and InstructBLIP-13B. In metrics such as BLEU-1 and METEOR, its scores are comparable to MiniGPT4-13B, indicating advantages in language fluency and diversity. However, MM-RSTraj-7B still exhibits a noticeable performance gap compared to more specialized remote sensing models such as RSGPT-13B and RS-MoE-7B. For example, in BLEU-1 and CIDEr scores, MM-RSTraj-7B achieved scores of 69.64 and 131.17, whereas RSGPT-13B scored 77.05 and 149.32, and RS-MoE-7B scored 82.13 and 158.36. This suggests that RSGPT-13B and RS-MoE produce outputs more closely aligned with general remote sensing semantics, particularly matching the descriptive style expected in the RSIEval dataset. This result aligns with our expectations, and we will further analyze the reasons for this performance gap in the subsequent sections.
Interestingly, the smaller version, MM-RSTraj-0.5B, performs similarly to RS-MoE-1B and even outperforms RS-MoE-1B in certain metrics, especially in CIDEr, where MM-RSTraj-0.5B achieves higher scores. This indicates that, despite its smaller scale, MM-RSTraj-0.5B is able to better align with human-generated descriptions, resulting in higher CIDEr scores. Furthermore, MM-RSTraj-0.5B outperforms BLIP2-13B in some metrics, demonstrating that it can match or even surpass larger models in some metrics. Especially in resource-limited practical application scenarios, MM-RSTraj-0.5B offers higher computational efficiency and faster response times, making it ideal for deployment in environments with limited devices or high real-time requirements.
Analysis. Our model did not achieve the best scores in the RSIC task on the RSIEval dataset, which was expected for the following reasons:
First, the compared models, especially RS-MoE and RSGPT, benefited from the fact that their training data or annotation style is highly consistent with the RSIEval validation set. In particular, RSGPT was trained on the manually curated RSICap dataset, which directly corresponds to RSIEval as its validation set. This close alignment in data origin and style naturally gives RSGPT a clear advantage on RSIEval. Meanwhile, RS-MoE leverages a mixture-of-experts architecture, which enhances its capacity to specialize across diverse sub-tasks. Combined with training data that also follows styles similar to RSIEval, RS-MoE is able to achieve strong performance on this benchmark.
In contrast, our model employed a two-stage fine-tuning process. The first stage utilized the RSI-Instruct dataset for general remote sensing semantic perception training. This dataset was primarily used for remote sensing image captioning tasks, and incorporated reasoning tasks in multi-turn dialogues (e.g., querying the number of items or the relative position of objects, i.e., the RSVQA task). The diversity and non-specialization of these tasks contributed to the model’s relatively lower performance in the RSIC task compared to models specifically designed for this task. In the second stage of fine-tuning, we gradually transitioned the model from general remote sensing semantic perception to trajectory semantic understanding and traffic scene reasoning, leading to significant improvements in these specific tasks. However, this optimization weakened the model’s performance in the RSIC task, as the model was more oriented toward trajectory and traffic reasoning rather than general remote sensing semantic understanding. Therefore, while our model’s score in the RSIC task was relatively low, comparisons with BLIP2 and InstructBLIP indicate that our model still excels in general remote sensing semantic perception, albeit with limitations compared to models optimized for the RSIC task.
Moreover, most of the samples in the RSIEval dataset involve trajectory, traffic, and urban scenarios, where the ground truth is more inclined toward static descriptions, whereas our generated descriptions are more focused on trajectory semantic understanding and traffic scene reasoning. This discrepancy led to differences between our generated descriptions and static descriptions, as can be observed in the results of Figure 7. Despite this, our generated results remain plausible and consistent with the requirements of trajectory semantic understanding and traffic scene reasoning, which explains the lower scores.
Lastly, we found that the performance improvement from MM-RSTraj-0.5B to MM-RSTraj-7B was not as large as the improvement seen in RS-MoE from 1B to 7B. We believe this is due to our second-stage fine-tuning placing more emphasis on trajectory and traffic semantic understanding, which further enhanced the 7B version’s capabilities in this area. However, this also led to a weakening of its performance in general remote sensing semantics. Consequently, MM-RSTraj-7B performed lower than models specifically optimized for general remote sensing tasks but demonstrated stronger abilities in trajectory semantic understanding and traffic scene reasoning.
Visual Comparison. To provide a more intuitive comparison between our model and existing approaches in the task of remote sensing image description, we directly adopted the example images used in the RS-MoE work and presented the generated captions from different models in Figure 7. These images are sourced from the RSIEval dataset. One depicts an industrial area centered on storage tanks and related facilities, emphasizing static spatial layouts. The other shows a suburban community with roads and residential areas, which is more relevant to trajectory semantic understanding and traffic reasoning.
In the generated results for these two representative images, different models exhibit their own characteristics and limitations: BLIP2 tends to produce simplified results that capture only the core elements of the scene. InstructBLIP incorporates more details, such as roads, swimming pools, and vegetation, which makes the descriptions richer, though occasionally verbose. RSGPT and RS-MoE demonstrate stronger performance in detail depiction, with RS-MoE in particular able to enumerate the number of swimming pools and provide a clear layout in the suburban community image, though its overemphasis on enumerating static elements may overlook complex semantic structures and potential reasoning relations.
In contrast, MM-RSTraj captures both static spatial structures and higher-level semantic relations. In the industrial area, it identifies the spatial distribution of storage tanks, roads and supporting facilities, while also inferring the functional organization and traffic connections of the region. In the suburban community, it depicts the distribution of houses and roads while integrating traffic flows, functional zones, and relative positional semantics, thereby producing descriptions with clearer task orientation and stronger reasoning value.
5.3.2. RSIC Task on UCM-Captions
To further evaluate the generalization ability of the model in cross-dataset scenarios, we conducted experiments on the UCM-Captions dataset. UCM-Captions is derived from the University of California Merced land-use dataset and contains 2,100 images covering 21 scene categories, accompanied by 10,500 human-annotated descriptions, making it a classic benchmark for remote sensing image captioning. In the comparative experiments, we selected two categories of representative models: one includes traditional deep learning methods based on convolutional networks and attention mechanisms; the other consists of multimodal large models (VLMs), such as RS-CapRet, RSGPT, and RS-LLaVA, which have been increasingly introduced into the remote sensing domain. It is important to note that our model was only fine-tuned on the proposed RSI-Instruct and RSI-Traffic datasets through a two-stage process, without any additional adaptation on UCM-Captions.
From Table 3, it can be seen that different methods demonstrate distinct advantages on the UCM-Captions dataset. RS-MoE excels in BLEU-1/2 and METEOR, highlighting its strong ability in lexical diversity and semantic alignment. In contrast, RS-LLaVA-13B (CLIP336-Vicuna13B) leads in BLEU-3/4 and ROUGE-L, which can be attributed to the inclusion of UCM-Captions in its training data, thereby aligning well with sentence-level structure and long-text consistency in the test set. In comparison, our MM-RSTraj model shows a performance trend closer to RS-MoE: while slightly lower in the BLEU series, it achieves the best CIDEr score, indicating stronger advantages in content richness and semantic coverage. It is noteworthy that MM-RSTraj performs better on UCM-Captions than on RSIEval. The main reason is that RSIEval contains a high proportion of trajectory and traffic semantics, while our model tends to emphasize such semantics during generation, resulting in certain performance limitations. In contrast, UCM-Captions covers a broader range of mid-level scene categories, where traffic-related semantics are less dominant. This allows the two-stage fine-tuning on RSI-Instruct and RSI-Traffic to generalize more effectively, yielding more balanced and comprehensive performance.
Visual Comparison. To further compare the differences in semantic expression and detail depiction, we selected two remote sensing images from the UCM-Captions dataset that are consistent with those used in the RS-MoE study (as shown in Figure 8) and compared the generated results of RS-MoE and MM-RSTraj.
For the first residential-area image, RS-MoE captures the main elements but shows redundancy and inconsistency in the details. For example, the swimming pool is described twice with different positions and expressions, which causes semantic ambiguity. In contrast, MM-RSTraj produces more concise and coherent descriptions, avoiding redundancy and more clearly presenting the spatial relationships among houses, parking lots, and greenery. For the second airport image, RS-MoE successfully describes the key elements such as the airplane, terminal, and surrounding facilities, while MM-RSTraj demonstrates a clearer and more structured expression. It not only accurately distinguishes the functional roles of the airplane, boarding gate, and ground vehicles but also emphasizes the orderly traffic flow, thus demonstrating higher precision in scene understanding and stronger semantic organization.
5.3.3. RSVQA Task on RSIEval
To further evaluate the performance of our model in general remote sensing semantic understanding and its generalization ability, we conducted an evaluation of the remote sensing image visual question answering (VQA) task on the RSIEval test set. The RSIEval test set contains 936 questions, covering 10 categories, including presence, quantity, color, absolute position, relative position, area comparison, road direction, image, scene, and reasoning. The first seven categories primarily involve object-level content, while the latter three focus on image-level, scene-level, and reasoning-level questions. For comprehensive comparison, experiments were conducted with models such as BLIP2, MiniGPT4, InstructBLIP, RSGPT, and RS-MoE, all of which were trained on the RSICap dataset, and the accuracy was computed for each question type. It is noteworthy that our MM-RSTraj model was not additionally trained on the RSICap dataset but instead was trained based on our custom datasets through two-stage fine-tuning. During the evaluation, we used GPT-4 as the evaluation tool to compare the generated answers with the reference answers and calculate the accuracy for each question type. For the other comparison models, we referred to the publicly available experimental results based on the RSIEval dataset from existing literature.
As shown in Table 4, our proposed MM-RSTraj model demonstrates strong performance on the RSVQA test set of RSIEval. Specifically, it achieves the best results in 6 out of the 10 question categories, highlighting its superior capability in handling diverse question types. In particular, the model shows significant advantages in categories such as Presence, Color, Absolute Position, and Area Comparison. These improvements can be attributed to the adoption of SigLIP as the vision encoder, which provides high-resolution input support, stable training with sigmoid loss, and strong zero-shot capabilities. Combined with the Higher AnyRes strategy with bilinear interpolation, the model is able to capture fine-grained spatial structures and semantic features more effectively, thereby excelling in tasks that require detailed semantic alignment.
We also observe that most models, including ours, perform poorly on the Road Direction category, with the exception of RSGPT. Further analysis reveals that this weakness is partly due to annotation style. For instance, when asked ”What is the direction of the road in the picture?”, the ground truth was annotated as ”North-south”, while our model answered ”The road runs vertically through the center of the image, dividing it into two sections.” Although semantically equivalent, this answer was marked as incorrect, underestimating the true capacity of the model. In addition, our model shows a noticeable gap in the Image category compared to strong baselines such as RS-MoE and RSGPT. This discrepancy stems from the fact that our fine-tuning datasets did not explicitly encourage the model to differentiate between attributes such as color type (e.g., color vs. panchromatic) or image resolution (e.g., high vs. low). we suggest that this category involves inherent ambiguity, as the definition of ”image type” is not consistently constrained, and thus results on this metric should be interpreted cautiously.
Visual Comparison. To provide a more intuitive comparison of the model’s performance on the RSVQA task, we adopted the visualization paradigm from RSGPT [44] and selected three representative remote sensing images from the RSIEval dataset, covering three categories: Presence, Quantity, and Reasoning, as shown in Figure 9. The results indicate that BLIP2 and MiniGPT4 show clear deficiencies in answering basic questions, while RSGPT provides correct answers in most cases. In contrast, our MM-RSTraj model demonstrates a stronger ability to address all three types of questions with greater detail and contextual understanding. Specifically, for the Presence questions, our model not only identifies the existence of objects but also provides their spatial location within the image. For Quantity questions, it correctly identifies the number of objects and also describes their relationships with other scene elements, such as the connection to boarding bridges. In Reasoning questions, the model not only identifies partial visibility but also provides detailed explanations of the objects, referencing parts of the structures like roofs and sides.
Overall, both quantitative and qualitative evaluations indicate consistent improvements. These results highlight that MM-RSTraj excels in semantic completeness and reasoning ability, offering more structured and task-oriented answers compared to existing models. This further validates the effectiveness of our proposed two-stage fine-tuning strategy in enhancing the model’s semantic expression and spatial reasoning capabilities.
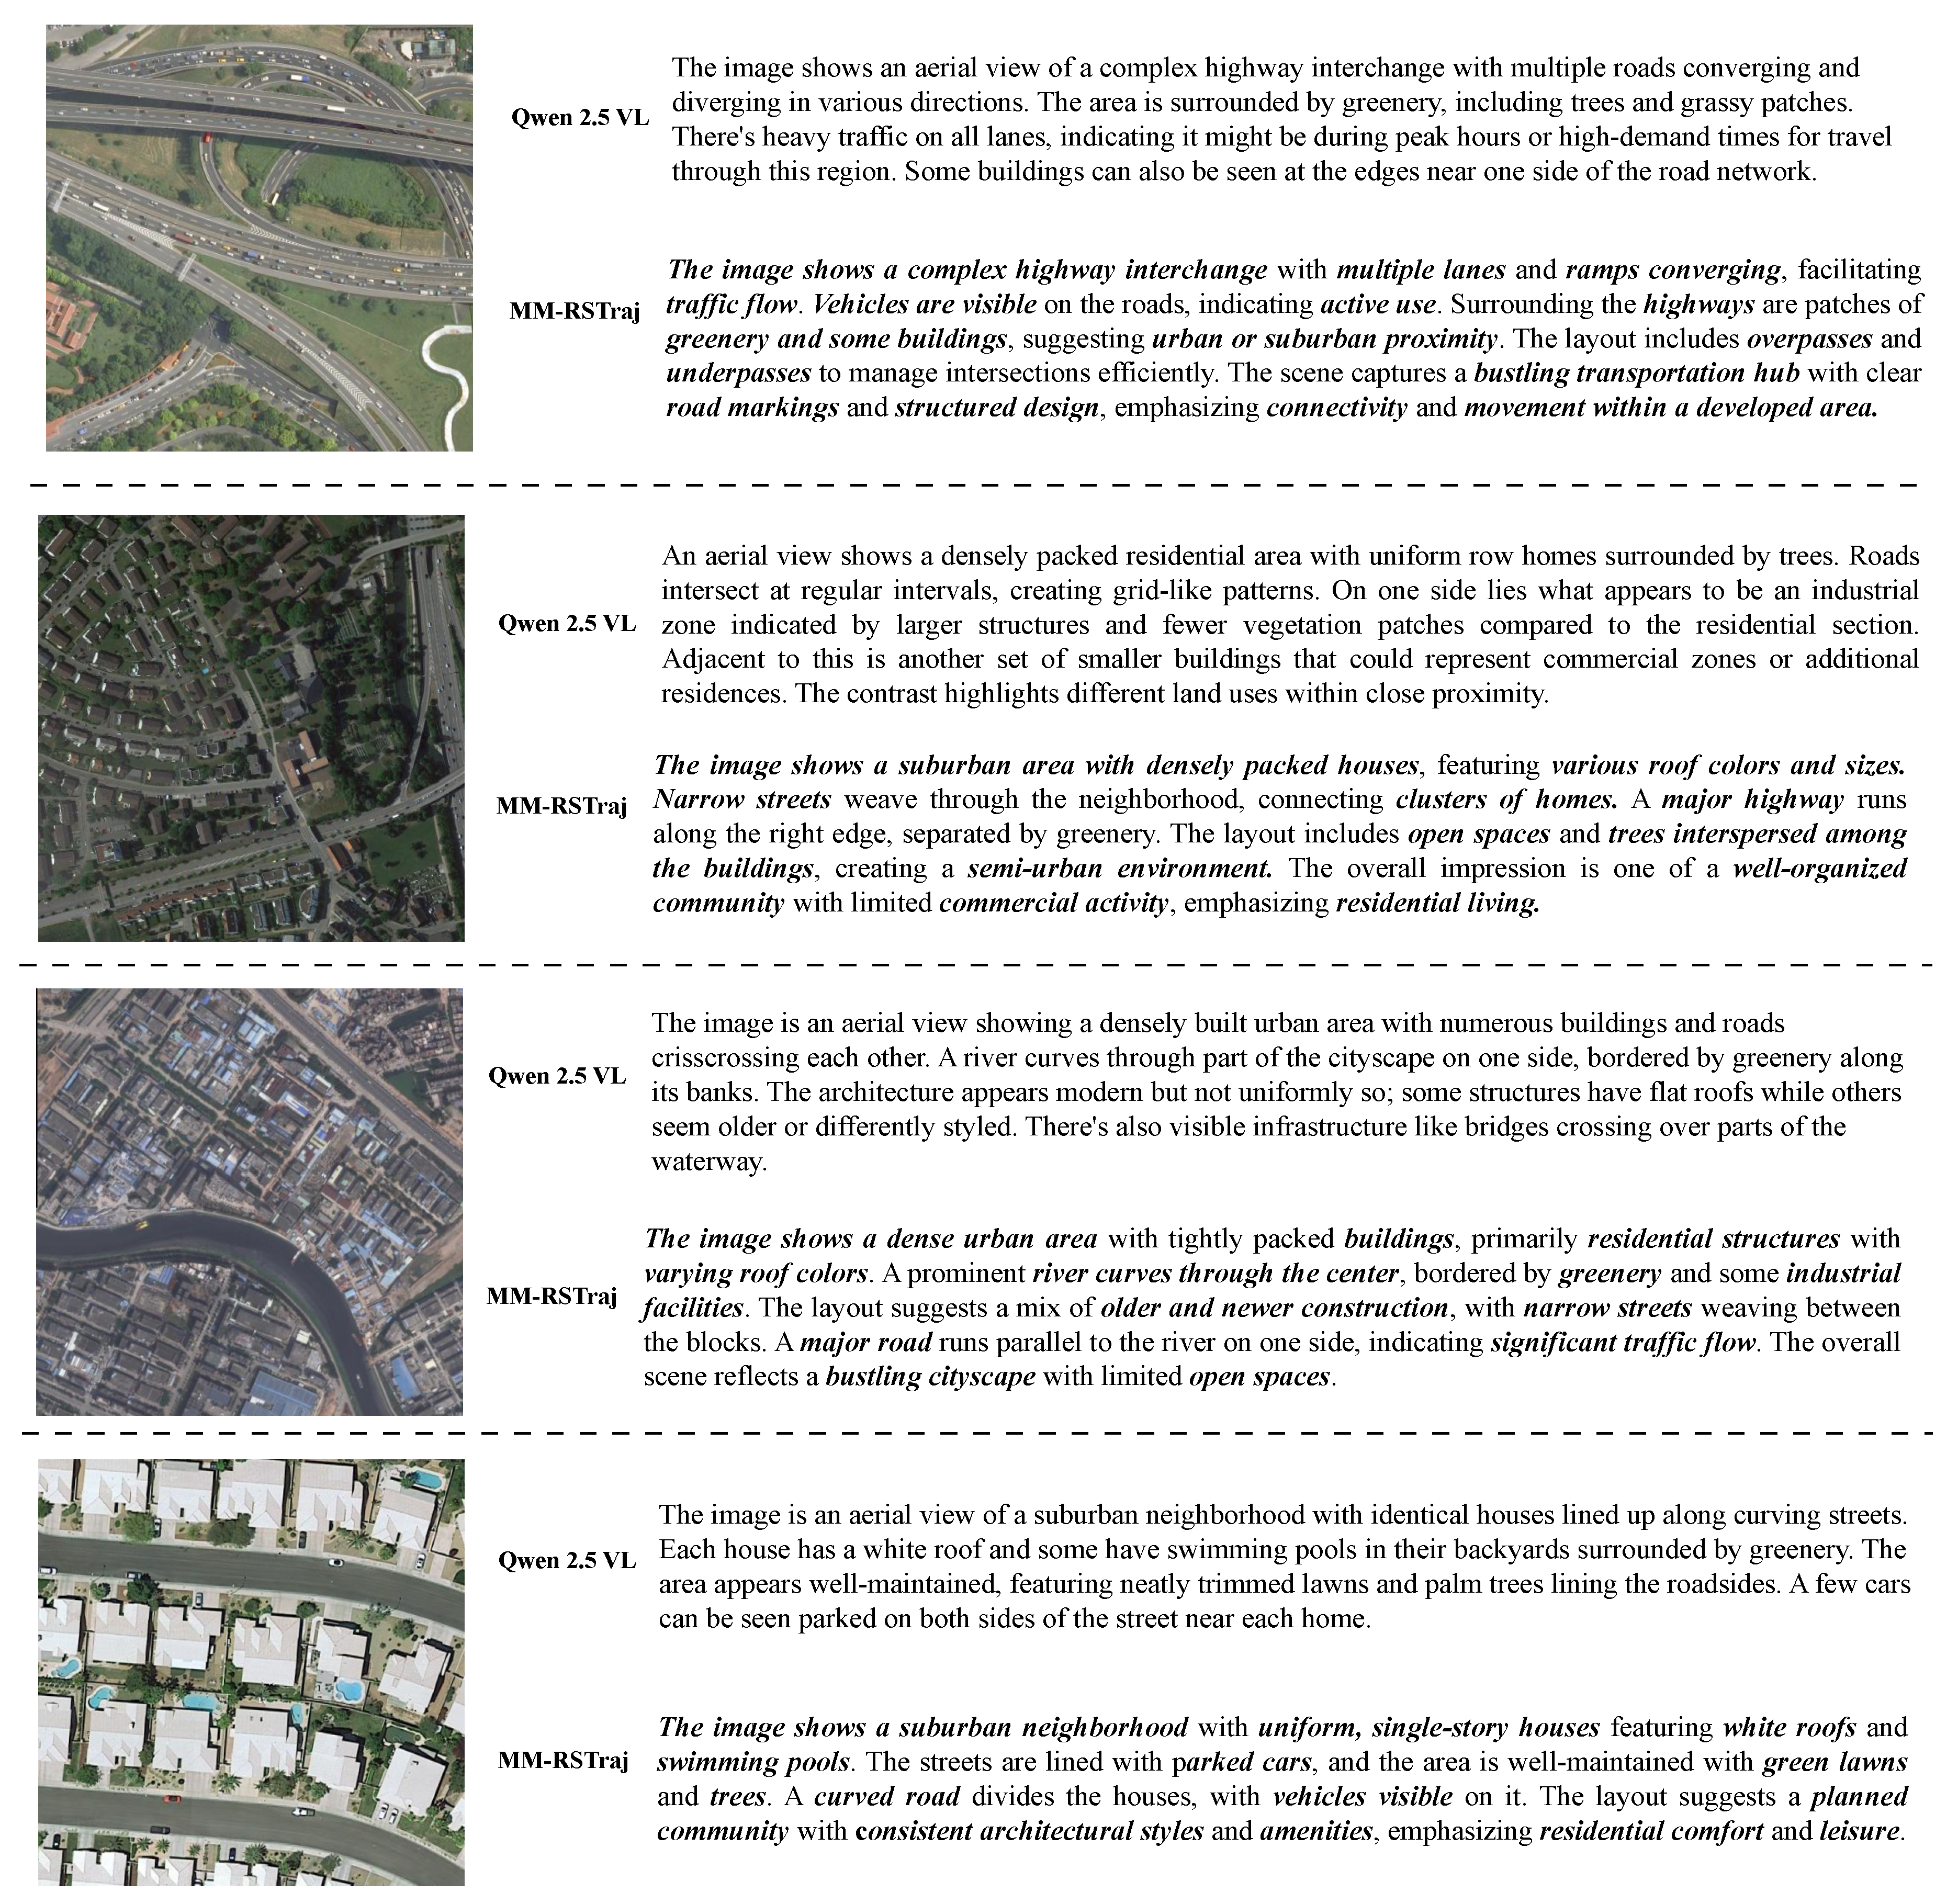
Figure 10.
Comparative visualization of MM-RSTraj and Qwen 2.5 VL outputs on four representative remote sensing images for trajectory traffic semantic understanding. The figure highlights MM-RSTraj’s superior detail in road structures, traffic bottlenecks, and flow dynamics, alongside its refined urban layout analysis, contrasting with Qwen 2.5 VL’s broader but less precise descriptions.
5.4. Trajectory Traffic Semantic Evaluation for Remote Sensing
To deeply evaluate the performance of the proposed MM-RSTraj model in remote sensing trajectory traffic semantic understanding, we face the challenge of the lack of standardized benchmarks and annotated datasets in this field. Currently, most existing datasets do not provide manual annotations for key elements in remote sensing images (such as road layout, functional zoning, traffic flow, etc.), making traditional quantitative evaluation methods not directly applicable. Given this context, we adopted a qualitative evaluation approach by randomly selecting images and comparing the model’s generated results with those of a commercial multimodal large model to intuitively assess the performance of our model in remote sensing trajectory traffic tasks.
To verify the effectiveness of the MM-RSTraj model, we selected 45 images related to remote sensing trajectory traffic from the RSIEval dataset. These images cover traffic features such as road structure, traffic flow density, functional zone distribution, and include scenes such as urban roads, intersections, and high-traffic-density areas. Ultimately, we randomly selected 4 images from these as samples for demonstration. To ensure a fair and objective verification of our model’s performance, we decided not to compare it with remote sensing general-purpose models (such as RS-LLaVA, RSGPT, RS-MoE, etc.), which are primarily optimized for broader remote sensing tasks rather than trajectory traffic semantics. Additionally, considering the tight integration of the RSI-Instruct and RSI-Traffic datasets with the MM-RSTraj model, comparing it directly with general remote sensing models is not fully applicable. Therefore, we chose the commercial multimodal large model Qwen 2.5 VL for comparison. Qwen 2.5 VL, developed by Alibaba, possesses excellent image understanding capabilities and performs outstandingly in vision-language tasks. This model is capable of understanding traffic structures and functional zone distributions in remote sensing images, generating high-quality natural language descriptions, and processing remote sensing images, satellite data, and urban planning information.
In the experiment, we present the generated results of two models, MM-RSTraj and Qwen 2.5 VL, on 4 remote sensing images, focusing on their descriptions of road structure, traffic bottlenecks, traffic flow density, and functional zoning. By comparing the natural language descriptions generated by both models, we intuitively assess the advantages of MM-RSTraj in remote sensing trajectory traffic semantic understanding.
Results and Analysis. The experimental results are shown in Figure 9. Qwen 2.5 VL demonstrated strong image understanding capabilities, providing smooth and coherent natural language descriptions, particularly excelling in recognizing traffic structures and functional zoning. It can clearly depict the contrast between different areas (such as residential areas and industrial zones) and describe features such as road intersections. However, the analysis of Qwen 2.5 VL is relatively broad, especially in the analysis of traffic flow and complex traffic layouts, where it falls short in addressing key factors such as traffic bottlenecks and road connectivity. Moreover, Qwen 2.5 VL occasionally exhibits hallucinations in its generated descriptions, making inaccurate speculations in the absence of sufficient evidence. For example, it speculates that an area is an industrial zone, but the actual image does not provide clear support for this, leading to some bias in its analysis.
In contrast, MM-RSTraj demonstrates significant advantages in remote sensing trajectory traffic semantic understanding. MM-RSTraj not only provides detailed descriptions of road structures, traffic bottlenecks, and traffic flow density, but also analyzes the relationship between traffic flow and urban layout. For instance, in the analysis of a suburban residential area, MM-RSTraj accurately identifies the relationship between narrow streets and main highways, revealing the close connection between traffic flow and functional zoning. In the analysis of a highway interchange, MM-RSTraj further highlights key factors such as interchange design, traffic flow management, and road connectivity, offering a more refined understanding of traffic infrastructure. Through this detailed analysis, MM-RSTraj is able to present a more accurate depiction of various traffic features in complex traffic scenarios, demonstrating its potential for advancing remote sensing trajectory traffic analysis.
6. Conclusion
This paper presents a remote sensing–assisted trajectory semantic modeling framework and introduces MM-RSTraj, the first multimodal large language model (MLLM) tailored for remote sensing trajectory–traffic tasks. Built on the LLaVA-OneVision architecture with a two-stage fine-tuning strategy, MM-RSTraj enhances cross-modal interaction between high-resolution remote sensing imagery and trajectory features. To support this process, we constructed two complementary instruction datasets: RSI-Instruct, extending RSICap for general remote sensing semantics, and RSI-Traffic, designed for trajectory traffic semantic understanding with emphasis on road structures, urban layouts, and traffic flow. Extensive experiments demonstrate that MM-RSTraj achieves state-of-the-art performance in trajectory–traffic semantic evaluation, while also maintaining competitive results on general remote sensing tasks such as RSIC and RSVQA. Beyond quantitative improvements, MM-RSTraj demonstrates notable advantages in traffic-oriented spatial reasoning, delivering outputs that are more task-aware and semantically enriched compared with existing baselines. This work advances the integration of remote sensing and trajectory analysis, offering new perspectives on multimodal modeling for urban mobility and intelligent transportation. Future research will focus on broadening data resources, establishing standardized benchmarks, and extending the deployment of MLLMs in practical applications.
7. Limitation and Future Work
This study developed the MM-RSTraj model for remote sensing trajectory traffic semantic understanding, but several limitations remain. A key limitation is the datasets: RSI-Instruct, derived from RSICap, is designed for general remote sensing tasks, and some captions do not fully align with trajectory-traffic semantics. While the RSI-Traffic dataset covers important features like road structures and traffic flow, it cannot represent the full diversity of traffic scenarios. Additionally, the lack of standardized benchmarks and annotations for trajectory traffic tasks presents a significant challenge for evaluation. Future work will focus on addressing these gaps by developing standardized datasets and benchmarks. Methodologically, the feature fusion approach has only been tested for qualitative interpretation of trajectory traffic semantics, and its integration into downstream tasks like point-of-interest recognition and trajectory prediction will be explored in future research. This approach not only enhances trajectory traffic analysis but also offers insights for applying similar multimodal fusion strategies in other domains, promoting the integration of diverse data for complex task-solving.
Author Contributions
Methodology, C.G. and F.H.; Software, C.G.; Formal analysis, H.K.; Writing—original draft, C.G. and F.H. ; Writing—review and editing, D.M. and X.D. All authors have read and agreed to the published version of the manuscript.
Funding
This research was supported by the Key R&D Program of Shandong Province, China (Grant No. 2024CXGC010905); the National Natural Science Foundation of China (Grant No. 42201458 and 52575294); and the Innovation Capability Enhancement Program for Technology-Based SMEs of Shandong Province, China (Grant No. 2023TSGC0111).
Data Availability Statement
The codes and datasets will be released at: https://github.com/BitSpatio/MM-RSTraj.
Acknowledgments
The authors would like to thank the support of the Key R&D Program of Shandong Province, the National Natural Science Foundation of China, and the Innovation Capability Enhancement Program for Technology-Based SMEs of Shandong Province. The authors are also very thankful to the editor and referees for their valuable comments and suggestions, which greatly helped improve the quality of this paper.
Conflicts of Interest
The authors declare no conflict of interest.
References
- Li, Z.; Xia, L.; Xu, Y.; Huang, C. Flashst: A simple and universal prompt-tuning framework for traffic prediction. arXiv preprint arXiv:2405.17898 2024.
- Ma, Z.; Tu, Z.; Chen, X.; Zhang, Y.; Xia, D.; Zhou, G.; Chen, Y.; Zheng, Y.; Gong, J. More than routing: Joint GPS and route modeling for refine trajectory representation learning. In Proceedings of the Proceedings of the ACM Web Conference 2024, 2024, pp. 3064–3075.
- Li, Z.; Xia, L.; Tang, J.; Xu, Y.; Shi, L.; Xia, L.; Yin, D.; Huang, C. Urbangpt: Spatio-temporal large language models. In Proceedings of the Proceedings of the 30th ACM SIGKDD Conference on Knowledge Discovery and Data Mining, 2024, pp. 5351–5362.
- Deng, L.; Zhao, Y.; Chen, J.; Liu, S.; Xia, Y.; Zheng, K. Learning to hash for trajectory similarity computation and search. In Proceedings of the 2024 IEEE 40th International Conference on Data Engineering (ICDE). IEEE, 2024, pp. 4491–4503.
- Li, S.; Chen, W.; Yan, B.; Li, Z.; Zhu, S.; Yu, Y. Self-supervised contrastive representation learning for large-scale trajectories. Future Generation Computer Systems 2023, 148, 357–366. [Google Scholar] [CrossRef]
- Xu, R.; Cheng, H.; Guo, C.; Gao, H.; Hu, J.; Yang, S.B.; Yang, B. Mm-path: Multi-modal, multi-granularity path representation learning. In Proceedings of the Proceedings of the 31st ACM SIGKDD Conference on Knowledge Discovery and Data Mining V. 1, 2025, pp. 1703–1714.
- Yan, Y.; Wen, H.; Zhong, S.; Chen, W.; Chen, H.; Wen, Q.; Zimmermann, R.; Liang, Y. Urbanclip: Learning text-enhanced urban region profiling with contrastive language-image pretraining from the web. In Proceedings of the Proceedings of the ACM Web Conference 2024, 2024, pp. 4006–4017.
- Yuan, Q.; Shen, H.; Li, T.; Li, Z.; Li, S.; Jiang, Y.; Xu, H.; Tan, W.; Yang, Q.; Wang, J.; et al. Deep learning in environmental remote sensing: Achievements and challenges. Remote sensing of Environment 2020, 241, 111716. [Google Scholar] [CrossRef]
- Kakogeorgiou, I.; Karantzalos, K. Evaluating explainable artificial intelligence methods for multi-label deep learning classification tasks in remote sensing. International Journal of Applied Earth Observation and Geoinformation 2021, 103, 102520. [Google Scholar] [CrossRef]
- Zhou, L.; Zhang, C.; Wu, M. D-LinkNet: LinkNet with pretrained encoder and dilated convolution for high resolution satellite imagery road extraction. In Proceedings of the Proceedings of the IEEE conference on computer vision and pattern recognition workshops, 2018, pp. 182–186.
- Yuan, Y.; Ding, J.; Feng, J.; Jin, D.; Li, Y. Unist: A prompt-empowered universal model for urban spatio-temporal prediction. In Proceedings of the Proceedings of the 30th ACM SIGKDD Conference on Knowledge Discovery and Data Mining, 2024, pp. 4095–4106.
- Xu, R.; Huang, W.; Zhao, J.; Chen, M.; Nie, L. A spatial and adversarial representation learning approach for land use classification with POIs. ACM Transactions on Intelligent Systems and Technology 2023, 14, 1–25. [Google Scholar] [CrossRef]
- Chen, M.; Li, Z.; Huang, W.; Gong, Y.; Yin, Y. Profiling urban streets: A semi-supervised prediction model based on street view imagery and spatial topology. In Proceedings of the Proceedings of the 30th ACM SIGKDD Conference on Knowledge Discovery and Data Mining, 2024, pp. 319–328.
- OpenAI. ChatGPT: A Language Model for Conversational AI. Tech. rep., OpenAI, 2023.
- Achiam, J.; Adler, S.; Agarwal, S.; Ahmad, L.; Akkaya, I.; Aleman, F.L.; Almeida, D.; Altenschmidt, J.; Altman, S.; Anadkat, S.; et al. Gpt-4 technical report. arXiv preprint arXiv:2303.08774 2023.
- Touvron, H.; Lavril, T.; Izacard, G.; Martinet, X.; Lachaux, M.A.; Lacroix, T.; Rozière, B.; Goyal, N.; Hambro, E.; Azhar, F.; et al. Llama: Open and efficient foundation language models. arXiv preprint arXiv:2302.13971 2023.
- Peng, B.; Li, C.; He, P.; Galley, M.; Gao, J. Instruction tuning with gpt-4. arXiv preprint arXiv:2304.03277 2023.
- Brown, T.; Mann, B.; Ryder, N.; Subbiah, M.; Kaplan, J.D.; Dhariwal, P.; Neelakantan, A.; Shyam, P.; Sastry, G.; Askell, A.; et al. Language models are few-shot learners. Advances in neural information processing systems 2020, 33, 1877–1901. [Google Scholar]
- Wei, J.; Wang, X.; Schuurmans, D.; Bosma, M.; Xia, F.; Chi, E.; Le, Q.V.; Zhou, D.; et al. Chain-of-thought prompting elicits reasoning in large language models. Advances in neural information processing systems 2022, 35, 24824–24837. [Google Scholar]
- Li, J.; Li, D.; Xiong, C.; Hoi, S. Blip: Bootstrapping language-image pre-training for unified vision-language understanding and generation. In Proceedings of the International conference on machine learning. PMLR, 2022, pp. 12888–12900.
- Chen, J.; Guo, H.; Yi, K.; Li, B.; Elhoseiny, M. Visualgpt: Data-efficient adaptation of pretrained language models for image captioning. In Proceedings of the Proceedings of the IEEE/CVF conference on computer vision and pattern recognition, 2022, pp. 18030–18040.
- Radford, A.; Kim, J.W.; Hallacy, C.; Ramesh, A.; Goh, G.; Agarwal, S.; Sastry, G.; Askell, A.; Mishkin, P.; Clark, J.; et al. Learning transferable visual models from natural language supervision. In Proceedings of the International conference on machine learning. PmLR, 2021, pp. 8748–8763.
- Lu, X.; Wang, B.; Zheng, X.; Li, X. Exploring models and data for remote sensing image caption generation. IEEE Transactions on Geoscience and Remote Sensing 2017, 56, 2183–2195. [Google Scholar] [CrossRef]
- Zhang, X.; Wang, X.; Tang, X.; Zhou, H.; Li, C. Description generation for remote sensing images using attribute attention mechanism. Remote Sensing 2019, 11, 612. [Google Scholar] [CrossRef]
- Li, Y.; Fang, S.; Jiao, L.; Liu, R.; Shang, R. A multi-level attention model for remote sensing image captions. Remote Sensing 2020, 12, 939. [Google Scholar] [CrossRef]
- Zheng, X.; Wang, B.; Du, X.; Lu, X. Mutual attention inception network for remote sensing visual question answering. IEEE Transactions on Geoscience and Remote Sensing 2021, 60, 1–14. [Google Scholar] [CrossRef]
- Chappuis, C.; Mendez, V.; Walt, E.; Lobry, S.; Le Saux, B.; Tuia, D. Language Transformers for Remote Sensing Visual Question Answering. In Proceedings of the IGARSS 2022-2022 IEEE International Geoscience and Remote Sensing Symposium. IEEE, 2022, pp. 4855–4858.
- Li, A.; Lu, Z.; Wang, L.; Xiang, T.; Wen, J.R. Zero-shot scene classification for high spatial resolution remote sensing images. IEEE Transactions on Geoscience and Remote Sensing 2017, 55, 4157–4167. [Google Scholar] [CrossRef]
- Quan, J.; Wu, C.; Wang, H.; Wang, Z. Structural alignment based zero-shot classification for remote sensing scenes. In Proceedings of the 2018 IEEE International Conference on Electronics and Communication Engineering (ICECE). IEEE, 2018, pp. 17–21.
- Awadalla, A.; Gao, I.; Gardner, J.; Hessel, J.; Hanafy, Y.; Zhu, W.; Marathe, K.; Bitton, Y.; Gadre, S.; Sagawa, S.; et al. Openflamingo: An open-source framework for training large autoregressive vision-language models. arXiv preprint arXiv:2308.01390 2023.
- Ye, J.; Xu, H.; Liu, H.; Hu, A.; Yan, M.; Qian, Q.; Zhang, J.; Huang, F.; Zhou, J. mplug-owl3: Towards long image-sequence understanding in multi-modal large language models. arXiv preprint arXiv:2408.04840 2024.
- Hu, J.; Yao, Y.; Wang, C.; Wang, S.; Pan, Y.; Chen, Q.; Yu, T.; Wu, H.; Zhao, Y.; Zhang, H.; et al. Large multilingual models pivot zero-shot multimodal learning across languages. arXiv preprint arXiv:2308.12038 2023.
- Bai, S.; Chen, K.; Liu, X.; Wang, J.; Ge, W.; Song, S.; Dang, K.; Wang, P.; Wang, S.; Tang, J.; et al. Qwen2. 5-vl technical report. arXiv preprint arXiv:2502.13923 2025.
- Zhu, J.; Wang, W.; Chen, Z.; Liu, Z.; Ye, S.; Gu, L.; Tian, H.; Duan, Y.; Su, W.; Shao, J.; et al. Internvl3: Exploring advanced training and test-time recipes for open-source multimodal models. arXiv preprint arXiv:2504.10479 2025.
- Comanici, G.; Bieber, E.; Schaekermann, M.; Pasupat, I.; Sachdeva, N.; Dhillon, I.; Blistein, M.; Ram, O.; Zhang, D.; Rosen, E.; et al. Gemini 2.5: Pushing the frontier with advanced reasoning, multimodality, long context, and next generation agentic capabilities. arXiv preprint arXiv:2507.06261 2025.
- Han, J.; Zhang, R.; Shao, W.; Gao, P.; Xu, P.; Xiao, H.; Zhang, K.; Liu, C.; Wen, S.; Guo, Z.; et al. Imagebind-llm: Multi-modality instruction tuning. arXiv preprint arXiv:2309.03905 2023.
- Sanh, V.; Webson, A.; Raffel, C.; Bach, S.H.; Sutawika, L.; Alyafeai, Z.; Chaffin, A.; Stiegler, A.; Scao, T.L.; Raja, A.; et al. Multitask prompted training enables zero-shot task generalization. arXiv preprint arXiv:2110.08207 2021.
- Hong, W.; Yu, W.; Gu, X.; Wang, G.; Gan, G.; Tang, H.; Cheng, J.; Qi, J.; Ji, J.; Pan, L.; et al. GLM-4.1 V-Thinking: Towards Versatile Multimodal Reasoning with Scalable Reinforcement Learning. arXiv preprint arXiv:2507.01006 2025.
- Li, L.H.; Yatskar, M.; Yin, D.; Hsieh, C.J.; Chang, K.W. Visualbert: A simple and performant baseline for vision and language. arXiv preprint arXiv:1908.03557 2019.
- Liu, H.; Li, C.; Wu, Q.; Lee, Y.J. Visual instruction tuning. Advances in neural information processing systems 2023, 36, 34892–34916. [Google Scholar]
- Zhou, C.; Liu, P.; Xu, P.; Iyer, S.; Sun, J.; Mao, Y.; Ma, X.; Efrat, A.; Yu, P.; Yu, L.; et al. Lima: Less is more for alignment. Advances in Neural Information Processing Systems 2023, 36, 55006–55021. [Google Scholar]
- Ouyang, L.; Wu, J.; Jiang, X.; Almeida, D.; Wainwright, C.; Mishkin, P.; Zhang, C.; Agarwal, S.; Slama, K.; Ray, A.; et al. Training language models to follow instructions with human feedback. Advances in neural information processing systems 2022, 35, 27730–27744. [Google Scholar]
- Chiang, W.L.; Li, Z.; Lin, Z.; Sheng, Y.; Wu, Z.; Zhang, H.; Zheng, L.; Zhuang, S.; Zhuang, Y.; Gonzalez, J.E.; et al. Vicuna: An open-source chatbot impressing gpt-4 with 90%* chatgpt quality. See https://vicuna. lmsys. org (accessed 14 April 2023) 2023, 2, 6. [Google Scholar]
- Hu, Y.; Yuan, J.; Wen, C.; Lu, X.; Liu, Y.; Li, X. Rsgpt: A remote sensing vision language model and benchmark. ISPRS Journal of Photogrammetry and Remote Sensing 2025, 224, 272–286. [Google Scholar] [CrossRef]
- Shen, Y.; Fu, C.; Chen, P.; Zhang, M.; Li, K.; Sun, X.; Wu, Y.; Lin, S.; Ji, R. Aligning and prompting everything all at once for universal visual perception. In Proceedings of the Proceedings of the IEEE/CVF Conference on Computer Vision and Pattern Recognition, 2024, pp. 13193–13203.
- Oquab, M.; Darcet, T.; Moutakanni, T.; Vo, H.; Szafraniec, M.; Khalidov, V.; Fernandez, P.; Haziza, D.; Massa, F.; El-Nouby, A.; et al. Dinov2: Learning robust visual features without supervision. arXiv preprint arXiv:2304.07193 2023.
- Gan, Z.; Li, L.; Li, C.; Wang, L.; Liu, Z.; Gao, J.; et al. Vision-language pre-training: Basics, recent advances, and future trends. Foundations and Trends® in Computer Graphics and Vision 2022, 14, 163–352. [Google Scholar] [CrossRef]
- Fu, Z.; Yan, H.; Ding, K. CLIP-MoA: Visual-Language Models with Mixture of Adapters for Multi-task Remote Sensing Image Classification. IEEE Transactions on Geoscience and Remote Sensing 2025. [Google Scholar] [CrossRef]
- Zhao, R.; Shi, Z.; Zou, Z. High-resolution remote sensing image captioning based on structured attention. IEEE Transactions on Geoscience and Remote Sensing 2021, 60, 1–14. [Google Scholar] [CrossRef]
- Zia, U.; Riaz, M.M.; Ghafoor, A. Transforming remote sensing images to textual descriptions. International Journal of Applied Earth Observation and Geoinformation 2022, 108, 102741. [Google Scholar] [CrossRef]
- Bazi, Y.; Al Rahhal, M.M.; Mekhalfi, M.L.; Al Zuair, M.A.; Melgani, F. Bi-modal transformer-based approach for visual question answering in remote sensing imagery. IEEE Transactions on Geoscience and Remote Sensing 2022, 60, 1–11. [Google Scholar] [CrossRef]
- Yuan, Z.; Mou, L.; Xiong, Z.; Zhu, X.X. Change detection meets visual question answering. IEEE Transactions on Geoscience and Remote Sensing 2022, 60, 1–13. [Google Scholar] [CrossRef]
- Abdullah, T.; Bazi, Y.; Al Rahhal, M.M.; Mekhalfi, M.L.; Rangarajan, L.; Zuair, M. TextRS: Deep bidirectional triplet network for matching text to remote sensing images. Remote Sensing 2020, 12, 405. [Google Scholar] [CrossRef]
- Yuan, Z.; Zhang, W.; Rong, X.; Li, X.; Chen, J.; Wang, H.; Fu, K.; Sun, X. A lightweight multi-scale crossmodal text-image retrieval method in remote sensing. IEEE Transactions on Geoscience and Remote Sensing 2021, 60, 1–19. [Google Scholar] [CrossRef]
- Rahhal, M.M.A.; Bencherif, M.A.; Bazi, Y.; Alharbi, A.; Mekhalfi, M.L. Contrasting Dual Transformer Architectures for Multi-Modal Remote Sensing Image Retrieval. Applied Sciences 2023, 13, 282. [Google Scholar] [CrossRef]
- Al Rahhal, M.M.; Bazi, Y.; Alsharif, N.A.; Bashmal, L.; Alajlan, N.; Melgani, F. Multilanguage Transformer for Improved Text to Remote Sensing Image Retrieval. IEEE Journal of Selected Topics in Applied Earth Observations and Remote Sensing 2022, 15, 9115–9126. [Google Scholar] [CrossRef]
- Rahhal, M.M.A.; Bazi, Y.; Abdullah, T.; Mekhalfi, M.L.; Zuair, M. Deep unsupervised embedding for remote sensing image retrieval using textual cues. Applied Sciences 2020, 10, 8931. [Google Scholar] [CrossRef]
- Bejiga, M.B.; Melgani, F.; Vascotto, A. Retro-remote sensing: Generating images from ancient texts. IEEE Journal of Selected Topics in Applied Earth Observations and Remote Sensing 2019, 12, 950–960. [Google Scholar] [CrossRef]
- Zhao, R.; Shi, Z. Text-to-remote-sensing-image generation with structured generative adversarial networks. IEEE Geoscience and Remote Sensing Letters 2021, 19, 1–5. [Google Scholar] [CrossRef]
- Xu, Y.; Yu, W.; Ghamisi, P.; Kopp, M.; Hochreiter, S. Txt2Img-MHN: Remote sensing image generation from text using modern Hopfield networks. arXiv preprint arXiv:2208.04441 2022.
- Li, Z.; Zhang, D.; Wang, Y.; Lin, D.; Zhang, J. Generative Adversarial Networks for Zero-Shot Remote Sensing Scene Classification. Applied Sciences 2022, 12, 3760. [Google Scholar] [CrossRef]
- Zhang, D.; Yu, Y.; Dong, J.; Li, C.; Su, D.; Chu, C.; Yu, D. Mm-llms: Recent advances in multimodal large language models. arXiv preprint arXiv:2401.13601 2024.
- Islam, R.; Moushi, O.M. Gpt-4o: The cutting-edge advancement in multimodal llm. Authorea Preprints 2024. [Google Scholar]
- Team, G.; Anil, R.; Borgeaud, S.; Alayrac, J.B.; Yu, J.; Soricut, R.; Schalkwyk, J.; Dai, A.M.; Hauth, A.; Millican, K.; et al. Gemini: a family of highly capable multimodal models. arXiv preprint arXiv:2312.11805 2023.
- Anthropic. Introducing Claude 3.5 Sonnet. Tech. rep., Anthropic, 2024.
- Li, B.; Zhang, Y.; Guo, D.; Zhang, R.; Li, F.; Zhang, H.; Zhang, K.; Zhang, P.; Li, Y.; Liu, Z.; et al. Llava-onevision: Easy visual task transfer. arXiv preprint arXiv:2408.03326 2024.
- Li, J.; Li, D.; Savarese, S.; Hoi, S. Blip-2: Bootstrapping language-image pre-training with frozen image encoders and large language models. In Proceedings of the International conference on machine learning. PMLR, 2023, pp. 19730–19742.
- Zhu, D.; Chen, J.; Shen, X.; Li, X.; Elhoseiny, M. Minigpt-4: Enhancing vision-language understanding with advanced large language models. arXiv preprint arXiv:2304.10592 2023.
- Li, K.; He, Y.; Wang, Y.; Li, Y.; Wang, W.; Luo, P.; Wang, Y.; Wang, L.; Qiao, Y. Videochat: Chat-centric video understanding. arXiv preprint arXiv:2305.06355 2023.
- Maaz, M.; Rasheed, H.; Khan, S.; Khan, F.S. Video-chatgpt: Towards detailed video understanding via large vision and language models. arXiv preprint arXiv:2306.05424 2023.
- Chu, Y.; Xu, J.; Zhou, X.; Yang, Q.; Zhang, S.; Yan, Z.; Zhou, C.; Zhou, J. Qwen-audio: Advancing universal audio understanding via unified large-scale audio-language models. arXiv preprint arXiv:2311.07919 2023.
- Bazi, Y.; Bashmal, L.; Al Rahhal, M.M.; Ricci, R.; Melgani, F. Rs-llava: A large vision-language model for joint captioning and question answering in remote sensing imagery. Remote Sensing 2024, 16, 1477. [Google Scholar] [CrossRef]
- Lin, H.; Hong, D.; Ge, S.; Luo, C.; Jiang, K.; Jin, H.; Wen, C. Rs-moe: A vision-language model with mixture of experts for remote sensing image captioning and visual question answering. IEEE Transactions on Geoscience and Remote Sensing 2025. [Google Scholar]
- Zhang, S.; Roller, S.; Goyal, N.; Artetxe, M.; Chen, M.; Chen, S.; Dewan, C.; Diab, M.; Li, X.; Lin, X.V.; et al. Opt: Open pre-trained transformer language models. arXiv preprint arXiv:2205.01068 2022.
- Raffel, C.; Shazeer, N.; Roberts, A.; Lee, K.; Narang, S.; Matena, M.; Zhou, Y.; Li, W.; Liu, P.J. Exploring the limits of transfer learning with a unified text-to-text transformer. The Journal of Machine Learning Research 2020, 21, 5485–5551. [Google Scholar]
- Chung, H.W.; Hou, L.; Longpre, S.; Zoph, B.; Tay, Y.; Fedus, W.; Li, Y.; Wang, X.; Dehghani, M.; Brahma, S.; et al. Scaling instruction-finetuned language models. Journal of Machine Learning Research 2024, 25, 1–53. [Google Scholar]
- Iyer, S.; Lin, X.V.; Pasunuru, R.; Mihaylov, T.; Simig, D.; Yu, P.; Shuster, K.; Wang, T.; Liu, Q.; Koura, P.S.; et al. Opt-iml: Scaling language model instruction meta learning through the lens of generalization. arXiv preprint arXiv:2212.12017 2022.
- Alayrac, J.B.; Donahue, J.; Luc, P.; Miech, A.; Barr, I.; Hasson, Y.; Lenc, K.; Mensch, A.; Millican, K.; Reynolds, M.; et al. Flamingo: a visual language model for few-shot learning. Advances in Neural Information Processing Systems 2022, 35, 23716–23736. [Google Scholar]
- Lin, T.Y.; Maire, M.; Belongie, S.; Hays, J.; Perona, P.; Ramanan, D.; Dollár, P.; Zitnick, C.L. Microsoft coco: Common objects in context. In Proceedings of the European conference on computer vision. Springer, 2014, pp. 740–755.
- Dai, W.; Li, J.; Li, D.; Tiong, A.; Zhao, J.; Wang, W.; Li, B.; Fung, P.N.; Hoi, S. Instructblip: Towards general-purpose vision-language models with instruction tuning. Advances in neural information processing systems 2023, 36, 49250–49267. [Google Scholar]
- Qu, B.; Li, X.; Tao, D.; Lu, X. Deep semantic understanding of high resolution remote sensing image. In Proceedings of the 2016 International conference on computer, information and telecommunication systems (Cits). IEEE, 2016, pp. 1–5.
- Yang, Y.; Newsam, S. Bag-of-visual-words and spatial extensions for land-use classification. In Proceedings of the Proceedings of the 18th SIGSPATIAL international conference on advances in geographic information systems, 2010, pp. 270–279.
- Zhang, F.; Du, B.; Zhang, L. Saliency-guided unsupervised feature learning for scene classification. IEEE transactions on Geoscience and Remote Sensing 2014, 53, 2175–2184. [Google Scholar] [CrossRef]
- Lu, X.; Wang, B.; Zheng, X.; Li, X. Exploring models and data for remote sensing image caption generation. IEEE Transactions on Geoscience and Remote Sensing 2017, 56, 2183–2195. [Google Scholar] [CrossRef]
- Cheng, Q.; Huang, H.; Xu, Y.; Zhou, Y.; Li, H.; Wang, Z. NWPU-captions dataset and MLCA-net for remote sensing image captioning. IEEE Transactions on Geoscience and Remote Sensing 2022, 60, 1–19. [Google Scholar] [CrossRef]
- Wei, J.; Bosma, M.; Zhao, V.Y.; Guu, K.; Yu, A.W.; Lester, B.; Du, N.; Dai, A.M.; Le, Q.V. Finetuned language models are zero-shot learners. arXiv preprint arXiv:2109.01652 2021.
- Zeng, Y.; Zhang, H.; Zheng, J.; Xia, J.; Wei, G.; Wei, Y.; Zhang, Y.; Kong, T.; Song, R. What matters in training a gpt4-style language model with multimodal inputs? In Proceedings of the Proceedings of the 2024 Conference of the North American Chapter of the Association for Computational Linguistics: Human Language Technologies (Volume 1: Long Papers), 2024, pp. 7930–7957.
- Du, Y.; Guo, H.; Zhou, K.; Zhao, W.X.; Wang, J.; Wang, C.; Cai, M.; Song, R.; Wen, J.R. What makes for good visual instructions? synthesizing complex visual reasoning instructions for visual instruction tuning. arXiv preprint arXiv:2311.01487 2023.
- Yang, A.; Li, A.; Yang, B.; Zhang, B.; Hui, B.; Zheng, B.; Yu, B.; Gao, C.; Huang, C.; Lv, C.; et al. Qwen3 technical report. arXiv preprint arXiv:2505.09388 2025.
- Zhai, X.; Mustafa, B.; Kolesnikov, A.; Beyer, L. Sigmoid loss for language image pre-training. In Proceedings of the Proceedings of the IEEE/CVF international conference on computer vision, 2023, pp. 11975–11986.
- Liu, H.; Li, C.; Li, Y.; Lee, Y.J. Improved baselines with visual instruction tuning. In Proceedings of the Proceedings of the IEEE/CVF conference on computer vision and pattern recognition, 2024, pp. 26296–26306.
- Team, Q. Qwen2 technical report. arXiv preprint arXiv:2407.10671 2024.
- Yin, S.; Fu, C.; Zhao, S.; Li, K.; Sun, X.; Xu, T.; Chen, E. A survey on multimodal large language models. National Science Review 2024, 11, nwae403. [Google Scholar] [CrossRef] [PubMed]
- Hu, E.J.; Shen, Y.; Wallis, P.; Allen-Zhu, Z.; Li, Y.; Wang, S.; Wang, L.; Chen, W.; et al. Lora: Low-rank adaptation of large language models. ICLR 2022, 1, 3. [Google Scholar]
- Li, X.; Yuan, A.; Lu, X. Multi-modal gated recurrent units for image description. Multimedia Tools and Applications 2018, 77, 29847–29869. [Google Scholar] [CrossRef]
- Wang, B.; Lu, X.; Zheng, X.; Li, X. Semantic descriptions of high-resolution remote sensing images. IEEE Geoscience and Remote Sensing Letters 2019, 16, 1274–1278. [Google Scholar] [CrossRef]
- Lu, X.; Wang, B.; Zheng, X. Sound active attention framework for remote sensing image captioning. IEEE Transactions on Geoscience and Remote Sensing 2019, 58, 1985–2000. [Google Scholar] [CrossRef]
- Xu, K.; Ba, J.; Kiros, R.; Cho, K.; Courville, A.; Salakhudinov, R.; Zemel, R.; Bengio, Y. Show, attend and tell: Neural image caption generation with visual attention. In Proceedings of the International conference on machine learning. PMLR, 2015, pp. 2048–2057.
- Sumbul, G.; Nayak, S.; Demir, B. SD-RSIC: Summarization-driven deep remote sensing image captioning. IEEE Transactions on Geoscience and Remote Sensing 2020, 59, 6922–6934. [Google Scholar] [CrossRef]
- Wang, B.; Zheng, X.; Qu, B.; Lu, X. Retrieval topic recurrent memory network for remote sensing image captioning. IEEE Journal of Selected Topics in Applied Earth Observations and Remote Sensing 2020, 13, 256–270. [Google Scholar] [CrossRef]
- Hoxha, G.; Melgani, F. A novel SVM-based decoder for remote sensing image captioning. IEEE Transactions on Geoscience and Remote Sensing 2021, 60, 1–14. [Google Scholar] [CrossRef]
- Hoxha, G.; Scuccato, G.; Melgani, F. Improving Image Captioning Systems with Post-Processing Strategies. IEEE Transactions on Geoscience and Remote Sensing 2023. [Google Scholar] [CrossRef]
- Silva, J.D.; Magalhães, J.; Tuia, D.; Martins, B. Large language models for captioning and retrieving remote sensing images. arXiv preprint arXiv:2402.06475 2024.
Figure 1.
Examples of multi-turn dialogues in RSI-Instruct. The first round illustrates diverse prompts for global scene understanding, while the second round focuses on fine-grained attributes such as object existence, quantity, color, spatial relations, and image resolution/type, showcasing the dataset’s rich semantic diversity and detailed reasoning capability.
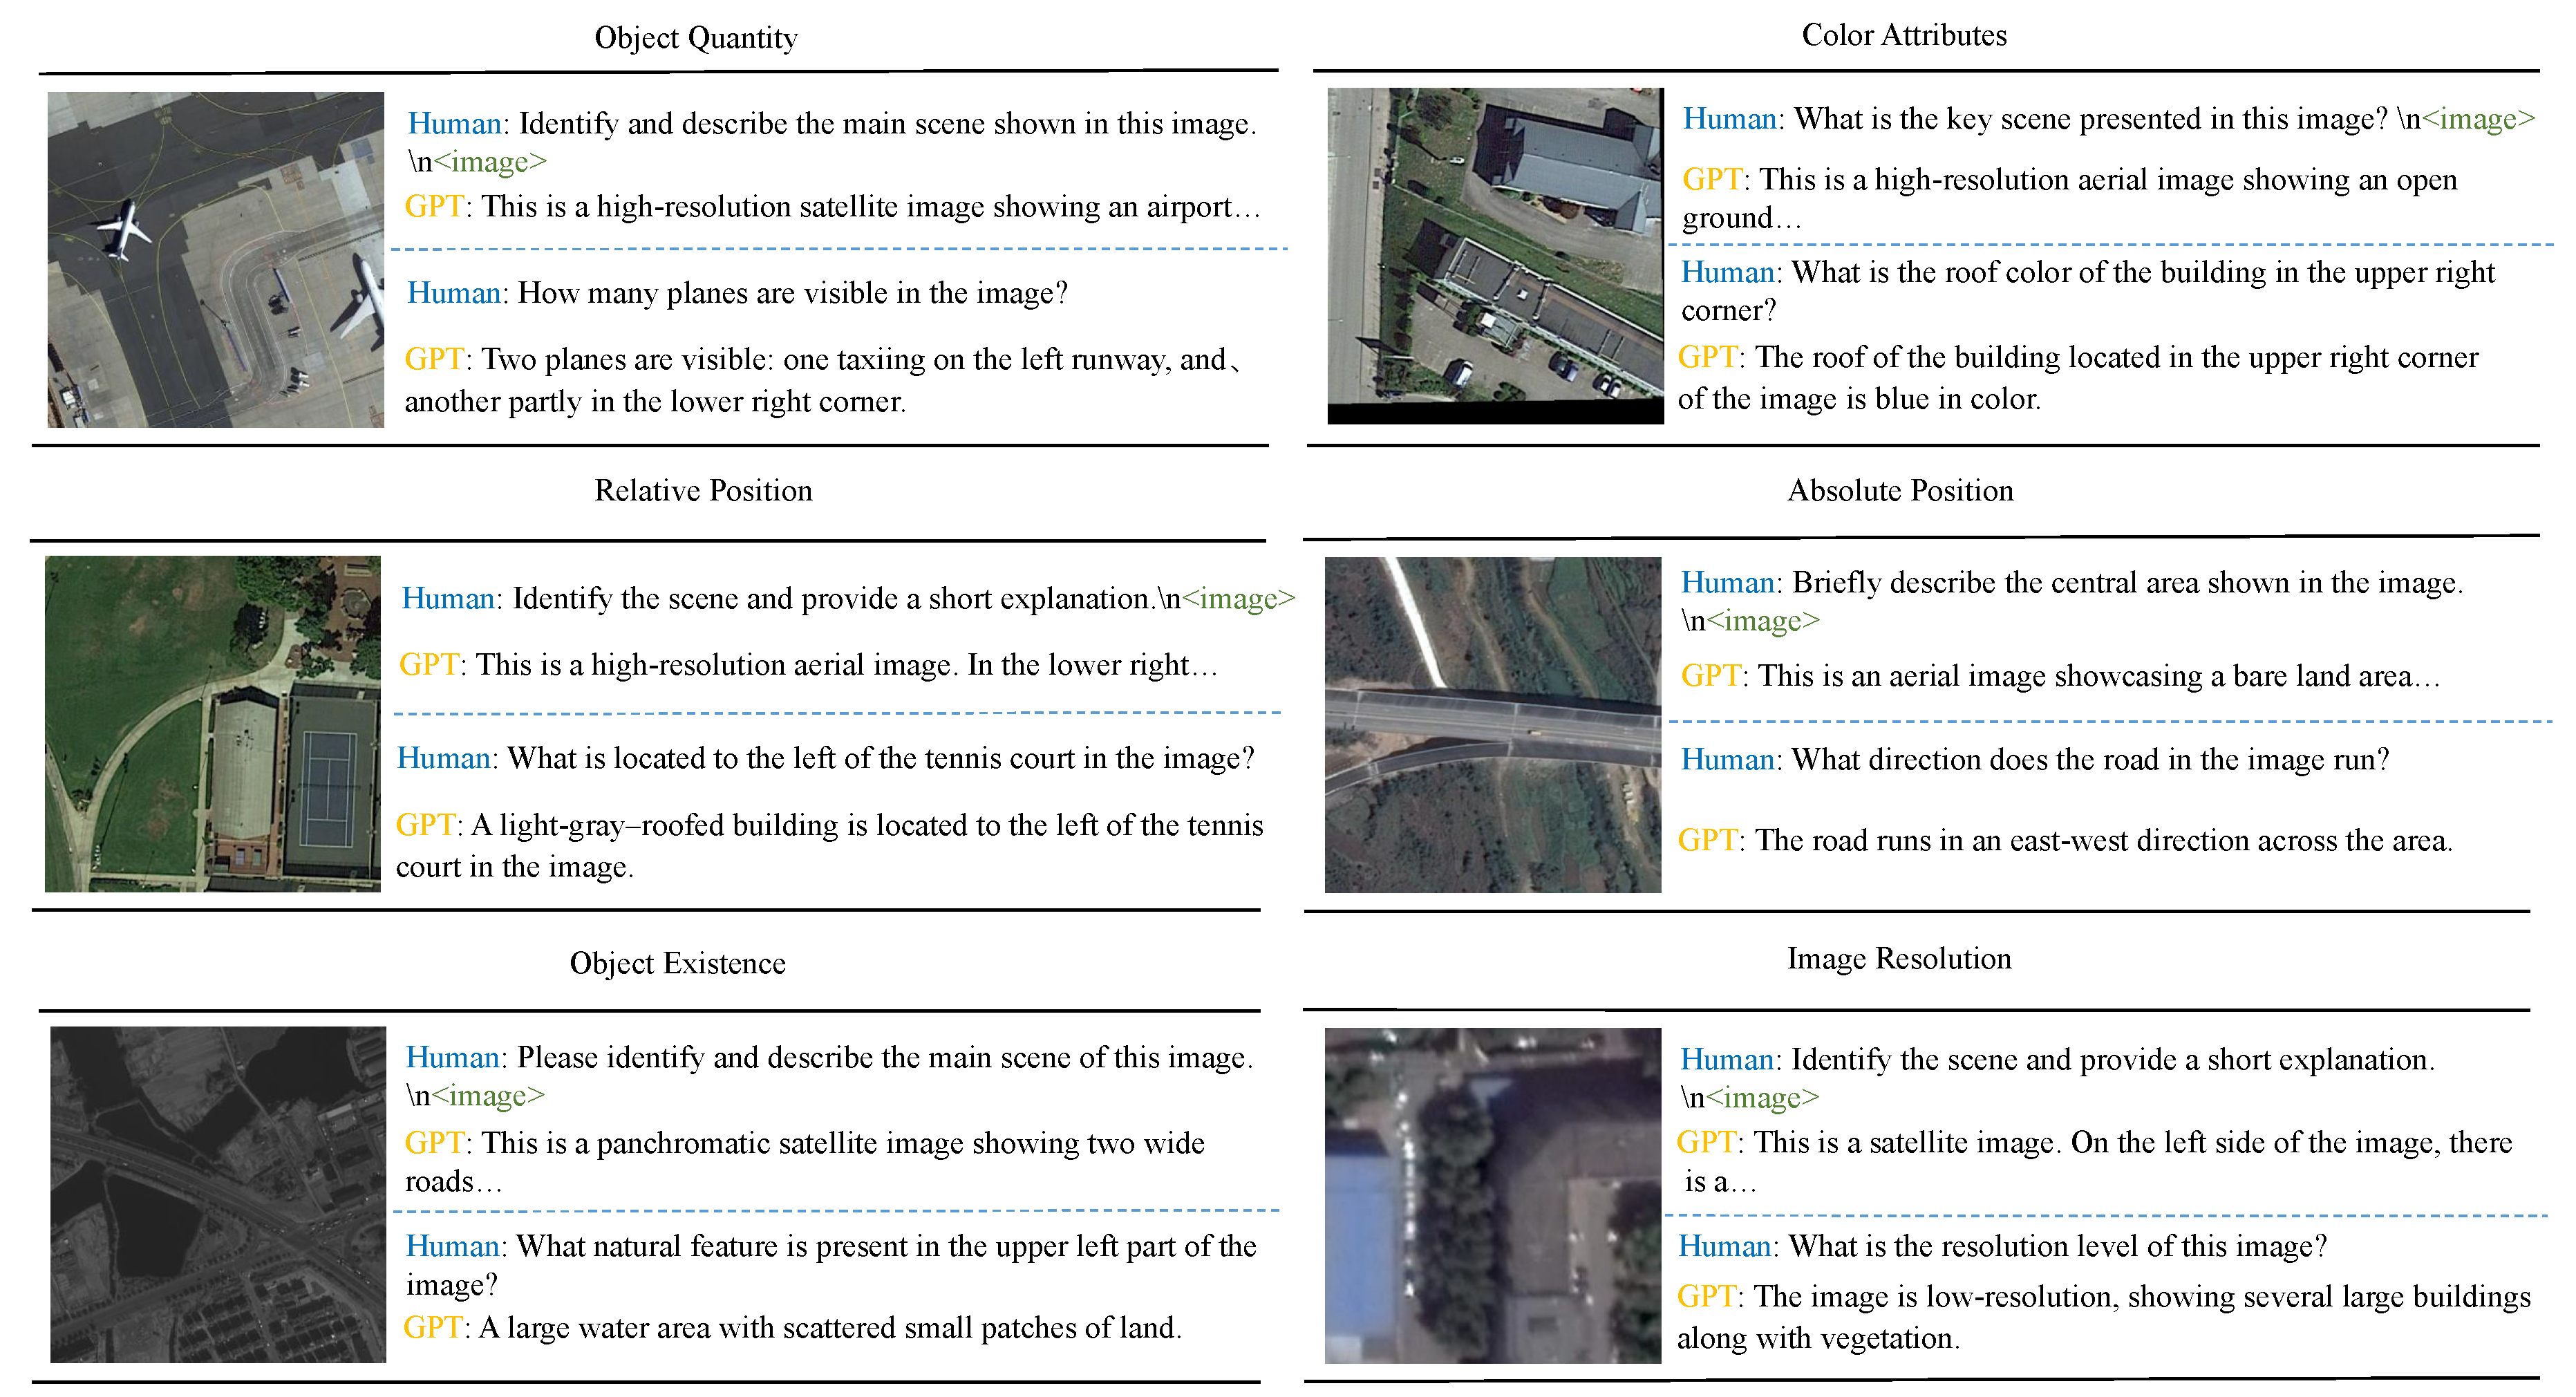
Figure 2.
Comparison of semantic descriptions across four remote sensing datasets. UCM-Captions and Sydney-Captions provide brief static facts; RSICap adds detail but remains object-centric with limited traffic semantics. RSI-Traffic (ours) captures road networks, traffic hierarchies, and functional zoning with deeper reasoning, demonstrating superior urban traffic understanding.
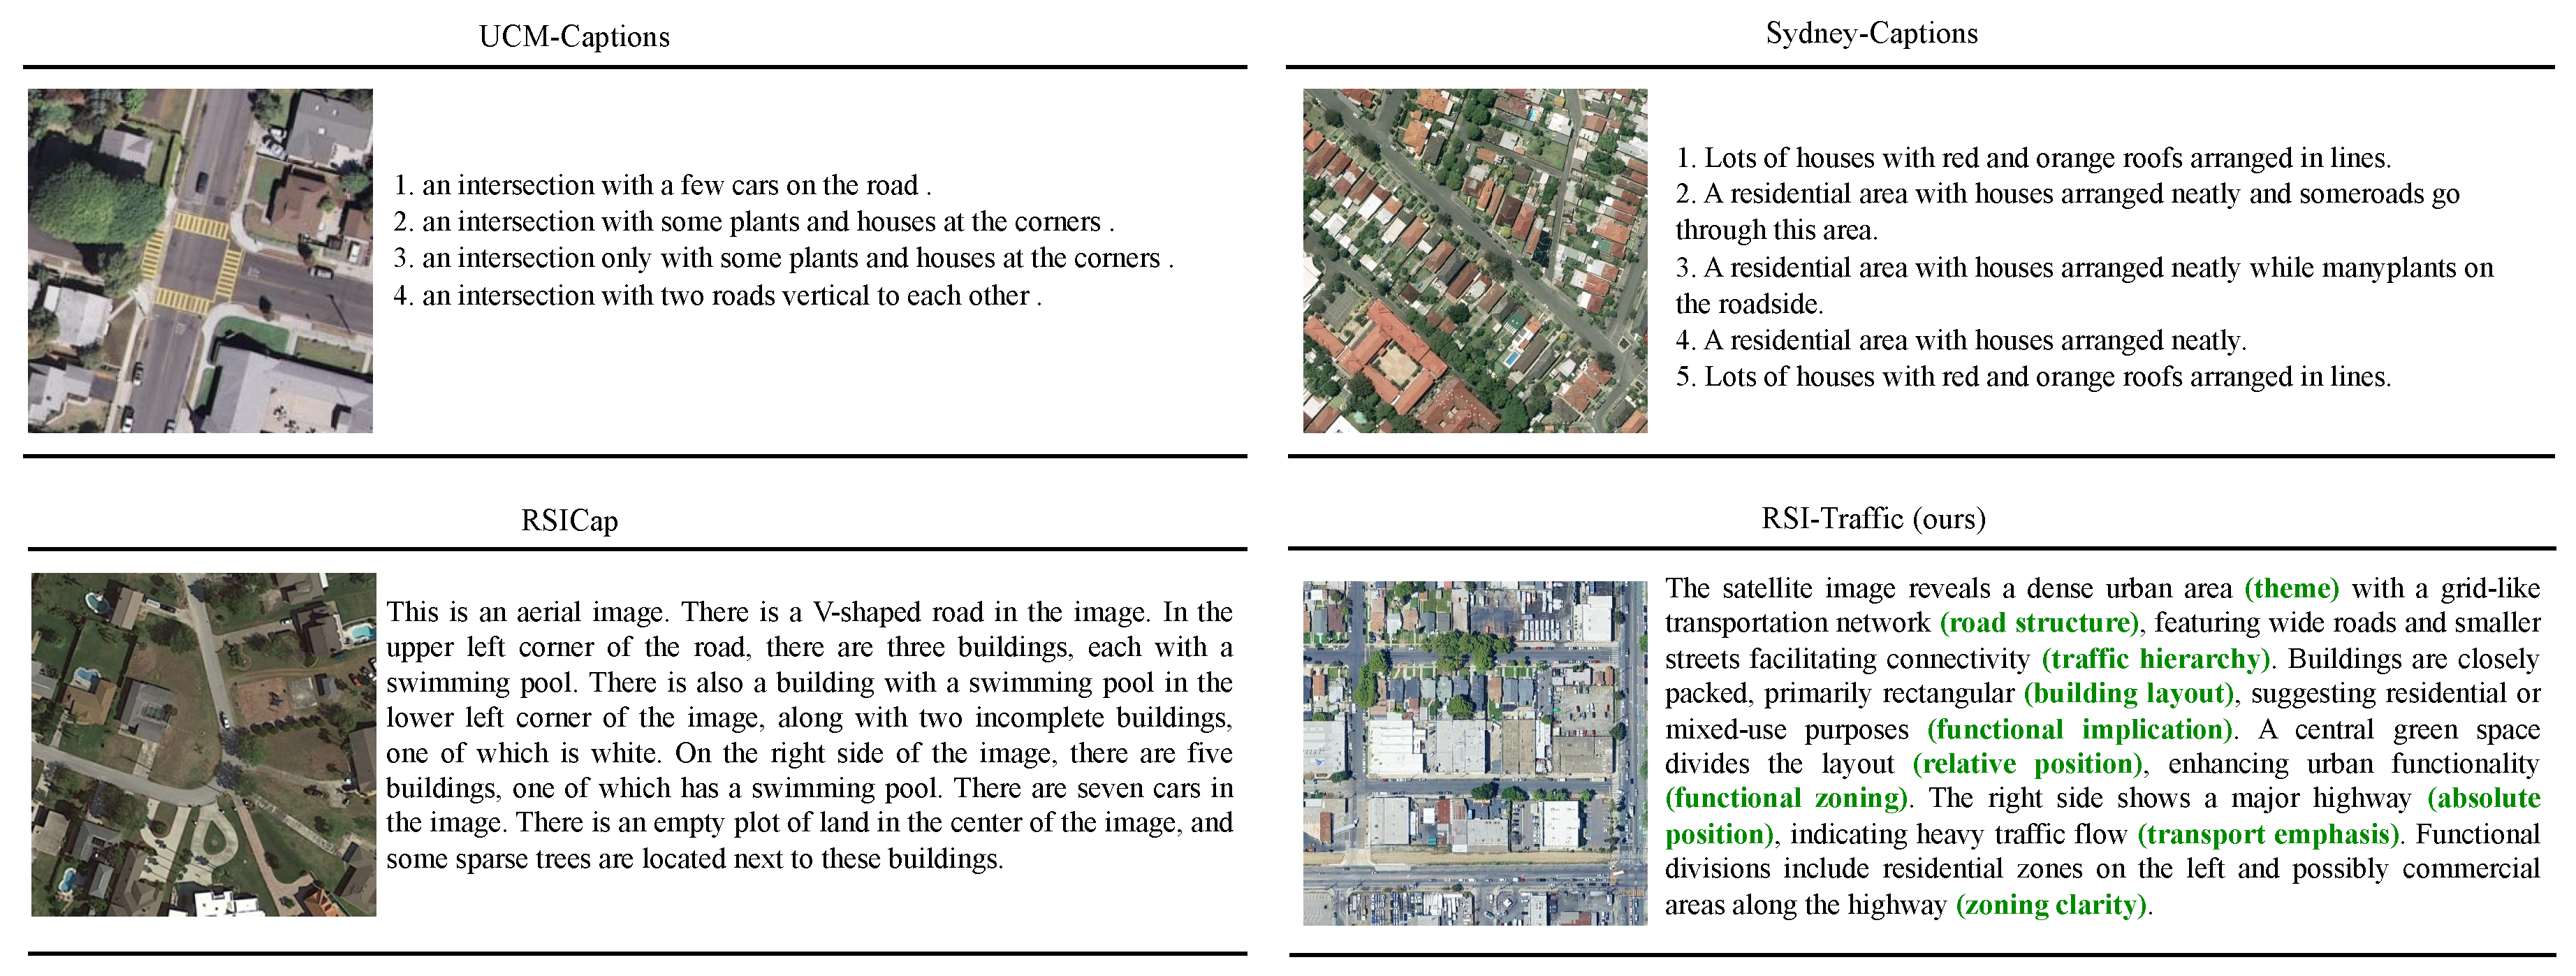
Figure 3.
Statistical summary of RSI-Instruct and RSI-Traffic datasets. (a) Probability density function (PDF) of caption length. (b) PDF of sentence count per caption. (c) Statistical indicators of RSI-Instruct and RSI-Traffic datasets.
Figure 3.
Statistical summary of RSI-Instruct and RSI-Traffic datasets. (a) Probability density function (PDF) of caption length. (b) PDF of sentence count per caption. (c) Statistical indicators of RSI-Instruct and RSI-Traffic datasets.
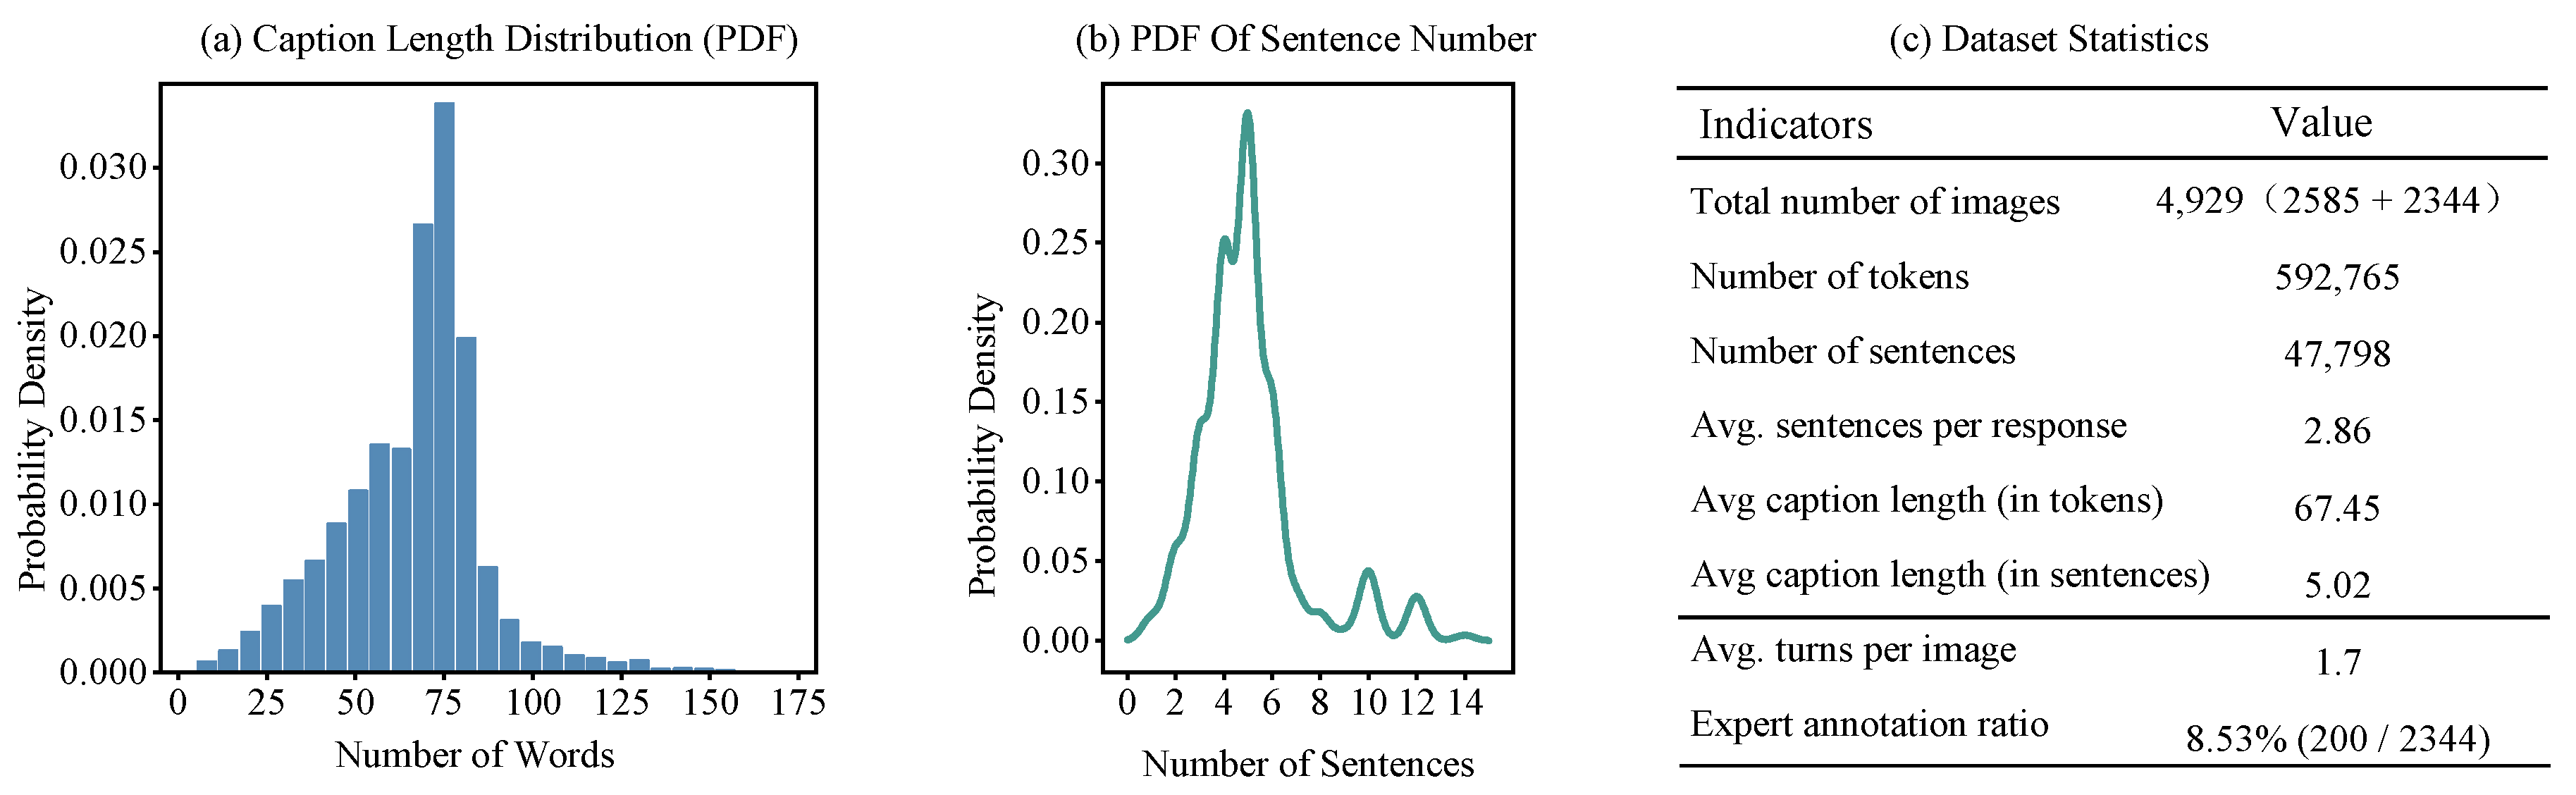
Figure 4.
Overview of MM-RSTraj framework: dataset construction (RSI-Instruct & RSI-Traffic), two-stage fine-tuning of LLaVA-OneVision with Higher AnyRes, and downstream RS & trajectory multimodal tasks with cross-modal semantic fusion.
Figure 4.
Overview of MM-RSTraj framework: dataset construction (RSI-Instruct & RSI-Traffic), two-stage fine-tuning of LLaVA-OneVision with Higher AnyRes, and downstream RS & trajectory multimodal tasks with cross-modal semantic fusion.
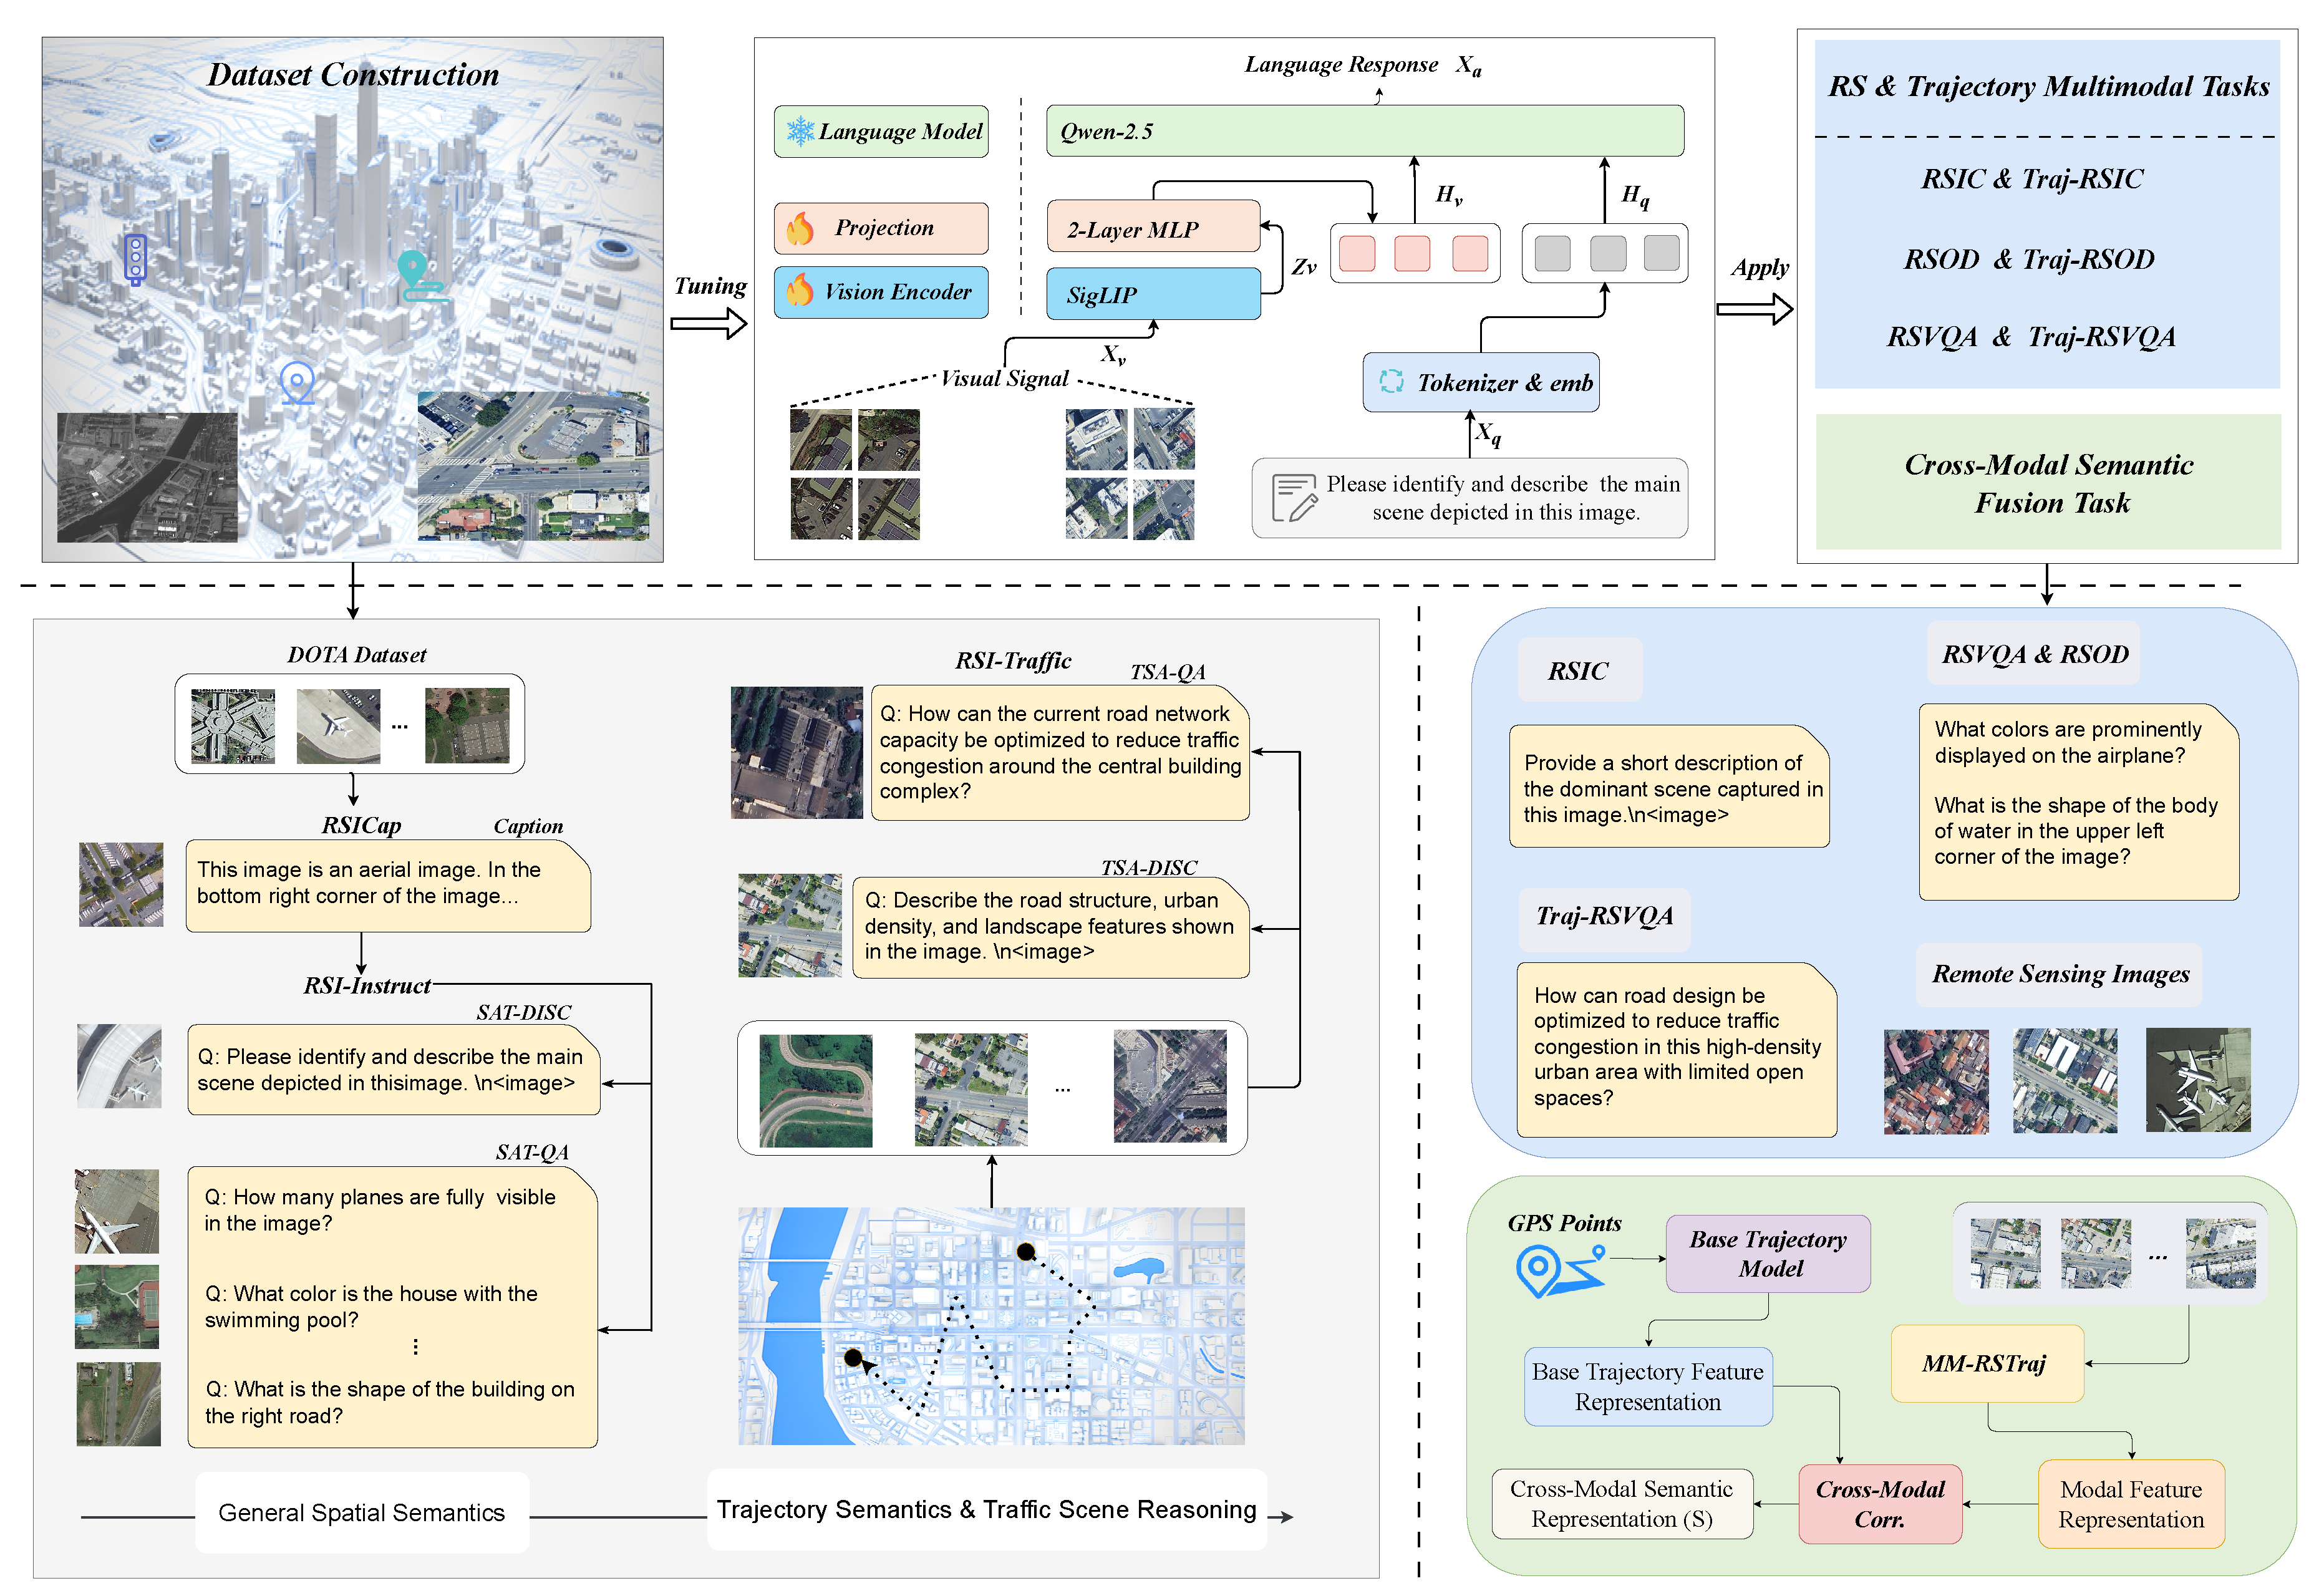
Figure 5.
Overview of the MM-RSTraj model, highlighting its three core components—SigLIP vision encoder, a customized 2-layer MLP projector, and the Qwen-2.5-7B language model—and the two-stage fine-tuning process for enhanced cross-modal semantic fusion and representation.
Figure 5.
Overview of the MM-RSTraj model, highlighting its three core components—SigLIP vision encoder, a customized 2-layer MLP projector, and the Qwen-2.5-7B language model—and the two-stage fine-tuning process for enhanced cross-modal semantic fusion and representation.
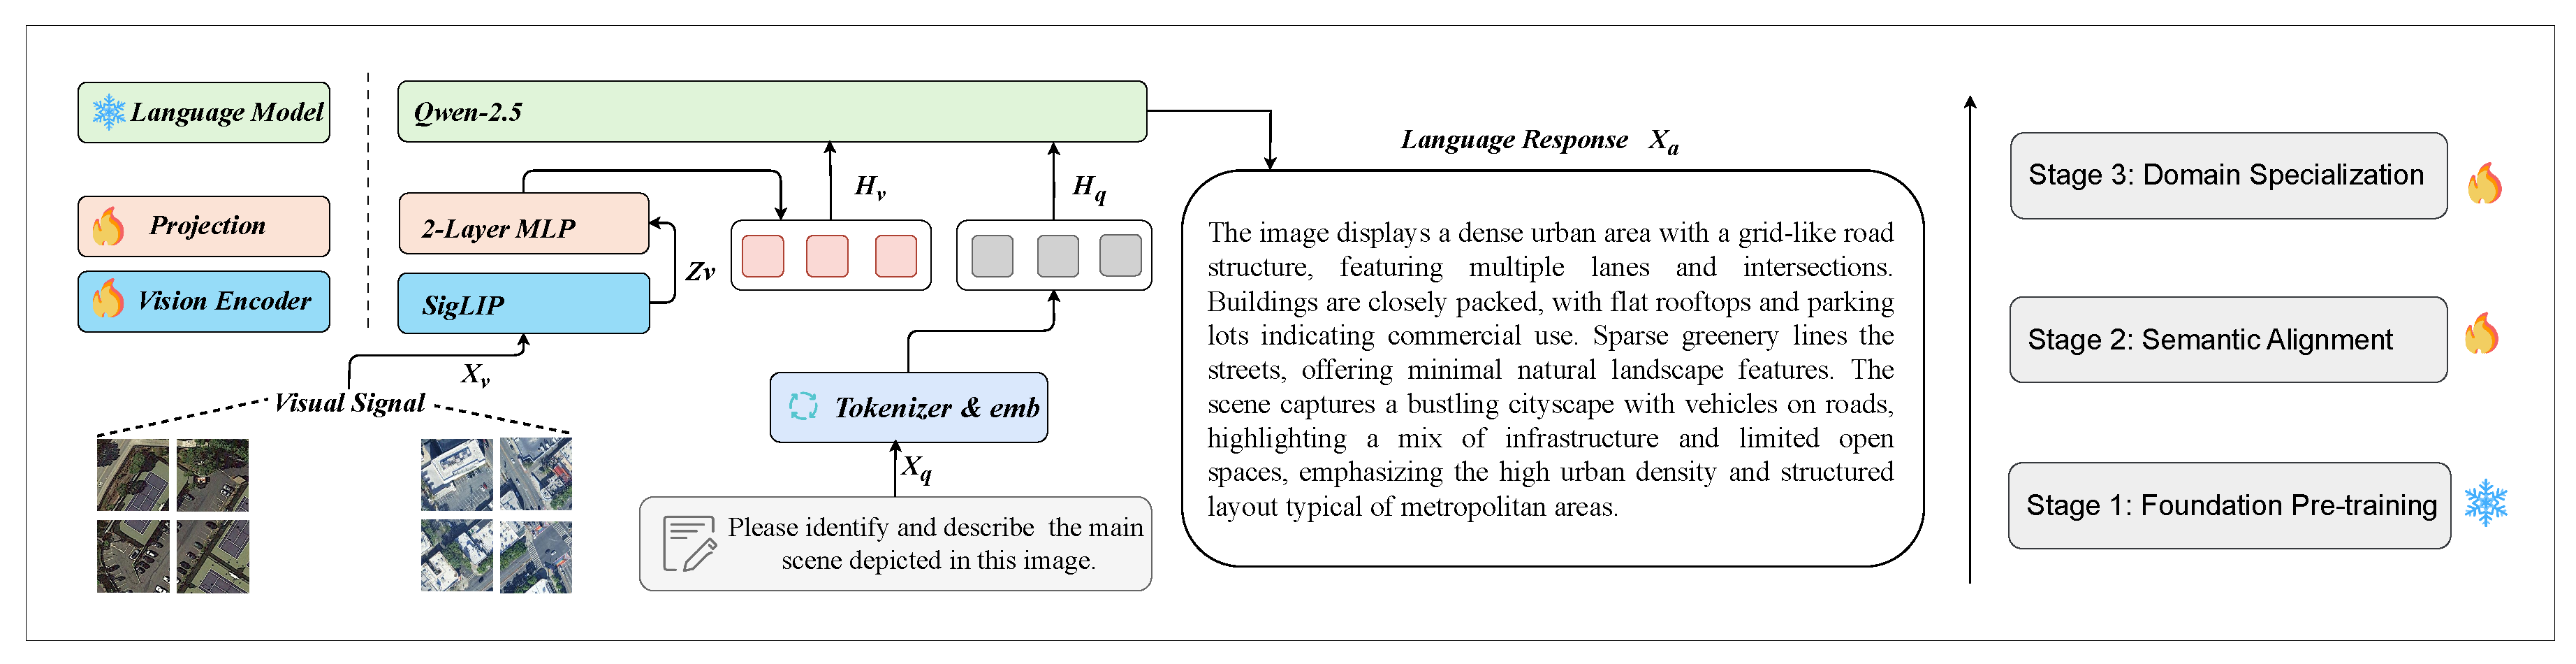
Figure 7.
Qualitative comparison of captioning performance on representative RSIEval images, showcasing the strengths and limitations of BLIP2, InstructBLIP, RSGPT, RS-MoE, and MM-RSTraj. The images include an industrial area with storage tanks (emphasizing static layouts) and a suburban community with roads (highlighting trajectory and traffic semantics).
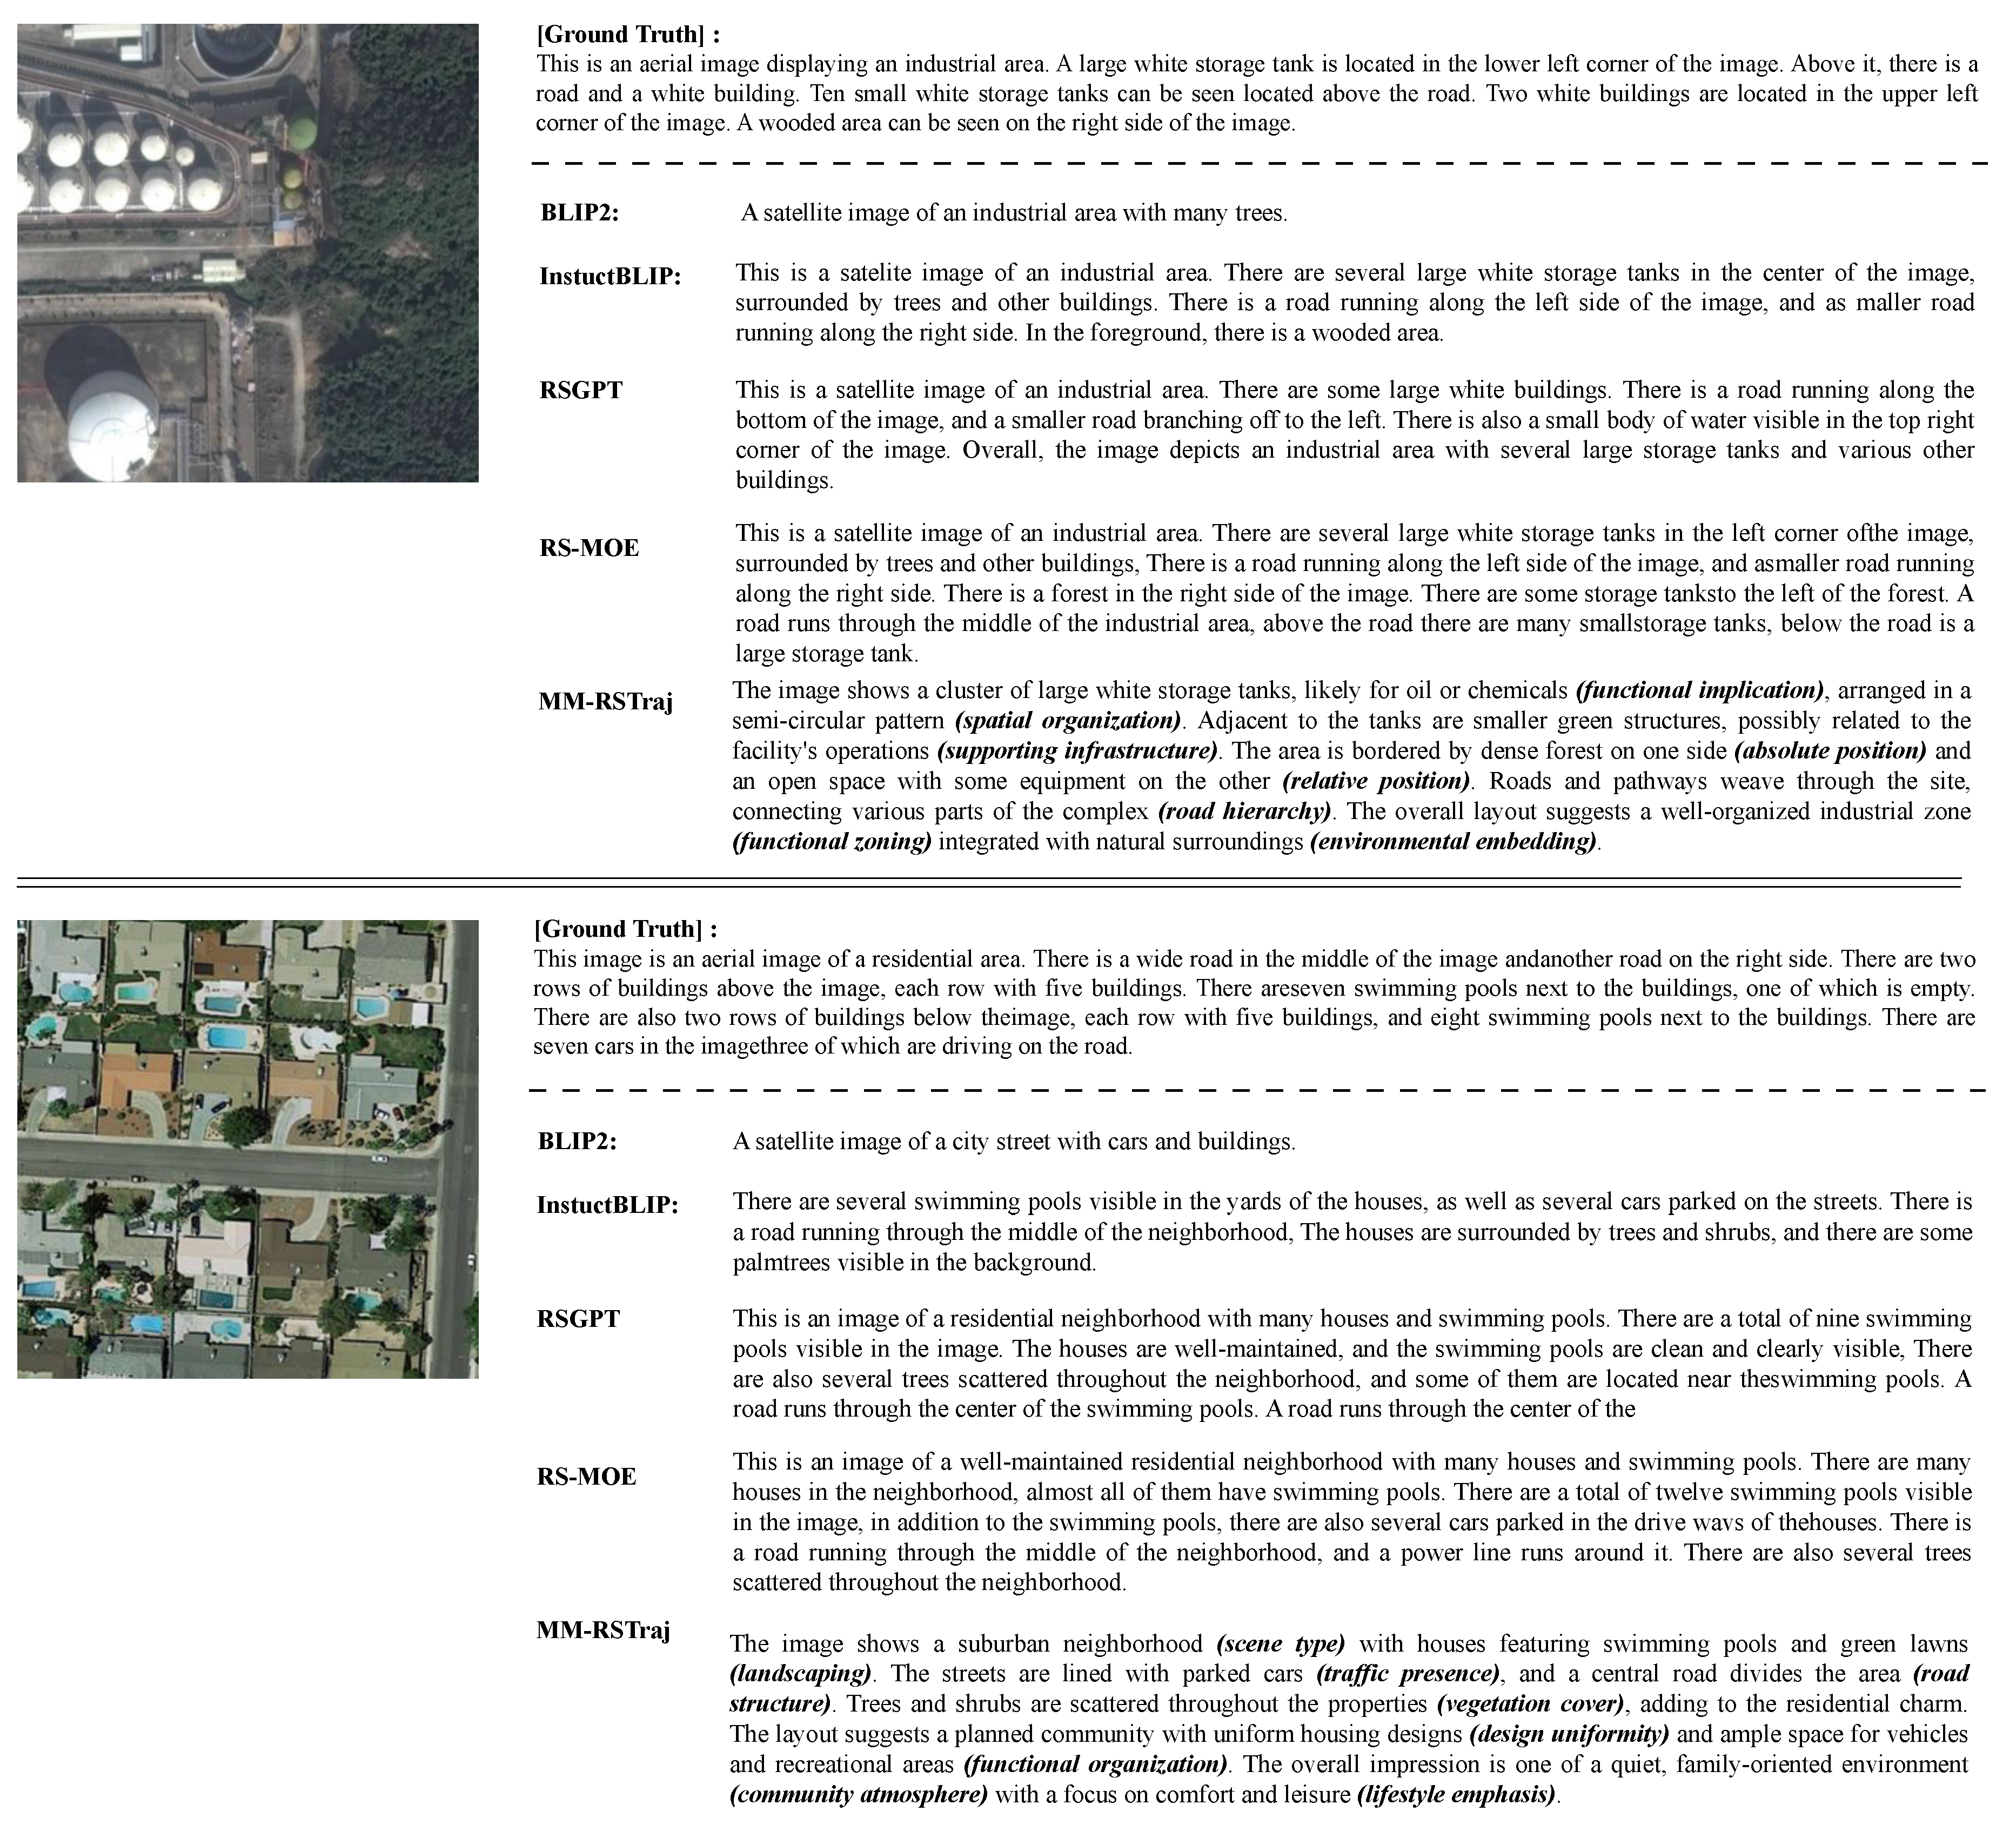
Figure 8.
Qualitative comparison of captioning outputs from RS-MoE and MM-RSTraj on two representative UCM-Captions images: a residential area and an airport. MM-RSTraj exhibits improved coherence and precision, reducing redundancy (e.g., residential spatial relationships) and enhancing structured semantic expression (e.g., airport traffic flow).
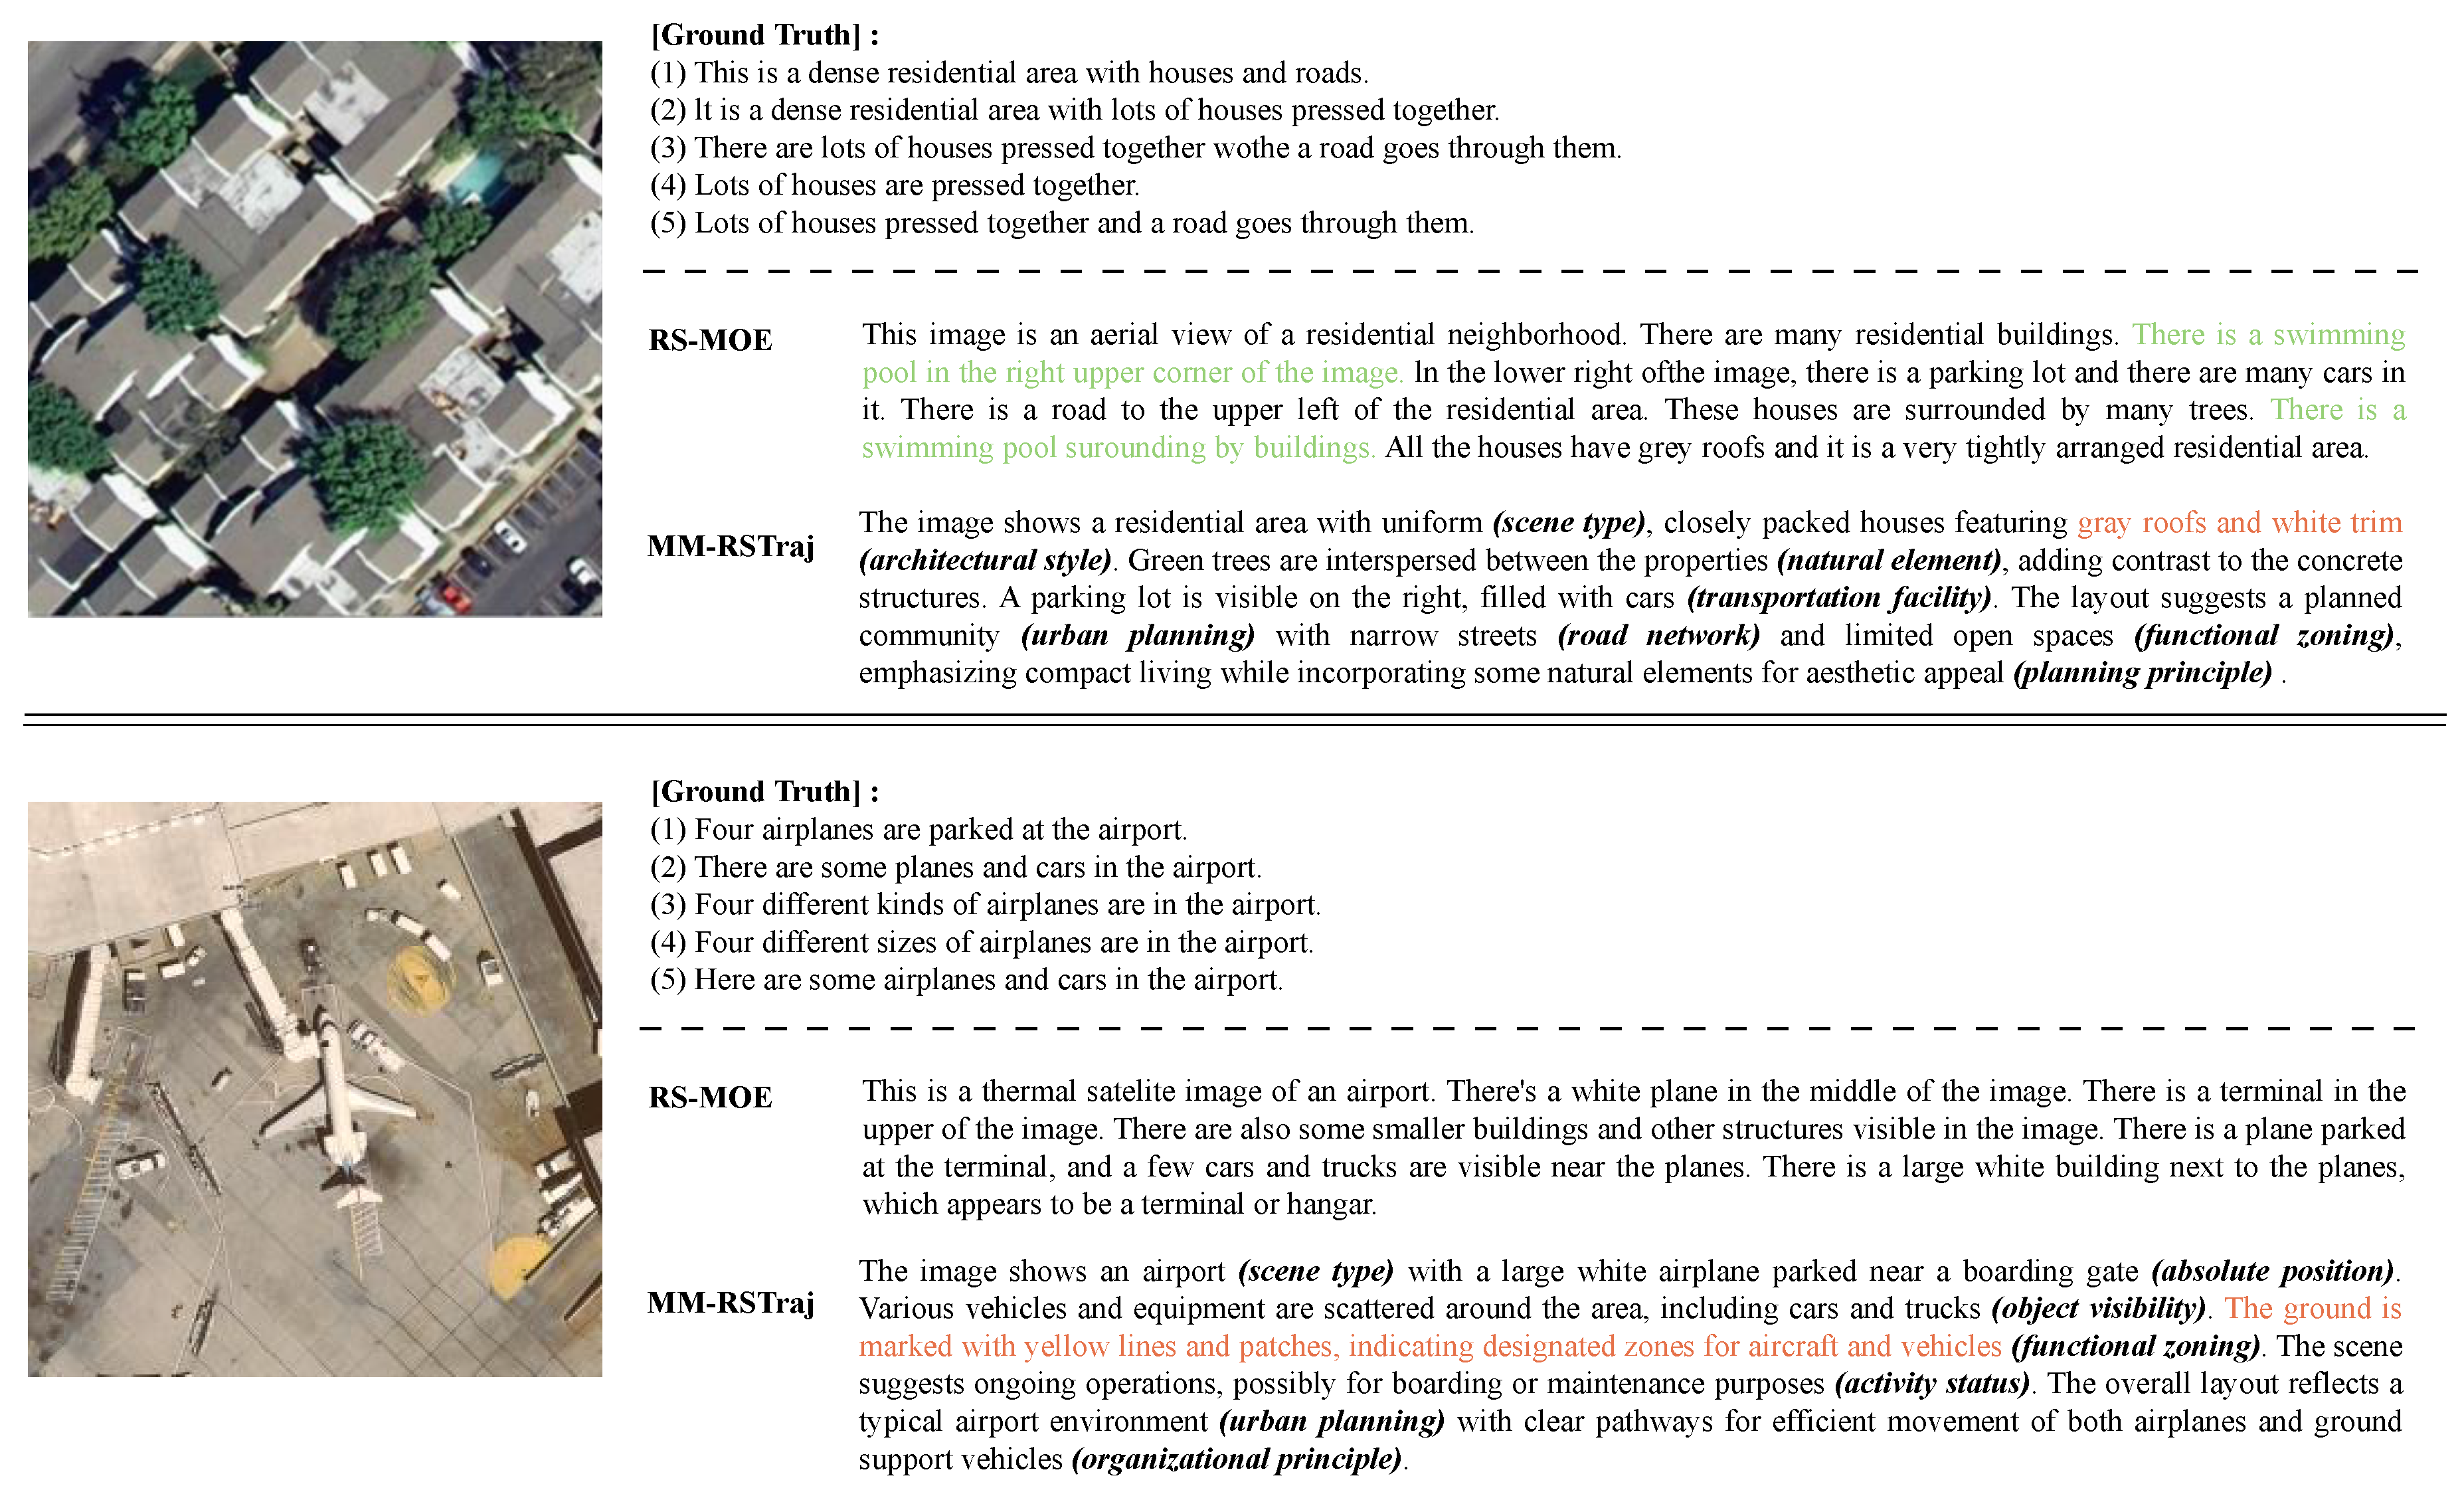
Figure 9.
Visual evaluation of model outputs on three representative RSIEval images for the RSVQA task, covering Presence, Quantity, and Reasoning categories. MM-RSTraj surpasses BLIP2, MiniGPT4, RSGPT, and RS-MoE with improved semantic completeness and reasoning, demonstrated by accurate object localization (Presence), relational object counting (Quantity), and detailed structural inferences (Reasoning).
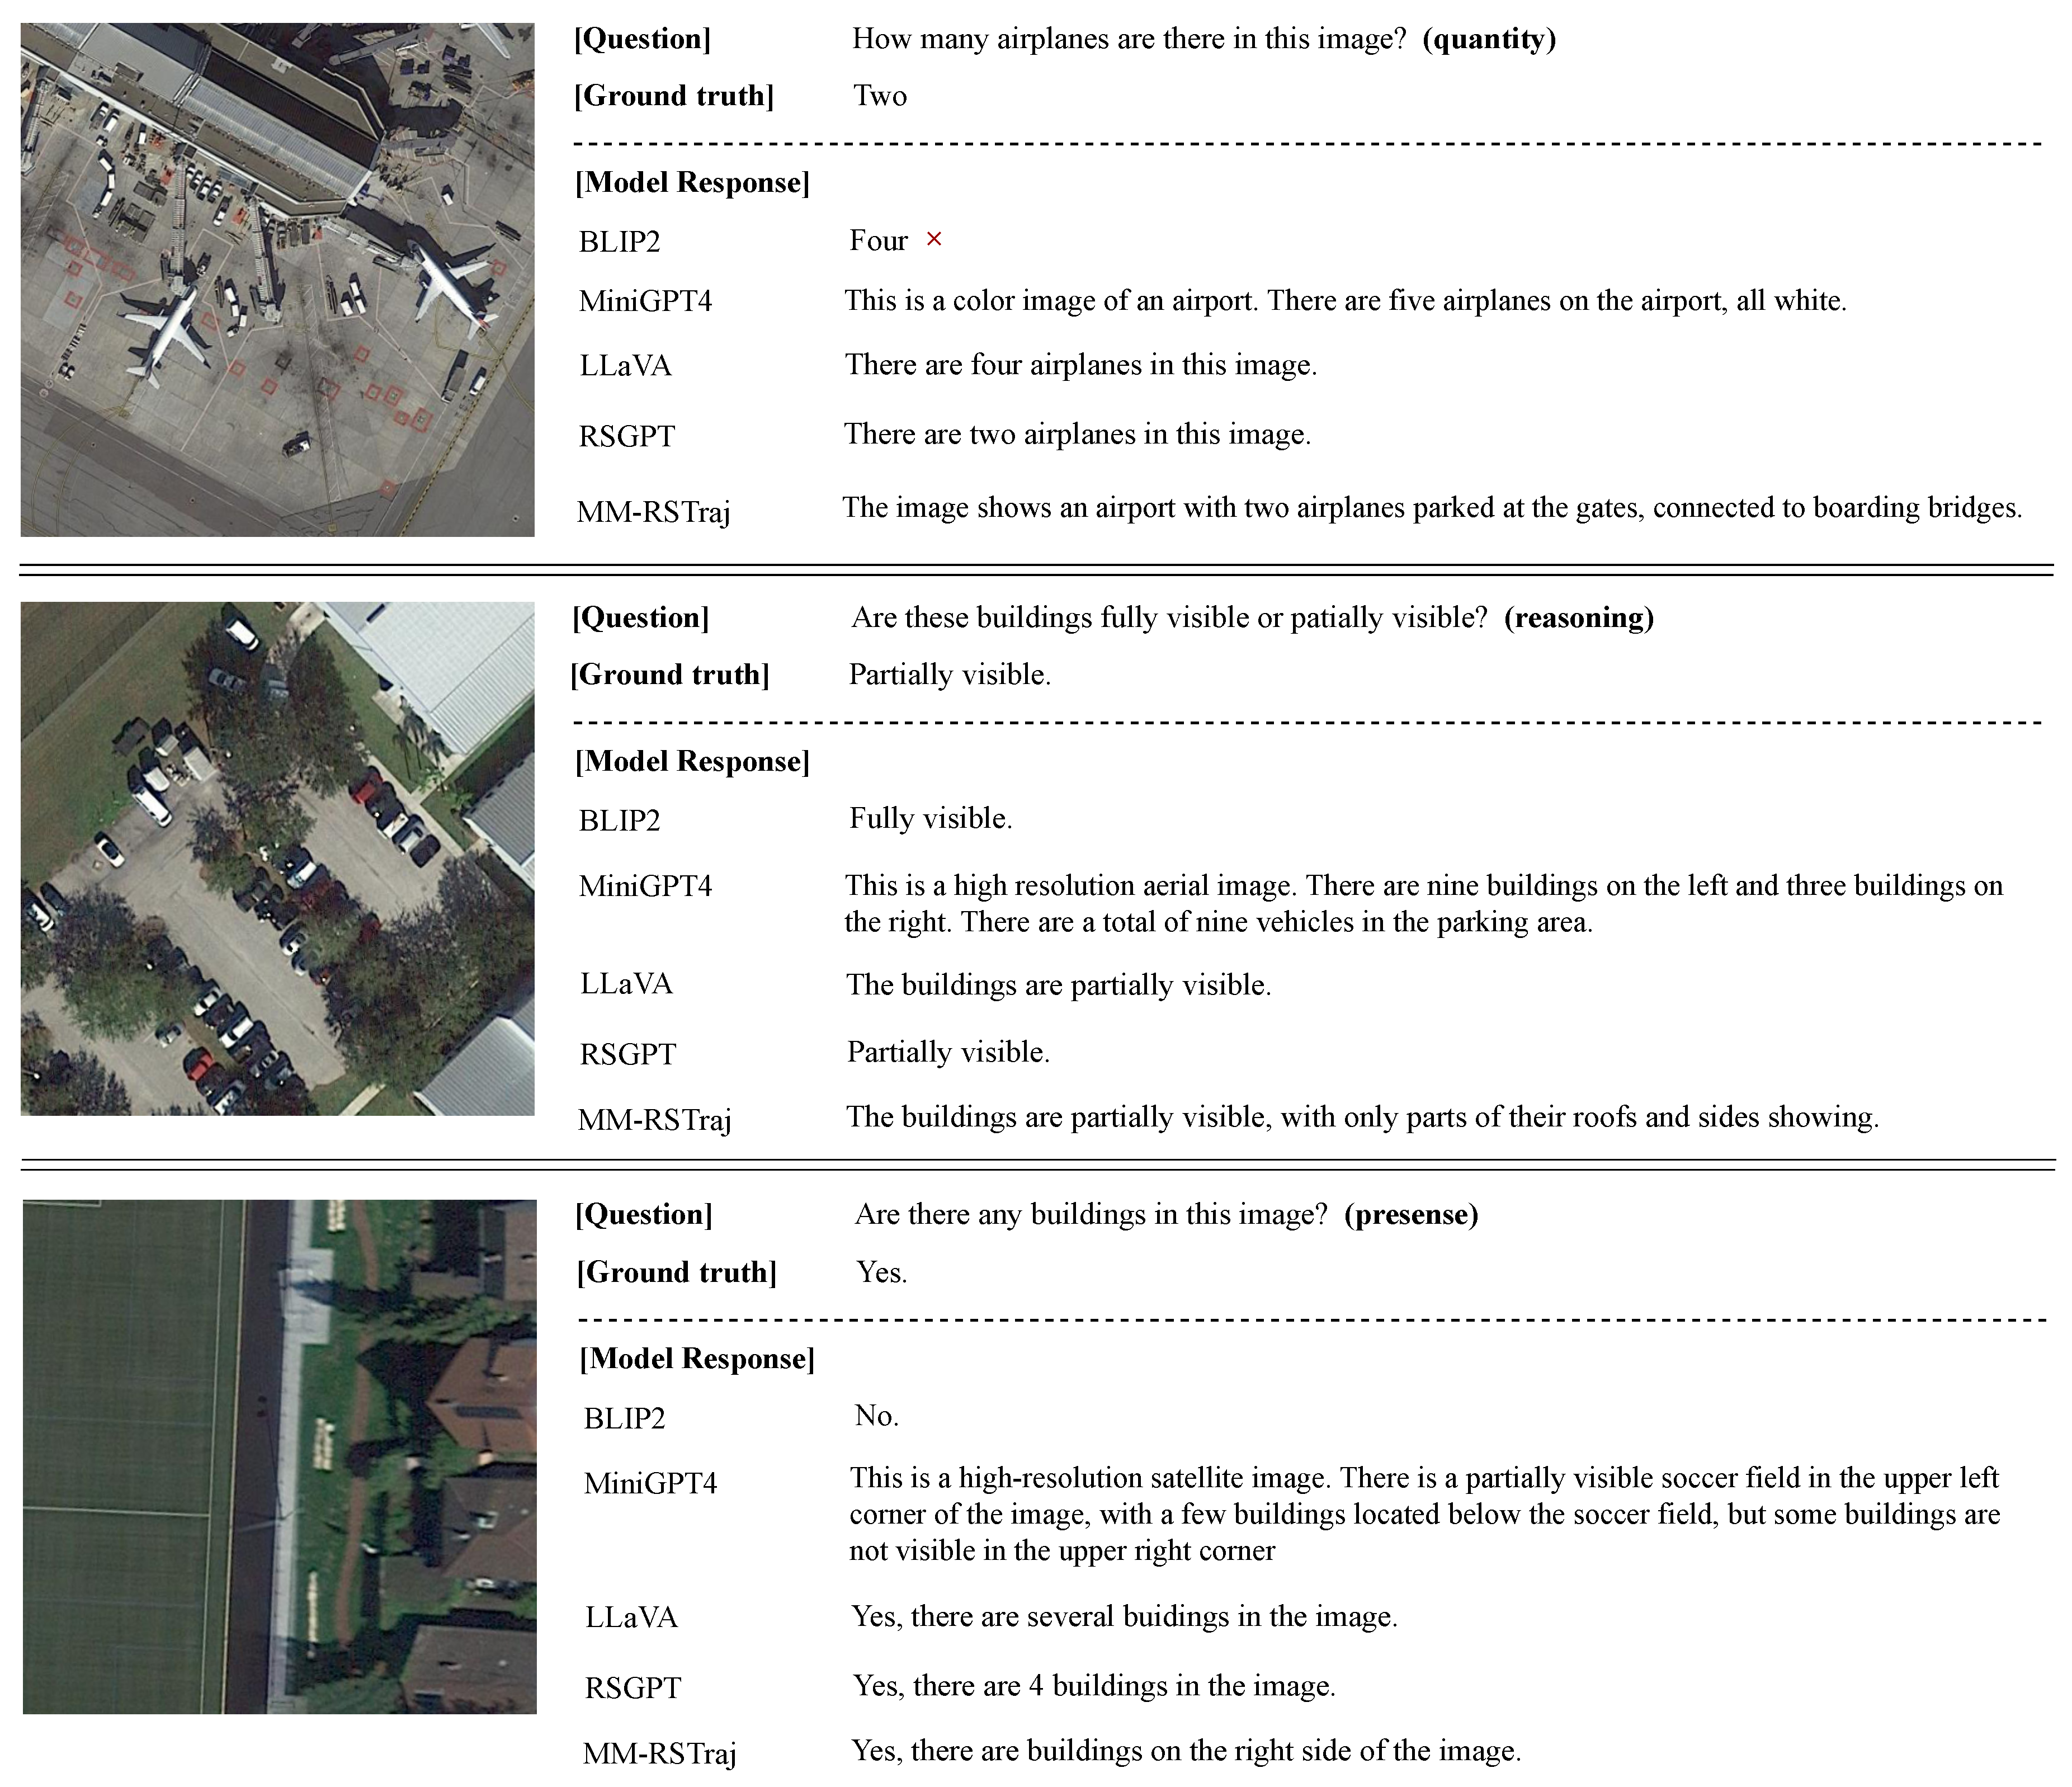
Table 2.
Performance Comparison of MM-RSTraj and State-of-the-Art Models on RSIEval Dataset for RSIC Task.
Table 2.
Performance Comparison of MM-RSTraj and State-of-the-Art Models on RSIEval Dataset for RSIC Task.
| Method | BLEU-1 | BLEU-2 | BLEU-3 | BLEU-4 | METEOR | ROUGE_L | CIDEr |
|---|---|---|---|---|---|---|---|
| BLIP2-13B [67] | 54.51 | 42.42 | 34.64 | 28.17 | 27.54 | 24.38 | 105.51 |
| MiniGPT4-13B [68] | 68.49 | 59.31 | 43.22 | 39.78 | 31.70 | 30.95 | 120.33 |
| InstructBLIP-13B [80] | 63.71 | 50.76 | 49.35 | 40.50 | 30.58 | 27.15 | 121.91 |
| RSGPT-13B [44] | 77.05 | 62.18 | 48.25 | 40.34 | 37.41 | 33.26 | 149.32 |
| RS-MoE-1B | 57.36 | 42.25 | 22.14 | 20.54 | 32.36 | 25.98 | 109.37 |
| MM-RSTraj-0.5B | 55.86 | 40.12 | 21.62 | 19.45 | 26.49 | 21.76 | 119.20 |
| RS-MoE-7B | 82.13 | 65.44 | 51.93 | 42.55 | 40.28 | 35.72 | 158.36 |
| MM-RSTraj-7B | 69.64 | 57.82 | 43.88 | 36.54 | 30.85 | 27.98 | 131.17 |
Table 3.
Performance Evaluation of MM-RSTraj and State-of-the-Art Models on UCM-Captions Dataset for RSIC Task.
Table 3.
Performance Evaluation of MM-RSTraj and State-of-the-Art Models on UCM-Captions Dataset for RSIC Task.
| Method | BLEU-1 | BLEU-2 | BLEU-3 | BLEU-4 | METEOR | ROUGE_L | CIDEr |
|---|---|---|---|---|---|---|---|
| VLAD + RNN [84] | 63.11 | 51.93 | 46.06 | 42.09 | 29.71 | 58.78 | 200.66 |
| VLAD + LSTM [84] | 70.16 | 60.85 | 54.96 | 50.30 | 34.64 | 65.20 | 231.31 |
| mRNN [81] | 60.10 | 50.70 | 32.80 | 20.80 | 19.30 | - | 214.00 |
| mLSTM [81] | 63.50 | 53.20 | 37.50 | 21.30 | 20.30 | - | 222.50 |
| mGRU [95] | 42.56 | 29.99 | 22.91 | 17.98 | 19.41 | 37.97 | 124.82 |
| mGRU embedword [95] | 75.74 | 69.83 | 64.51 | 59.98 | 36.85 | 66.74 | 279.24 |
| CSMLF [96] | 37.71 | 14.85 | 7.63 | 5.05 | 9.44 | 29.86 | 13.51 |
| SAA [97] | 79.62 | 74.01 | 69.09 | 64.77 | 38.59 | 69.42 | 294.51 |
| Soft-attention [98] | 74.54 | 65.45 | 58.55 | 52.50 | 38.86 | 72.37 | 261.24 |
| Hard-attention [98] | 81.57 | 73.12 | 67.02 | 61.82 | 42.63 | 76.98 | 299.47 |
| SD-RSIC [99] | 74.80 | 66.40 | 59.80 | 53.80 | 39.00 | 69.50 | 213.20 |
| RTRMN (semantic) [100] | 55.26 | 45.15 | 39.62 | 35.87 | 25.98 | 55.38 | 180.25 |
| RTRMN (statistical) [100] | 80.28 | 73.22 | 68.21 | 63.93 | 42.58 | 77.26 | 312.70 |
| SVM-D BOW [101] | 76.35 | 66.64 | 58.69 | 51.95 | 36.54 | 68.01 | 271.42 |
| SVM-D CONC [101] | 76.53 | 69.47 | 64.17 | 59.42 | 37.02 | 68.77 | 292.28 |
| Post-processing [102] | 79.73 | 72.98 | 67.44 | 62.62 | 40.80 | 74.06 | 309.64 |
| RS-CapRet-7B [103] | 84.30 | 77.90 | 72.20 | 67.00 | 47.20 | 81.70 | 354.80 |
| RSGPT-13B [44] | 86.12 | 79.14 | 72.31 | 65.74 | 42.21 | 78.34 | 333.23 |
| RS-LLaVA-13B [72] | 90.00 | 84.88 | 80.30 | 76.03 | 49.21 | 85.78 | 355.61 |
| RS-MoE-7B | 94.81 | 87.09 | 79.57 | 72.34 | 66.97 | 62.74 | 396.46 |
| MM-RSTraj-7B (ours) | 91.14 | 85.10 | 77.06 | 71.53 | 64.10 | 61.87 | 398.10 |
Table 4.
Performance Comparison of MM-RSTraj and State-of-the-Art Models on RSIEval RSVQA Test Set.
| Method | Presence | Quantity | Color | Absolute pos. | Relative pos. | Area comp. | Road dir. | Image | Reasoning | Scene |
|---|---|---|---|---|---|---|---|---|---|---|
| BLIP2 | 60.41 | 26.02 | 43.24 | 7.69 | 13.16 | 58.14 | 33.33 | 74.42 | 47.50 | 43.24 |
| MiniGPT4 | 29.70 | 9.76 | 31.53 | 1.54 | 1.32 | 16.28 | 0.00 | 34.88 | 17.50 | 24.32 |
| InstructBLIP | 76.14 | 21.95 | 45.05 | 12.31 | 10.53 | 69.77 | 0.00 | 81.40 | 57.50 | 45.95 |
| RSGPT | 81.22 | 39.02 | 54.05 | 38.46 | 35.53 | 62.79 | 66.67 | 93.02 | 70.00 | 89.19 |
| RS-MOE | 83.16 | 32.77 | 71.92 | 43.95 | 45.00 | 63.41 | 0.00 | 77.89 | 74.07 | 93.18 |
| MM-RSTraj | 87.31 | 33.06 | 77.59 | 68.13 | 47.50 | 81.25 | 0.00 | 61.46 | 71.24 | 93.331 |
Disclaimer/Publisher’s Note: The statements, opinions and data contained in all publications are solely those of the individual author(s) and contributor(s) and not of MDPI and/or the editor(s). MDPI and/or the editor(s) disclaim responsibility for any injury to people or property resulting from any ideas, methods, instructions or products referred to in the content. |
© 2025 by the authors. Licensee MDPI, Basel, Switzerland. This article is an open access article distributed under the terms and conditions of the Creative Commons Attribution (CC BY) license (http://creativecommons.org/licenses/by/4.0/).
Copyright: This open access article is published under a Creative Commons CC BY 4.0 license, which permit the free download, distribution, and reuse, provided that the author and preprint are cited in any reuse.


