
Submitted:
16 September 2025
Posted:
17 September 2025
You are already at the latest version
Abstract
The FTO gene rs9939609 has been positively associated with obesity in humans, but its role in dietary intake is still unclear. The aim of this study was to investigate the relationship between nutritional status and dietary intake in adults and the role of the FTO gene polymorphism in this context. In a group of 112 adults (74% women, mean age 40.1 ± 13.24 years), body composition was analysed using the bioimpedance method and body weight status was assessed using BMI criteria. Diet was assessed by three-day food records and a food frequency questionnaire. The polymorphisms of the FTO rs9939609: AA, AT, and TT were analysed by fast real-time PCR in DNA isolated from buccal swabs. The data were statistically analyzed by using analysis of variance, non-parametric tests, and multivariate analyses (principal component analysis, correspondence analysis). The frequency of the mutant A allele in the study group was 0.46. The frequency analysis of individual genotypes (TT=0.26; AT=0.56; AA=0.18) revealed that the genotype distribution in the study group was consistent with the Hardy-Weinberg law. The rs9939609 FTO gene polymorphism was associated with frequency of excessive body weight. There was no difference in the values obtained from anthropometric measurements and body composition analysis in the group. The results showed that the studied polymorphism FTO gene explained only 7.82% of the variability in features characterising the nutritional status. The analysis of obesity prevalence within families revealed a significant impact from relatives on the female line.
Keywords:
genetic obesity
; obesity
; body composition
; nutrition
; adults
; rs9939609 polymorphism
1. Introduction
The prevalence of obesity represents a significant public health challenge on a global scale [1]. Since 1980, the global prevalence of obesity has increased by more than twofold. In 2024, the World Obesity Federation posited that over the course of the following 11 years, 54% of the global population, or approximately 3.3 billion individuals, will be classified as overweight or obese [2]. Furthermore, it has been estimated that globally the adverse effects of overweight and obesity result in a greater number of deaths than the consequences of undernutrition [3]. There is a strong association between obesity and a range of adverse health outcomes, including an increased risk of cardiovascular disease, hypertension, type 2 diabetes, cancer, and obstructive sleep apnoea [4,5,6,7]. Additionally, the financial burden of treating obesity and its associated complications represents a significant challenge for healthcare budgets globally [8].
The most prevalent form of obesity is polygenic obesity, which has a complex aetiology [9]. Although a positive energy balance is the direct cause of obesity, the unsatisfactory effectiveness of a low-energy diet in treating excessive body mass has led to the search for other causes of its development. The occurrence of obesity is influenced by a number of factors, including genetic predisposition, environmental factors and the interaction between genotype and the environment [10]. Although, environmental factors, such as incorrect eating habits and insufficient physical activity play crucial role in excess weight gain, the family and twin studies showed that around 40-70% of the obesity variation in human are resulted from genetic factors [11]. Among the several dozen known genes whose influence on body weight has been examined, there is the FTO (FaT mass and Obesity-associated) gene [12]. Variants in the FTO gene, encoded on chromosome 16, have been identified as a significant genetic factor influencing obesity and related metabolic disorders [13,14,15,16].
Although the FTO deficient mice fed on either normal or high fat diet had comparable fat mass as the wild type controls [17], numerous studies have demonstrated that overexpression of FTO plays a vital role in adipogenesis [18,19,20]. Furthermore, single nucleotide polymorphisms of FTO have been linked to food intake, although the underlying mechanisms remain unclear and the research findings are inconclusive. Adult individuals with the FTO A allele of rs9939609 polymorphism had a higher intake of total fat, saturated fatty acids, monounsaturated fatty acids, and a lower intake of carbohydrate compared with TT homozygous, however the total energy intake did not differ between AA and TT groups [21]. Rahimlou et al [22] reported no significant correlation between FTO rs9939609 (A/T) polymorphism and fatty food and sweet preferences among obese and non-obese adults. However, a higher intake of added sugar was observed in a group of young adults with the TA/AA genotype vs TT [23]. The FTO A allele (AA and AT vs. TT) was found to have a significant correlation with the frequency of consumption of sweet drinks among children aged 10-12. Conversely, no significant relationship was observed for the frequency of snacks, fast food consumption or an appetite [24]. In the study among 652 adolescents no association was found between FTO rs9939609 and energy and macronutrient intake. However, in adolescents whose fat intake was above 30% of energy, the rs9939609 polymorphism was associated with a higher body fat [25]. Adolescent girls with the A allele were more likely to consume more fried food and have a lower intake of fruit compared to those with the TT genotype [26]. The observed inconsistencies highlight the necessity for further investigation into the relationship between the FTO gene and food intake, as well as the potential modifying factors.
The present study had four objectives: 1. to ascertain the prevalence of FTO rs9939609 gene polymorphisms: AA, AT, and TT; 2. to assess the nutritional status of individuals with different FTO genotypes; 3. to analyse the dietary intake of these individuals; 4. to determine the relationship between FTO genotype and dietary habits among individuals. The results will provide information on the potential scale of obesity associated with the rs9939609 polymorphism of the FTO gene, based on its relationship with dietary intake and nutritional status, as well as the frequency of its occurrence in the studied cohort of individuals with normal and excessive body weight. Understanding how dietary intake and nutritional status interact with the FTO genotype can provide insights into personalized nutrition and effective dietary interventions for those genetically predisposed to obesity.
2. Materials and Methods
2.1. Study Design and Ethical Approval
The study protocol was approved by the Ethics Committee of the Institute of Food and Nutrition, Warsaw, Poland, in accordance with ethical principles (the ethical approval dated 07/01/2015). The study was conducted in accordance with the ethical principles set forth in the Declaration of Helsinki, and all participants provided informed consent. Each participant was provided with a comprehensive description of the study and any questions or concerns were addressed. Participants were informed that they could withdraw from the study at any stage without providing a reason. To ensure participant retention, the researcher maintained direct contact with the participants throughout the study period. The main study was preceded by a pilot study, which allowed for the selection of appropriate tools and the assessment of the correctness of the performed genetic analyses. It included a number of components: analyses, measurements and tests, necessary to solve the research problem. They are listed in Figure 1.
2.2. Selection of Participants
The sample for the study was selected purposefully, with consideration of the inclusion and exclusion criteria. Recruitment for the study was conducted using the snowball method via social networking sites. Furthermore, collaboration was established with medical facilities to reach more potential participants. The following inclusion criteria were adopted for the study: a body mass index of at least 18.5 kg/m2; an age between 18 and 65; a usual/typical eating habits/diet; and consent to participate in the study. The exclusion criteria were as follows: previous surgical or pharmacological treatment of obesity; adherence to a diet that affects the usual way of eating; diagnosed eating disorders (anorexia nervosa, compulsive overeating disorder, bulimia); diagnosed epilepsy; having a pacemaker; diagnosed hormonal disorders (diseases of the thyroid gland, adrenal glands, gonads); pregnancy; age: under 18 or over 65; inability to consciously consent to participate in the study.
2.4. Nutritional Status
The anthropometric measurements, namely body weight, height, and waist circumference, were taken in accordance with the applicable, standard procedure [28]. Based on anthropometric data, body mass index (BMI = weight (kg)/(height (m))2) [29], waist-to-hip ratio (WHR = waist circumference (cm)/hip circumference (cm)) [30], and waist-to-height ratio (WHtR = waist circumference (cm)/height (cm)) were calculated [31]. Overweight was defined as BMI between 25.00 and 29.99 kg/m2, while obesity was defined as BMI ≥ 30.00 kg/m2. Central obesity was defined as WHR > 0.8 [30] and/or WHtR ≥ 0.5 [32].
Body composition was analyzed with the bioelectrical impedance (BIA) method using the body composition analyser (Akern Srl). The measurement was conducted with the subject in a standing position, with the individual standing barefoot in his/her underwear, at least four hours after a meal and at least 12 hours after intense physical activity. Body composition was assessed in accordance with the guidelines contained in the Body Composition Procedures Manual [28].
2.5. Dietary Intake
The energy and nutrients intake were assessed using the standard three-day food record method. Prior to the completion of the food record, the participants were provided with instructions on how to accurately complete the questionnaire and were furnished with an exemplar of a completed form to illustrate the task. The mean energy and nutrients intake for each individual was calculated using a dedicated computer application, “DIETA 6®” (Poland), with the Polish nutrient database for food products and dishes [33]. To assess the consumption frequency of selected food products and eating habits, the Polish-validated Food Frequency Questionnaire (FFQ-6) was used. The questionnaire covers 62 different food products. Participants were required to select one of the six categories, indicating the frequency of food consumption over the past 12 months: (1) never or almost never, (2) once a month or less, (3) several times a month, (4) several times a week, (5) daily, (6) several times a day. Additionally, the questionnaire comprised socio-demographic inquiries essential for characterising the group [34].
2.6. Genotyping
The collection of biological material for testing and all determinations were performed at the Nutrigenomics Laboratory, Department of Gastronomic Technology and Food Hygiene, Faculty of Human Nutrition and Consumer Sciences, Warsaw University of Life Sciences. The samples for testing, which consisted of a cheek swab, were collected during the first meeting with the subjects, planned as part of the study. Preparation for sampling of individuals participating in the study included a ban on: eating meals for at least one hour before taking the swab, drinking fluids (except clean water) and brushing teeth. Before taking the swab, individuals were asked to remove foreign bodies from their oral cavity, e.g. chewing gum, lollipops, sweets, etc. Two swabs were taken from one individual. The samples were frozen until further tests. DNA isolation from oral epithelium was performed using the ReliaPrep gDNA Tissue Miniprep System isolation kit (Promega) according to the manufacturer's protocol. DNA concentration was assessed using a UV-Vis NanoDrop 2000 spectrophotometer (Thermo SCIENTIFIC) for the analysis of DNA, RNA and proteins in microvolume. UV light absorbance measurements were performed by isolated materials in 2 µL samples. In all isolated samples, the concentration was sufficient for further analysis. By measuring the DNA concentration at a wavelength of 260 and 280 nm, the purity of the isolated material was determined. The ratio of the A260 to A280 absorption values indicates protein contamination of the preparations. In most samples, the value of this coefficient was between 1.8-2.0, which meant that the isolated preparations were sufficiently purified. The analysis of the rs9939609 polymorphism of the FTO gene in DNA isolated from the oral epithelium of the studied persons was performed in 2 assays, using the discrimination method (Fast Real-Time PCR). Real-time polymerase chain reaction (PCR) was performed using TaqMan Genotyping Master Mix (Applied Biosystems), using the LightCycler 96 real-time PCR thermal cycler (Roche) and LightCycler® 96 SW 1.1 software. The determination of single nucleotide polymorphism (SNP) was performed using fluorescently labeled probes for detection of the rs9939609 polymorphism in the FTO gene TaqMan SNP Genotyping Assay (Applied Biosystems). All analyses were performed according to the manufacturers' procedures and recommendations. The reaction was performed in 96-well plates in a volume of 25 μL, the mixture contained 1.25 μL of DNA material, 12.5 μL of TaqMan Genotyping Master Mix (Applied Biosystems), 1.25 μL of TaqMan SNP Genotyping Assay (applied Biosystems) and 10 μL of DNase-free water. The following reaction thermal profile was used: pre-denaturation (preincubation) 95°C for 10 min; amplification of 45 cycles of the following: denaturation 92°C for 15 s and annealing/extension 60°C for 60 s, then melting 95°C for 20 s, 40°C for 30 s, 85°C for 1 s and cooling 40°C for 30 s. To control contamination, negative samples containing water instead of DNA material were introduced on each reaction plate. 100% correct reactions were recorded. Some of the tested samples were applied in duplicate to assess the correctness and repeatability of the readings.
2.7. Statistical Analyses
A statistical analysis of the relationship between genotypes and the values of traits related to diet, nutritional status, socioeconomic factors, lifestyle, overweight and obesity in the family in the study group was performed. One-way ANOVA analysis of variance was used to analyse the relationship between the FTO rs9939609 genotype and the mean values of the studied traits from bioimpedance body composition measurements and anthropometric measurements, because the initial analysis did not show a significant effect of gender. Analyses of the frequency of consumption were performed using the Kruskal-Wallis ANOVA rank test. Before the calculations, the answers obtained in the questionnaire of the frequency of consumption were grouped. Quantitative analyses regarding the assessment of the diet and nutritional status were performed after prior standardization of the results, in order to eliminate the influence of gender and different intakes, in the case of the analysis of the diet. In the statistical analysis of the results, the following were used, respectively: the F ANOVA test for the normal distribution of features or the Kruskal-Wallis test for the distribution without normality, after previously checking the normality of the distribution of features with the Shapiro-Wilk test. Additionally, for nominal data, such as the interpretation of BMI and WHR, the chi-square test was performed. Additionally, in order to analyse the general variability of the entire set of examined persons and features, a multivariate analysis of variability using the Principal Components method (PCA) was used. Correspondence analysis was used to search for features differentiating the studied genetic groups. Statistical significance was assumed for the value of p ≤ 0.05. All results were processed using the Statistica ver.13 statistical package (TIBCO Software Inc. 2017. Statistica data analysis software system, version 13. http://statistica.io.).
3. Results
The study involved 112 adults aged between 18 and 65 years (mean age 40.1 ± 13.24 years, mean BMI 30.1± 7.36 kg/m2), 74% of whom were female. The study participants did not exhibit a significant disparity in terms of age and BMI (p = 0.34 and 0.66, respectively). 3.1. Genotype Characteristics
The allele and genotype frequencies in the study population were determined by counting genotypes. All 3 genotypes associated with the rs9939609 polymorphism in the FTO gene were present in the study group. The percentage of individuals with the AA genotype (homozygotes with polymorphism) was the lowest, slightly more participants were characterized by the TT genotype (homozygotes without polymorphism). The largest group was represented by people with the TA genotype (heterozygotes), which constituted more than half of the study group. The exact values are presented in Table 1. The A allele occurred in almost 46% of the study group (45.99%), while the T allele in 54%.
3.2. Genotype and Nutritional Status
In the study group, a relationship was demonstrated between the occurrence of the rs9939609 polymorphism in the FTO gene and the BMI value (Pα ≤ 0.05; Table 2), which is an indicator of the nutritional status in adults. Individuals with the A allele in their genotype showed significantly more excess body weight in their phenotype. The A allele significantly increased the incidence of overweight and obesity, with obesity occurring 27% more often in the group of individuals with the homozygous AA genotype compared to the group with the homozygous TT genotype.
The values of anthropometric measurements and the results of body composition analysis by genotype are presented in Table 3. The mean values of anthropometric and body composition measurements across genotypes exhibited a tendency towards association with the FTO genotype. However, no significant differences were identified between the means for individual genotypes, which may have arisen from high variability within the groups. In the case of homozygotes with the A allele, i.e. those at risk of obesity, height and weight indicated a higher BMI compared to the other groups. Waist and hip circumferences were also found to be elevated. The analysis of body composition measurements indicates that individuals who carry the risk allele exhibit elevated levels of fat mass and cellular mass, while concurrently demonstrating a reduced percentage of muscle mass and total water.
The application of principal component analysis demonstrated that the studied polymorphism in the FTO gene explained a mere 7.82% of the overall variability of traits characterising nutritional status.
The study revealed a relationship between extracellular water content (in Liters) and the presence of the rs9939609 polymorphism in the FTO gene, both in men and women (Figure 1). The A allele was found to be associated with higher extracellular water content in AA homozygotes, with a simultaneous significant difference observed between men and women. No such effects were observed for the remaining characteristics.
Figure 1.
The relationship between the extracellular water content (ECW in litres) and the genotype (1-TT genotype, 2-TA genotype, 3-AA genotype) is divided by gender (1-women, 2-men).
Figure 1.
The relationship between the extracellular water content (ECW in litres) and the genotype (1-TT genotype, 2-TA genotype, 3-AA genotype) is divided by gender (1-women, 2-men).
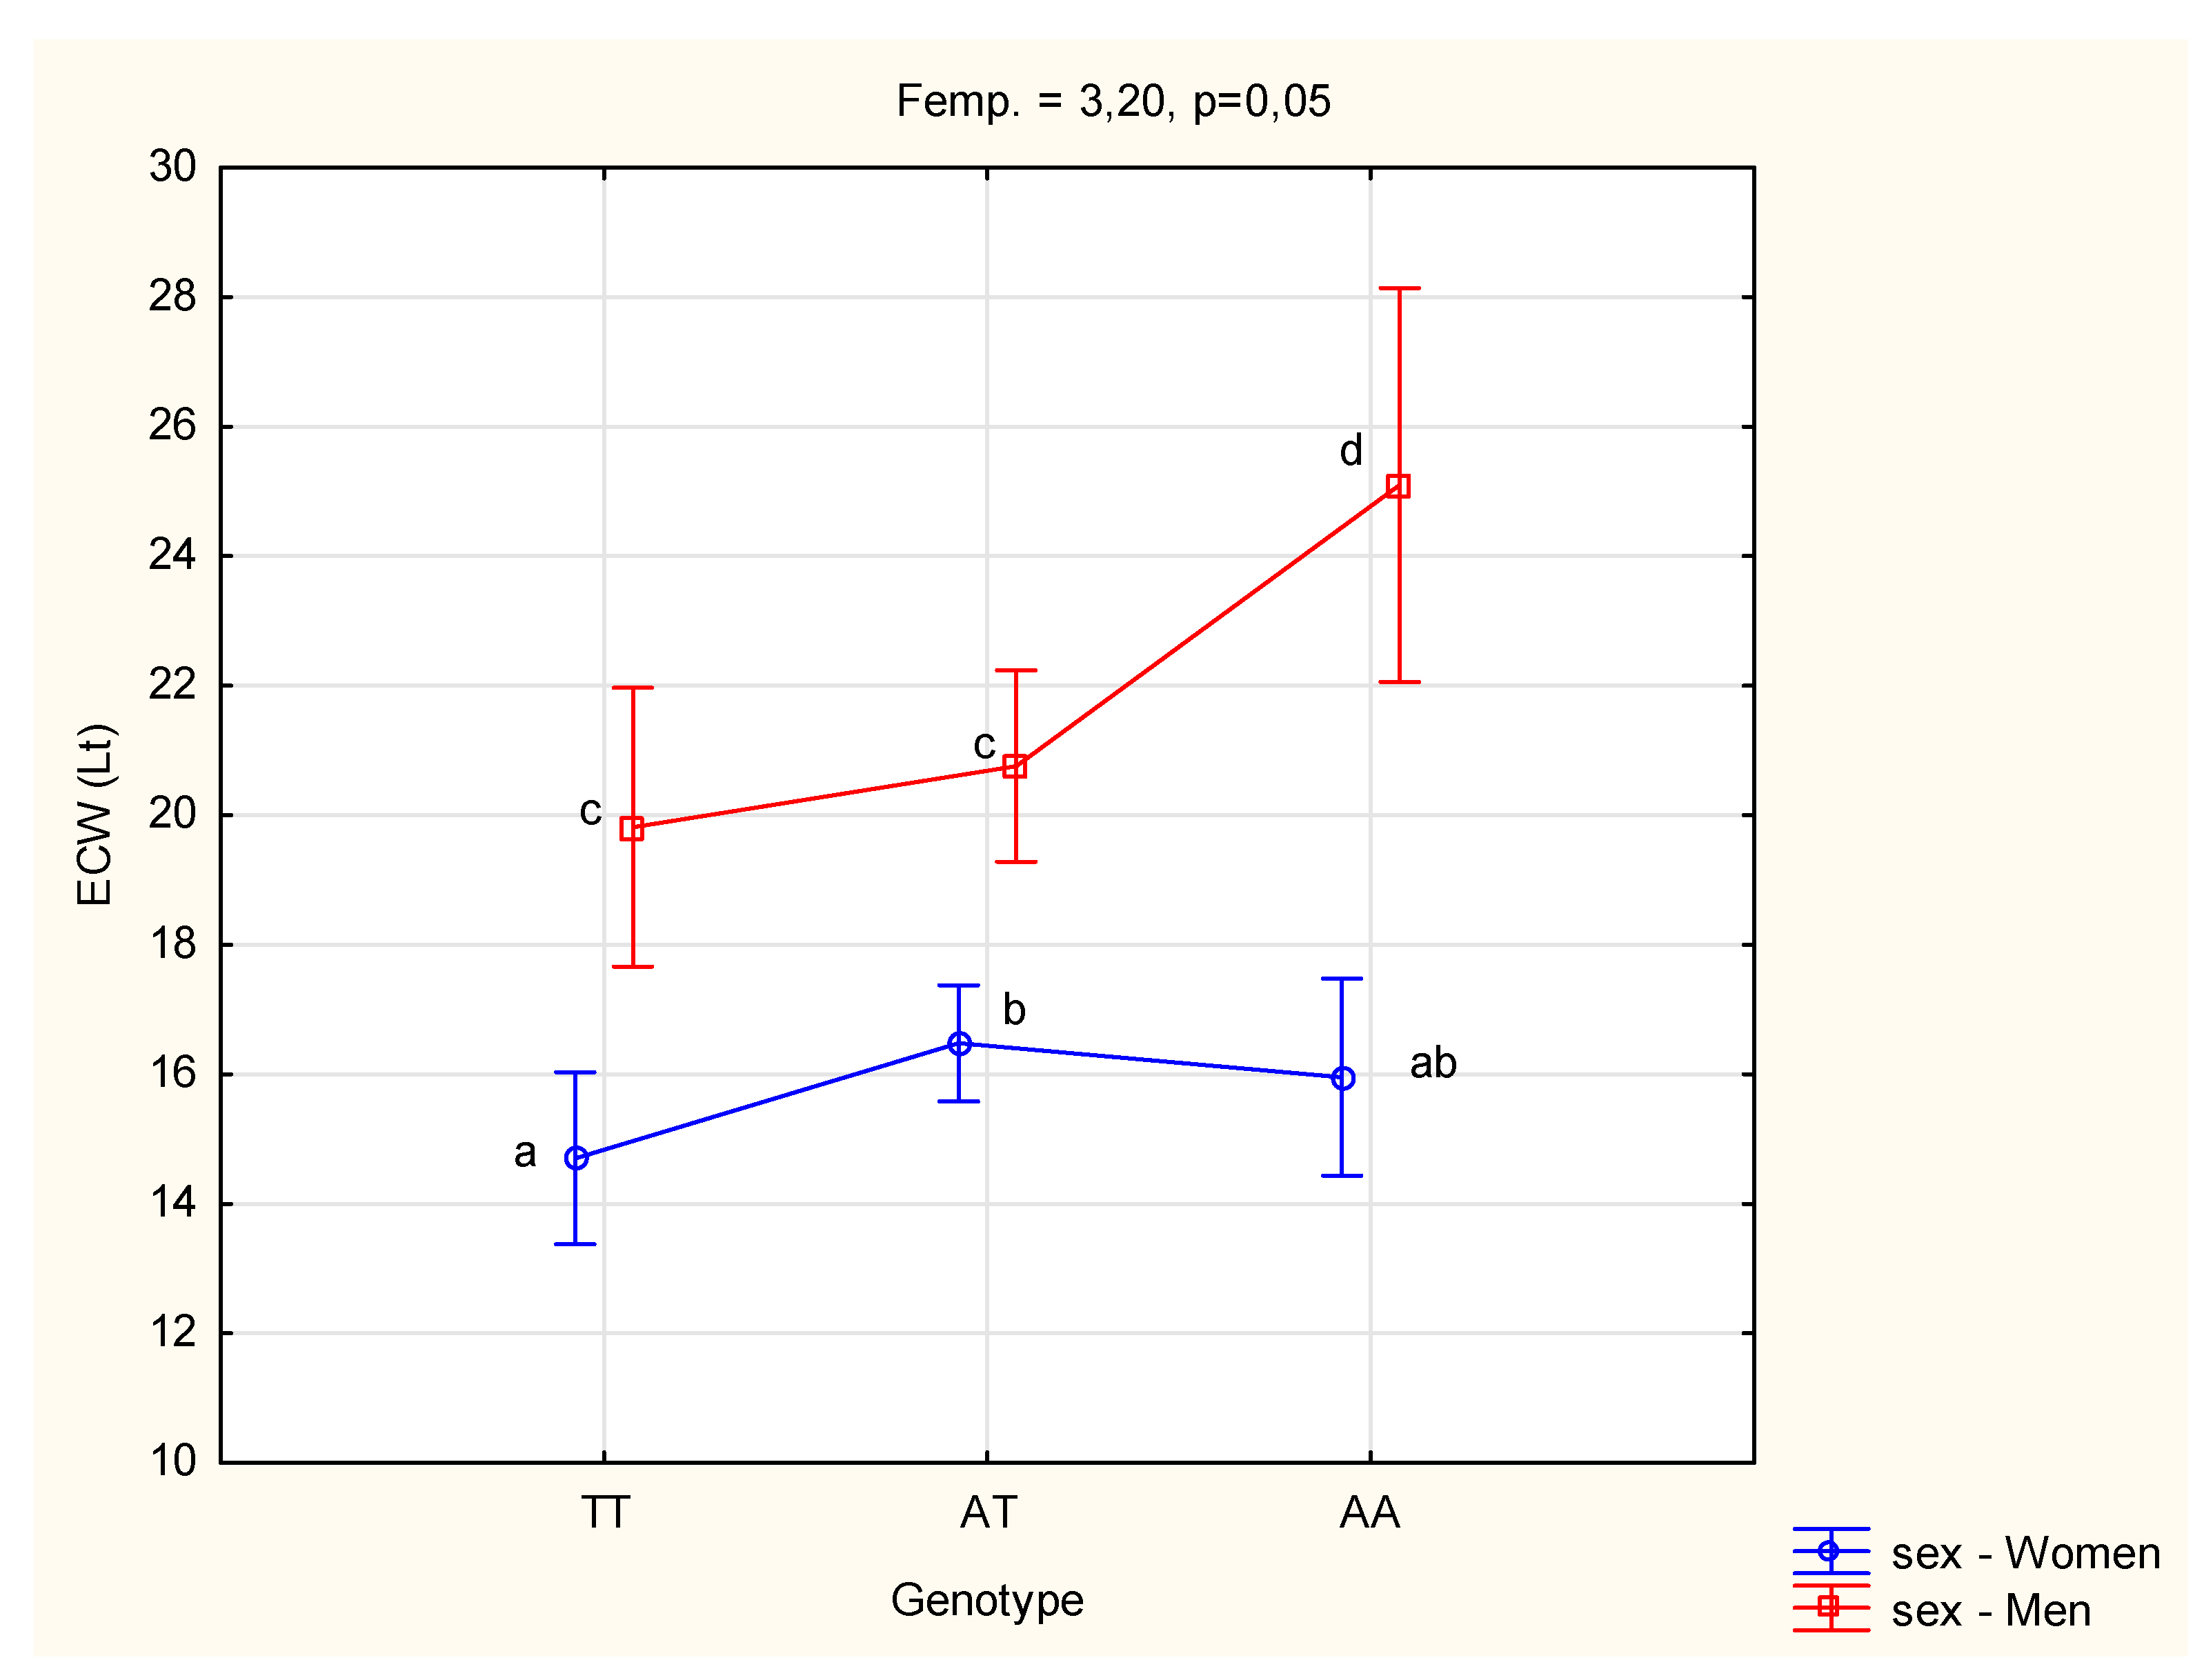
Table 4 presents the prevalence of excess body weight among relatives of the study participants. The prevalence of excess body weight was reported most frequently among respondents' parents, siblings, and mothers' siblings. A heightened prevalence of obesity was observed in these relatives, with this phenomenon being primarily evident among individuals who were AT heterozygotes. A tendency towards increased reporting of excess body weight in the female line was observed. The analysis of the data using Spearman's rank order correlation revealed a slight (r = 0.24 - 0.27; p < 0.05) but significant association between excess body weight in siblings and mothers of the study participants and the risk genotype.
3.2. Genotype and Dietary Charactetistics
Dietary analysis, encompassing energy and nutrient intake, failed to substantiate the association between the FTO gene polymorphism and dietary patterns. There was no statistically significant relationship identified between energy and nutrients intake and the rs9939609 polymorphism in the FTO gene (detailed data available in Table S1 and Table S2 in the Supplementary Materials).
The results of the Kruskal-Wallis ANOVA test indicated the presence of relationships between genotype and frequency of consumptions food products and food groups (Table 5). Homozygous carriers of the risk allele A exhibited a statistically significant reduction in the consumption of refined small-grained groats; tropical fruits (other than kiwi and citrus fruits); lean fish; and yellow-orange vegetables. A tendency among these subjects to consume biscuits and cakes with greater frequency, while vegetables such as cucumber less frequently was noted. Individuals with the A allele tend to consume products such as ice cream and pudding, ready-made breakfast cereals, berries, and avocado with lower frequency compared to others.
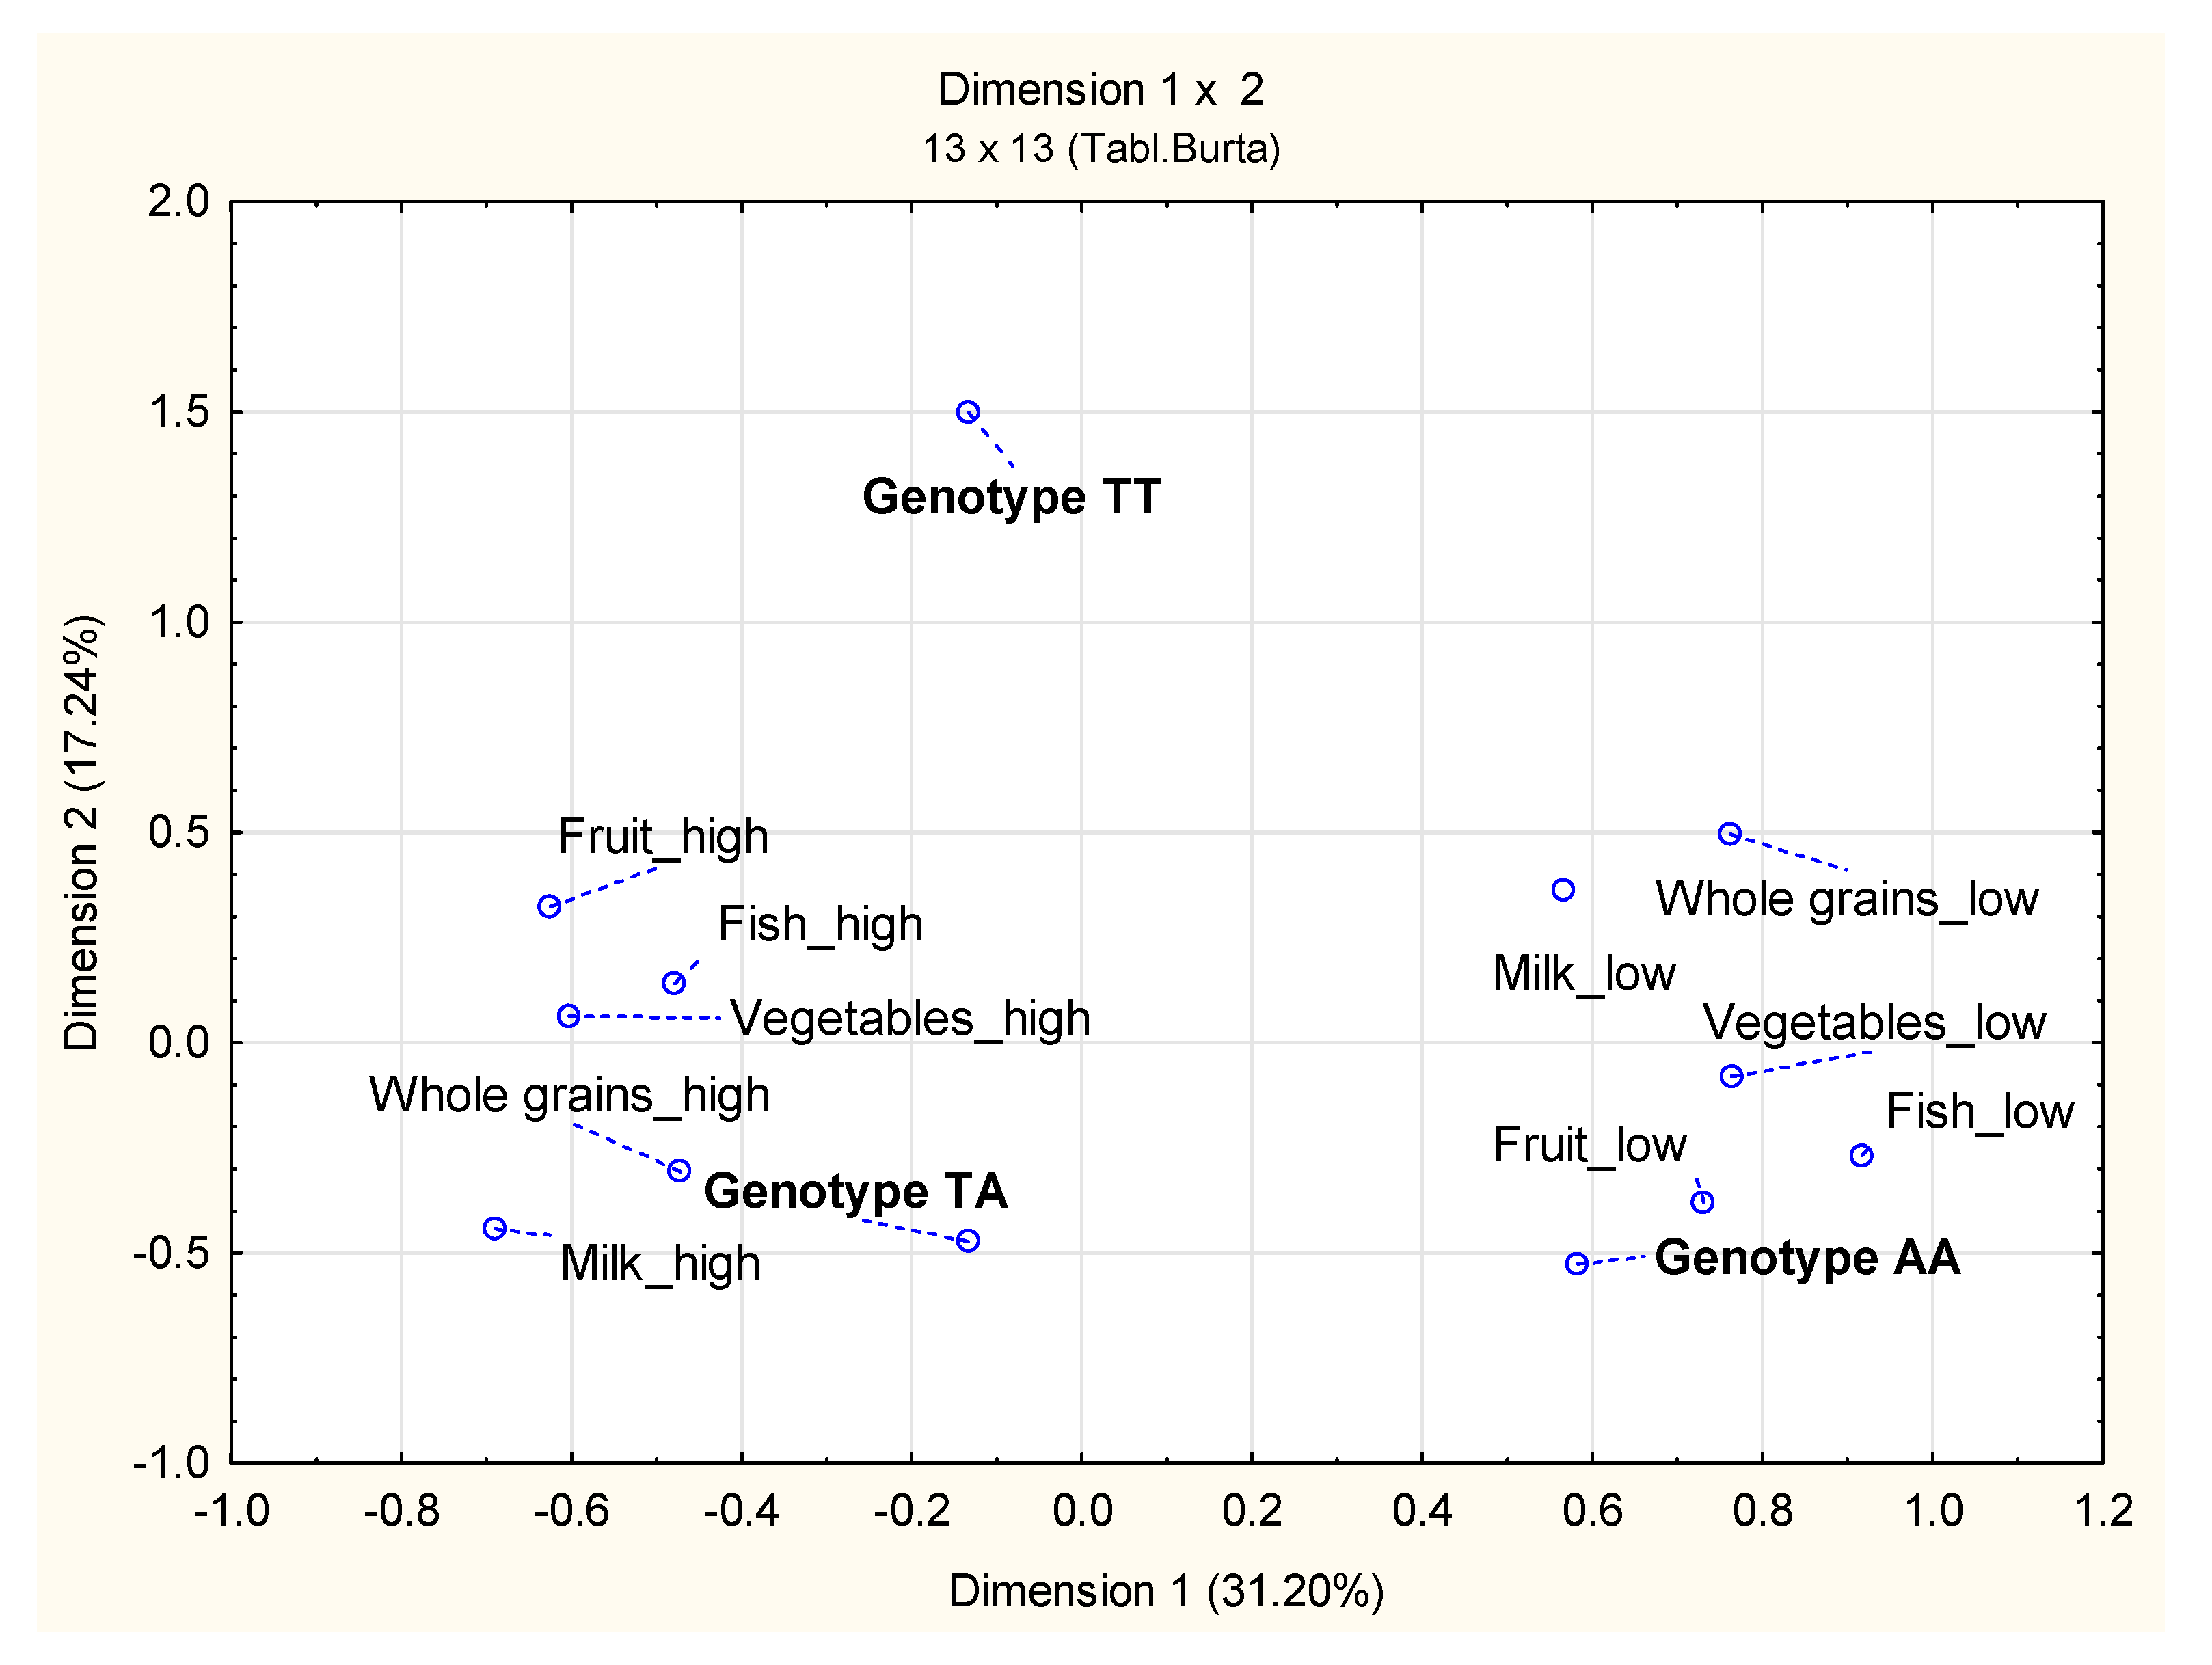
The relationship between genotype and key determinants of healthy nutrition was analysed, including daily consumption of fruits and vegetables, whole-grains, dairy products, and consumption of oily fish at least once a week (Figure 2). There were differences between the TA and AA genotypes: the presence of the homozygous risk genotype corresponded with a lower frequency of consumption of high-nutrient foods. The results also revealed a different dietary pattern among carriers of the A allele (heterozygotes). These individuals reported higher consumption of fruits, vegetables, oily fish, whole-grain cereals, milk, and natural dairy products compared to AA genotype individuals.
Figure 2.
The correspondence analysis of genotypes and frequency of consumption of selected product groups (high – consumption at least once a day for fruit, vegetables, milk, whole grains or several times per month for fish; low – consumption less than once a day for fruit, vegetables, milk, whole grains or less than several times per month for fish).
4. Discussion
The rs9939609 polymorphism in the FTO gene was detected in the study group. The frequency of the mutant A allele was found to be 0.46. Analysis of the genotype distribution using the χ2 test (Chi2) showed that the study group was in genetic equilibrium according to the Hardy-Winberg law. There was no significant deviation between the actual and expected values (the χ2 statistic value was 0.99 at p=0.05). Similar results were obtained by Livingstone et al. [35]. Based on the obtained results, it was estimated that the frequency of the A allele in the Polish population is the same as in other European countries [36]. In a study on the Turkish population [37], in a group of 200 participants in the same age range (18-65 years), the frequency of the rs9939609 AA genotype was 19.0%, 42.5% of the AT genotype and 38.5% of the TT genotype (wild type). In contrast to the study in question, in this group the difference between the frequency of the FTO gene alleles in men and women was statistically significant. In men, the risk allele was less common - 34.5% of men and 46.0% of women had the A allele, while 65.5% of men and 54.0% of women had the T allele. The frequency of the A allele was slightly lower than in the study in question [37]. In a study conducted in a group of 300 people from Italy, the frequency of the AA genotype was 0.20, the AT genotype 0.46, and the TT genotype 0.34 [38]. The frequency of the A risk allele in the European population according to HapMap is 0.45. It is therefore almost identical to that in the present study. There were no large intercontinental differences in the frequency of the rs9939609 polymorphism in the FTO gene. The results of studies in East Asian populations are comparable to those among people of European descent [39].
In the studied group of individuals, a relationship was demonstrated between the presence of the rs9939609 polymorphism in the FTO gene and body mass status. The results of the present study are consistent with the results of the study among over 38 thousand Europeans. Homozygous carriers of the allele A, constituting 16% of the studied population, exhibited an average body mass approximately 3 kg higher than that of other participants and demonstrated a predisposition to obesity that was 1.67 times greater [40]. The relationship between the rs9939609 genotype of the FTO gene and overweight and obesity, along with its impact on additional anthropometric variables, was also observed in a representative group of adult Poles. The frequency of the AA genotype increased with higher BMI in both sexes and was associated with higher anthropometric obesity indicators in both men and women. The AA rs9939609 genotype of the FTO gene was found to be significantly associated with abnormal BMI (overweight or obesity) in men, irrespective of age, smoking, physical activity, diet, and the presence of diabetes. In women, this association was significant after additionally considering menopause [36].The risk allele A of the SNP rs9939609 in the FTO gene has been found to be closely associated with obesity and BMI in a number of Asian populations, including those of ethnic Chinese [41], Malaysians and Singaporeans [42], as well as residents of East and South Asia [43]. Recent global studies have linked the variant rs9939609 to a higher risk of obesity among Brazilians [44], young adults in China [24], and adults in Shiraz, Iran [38]. The FTO polymorphism may be associated with anthropometric parameters, e.g. carriers of the allele A polymorphism rs9939609 of the FTO gene have a higher percentage of body fat [45] and waist circumference [46]. In the present study, a significant difference between individual genotypes was demonstrated only for the extracellular water content. Allele A has been demonstrated to be associated with a higher extracellular water content in the body of AA homozygotes, exhibiting a significant difference between female and male subjects. In other study in obese individuals, the volume of extracellular fluid was positively related to the amount of body fat [47]. The absence of substantial disparities, notwithstanding the discernible trends, for the other evaluated parameters may be attributed to considerable variability within individual groups.
In addition to the genetic analyses conducted, the prevalence of excessive body weight among the relatives of the subjects was estimated based on their declarations. The elevated prevalence of obesity observed among these relatives was predominantly observed among heterozygotes AT, a finding that warrants further investigation. The responses indicating the frequency of excessive body weight in the family suggest the presence of genetic factors predisposing to excessive body weight in the studied group. A further observation to be made from the results obtained is the tendency for females to be declared to have excessive body weight more frequently than males. A significant association has been identified between the occurrence of excessive body weight in siblings and mothers of the respondents with the risk genotype, and the risk of developing the condition. This association may be related to genetic factors influencing body weight, which may be inherited mitochondrial, as well as to environmental factors such as family dietary patterns, including features such as: type and amount of food, food groups, meal frequency, dietary preferences, or avoidance of certain foods.
The meta-analysis conducted by Livingstone [48] indicated a weak inverse relationship between the risk allele of FTO and energy intake in adults, as well as the role of the FTO gene in changing the proportion of energy consumed in the diet from fat and protein. In the study conducted by Daya et al. [49], it was observed that obese individuals with the AT/AA genotype exhibited a fat intake that was 1.40 times higher than that of individuals with the TT genotype. The A allele of the rs9939609 FTO gene was associated with higher total fat, saturated fatty acids, and fat-rich ultra processed foods intake, as well as higher adherence to the Western dietary pattern in 173 healthy adults in Argentina [21]. Individuals with the A allele showed a heightened predilection for foods, particularly those with high added sugar content [50].The present study has not provided clear evidence to support the hypothesis that dietary habits are associated with the occurrence of gene polymorphism. Quantitative analysis revealed no significant disparities in energy and nutrient intake between the groups. However, the qualitative analysis indicated relationships between the consumption of certain product groups and gene polymorphism. A relationship was identified between the frequency of consumption of key indicators of a healthy diet and the TA and AA genotypes. Individuals with the AA genotype exhibited a consumption frequency of fatty fish, vegetables, fruits, milk and dairy products, and whole grain products that was lower than that which is recommended. In contrast, no substantial correlation was identified between the FTO rs9939609 (A/T) polymorphism and preferences for sweet and fatty foods among a sample of 77 Iranian adults [22]. The relationships between the rs9939609 polymorphism in the FTO gene and the frequency of consumption of food groups [51], and dietary patterns [35], were also not demonstrated in a large population of adult Europeans. However, individuals who possessed two copies of the allele A, and who exhibited the lowest intake of fried foods, demonstrated an average BMI that was 1.4 kg/m2 higher and a waist circumference that was 3.1 cm greater, in comparison to individuals who did not possess the risk allele A, and who similarly exhibited the lowest consumption of fried foods [35]. These results, in conjunction with the findings of our own study, may indicate disparities in energy expenditure and nutrient utilisation among individuals who carry the risk allele A.
While genetic factors undoubtedly play a role in the pathogenesis of obesity, they are not the sole cause of the significant increase in obesity rates observed in recent years, as they have remained relatively stable over such a brief period [52]. Irrespective of the underlying cause, the accumulation of excess fat and subsequent obesity are the consequence of a prolonged energy imbalance, characterised by the ingestion of greater energy than is expended by the body, resulting in a positive energy balance. Consequently, modifying dietary habits and enhancing physical activity are pivotal in the management of obesity. It is evident that lifestyle modifications, particularly dietary changes in cases of genetically determined obesity, can result in weight loss irrespective of genetic predisposition.
The present study has several strengths. To the best of our knowledge, this study is the first to examine the relationship between the FTO gene polymorphism rs9939609 and dietary habits, considering both qualitative characteristics (frequency of consumption of products/product groups) and quantitative characteristics (energy and nutrient intake), and nutritional status. Nevertheless, the study was subject to certain limitations. The utilisation of self-reported dietary assessment methods is susceptible to the occurrence of reporting bias, which represents a significant limitation. However, all participants were thoroughly instructed on how to provide their responses and had direct contact with a dietitian throughout the study. Furthermore, the relatively limited sample size of this study constitutes a limitation, in that it precludes the possibility of extrapolating the results to the broader population of Poles.
5. Conclusions
In the studied group, the presence of polymorphism rs9939609 in the FTO gene was observed, with the frequency of the mutated allele A being 0.46. The study indicates a significant association of polymorphism rs9939609 in the FTO gene with the prevalence of excessive body weight in individuals with AT and AA genotype groups. The studied polymorphism FTO gene explained only 7.82% of the variability in features characterising the nutritional status. The analysis of obesity prevalence within families revealed a significant impact from relatives on the female line. Nevertheless, the absence of observed disparities in nutrient intake between genotypes suggests the presence of other significant factors contributing to excess body weight. The AA genotype exerts a significant influence on the regulation of body homeostasis; however, this influence is subject to substantial modulation by other environmental factors. The utilisation of genetic testing for the identification of the FTO gene polymorphism may facilitate the personalisation of dietary interventions, thereby enhancing their efficacy. There is an absence of international consensus or guidelines regarding the utilisation of genetic testing in patients diagnosed with obesity. Consequently, it can be hypothesised that the pursuit of knowledge and the development of therapeutic solutions for the treatment of genetically determined obesity will become a substantial component of scientific research in the near future, representing a pathway to the development of personalised diet therapy.
Supplementary Materials
The following supporting information can be downloaded at the website of this paper posted on Preprints.org, Table S1: The average daily macronutrient intake based on three-day food records for each individual genotype; Table S2: The average daily vitamins and minerals intake based on three-day food records expressed for 1000 kcal for each individual genotype.
Author Contributions
The following statements should be used “Conceptualization, W.P. and M.S.S.; methodology, W.P. and M.S.S. and J.M.R.; software, W.P. and J.M.R.; validation, J.M.R. and W.P.; formal analysis, W.P. and J.M.R.; investigation, M.S.S.; resources, M.S.S.; data curation, M.S.S.; writing—original draft preparation, J.M.R. and W.P.; writing—review and editing, W.P. and J.M.R.; visualization, W.P. and J.M.R.; supervision, W.P. and J.M.R.; project administration, M.S.S; funding acquisition, M.S.S. All authors have read and agreed to the published version of the manuscript.”.
Funding
This research received no external funding. The article was financed by the Polish Ministry of Sciences and Higher Education with funds from the Institute of Human Nutrition Sciences WULS for scientific research.
Institutional Review Board Statement
The study was conducted in accordance with the Declaration of Helsinki, and approved by the Ethics Committee of the Institute of Food and Nutrition, Warsaw, Poland (protocol dated 7th of January 2015), for studies involving humans.
Informed Consent Statement
Informed consent was obtained from all subjects involved in the study.
Data Availability Statement
Data are available on request due to privacy restrictions. The data presented in this study are available on request from the corresponding authors. The data are not publicly available due to internal regulations.
Acknowledgments
The authors would like to express their gratitude to all study participants for their time and patience during the procedures.
Conflicts of Interest
The authors declare no conflicts of interest.
References
- NCD Risk Factor Collaboration (NCD-RisC). Worldwide trends in underweight and obesity from 1990 to 2022: a pooled analysis of 3663 population-representative studies with 222 million children, adolescents, and adults. The Lancet 2024, 403, 1027-1050.
- World Obesity Federation. World Obesity Atlas 2024. World Obesity Federation, London, 2024.
- Chong, B., Jayabaskaran, J., Kong, G., Chan, Y. H., Chin, Y. H., Goh, R., Kannan, S., Ng, C. H., Loong, S., Kueh, M. T. W., Lin, C., Anand, V. V., Lee, E. C. Z., Chew, H. S. J., Tan, D. J. H., Chan, K. E., Wang, J. W., Muthiah, M., Dimitriadis, G. K., Hausenloy, D. J., … Chew, N. W. S. Trends and predictions of malnutrition and obesity in 204 countries and territories: an analysis of the Global Burden of Disease Study 2019. EClinicalMedicine, 2023, 57, 101850. https://doi.org/10.1016/j.eclinm.2023.101850. [CrossRef]
- Chandrasekaran, P.; Weiskirchen, R. The Role of Obesity in Type 2 Diabetes Mellitus—An Overview. Int. J. Mol. Sci. 2024, 25, 1882. https://doi.org/10.3390/ijms25031882. [CrossRef]
- Tiffany M. Powell-Wiley, Paul Poirier, Lora E. Burke, Jean-Pierre Després, Penny Gordon-Larsen, Carl J. Lavie, MD, Scott A. Lear, Chiadi E. Ndumele, Ian J. Neeland, Prashanthan Sanders, Marie-Pierre St-Onge. Obesity and Cardiovascular Disease: A Scientific Statement From the American Heart Association. Circulation, 2021, 143, e984-e1010 https://doi.org/10.1161/CIR.0000000000000973. [CrossRef]
- Pati, S.; Irfan, W.; Jameel, A.; Ahmed, S.; Shahid, R.K. Obesity and Cancer: A Current Overview of Epidemiology, Pathogenesis, Outcomes, and Management. Cancers 2023, 15, 485. [CrossRef]
- Dong, Z.; Xiling Xu, Cunchuan Wang, Susie Cartledge, Ralph Maddison, Sheikh Mohammed Shariful Islam, Association of overweight and obesity with obstructive sleep apnoea: A systematic review and meta-analysis. Obesity Medicine, 2020, 17, 100185. [CrossRef]
- Okunogbe A, Nugent R, Spencer G, Powis J, Ralston J, Wilding J. Economic impacts of overweight and obesity: current and future estimates for 161 countries. BMJ Glob Health. 2022, 7(9), e009773. doi: 10.1136/bmjgh-2022-009773. [CrossRef]
- Czajkowski, P.; Adamska-Patruno, E.; Bauer, W.; Fiedorczuk, J.; Krasowska, U.; Moroz, M.; Gorska, M.; Kretowski, A. The Impact of FTO Genetic Variants on Obesity and Its Metabolic Consequences is Dependent on Daily Macronutrient Intake. Nutrients 2020, 12, 3255. https://doi.org/10.3390/nu12113255. [CrossRef]
- Lin, X.; Li, H. Obesity: Epidemiology, Pathophysiology, and Therapeutics. Front. Endocrinol. 2021, 12, 706978. doi: 10.3389/fendo.2021.706978. [CrossRef]
- Wu Y, Duan H, Tian X, Xu C, Wang W, Jiang W, et al. Genetics of Obesity Traits: A Bivariate Genome-Wide Association Analysis. Front Genet, 2018, 9, 179. doi: 10.3389/fgene.2018.00179. [CrossRef]
- Huang, Ch.; Chen, W.; Wang, X. Studies on the fat mass and obesity-associated (FTO) gene and its impact on obesity-associated diseases. Genes & Diseases, 2023, 10, 2351e2365. [CrossRef]
- Hinney A, Nguyen TT, Scherag A, et al. Genome wide association (GWA) study for early onset extreme obesity supports the role of fat mass and obesity associated gene (FTO) variants. PLoS One, 2007, 2(12), e1361. [CrossRef]
- Speakman JR. The ‘fat mass and obesity related’ (FTO) gene: mechanisms of impact on obesity and energy balance. Curr Obes Rep, 2015, 4(1), 73e91.
- Locke, A., Kahali, B., Berndt, S. et al. Genetic studies of body mass index yield new insights for obesity biology. Nature, 2015, 518, 197–206 https://doi.org/10.1038/nature14177. [CrossRef]
- Tan, L. J., Zhu, H., He, H., Wu, K. H., Li, J., Chen, X. D., ... & Deng, H. W. Replication of 6 obesity genes in a meta-analysis of genome-wide association studies from diverse ancestries. PLoS One, 2014, 9(5), e96149. [CrossRef]
- Gao X, Shin Y-H, Li M, Wang F, Tong Q, Zhang P. The Fat Mass and Obesity Associated Gene FTO Functions in the Brain to Regulate Postnatal Growth in Mice. PLoS ONE 2010, 5(11): e14005. https://doi.org/10.1371/journal.pone.0014005. [CrossRef]
- Chen X., Luo Y., Jia G., Liu G., Zhao H., Huang Z. FTO promotes adipogenesis through inhibition of the Wnt/β-catenin signaling pathway in porcine intramuscular preadipocytes. Anim Biotechnol, 2017, 28(4), 268–274.
- Wu R., Liu Y., Yao Y., et al. FTO regulates adipogenesis by controlling cell cycle progression via m6A-YTHDF2 dependent mechanism. Biochim Biophys Acta Mol Cell Biol Lipids. 2018, 1863(10), 1323–1330.
- Jiao, Y.; Zhang, J.; Lu, L.; Xu, J.; Qin, L. The Fto Gene Regulates the Proliferation and Differentiation of Pre-Adipocytes in Vitro. Nutrients 2016, 8, 102. https://doi.org/10.3390/nu8020102. [CrossRef]
- Olmedo, L.; Fernando Javier Luna, Jeremías Zubrzycki, Hernán Dopazo, Magalí Pellon-Maison. Associations Between rs9939609 FTO Polymorphism With Nutrient and Food Intake and Adherence to Dietary Patterns in an Urban Argentinian Population. J Acad Nutr Diet. 2024, 124, 874-882. [CrossRef]
- Rahimlou, M., Ghobadian, B., Ramezani, A. et al. Fat mass and obesity-associated gene (FTO) rs9939609 (A/T) polymorphism and food preference in obese people with low-calorie intake and non-obese individuals with high-calorie intake. BMC Nutr, 2023, 9, 143. https://doi.org/10.1186/s40795-023-00804-y. [CrossRef]
- Madrigal-Juarez, A.; Erika Martínez-López, Tania Sanchez-Murguia, Lisset Magaña-de la Vega, Roberto Rodriguez-Echevarria, Maricruz Sepulveda-Villegas, Rafael Torres-Valadez, Nathaly Torres-Castillo; FTO genotypes (rs9939609 T>A) are Associated with Increased Added Sugar Intake in Healthy Young Adults. Lifestyle Genomics, 2023, 16(1), 214–223. https://doi.org/10.1159/000534741. [CrossRef]
- Jiang, Y.; Mei, H., Lin, Q., Wang, J., Liu, S., Wang, G., & Jiang, F. Interaction effects of FTO rs9939609 polymorphism and lifestyle factors on obesity indices in early adolescence. Obes. Res. Clin. Pract, 2019, 13(4), 352–357. https://doi.org/10.1016/j.orcp.2019.06.004. [CrossRef]
- Labayen, I., Ruiz, J. R., Huybrechts, I., Ortega, F. B., Arenaza, L., González-Gross, M., Widhalm, K., Molnar, D., Manios, Y., DeHenauw, S., Meirhaeghe, A., & Moreno, L. A. Dietary fat intake modifies the influence of the FTO rs9939609 polymorphism on adiposity in adolescents: The HELENA cross-sectional study. NMCD, 2016, 26, 937–943. https://doi.org/10.1016/j.numecd.2016.07.010. [CrossRef]
- Susmiati, Nur Indrawaty Lipoeto, Ingrid S. Surono and Jamsari Jamsari, Association of fat mass and obesity-associated rs9939609 polymorphisms and eating behaviour and food preferences in adolescent Minangkabau girls. Pak. J. Nutr., 2018, 17, 471-479. [CrossRef]
- Page M. J., McKenzie J. E., Bossuyt P. M., Boutron I., Hoffmann T. C., Mulrow C. D. The PRISMA 2020 statement: an updated guideline for reporting systematic reviews. BMJ, 2020, 372, 71. [CrossRef]
- Antropometry Procedures Manual; National Health and Nutrition Examination Survey (NHANES): Washington, DC, USA, 2017. Available online: https://www.cdc.gov/nchs/data/nhanes/nhanes_07_08/manual_an.pdf (accessed on 15 July 2024).
- A Healthy Lifestyle—WHO Recommendations. Available online: https://www.who.int/europe/news-room/fact-sheets/item/a-healthy-lifestyle---who-recommendations (accessed on on 15 July 2025).
- Waist Circumference and Waist-Hip Ratio; Report of a WHO Expert Consultation: Geneva, Switzerland, 2008; Available online: https://www.who.int/publications/i/item/9789241501491 (accessed on on 15 July 2024).
- Yoo, E.G. Waist-to-Height Ratio as a Screening Tool for Obesity and Cardiometabolic Risk. Korean J. Pediatr. 2016, 59, 431. [CrossRef]
- Ashwell, M.; Gibson, S. Waist-to-Height Ratio as an Indicator of “Early Health Risk”: Simpler and More Predictive than Using a “matrix” Based on BMI and Waist Circumference. BMJ Open 2016, 6, e010159.
- Kunachowicz, H.; Przygoda, B.; Nadolna, I.; Iwanow, K. Tables of Food Composition and Nutritional Values [Tabele Składu i Wartości Odżywczej Żywności]; PZWL: Warsaw, Poland, 2017.
- Niedzwiedzka, E.; Wadolowska, L.; Kowalkowska, J. Reproducibility of A Non-Quantitative Food Frequency Questionnaire (62-Item FFQ-6) and PCA-Driven Dietary Pattern Identification in 13–21-Year-Old Females. Nutrients 2019, 11, 2183. [CrossRef]
- Livingstone K. M., Brayner B., Celis-Morales C., Moschonis G., Manios Y., Traczyk I., Drevon C. A., Daniel H., Saris W. H. M., Lovegrove J. A., Gibney M., Gibney E. R., Brennan L., Martinez J. A., Mathers J. C. Associations between dietary patterns, FTO genotype and obesity in adults from seven European countries. Eur. J. Nutr, 2022, 61, 2953–2965. [CrossRef]
- Piwonska A. M., Cicha-Mikolajczyk A., Sobczyk-Kopciol A., Piwonski J., Drygas W., Kwasniewska M., Pajak A., Zdrojewski T., Tykarski A., Kozakiewicz K., Ploski R. Independent association of FTO rs9939609 polymorphism with overweight and obesity in Polish adults. Results from the representative population-based WOBASZ study. J. Physiol. Pharmacol, 2022, 73, doi: 10.26402/jpp.2022.3.07. [CrossRef]
- Ağagündüz D., Gezmen-Karadağ M. Association of FTO common variant (rs9939609) with body fat in Turkish individuals. Lipids Health Dis, 2019, 18, 1, s. 212. [CrossRef]
- Mehrdad M., Fardaei M., Fararouei M., Eftekhari M. H. The association between FTO rs9939609 gene polymorphism and anthropometric indices in adults. J. Physiol. Anthropol, 2020, 39, 14. [CrossRef]
- Lan N., Lu Y., Zhang Y., Pu S., Xi H., Nie X., Liu J., Yuan W. FTO – A Common Genetic Basis for Obesity and Cancer. Frontiers in Genetics, 2020, 11, 559138.
- Frayling, T.M. Genome – wide association studies provide new insights into type 2 diabetes aetiology. Nature Review Genetics, 2007, 8 (9), 657–662. [CrossRef]
- Chang Y., Liu, P., Lee, W., Chang, T., Jiang, Y., Li, H. Common variation in the fat mass and obesity-associated (FTO) gene confers risk of obesity and modulates BMI in the Chinese population. Diabetes, 2008, 57, 2245–2252. [CrossRef]
- Tan J., Dorajoo R. Seielstad, M. Sim, X., Ong R. T., Chia K. FTO variants are associated with obesity in the chinese and malay populations in Singapore. Diabetes, 2008, 57, 2851–2857.
- Li H., Kilpeläinen, T. Liu C. Zhu J., Liu Y., Hu C. Association of genetic variation in FTO with risk of obesity and type 2 diabetes with data from 96,551 east and south Asians. Diabetologia, 2012, 55, 981–995.
- Fonseca A., Abreu G., Zembrzuski V., Junior M., Carneiro J., Neto J. The association of the fat mass and obesity-associated gene (FTO) rs9939609 polymorphism and the severe obesity in a Brazilian population. Diabetes, Metabolic Syndrome and Obesity, 2019, 12, 667–684. [CrossRef]
- Gholamalizadeh M., Mirzaei Dahka S., Vahid F., Bourbour F., Badeli M., JavadiKooshesh S., Mosavi Jarrahi S. A., Akbari M. E., Azizi Tabesh G., Montazeri F., Hassanpour A., Doaei S. Does the rs9939609 FTO gene polymorphism affect fat percentage? A meta-analysis. Archives of Physiology and Biochemistry, 2020, 128, 6, 1421–1425. [CrossRef]
- Reuter C. P., Rosane De Moura Valim A., Gaya A. R., Borges T. S., Klinger E. I., Possuelo, L. G. (2016): FTO polymorphism, cardiorespiratory fitness, and obesity in brazilian youth. American Journal of Human Biology, 28, s. 381–386. [CrossRef]
- Liang Chen X., Li J., Yan M., Yang Y. Study on body composition and its correlation with obesity: A Cohort Study in 5121 Chinese Han participants. Medicine (Baltimore), 2018, 97, 21, e10722. doi: 10.1097/MD.0000000000010722. [CrossRef]
- Livingstone K., Celis-Morales C., Lara J., Ashor A., Lovegrove J., Martinez J., Saris W., Gibney M., Manios Y., Traczyk I., Drevon C., Daniel H., Gibney E., Brennan L., Bouwman J., Grimaldi K., Mathers J. Associations between FTO genotype and total energy and macronutrients intake: a systematic review and meta-analysis. Obes Rev, 2015, 16, 8, s. 666–678. [CrossRef]
- Daya M., Pujianto D. A., Witjaksono F., Priliani L., Susanto J., Lukito W., Malik S. G. Obesity risk and preference for high dietary fat intake are determined by FTO rs9939609 gene polymorphism in selected Indonesian adults. Asia Pac J Clin Nutr, 2019, 28, 1, 183–191. [CrossRef]
- Madrigal-Juarez, A.; Erika Martínez-López, Tania Sanchez-Murguia, Lisset Magaña-de la Vega, Roberto Rodriguez-Echevarria, Maricruz Sepulveda-Villegas, Rafael Torres-Valadez, Nathaly Torres-Castillo; FTO genotypes (rs9939609 T>A) are Associated with Increased Added Sugar Intake in Healthy Young Adults. Lifestyle Genomics, 2023, 16 (1), 214–223. [CrossRef]
- Livingstone K. M., Celis-Morales C., Navas-Carretero S., San-Cristobal R., Forster H., O'Donovan C. B., Woolhead C., Marsaux C. F., Macready A. L., Fallaize R., Kolossa S., Tsirigoti L., Lambrinou C. P., Moschonis G., Godlewska M., Surwiłło A., Drevon C. A., Manios Y., Traczyk I., Gibney E. R., Brennan L., Walsh M. C., Lovegrove J. A., Martinez J. A., Saris W. H., Daniel H., Gibney M., Mathers J. C. Food4Me study. Fat mass- and obesity-associated genotype, dietary intakes and anthropometric measures in European adults: the Food4Me study. Br J Nutr. 2016, 14, 115, 3, s. 440–448. [CrossRef]
- Lusting R., Collier D., Kassotis Ch., Roepke T., Kim M., Blanc E., Barouki R., Bansal A., Cave M., Chatterjee S., Choudhury M., Gilbertson M., Lagadic-Gossmann D., Howard S., Lind L., Tomlinson C., Vondracek J., Heindel J. Obesity I: Overview and Molecular and Biochemical Mechanisms. Biochem. Pharmacol, 2022, 199, 115012. [CrossRef]
Figure 1.
Study design based on “The PRISMA 2020 statement” [27].
Figure 1.
Study design based on “The PRISMA 2020 statement” [27].
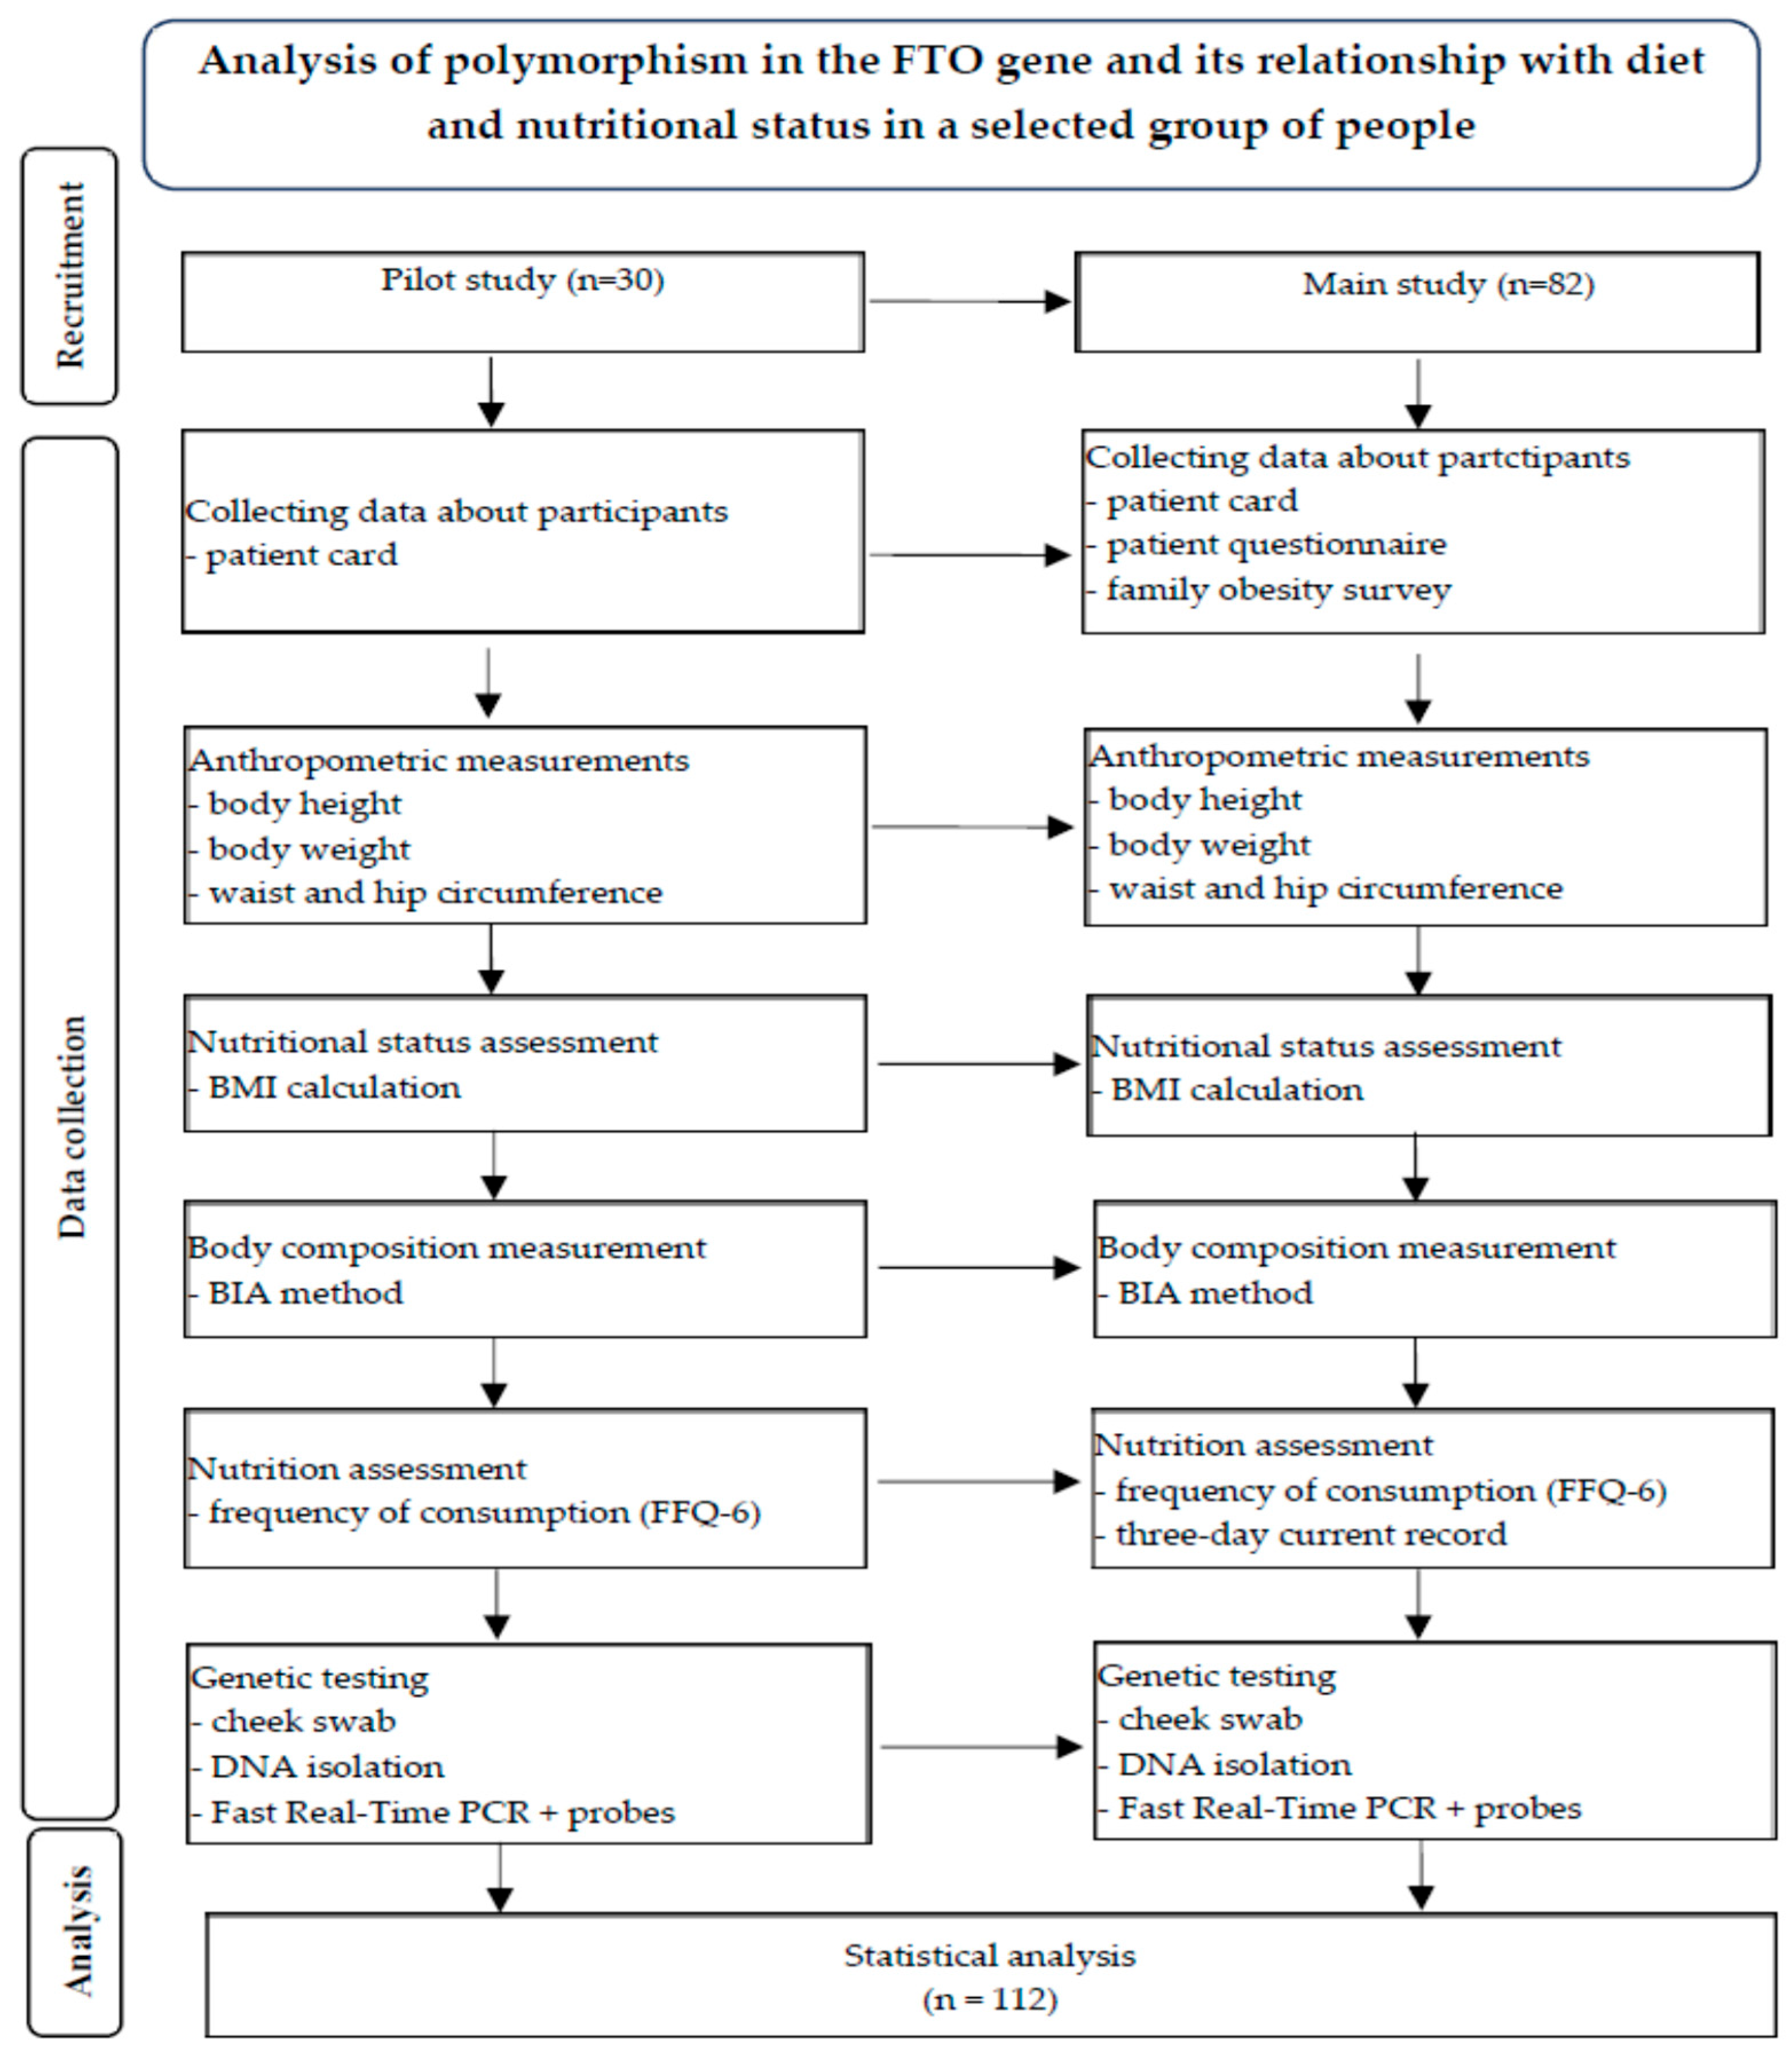

Table 1.
Number of people (n = 112) with individual genotypes, divided by gender, and percentage share of individual genotypes in the study group.
Table 1.
Number of people (n = 112) with individual genotypes, divided by gender, and percentage share of individual genotypes in the study group.
| Genotype | Number of people (n) | Women (n) | Men (n) | Percentage of genotypes |
|---|---|---|---|---|
| Homozygous TT | 29 | 21 | 8 | 25.9 |
| Heterozygous TA | 63 | 46 | 17 | 56.2 |
| Homozygous AA | 20 | 16 | 4 | 17.9 |
| Total | 112 | 83 | 29 | 100.0 |
Table 2.
The relationship between genotype and nutritional status (χ2 = 9.75; Pα ≤ 0.05) in the study group.
Table 2.
The relationship between genotype and nutritional status (χ2 = 9.75; Pα ≤ 0.05) in the study group.
| Genotype | Number of people with normal body weight | Number of overweight people | Number of people with obesity | Percentage of individuals with excess body weight |
|---|---|---|---|---|
| Homozygous TT | 12 | 7 | 10 | 58.6 |
| Heterozygous TA | 15 | 20 | 28 | 76.2 |
| Homozygous AA | 3 | 6 | 11 | 85.0 |
| Total | 30 | 33 | 49 | 73.2 |
Table 3.
The mean values of the anthropometric measurements and body composition of the individual genotypes.
Table 3.
The mean values of the anthropometric measurements and body composition of the individual genotypes.
| r variance analysis p | Genotype AA Mean ± SD |
Genotype TA Mean ± SD |
Genotype TT Mean ± SD |
Parameter |
|---|---|---|---|---|
| NS* | 170.5 ± 9.32 | 171.6 ±7.91 | 172.5 ± 8.48 | Height [cm] |
| NS | 98.8 ± 22.47 | 84.2 ± 24.38 | 75.3 ± 20.75 | Body weight [kg] |
| NS | 116.0 ± 10.89 | 104.7 ± 14.95 | 98.0 ± 14.65 | Hip circumference [cm] |
| NS | 104.0 ± 17.44 | 90.6 ±19.65 | 85.5 ± 17.08 | Waist circumference [cm] |
| NS | 0.88 ± 0.13 | 0.88 ± 0.12 | 0.87 ± 0.11 | WHR [cm/cm] |
| NS | 0.55 ± 0.10 | 0.56 ± 0.11 | 0.58 ± 0.09 | WHtR [cm/cm] |
| NS | 9.5 ± 2.81 | 8.4 ± 2.69 | 7.7 ± 3.25 | Body cell mass index |
| NS | 38.1 ± 8.11 | 34.3 ± 10.04 | 29.3 ± 9.57 | Fat mass [%] |
| NS | 38.7 ± 11.98 | 31.0 ± 17.64 | 23.5 ± 13.9 | Fat mass [kg] |
| NS | 61.9 ± 14.63 | 65.2 ± 10.57 | 70.7 ± 11.06 | Fat free mass [%] |
| NS | 60.0 ± 8.21 | 53.2 ± 7.43 | 51.7 ± 9.40 | Fat free mass [kg] |
| NS | 46.6 ± 12.51 | 46.3 ± 10.94 | 44.7 ± 13.74 | Cellular mass [%] |
| NS | 28.0 ± 8.21 | 24.7 ± 7.43 | 23.0 ± 9.40 | Cellular mass [kg] |
| NS | 36.1 ± 12.11 | 38.3 ± 10.75 | 39.8 ± 11.02 | Muscle mass [%] |
| NS | 34.7 ± 9.58 | 30.8 ± 8.52 | 28.7 ± 10.75 | Muscle mass [kg] |
| NS | 45.3 ± 5.80 | 47.9 ±7.26 | 51.7 ± 6.58 | Total body water [%] |
| NS | 43.9 ± 10.54 | 39.0 ± 8.03 | 37.8 ± 7.94 | Total body water [Lt.] |
| NS | 45.2 ±4.11 | 45.2 ± 4.14 | 45.7 ± 5.09 | Extracellular water [%] |
| NS | 19.8 ± 4.67 | 17.5 ± 3.84 | 17.2 ± 3.37 | Extracellular water [Lt.] |
| NS | 54.8 ± 4.11 | 54.2 ± 4.56 | 54.3 ± 5.09 | Intracellular water [%] |
| NS | 24.1 ± 6.32 | 21.5 ± 4.90 | 20.6 ± 5.60 | Intracellular water [Lt.] |
* non-significant.
Table 4.
The occurrence of excess body weight in relatives of the study participants (percentage of the total group).
Table 4.
The occurrence of excess body weight in relatives of the study participants (percentage of the total group).
| Degree of kinship | Genotype of the studied individual | |
|---|---|---|
| AA | TA & TT | |
| Individual | 18.06 | 61.11 |
| Mother | 8.33 | 38.89 |
| Father | 9.72 | 33.33 |
| Brothers | 1.39 | 27.77 |
| Sisters | 11.11 | 34.73 |
| Sons | 2.78 | 13.89 |
| Daughters | 2.78 | 16.66 |
| Grandchildren | 0.00 | 2.78 |
| Father's brothers | 2.78 | 9.72 |
| Father's sisters | 4.17 | 30.55 |
| Father's father | 1.39 | 1.39 |
| Father's mother | 4.17 | 12.50 |
| Mother's brothers | 2.78 | 15.28 |
| Mother's sisters | 0.00 | 19.45 |
| Mother's father | 1.39 | 5.56 |
| Mother's mother | 4.17 | 20.84 |
Table 5.
The frequency of consumption of selected food groups in individual genotypes (mean; standard deviation, SD; median, Me).
Table 5.
The frequency of consumption of selected food groups in individual genotypes (mean; standard deviation, SD; median, Me).
| The Kruskal-Wallis ANOVA p | Genotype AA | Genotype TA | Genotype TT | Food product / group | ||||||
|---|---|---|---|---|---|---|---|---|---|---|
| Me | SD | Mean | Me | SD | Mean | Me | SD | Mean | ||
| NS* | 2.0 | 1.87 | 2.8 | 1.5 | 1.86 | 2.6 | 1.0 | 1.83 | 2.4 | Sugar for sweetening drinks |
| NS | 3.0 | 1.31 | 2.5 | 2.0 | 1.36 | 2.6 | 2.0 | 1.16 | 2.6 | Honey |
| NS | 3.0 | 0.87 | 3.3 | 3.0 | 0.87 | 3.3 | 3.0 | 1.03 | 3.3 | Chocolates, chocolate candies and bars |
| NS | 2.0 | 0.94 | 2.1 | 3.0 | 1.05 | 2.5 | 2.0 | 0.82 | 2.4 | Non-chocolate candies |
| 0.088 | 3.0 | 0.91 | 2.9 | 3.0 | 0.93 | 3.1 | 3.0 | 0.8 | 2.7 | Biscuits and biscuits |
| 0.068 | 2.0 | 0.94 | 2.0 | 2.0 | 0.8 | 2.4 | 2.0 | 0.77 | 2.5 | Ice cream and pudding |
| NS | 2.0 | 0.96 | 2.4 | 3.0 | 1.01 | 2.7 | 3.0 | 1.08 | 2.6 | Salty snacks |
| NS | 4.0 | 1.05 | 3.9 | 5.0 | 1.34 | 4.1 | 4.0 | 1.2 | 3.9 | Milk and natural milk drinks |
| NS | 2.0 | 0.99 | 1.9 | 3.0 | 1.19 | 2.5 | 2.0 | 1.23 | 2.5 | Sweetened milk drinks |
| NS | 4.0 | 0.68 | 3.6 | 4.0 | 0.8 | 3.5 | 3.0 | 0.89 | 3.3 | Natural cottage cheese |
| NS | 1.0 | 0.98 | 1.8 | 2.0 | 0.94 | 2.0 | 2.0 | 0.93 | 2.0 | Flavoured cottage cheese |
| NS | 3.0 | 0.77 | 3.5 | 4.0 | 0.96 | 3.5 | 3.0 | 1.04 | 3.4 | Cheese |
| NS | 4.0 | 0.83 | 3.6 | 4.0 | 0.86 | 3.8 | 4.0 | 0.82 | 3.8 | Eggs and egg dishes |
| NS | 5.0 | 0.73 | 4.7 | 5.0 | 0.98 | 4.8 | 5.0 | 0.91 | 4.6 | Wholemeal bread or bread with grains |
| NS | 3.0 | 1.37 | 3.0 | 4.0 | 1.22 | 3.6 | 3.0 | 1.12 | 3.0 | Refined bread |
| NS | 3.0 | 0.99 | 3.1 | 3.0 | 0.82 | 3.2 | 3.0 | 0.76 | 2.8 | Coarse-grained groats, unrefined |
| 0.019 | 3.0 | 0.82 | 2.7 | 3.0 | 0.83 | 3.2 | 3.0 | 0.78 | 2.9 | Fine-grained refined groats |
| 0.087 | 1.0 | 0.51 | 1.4 | 2.0 | 0.96 | 1.9 | 2.0 | 0.81 | 1.9 | Ready-made breakfast cereal products |
| NS | 4.0 | 1.16 | 3.7 | 4.0 | 0.89 | 4.2 | 4.0 | 1.06 | 4.0 | Oil, all types |
| NS | 4.0 | 1.36 | 3.8 | 4.0 | 1.15 | 3.7 | 4.0 | 0.82 | 4.2 | Butter |
| NS | 2.0 | 1.45 | 2.3 | 3.0 | 1.44 | 3.1 | 3.0 | 1.47 | 2.8 | Margarine, all types |
| NS | 3.0 | 1.2 | 3.1 | 3.0 | 0.94 | 3.2 | 4.0 | 0.9 | 3.3 | Cream, all types |
| NS | 2.0 | 0.51 | 1.5 | 2.0 | 0.87 | 1.7 | 2.0 | 0.79 | 1.7 | Other animal fats |
| NS | 2.0 | 1.16 | 2.6 | 3.0 | 0.95 | 2.6 | 3.0 | 1.04 | 2.6 | Mayonnaise and dressings |
| NS | 4.0 | 1.0 | 4.3 | 5.0 | 0.91 | 4.7 | 5.0 | 1.07 | 4.7 | Fruits, all kinds |
| NS | 3.0 | 0.84 | 3.5 | 4.0 | 0.84 | 3.5 | 4.0 | 0.89 | 3.7 | Kiwi and citrus |
| 0.047 | 2.0 | 1.11 | 2.3 | 3.0 | 0.86 | 2.9 | 3.0 | 0.98 | 3.0 | Tropical fruits other |
| 0.054 | 2.0 | 0.96 | 2.6 | 3.0 | 0.76 | 2.9 | 3.0 | 0.99 | 3.2 | Berries |
| NS | 3.0 | 0.9 | 3.4 | 4.0 | 0.88 | 3.5 | 4.0 | 0.82 | 3.6 | Bananas |
| NS | 4.0 | 0.76 | 4.2 | 4.0 | 0.85 | 3.9 | 4.0 | 1.04 | 3.9 | Apples and pears |
| 0.074 | 2.0 | 0.92 | 1.8 | 2.0 | 0.93 | 1.8 | 2.0 | 0.84 | 2.3 | Avocado |
| NS | 2.0 | 0.97 | 2.1 | 2.0 | 0.86 | 2.2 | 3.0 | 1.14 | 2.3 | Olives |
| NS | 2.0 | 0.93 | 2.3 | 2.0 | 0.9 | 2.3 | 2.0 | 0.75 | 2.2 | Dried fruit |
| NS | 2.0 | 0.83 | 2.2 | 2.0 | 0.9 | 2.2 | 2.0 | 0.93 | 2.1 | Sweet fruit preparations and candied fruit |
| NS | 4.0 | 0.96 | 4.5 | 5.0 | 0.88 | 4.9 | 5.0 | 1.21 | 4.7 | Vegetables, all types |
| NS | 3.0 | 0.76 | 3.4 | 4.0 | 0.82 | 3.6 | 4.0 | 1.0 | 3.6 | Cruciferous vegetables |
| 0.038 | 4.0 | 0.9 | 3.5 | 4.0 | 0.78 | 4.0 | 4.0 | 0.97 | 3.8 | Yellow-orange vegetables |
| NS | 4.0 | 0.63 | 3.8 | 4.0 | 0.89 | 3.8 | 4.0 | 0.96 | 3.8 | Leafy green vegetables |
| NS | 4.0 | 0.94 | 3.9 | 4.0 | 0.98 | 4.1 | 4.0 | 1.02 | 4.0 | Tomatoes |
| 0.098 | 4.0 | 1.01 | 3.4 | 4.0 | 0.75 | 3.9 | 4.0 | 0.63 | 3.7 | Vegetables like cucumber |
| NS | 4.0 | 0.68 | 3.6 | 4.0 | 0.79 | 3.8 | 4.0 | 0.6 | 3.8 | Root and other vegetables |
| NS | 3.0 | 0.77 | 2.5 | 3.0 | 0.68 | 2.6 | 3.0 | 0.76 | 2.6 | Fresh and canned legumes |
| NS | 2.0 | 0.81 | 2.1 | 2.0 | 0.82 | 2.2 | 2.0 | 0.87 | 2.6 | Dry legumes |
| NS | 3.0 | 0.92 | 3.2 | 4.0 | 0.78 | 3.7 | 4.0 | 0.65 | 3.6 | Potatoes |
| NS | 2.0 | 1.22 | 2.6 | 3.0 | 1.05 | 2.8 | 3.0 | 1.06 | 3.0 | Nuts |
| NS | 3.0 | 1.27 | 2.8 | 3.0 | 1.17 | 2.7 | 3.0 | 1.08 | 3.1 | Grain |
| NS | 3.0 | 1.03 | 2.8 | 3.0 | 0.96 | 3.1 | 3.0 | 0.94 | 3.2 | Sausage |
| NS | 4.0 | 1.07 | 3.8 | 4.0 | 1.11 | 4.0 | 4.0 | 1.1 | 4.0 | High-quality cold cuts |
| NS | 2.0 | 0.87 | 1.7 | 2.0 | 0.79 | 2.0 | 2.0 | 0.68 | 2.0 | Organ meat and sausage |
| NS | 3.0 | 0.82 | 2.7 | 2.5 | 0.9 | 2.5 | 2.0 | 0.65 | 2.6 | Red meat |
| NS | 4.0 | 0.96 | 3.6 | 4.0 | 0.73 | 3.6 | 4.0 | 0.86 | 3.4 | Poultry and rabbit meat |
| NS | 1.0 | 0.32 | 1.1 | 1.0 | 0.41 | 1.2 | 1.0 | 0.5 | 1.2 | Game meat |
| 0.052 | 2.0 | 0.76 | 2.4 | 3.0 | 0.76 | 2.9 | 3.0 | 0.6 | 2.8 | Lean fish |
| NS | 3.0 | 0.96 | 2.5 | 3.0 | 1.09 | 2.9 | 3.0 | 0.91 | 3.1 | Oily fish |
| NS | 3.0 | 1.24 | 2.7 | 3.0 | 0.94 | 2.7 | 3.0 | 0.76 | 2.9 | Fruit juices and fruit nectars |
| NS | 3.0 | 1.12 | 2.6 | 3.0 | 0.96 | 2.5 | 3.0 | 0.97 | 2.8 | Vegetable and vegetable and fruit juices |
| NS | 1.0 | 1.27 | 1.8 | 1.0 | 1.15 | 1.8 | 2.0 | 1.04 | 2.1 | Energy drinks |
| NS | 2.0 | 0.75 | 1.7 | 2.0 | 0.91 | 1.9 | 2.0 | 0.96 | 2.2 | Sweetened drink |
| NS | 2.0 | 1.18 | 2.2 | 2.0 | 1.01 | 2.3 | 3.0 | 0.98 | 2.7 | Beer |
| NS | 2.0 | 1.15 | 2.3 | 3.0 | 1.14 | 2.6 | 3.0 | 1.08 | 2.6 | Wine and drinks |
| NS | 2.0 | 0.96 | 1.8 | 2.0 | 0.73 | 1.8 | 2.0 | 0.73 | 2.0 | Vodka and spirits |
* non-significant.
Disclaimer/Publisher’s Note: The statements, opinions and data contained in all publications are solely those of the individual author(s) and contributor(s) and not of MDPI and/or the editor(s). MDPI and/or the editor(s) disclaim responsibility for any injury to people or property resulting from any ideas, methods, instructions or products referred to in the content. |
© 2025 by the authors. Licensee MDPI, Basel, Switzerland. This article is an open access article distributed under the terms and conditions of the Creative Commons Attribution (CC BY) license (http://creativecommons.org/licenses/by/4.0/).
Copyright: This open access article is published under a Creative Commons CC BY 4.0 license, which permit the free download, distribution, and reuse, provided that the author and preprint are cited in any reuse.


