
Submitted:
27 January 2024
Posted:
29 January 2024
You are already at the latest version
Abstract
Obesity is a worldwide epidemic; hence it is crucial to understand how it can be effectively prevented/treated. Thus, obesity should be tackled considering that it is a multifactorial condition. This work examines a wide range of factors and attempts to understand which contribute most to variability in overweight/obesity. Eighty-four subjects with overweight/obesity were recruited. Dietary baseline information was obtained by analyzing three 24-hour recalls. Resting metabolic rate was measured using indirect calorimetry, physical activity through accelerometry, cardiometabolic parameters were determined in blood samples and body composition by anthropometry and bioimpedance. Factor analysis of principal components (PCA) was carried out (SPSS v22.0). Large interindividual variability was observed in dietetic, biochemical, and physical activity measurements (coefficient of variation ≥30%), but body composition was homogeneous. Volunteers had an unbalanced diet and low physical activity. PCA reduced the 26 analyzed variables into 7 factors, accounting for 81,5% of total data variability. The main factor was the ‘‘caloric and lipid factor’’ related to diet, responsible for 25.9% of total variability, followed by ‘‘adiposity factor’’ (16,9%) and ‘‘cardiometabolic risk factor’’ (13,2%). Diet seems to be the factor that contributes the most to data variability in people with overweight/obesity, especially the intake of lipids, energy and proteins.
Keywords:
Overweight
; Obesity
; interindividual variability
; Polyphenols
; Cardiometabolic Risk Factors
; Factor Analysis
; Dietary Intake
; Body Composition
; Physical Activity
; Energy Expenditure
1. Introduction
Although there is an open debate on whether considering obesity as a disease [1], it is undeniable that excessive body fat accumulation, both overweight and obesity, have reached worldwide epidemic dimensions in the last decades as highlighted by the World Health Organization (WHO, Fact sheet 311) [2,3]. Worldwide, obesity has nearly tripled since 1975 despite public health policies and treatment efforts to combat the obesity epidemic [4]. Estimations dating back to 2016-2017 projected that, if the increasing trend in obesity continued, by 2025, global obesity prevalence will reach 20% of the population [5]. However, these figures were already surpassed in Europe in 2022 [3].
Central obesity is a contributor of metabolic syndrome (MetS), a major risk factor for the development of chronic non-communicable diseases (NCD) such as type 2 diabetes mellitus (T2D), cardiovascular diseases (CVD) and many types of cancer [6,7]. In addition, the low-grade chronic inflammation commonly associated with obesity is also related to many of these and many other comorbidities (T2D, CVD, metabolic-associated fatty liver disease (MAFLD), steatohepatitis, osteoarthritis, iron deficiency, asthma, cancer, and neurodegenerative diseases) [8]. Therefore, considering the increasing prevalence of obesity and its associated comorbidities, it is of utmost importance to further understand this metabolic condition and how it can be more effectively prevented.
Far more than an imbalance between food intake and energy expenditure, obesity is a complex multifactorial disorder resulting from the interaction of a range of conditions including lifestyle (mostly diet and physical activity), social and environmental aspects (obesogenic environment, country, religion, socioeconomic status, education), or biological factors (aging, sex, genotype, epigenetic modifications, microbiota composition), among others [9].
For many years, dietary strategies to lose weight have consisted of varying macronutrient composition (e.g., low carbohydrate or low fat) as well as restricting total energy (e.g. low calorie, intermittent fasting) intake, whereas the reduction of body weight and body mass index (BMI) have been the main targets to determine the effectiveness of the weight reduction treatment. However, there has been a progressive shift on the approach to weight loss strategies and the focus on relevant endpoints [10]. Changes in BMI have been largely considered as a key endpoint to measure success of the weight management strategies. BMI has been a population-level measure of overweight and obesity commonly used for both sexes and for all ages of adults; however, this index has also been largely criticised, as BMI value varies greatly among individuals based on age, sex, and ethnicity. Furthermore, BMI is not sensitive enough to differentiate the level or the distribution of adipose tissue mass with the health-related implications. Indeed, for any given amount of body fat, greater cardio-metabolic risk has been associated with the localization of excess fat in the visceral adipose tissue and ectopic depots (such as muscle, liver, and pancreas) [11,12].
In addition to the above, it is also important to consider the improvement of health as a relevant endpoint in weight loss treatments. While many types of dietary interventions can achieve a negative energy balance, a successful dietary strategy permits a loss of at least 5% of baseline body weight along with improvement on cardiometabolic health outcomes [10]. Given the large variability between individuals in their weight loss responses to most treatments, it is essential that future research addressing the causes of such variability incorporates more rigorous analyses of the key factors involved, i.e. dietary composition and dietary patterns, energy requirements and energy expenditure (e.g., resting metabolic rate and physical activity energy expenditure) [13].
In line with this, and to further increase in the success of weight-loss treatments, excess of body weight must be addressed with a multidisciplinary approach. Sex and age are very important factors in the individualization process due to critical differences in hormone concentration, adiposity, fat distribution [14,15], or even different eating behaviour and dietary habits [16], as well as microbiota composition [17]. Demographic factors (educational level, ethnicity, nationality, income level, occupation, etc.) are also associated to obesity on an individual and community level, and thus understanding the relationship between these factors is essential to implement changes/recommendations that may help to fight the obesity epidemic [18]. All these aspects and complexity of their interactions suggest that there might be different subpopulations with different types of overweight/obesity and risk for other diseases, and thus with different optimal treatment response. More research must be conducted to determine their distinguishable features for subsequent risk and response stratification [1]. In this context, nutrition advice based on the unique characteristics of an individual, emerged as a new strategy to improve the way obesity was being tackled. Personalized nutrition tries to take into account many of these multiple factors based on baseline information to then establish decisions and choose the most appropriate weight loss treatment [19,20].
All the above-mentioned features have been considered and reunited in GREENCOF, a research project aimed at improving our understanding of the potential beneficial regulatory effects of a coffee drink in subjects with overweight/obesity, with a multi-faceted approach. Coffee is one of the beverages most consumed worldwide, and due to its high content in (poly)phenols [21] this beverage constitutes a major source of these bioactive compounds in Europe [22]. There is a body of scientific evidence that supports the potential beneficial health effects of regularly consuming coffee, including weight management and cardio-metabolic effects [23,24,25]. Nevertheless, the controversy remains as to whether these benefits are associated to the coffee (poly)phenols and/or to any other components of this drink. It is also unclear, whether the effects are equally produced in any individual drinking coffee or if a particular subpopulation may benefit best. GREENCOF will contribute to these issues by exploring the association between consuming coffee in volunteers with overweight/obesity with a focus on individual responses and the multiplicity of factors involved in the response.
The purpose of the current article is to evaluate the association between some of the main variables classically linked with overweight/obesity management studies: i) dietary intake, energy expenditure (‘causative variables’), ii) body weight, body fat distribution (‘measurement variables’), and iii) cardio-metabolic risk factors (‘outcome variables’) in subjects with overweight and obesity, with an insight into the variability of these factors in the study population and to understand among these factors which ones contribute the most to variability.
2. Materials and methods
2.1. Study design
The GREENCOF study is a randomized, cross-over, blind, dose-response nutritional intervention aimed at understanding the effects of a coffee drink and its main components on overweight/obesity and its associated cardiometabolic risk factors with a focus on the individual responses. For this purpose, an in-depth description and a multifaceted characterization of the cohort was carried out at the starting time point of the intervention (baseline conditions), compiling data on sex, age, ethnicity, education and socioeconomic level, anthropometric and body composition, diet (including adherence to the Mediterranean diet), energy expenditure (physical activity and resting metabolic rate (RMR)), which will be addressed in the present article.
For this study men and women with overweight and grade I and II obesity (BMI between 25-36 kg/m2), between 20-65 years were recruited (inclusion criteria). Exclusion criteria were: people following a vegetarian/vegan dietary pattern, smokers, pregnant or breastfeeding women, people taking dietary supplements (vitamins, antioxidants, etc.), having taken antibiotics in the six months before the start of the study, and having changed their lifestyle habits (diet, physical activity) in the last 6 months. People who were on a treatment with prescription drugs that did not interfere with the outcomes of the study or that were on a long-term therapy and well controlled/stable were accepted into the study.
The GREENCOF trial was registered in ClinicalTrials (NCT06204445). The protocol of the study was approved by the Clinical Research Ethics Committee of Hospital Universitario Puerta de Hierro (Majadahonda, Spain) and the Bioethics Committee of Spanish National Research Council (CSIC). Before the beginning of the study, the participants had to sign the informed consent. The study was carried out at the Human Nutrition Unit (HNU) of the Institute of Food Science, Technology and Nutrition (ICTAN) where all tests were performed.
2.2. Recruitment
Participants were recruited by placing advertisements on the website of the GREENCOF study (www.proyectogreencof.es), sending massive e-mails within CSIC and Complutense University of Madrid (UCM) mail lists, and placing informative posters at UCM campus, CSIC centres located in Madrid, cultural centres, libraries, or billboards in the area near ICTAN. Other forms of recruiting people consisted in giving short talks in classes held at the Complutense University, distributing flyers in pharmacies, organizing science divulgation activities, or using social networks to improve the distribution and the variety of people enrolled in this study. In addition, people who participated in previous human studies at ICTAN were contacted using the data base of the HNU in ICTAN. The recruitment was also supported by the Spanish Society of Family and Community Pharmacy (SEFAC). The objective was recruiting students, employees and in general, a wide range of people with different backgrounds and educational levels to avoid biasing the sample of study participants. A self-reported questionnaire was distributed to the volunteers to attain information on their sociodemographic characteristics: sex, age, monthly income, education level, and ethnicity.
The flow chart of the recruitment process is shown in Figure 1.
2.3. Dietary intake measurements and adherence to the Mediterranean Diet
Before the start of the intervention, trained scientists interviewed the participants to fill out 24-hour dietary recalls that collected all the food and beverages consumed within 24 hours on three different days, including two working days and one weekend day or holiday. Energy intake, macronutrients, simple sugars (both intrinsic and added), alcohol, dietary fibre, cholesterol intake and the lipid profile of the diet (saturated fatty acids [SFA], monounsaturated fatty acids [MUFA] and polyunsaturated fatty acids [PUFA]) were calculated using the DIAL software [for Windows version 3.15.3; Department of Nutrition and Food Science (UCM) and Alce Ingeniería, S.A. Madrid, Spain]. The energy density of the diet was calculated as the ratio between energy intake (in kcal) and total edible food intake in grams.
(Poly)phenol intake was calculated using: 1) the average quantity of each food item intake (g/day) obtained from the 24-hour dietary recalls and analysed by the DIAL software for assessing diets and food calculations, and 2) the corresponding content of (poly)phenols (mg/100 g) assessed with a simple tool created in a Microsoft Excel spreadsheet and data extracted from the Phenol-Explorer database (www.phenol-explorer.eu) [26,27]. Total daily (poly)phenol intake was estimated as the sum of intakes of the (poly)phenols from each food group, then it was corrected by individual energy intake and expressed as total (poly)phenol intake per 1000 kcal. More detailed information on the food groups included or not considered in the calculation is provided in the Supplementary information (Table S1). It is worth noting that the subjects taking part in this study were going through a two-week coffee washing period before starting the coffee intervention and thus this drink was excluded from the estimation of the (poly)phenols’ intake.
The adherence to the Mediterranean Diet (MD) was measured using the 14-item Mediterranean Diet Adherence Screener (MEDAS) from the PREvention with MEDiterranean Diet Study (PREDIMED) [28]. The score in this questionnaire can range from 0 to 14 points, meaning that 10 or more points corresponds to ‘‘very good adherence to Mediterranean Diet’’, 6 to 9 points to ‘‘moderate adherence to Mediterranean Diet’’ and less than 6 points to ‘‘low adherence to Mediterranean Diet’’ [29].
2.4. Anthropometric, body composition, physical activity and resting metabolic rate analysis.
A trained anthropometrist, certificated by the International Society for the Advancement of Kinanthropometry (ISAK), took all the anthropometric measurements following ISAK recommendations and protocols (https://www.isak.global/) to reduce interindividual errors. Participants’ heights were measured with a Holtain precision stadiometer and body weight was measured with an Omron scale (Body Composition Monitor BF511). BMI was calculated as the quotient between body weight in kilograms and squared height in metres (kg/m2). Waist, hip, brachial, thigh and calf circumferences were taken with a Cescorf anthropometric tape. Six anthropometric skinfolds (tricipital, bicipital, subscapular, suprailiac, mid-thigh and calf) were measured using a Holtain skinfold calliper. Then all of the six skinfolds were added up to create the variable ‘‘SUMM of 6 skinfolds’’ representing the subcutaneous adipose tissue.
A multi-frequency bioelectrical impedance analysis (BIA) with the INBODY S10 Body Composition Analyser (Microcaya Bilbao, Spain) was used to estimate total body fat, skeletal muscle mass (SMM; both in kilograms) and visceral fat area (VFA; in squared centimetres). Skeletal muscle index (SMI) was calculated as the quotient between skeletal muscle mass and squared height in metres (kg/m2).
Accelerometers were used to monitor the physical activity of the participants, who wore them continuously for one week, only removing them when in contact with water (i.e. showering/bathing or at the swimming pool, in which case they informed of the time swimming). The accelerometers (ActiGraph wGT3X-BT; CamNtech Ltd. Fenstanton, UK) registered high resolution raw acceleration data in three axes, that can be transformed into other variables, such as the average of physical activity expenditure per day (Kcal/day), the average steps count per day or the Metabolic Equivalent of Task (MET), where one MET equal 3.5 millilitres of oxygen per kilogram of body weight per minute (mL/kg/min).
To assess the Resting Metabolic Rate (RMR), indirect calorimetry was performed using the FITMATE Pro portable calorimeter (Version 4.10, Cosmed, Bicester, UK). Total energy expenditure (TEE) was calculated as RMR plus average physical activity expenditure plus the thermogenic effect of the food (estimated as 10% of RMR). Finally, Physical Activity Level (PAL) was calculated using the ratio between TEE:RMR using the criteria of the European Food Safety Authority (EFSA). Age specific (18 - 69 years) cut-off values reported by EFSA’s scientific opinion on dietary reference values for energy (2013) were used to classify subjects according to their PAL as follows: 1.4 – 1.6 low physical activity, 1.6 – 1.8 moderate, > 1.8 high physical activity [30].
2.5. Biochemical analysis and blood pressure measurement.
Volunteers came to the HNU at ICTAN after at least an overnight fasting. A nurse extracted fasting blood samples into tubes without anticoagulant or EDTA-coated tubes that were centrifuged to obtain serum and plasma samples. Aliquots were kept frozen at -80ºC until analysis.
Total cholesterol (TC), high-density lipoprotein cholesterol (HDL), low-density lipoprotein cholesterol (LDL), very low-density lipoprotein cholesterol (VLDL), triglycerides (TG), fasting blood glucose (FBG), insulin, glycated haemoglobin (HbA1c) aspartate aminotransferase (AST) and alanine aminotransferase (ALAT) were measured using serum samples according to the reference methods recommended by the Spanish Society of Clinical Biochemistry and Molecular Pathology (SEQC) using a Roche Cobas Integra 400 plus analysers (Roche Diagnostics, Mannheim, Germany).
Homeostasis Model Assessment index to estimate insulin resistance (HOMA-IR) was calculated using fasting blood glucose and insulin values [31]: [Fasting glucose (mg/dL) × Fasting insulin (mU/L)]/405.
Homeostasis Model Assessment of β-Cell Function (HOMA-β) was calculated as follows [32]: [360 x Fasting Insulin (mU/L)] / [Fasting glucose (mg/dL) – 63].
Quantitative Insulin Sensitivity Check Index (QUICKI) was also calculated using fasting insulin and glucose using this equation [33]: 1/ [log fasting insulin (µIU/ mL) – log fasting blood glucose (mg/dl)].
Systolic (SBP) and diastolic (DBP) blood pressure was measured using an automatic arm sphygmomanometer (OMRON Healthcare M3; Model: HEM-7131-E). The measurement was carried out in both arms and then repeated two more times in the arm with higher blood pressure values following the protocol of the Spanish Society of Internal Medicine.
2.6. Statistical Analysis
Data were analysed using JASP (Version .0.18.1, Computer Software) and SPSS v22.0 software (SPSS Inc. Chicago, IL). Descriptive data are presented in tables and expressed as the mean ± standard deviation, the coefficient of variation (CV) of the total study sample in percentage, and the median with the interquartile range. CV values were used to observe interindividual variability, if values were above 30% data were considered heterogeneous [34]. Shapiro-Wilk test was used to determine the variables that followed a normal distribution when data were segmented by sex (n < 50) and Kolmogorov-Smirnov test was used to observe the distribution of the total study sample (n > 50). Data was analysed using Quantil-Quantil plots (Q-Q Plot) and histograms to confirm the assumption of normality. Levene’s test was used to contrast the homoscedasticity of variance between men and women in the variables analysed. Differences between men and women in continuous variables were analysed using Student’s t-test for independent groups if the assumption of normality and homoscedasticity were met, Welch test if data followed a normal distribution but did not meet the assumption of homoscedasticity between variances or the Mann-Whitney U test if data did not follow a normal distribution. The Chi-Square test (χ2) was used to observe if there were differences in the distribution of men and women in some categorical variables of interest, such as the frequency of overweight or obesity and the frequency of metabolic syndrome. Correlations between quantitative continuous variables were analysed using the Pearson’s correlation coefficient (r) if the variables were normally distributed or Spearman’s correlation coefficient (rho) if not. P-values were considered significant if they were lower than 0.05 (α = 0.05).
To reduce the studied variables into a small number of factors that could explain most variability of the data, several factor analyses of principal components (PCA) were carried out: 1) with dietary intake variables to try to obtain dietary composition patterns 2) with biochemical, anthropometric, body composition variables and blood pressure measurements 3) with variables of dietary intake, anthropometric, body composition, and biochemical analysis 4) with variables of dietary intake, anthropometric, body composition, biochemical, blood pressure and physical activity variables. Analysis 2, 3 and 4 were carried out to understand the relationship between the variables and see if the large number of variables could be simplified into factors. Variables that were not normally distributed were transformed using natural logarithms before introducing them in the PCA in order to achieve normality. Similar factor analysis approach has been followed in other works [35,36]. Variables were selected if there were sufficient significant correlations with coefficients above 0.30 but not too many correlations above 0.80 in the correlation matrix since they could produce multi-collinearity problems. Moreover, variables with low communalities were excluded from factor analysis. To assess the adequacy of the data the Kaiser-Meyer-Olkin (KMO) test and the Bartlett test of sphericity were carried out, before conducting the each PCA. If KMO test indicated a value above 0.60 and the p value of Bartlett test of sphericity was significant, data was considered adequate to the PCA. Factors with eigenvalues above 1 were selected and Varimax rotation was used to extract the rotated factors with Kaiser normalization. Once the main factors emerged, loadings above 0.50 were considered as relevant in the PCA.
3. Results
3.1. Subjects sociodemographic characteristics
The main sociodemographic characteristics of the sample population are shown in Table 1. The final sample was constituted by 84 volunteers (49 women and 35 men). All the participants lived in the urban area of Madrid and surroundings. The overall sample population can be considered Europid in origin, since most participants were European. Only two volunteers were from Latin America countries but had been living in Spain for at least 6 years and adopted the Spanish lifestyle, including dietary habits. Many participants came from the academic sector (graduate/postgraduate students, lecturers, researchers and administrative personnel) and thus, according to the categories described by Stea et al. [37], most of them were included in the high educational category (73.8 %), while only 17.5 % had a medium educational level and 8.7 % had a low education level (although all of them had at least secondary education). On average, the volunteers had a medium economic income, and no differences were found across the three educational levels (p = 0.229), indicating similar levels of economic status.
The study population had a mean age of 49.7 ± 9.9 years with a median age of 51.0 and an interquartile range (IQR) of 11.25 (56.00 – 44.75; third and first quartile, respectively). The distribution of age in the sample population is shown in Figure S1. About 86% of the population was constituted by adults over 40 years old (only 14% were under 40 years of age, between 20 and 38 years).
3.2. Dietary intake.
The results of the analysis of the dietary intake of the sample population are shown in Table 2 and Table 3. Initial dietary information could not be obtained from 3 volunteers (n = 81 for dietary intake). The mean energy density of the diet was 1.00 kcal/g, in line with other studies in adults with obesity [38]. Overall, the dietary intake of macronutrients was similar between men and women except for carbohydrates that was slightly but significantly higher in men (Table 2). Of note, and according to the Spanish Society of Community Nutrition (SENC) and the Nutritional Objectives (NO), consumption of dietary fibre was below the recommendations (25 g/day for women and 35 g/day for men or 14 per 1000 kcal) and the dietary cholesterol and mg of cholesterol per 1000 kcal were above the recommended limit (<300 mg/day or <100 mg per 1000 kcal) [39].
When expressed as the percentage of energy coming from these macronutrients (Table 3), no differences were found between sexes except for the percentage of energy coming from α-linolenic acid which was higher in women (p = 0.029).
There was an imbalance in the energy profile of the diet as the percentages of energy intake from fat and protein were exceeding the nutritional objectives for the Spanish population (30-35 % of energy intake from fat and 10-15 % from protein), at the expense of the energy intake from carbohydrates, lower than recommended (50-55 %) (Table 3). However, the percentage of energy coming from alcohol was acceptable according to these nutritional objectives, as well as the intake of added sugar (nutritional objective for added sugars: ≤ 6 % of total energy intake) [39].
The lipid profile of the diet was also unbalanced, because the percentage of energy obtained from SFA and PUFA were above the recommended limit (NO: 7-8 % and 5 % of total energy intake, respectively) while the percentage from MUFA was below the recommendation. The energy intake from omega 3 fatty acids (ω3), specially from α-linolenic acid, was lower than the limit settled by the SENC (NO: 1-2 % of total energy intake); in contrast, linoleic acid and total omega 6 fatty acids (ω6) consumption was higher than recommended (NO: 3 % of total energy intake). Trans fatty acids intake was adequate (NO: < 1% of total energy) (Table 3) [39].
Of special interest for this study is the data variability. Overall, we found a considerable interindividual variability (expressed as CV%; Table 2 and Table 3) with values ranging between approximately 25% and 40% for most of the dietary macronutrients examined. The largest variability was found for added sugars (66.9%) and alcohol (>100%).
Regarding (poly)phenols, the estimated average total (poly)phenol intake was 1277.8 ± 808.7 mg/day (median: 1073.2 mg/day, IQR: 1017.2 mg/day) (Table 2). The highest total (poly)phenol intake recorded was 4582.6 mg/day and the lowest intake was 321.4 mg/day displaying also a large inter-individual variability in the dietary daily intake of these compounds (CV = 63.3 %). The distribution of (poly)phenol intake across the main foods analysed is shown in Supplementary Table S1. The most highly consumed (by more than 75% of the participants) (poly)phenol food sources were cereals and derivatives, oils and olives, vegetables and fruits, processed foods, condiments, herbs, and tubers. The (poly)phenol food sources less consumed (by less than 40% of the participants) were soy and derivatives, juices, nuts and legumes. Alcoholic drinks, cocoa and derivatives, and infusions were consumed by approximately half of the sample population. Of all the food sources of (poly)phenols included the ones that most (>200 mg/day) contributed to the total daily (poly)phenol intake were legumes (504.5 ± 714.9 mg/d; 39.5 %), cocoa and derivatives (371.0 ± 387.0 mg/day; 29.0 %), fruits and derivatives (293.2 ± 207.0 mg/day; 23.0 %), and nuts (216.6 ± 285.1 mg/day; 17.0%). The food sources that provided the lowest (<40 mg/day) content of (poly)phenols were herbs (2.8 ± 6.4; 0.2%), oils and olives (15.6 ± 11.5; 1.2%), condiments (21.6 ± 51.7 mg/day; 1.7%), and soy and derivatives (31.5 ± 36.4; 2.5%). The large CV (%) values (even >100%) indicate that the individuals’ consumption of (poly)phenols are very distant from the mean values and corroborate the large variability in the consumption of these bioactive compounds as well as in the food sources of these compounds present in the diet of the study participants. The main food groups and food items included in the estimation of the daily intake of (poly)phenols is shown in Supplementary Table S2.
Adherence to the MD measured by the 14-MEDAS score (scale from 0 – 14) is shown in Supplementary Table S4. Women (median = 8.0) display a higher score in this scale comparing to men (median = 7.0), which was slightly above the limit of significance (p = 0.059). Once they were classified into low, moderate, and high adherence to MD (Supplementary Table S3), there were no significant differences in the distribution between sexes.
3.3. Biochemical measurements
Serum lipid profile, glucose metabolism measurements, hepatic enzymes and high-sensitive C-reactive protein values are shown in Table 4. One blood sample could not be obtained from one volunteer due to difficulties in venipuncture (n = 83). Total cholesterol was higher than the reference limit settled by the Spanish Society of Clinical Biochemistry and Molecular Pathology (SEQC), which is 200 mg/dL. Other biochemical measurements such as TG, LDL, VLDL and HDL were within the reference limits. HDL was significantly higher in women than in men (p < 0.001). Contrarily, median AST and ALT were found to be significantly higher in men compared to women (p = 0.014 and p = 0.006, respectively), but were within the reference limits in both sexes. C-reactive protein did not differ between sexes, and it was also below the upper reference limit (Table 4).
Fasting blood glucose (FBG) and insulin were adequate according to the reference limits, but glycosylated haemoglobin (HbA1c) was higher than recommended (< 5.7 %) in both sexes and could be indicative of predisposition to prediabetes, although QUICKI values were comparable to those reported by Katz et al. [33] in obese subjects and HOMA-IR values were similar to the values of healthy volunteers in other studies [40,41]. Regarding glucose metabolism, there were no significant differences between sexes in any of the parameters measured, as shown in Table 4. Mean systolic blood pressure (SBP) and diastolic blood pressure (DBP) were below 140/90 mmHg in both men and women, but men had higher values in both parameters and only SBP was significantly higher compared to women (p = 0.01).
Lower values of CV (≤ 30 %) were found in the following biochemical and blood pressure measurements (Table 4): CT, HDL, LDL, HbA1c, FBG, QUICKI, SBP and DBP. In contrast, TG, VLDL, insulin, HOMA-IR, HOMA-β and ALT showed CV over 50%, outstanding CRP (162.8%).
3.4. Anthropometric, body composition, resting metabolic rate and physical activity measurements
Regarding body weight (Table 5), the mean BMI of the sample population was 30.5 ± 2.9 kg/m2. Among all the participants, 42.9 % were overweight (n = 36), 50 % had grade I obesity (n = 42) and 7.1 % had grade II obesity (n = 6), with no significant differences in the distribution between men and women (data are included in Supplementary Table S3).
There were not significant differences between men (30.8 kg/m2) and women (30.3 kg/m2). These values exceed the recommended BMI settled by the WHO (18.5 kg/m2 - 24.9 kg/m2) and corroborates a higher associated risk for comorbidities in this population [42]. Moreover, mean waist circumference (WC) in both men and women were above the cut-off values defined by the International Diabetes Federation (≥ 94 cm for European men, and ≥ 80 cm for European women), showing a high prevalence of abdominal obesity in the study sample [43]. Despite having similar BMI, waist circumference, hip circumference, the summation of the 6 skinfolds and body composition measurements by multifrequency BIA showed significant differences between women and men, as expected. Body composition analysis indicated that body fat percentage and visceral fat area were significantly higher in women (p < 0.001 and p = 0.003, respectively), whilst percentage muscle mass (p < 0.001), skeletal muscle mass (SMM; p < 0.001) and skeletal muscle index (SMI; p < 0.001) were significantly lower compared to men (Table 5).
In this case, anthropometric and body composition measurements were more homogeneous in the study population, except for the visceral fat area (VFA) which exhibited CV values above the threshold of 30% (Table 5).
Then, the volunteers were classified using the Metabolic Syndrome criteria of the International Diabetes Federation definition for the European population [43], hence participants had to meet at least the criterion of central obesity measured by waist circumference. Once participants were classified, 29 subjects (34.9 %) met the criteria for metabolic syndrome, while 55 (65.5 %) did not (Supplementary Table S5). Although there were significant differences between sexes in some components of the metabolic syndrome, its frequency was similar in men and women (X2 = 1.843, p = 0.175).
The results of physical activity assessment measured by accelerometers are shown in Table 6, together with the RMR measured by calorimetry and data on energy expenditure. There are missing data from volunteers that failed to complete physical activity or RMR measurements. Mean and median METs of the individuals were ≤1.5 METs, which indicates that they had a sedentary lifestyle [44,45], in accordance with EFSA cut-off values for mean physical activity level (PAL), also indicating a prevalence of low physical activity among volunteers, with no significant differences between sexes (Table 6). Average physical activity energy expenditure and METs did not differ between women and men, but women had a significantly higher step count per day than men (p = 0.048). Only two variables had CV above the threshold of 30%: the average physical activity expenditure and the average of steps per day (Table 6), whereas the other variables had homogeneous interindividual values.
To assess if the energy intake (EI) in the 24-hour food recalls collected in the present work were underestimated, Goldberg & Black [46,47] equations for implementation of cut-off values to evaluate misreporting of EI were used. The fundament of these equations consists in calculating cut-off values with specific intervals at 95 % of confidence. The cut-off values can be calculated at individual level or at group level, using PAL values. To better understand the misreporting in the present study, the assessment was conducted at both group and individual level using calculated PAL values, RMR measured by calorimetry and TEE. Afterwards, EI:RMR ratio was calculated, considering that if the ratio is below the lower limit of the confident interval (CI), participants underreported their EI, and if it is above the upper limit of the CI, participants over reported their EI [53]. Using this method at individual level, 68.8 % of the participants had an adequate report of their EI, 27.1 % of the subjects underreported their EI and 4.2 % over reported their EI. Comparing the group who underreported their EI to those with an adequate report, although EI (1477 ± 300 kcal/day and 2070 ± 351 kcal/day, respectively) and the energy density of the diet (0.875 ± 0.222 and 1.000 ± 0.179, respectively) was lower in under-reporters, BMI in both groups was similar (30.4 ± 1.7 kg/m2 and 30.8 ± 3.1 kg/m2, respectively).
3.5. Principal component analysis (PCA)
To explore the contribution to variability of the main factors associated with the overweight/obesity condition in the sample population, factor analysis was carried out by PCA with different, sequential approaches. The variables included in the analysis are highly relevant regarding diet composition, cardiometabolic health, body composition and energy expenditure, and widely accepted to be closely related to obesity. Some indexes were used, such as HOMA-IR or Waist/Hip ratio, in these cases the original variables were not included.
For the dietary factor analysis, intake of energy, macronutrients, dietary cholesterol, dietary fibre and (poly)phenols were included in the PCA. The KMO measure of sampling adequacy and the Bartlett test of sphericity were carried out to evaluate the adequacy of the data to conduct the PCA. In this case, the KMO value was 0.787 and the p value of the Bartlett test of sphericity was significant (p <0.001). These results show that the data were adequate for factor analysis. Once the PCA was conducted (n = 80), three main factors emerged accounting for 75.0 % of the total variance (Table 7). The first factor accounted for 51.0 % of total variance and the higher positive loadings were lipids, MUFA, energy intake (EI), dietary cholesterol, SFA, PUFA, and proteins. Therefore, this factor could be called the “Caloric and lipid component”. The second factor was responsible of 13.5 % of total variance and the main variables with higher positive loadings were total (poly)phenol intake, dietary fibre, and intrinsic sugars, thus this factor could be closely related to fruits, vegetables and legumes as food sources rich in these compounds and could be named “Plant-based diet factor”. Finally, the third factor accounted for 10.5 % of total variance and the main positive loadings were added sugars and total carbohydrates, and thus may be named the “Dietary glycaemic factor” (Table 7). Complete data are shown in supplementary material (Tables S6 and S7).
The second PCA (n = 81) consisted of variables related to body composition measurements, analysed through anthropometry and BIA, and variables related to cardiometabolic risk factors (biochemical measurements). The result of the KMO test was 0.670 and the p value of the Bartlett test was <0.001, therefore the selected variables were adequate to perform a PCA. Four main factors arose accounting for 80.13 % of the total variance (Table 8). The first factor was responsible for 30.5 % of the variance and the variables with higher positive loadings were the percentage of body fat, the visceral fat area, the summation of 6 skinfolds and the BMI, while the percentage of muscle mass had a negative loading, thus it was named ‘‘Adiposity factor”. The second factor was responsible for 26.6 % of variance and the variables with the higher positive loadings were TG, VLDL, HOMA-IR, waist/hip ratio and BMI, whilst HDL had a high negative loading. This second factor was labelled as ‘‘Cardiometabolic risk factor’’. A third factor emerged and was responsible for 16.1 % of the variance, this factor was composed of three variables with higher positive loadings: DBP, SBP and waist/hip ratio. Hence, it could be named as ‘‘Blood pressure and abdominal obesity factor’’. Finally, the fourth factor accounted for 9.7% of the total variability and the variables with higher positive loadings were total Cholesterol and LDL, thus it was called ‘‘Cholesterol factor’’ (Table 8). Complete data are shown in supplementary material (Tables S8 and S9).
A third PCA was conducted using all the variables extracted in the other two PCAs (n = 77). The KMO value for this PCA was 0.677 and the p value of the Bartlett test was <0.001. Seven factors arose accounting for 81.5 % of total variance (Table 9). The first factor responsible for 25.9% of the total variability of the data, included the variables corresponded to the “Caloric and lipid factor” which was the first component in the dietary PCA, although the loadings slightly changed. The following factors were the same as that obtained in the previous PCA: the second factor accounted for 16.9 % and was identical as “Adiposity factor”, the third factor responsible for 13.2 % of total variability was the ‘‘Cardiometabolic risk factor’’, the fourth factor was responsible for 9.4 % of total variability was the ‘‘Cholesterol factor’’, the fifth factor was the ‘‘Blood pressure and abdominal obesity’’ and accounted for 6.5 % of total data variability, the sixth factor was the “Plant-based diet factor” and accounted for 5% of the variance. And to end, the seventh factor emerged accounting for 4.5 % of total variance and corresponded to “Dietary glycaemic factor” (Table 9). Complete data are shown in supplementary material (Tables S10 and S11).
To end, a fourth PCA was carried out using all the variables presented above, and also including total energy expenditure (TEE), average steps per day and METs (data are shown in Supplementary Tables S12 and S13). The KMO value was 0.585 and the p value of Bartlett test was < 0.001 as in the other PCAs performed. This new model retained eight factors that explained 82.3 % of total variance. The sample size for this PCA was low (n = 46) and the KMO value was below 0.6, thus the results cannot be representative of all subjects’ data. Nevertheless, after introducing these new variables related to energy expenditure and physical activity, the components previously described were observed: “Caloric and lipid factor” explained 23.2 % of the variance, the “Cardiometabolic risk factor” 15.5%, the “Adiposity factor” 12.9%, of the variance, the “Cholesterol factor” 8.5% of the variance, the new fifth factor formed by “METs, average steps per day and TEE” named “Energy factor” explained 7.7 % of total variance, the “Blood pressure factor” 5.6% of the variance, the “Plant-based diet factor”4.9% of the variance and the “Dietary glycaemic factor” 4.0% of the variance.
4. Discussion.
The current work aimed to contribute to our understanding of the variability and potential relationship between some of the main factors associated with overweight/obesity, i.e. food intake (both quantity and quality of the diet), energy expenditure (RMR and physical activity), body composition and cardiometabolic risk factors in a mixed (men and women) sample population affected with this disorder. Therefore, a holistic approach was used to comprehend the baseline characteristics in the studied population.
The initial characterization of the study population here presented corresponds to the baseline features of volunteers participating in a randomized, cross-over, blind, dose-response nutritional intervention to understand the effects of coffee bioactive compounds on overweight/obesity. In this nutritional intervention, special attention has been paid to address a wide range of factors potentially contributing to the inter-individual variability in the response to dietary bioactive compounds, specifically (poly)phenols. Thus, deepening into the main factors contributing to the variability of the population before starting the intervention would help to understand the factors involved in obesity and better explain the different response of these volunteers to the intervention with a slightly roasted coffee rich in (poly)phenols as a weight losing/health improving tool.
It is well known that diet is a key factor in obesity prevention and treatment. As aforementioned, current research addressing the factors causing inter-individual variability in response to dietary interventions incorporates rigorous analyses of dietary intake [13]. As shown in the results of the present work, 27.1 % of participants underreported their EI. In line with this, previous studies support that people with overweight or obesity [48,49] tend to underreport their EI for different reasons: some underreport their food consumption deliberately, others forget some food or beverages once they are interviewed (memory bias), or they can reduce and/or modify their food consumption, or else make different food choices due to the Hawthorne effect, consisting in participants changing eating behaviour during the period of study due to being observed [48]. A possible explanation to the higher CV values observed in the dietetic variables (apart from the interindividual differences naturally present in the volunteers) is the misreporting of the 24-hours of dietary recalls.
Another lifestyle factor that has been extensively linked to obesity and overweight, is excessive EI or elevated energy density of the diet, high consumption of foods rich in SFA or added sugars [50,51,52,53,54], as well as unhealthy dietary patterns due to inadequate dietary choices [51]. In the present study, participants’ diet was unbalanced, as the caloric profile did not meet the nutritional objectives for Spanish population [39]. In addition, other nutritional objectives were not met (Table 2 and Table 3), such as daily dietary fibre intake, that was 14.5 g and 5.8 g lower than recommended intake for men and women, respectively (nutritional objective: 35 g/day for men and 25 g/day for women). When the nutrients intake was corrected by EI, dietary fibre intake per 1000 kcal continued to be below the recommendation (14 g per 1000 kcal for both sexes) [39]. Regarding dietary cholesterol, daily intake was 338 mg (38 mg higher than recommended) and when corrected by EI, dietary cholesterol continued to be above the recommendation of 100 mg per 1000 kcal (mean value of 172 mg per 1000 kcal; Table 3). The energy coming from lipids was also elevated (40.9 %) in detriment of carbohydrates (36.9 %). Fatty acids (FA) intake was also inadequate, as SFAs were above 10 % of total EI (12.6 %), mean α-linolenic acid intake was below 1 % of total EI (0.5 %) and mean linoleic acid was above 3 % (4.5 %). Moreover, the ratio between total ω6: ω3 FA was also unbalanced, 6.5:1 instead of being between 4:1 and 2:1 as recommended [55]. Although most participants had moderate adherence to MD according to MEDAS questionnaire (74.6 %, Supplementary Table S4), they had an inadequate lipid intake, high in SFA and ω6 and low in ω3 FA. These higher intakes of SFAs and ω6 has been observed in the Western dietary pattern [56]. In addition, the high intake of SFAs and cholesterol might indicate that subjects’ diet was rich in animal products such as red and processed meat, or other foods rich in SFAs, to the detriment of foods that are sources of dietary fibre, such as vegetables, fruits, whole grains, and nuts as dietary fibre intake was lower than recommended [50,52,56].
Regarding sex differences in diet composition, only total carbohydrate intake was different between men and women (p = 0.038), but when expressed as the energy coming from carbohydrates, it did not reach the threshold of significance. Nevertheless, women showed a trend to a lower carbohydrate intake (Table 2 and Table 3). Furthermore, the percentage of energy coming from α-linolenic acid was significantly higher in women (p = 0.029), but these differences cannot be considered clinically relevant (median values 0.49 % in women and 0.40 % in men; total α-linolenic acid in grams: 0.975 g in women and 0.920 g in men). These results dissent from previous studies describing that women consume more foods rich in carbohydrates and simple sugars, but men have higher consumption of food rich in fats [57], or from other research showing that women in southern European countries consume more fruits, vegetables and, therefore, more dietary fibre than men who also had a higher fat intake [37]. In this case, total dietary fibre intake and dietary fibre corrected by energy (g / 1000 kcal) were similar and lower than recommended for both sexes, as well as (poly)phenol intake (total and corrected by energy). These dietary indices and the subjects’ macronutrient intake may indicate that the consumption of fruits, vegetables, whole cereals and other sources of dietary fibre and (poly)phenols are low and homogeneous between both sexes (Table 2).
Nonetheless, nowadays most authors agree that one dietary factor alone, or sole nutrients such as SFA or added sugars, should not be used to determine if a diet is healthy or not, as it is necessary to consider the dietary pattern as a whole to assess the influence of the diet in cardiometabolic or obesity risk [54]. In agreement, interventional studies have shown that replacement of SFA with unsaturated fatty acids (UFA) might have limited effect in reducing waist circumference or improving serum lipid profile in metabolically healthy adults with overweight and obesity if caloric restriction is not achieved [50]. Regarding sugar intake, intrinsic sugars and the percentage of energy coming from these sugars (Table 2 and Table 3), were similar to those described in the ANIBES study in a representative sample of Spanish population aged between 18 to 64 years old [58]. Alike the results of the aforementioned study with SFA and UFA [50], reducing free sugar intake must be accompanied with lower EI, as isoenergetic replacement with other carbohydrates is not significantly associated with changes in body weight [53]. There is a body of evidence that supports that the Mediterranean diet may reduce cardiometabolic risk and obesity [52,59] and that lifestyle changes to balance EI and energy expenditure are more realistic strategies to treat the excess of body fat [60]. The results of the present study show that participants’ diet was slightly deflected from the traditional Mediterranean diet, which is predominantly a plant-based and a low energy density diet. This outcome is agreement with studies that support that the Spanish population is moving away from the Mediterranean diet, with high meat consumption and low in foods that are sources of dietary fibre and (poly)phenols, which could be related to the increasing rates of cardiometabolic diseases in Spain [61].
In nutritional epidemiology, factor analysis is a commonly used method to derive eating patterns [62,63,64,65]. Therefore, in the present study factor analysis was used to reduce dietary data collected with the 24-hour recalls into patterns based upon the inter-correlations between nutrients. Three factors emerged accounting for 51.0 %, 13.5 % and 10.5 % respectively (Table 7). The first factor (the “Caloric and lipid risk factor”) was related to total lipid intake and lipid composition, as well as protein intake of the diet and EI, could be related to a high energy density diet. The second factor (the “Plant-based diet factor”) with total (poly)phenol intake, dietary fibre and intrinsic sugars as main loadings, could be a proxy for fruits, vegetables, whole cereals and other plant-based products, and it may be considered as a healthy pattern. The third factor (the “Dietary glycaemic factor”) was mainly formed by added sugars and total carbohydrate intake, and to a lower extent SFA, could be associated with a Western dietary pattern [56].
In addition to dietary intake, the other key factor that must be considered for understanding inter-individual variability in weight loss is energy expenditure, which includes physical activity and resting energy requirements [13]. Regarding physical activity, median METs values indicate that most volunteers had a sedentary behaviour (median METs values 1.12, Table 6). This outcome was reinforced by individual PAL values (calculated as the ratio between TEE:RMR), which indicated that most participants had low levels of physical activity (mean PAL value 1.36) and only one subject had moderate physical activity levels (PAL value above 1.6), according to EFSA cut-off values [30,47]. These results agree with previous studies that showed that the prevalence of physical inactivity and sedentary behaviour is higher in adults with obesity. In fact, in a recent metanalysis an increased risk of obesity with sedentary behaviour and physical inactivity was corroborated [45].
The negative impact in cardiovascular health of sedentary behaviour has been extensively described [66]. As shown in a recent study, postprandial glucose, insulin and plasma TG diminished with regular bouts of physical activity after prolonged sitting, reducing cardiometabolic risk [66]. Other mechanisms involved are related to enzymes that regulate lipid metabolism, such as muscle lipoprotein lipase (LPL), that are significantly reduced after long periods of immobilization, changes associated with lower levels of HDL, higher levels of TG and postprandial lipids [67,68]. As stated before, only a few dietary and physical activity parameters differ significantly between women and men, but these differences were not clinically relevant (Table 2, Table 3 and Table 6). Other differences in body composition, biochemical measurements, or energy expenditure may be explained by sex-specific differences that are widely documented.
As expected, there were significant differences between women and men in anthropometric and body composition measurements (Table 5). Due to hormonal dissimilarity and a higher expression of estrogenic and progesterone receptors in subcutaneous adipose tissue, women have more fat mass and a peripheral distribution of adiposity. On the contrary, men usually accumulate fat mass in the abdominal and thoracic area [57]. Interestingly, in the present study female subjects had a significantly higher visceral fat area (VFA) than men (p = 0.003) indicating a central distribution of adiposity. This elevated accumulation of fat in visceral tissues could be explained by the age of female subjects (median age 53 years), as visceral fat accumulation tends to increase due menopause and in postmenopausal women visceral fat represents nearly 15 to 20 % of total fat [69]. Although, this excess of visceral fat can increase the cardiometabolic risk in postmenopausal women [69], women did not exhibit a higher metabolic risk comparing to men when serum lipid profile, glucose metabolism or other measurements were analysed (Table 4).
Regarding cardiometabolic sex differences, women showed higher HDL levels compared to men, which is related to sex hormones differences, mainly due to oestrogens [70], and lower levels of transaminases (AST and ALT) and SBP (Table 4). Transaminases, especially ALT, are markers of non-alcoholic fatty liver disease (NAFLD), recently termed as MAFLD. Moreover, elevated ALT levels had been associated with an increased risk of metabolic syndrome or insulin resistance [71]. Other studies support that liver transaminases levels are associated with sex, specifically, men usually have higher levels of ALT [71,72,73,74]. In this study, although men had higher transaminases levels, both sexes had transaminase values within reference limits (Table 4). SBP was also higher in men than in women, in accordance with previous research suggesting that the higher prevalence of hypertension in men may be due to interactions between oestrogens/testosterone and the renin-angiotensin-aldosterone system. Nonetheless, women appeared to have higher cardiovascular risk at lower blood pressure levels than men, and once menopause is reached, blood pressure increases at higher rates in women [75,76]. Considering these results, and due to the high prevalence of Metabolic Syndrome in this specific population (Supplementary Table S5), participants might benefit from an intervention that could reduce their cardiometabolic risk or that could help controlling some components of metabolic syndrome.
When tackling overweight and obesity with a personalized approach, many factors may be considered [20], thus it is important to understand the relationship between them and it may be convenient to transform a large set of correlated variables into smaller sets of non-correlated variables, called principal components or factors [62,63,64,65]. This analysis allows to identify the underlying structure in data matrix and describe data in terms of a much smaller number of items than do the individual variables. In the present study this approach was carried out using dietary items, total energy expenditure, body composition, biochemical and blood pressure baseline biomarkers. Including the twenty-nine variables shown in supplementary material (Tables S12 and S13), 8 factors arouse. However, as aforementioned, this analysis presented certain limitations as the KMO value was under 0.6 (0.565), and because we had a smaller sample size for these variables for reasons explained in the limitation section at the end of this work. In addition, considering that this factor contributed to a low extent (7.7%) to the total variability, to improve this analysis, the factor related to energy expenditure (TEE, METs and average steps per day) was removed.
After removing the energy expenditure factor, twenty-six variables were reduced into seven factors explaining 81.5 % of the total variance (Table 9). Out of the seven factors, three (1, 6 and 7) were composed of dietary variables accounting for 35.4 % of total data variability. These results are in line with a previous study [77] using a similar statistical approach (PCA) carried out with dietary, body composition and biochemical variables. As in Garaulet et al. [77], the main factor was composed of total lipid intake, as well as lipid composition (MUFA, SFA, PUFA), proteins and dietary cholesterol (the ‘‘Caloric and lipid factor’’; Table 9). These results point out to energy dense foods, animal products and foods with high-lipid content as the main dietary components contributing to participants’ overweight/obesity. Moreover, this result agrees with dietary unbalance identified with the 24-hour recall dietary analysis, that showed high intake of lipids, proteins and cholesterol (Table 2 and Table 3). Although with the dietary analysis software used (DIAL) the source of protein (i.e. animal or plant) cannot be distinguished, considering that dietary cholesterol is only found in animal products [78] and due to the strong correlation found between protein intake and dietary cholesterol, both corrected by EI (rho = 0.509, p < 0.001), it could be inferred that the main source of protein in the participants’ diet was of animal origin. High consumption of protein coming from plant-based foods (legumes, nuts, seeds) had been associated with better health outcomes [79], whilst higher consumption of animal products, specifically red or processed meat, has been related to cardiovascular diseases, mainly due to their high content of SFA [80]. As aforementioned, the subjects of this study exceeded the recommended intake of SFA and protein, while their dietary fibre intake was low, which also points to a higher consumption of animal-based products (Table 3) and low consumption of plant-based protein that are also sources of fibre and (poly)phenols, related to better health outcomes [81]. This idea is reinforced with the low contribution of the ‘‘Plant-based diet factor” (5%) to the total variance.
(Poly)phenol intake values in the present work (1073 mg/day, Table 1), were similar to those described in the EPIC study in Mediterranean countries (1011 mg/day) [22]. In previous studies, these compounds have shown anti-obesity properties explained by different mechanisms, such as modulating some neuro-hormones that play a role in satiety like neuropeptide Y, supressing lipogenesis or even modifying the microbiota. Therefore, a modification of dietary habits increasing the consumption of plant-based foods rich in phenolic compounds, including consumption of a (poly)phenol-rich coffee, could help to reduce the risk of developing obesity and/or treat comorbidities related to features of obesity/metabolic syndrome in certain subjects depending on baseline features [82,83]. This idea is based on a previous human study in which a blend of green/roasted coffee rich in (poly)phenols, was regularly consumed at a realistic rate (3 cups/day) by healthy and hypercholesterolemic subjects. The subjects with higher cardiovascular risk showed an improvement in cardiometabolic risk markers and abdominal adiposity, which were not observed in healthy subjects. Another important outcome of that study was the high interindividual variability in the biomarkers analysed [23,25,84]. Not only did the percentage of responders and non-responders vary between the two study groups, but there was also a large variability in the extent of the response, with variations in the range of 1-115 units decrease in total cholesterol or TG as an example.
Even though the “Caloric and lipid” factor (EI, lipids and proteins) explained most variability (25 %), the “Adiposity factor” and “Cardiometabolic risk factor” had a considerable contribution to total variability in the PCA (16.9% and 13.2%, respectively; Table 8). The relevance of the secondary factor related to adiposity (% body fat, visceral fat area, etc.) may be attributed to the adipose tissue being not only an energy reservoir but also a secretory organ of certain molecules that have endocrine, paracrine, and autocrine actions, that are involved in the regulation of body weight (leptin, adiponectin), in the local inflammation generated in obesity (tumour necrosis factor α, interleukin (IL)-6, and IL-1β), or in vascular function (angiotensin II and plasminogen activator inhibitor-1) [85,86]. The low-grade inflammation is closely related to insulin resistance and angiogenesis which would explain the importance of the next factor that accounts for more variability, the “Cardiovascular risk factor” (main loadings TG, VLDL, HDL). Accordingly, most participants had elevated abdominal and subcutaneous obesity measured by different indices (Table 5 and Table 6), elevated cardiometabolic risk attending to high total cholesterol values, and glycosylated haemoglobin (HbA1c) levels that indicated that most participants could be at risk of prediabetes. The fifth component was the “Blood pressure & abdominal fat component”, which accounted for 6.5% of the variability, showing that SBP, DBP and the waist/hip ratio were interconnected. These findings were in accordance with other studies showing a dose response relationship between higher values of waist to hip ratios and increased risk of hypertension [87].
To sum up, an unbalanced ratio between energy intake and expenditure, with an inadequate dietary composition, high in lipids and proteins of animal origin, low in dietary fibre and bioactive compounds (such as (poly)phenols), might trigger body composition changes by elevating subcutaneous and visceral fat. These changes in adiposity may alter the serum lipid profile, leading to hypercholesterolemia, hypertriglyceridemia, insulin resistance and inflammation, thus connecting obesity, and especially abdominal obesity, with metabolic syndrome, T2D or cardiovascular disease [86].
Strengths and weaknesses
A strength of this study is that participants were exhaustively characterised using objective and accurate techniques: the measurement of physical activity was done with accelerometers, the assessment of RMR with indirect calorimetry, the diet was systematically measured using three 24-hours dietary recalls, which enabled the meticulous estimation of (poly)phenol intake. Body composition was rigorously measured by anthropometry and BIA. However, there are some limitations in the present work. This is not an epidemiologic study, but the initial characterization of a study population participating in a randomized controlled trial. The sample size (n=84) is large enough to carry out the cross-over intervention to study the inter-individual variability in the response to the intake of coffee, although a higher number of participants would have been preferred to tackle the variability of the main factors associated with overweight/obesity like dietary intake, energy expenditure, cardiometabolic risk factors, etc. here addressed. In addition, some data from accelerometers were missing due to attrition bias, commonly occurring in other interventional studies; it seems that some volunteers did not wear the accelerometer during the time indicated or the equipment did not register the data properly. Therefore, data on energy expenditure used in the fourth PCA had a lower sample size and results from this factor analysis should be taken with caution, as these are not representative of all subjects. Furthermore, as these data were necessary to estimate the misreporting of the EI, it was not possible to perform sub-analysis based on subgroups of people that underreport, overreport or are adequately reporting the EI. Since eliminating those who underreport or overreport their EI might bias the data, the PCA was performed with all participants without segmenting. It could be hypothesized that the high CVs of the dietetic variables were because of the misreporting in some individuals, but due to lower sample size, (n = 13 underreport, n = 33 had an adequate report, n = 2 overreport) the analysis was not carried out. Moreover, the CI of the cut-off values at individual level (n= 1) are wider and could be limited at detecting invalid reports [46]. However, some limitations of these methods were avoided by calculating PAL at individual level using more reliable tools to measure physical activity (by accelerometers) and RMR (by calorimetry). This approach is more accurate to identify misreporting of dietary recalls at individual level [47].
We acknowledge that not all the factors related with obesity have been included in the present analysis, due to the complexity and extension. Factors like sex, age, ethnicity, socioeconomic status, and education, which were described in the characterization of the sample population were not included in the analysis due to the relative homogeneity of these variables in the sample population investigated here. Other important factors not included in this manuscript are: 1) The intestinal microbiota, a key determinant of inter-individual variability also affected by factors like age, genetics, health (particularly antibiotics) and environmental factors, especially diet [88]. 2) Circadian rhythms and food timing. The alteration of normal circadian rhythmicity or chronodisruption derived from sleep deprivation, shift work, social jet lag, etc. has been shown to increase the prevalence of adiposity [89]. Also, circadian timing of food intake contributes to weight gain and the success of weight reduction interventions [90,91]. 3) Emotion dysregulation and other psychological and behaviour aspects related to obesity [92] that are gaining importance in weight treatments, are also factors contributing to inter-individual variability and are being considered in the project but not presented here. Last, but not least, 4) genetic susceptibility in another key contributor, since it is estimated that between 40-70% of the variation in obesity susceptibility is due to inter-individual genetic differences, mostly single nucleotide polymorphisms (SNPs) [93]. All these factors have been addressed within the GREENCOF project and will be reported in future communications.
5. Conclusions
In the present studied sample population of men and women with overweight or obesity, a large variability was found in the intake of specific dietary items (particularly, total (poly)phenols, added sugars, ω3, and alcohol), biochemical variables (mainly TG, VLDL, ALT, insulin and derived indexes) and physical activity measurements (average steps and physical activity expenditure). In contrast, anthropometric and body composition measurements were more homogenous, except for visceral fat area. Volunteer’s diet composition was unbalanced, particularly high in lipids, and most participants had a sedentary behaviour with low physical activity. Regarding sex-related differences, besides body composition distinctness, men presented higher SBP and transaminases values and women higher HDL and visceral fat area, the latter being closely related to female age. When all the variables related to overweight and obesity were analysed using PCA, diet (mainly: lipids, energy intake and proteins) was the principal factor responsible for most of the data variability in people with overweight and obesity. The second and third factors were the adiposity factor (mainly related to total body fat and visceral fat area) and the cardiometabolic risk factor (mainly composed of TG, VLDL, insulin resistance and closely related to abdominal obesity). Interestingly, the fifth factor was related to SBP, DBP and the waist/hip ratio, indicating a relationship between abdominal obesity and blood pressure. These outcomes may be attributed to the important role of the adipose tissue as a secretory organ of molecules involved in the regulation of body weight, inflammation and vascular function.
Supplementary Materials
The following supporting information can be downloaded at the website of this paper posted on Preprints.org.
Author Contributions
Conceptualization, B.S., L.B., J.L.S.-C., M.-T.G.-C, B.B., C.C. and A.F.-C.; methodology, B.S., L.B., J.L.S.-C., M.-T.G.-C, B.B., C.C. and A.F.-C.; validation, B.S., L.B., J.L.S.-C., M.-T.G.-C, B.B. and C.C.; formal analysis, A.F.-C., A.L.-J. and J.L.S.-C.; investigation, A.F.-C., A.L.-J., B.S., L.B., J.L.S.-C., M.-T.G.-C, B.B. and C.C.; resources, B.S. and L.B.; data curation, A.F.-C., A.L.-J., J.L.S.-C., B.S., L.B.; writing—original draft preparation, A.F.-C. and B.S.; writing—review and editing, A.F.-C., B.S., L.B., M.-T.G.-C., J.L.S.-C., B.B., A.L.-J. and C.C.; visualization, A.F.-C.; supervision, B.S., L.B., J.L.S.-C., M.-T.G.-C, B.B. and C.C.; project administration, B.S. and L.B.; funding acquisition B.S. and L.B. All authors have read and agreed to the published version of the manuscript.
Funding
This research is funded by the Ministry of Science, Innovation and Universities of Spain (Ref.: PID2020-114102RB-I00). The following authors were granted with CSIC JAE Intro grants: A.F.-C. (Ref.: JAEINT_23_00055); A. G.-L. (Ref.: JAEINT_22_00662); as well as Alicia Fernández-Alonso (Ref.: JAEINT_22_02911).
Institutional Review Board Statement
The study was conducted in accordance with the Declaration of Helsinki and approved by the Ethics Committee of Hospital Universitario Puerta de Hierro Majadahonda (protocol code PI 200/21XXX and date of approval 06/05/2022) and the Ethics Committee of CSIC (Ref. 123/2022 and date of approval 15/08/2022).
Informed Consent Statement
Informed consent was obtained from all subjects involved in the study.
Acknowledgments
We acknowledge the support at many stages of the human study, given by Alicia Fernández-Alonso; Andrea Sánchez-Medina; Teresa A. González de Toro; Sandra Rodríguez Fernández; Alana Moore; Beatriz del Cura and David García-García. We also thank Milagros Sánchez-Prieto for her technical assistance. Authors are deeply grateful to the volunteers who made GREENCOF possible.
Conflicts of Interest
The authors declare no conflict of interest. The funders had no role in the design of the study; in the collection, analyses, or interpretation of data; in the writing of the manuscript; or in the decision to publish the results.
References
- Luli, M.; Yeo, G.; Farrell, E.; Ogden, J.; Parretti, H.; Frew, E.; Bevan, S.; Brown, A.; Logue, J.; Menon, V.; et al. The Implications of Defining Obesity as a Disease: A Report from the Association for the Study of Obesity 2021 Annual Conference; EClinicalMedicine 2023, 58, 101962. [CrossRef]
- Available online: https://www.who.int/en/news-room/fact-sheets/detail/obesity-and-overweight (accessed on 17 December 2023).
- World Health Organization [WHO]. Regional Office for Europe WHO European Regional Obesity: Report 2022; WHO: Geneva, Switzerland, 2022; ISBN 978-92-890-5773-8.
- González-Muniesa, P.; Mártinez-González, M.A.; Hu, F.B.; Després, J.P.; Matsuzawa, Y.; Loos, R.J.F.; Moreno, L.A.; Bray, G.A.; Martinez, J.A. Obesity. Nat Rev Dis Primers 2017, 3, 17034. [CrossRef]
- Di Cesare, M.; Bentham, J.; Stevens, G.A.; Zhou, B.; Danaei, G.; Lu, Y.; Bixby, H.; Cowan, M.J.; Riley, L.M.; Hajifathalian, K.; et al. Trends in Adult Body-Mass Index in 200 Countries from 1975 to 2014: A Pooled Analysis of 1698 Population-Based Measurement Studies with 19.2 Million Participants. The Lancet 2016, 387, 1377–1396. [CrossRef]
- Ezzati, M.; Riboli, E. Behavioral and Dietary Risk Factors for Noncommunicable Diseases. N Engl J Med 2013, 369, 954–964. [CrossRef]
- WHO. Global Health Risks: Mortality and Burden of Disease Attributable to Selected Major Risks; WHO: Geneva, Switzerland, 2009; ISBN 978-92-4-156387-1.
- Reilly, S.M.; Saltiel, A.R. Adapting to Obesity with Adipose Tissue Inflammation. Nat Rev Endocrinol 2017, 13, 633–643. [CrossRef]
- Chung, W.K.; Leibel, R.L. Considerations Regarding the Genetics of Obesity. Obesity 2008, 16, S33–S39. [CrossRef]
- Losavio, J.; Keenan, M.J.; Gollub, E.A.; Silver, H.J. Factors That Predict Weight Loss Success Differ by Diet Intervention Type. Front Nutr 2023, 10, 1192747. [CrossRef]
- Tsatsoulis, A.; Paschou, S.A. Metabolically Healthy Obesity: Criteria, Epidemiology, Controversies, and Consequences. Curr Obes Rep 2020, 9, 109–120. [CrossRef]
- Chooi, Y.C.; Ding, C.; Magkos, F. The Epidemiology of Obesity. Metabolism 2019, 92, 6–10. [CrossRef]
- Dent, R.; McPherson, R.; Harper, M.E. Factors Affecting Weight Loss Variability in Obesity. Metabolism 2020, 113, 154388. [CrossRef]
- Markle, J.G.M.; Frank, D.N.; Mortin-Toth, S.; Robertson, C.E.; Feazel, L.M.; Rolle-Kampczyk, U.; Von Bergen, M.; McCoy, K.D.; Macpherson, A.J.; Danska, J.S. Sex Differences in the Gut Microbiome Drive Hormone-Dependent Regulation of Autoimmunity. Science 2013, 339 (6123), 1084–1088. [CrossRef]
- Yurkovetskiy, L.; Burrows, M.; Khan, A.A.; Graham, L.; Volchkov, P.; Becker, L.; Antonopoulos, D.; Umesaki, Y.; Chervonsky, A. V. Gender Bias in Autoimmunity Is Influenced by Microbiota. Immunity 2013, 39, 400–412. [CrossRef]
- Asarian, L.; Geary, N. Sex Differences in the Physiology of Eating. Am J Physiol Regul Integr Comp Physiol 2013, 305, 1215–1267. [CrossRef]
- Cuevas-Sierra, A.; Milagro, F.I.; Guruceaga, E.; Cuervo, M.; Goni, L.; García-Granero, M.; Martinez, J.A.; Riezu-Boj, J.I. A Weight-Loss Model Based on Baseline Microbiota and Genetic Scores for Selection of Dietary Treatments in Overweight and Obese Population. Clinical Nutrition 2022, 41, 1712–1723. [CrossRef]
- Anekwe, C.V.; Jarrell, A.R.; Townsend, M.J.; Gaudier, G.I.; Hiserodt, J.M.; Stanford, F.C. Socioeconomics of Obesity. Curr Obes Rep 2020, 9, 272–279. [CrossRef]
- Cai, T.; Tian, L.; Wong, P.H.; Wei, L.J. Analysis of Randomized Comparative Clinical Trial Data for Personalized Treatment Selections. Biostatistics 2011, 12, 270–282. [CrossRef]
- De Toro-Martín, J.; Arsenault, B.J.; Després, J.-P.; Vohl, M.-C. Precision Nutrition: A Review of Personalized Nutritional Approaches for the Prevention and Management of Metabolic Syndrome. Nutrients 2017, 9, 913. [CrossRef]
- Gómez-Juaristi, M.; Martínez-López, S.; Sarria, B.; Bravo, L.; Mateos, R. Bioavailability of Hydroxycinnamates in an Instant Green/Roasted Coffee Blend in Humans. Identification of Novel Colonic Metabolites. Food Funct 2018, 9, 331–343. [CrossRef]
- Zamora-Ros, R.; Knaze, V.; Rothwell, J.A.; Hémon, B.; Moskal, A.; Overvad, K.; Tjønneland, A.; Kyrø, C.; Fagherazzi, G.; Boutron-Ruault, M.C.; et al. Dietary Polyphenol Intake in Europe: The European Prospective Investigation into Cancer and Nutrition (EPIC) Study. Eur J Nutr 2016, 55, 1359–1375. [CrossRef]
- Martínez-López, S.; Sarriá, B.; Mateos, R.; Bravo-Clemente, L. Moderate Consumption of a Soluble Green/Roasted Coffee Rich in Caffeoylquinic Acids Reduces Cardiovascular Risk Markers: Results from a Randomized, Cross-over, Controlled Trial in Healthy and Hypercholesterolemic Subjects. Eur J Nutr 2019, 58, 865–878. [CrossRef]
- Ludwig, I.A.; Clifford, M.N.; Lean, M.E.J.; Ashihara, H.; Crozier, A. Coffee: Biochemistry and Potential Impact on Health. Food Funct 2014, 5, 1695–1717. [CrossRef]
- Sarriá, B.; Martínez-López, S.; Sierra-Cinos, J.L.; García-Diz, L.; Mateos, R.; Bravo-Clemente, L. Regularly Consuming a Green/Roasted Coffee Blend Reduces the Risk of Metabolic Syndrome. Eur J Nutr 2018, 57, 269–278. [CrossRef]
- Hinojosa-Nogueira, D.; Pérez-Burillo, S.; Garciá-Rincón, I.; Rufián-Henares, J.A.; Pastoriza, S. A Useful and Simple Tool to Evaluate and Compare the Intake of Total Dietary Polyphenols in Different Populations. Public Health Nutr 2021, 24, 3818–3824. [CrossRef]
- Neveu, V.; Perez-Jiménez, J.; Vos, F.; Crespy, V.; du Chaffaut, L.; Mennen, L.; Knox, C.; Eisner, R.; Cruz, J.; Wishart, D.; et al. Phenol-Explorer: An Online Comprehensive Database on Polyphenol Contents in Foods. Database (Oxford) 2010, 2010, bap024. [CrossRef]
- 28. Estruch, R.; Ros, E.; Salas-Salvadó, J.; Covas, M.-I.; Corella, D.; Arós, F.; Gómez-Gracia, E.; Ruiz-Gutiérrez, V.; Fiol, M.; Lapetra, J.; et al. Primary Prevention of Cardiovascular Disease with a Mediterranean Diet Supplemented with Extra-Virgin Olive Oil or Nuts. N Engl J Med 2018, 378, e34. [CrossRef]
- García-Conesa, M.-T.; Philippou, E.; Pafilas, C.; Massaro, M.; Quarta, S.; Andrade, V.; Jorge, R.; Chervenkov, M.; Ivanova, T.; Dimitrova, D.; et al. Exploring the Validity of the 14-Item Mediterranean Diet Adherence Screener (MEDAS): A Cross-National Study in Seven European Countries around the Mediterranean Region. Nutrients 2020, 12, 2960. [CrossRef]
- EFSA Panel on Dietetic Products, Nutrition and Allergies (NDA). Scientific Opinion on Dietary Reference Values for Energy. EFSA J 2013, 11, 3005. [CrossRef]
- Matthews, D.R.; Hosker, J.R.; Rudenski, A.S.; Naylor, B.A.; Treacher, D.F.; Turner, R.C. Homeostasis Model Assessment: Insulin Resistance and Fl-Cell Function from Fasting Plasma Glucose and Insulin Concentrations in Man. Diabetologia 1985, 28, 412 - 41. [CrossRef]
- Meier, J.J.; Hü, K.; Holst, J.J.; Deacon, C.F.; Schmiegel, W.H.; Nauck, M.A. Reduced Insulinotropic Effect of Gastric Inhibitory Polypeptide in First-Degree Relatives of Patients With Type 2 Diabetes. Diabetes 2001, 50, 2497 - 2504. [CrossRef]
- Katz, A.; Nambi, S.S.; Mather, K.; Baron, A.D.; Follmann, D.A.; Sullivan, G.; Quon, M.J. Quantitative Insulin Sensitivity Check Index: A Simple, Accurate Method for Assessing Insulin Sensitivity In Humans. J Clin Endocrinol Metab 2000; 85, 2402-2410. [CrossRef]
- Vargas Franco, V. Estadística Descriptiva Para Ingeniería Ambiental Con SPSS; Vargas Franco, V., Eds.; Universidad Nacional de Colombia Editorial UN: Cali, Colombia, 2007; p. 49, ISBN 978-958-33-9319-3.
- Maskarinec, G.; Novotny, R.; Tasaki, K. Nutritional Epidemiology Dietary Patterns Are Associated with Body Mass Index in Multiethnic Women. J Nutr 2000, 130, 3068-3072. [CrossRef]
- Kerver, J.M.; Yang, E.J.; Bianchi, L.; Song, W.O. Dietary Patterns Associated with Risk Factors for Cardiovascular Disease in Healthy US Adults. Am J Clin Nutr 2003, 78, 1103–1110. [CrossRef]
- Stea, T.H.; Nordheim, O.; Bere, E.; Stornes, P.; Eikemo, T.A. Fruit and Vegetable Consumption in Europe According to Gender, Educational Attainment and Regional Affiliation—A Cross-Sectional Study in 21 European Countries. PLoS One 2020, 15, e0232521. [CrossRef]
- Pour-Abbasi, M.S.; Nikrad, N.; Farhangi, M.A.; Vahdat, S.; Jafarzadeh, F. Dietary Energy Density, Metabolic Parameters, and Blood Pressure in a Sample of Adults with Obesity. BMC Endocr Disord 2023, 23, 3. [CrossRef]
- Bartrina, J. A., & Majem, L. S. Objetivos nutricionales para la población española: Consenso de la Sociedad Española de Nutrición Comunitaria 2011. RENC 2011, 17, 178–199.
- Lichnovská, R.; Gwozdziewiczová, S.; Hrebícek, J. Gender Differences in Factors Influencing Insulin Resistance in Elderly Hyperlipemic Non-Diabetic Subjects. Cardiovasc Diabetol 2002, 1, 4. [CrossRef]
- Acosta B, A.M.; Escalona O, M.; Maiz G, A.; Pollak C, F.; Leighton P, F. Determinación Del Índice de Resistencia Insulínica Mediante HOMA En Una Población de La Región Metropolitana de Chile. Rev Med Chil 2002, 130, 1227–1231. http://dx.doi.org/10.4067/S0034-98872002001100004.
- WHO. Obesity: preventing and managing the global epidemic. Report of a WHO consulation; WHO: Geneva, Switzerland, 2000; ISBN 92-4-120894-5.
- Alberti, K.G.M.M.; Zimmet, P.; Shaw, J. Metabolic Syndrome - A New World-Wide Definition. A Consensus Statement from the International Diabetes Federation. Diabetic Med 2006, 23, 469–480. [CrossRef]
- Raiman, L.; Amarnani, R.; Abdur-Rahman, M.; Marshall, A.; Mani-Babu, S. The Role of Physical Activity in Obesity: Let’s Actively Manage Obesity. Clin Med (Lond) 2023, 23, 311–317. [CrossRef]
- Silveira, E.A.; Mendonça, C.R.; Delpino, F.M.; Elias Souza, G.V.; Pereira de Souza Rosa, L.; de Oliveira, C.; Noll, M. Sedentary Behavior, Physical Inactivity, Abdominal Obesity and Obesity in Adults and Older Adults: A Systematic Review and Meta-Analysis. Clin Nutr ESPEN 2022, 50, 63–73. [CrossRef]
- Black, A.E. Critical Evaluation of Energy Intake Using the Goldberg Cut-off for Energy Intake:Basal Metabolic Rate. A Practical Guide to Its Calculation, Use and Limitations. Int J Obes Relat Metab Disord 2000, 24, 1119-1130. [CrossRef]
- European Food Safety Authority (EFSA). Example of a Protocol for Identification of Misreporting (Under-and Over-Reporting of Energy Intake) Based on the PILOT-PANEU Project. EFSA J 2013, 11, 1–17. https://www.efsa.europa.eu/sites/default/files/efsa_rep/blobserver_assets/3944A-8-2-1.pdf.
- Wehling, H.; Lusher, J. People with a Body Mass Index ⩾30 Under-Report Their Dietary Intake: A Systematic Review. J Health Psychol 2019, 24, 2042–2059. [CrossRef]
- Malinowska, A.M.; Mlodzik-Czyzewska, M.A.; Chmurzynska, A. Dietary Patterns Associated with Obesity and Overweight: When Should Misreporters Be Included in Analysis? Nutrition 2020, 70, 110605. [CrossRef]
- Hannon, B.A.; Thompson, S. V.; An, R.; Teran-Garcia, M. Clinical Outcomes of Dietary Replacement of Saturated Fatty Acids with Unsaturated Fat Sources in Adults with Overweight and Obesity: A Systematic Review and Meta-Analysis of Randomized Control Trials. Ann Nutr Metab 2017, 71, 107–117. [CrossRef]
- Vernarelli, J.A.; Mitchell, D.C.; Rolls, B.J.; Hartman, T.J. Dietary Energy Density Is Associated with Obesity and Other Biomarkers of Chronic Disease in US Adults. Eur J Nutr 2015, 54, 59–65. [CrossRef]
- Seifu, C.N.; Fahey, P.P.; Hailemariam, T.G.; Frost, S.A.; Atlantis, E. Dietary Patterns Associated with Obesity Outcomes in Adults: An Umbrella Review of Systematic Reviews. Public Health Nutr 2021, 24, 6390–6414. [CrossRef]
- Morenga, L. Te; Mallard, S.; Mann, J. Dietary Sugars and Body Weight: Systematic Review and Meta-Analyses of Randomised Controlled Trials and Cohort Studies. BMJ 2012, 346, e7492. [CrossRef]
- Khan, T.A.; Sievenpiper, J.L. Controversies about Sugars: Results from Systematic Reviews and Meta-Analyses on Obesity, Cardiometabolic Disease and Diabetes. Eur J Nutr 2016, 55, 25–43. [CrossRef]
- Simopoulos, A.P. Omega-6/Omega-3 Essential Fatty Acid Ratio and Chronic Diseases. Food Rev Int 2004, 20, 77–90. [CrossRef]
- Clemente-Suárez, V.J.; Beltrán-Velasco, A.I.; Redondo-Flórez, L.; Martín-Rodríguez, A.; Tornero-Aguilera, J.F. Global Impacts of Western Diet and Its Effects on Metabolism and Health: A Narrative Review. Nutrients 2023, 15, 2749. [CrossRef]
- Muscogiuri, G.; Verde, L.; Vetrani, C.; Barrea, L.; Savastano, S.; Colao, A. Obesity: A Gender-View. J Endocrinol Invest 2023, 1-8. [CrossRef]
- Ruiz, E.; Rodriguez, P.; Valero, T.; Ávila, J.M.; Aranceta-Bartrina, J.; Gil, Á.; González-Gross, M.; Ortega, R.M.; Serra-Majem, L.; Varela-Moreiras, G. Dietary Intake of Individual (Free and Intrinsic) Sugars and Food Sources in the Spanish Population: Findings from the ANIBES Study. Nutrients 2017, 9, 275. [CrossRef]
- Kastorini, C.M.; Milionis, H.J.; Esposito, K.; Giugliano, D.; Goudevenos, J.A.; Panagiotakos, D.B. The Effect of Mediterranean Diet on Metabolic Syndrome and Its Components: A Meta-Analysis of 50 Studies and 534,906 Individuals. J Am Coll Cardiol 2011, 57, 1299–1313. [CrossRef]
- Rice Bradley, B.H. Dietary Fat and Risk for Type 2 Diabetes: A Review of Recent Research. Curr Nutr Rep 2018, 7, 214–226. [CrossRef]
- Cerrillo, I.; Saralegui-Díez, P.; Morilla-Romero-de-la-Osa, R.; González de Molina, M.; Guzmán, G.I. Nutritional Analysis of the Spanish Population: A New Approach Using Public Data on Consumption. Int J Environ Res Public Health 2023, 20, 1642. [CrossRef]
- Varraso, R.; Garcia-Aymerich, J.; Monier, F.; Le Moual, N.; De Batlle, J.; Miranda, G.; Pison, C.; Romieu, I.; Kauffmann, F.; Maccario, J. Assessment of Dietary Patterns in Nutritional Epidemiology: Principal Component Analysis Compared with Confirmatory Factor Analysis. Am J Clin Nutr 2012, 96, 1079–1092. [CrossRef]
- Newby, P.K.; Tucker, K.L. Empirically Derived Eating Patterns Using Factor or Cluster Analysis: A Review. Nutr Rev 2004, 62, 177–203. [CrossRef]
- Newby, P.K.; Muller, D.; Hallfrisch, J.; Andres, R.; Tucker, K.L. Food Patterns Measured by Factor Analysis and Anthropometric Changes in Adults. Am J Clin Nutr 2004, 80, 504-513. [CrossRef]
- Hu, F.B. Dietary Pattern Analysis: A New Direction in Nutritional Epidemiology. Curr Opin Lipidol 2002, 13, 3–9. [CrossRef]
- Campbell, S.D.I.; Brosnan, B.J.; Chu, A.K.Y.; Skeaff, C.M.; Rehrer, N.J.; Perry, T.L.; Peddie, M.C. Sedentary Behavior and Body Weight and Composition in Adults: A Systematic Review and Meta-Analysis of Prospective Studies. Sports Med 2018, 48, 585–595. [CrossRef]
- Edwardson, C.L.; Gorely, T.; Davies, M.J.; Gray, L.J.; Khunti, K.; Wilmot, E.G.; Yates, T.; Biddle, S.J.H. Association of Sedentary Behaviour with Metabolic Syndrome: A Meta-Analysis. PLoS One 2012, 7, e34916. [CrossRef]
- Park, J.H.; Moon, J.H.; Kim, H.J.; Kong, M.H.; Oh, Y.H. Sedentary Lifestyle: Overview of Updated Evidence of Potential Health Risks. Korean J Fam Med 2020, 41, 365–373. [CrossRef]
- Kodoth, V.; Scaccia, S.; Aggarwal, B. Adverse Changes in Body Composition During the Menopausal Transition and Relation to Cardiovascular Risk: A Contemporary Review. Womens Health Rep (New Rochelle) 2022, 3, 573–581. [CrossRef]
- Holven, K.B.; Roeters van Lennep, J. Sex Differences in Lipids: A Life Course Approach. Atherosclerosis 2023, 384. [CrossRef]
- Buday, B.; Pach, P.F.; Literati-Nagy, B.; Vitai, M.; Kovacs, G.; Vecsei, Z.; Koranyi, L.; Lengyel, C. Sex Influenced Association of Directly Measured Insulin Sensitivity and Serum Transaminase Levels: Why Alanine Aminotransferase Only Predicts Cardiovascular Risk in Men? Cardiovasc Diabetol 2015, 14. [CrossRef]
- Caballería, L.; Pera, G.; Auladell, M.A.; Torán, P.; Muñoz, L.; Miranda, D.; Alumà, A.; Casas, J.D.; Sánchez, C.; Gil, D.; et al. Prevalence and Factors Associated with the Presence of Nonalcoholic Fatty Liver Disease in an Adult Population in Spain. Eur J Gastroenterol Hepatol 2010, 22, 24–32. [CrossRef]
- Du, T.; Sun, X.; Yuan, G.; Zhou, X.; Lu, H.; Lin, X.; Yu, X. Sex Differences in the Impact of Nonalcoholic Fatty Liver Disease on Cardiovascular Risk Factors. Nutr Metab Cardiovasc Dis 2017, 27, 63–69. [CrossRef]
- Ballestri, S.; Nascimbeni, F.; Baldelli, E.; Marrazzo, A.; Romagnoli, D.; Lonardo, A. NAFLD as a Sexual Dimorphic Disease: Role of Gender and Reproductive Status in the Development and Progression of Nonalcoholic Fatty Liver Disease and Inherent Cardiovascular Risk. Adv Ther 2017, 34, 1291–1326. [CrossRef]
- Maranon, R.; Reckelhoff, J.F. Sex and Gender Differences in Control of Blood Pressure. Clin Sci (Lond) 2013, 125, 311–318. [CrossRef]
- Connelly, P.J.; Currie, G.; Delles, C. Sex Differences in the Prevalence, Outcomes and Management of Hypertension. Curr Hypertens Rep 2022, 24, 185-192. [CrossRef]
- Garaulet, M.; Pérez-Llamas, F.; Canteras, M.; Tebar, F.J.; Zamora, S. Endocrine, Metabolic and Nutritional Factors in Obesity and Their Relative Significance as Studied by Factor Analysis. Int J Obes Relat Metab Disord 2001, 25, 243-251. [CrossRef]
- Sweeney, J. P; Weihrauch, J. L. Summary of Available Data for Cholesterol in Foods and Methods for Its Determination. CRC Crit Rev Food Sci Nutr 1976, 8, 131-159. [CrossRef]
- Neuenschwander, M.; Stadelmaier, J.; Eble, J.; Grummich, K.; Szczerba, E.; Kiesswetter, E.; Schlesinger, S.; Schwingshackl, L. Substitution of Animal-Based with Plant-Based Foods on Cardiometabolic Health and All-Cause Mortality: A Systematic Review and Meta-Analysis of Prospective Studies. BMC Med 2023, 21. [CrossRef]
- Ferrari, L.; Panaite, S.-A.; Bertazzo, A.; Visioli, F. Animal- and Plant-Based Protein Sources: A Scoping Review of Human Health Outcomes and Environmental Impact. Nutrients 2022, 14, 5115. [CrossRef]
- Hertzler, S.R.; Lieblein-Boff, J.C.; Weiler, M.; Allgeier, C. Plant Proteins: Assessing Their Nutritional Quality and Effects on Health and Physical Function. Nutrients 2020, 12, 3704. [CrossRef]
- Amiot, M.J.; Riva, C.; Vinet, A. Effects of Dietary Polyphenols on Metabolic Syndrome Features in Humans: A Systematic Review. Obes Rev 2016, 17, 573–586. [CrossRef]
- Aloo, S.O.; Ofosu, F.K.; Kim, N.H.; Kilonzi, S.M.; Oh, D.H. Insights on Dietary Polyphenols as Agents against Metabolic Disorders: Obesity as a Target Disease. Antioxidants (Basel) 2023, 12, 416. [CrossRef]
- Sarriá, B.; Sierra-Cinos, J.L.; García-Diz, L.; Martínez-López, S.; Mateos, R.; Bravo-Clemente, L. Green/Roasted Coffee May Reduce Cardiovascular Risk in Hypercholesterolemic Subjects by Decreasing Body Weight, Abdominal Adiposity and Blood Pressure. Foods 2020, 9, 1191. [CrossRef]
- van de Woestijne, A.P.; Monajemi, H.; Kalkhoven, E.; Visseren, F.L.J. Adipose Tissue Dysfunction and Hypertriglyceridemia: Mechanisms and Management. Obes Rev 2011, 12, 829–840. [CrossRef]
- Gómez-Hernández, A.; Beneit, N.; Díaz-Castroverde, S.; Escribano, Ó. Differential Role of Adipose Tissues in Obesity and Related Metabolic and Vascular Complications. Int J Endocrinol 2016, 2016. [CrossRef]
- Zhou, W.; Shi, Y.; Li, YQ.; Ping, Z.; Wang, C.; Liu, X.; Lu, J.; Mao, Z.X.; Zhao, J.; Yin, L.; et al. Body Mass Index, Abdominal Fatness, and Hypertension Incidence: A Dose-Response Meta-Analysis of Prospective Studies. J Hum Hypertens 2018, 32, 321–333. [CrossRef]
- Sánchez-Tapia, M.; Tovar, A.R.; Torres, N. Diet as Regulator of Gut Microbiota and Its Role in Health and Disease. Arch Med Res 2019, 50, 259–268. [CrossRef]
- Garaulet, M.; Ordovás, J.M.; Madrid, J.A. The Chronobiology, Etiology and Pathophysiology of Obesity. Int J Obes (Lond) 2010, 34, 1667–1683. [CrossRef]
- Arble, D.M.; Bass, J.; Laposky, A.D.; Vitaterna, M.H.; Turek, F.W. Circadian Timing of Food Intake Contributes to Weight Gain. Obesity 2009, 17, 2100–2102. [CrossRef]
- Garaulet, M.; Corbalán, M.D.; Madrid, J.A.; Morales, E.; Baraza, J.C.; Lee, Y.C.; Ordovas, J.M. CLOCK Gene Is Implicated in Weight Reduction in Obese Patients Participating in a Dietary Programme Based on the Mediterranean Diet. Int J Obes (Lond) 2010, 34, 516–523. [CrossRef]
- Annesi, J.J. Coaction of Exercise and Eating Improvements Within a Behavioral Obesity Treatment: Directionality and Psychological Mechanisms. Res Q Exerc Sport 2023, 94, 826–838. [CrossRef]
- Elks, C.E.; Hoed, M. den; Zhao, J.H.; Sharp, S.J.; Wareham, N.J.; Loos, R.J.F.; Ong, K.K. Variability in the Heritability of Body Mass Index: A Systematic Review and Meta-Regression. Front Endocrinol (Lausanne) 2012, 3. [CrossRef]
Figure 1.
Flow chat of the recruitment process.
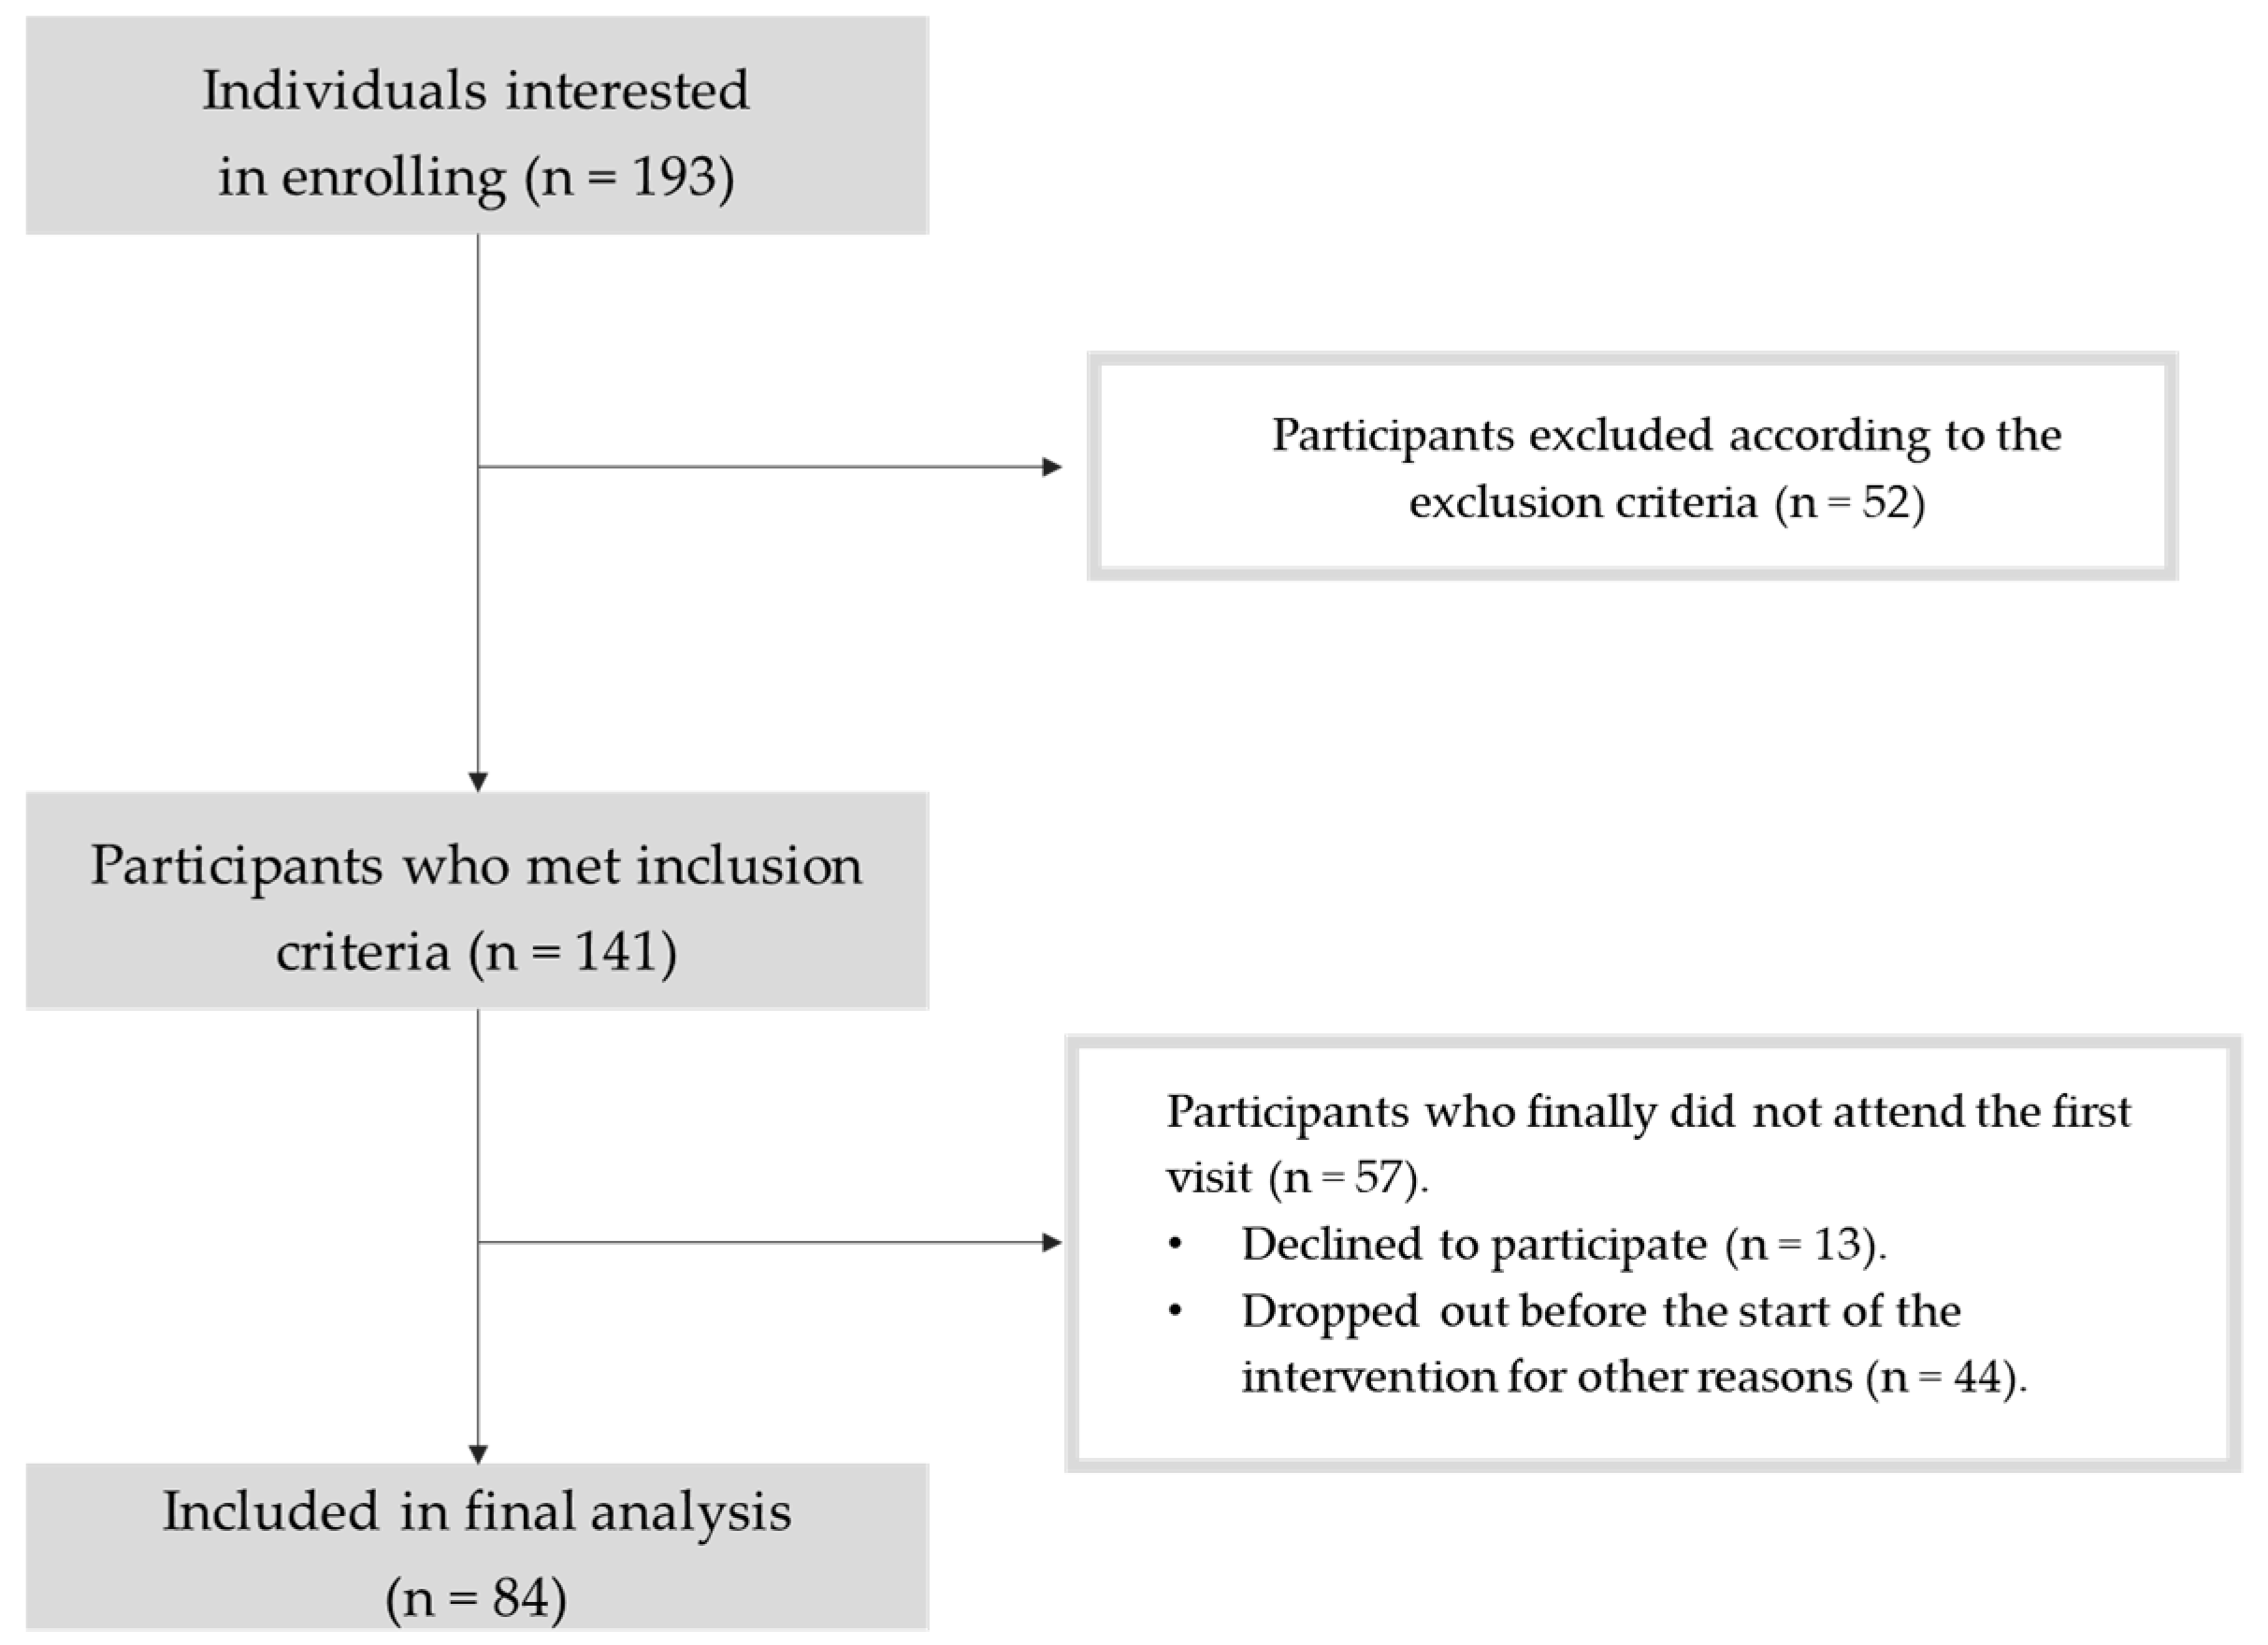

Table 1.
Sociodemographic characteristics of the study participants (based on self-reported questionnaires).
Table 1.
Sociodemographic characteristics of the study participants (based on self-reported questionnaires).
| Absolute frequency (n) | Relative frequency (%) | |
|---|---|---|
| Men | 35 | 41.7 |
| Women | 49 | 58.3 |
| European origin | 78 | 97.5 |
| Latin-American origin | 2 | 2.5 |
| Low educational level | 7 | 8.7 |
| Medium educational level | 14 | 17.5 |
| High educational level | 59 | 73.8 |
| Mean ± SD | Median (IQR) | |
| Monthly income per person (€) | 1358 ± 727 | 1167 (900) |
| Monthly income per family unit (€) | 3298 ± 1493 | 3000 (1900) |
| Age | 49.7 ± 9.9 | 51.0 (11.3) |
Low educational level: no education, primary or secondary education. Medium educational level: upper secondary education. High educational level: advanced vocational education or university degree. There are some missing data since some participants did not provide an answer to questions relative to education, income, or origin.
Table 2.
Daily edible food intake, energy intake, energy density, macronutrients, alcohol, dietary fibre and total (poly)phenols intake recorded in 3 dietary recalls of 24 h.
Table 2.
Daily edible food intake, energy intake, energy density, macronutrients, alcohol, dietary fibre and total (poly)phenols intake recorded in 3 dietary recalls of 24 h.
| Total (n = 81) | Men (n = 35) | Women (n = 46) |
P value |
||||
|---|---|---|---|---|---|---|---|
| Mean ± SD (%CV) |
Median (IQR) | Mean ± SD |
Median (IQR) | Mean ± SD |
Median (IQR) | ||
| Edible food intake (g) a | 2091 ± 572 (27.3 %) |
2038 (646) | 2103 ± 456 | 2053 (513) | 2082 ± 651 | 1967 (773) | 0.498 |
| Energy intake (kcal) | 2015 ± 521 (25.9 %) |
1960 (716) | 2095 ± 509 | 2062 (780) | 1953 ± 527 | 1907 (809) | 0.227 |
| Energy density (kcal/g)b | 1.00 ± 0.25 (24.8 %) |
1.00 (0.32) | 1.01 ± 0.20 | 1.00 (0.27) | 0.99 ± 0.28 | 0.99 (0.35) | 0.643 |
| Proteins (g) a | 88.9 ± 23.9 (26.9 %) |
88.8 (22.4) | 89.5 ± 24.3 | 88.8 (18.6) | 88.38 ± 23.8 | 87.2 (28.4) | 0.985 |
| Carbohydrates (g) | 186 ± 56 (30.1 %) |
179 (72) | 200.6 ± 57.6 | 183 (88.5) | 174.7 ± 52.6 | 177 (62.5) | 0.038* |
| Simple sugars (g) a | 75.8 ± 27.7 (36.6 %) |
70.8 (34.2) | 77.7 ± 28.0 | 73.1 (29.3) | 74.3 ± 27.8 | 68.1 (37.1) | 0.448 |
| Intrinsic sugars (g) | 47.9 ± 17.6 (36.8 %) |
48.3 (22.5) | 47.9 ± 17.7 | 48.2 (23.6) | 47.9 ± 17.8 | 48.3 (21.3) | 0.986 |
| Added sugars (g) a | 28.1 ± 18.8 (66.9 %) |
24.9 (20.3) | 30.3 ± 20.0 | 25.8 (20.1) | 26.5 ± 17.9 | 23.5 (21.2) | 0.381 |
| Lipids (g) a | 92.1 ± 29.9 (32.4 %) |
86.8 (42.5) | 92.6 ± 27.9 | 90.4 (46.4) | 91.7 ± 31.6 | 83.7 (44.1) | 0.706 |
| SFA (g) a | 28.6 ± 10.7 (37.5 %) |
24.6 (17.0) | 20.0 ± 11.1 | 25.3 (16.2) | 28.3 ± 10.5 | 24.3 (17.2) | 0.706 |
| MUFA (g) a | 40.5 ± 14.3 (35.3 %) |
37.5 (13.7) | 40.3 ± 12.9 | 37.3 (13.1) | 40.6 ± 15.4 | 38.7 (15.3) | 0.838 |
| PUFA (g) a | 12.3 ± 5.3 (43.2 %) |
11.2 (5.3) | 12.1 ± 4.3 | 11.2 (5.4) | 12.5 ± 6.0 | 11.3 (4.6) | 0.637 |
| 6 (g) a | 10.3 ± 4.9 (47.6 %) |
9.2 (5.0) | 10.1 ± 3.9 | 9.7 (5.5) | 10.4 ± 5.6 | 8.8 (4.9) | 0.520 |
| 3 (g)a | 1.9 ± 1.0 (50.6 %) |
1.5 (1.1) | 1.81 ± 1.01 | 1.40 (0.95) | 1.93 ± 0.91 | 1.80 (1.15) | 0.359 |
| 6/3 ratio a | 6.5 ± 3.8 (59.0 %) |
6.1 (4.5) | 6.91 ± 4.52 | 6.43 (3.98) | 6.13 ± 3.19 | 5.05 (4.67) | 0.564 |
| Total dietary cholesterol (mg) a | 339 ± 132 (39.0 %) |
317 (163) | 354 ± 142 | 317 (157) | 326 ± 123 | 319 (161) | 0.577 |
| Cholesterol (mg/1000kcal) a | 172.3 ± 68.5 (39.7 %) |
166.1 (80.6) | 173.8 (78.8) | 166.1 (69.1) | 171.1 ± 60.3 | 169.1 (90.5) | 0.659 |
| Alcohol (g) a | 6.7 ± 9.6 (143.9 %) |
2.9 (10.1) | 8.6 ± 12.3 | 4.1 (13.3) | 5.3 ± 6.8 | 2.8 (7.9) | 0.503 |
| Dietary fibre (g) a | 19.8 ± 8.1 (40.7 %) |
19.7 (10.5) | 20.5 ± 9.0 | 19.8 (11.8) | 19.2 ± 7.3 | 19.2 (8.4) | 0.501 |
| Dietary fibre (g / 1000 kcal) a | 10.0 ± 3.5 (34.7 %) |
9.7 (5.0) | 9.9 ± 4.2 | 9.2 (3.9) | 10.0 ± 2.8 | 10.1 (5.0) | 0.370 |
| Total (poly)phenols (mg)a | 1278 ± 809 (63.3 %) |
1073 (1017) | 1264 ± 731 | 1073 (688) | 1288 ± 871 | 1075 (1095) | 0.802 |
|
(Poly)phenols (mg/1000 kcal) a |
642 ± 371 (57.8 %) |
535 (426) | 620 ± 364 | 509 (412) | 658 ± 383 | 594 (437) | 0.659 |
Energy intake was expressed as kcal per day; macronutrients, dietary fibre, and alcohol intake was expressed as grams per day and cholesterol as mg per day. Dietary fibre and cholesterol intake were also expressed in grams or milligrams per 1000 kcal, calculated as follows: [(Dietary cholesterol (mg) or dietary fibre) (g)) / energy intake (kcal)] x 1000. Data are presented as mean ± standard deviation (SD), median and interquartile range (IQR) in parenthesis. The superscript a indicates data that does not follow a normal distribution when data is segmented, and b indicates heteroscedasticity between variance of men and women. Significant p-values were marked with one asterisk (*) for p < 0.05, two asterisks (**) for p < 0.01, or three asterisks (***) for p < 0.001. SFA: saturated fatty acids; MUFA: monounsaturated fatty acids; PUFA: polyunsaturated fatty acids; ω6: Omega 6 fatty acids; ω3: Omega 3 fatty acids.
Table 3.
Percentages of daily energy intake from macronutrients, alcohol and dietary fibre.
| Total (n = 81) | Men (n = 35) | Women (n = 46) |
P value |
||||
|---|---|---|---|---|---|---|---|
| Mean ± SD (%CV) |
Median (IQR) | Mean ± SD |
Median (IQR) | Mean ± SD |
Median (IQR) | ||
| % Carbohydrates | 36.9 ± 6.4 (17.4 %) |
37.1 (10.3) | 38.4 ± 6.6 | 39.6 (11.5) | 35.8 ± 6.1 | 36.5 (9.1) | 0.067 |
| % Simple sugars | 14.9 ± 4.1 (27.4 %) |
14.7 (4.9) | 15.1 ± 4.7 | 15.0 (5.7) | 14.8 ± 3.6 | 14.4 (4.4) | 0.792 |
| % Intrinsic sugars | 9.7 ± 3.4 (35.1 %) |
9.1 (4.9) | 9.3 ± 3.5 | 8.9 (5.1) | 10.0 ± 3.3 | 9.9 (5.6) | 0.352 |
| % Added sugars | 5.4 ± 3.1 (57.0 %) |
5.1 (4.2) | 5.6 ± 3.4 | 5.4 (4.4) | 5.2 ± 2.8 | 5.1 (4.1) | 0.541 |
| % Proteins | 17.9 ± 2.9 (16.3 %) |
17.8 (4.1) | 17.2 ± 2.8 | 16.8 (3.8) | 18.3 ± 2.9 | 18.5 (4.4) | 0.089 |
| % Lipids | 40.9 ± 6.0 (14.6 %) |
40.7 (9.7) | 39.5 ± 5.8 | 38.2 (8.5) | 41.9 ± 6.0 | 41.4 (8.0) | 0.072 |
| % SFA a | 12.6 ± 2.6 (20.7 %) |
12.4 (3.7) | 12.3 ± 3.1 | 12.0 (3.5) | 12.8 ± 2.2 | 13.1 (3.5) | 0.113 |
| % MUFA | 18.1 ± 3.8 (21.2 %) |
17.5 (4.5) | 17.2 ± 3.5 | 16.9 (4.0) | 18.7 ± 4.0 | 18.1 (4.3) | 0.096 |
| % PUFA a | 5.5 ± 1.8 (33.2 %) |
5.2 (2.2) | 5.3 ± 1.6 | 5.1 (2.6) | 5.7 ± 2.0 | 5.3 (1.9) | 0.396 |
| %3 a | 0.87 ± 0.50 (52.3 %) |
0.76 (0.59) | 0.79 ± 0.46 | 0.61 (0.44) | 0.92 ± 0.45 | 0.87 (0.55) | 0.088 |
| % α-Linolenic acid a | 0.5 ± 0.2 (42.3 %) |
0.44 (0.23) | 0.46 ± 0.21 | 0.40 (0.17) | 0.55 ± 0.22 | 0.49 (0.22) | 0.029* |
| %6 a | 4.6 ± 1.7 (37.0 %) |
4.1 (2.1) | 4.4 ± 1.5 | 4.3 (2.3) | 4.7 ± 1.9 | 4.1 (1.9) | 0.652 |
| % Linoleic acid a | 4.5 ± 1.7 (37.5 %) |
4.1 (2.1) | 4.3 ± 1.5 | 4.1 (2.2) | 4.6 ± 1.8 | 4.0 (1.8) | 0.744 |
| % Trans FA | 0.38 ± 0.19 (49.3 %) |
0.38 (0.27) | 0.38 ± 0.17 | 0.36 (0.23) | 0.39 ± 0.21 | 0.41 (0.29) | 0.871 |
| % Alcohol a | 2.3 ± 3.3 (145.5 %) |
1.0 (3.2) | 2.8 ± 4.0 | 1.2 (4.3) | 1.9 ± 2.7 | 1.0 (2.5) | 0.565 |
| % Dietary fibre a | 2.0 ± 0.7 (34.7%) |
1.9 (1.0) | 2.0 ± 0.8 | 1.8 (0.8) | 2.0 ± 0.6 | 2.0 (1.0) | 0.370 |
Results are expressed as the percentage of total energy intake from macronutrients, alcohol and dietary fibre, considering that protein and carbohydrates provide 4 kcal per gram, lipids 9 kcal per gram, alcohol 7 kcal per gram, and dietary fibre 2 kcal per gram. Data are presented as mean ± standard deviation (SD), median and interquartile range (IQR) in parenthesis. The superscript a indicates data that does not follow a normal distribution when data is segmented by sex. Significant p-values were marked with one asterisk (*) for p < 0.05, two asterisks (**) for p < 0.01, or three asterisks (***) for p < 0.001. FA: fatty acids; SFA: saturated fatty acids; MUFA: monounsaturated fatty acids; PUFA: polyunsaturated fatty acids; ω6: Omega 6 fatty acids; ω3: Omega 3 fatty acids.
Table 4.
Serum lipid profile, glucose metabolism measurements, hepatic enzymes, CRP and blood pressure.
Table 4.
Serum lipid profile, glucose metabolism measurements, hepatic enzymes, CRP and blood pressure.
| Total (n = 83) |
Men (n = 35) |
Women (n = 48) |
|||||
|---|---|---|---|---|---|---|---|
| Mean ± SD (%CV) |
Median (IQR) |
Mean ± SD |
Median (IQR) | Mean ± SD |
Median (IQR) | P value | |
| TC (mg/dL) | 211.0 ± 31.1 (14.7 %) |
214 (42.5) | 204.1 ± 31.7 | 205 (36.5) | 216.0 ± 30.2 | 223 (46.8) | 0.085 |
| TG (mg/dL) a | 127.7 ± 68.1 (53.3 %) |
111 (52) | 144.8 ± 80.6 | 121 (61.5) | 115.3 ± 55.0 | 104.5 (50) | 0.091 |
| HDL (mg/dL) a | 61.6 ± 17.0 (27.6 %) |
56 (26) | 54.3 ± 16.1 | 51 (14) | 66.9 ± 15.8 | 68 (23.3) | <0.001*** |
| LDL (mg/dL) | 124.0 ± 25.0 (20.2 %) |
126.8 (36.6) | 120.9 ± 25.6 | 120.6 (36.5) | 126.2 ± 24.6 | 128.6 (36.9) | 0.337 |
| VLDL (mg/dL) a | 25.5 ± 13.6 (53.2 %) |
22.0 (10.3) | 28.9 ± 16.1 | 24.0 (12.0) | 23.0 ± 10.9 | 21.0 (10.3) | 0.094 |
| HbA1c (%) | 5.75 ± 0.35 (6.1 %) |
5.70 (0.40) | 5.71 ± 0.32 | 5.70 (0.35) | 5.77 ± 0.37 | 5.80 (0.40) | 0.504 |
| FBG (mg/dL) | 93.1 ± 11.3 (12.2 %) |
92 (12.5) | 92.3 ± 12.0 | 91 (11.5) | 93.7 ± 11.0 | 93 (13.3) | 0.586 |
| Insulin (µUI/mL) a | 10.5 ± 5.7 (54.2 %) |
9.2 (6.6) | 11.1 ± 5.7 | 10.5 (5.1) | 10.0 ± 5.7 | 8.0 (7.0) | 0.173 |
| HOMA-IR a | 2.41 ± 1.32 (54.5 %) |
1.98 (1.66) | 2.51 ± 1.22 | 2.41 (1.22) | 2.34 ± 1.39 | 1.84 (2.05) | 0.243 |
| HOMA-β a | 146 ± 123 (84.2 %) |
111 (97) | 153 ± 127 | 119 (123) | 141 ± 121 | 98 (83) | 0.437 |
| QUICKI a | 0.343 ± 0.027 (7.8 %) |
0.344 (0.040) | 0.340 ± 0.027 | 0.335 (0.026) | 0.345 ± 0.026 | 0.348 (0.047) | 0.233 |
| AST (UI/L) a | 24.8 ± 12.0 (48.4 %) |
22.0 (8.0) | 27.6 ± 14.5 | 24.0 (9.3) | 22.9 ± 9.5 | 21.0 (5.5) | 0.014* |
| ALT (UI/L) a | 30.1 ± 18.9 (62.9 %) |
24.0 (16.0) | 34.6 ± 18.5 | 30.0 (20.0) | 26.8 ± 18.8 | 21.0 (10.0) | 0.006** |
| hsCRP (mg/dL) a | 0.345 ± 0.562 (162.8 %) |
0.153 (0.301) | 0.350 ± 0.662 | 0.158 (0.248) | 0.341 ± 0.484 | 0.151 (0.440) | 0.843 |
| Blood pressure | |||||||
| SBP (mmHg) a | 126.2 ± 18.6 (14.7 %) |
124.7 (25.1) | 130.5 ± 14.2 | 130.7 (18.7) | 123.2 ± 20.8 | 121.3 (25.0) | 0.01* |
| DBP (mmHg) a | 84.8 ± 10.9 (12.8 %) |
82.0 (14.8) | 86.9 ± 11.1 | 87.3 (18.6) | 83.3 ± 10.6 | 80.7 (12.7) | 0.110 |
Data are presented as mean ± standard deviation (SD), median and interquartile range (IQR) in parenthesis. The superscript a indicates data that does not follow a normal distribution when data is segmented by sex. Significative p-values were marked with one asterisk (*) for p < 0.05, two asterisks (**) for p < 0.01, or three asterisks (***) for p < 0.001. TC: total cholesterol; TG: triglycerides; HDL: high density lipoprotein; LDL: low density lipoprotein; VLDL: very low-density lipoprotein. HbA1c: glycated haemoglobin; FBG: fasting blood glucose; HOMA-IR: Homeostasis Model Assessment of insulin resistance; HOMA-β: Homeostasis Model Assessment of β-cell function; QUICKI: Quantitative Insulin Sensitivity Check Index. AST: aspartate aminotransferase; ALT: alanine aminotransferase; hsCRP: High-sensitive C-reactive protein. SBP: systolic blood pressure; DBP: diastolic blood pressure.
Table 5.
Anthropometric and body composition measurements.
| Total (n = 84) | Men (n = 35) | Women (n = 49) | |||||
|---|---|---|---|---|---|---|---|
| Mean ± SD (%CV) |
Median (IQR) |
Mean ± SD |
Median (IQR) | Mean ± SD |
Median (IQR) | P value | |
| Height (cm) | 165.4 ± 8.1 (4.9 %) |
163.6 (13) | 172.1 ± 6.7 | 173.3 (7.2) | 160.7 ± 5.0 | 160.1 (5.6) | <0.001*** |
| Weight (kg) b | 83.6 ± 11.1 (13.2 %) |
83.6 (12.0) | 91.2 ± 10.9 | 87.3 (14.9) | 78.1 ± 7.4 | 77.6 (10.2) | <0.001*** |
| BMI (kg/m2) | 30.5 ± 2.9 (9.6 %) |
30.4 (3.5) | 30.8 ± 2.8 | 30.8 (3.3) | 30.3 ± 3.0 | 30.1 (4.6) | 0.471 |
| WC (cm) | 96.0 ± 11.5 (11.9 %) |
94.7 (15.4) | 102.2 ± 11.1 | 103.9 (15.1) | 91.5 ± 9.5 | 91.6 (10.8) | <0.001*** |
| HC (cm) a | 108.5 ± 6.8 (6.3 %) |
106.8 (10.4) | 105.9 ± 6.1 | 104.5 (6.2) | 110.5 ± 6.6 | 110.2 (10) | <0.001*** |
| WC/HC b | 0.89 ± 0.11 (12.8 %) |
0.88 (0.15) | 0.97 ± 0.11 | 0.96 (0.16) | 0.83 ± 0.08 | 0.85 (0.12) | <0.001*** |
| WC / Height | 0.58 ± 0.07 (11.3 %) |
0.58 (0.09) | 0.59 ± 0.06 | 0.60 (0.10) | 0.57 ± 0.07 | 0.57 (0.08) | 0.107 |
| SUMM 6 FOLDS a | 153.6 (33.0) (21.5 %) |
162.1 (46.5) | 131.7 ± 30.1 | 130.0 (36.8) | 169.3 ± 25.3 | 170.2 (24.6) | <0.001*** |
| Body composition measured by bioimpedance | |||||||
| Fat weight (kg) | 30.2 ± 7.3 (24.0 %) |
29.8 (9.7) | 28.4 ± 7.6 | 27.3 (9.9) | 31.5 ± 6.8 | 31.3 (9.1) | 0.053 |
| % Body fat | 36.2 ± 7.8 (21.5 %) |
35.6 (11.8) | 30.8 ± 6.5 | 30.5 (7.8) | 40.1 ± 6.2 | 39.7 (9.1) | <0.001*** |
| VFA (cm2) a | 141.9 ± 43.6 (30.7 %) |
137.6 (70.7) | 125.9 ± 40.8 | 115.4 (53.2) | 153.3 ± 42.2 | 155.9 (56.2) | 0.003 ** |
| SMM (kg) b | 29.9 ± 6.4 (21.5 %) |
27.7 (9.3) | 35.9 ± 5.2 | 36.0 (5.2) | 25.7 ± 2.9 | 25.8 (2.8) | <0.001*** |
| % Muscle mass | 35.7 ± 5.1 (14.3 %) |
35.8 (7.0) | 39.4 ± 4.5 | 39.2 (4.7) | 33.1 ± 3.6 | 33.0 (5.1) | <0.001*** |
| SMI (kg/m2) b | 7.94 ± 0.95 (12.0 %) |
7.70 (1.40) | 8.79 ± 0.74 | 8.60 (0.95) | 7.33 ± 0.51 | 7.30 (0.70) | <0.001*** |
Data are presented as mean ± standard deviation (SD), median and interquartile range (IQR) in parenthesis. Superscript a indicates data that does not follow a normal distribution when data is segmented, letter b indicates heteroscedasticity between variance of men and women. Significant p-values were marked with one asterisk (*) for p < 0.05, two asterisks (**) for p < 0.01, or three asterisks (***) for p < 0.001. BMI: body mass index; WC: waist circumference; HC: hip circumference; SUMM 6 FOLDS: summation of 6 skinfolds (tricipital, bicipital, subscapular, suprailiac, mid-thigh and calf); VFA: visceral fat area; SMM: skeletal muscle mass; SMI: skeletal muscle index.
Table 6.
RMR and physical activity measurements.
| Total | Men | Women | |||||
|---|---|---|---|---|---|---|---|
| Mean ± SD (%CV) |
Median (IQR) |
Mean ± SD |
Median (IQR) | Mean ± SD |
Median (IQR) | P value | |
|
RMR (kcal/day) (n = 56) |
1778 ± 310 (17.4 %) |
1712 (472) | 2038 ± 240 | 2077 (364) | 1596 ± 206 | 1577 (233) | <0.001*** |
|
TEE (n = 50) |
2427 ± 453 (18.7 %) |
2372 (507) | 2723 ± 419 | 2628 (325) | 2194 ± 329 | 2175 (278) | <0.001*** |
|
Average PAE (kcal/day) a (n = 60) |
463 ± 185 (39.9 %) |
447(169.1) | 483.6 ± 216.4 | 443.5 (190.7) | 447.4 ± 158.2 | 454.1 (140.6) | 0.662 |
|
METs a (n = 60) |
1.14 ± 0.09 (7.6 %) |
1.12 (0.09) | 1.14 ± 0.10 | 1.12 (0.10) | 1.13 ± 0.08 | 1.12 (0.08) | 0.676 |
|
Steps per day a (n = 60) |
7961 ± 3149 (42.0 %) |
7281 (3445) | 7521 ± 3829 | 6866 (2048) | 8297 ± 2521 | 8193 (3353) | 0.048* |
|
PAL (n = 50) |
1.36 ± 0.10 (7.0 %) |
1.36 (0.11) | 1.34 ± 0.10 | 1.33 (0.12) | 1.38 ± 0.09 | 1.37 (0.09) | 0.084 |
Data are presented as mean ± standard deviation (SD), median and interquartile range (IQR) in parenthesis. The letter a indicates data that does not follow a normal distribution when data is segmented by sex. Significant p-values were marked with one asterisk (*) for p < 0.05, two asterisks (**) for p < 0.01, or three asterisks (***) for p < 0.001. RMR: resting metabolic rate; TEE: total energy expenditure; Average PAE: physical activity expenditure; MET: metabolic equivalent of task. 1 MET = 3.5 millilitres of oxygen per kilogram of body weight per minute (mL/kg/min). PAL: physical activity level.
Table 7.
Component rotated array from PCA of the diet, eigenvalues, and percentage of total variance from each factor.
Table 7.
Component rotated array from PCA of the diet, eigenvalues, and percentage of total variance from each factor.
| Components | |||
|---|---|---|---|
| 1 | 2 | 3 | |
| Proteins a | 0.859 | ||
| Lipids | 0.832 | ||
| MUFA a | 0.821 | ||
| Energy intake | 0.761 | 0.515 | |
| Dietary cholesterol | 0.752 | ||
| SFA a | 0.731 | 0.552 | |
| PUFA a | 0.627 | ||
| Total (poly)phenol intake a | 0.883 | ||
| Dietary fibre | 0.814 | ||
| Intrinsic sugars | 0.755 | ||
| Added sugars a | 0.893 | ||
| Carbohydrates | 0.727 | ||
| Eigenvalues | 6.125 | 1.618 | 1.258 |
| Percentage of total variance | 51.040 | 13.483 | 10.487 |
Extraction method: principal component analysis. Rotation method: Varimax with Kaiser normalization. The rotation has converged in 3 iterations. Superscript a indicated variables that were transformed using natural logarithms (Ln) to achieve a normal distribution before introducing them into the PCA. Loadings under 0.5 were not registered.
Table 8.
Component rotated array from PCA of anthropometric, body composition and biochemical measurements, eigenvalues, and percentage of total variance from each factor.
Table 8.
Component rotated array from PCA of anthropometric, body composition and biochemical measurements, eigenvalues, and percentage of total variance from each factor.
| Components | ||||
|---|---|---|---|---|
| 1 | 2 | 3 | 4 | |
| % Body fat | 0.975 | |||
| % Muscle mass | -0.944 | |||
| Visceral fat area | 0.934 | |||
| SUMM 6 skinfolds a | 0.803 | |||
| BMI | 0.639 | 0.503 | ||
| TG a | 0.934 | |||
| VLDL a | 0.933 | |||
| HDL a | -0.808 | |||
| HOMA-IR a | 0.665 | |||
| DBP a | 0.918 | |||
| SBP | 0.905 | |||
| Waist/hip ratio | 0.551 | 0.565 | ||
| Total cholesterol | 0.986 | |||
| LDL | 0.921 | |||
| Eigenvalues | 4.268 | 3.717 | 2.260 | 1.357 |
| Percentage of total variance | 30.487 | 26.552 | 16.143 | 9.695 |
Extraction method: principal component analysis. Rotation method: Varimax with Kaiser normalization. The rotation has converged in 5 iterations. Letter a indicated variables that were transformed using natural logarithms (Ln) in order to achieve a normal distribution before introducing them into the PCA. Loadings under 0.5 were not registered.
Table 9.
Component rotated array from PCA of diet, anthropometric, body composition and biochemical measurements, eigenvalues, and percentage of total variance from each factor.
Table 9.
Component rotated array from PCA of diet, anthropometric, body composition and biochemical measurements, eigenvalues, and percentage of total variance from each factor.
| Components | |||||||
|---|---|---|---|---|---|---|---|
| 1 | 2 | 3 | 4 | 5 | 6 | 7 | |
| Lipids | 0.942 | ||||||
| MUFA a | 0.875 | ||||||
| SFA a | 0.841 | ||||||
| Energy intake | 0.837 | ||||||
| Proteins a | 0.788 | ||||||
| PUFA a | 0.757 | ||||||
| Dietary cholesterol | 0.594 | ||||||
| % Body fat | 0.967 | ||||||
| % Muscle mass | -0.935 | ||||||
| Visceral fat area | 0.924 | ||||||
| SUMM 6 skinfolds a | 0.786 | ||||||
| BMI | 0.642 | 0.553 | |||||
| TG a | 0.884 | ||||||
| VLDL a | 0.882 | ||||||
| HDL a | -0.824 | ||||||
| HOMA-IR a | 0.674 | ||||||
| Waist/hip ratio | 0.626 | 0.534 | |||||
| CT | 0.931 | ||||||
| LDL | 0.922 | ||||||
| SBP | 0.897 | ||||||
| DBP a | 0.885 | ||||||
| Intrinsic sugars | 0.828 | ||||||
| Total (poly)phenol intake a | 0.824 | ||||||
| Dietary fibre a | 0.681 | ||||||
| Carbohydrates | 0.740 | ||||||
| Added sugars a | 0.717 | ||||||
| Eigenvalues | 6.736 | 4.394 | 3.431 | 2.439 | 1.700 | 1.310 | 1.172 |
| Percentage of total variance | 25.908 | 16.902 | 13.195 | 9.379 | 6.540 | 5.040 | 4.508 |
Extraction method: principal component analysis. Rotation method: Varimax with Kaiser normalization. The rotation has converged in 7 iterations. Letter a indicated variables that were transformed using natural logarithms (Ln) in order to achieve a normal distribution before introducing them into the PCA. Loadings under 0.5 were not registered.
Disclaimer/Publisher’s Note: The statements, opinions and data contained in all publications are solely those of the individual author(s) and contributor(s) and not of MDPI and/or the editor(s). MDPI and/or the editor(s) disclaim responsibility for any injury to people or property resulting from any ideas, methods, instructions or products referred to in the content. |
© 2024 by the authors. Licensee MDPI, Basel, Switzerland. This article is an open access article distributed under the terms and conditions of the Creative Commons Attribution (CC BY) license (http://creativecommons.org/licenses/by/4.0/).
Copyright: This open access article is published under a Creative Commons CC BY 4.0 license, which permit the free download, distribution, and reuse, provided that the author and preprint are cited in any reuse.


