Submitted:
16 September 2025
Posted:
17 September 2025
You are already at the latest version
Abstract
The Wide-swath Thermal Infrared Remote Sensor (WTI) is the primary payload on Chinese Gaofen-5A(GF-5A) satellite. WTI is a cross-track infrared scanner developed by the Beijing Institute of Space Mechanics & Electricity(BISME). It uses the measurements of high temperature blackbody(HTBB) and low temperature blackbody (LTBB) as the on-orbit radiometric calibration reference sources allowing to update the calibration coefficients on a scan-by-scan basis. There is scan-angle effect, different calibration coefficients for different scan angles, for WTI. The method to get the angle-dependent calibration coefficients based on HTBB and LTBB calibration data is presented in this paper. The scan angle correction coefficients (SACs) are applied to account for the scan-angle effect. The SACs are calculated based on cross-calibration which utilize the Advanced Geostationary Radiation Imager(AGRI) aboard on FY-4B as reference. The calibration site data with the infrared ground temperature automatic measurement equipment and the atmospheric data from ERA5 are utilized to evaluate the absolute calibration accuracy. The root mean square error(RMSE) of WTI are as follows: 0.82K for 8.2μm, 0.74K for 8.6μm, 0.75K for 10.8μm, 0.85K for 12.0μm. To assess on-orbit radiometric performances of WTI, the key parameters including temperature stability, Noise Equivalent Temperature Difference (NETD) and System Radiation Stability(SRS) are calculated. Since the launch of GF-5A in December 2022, the radiometric performances have been monitored based on routine measurements of the onboard calibration data. There are only 0.4mK, 7mK and 8mK temperature fluctuation respectively for IRFPA , LTBB and HTBB for a single imaging time about 1200 sconds. The fluctuations of NETD and SRS are less than 1% and 0.002% respectively. The results indicate that there are no significant attenuation in WTI on-orbit radiometric performance during the first two years following its launch.
Keywords:
GF-5A satellite
; WTI
; on-orbit calibration
; radiometric performance
1. Introduction
The thermal emissive bands(TEBs) remote sensing data serve as a critical indicator in surface temperature inversion. TEBs can delineate the characterization about emitted radiation information from the Earth’s surface[1]. To obtain high quality surface temperature products, accurate on-orbit radiometric calibration of the infrared remote sensor is required[2]. Some infrared remote sensors imaging by cross-track scanning, such as the Advanced Very High Resolution Radiometer (AVHRR), the Moderate Resolution Imaging Spectroradiometer (MODIS) and the Visible Infrared Imaging Radiometer Suite (VIIRS) use the onboard blackbody(BB) and the the deep space as the on-orbit radiometric reference sources to calculate the radiometric calibration coefficients on a scan-by-scan basis [3]. For the AVHRR TEBs, the onboard blackbody and deep space are used to get a linear radiometric calibration coefficients and the constant nonlinear coefficients are applied to linear radiance for further correction [4,5,6]. A quadratic algorithm is used for the MODIS and VIIRS TEBs on-orbit calibration. To overcome the defect of variant reflectivity at different scan-angle for thermal radiation on MODIS paddle-wheel mirror and VIIRS half angle mirror, considerable work has been done to derive the response versus scan angle (RVS) to address the effect on the TEBs calibration. [7,8,9,10]. The consistency of MODIS and VIIRS TEBs was generally less than 0.2K. The on-orbit performance of on-board BB, detector, and noise characterization were quite stable [11,12,13,14].
WTI was launched on December 9, 2022 onboard GF-5A Satellite which was also known as the Hyperspectral Comprehensive Observation Satellite[15]. The GF-5A Satellite is the follow-on mission to GF-5 Satellite. The GF-5A Satellite is operated in a sun-synchronous orbit at a nominal altitude of 705km with an equatorial crossing time of 13:30. WTI , which features a short-focus, low F-number, and high aspect ratio refractive lens, is characterized by its high-performance capabilities. WTI, like AVHRR, MODIS and VIIRS , is a cross-track scanner and uses the measurements of an onboard BB as the on-orbit radiometric reference sources allowing to update the calibration coefficients on a scan-by-scan basis. Observations are made over a scan angle range of ±46.25° with a swath width of up to 1500km and a spatial resolution of 100m at nadir.
WTI collects data in 4 spectral bands with long-wave infrared. The focal plane of WTI consists of four Infrared detector arrays each containing 1024 by 3 detector elements. Spectral interference filters are placed on each array to produce four spectral channels when combined with the detector spectral response. One of the filters produces a band sensitive between roughly 8 and 8.4µm,the other filter produces a band between 8.5 and 8.9µm, the third filter produces a band between 10.3 and 11.3µm, the last filter produces a band between 11.5 and 12.5µm. The 4 TEBs make both daytime and nighttime measurements of the earth view thermal emissions. The specifications of the WTI TEBs are given in Table 1. WTI wroks at different imaging parameters during daytime and nighttime to get better radiometric performance.which are given in Table 2. The single imaging time for WTI is generally limited to a maximum of 25 minutes. However, in special cases, continuous imaging may be conducted for one day or even longer durations. Compared with the visible and infrared multispectral sensor(VIMS) equipped on GF-5 satellite, WTI demonstrates significant improvements in the width, revisiting cycle and NEDT.
To ensure high quality calibration of TEBs, WTI is equipped with two onboard V-groove blackbodies as the principal reference sources. The blackbodies are large and uniform enough to achieve full-aperture calibration. One of the blackbodies is controlled at a higher temperature hereafter referred to as high temperature blackbody (HTBB), the other one is controlled at lower temperature hereafter referred to as low temperature blackbody(LTBB). The HTBB assembly constitutes of V-groove blackbody(BB), two platinum resistors and heater elements. One of the platinum resistors is used to monitor the temperature and the other one is used to verify the temperature. When the HTBB is heated to its operational temperature, the heater elements are then controlled to maintain it. The LTBB assembly constitutes not only of the same components as HTBB assembly, but also of a heat dissipation surface and heat pipe. Figure 1 illustrates the viewing angle of the HTBB, the LTBB and the Earth. The WTI scan direction is counter-clockwise and it views the LTBB, HTBB in sequence and the range of the earth view is from -46.25° to 46.25°. As the calibration sources are viewed at different scan angles, the thermal radiation is attenuated varying with scan angle before reaching on the Infrared Focal Plane Array(IRFPA). Therefore, the scan angle correction coefficients (SACs) are applied to account for the scan-angle effect on the calibration of the WTI. After the launch of the satellite, the on-orbit SACs are derived using cross calibration of AGRI onboard FY-4B.
WTI was heated for decontamination for about one month after its launch from December 2022 to January 2023. During this period, WTI was remained powered off. From January 2023 to February 2023, WTI was in the adjustment state. Imaging parameters including the integration time and gain, the HTBB and LTBB temperatures were adjusted to achieve the optimal imaging performance. Up to now, the GF-5A satellite has worked for about two years and it has provided a substantial volume of image products which support various studies including dust monitoring, sea surface temperature assessment, and thermal discharge monitoring from nuclear power plants in China.
This paper focuses on GF-5A WTI on-orbit radiometric performance. It provides a brief overview of the TEBs calibration and characterization methodologies which use the onboard HTBB and LTBB data. The performance of the HTBB and the LTBB, and the results of the detector noise characterization, short-term stability, and long-term response performance will be covered in this paper. Other topics briefly discussed in this paper include the on-orbit SACs of WTI.
2. Materials and Methods
This chapter gives a description of the method to obtain angle-dependent calibration coefficients and the on-orbit radiometric performances. To ensure the high-quality radiance product, HTBB and LTBB are utilized as the on-orbit calibration source and the BB’s temperatures are measured by the platinum resistors. The radiances of HTBB and LTBB, together with the corresponding detector-averaged DN values, constitute the reference inputs for a linear algorithm. The gain and offset on a scan-by-scan basis are calculated and updated. Due to the scan-angle effect, the SACs are then applied to the gain and offset to generate calibration coefficients at different scan angles. To establish baselines for future assessment, the radiometric performances of key parameters including temperature stability, Noise Equivalent Temperature Difference(NETD) and System Radiation Stability(SRS) are presented.
2.1. Data
2.1.1. WTI
The GF-5A WTI products are processed and delivered by the China Centre for Resources Data and Application. The WTI Level-2 (L2) products are geolocated data in Tiff format which contains digital number (DN) values of Earth observation, the imaging time and the calibration coefficients. The on-board calibration data are got in raw format which containing DN values of the HTBB and LTBB, the platinum resistor DN values of the HTBB and LTBB, and the temperature of the IRFPA.
2.1.2. AGRI
AGRI aboard on FY-4A/FY-4B has 15 spectral bands covering 0.47μm to 13.3μm with a nadir spatial resolution of 4 km for TEBs bands. It was demonstrated that AGRI has high accuracy and stability. High-frequency infrared calibrations are performed utilizing the on-board calibration system to ensure the precision of the products. The accuracy of this onboard calibration exceeds 0.5K[16,17].
The FY-4A/FY-4B AGRI products are processed and delivered by the National Satellite Meteorologicsl Center. The FY-4A/FY-4B AGRI Level-1(L1) products are provided in HDF format. Each L1_SDR HDF file contains digital number (DN) values of Earth observation, calibration coefficients, and so on. Each L1_GEO_SDR HDF file contains the nominal satellite azimuth angle, the nominal satellite zenith angles for each Line Number and Column Number, and others.
2.1.3. ERA5
The fifth generation ECMWF Atmospheric Reanalysis of the Global Climate data(ERA5) are introduced to assess the accuracy of the on-board calibration model. ERA5, the latest generation of reanalysis datasets from the European Centre for Medium-Range Weather Forecasts (ECMWF), is generated using a four-dimensional variational data assimilation model in conjunction with the Integrated Forecasting System (IFS) to predict various climate variables pertaining to the atmosphere, land, and ocean. In comparison to its predecessor, ERA-Interim, ERA5 has significantly broadened its sources of observational data. It primarily relies on satellite observations while also integrating conventional data sources such as meteorological stations, aircraft, ships, buoys, and radiosondes.
The atmospheric profile data from ERA5 are used in this paper to get the calibration accuracy. ERA5 offers atmospheric profile data across 37 vertical layers ranging from 1000 hPa to 1 hPa. The data includes key parameters such as water vapor content, temperature, wind speed, cloud cover, among others. The ERA5 data is presented in a grid format, organized according to longitude and latitude along the horizontal axis, with a corresponding spatial resolution of 0.25°[18].
2.1.4. Site Data
The calibration site with the infrared ground temperature automatic measurement equipment(IGTAME) shown in Figure 2 is used here to evaluate the absolute calibration accuracy. IGTAME could continuously and automatically acquire the site’s surface temperature. It is powered by solar energy, so it is able to continuously measure and store the temperature data in the absence of external power supply. It can operate in the site environment for a extended period, and it is equipped with rain-proof, sand-proof, dust-proof functions. It can transmit the temperature data to the Beidou-3 satellite at 5-minute intervals, and the data will then be relayed back to users via the Internet through the Beidou-3 data center. For this study, the calibration site data from three calibration sites: Golmud Site in Qinghai Province, China (36°35'52.3"N, 93°51'28.2"E, elevation: 2754 meters); Dachaidan Site in Qinghai Province, China (38°41'53.1"N, 94°27'49.6"E, elevation: 2906 meters); and Dunhuang Site in Gansu Province, China (40°09'20.7"N, 94°19'12.9"E, elevation: 1131 meters) are used. These surface temperature data are got in the TXT format which contains the surface temperature, the temperature measurement time, and so on.
2.2. On-Orbit Calibration
WTI gets the earth surface temperature in a scan angle range from -46.25° to 46.25°. At a given scan angle, the earth-view radiance in a granule can be expressed by:
where, θ is the scan angle. is the earth-view digital number. The and are the angle-dependent calibration coefficients, is the derived earth-view radiance.
The radiances of HTBB and LTBB, together with the corresponding detector averaged DN values are used to calculate the gain and offset coefficients of the onboard calibration BB by a linear algorithm:
Where, and are the equivalent radiance value calculated based on the HTBB and LTBB respectively[W/m²·Sr·μm]; and are the mean DN values of the HTBB and LTBB data respectively[unitless]; is the blackbody emissivity[unitless];
The scan-angle correction factors are defined as and , which is expressed as follows:
Then the relationship between and is build as Equation (6). Then, the radiance at the on-board calibration BB is corrected to obtain the earth-view radiance at different angles.
The coefficients and are then corrected by and to obtain angle-dependent on-orbit calibration coefficients and for the Earth-view data :
2.3. SACs On-Orbit Derivation
The WTI utilizes the rotating telescope to get earth surface temperature in a scan angle range of -46.25° to 46.25°. There is scan-angle effect for WTI. The calibration coefficients of different scan angles are different. If the scan-angle effect is addressed incorrectly, the residual can introduce significant inaccuracies in both the radiance products and, ultimately, the LST products.
In equations (2) (3), the gain and offset are able to be calculated on a scan-by-scan basis using on-board calibration data. The on-orbit SACs accounting for scan-angle effect can be derived after calculating the angle-dependent calibration coefficients and . A practical approach for WTI to calculate on-orbit and is the cross-calibration which utilize the AGRI as reference. The earth-view observation data of AGRI are matched with WTI in a spatial window of 4 km and a temporal window of 10 minutes from March 2024 to August 2024 in homogenous scenes. The Top of Atmosphere(TOA) radiance matchups between AGRI and WTI are divided into 1° bins, then the calibration coefficients and can be got based on the matchups. This approach enables derivation of calibration coefficients with adequate statistical number while properly accounting for scan-angle effects.
Given that the accuracy of calibration coefficients directly determine the accuracy of SACs and consequently the ultimate accuracy of absolute calibration, and the outliners can have significant impact on the derivation of the calibration coefficients in each angle bins, for the most stringent fitting, the 3 robust standard deviation exclusion method is applied, i.e., the matchups whose absolute bias between the true value and the fitted value exceeds three times the RSD of the bias are excluded. Besides, the corresponding gains and offsets where the matchups located are calculated and averaged in each granule. The scan angle correction coefficients and are then calculated by equations (4) and (5), which are also in 1° interval. Then and are fitted to a sixth-order polynomial by least squares regression to ensure the image continuity and reduce the residual:
where, to and to are coefficients obtained by the regression and is scan angle.
2.4. On-Orbit Performances
The on-board calibration system is the preferred method to monitor the radiation performance for infrared remote sensors. High-frequency monitoring of radiation performance can be achieved through the on-board calibration data. The on-orbit working temperatures of the HTBB and LTBB are approximately 298K and 273K respectively, and the temperatures are adjustable. The temperatures of the Infrared Focal Plane Array(IRFPA), HTBB and LTBB are the most critical indicator parameters. The temperature of IRFPA is prerequisite for ensuring the response reliability, and the temperatures of HTBB and LTBB serve as the primary calibration sources. The calibration accuracy will be affected by the fluctuations in temperature. Additionally, the NEDTs of the four bands are other key parameters, reflecting the instrument's response sensitivity and detection capability. Finally, the system radiation stabilities(SRS) of the four bands are also the key parameters, as they are the basic for on-orbit calibration.
2.4.1. Temperature Stability
IRFPA works at lower temperature in order to get higher radiometric performance, reduce the system noise, and achieve higher signal-to-noise ratio finally. Specifically, IRFPA working temperature of WTI is maintained at about 56K. The stability of IRFPA temperature is the foundation for the stable response of WTI. The HTBB and LTBB are the main calibration references for the on-orbit calibration. The stability of the HTBB and LTBB temperature is key indicators for assessing on-orbit performance. The stability of the temperatures is characterized by the standard root mean square deviation of the temperature data.
2.4.2. NETD
The NETD, reflecting the instrument's thermal sensitivity and detection capability, serves as a crucial objective key parameters for WTI[19]. After WTI was successfully launched, the solar contamination, the thermal radiation of other components into the optical path of calibration and the degradation of detector response are primary contributors to the on-orbit noise. The on-orbit noise level can be comprehensively quantified by the performance of the NETD. NEDT specifications for WTI are 0.1K@300K. NETD associated with on-board calibration data is calculated using equation(11).
where, and are the equivalent temperatures of HTBB and LTBB respectively [K];and are the noise values associated with HTBB and LTBB calibration data respectively; and are the i-th scan calibration noise values of the HTBB and LTBB calibration data respectively; M is the scan number.
2.4.3. SRS
The stability of the infrared remote sensor is assessed by analyzing the fluctuations of the on-board calibration data. As mentioned previously in this paper, WTI acquired images through 360-degree rotating scanning. On-board calibration data can be got in every scan which allows for the collection of HTBB and LTBB calibration data at different time. Under the premise that the temperature of HTBB and LTBB remain relatively stable, the SRS is calculated based on these sequential on-board HTBB and LTBB calibration data using equation(12-14)[20].
where, and are the stability calculated based on the HTBB and LTBB data respectively [unitless]; and are the maximum DN value of the on-board HTBB and LTBB data [unitless]; and are the minimum DN value of the on-board HTBB and LTBB data [unitless]; and are the mean DN value of the on-board HTBB and LTBB data [unitless].
3. Results and Discussion
3.1. On-Orbit SACs Results
The on-orbit SACs coefficients are calculated by the cross-calibration with the AGRI onboard FY-4A/FY-4B as reference. The calibration accuracy of AGRI onboard calibration exceeds 0.5K. The analogous spectral range coverage, center wavelength, spatial resolution of GF-5A/WTI and FY-4B/AGRI, are summarized in Table 3. Figure 3 illustrates the RSR profiles for GF-5A/WTI and FY-4B/AGRI. It is noteworthy that discrepancies are observed in the RSR within the same band range between the reference remote sensor AGRI and the remote sensor undergoing calibration WTI. These discrepancies can be addressed by calculating the spectral matching factors of Top of Atmosphere(TOA) radiance between the two sensors[21,22,23]. The spectral matching factors, which are typically comprised of linear coefficients, denoted as a and b, are as shown in equation 15. The results of the spectral matching factors are displayed in Table 4.
where, is the TOA radiance of WTI [W/m²·Sr·μm];is the TOA radiance of AGRI [W/m²·Sr·μm]; and are the slope and offset coefficients of the spectral matching factors between WTI and AGRI.
To minimize the errors associated with cross calibration, it is essential to control the imaging time difference between the sensor undergoing calibration and the reference sensor for the same area. The time difference must remain below a predetermined threshold. In this study, to effectively manage these discrepancies, the time difference between WTI and ARGI was maintained within a limit of 10 minutes [22].
The calibration area should be uniformity in spatial distribution to minimize the error in cross radiometric calibration. This requirement stems from the significant differences in Ground Sample Distance(GSD)between the sensor being calibrated and the reference sensor. Ensuring uniformity helps to mitigate radiometric calibration errors induced by mixed pixels[22]. The uniformity of the cross calibration areas must adhere to the equation(16).
where, is the standard deviation of the TOA radiance within the selected cross calibration area[W/m²·Sr·μm];is the average TOA radiance of selected cross calibration area[W/m²·Sr·μm]; is the threshold for spatial uniformity of cross calibration[unitless].The threshold value for spatial uniformity matching is typically set as 0.01[22]. To improve the fitting linearity of the cross calibration matching points, four distinct threshold values were employed for the four bands of WTI: 0.008 for B1, 0.006 for B2, 0.004 for B3, and 0.003 for B4.
3.2. On-Board Performance Results
3.2.1. Temperature Stability
The stability of the IRFPA temperature and the BB temperature is a prerequisite for ensuring the reliability of calibration data responses. Consequently, an initial analysis is conducted to assess the stability of both the IRFPA temperature, HTBB and LTBB temperature. As mentioned before, IRFPA works at 56K to get higher performance, reduce system noise level, and achieve higher signal-to-noise ratio. Significant fluctuations in IRFPA temperature may affect the imaging quality such as NETD and the number of blind pixels.
WTI was heated for decontamination for about one month from December 2022 to January 2023, during this period WTI was remained powered off. From January 2023 to February 2023, WTI was in the adjustment processing state. Imaging parameters including gain and intergration time, and the on-board BB temperature were adjusted to achieve the optimal imaging performace. Figure 4a presents the IRFPA temperature curve in 20 minutes. The response associated with IRFPA temperature exhibited a fluctuation of only 0.4mK for a single imaging time about 1200 sconds. Calculate the mean value of the temperature for a single imaging time, and then analyze the mean temperature changes over two years, from February 2023 to February 2025. The long-term temperature stability was presented in Figure 4b with STD about 1mK. The observed fluctuations signify a notable level of stability that is unlikely to provoke variations in the on-board calibration data.
Conversely, the on-board calibration data are directly influenced by the fluctuations in HTBB and LTBB temperatures. Figure 5 presents the temperature curves of LTBB in 20 minutes and over 2 years. Figure 6 presents the HTBB temperature curves in 20 minutes and over 2 years. The results show that WTI is confirmed to work normally after the launch and the HTBB is maintained at an average temperature of ~298 K, while the LTBB is maintained at an average temperature of ~273 K.
The LTBB temperature trends remain remarkably stable with the STDs 7mK in a single imaging time and 25mK over two years. The HTBB temperature trends remain remarkably stable with the STDs 8mK in a single imaging time and over two years. The temperature stability within a single imaging time is significantly better than that in a long-term period. Since there are HTBB and LTBB data for each scan, the stability of the HTBB and LTBB mainly depends on the results within a single imaging time. The results indicated that the temperatures of IRFPA, HTBB and LTBB were stable.
3.2.2. NETD
NETD based on on-board calibration was calculated using equation(11). The variation curves of NETD over a two-year period, from February 2023 to February 2025, are presented in Figure 7. It can be observed from Figure 7 that there is no notable trend of attenuation in the NETD over the course of two years. The fluctuations and stability of NETD are summarized in Table 7. It is evident that the NETD fluctuation remained below 1%, indicating that the NETD remains stable.
3.2.3. SRS
The SRS of the on-board calibration data collected from February 2023 to February 2025 was analyzed in accordance with equation(12-14). The SRS curves for the two-year period under consideration are illustrated in Figure 8. It can be observed from Figure 8 that there is no notable trend of attenuation in the SRS for WTI over the course of two years. The fluctuations and stability of SRS of WTI are summarized in Table 2. The mean of SRS were more than 99.3% and the fluctuations of SRS were less than 0.002%. The results indicated that all four bands of WTI were stable.
3.3. On-Orbit Calibration Accuracy
To evaluate the absolute calibration accuracy, the calibration site data with IGTAME and the atmospheric data from ERA5 are utilized here. The calibration site data with IGTAME are mainly from Golmud Site, Dachaidan Site and Dunhuang Site. The images in these three sites are shown in Figure 9. The ERA5 atmospheric profile data across 37 vertical layers ranging from 1000 hPa to 1 hPa are got from ECMWF. The key atmospheric parameters such as water vapor content, temperature, wind speed are provided in every vertical layer. The data is presented in a grid format, organized according to longitude and latitude along the horizontal axis, with a corresponding spatial resolution of 0.25°. Reference [18] indicates that ERA5 provides relatively stable and highly accurate data. Figure 10 shows the differences between ERA5 data and measured data at different altitude. The difference in atmospheric transmittance calculated based on these two types of data is only 0.2%.
The land brightness temperature (BT) of the calibration site and the ERA5 atmospheric profile data are used to calculate the TOA radiance in the calibration accuracy assessment. Then the retrived BT, which was got based on the TOA radiance, was utilized as the true value. The TOA BT derived from the on-orbit calibration coefficients was calculated by equation(1). Then ,we conducted a comparison and validation with the two BT data. The RMSE of multiple validation points is utilized to quantify the calibration accuracy of the satellite[24,25]. 243 image products of GF5A-WTI containing Dunhuang, Dachaidan, and Golmud sites from June to October, 2024 are acquired as the validation data.
The average DN values of a 5×5-pixel area within this image were calculated as the response value, along with the standard deviation of 5×5-pixel area as the reference value. The DN values of each band in the validation data were extracted by the same method. To assess the cloud cover of the sites, the uniformity of the 5×5-pixel images are calculated. The stability of surface temperatures within 5 minutes before and after transit are evaluated to detect any short-term factors affecting temperature stability, such as thin clouds or shadows. Additionally, outliers deviating from the regression line by more than twice the standard deviation were removed.
After excluding abnormal data such as cloud cover, cloud shadows, and thin clouds, the RMSE errors between the true BT values and the derived BT values were statistically analyzed by equation(17). The calibration accuracies of WTI four bands within the range of 0.72K to 0.88 K, with an average of 0.53 K to 0.68K are shown in Figure 11 .
where, is the BT derived from the on-orbit calibration coefficients;is the reference true brightness temperature[K];N is the total number of calibration accuracy verification.

Table 8.
RMSE Error Statistics for Calibration Verification of WTI.
| Band | RMSE | Mean |
| B1 | 0.82K | 0.16K |
| B2 | 0.70K | -0.17K |
| B3 | 0.73K | 0.10K |
| B4 | 0.74K | -0.14K |
4. Conclusions
WTI is the key infrared remote sensor aboard on GF-5A. The method and performance of the on-orbit calibration for its four infrared bands are presented. In terms of its on-orbit calibration, the SACs are applied to the gain and offset to account for the scan-angle effect. After GF-5A was launched, cross calibration with FY-4B AGRI as the reference satellite was used to calculate the on-orbit SACs coefficients for WTI. The assessment of the on-orbit calibration shows that the on-orbit derived SACs perform well for WTI. The calibration accuracies for the four TEBs are as follows: a median difference of 0.16K and RMSE of 0.82K for the 8.2μm band, a median difference of -0.17K and RMSE of 0.70K for the 8.6μm band, a median difference of 0.16K and RMSE of 0.73K for the 10.8μm band, a RMSE of 0.74K for the 12.0μm band.
Furthermore, to establish baselines for future operational monitoring, the first two years’ performances of the key parameters such as IRFPA temperature, blackbody temperature , NEDT and SRS were also presented. The results show remarkably stable performing the satellite is operating normally. The specifications of WTI TEBs are met and it can be concluded that WTI can provide high-quality level-1 radiometric products.
Author Contributions
Conceptualization, Y.L., Y.B., and K.J.; investigation, Y.L., Y.B., and K.J;data collection, H.W., Y.L., and K.J, and Y.S.; writing and original draft, Y.L.; writing—reviewing and editing, Y.L., Y.B., and K.J; methodology, Y.L.; project administration, Y.L., Y.B., H.W., and K.J.. All authors have read and agreed to the published version of the manuscript.
Funding
Please add: This research was funded by NAME OF FUNDER, grant number XXX” and “The APC was funded by XXX”. Check carefully that the details given are accurate and use the standard spelling of funding agency names at https://search.crossref.org/funding. Any errors may affect your future funding.
Data Availability Statement
The data is available from the corresponding author upon reasonable request.
Acknowledgments
The authors thank China Centre for Resources Data and Application for the GF-5A/WTI images; National Satellite Meteorological Center (NSMC) of China for FY-4B/AGRI images;ERA5 for the atmospheric profile data and SST data.
Conflicts of Interest
The authors declare no conflicts of interest.
Abbreviations
The following abbreviations are used in this manuscript:
| GF-5A | Gaofen Satellite 5A |
| WTI | Wide-swath Thermal Infrared Remote Sensor |
| BISME | Beijing Institute of Space Mechanics & Electricity |
| HTBB | high temperature blackbody |
| LTBB | low temperature blackbody |
| SACs | scan angle correction coefficients |
| AGRI | Advanced Geostationary Radiation Imager |
| FY-4B | FengYun-4B satellite |
| IGTAME | infrared ground temperature automatic measurement equipment |
| ECMWF | European Centre for Medium-Range Weather Forecasts |
| ERA5 | the fifth generation ECMWF Atmospheric Reanalysis of the Global Climate data |
| NETD | Noise Equivalent Temperature Difference |
| SRS | System Radiation Stability |
| IRFPA | Infrared Focal Plane Array |
| RMSE | root mean square error |
| BB | Blackbody |
| TEBs | thermal emissive bands |
| AVHRR | Advanced Very High Resolution Radiometer |
| MODIS | Moderate Resolution Imaging Spectroradiometer |
| VIIRS | Visible Infrared Imaging Radiometer Suite |
| RVS | response versus scan angle |
| VIMS | visible and infrared multispectral sensor |
| TOA | Top of Atmosphere |
| CW | Center Wavelength |
| RES | Spatial Resolution |
| RSR | Comparison of Relative Spectral Response |
| MERSI | Medium Resolution Spectral Imager |
| FY-3A | FengYun Satellite 3A |
| DN | Digital Number |
| CW | Center Wavelength |
| RES | Spatial Resolution |
| RSR | Relative Spectral Response |
| TOA | Top of Atmosphere |
| GSD | Ground Sample Distance |
| BT | brightness temperature |
References
- S. Kalluri, C. Cao, A. Heidinger, A. Ignatov, J. Key, and T. Smith, "The Advanced Very High Resolution Radiometer: Contributing to Earth Observations for over 40 Years,". vol. 102 Boston MA, USA: American Meteorological Society, 2021, pp. E351 - E366. [CrossRef]
- D. Smith, D. Peters, T. Nightingale, J. Pearce, and R. Veltcheva, "Challenges for In-Flight Calibration of Thermal Infrared Instruments for Earth Observation," Remote sensing (Basel, Switzerland), vol. 12, no. 11, p. 1832, 2020. [CrossRef]
- X. Liang and A. Ignatov, "AVHRR, MODIS, and VIIRS radiometric stability and consistency in SST bands," Journal of Geophysical Research: Oceans, vol. 118, no. 6, pp. 3161-3171, 2013. [CrossRef]
- Arino, A. Buongiorno, and P. Goryl, "Intercalibration of AVHRR and ATSR data," Adv. Space Res., vol. 17, no. 1, pp. 29-38, 1996. [CrossRef]
- P. Trishchenko, G. Fedosejevs, Z. Li, and J. Cihlar, "Trends and uncertainties in thermal calibration of AVHRR radiometers onboard NOAA-9 to NOAA-16," Journal of Geophysical Research: Atmospheres, vol. 107, no. D24, 2002. [CrossRef]
- L. Wang and C. Cao, "Radiance comparison of IASI and AVHRR on MetOp-A," Proc. SPIE 6684, Atmospheric and Environmental Remote Sensing Data Processing and Utilization III: Readiness for GEOSS, 668417 (24 September 2007). [CrossRef]
- X. Xiong and W. Barnes, "An overview of MODIS radiometric calibration and characterization," Adv. Atmos. Sci., vol. 23, no. 1, pp. 69-79, 2006. [CrossRef]
- W. Wang, C. Cao, and S. Blonski, "Estimating the VIIRS Thermal Emissive Band Response Versus Scan (RVS) and Calibration Offsets Using On-Orbit Pitch Maneuver Data," IEEE Trans. Geosci. Remote Sensing, vol. 60, pp. 1-10, 2022. [CrossRef]
- H. Oudrari et al., "Prelaunch Radiometric Characterization and Calibration of the S-NPP VIIRS Sensor," IEEE Trans. Geosci. Remote Sensing, vol. 53, no. 4, pp. 2195-2210, 2015. [CrossRef]
- X. Xiong et al., "VIIRS on-orbit calibration methodology and performance," Journal of Geophysical Research: Atmospheres, vol. 119, no. 9, pp. 5065-5078, 2014. [CrossRef]
- X. Xiong, K. Chiang, A. Wu, W. L. Barnes, B. Guenther, and V. V. Salomonson, "Multiyear On-Orbit Calibration and Performance of Terra MODIS Thermal Emissive Bands," IEEE Trans. Geosci. Remote Sensing, vol. 46, no. 6, pp. 1790-1803, 2008. [CrossRef]
- Y. Li, A. Wu, and X. Xiong, "Inter-Comparison of S-NPP VIIRS and Aqua MODIS Thermal Emissive Bands Using Hyperspectral Infrared Sounder Measurements as a Transfer Reference," Remote Sens., vol. 8, no. 1},ARTICLE-NUMBER = {72, 2016. [CrossRef]
- C. L. Pérez Díaz, X. Xiong, Y. Li, and K. Chiang, "S-NPP VIIRS Thermal Emissive Bands 10-Year On-Orbit Calibration and Performance," Remote sensing (Basel, Switzerland), vol. 13, no. 19, p. 3917, 2021. [CrossRef]
- Y. Li, X. Xiong, J. McIntire, and A. Wu, "Comparison of the MODIS and VIIRS Thermal Emissive Band Radiometric Calibration," IEEE Trans. Geosci. Remote Sensing, vol. 58, no. 7, pp. 4852-4859, 2020. [CrossRef]
- Ren Chang-sheng, Hyperspectral observation satellite: See the Present and Seize the Future. Chinese Society of Astronautics, Beijing, China, Mar.2023.
- Hu, Y.; Zhang, Y.; Yan, L.; Li, X.; Zhang, L. Evaluation of the radiometric calibration of FY4-A AGRI thermal infrared data using lake qinghai,” IEEE Trans. Geosci. Remote Sens. 2020, 59, 8040–8050. [Google Scholar] [CrossRef]
- LI XiuJu, WANG BaoYong, et al., “Study on the improvement of scan mirror thermal radiation correction on the calibration accuracy of FY-4A AGRI,” Infrared Millim. Waves,Vol. 41,No. 3,pp. 608-616, Jun.2022,.
- Xue Y N,et al.,Accuracy evaluation of the satellite thermal infrared radiometric calibration method based on ERA5 ocean re-analysis data,National Remote Sensing Bulletin,VOL.27, NO.5, pp.1150-1165,APR. 2022. [CrossRef]
- WANG Xiaojian,LIU Yang,CHEN Lei,et al., “Discussion on the operation range of the infrared imaging system for point target expressed by NETD and ΔT, ”Infrared and Laser Engineering,Vol.37,No. S2, pp.493-495, Jun. 2008.
- Radiometric calibration method for space-borne optical remote sensors in laboratory. GB/T 38236-2019, 2019.
- Xin, Ye; et al. Xin Ye et al., “ cross calibration of Chinese Gaofen-5 thermal infrared images and its improvement on land surface temperature retrieval,” International Journal of Applied Earth Observations and Geoinformation, vol.101,no.102357,pp,May.2021. [CrossRef]
- Technical specification on infrared cross-calibration for geostationary meteorological satellites, QX/T 388-2017,2017.
- Rui Chen,Lei Guan,Mingkun Liu andLiqin Qu, Cross-Calibration of HY-1D/COCTS Thermal Emissive Bands in the South China Sea. Remote Sens. 2024, 16(2), 292.
- Tang, H.Z.; Xie, J.F.; Dou, X.H.; Zhang, H.G.; Chen, W. On-Orbit vicarious radiometric calibration and validation of ZY1-02E thermal infrared sensor. Remote Sens. 2023, 15, 994. [Google Scholar]
- Ye, X.; Liu, J.; Lin, M.; Ding, J.; Zou, B.; Song, Q.; Teng, Y. Evaluation of Sea Surface Temperatures Derived From the HY-1D Satellite. IEEE J. Sel. Top. Appl. Earth Obs. Remote Sens. 2022, 15, 654–665. [Google Scholar] [CrossRef]
Figure 1.
WTI view angles of the earth, HTBB and LTBB.
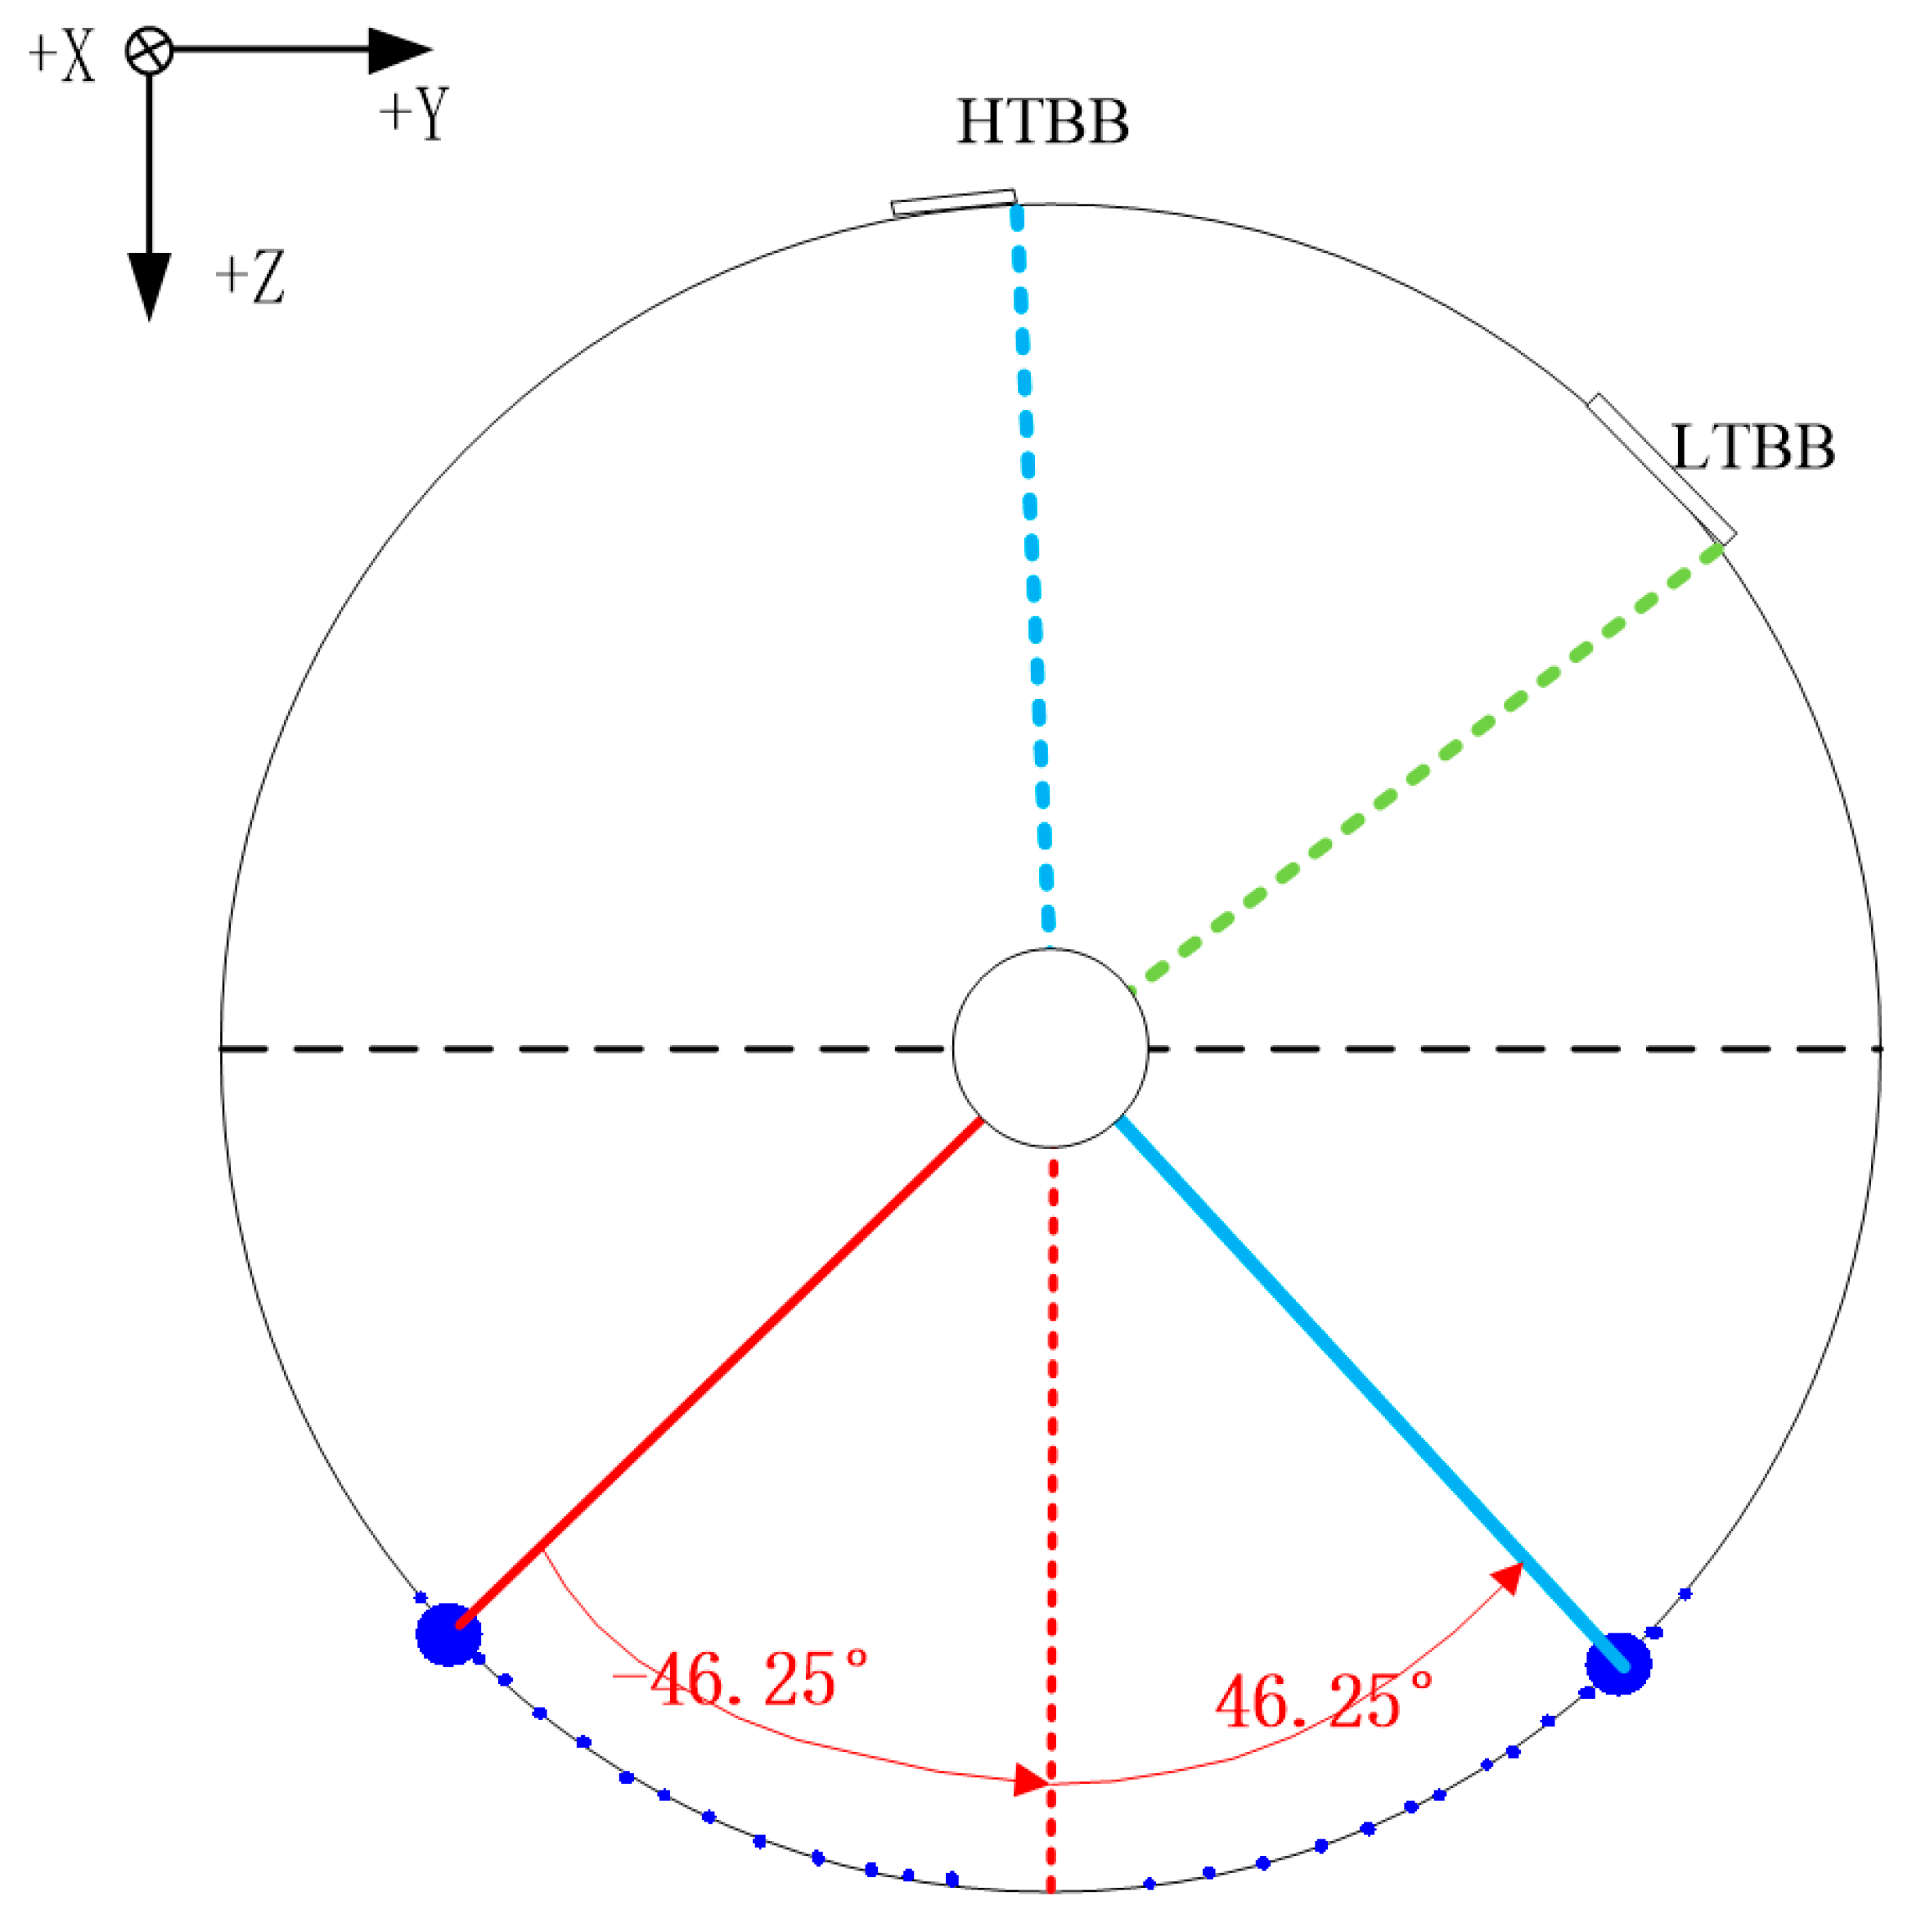
Figure 2.
The calibration sites with IGTAME. (a): Golmud Site, (b): Dunhuang Site and (c): Dachaidan Site.
Figure 2.
The calibration sites with IGTAME. (a): Golmud Site, (b): Dunhuang Site and (c): Dachaidan Site.
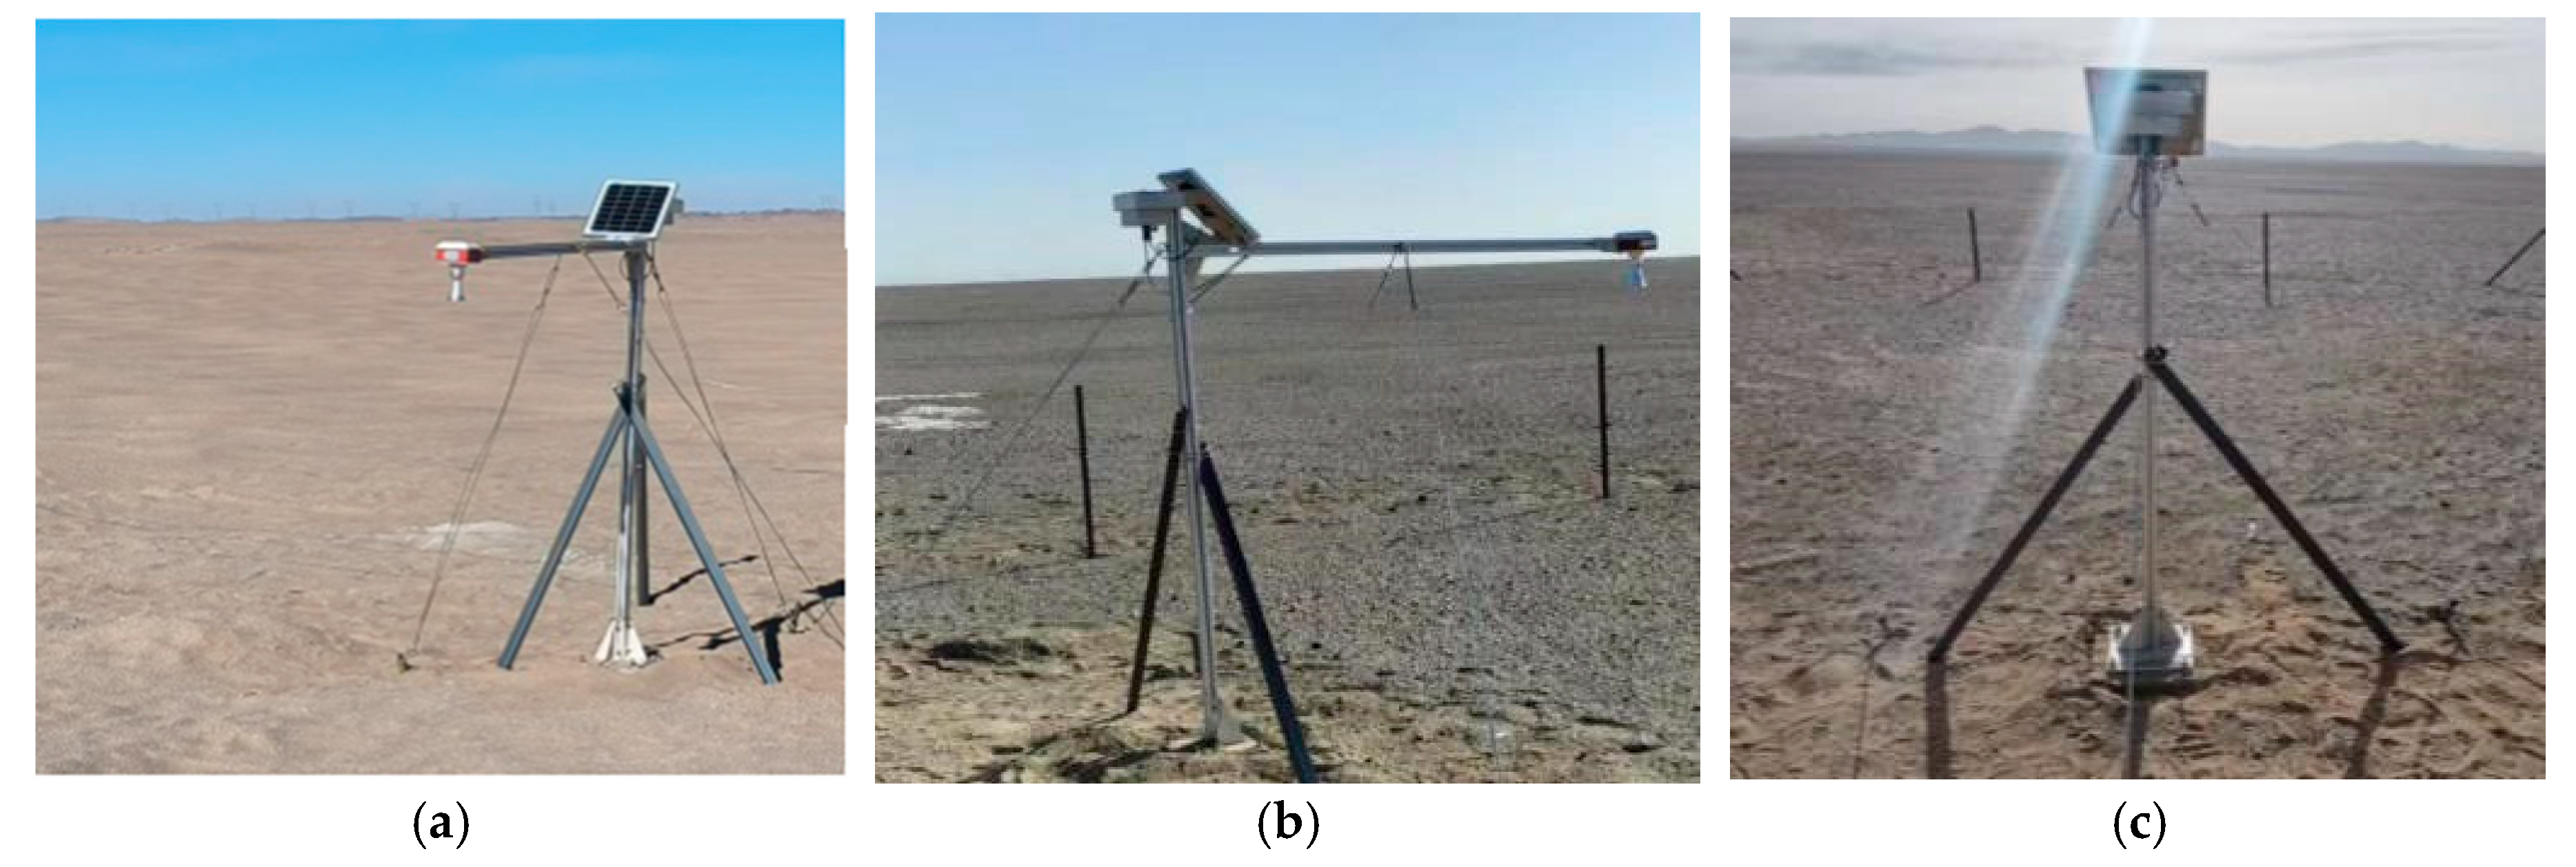
Figure 3.
Comparison of Relative Spectral Response (RSR) profiles from GF-5A and FY-4B.
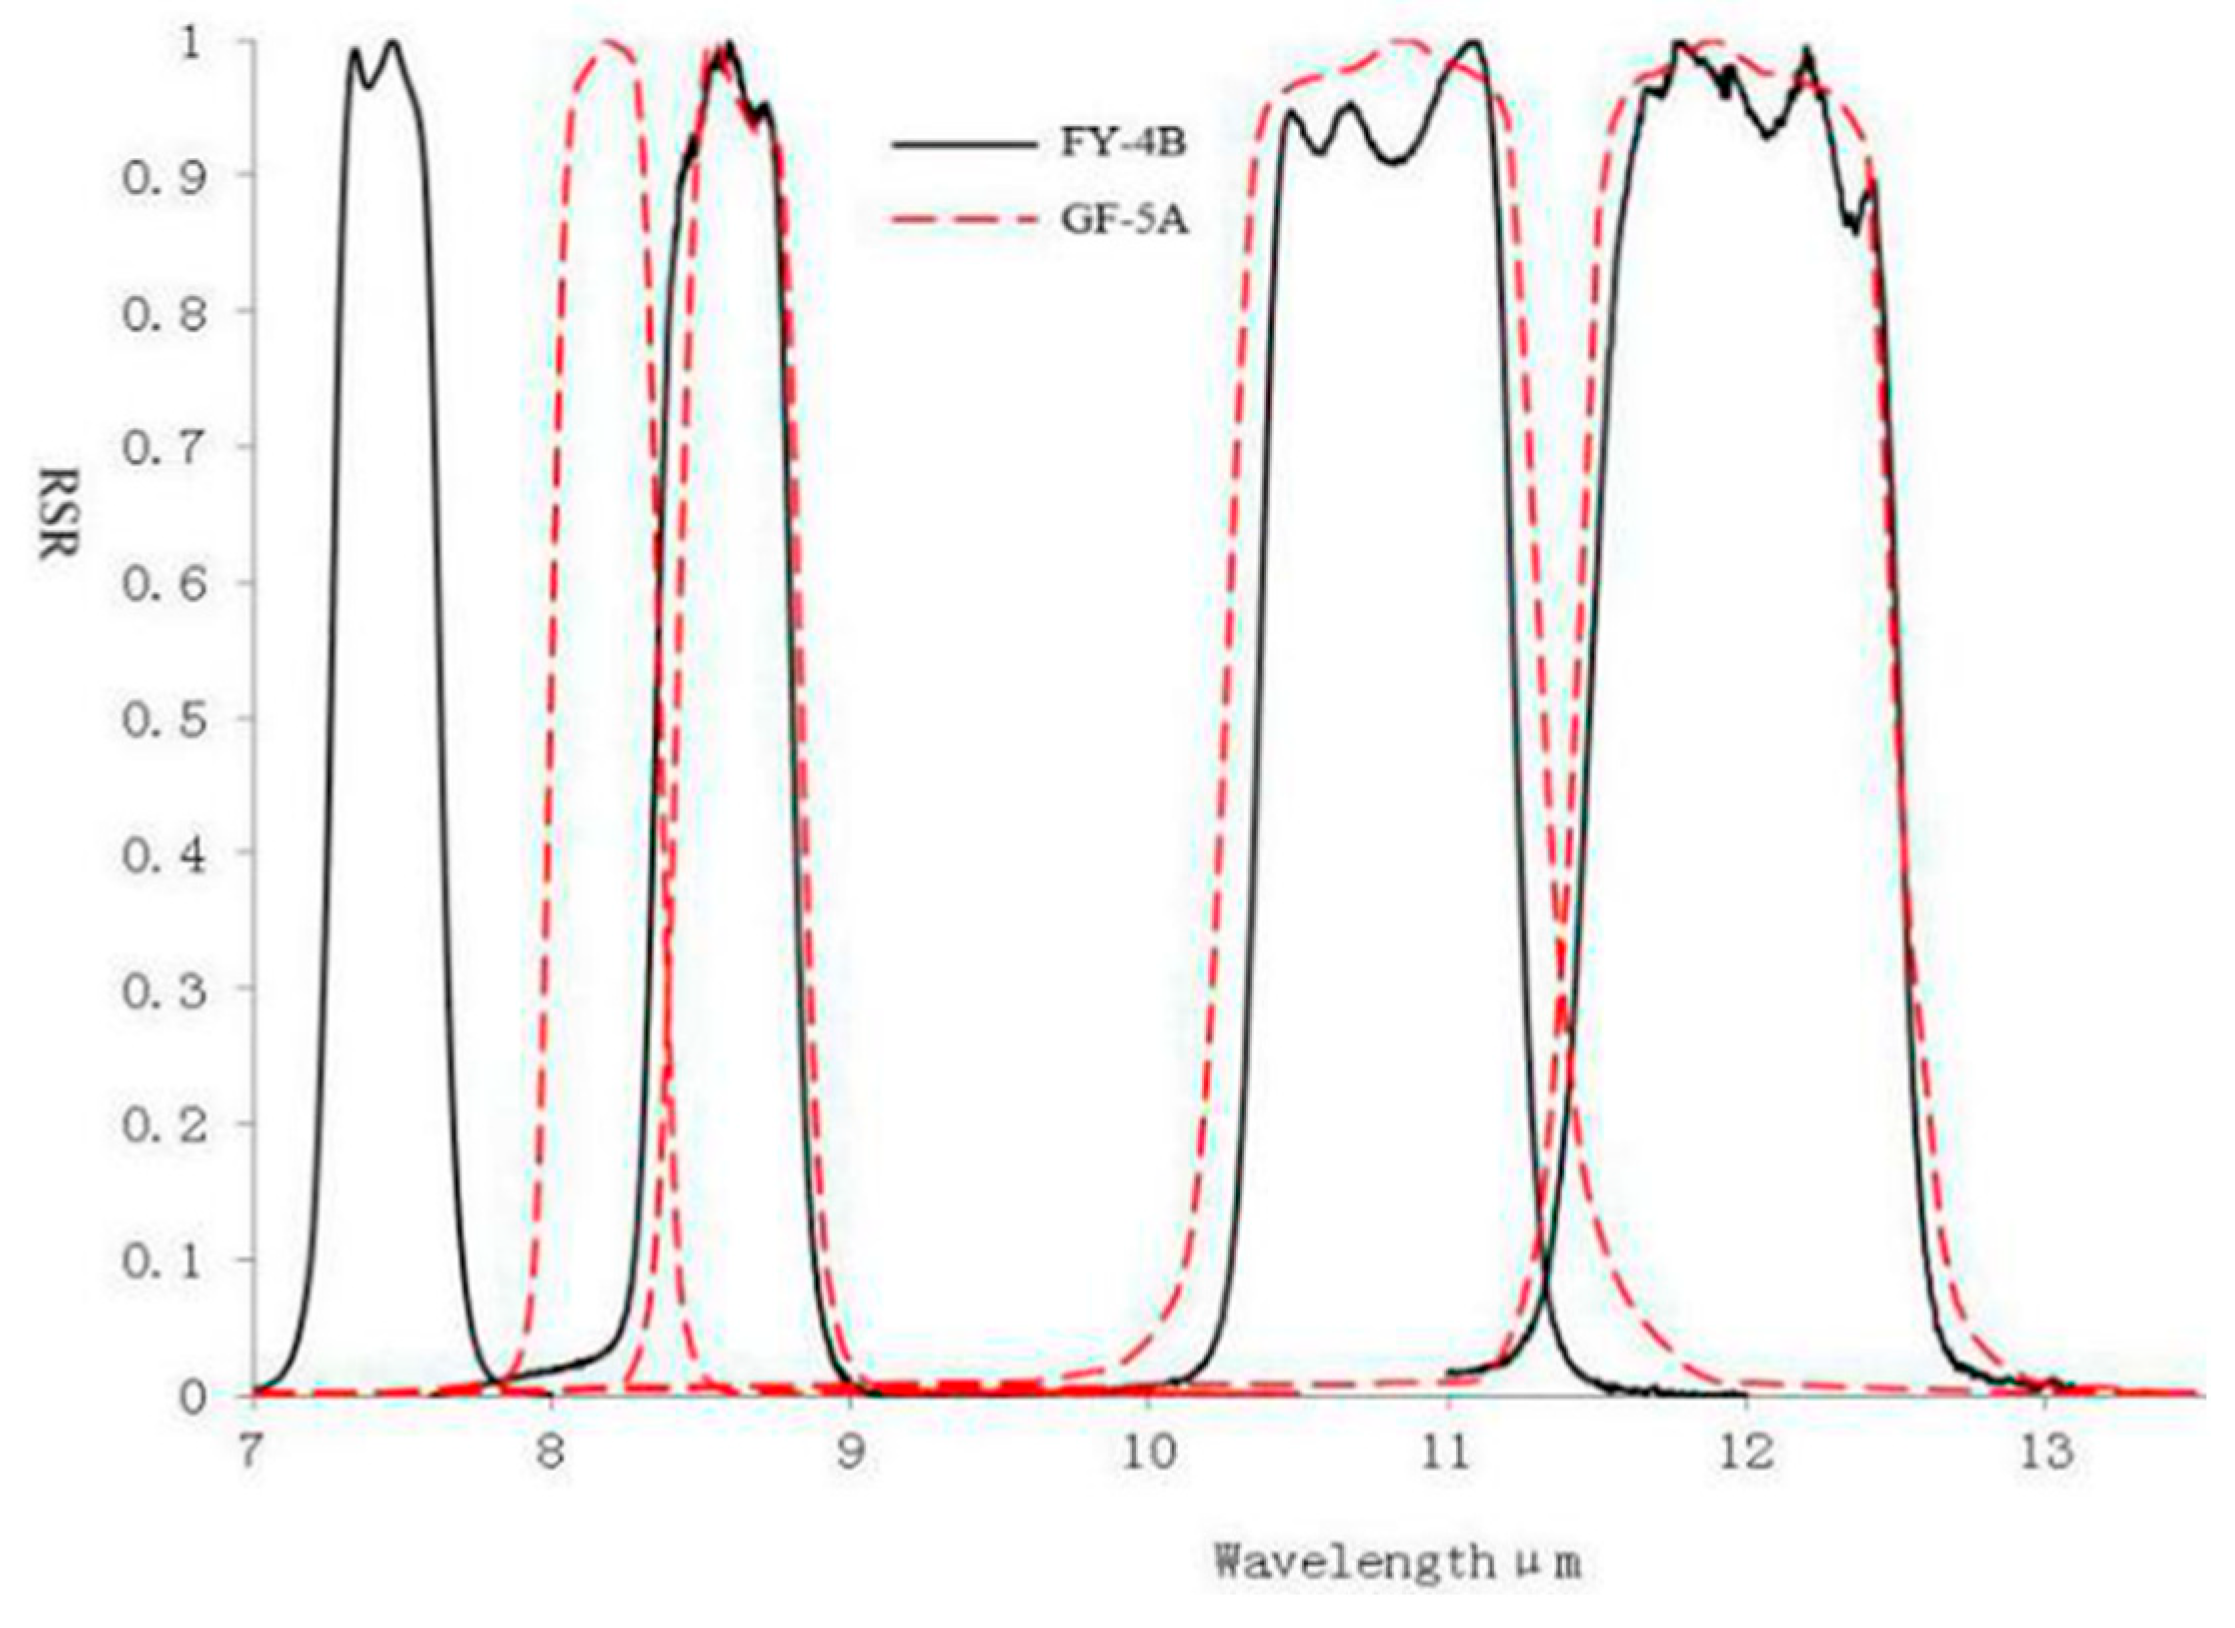
Figure 4.
The IRFPA temperature results.(a):The IRFPA temperature curve in 20 minutes. (b): The IRFPA temperature curve over two years.
Figure 4.
The IRFPA temperature results.(a):The IRFPA temperature curve in 20 minutes. (b): The IRFPA temperature curve over two years.
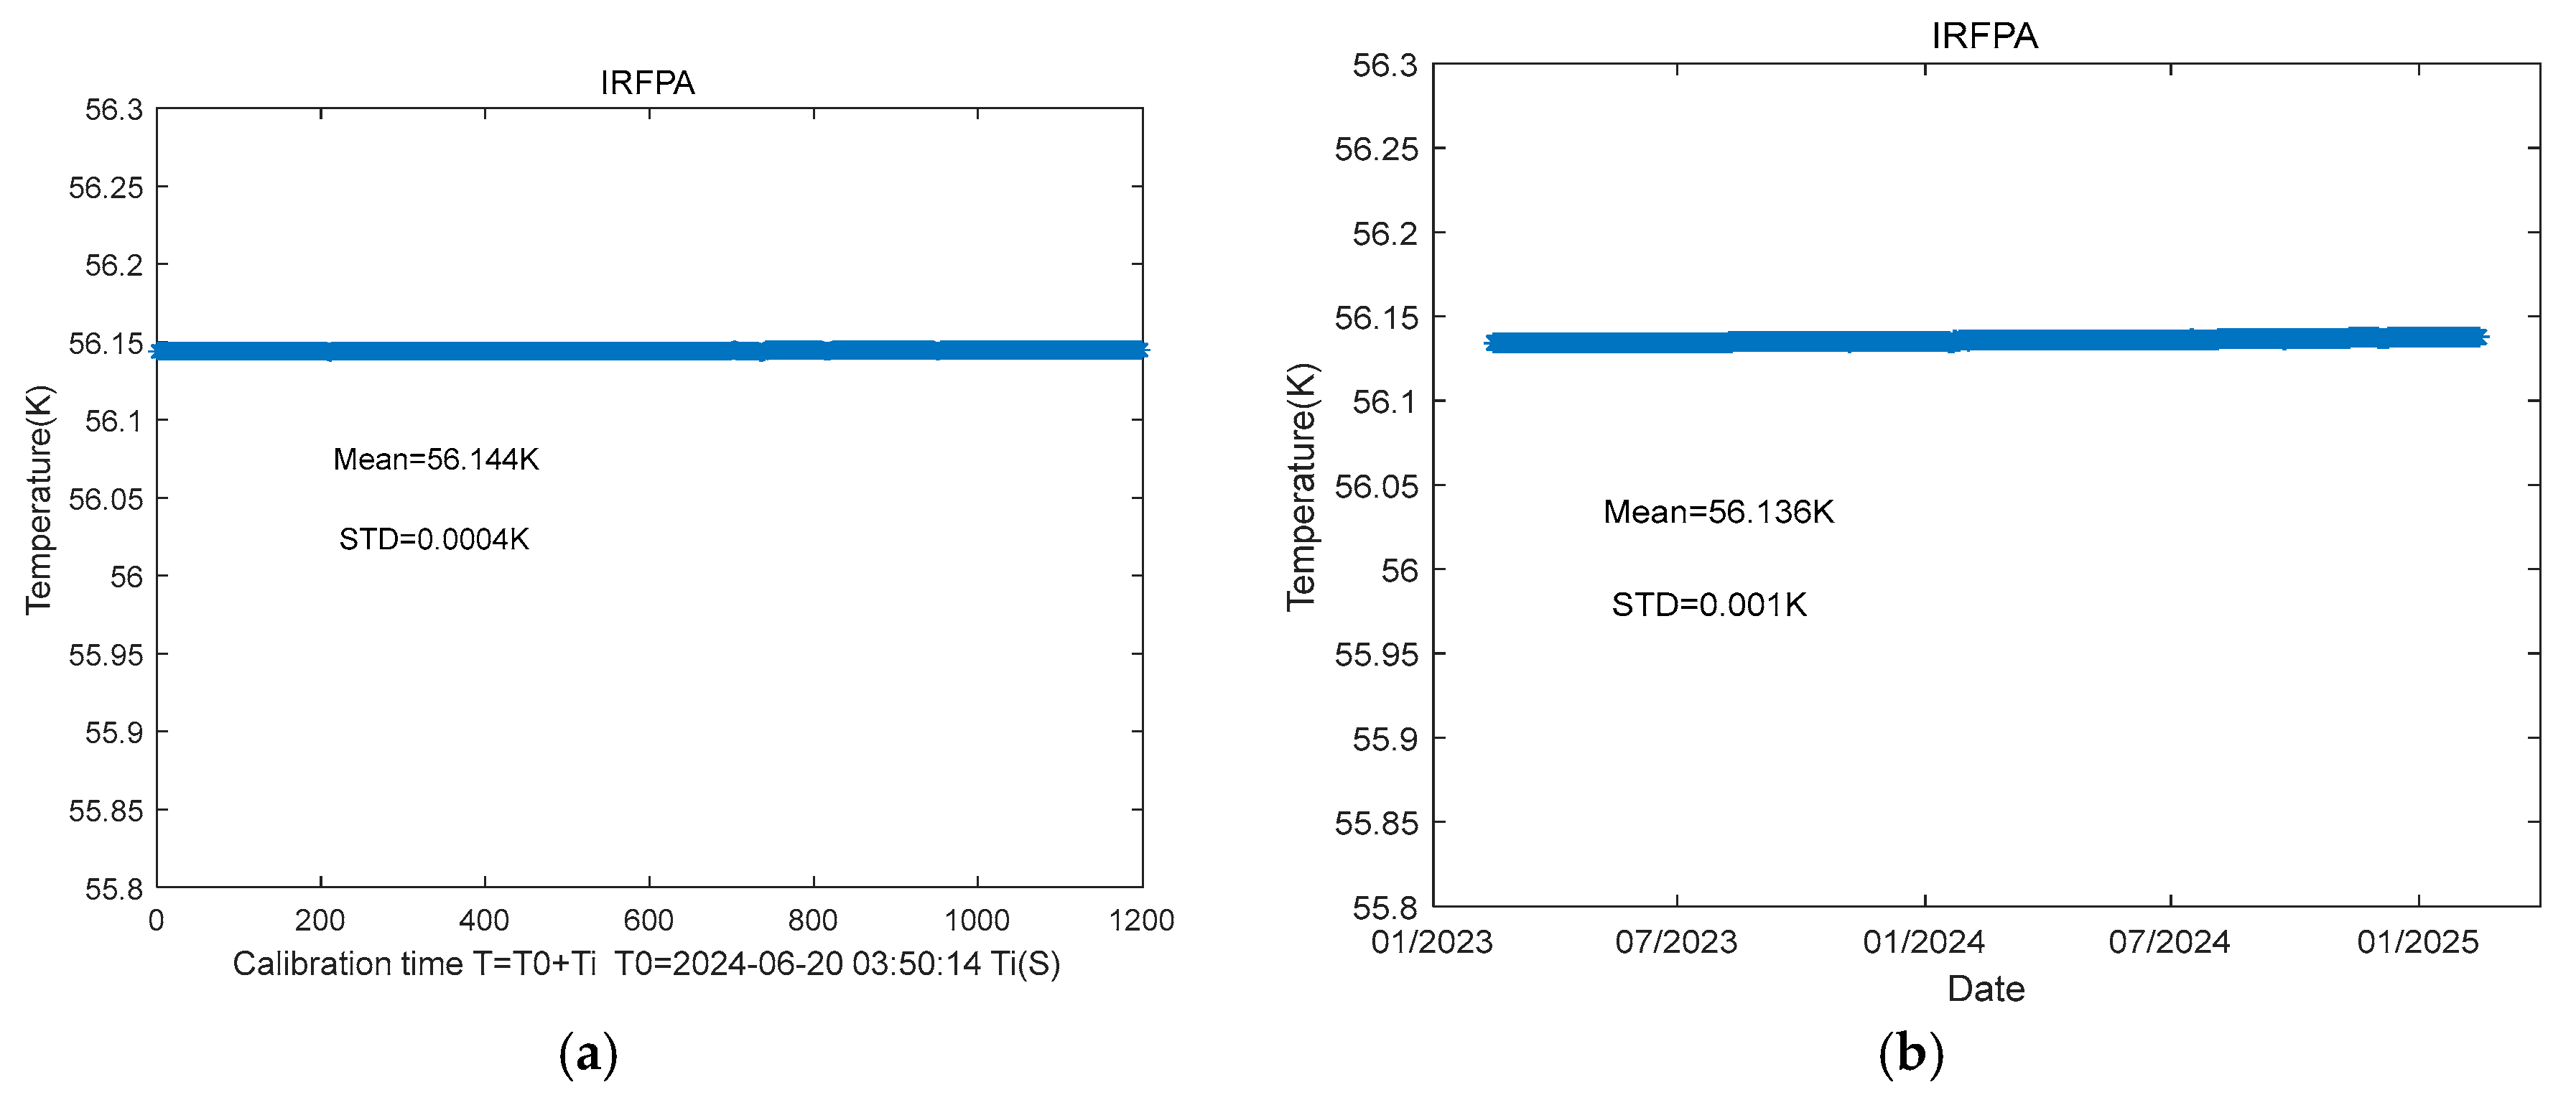
Figure 5.
The temperature curves of LTBB. (a):The LTBB temperature curve in 20 minutes. (b): The LTBB temperature curve over two years.
Figure 5.
The temperature curves of LTBB. (a):The LTBB temperature curve in 20 minutes. (b): The LTBB temperature curve over two years.
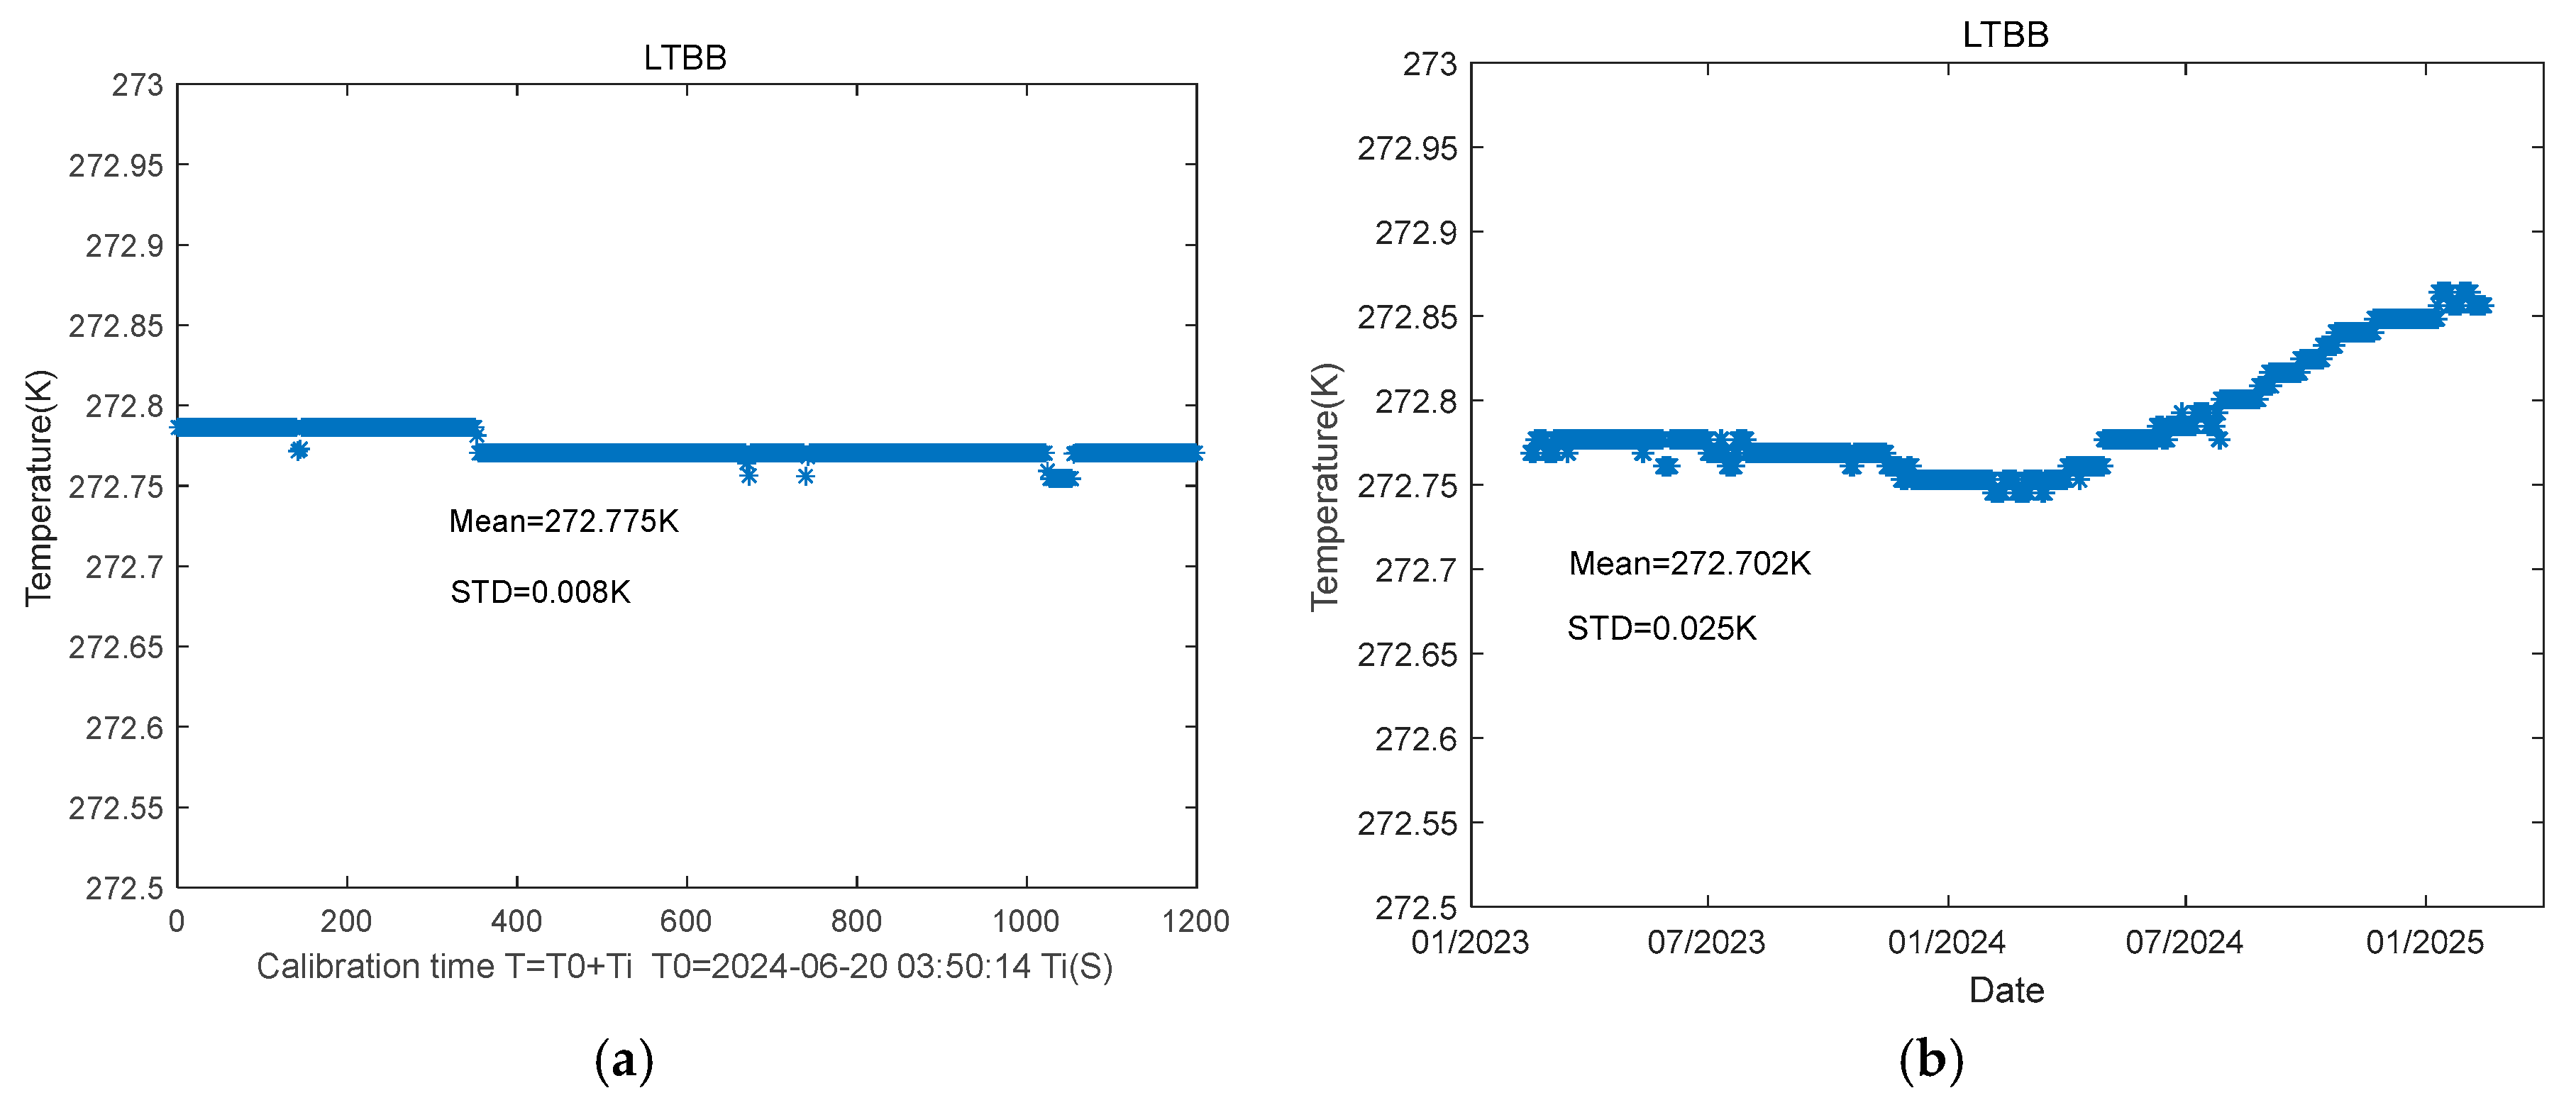
Figure 6.
The temperature curves of HTBB .(a):The HTBB temperature curve in 20 minutes. (b): The HTBB temperature curve over two years.
Figure 6.
The temperature curves of HTBB .(a):The HTBB temperature curve in 20 minutes. (b): The HTBB temperature curve over two years.
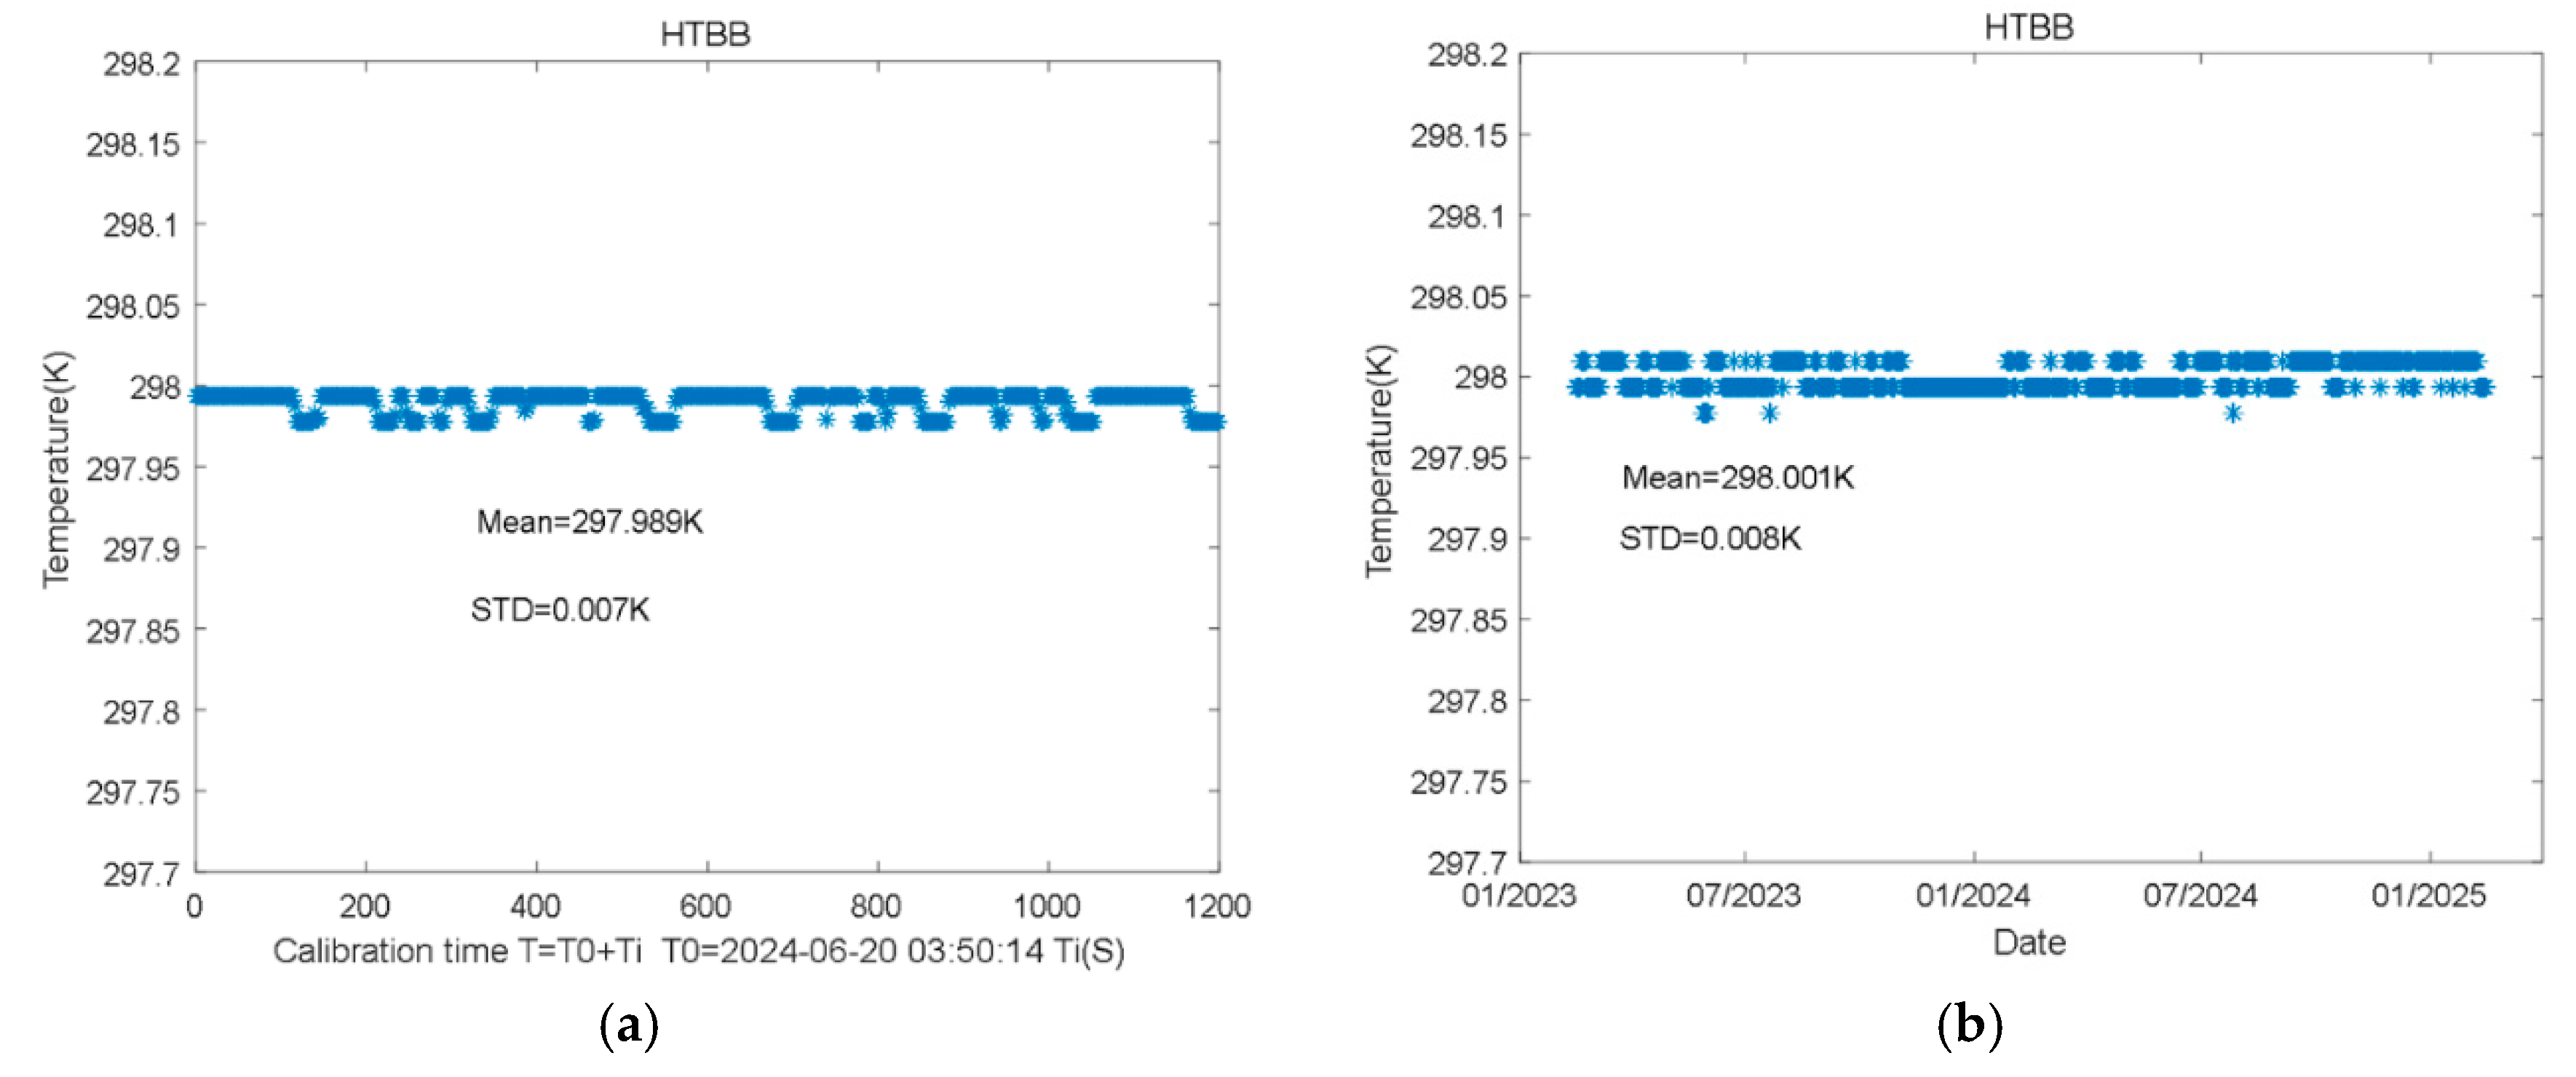
Figure 7.
The NETD curves based on on-board calibration. (a):The NETD curves of daytime imaging parameter.(b):The NETD curves of nighttime imaging parameter.
Figure 7.
The NETD curves based on on-board calibration. (a):The NETD curves of daytime imaging parameter.(b):The NETD curves of nighttime imaging parameter.
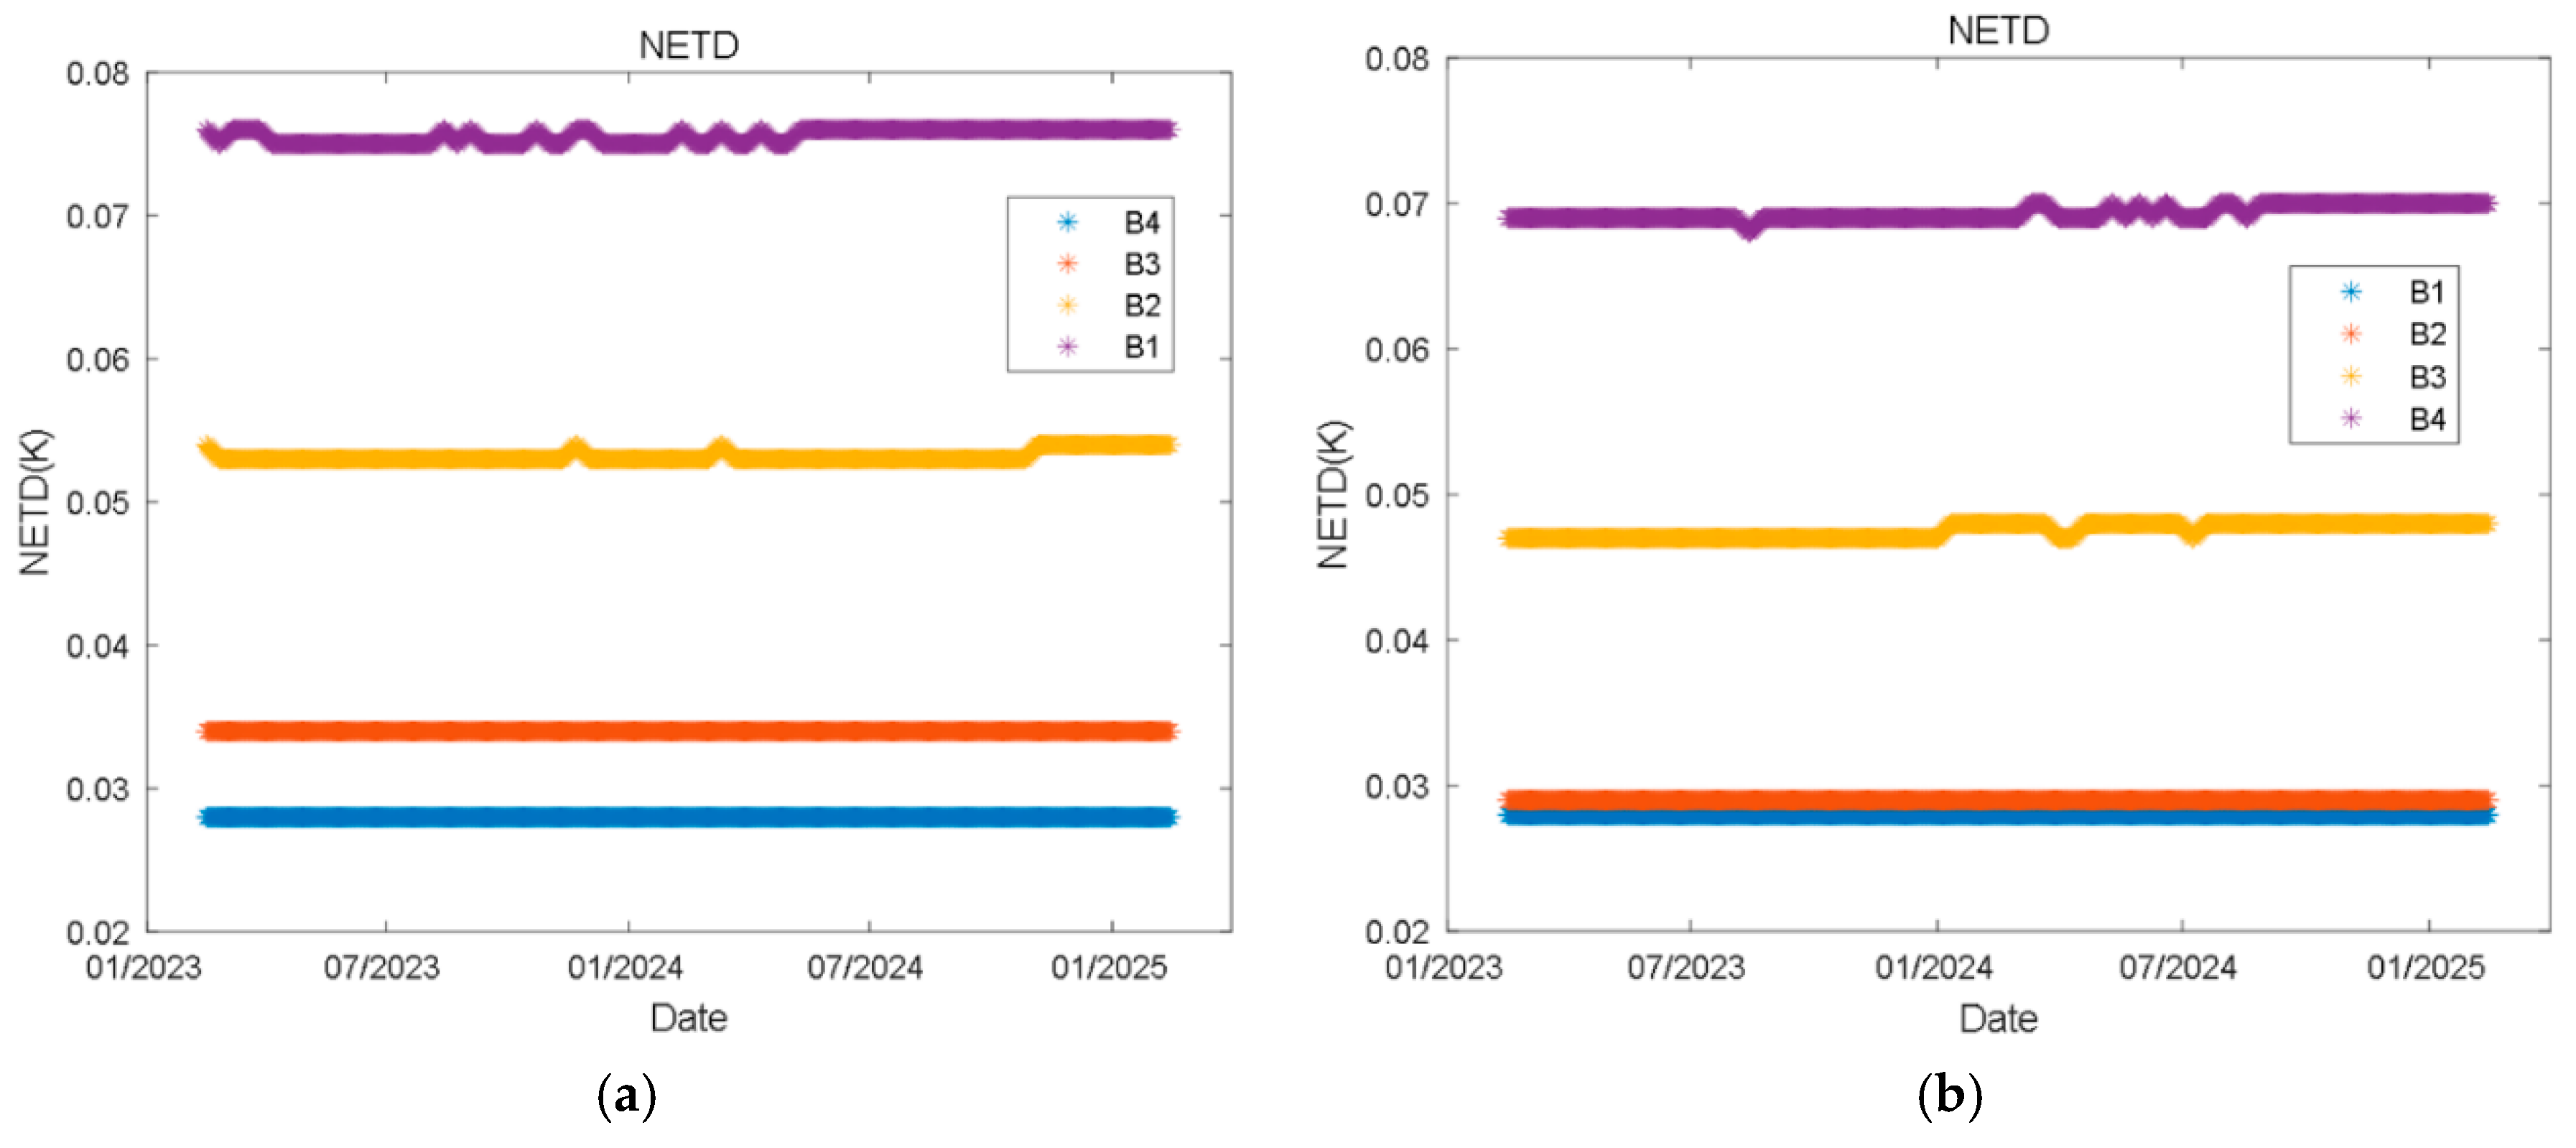
Figure 8.
The SRS curves. (a):The SRS curves of daytime parameter;(b):The SRS curves of nighttime parameter.
Figure 8.
The SRS curves. (a):The SRS curves of daytime parameter;(b):The SRS curves of nighttime parameter.
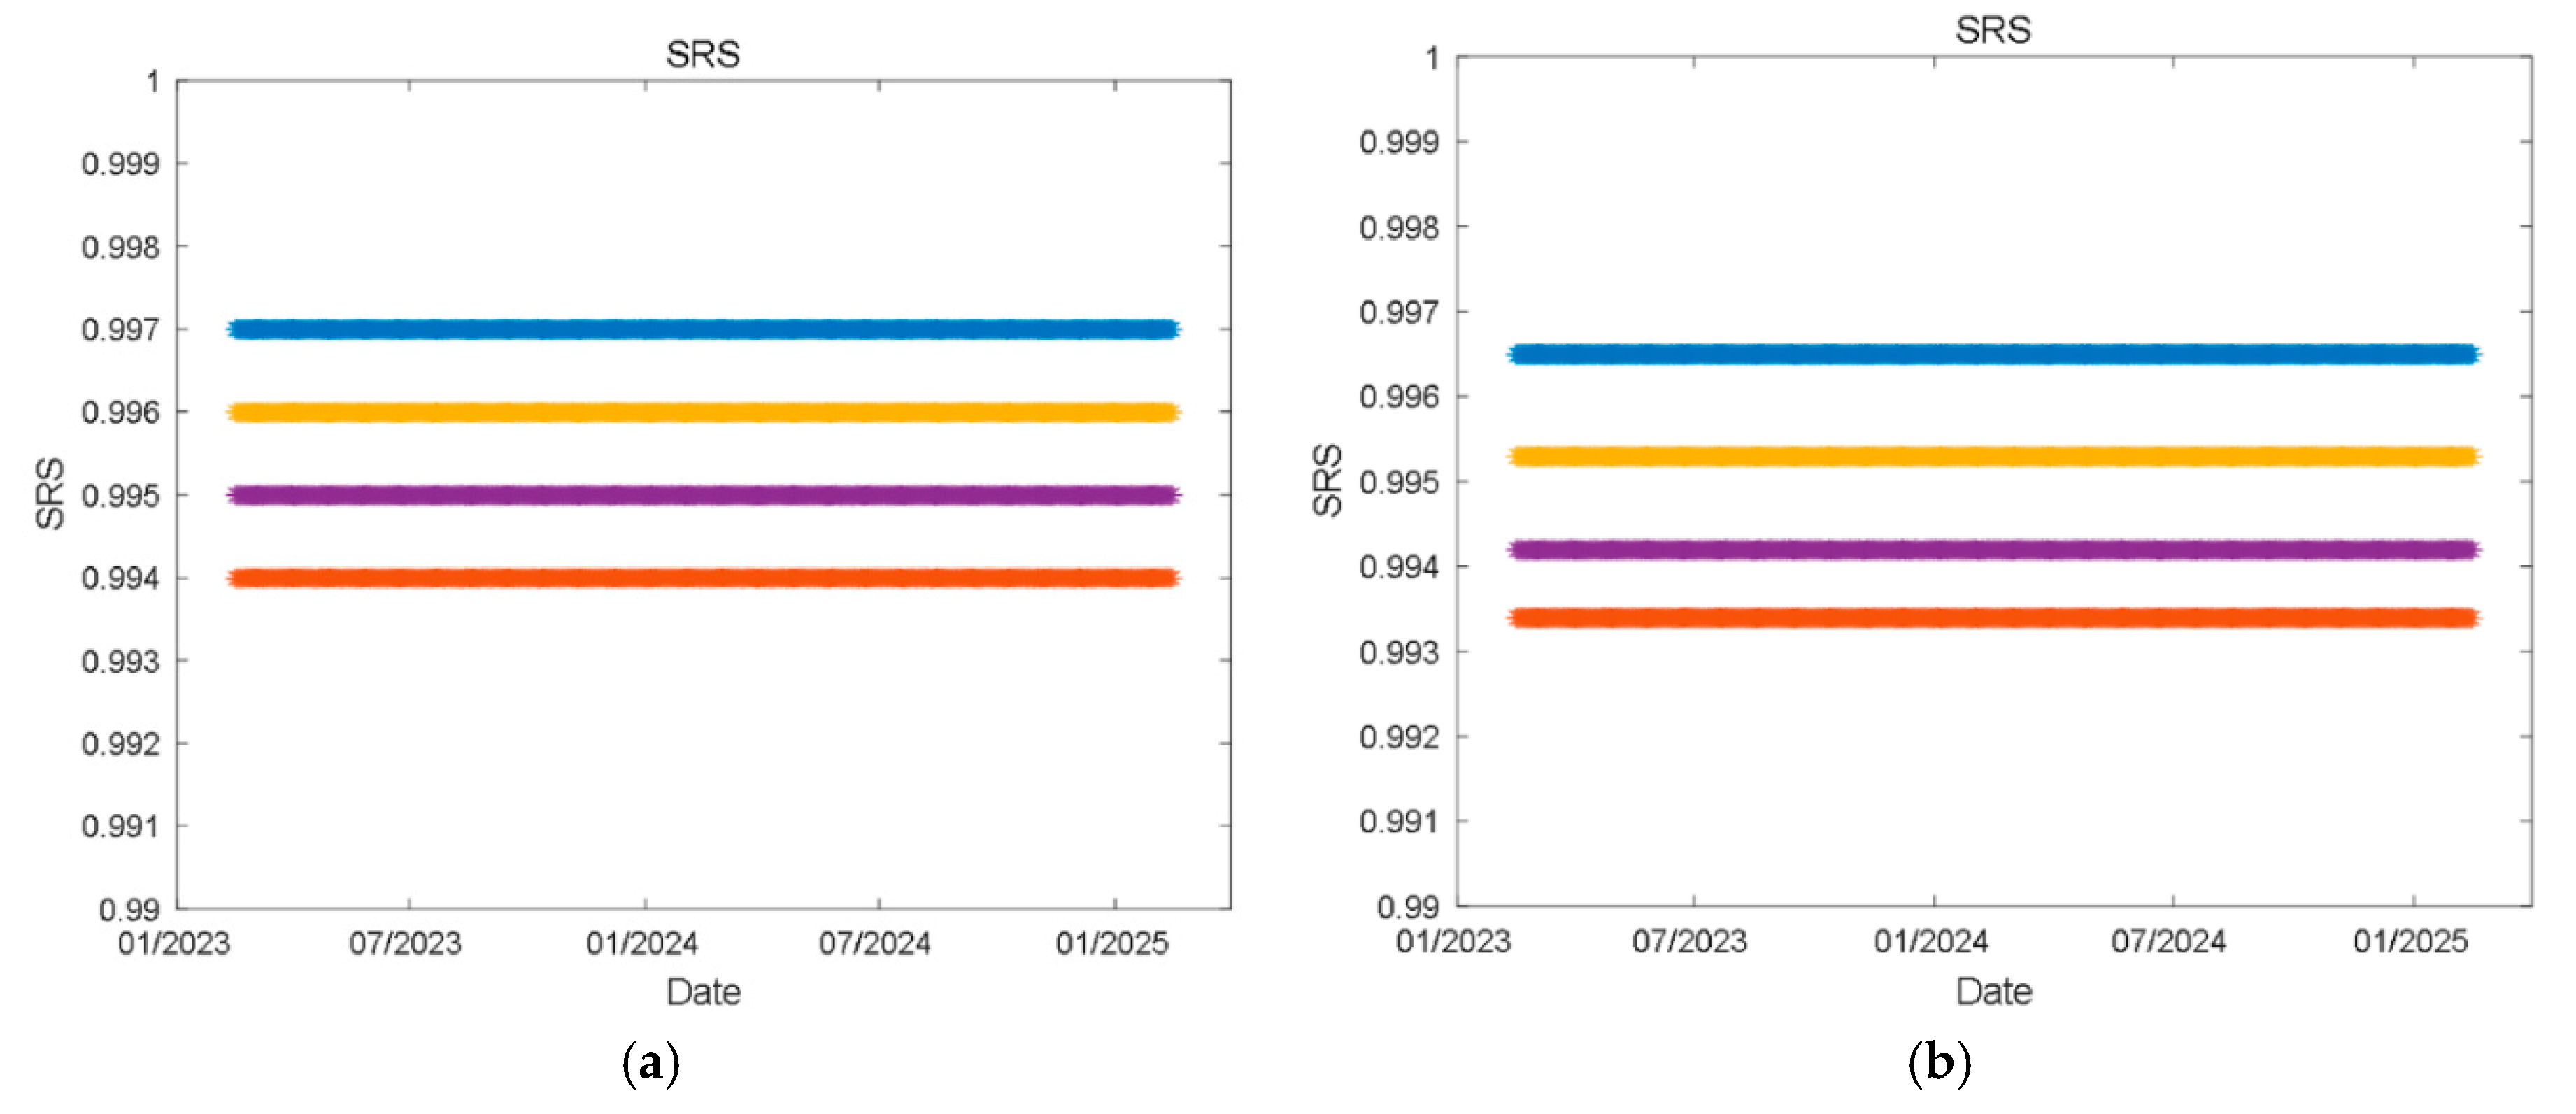
Figure 9.
The test images (a):WTI image at Dachaidan Site. (b):WTI image at Dunhuang Site. (c): WTI image at Golmud Site.
Figure 9.
The test images (a):WTI image at Dachaidan Site. (b):WTI image at Dunhuang Site. (c): WTI image at Golmud Site.
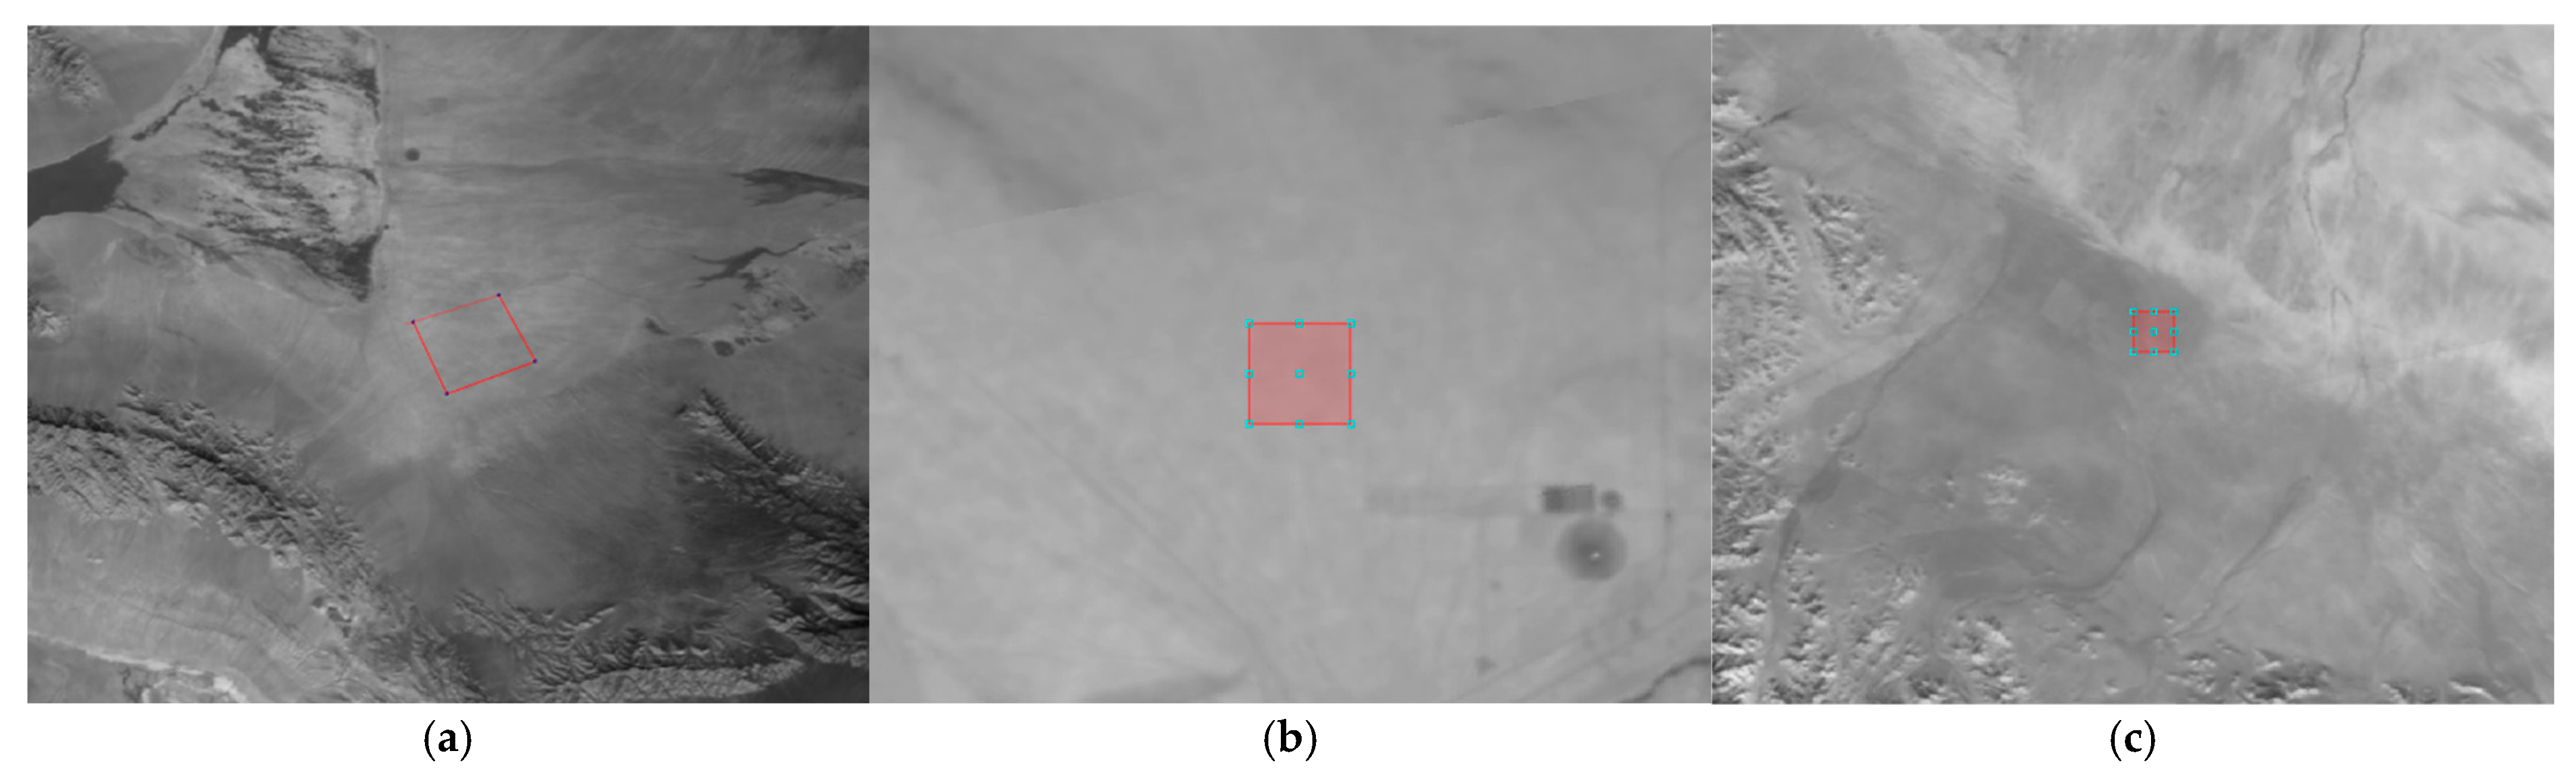
Figure 10.
The comparison curves between ERA5 and measured data.(a):The atmospheric press curves; (b): The water vapor content curves; (c) The temperature curves.
Figure 10.
The comparison curves between ERA5 and measured data.(a):The atmospheric press curves; (b): The water vapor content curves; (c) The temperature curves.
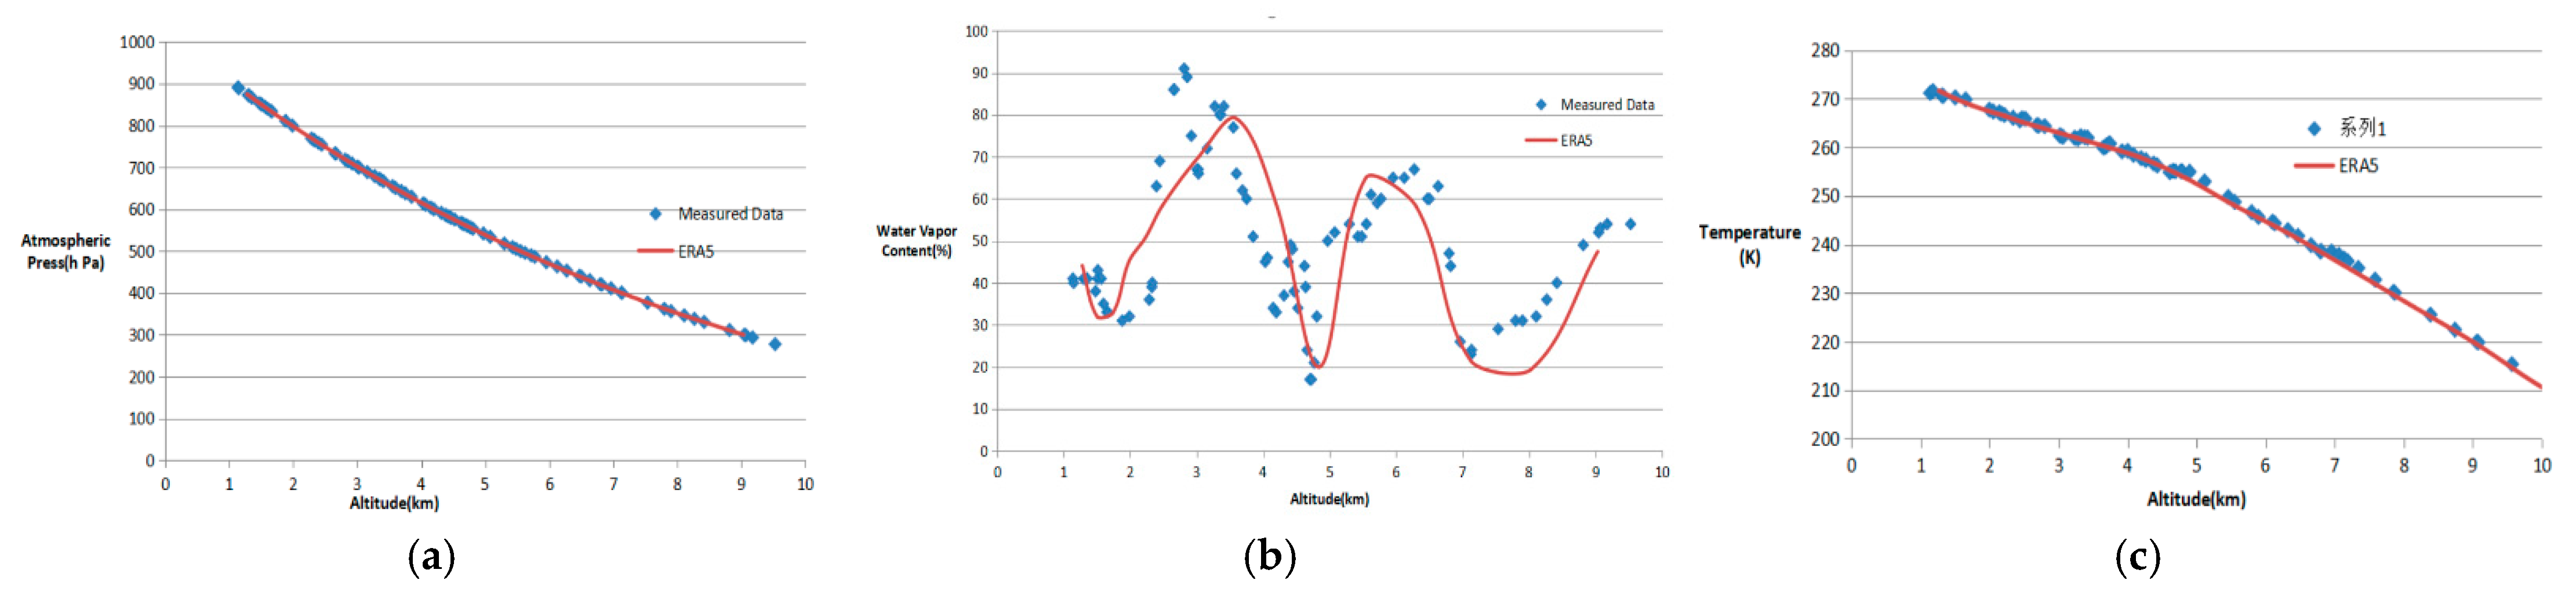
Figure 11.
Calibration Verification Error Distribution. (a) for B1, (b) for B2, (c) for B3, (d) for B4.
Figure 11.
Calibration Verification Error Distribution. (a) for B1, (b) for B2, (c) for B3, (d) for B4.
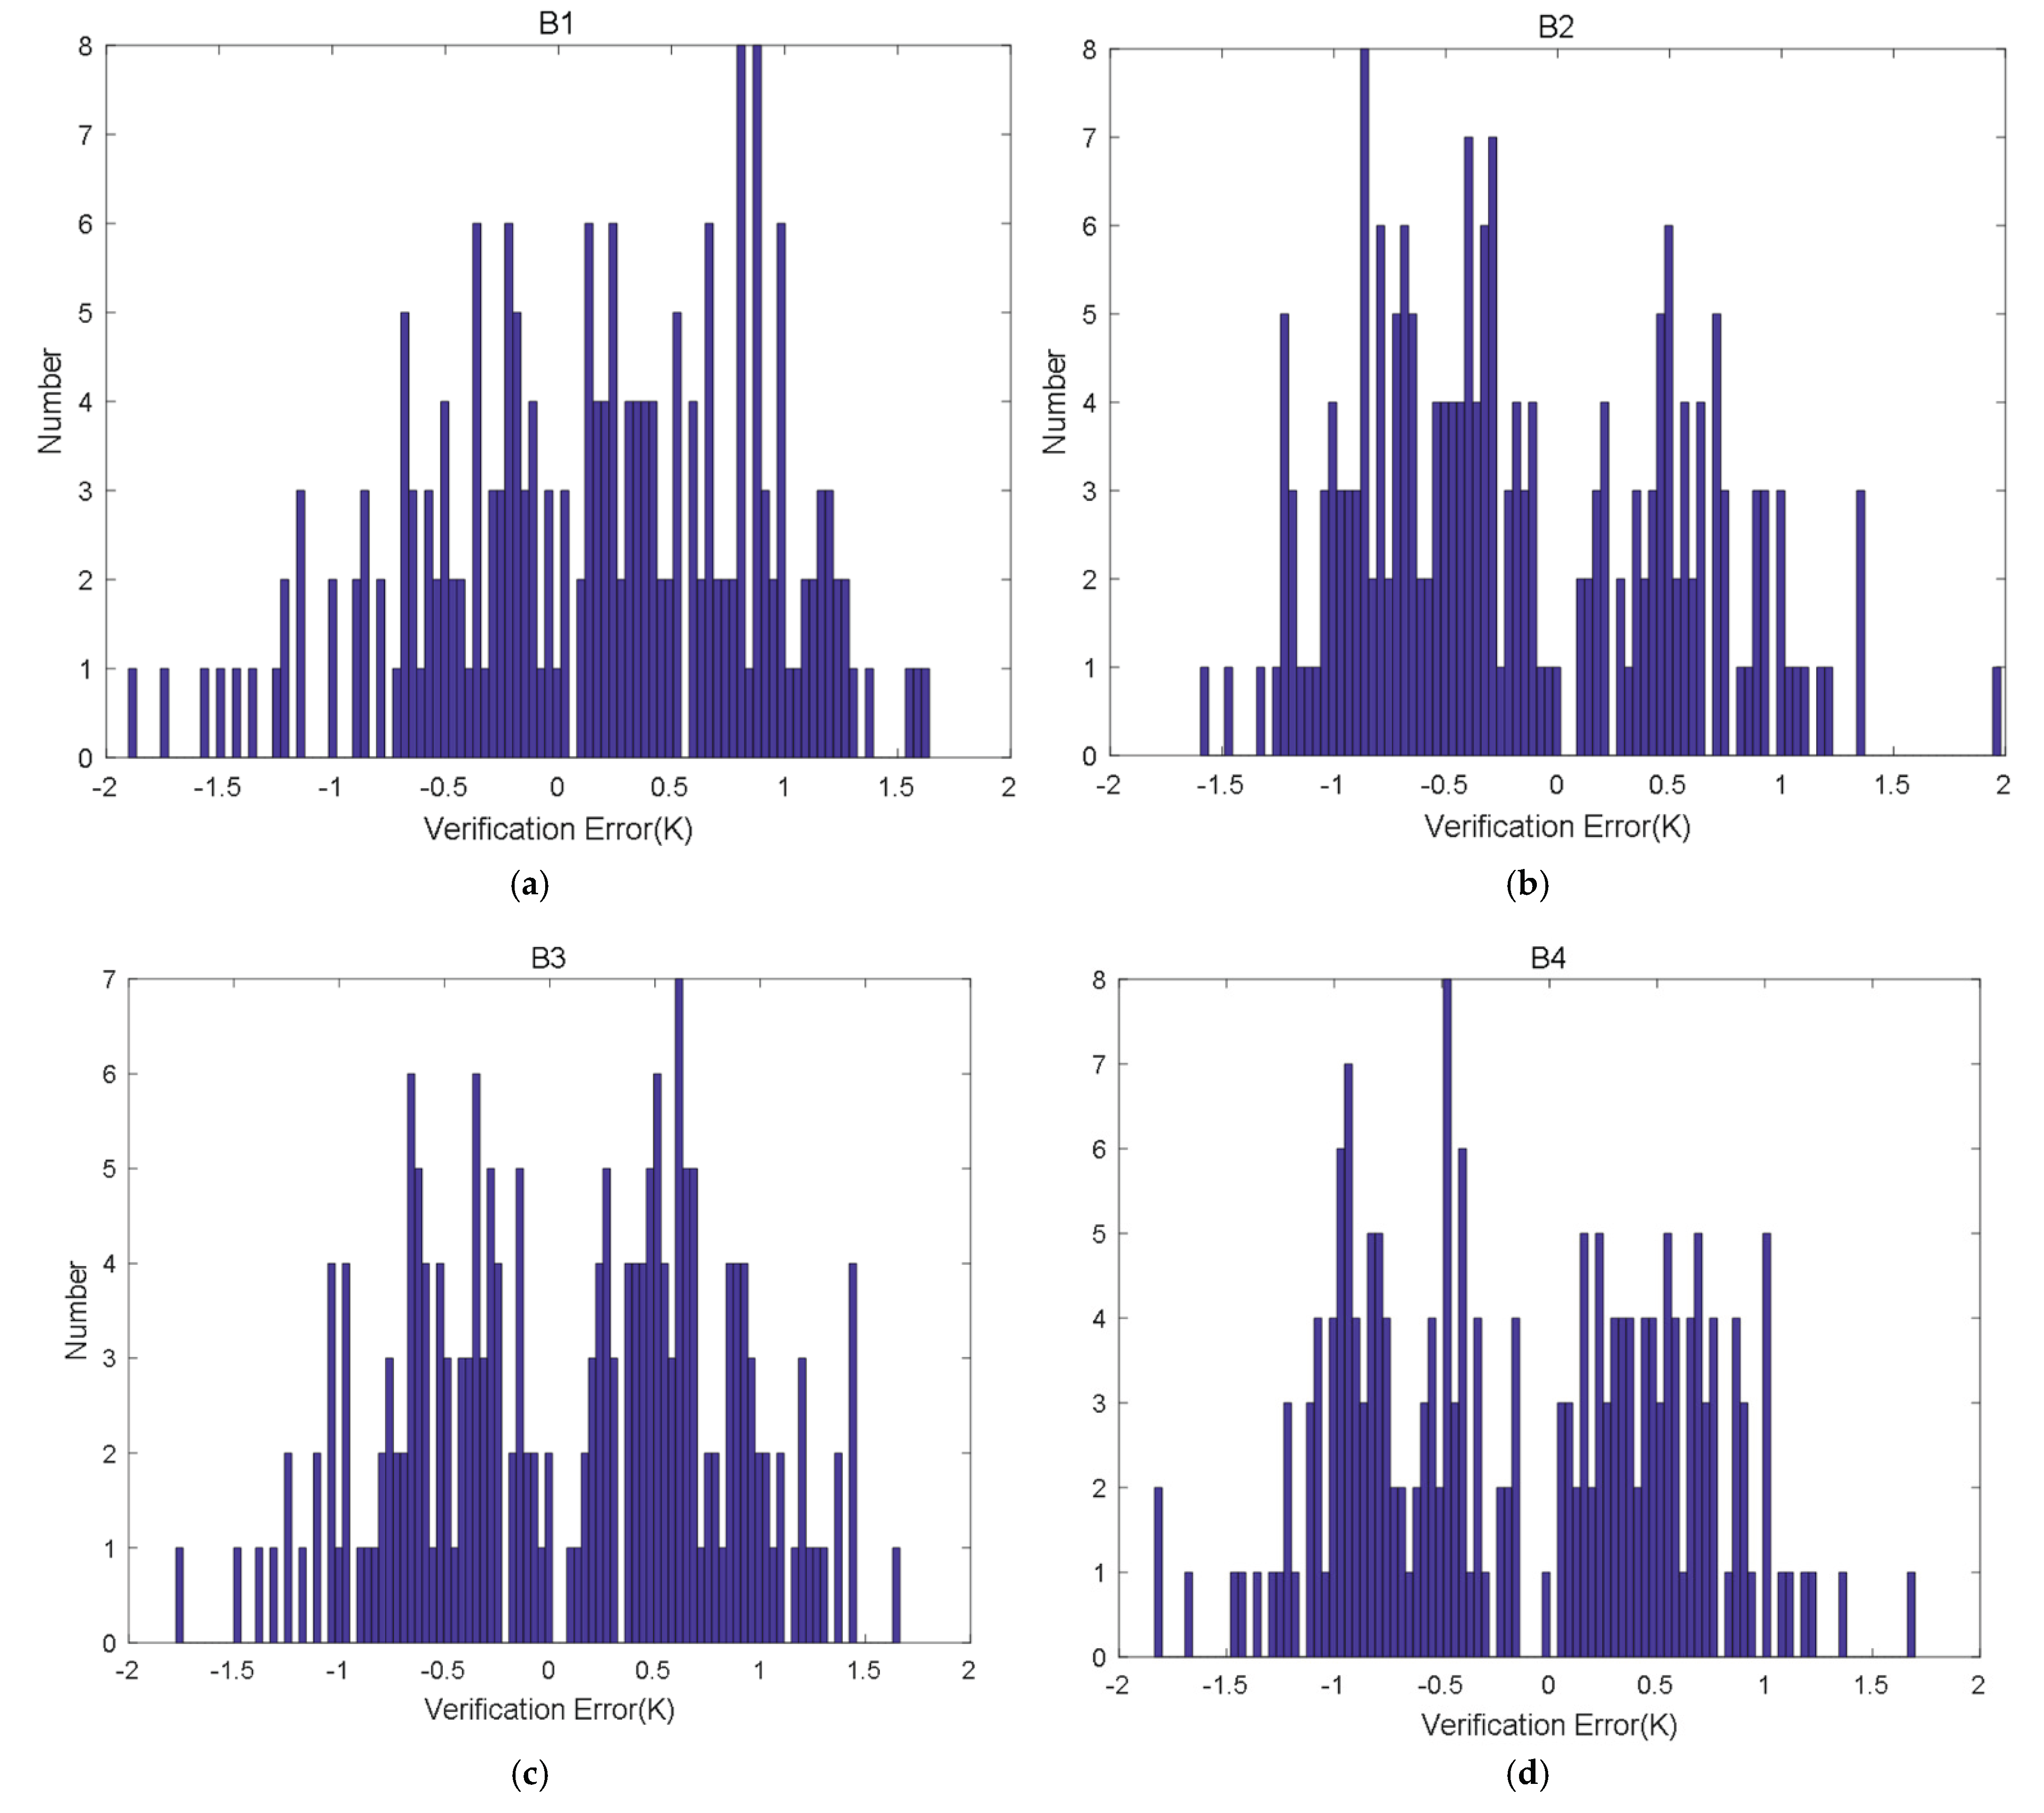
Table 1.
WTI TEBs specifications.
| Nadir Resolution |
Center wavelength | Spectral Range | Dynamic Range | NEDT@300K |
|---|---|---|---|---|
| 100m | 8.20µm | 8.01μm-8.39μm | 200K-340K | 0.1K |
| 100m | 8.63µm | 8.42μm-8.83μm | 200K-340K | 0.1K |
| 100m | 10.80µm | 10.3μm-11.3μm | 200K-340K | 0.1K |
| 100m | 12.00µm | 11.5μm-12.5μm | 200K-340K | 0.1K |
Table 2.
Imaging Parameter (Integration Time and Gain).
| Band | Daytime | Nighttime |
| B1 | 105.6μs,07H | |
| B2 | 100.8μs,07H | 79.2μs,07H |
| B3 | 82.8μs,05H | 72μs,05H |
| B4 | 96μs,05H | 86.4μs,05H |
Table 3.
Comparison of GF-5/ WTI and FY-4B/AGRI Analogous Center Wavelength (CW), Spectral Range, and Spatial Resolution (RES.).
Table 3.
Comparison of GF-5/ WTI and FY-4B/AGRI Analogous Center Wavelength (CW), Spectral Range, and Spatial Resolution (RES.).
| GF-5/ WTI | FY-4B/AGRI | ||||||
| Band | CW | Range | RES. | Band | CW | Range | RES. |
| B1 | 8.20µm | 8.01μm-8.39μm | 100m | B10 | 7.1µm | 6.9~7.3µm | 4km |
| B2 | 8.63µm | 8.42μm-8.83μm | 100m | B11 | 8.5µm | 8.0~9.0µm | 4km |
| B3 | 10.80µm | 10.3μm-11.3μm | 100m | B12 | 10.7µm | 10.3~11.3µm | 4km |
| B4 | 12.00µm | 11.5μm-12.5μm | 100m | B13 | 12.0µm | 11.5~12.5µm | 4km |
Table 4.
The spectral matching factors between WTI and AGRI.
| AGRI B12 | AGRI B13 | AGRI B14 | ||||
| a | b | a | b | a | b | |
| WTI B1 | 1.2854 | 2.4753 | -- | -- | -- | -- |
| WTI B2 | 0.9413 | 0.3278 | -- | -- | -- | -- |
| WTI B3 | -- | -- | 0.9890 | 0.0528 | -- | -- |
| WTI B4 | -- | -- | -- | -- | 0.9909 | 0.0348 |
Table 5.
The value of Sixth-degree polynomial factors to .
| Band | |||||||
| B1 | -6.729e-11 | - 6.785e-10 | 4.197e-07 | 2.695e-06 | - 7.679e-04 | - 2.316e-03 | 9.389E-01 |
| B2 | -2.845e-11 | - 3.156e-18 | 8.284e-08 | 8.501e-15 | - 7.110e-05 | - 4.011e-12 | 9.185E-01 |
| B3 | -8.149e-11 | - 3.595e-18 | 2.675e-07 | 9.460e-15 | - 2.398e-04 | - 5.528e-12 | 9.708E-01 |
| B4 | -4.462e-11 | -2.362e-18 | 1.545e-07 | 7.107e-15 | - 1.643e-04 | -3.845e-12 | 9.758E-01 |
Table 6.
The value of fourth-degree polynomial factors to .
| Band | |||||||
| B1 | 1.229e-10 | 9.059e-09 | - 1.725e-06 | - 2.723e-05 | 4.278e-03 | 1.737e-02 | -4.592e+00 |
| B2 | 1.708e-10 | 4.637e-10 | - 5.040e-07 | - 8.713e-07 | 4.021e-04 | 1.427e-05 | 6.097e-01 |
| B3 | 7.723e-10 | 1.339e-09 | - 2.581e-06 | - 3.409e-06 | 2.313e-03 | 1.202e-03 | -3.201e-01 |
| B4 | 1.821e-10 | 1.907e-18 | - 7.795e-07 | - 3.786e-15 | 1.064e-03 | 1.317e-13 | 9.492e-01 |
Table 7.
The standard deciation, mean vaule of NETD and SRS based on on-board calibraion within two years.
Table 7.
The standard deciation, mean vaule of NETD and SRS based on on-board calibraion within two years.
| Statistical Parameters | NETD(K) | SRS(unitless) | |||||||
| B1 | B2 | B3 | B4 | B1 | B2 | B3 | B4 | ||
| Daytime parameter |
STD | 0.000154 | 0.000200 | 0.000522 | 0.000703 | 0.001% | 0.002% | 0.002% | 0.001% |
| Mean Value | 0.028037 | 0.034024 | 0.053012 | 0.075105 | 99.703% | 99.412% | 99.604% | 99.503% | |
| Nighttime parameter | STD | 0.000127 | 0.000186 | 0.000489 | 0.000565 | 0.001% | 0.002% | 0.002% | 0.001% |
| Mean Value | 0.028015 | 0.029043 | 0.047514 | 0.069322 | 99.649% | 99.339% | 99.530% | 99.419% | |
Disclaimer/Publisher’s Note: The statements, opinions and data contained in all publications are solely those of the individual author(s) and contributor(s) and not of MDPI and/or the editor(s). MDPI and/or the editor(s) disclaim responsibility for any injury to people or property resulting from any ideas, methods, instructions or products referred to in the content. |
© 2025 by the authors. Licensee MDPI, Basel, Switzerland. This article is an open access article distributed under the terms and conditions of the Creative Commons Attribution (CC BY) license (http://creativecommons.org/licenses/by/4.0/).
Copyright: This open access article is published under a Creative Commons CC BY 4.0 license, which permit the free download, distribution, and reuse, provided that the author and preprint are cited in any reuse.


