
Submitted:
16 September 2025
Posted:
16 September 2025
You are already at the latest version
Abstract
Industrial wastewater is a significant source of environmental pollution. This study conducts a life cycle assessment (LCA) of fluoride removal from mineral industry ef-fluents via an electrocoagulation process, incorporating CO₂ derived from biogas for pH regulation and electricity cogeneration. The LCA includes five subsystems: elec-trocoagulation, pH adjustment, sedimentation, pumping, and sludge transport. Three scenarios were evaluated: S1, which employed hydrochloric acid for pH adjustment; S2, which used biogas exclusively for pH regulation and S3, which utilized biogas for both pH control and power generation. The overall environmental impact followed the order S3 < S1 < S2, with S3 achieving approximately a 50% reduction in impact com-pared to S1. Among these, the electrocoagulation unit exhibited the highest environ-mental impact. However, in Scenario 3 (S3), the pH adjustment subsystem demon-strated a net environmental benefit due to extra electricity generation. Furthermore, the valorization of electrocoagulation sludge as a raw material for bricks contributed to additional impact reduction. Sludge reuse was implemented in all scenarios. Human health was the most affected category, with primary contributors including human non-carcinogenic and carcinogenic toxicity, global warming potential, marine ecotoxi-city, and fine particulate matter formation. The findings underscore the environmental advantages of biogas integration and sludge valorization in industrial wastewater treatment.
Keywords:
ReCiPe Endpoint
; pH regulator
; energy cogeneration
; mineral wastewater
; CO2 capture
; electrocoagulation
1. Introduction
Industrial fluoride-containing wastewater significantly contributes to the pollution of groundwater, surface water bodies, and soil, with substantial adverse environmental impacts [1,2]. Fluoride concentrations in industrial effluents are often substantially higher than in natural waters, ranging from 10 to 6,500 mg·L⁻¹ [3,4,5,6,7]. These effluents typically originate from the production of niobium(hydrofluoric acid is used as activator in flotation) and phosphates (fluorapatite bearing) ores processing, aluminum fluoride, semiconductors, fertilizers, glass industries and from the production of high-strength and superconducting metal alloys [8,9]. Chronic exposure to fluoride concentrations above 2 mg·L⁻¹ can lead to dental fluorosis and, in severe cases, skeletal fluorosis, osteoporosis, arthritis, male infertility, Alzheimer’s disease, and damage to the liver, kidneys, or parathyroid gland [10,11,12].
The impact of fluoride in human health is well known [1,2,3,4,5,6,7,8,9,10,11,12,13]. Under chronic fluoride exposure at 100 ppm, the highest accumulation was observed in the liver, followed by the kidneys and heart. This distribution was associated with significant biochemical alterations, including elevated plasma levels of dehydrogenase, aminotransferases, kidney injury molecule-1 (KIM-1), and other renal biomarkers, together with a reduction in total plasma proteins and albumin. The findings demonstrate that fluoride accumulation exerts concentration-dependent hepatotoxic, nephrotoxic, and cardiotoxic effects, underscoring the substantial health risks posed by chronic fluoride intake in endemic areas [13].
Various technologies have been applied to adjust fluoride concentrations to acceptable levels for discharge or human consumption [14]. From them, electrocoagulation (EC) has proved to be particularly effective for both drinking water and industrial wastewater treatment [15,16,17,18,19,20,21,22,23]. EC offers several advantages such as simple and compact design, ease of automation, no need for chemical additives, quick operation, and minimal sludge production [24,25]. However, pH control is a critical factor in EC-based fluoride removal. This is because effective formation of Al(OH)₃, a key agent in the process, depends on pH and is favored in the pH range of 6–8 [7,26]. This commands the use of pH regulators to maintain the optimal pH range during the treatment.
From another side, CO2 capture systems from flue gases and other systems have a potential effect on reducing impacts on climate change. Various technologies have been developed to capture CO2 from flue gases and other sources, each one with distinct advantages and limitations. These technologies include absorption, adsorption, membrane separation, cryogenic distillation, and electrochemical processes [27]. The effectiveness of these systems in reducing emissions and their potential to mitigate climate change varies based on their application, cost, and efficiency. In this paper, it is addressed the use of CO₂ for pH control, as an alternative to traditional acids such as HCl or H₂SO₄, avoiding introducing chloride or sulfate ions into the treated water and contributing to reduce CO2 emissions. Control of pH is crucial for enhancing CO2 absorption in water, as it facilitates the conversion of CO2 into bicarbonate (HCO3−). Absorption must be carried out at optimal pH to get maximum efficiency. This method may be particularly beneficial for smaller plants that emit limited amounts of CO2, as it does not require extensive transport and storage infrastructure [28]. Considering the high content of CO2 in biogas (35-40% in vol), and the need to separate it from methane (55-60% in vol) [w], integrating biogas into the treatment process, can contribute to reducing greenhouse gas emissions and reduce the CO2 impact on environment. In a previous work, the separation of CO₂ from biogas produced in anaerobic biodigesters allowed its separation from methane, enhancing its use for energy generation [29].
Evaluation of the environmental performance of fluoride treatment processes may be done by Life Cycle Assessment (LCA) tools [33,34]. providing a comprehensive assessment of environmental burdens, related to material and energy inputs. This has been widely applied to assess and compare wastewater treatment technologies [34,36,37,38,39]. LCA methodologies have also evolved to access associated toxicity impacts on human health and ecosystems [34,40]. Despite many studies on fluoride removal by electrocoagulation [15,16,17,18,19,20,21,22,23,24,25,26], LCA applied specifically to the fluoride electrocoagulation (EC) are scarce. The environmental performance comparing two technologies for removing arsenic (As3⁺) and fluoride (F⁻) from groundwater is presented in literature [41]. |They used the GaBi software with midpoint methods (CML 2001 and TRACI) and report that, compared to adsorption, EC is identified as a more sustainable and cost-effective option for community-level groundwater treatment.
On the other hand, LCA also accounts for indirect environmental impacts, such as those related to the production of fuels and energy used in effluent treatment processes [36]. Using renewable energy to power EC systems can mitigate concerns related to greenhouse gas emissions associated with fossil-based electricity [42,43]. The electrocoagulation (EC) process produces sludge with significant potential for resource recovery and environmental sustainability. The valorization of EC-generated sludge offers potential for waste minimization and further impact reduction [44]. Potential applications of this sludge containing fluorides can be cited, as in construction materials [45,46)], as adsorbents [47,48,49], and as active corrosion inhibitors for aluminum [50]. Nevertheless, challenges related to energy consumption and electrode stability remain and must be addressed to optimize the process for widespread use.
In the context of fluoride-containing wastewater treatment by electrocoagulation, where strict pH control is required and reducing CO₂ emissions is a priority, this study applies the LCA methodology to evaluate the environmental impacts of different pH control strategies in a full-scale electrocoagulation plant. The three strategies considered are: (i) pH adjustment using hydrochloric acid (HCl), (ii) pH regulation with biogenic CO₂ derived from biodigester-sourced biogas, and (iii) combined use of biogenic CO₂ for pH regulation together with methane-enriched biogas for electricity generation
Description of system and conditions
2.1. LCA methodology
The LCA methodology defined by the ISO 14040:2006 series [35,51] was applied in this study. LCA modeling and impact estimation were performed using SimaPro® 9.1. This software was selected because it provides access to multiple databases and impact assessment methods, along with a robust graphical interface that facilitates the identification of the processes with the greatest impacts [52]. The ReCiPe 2016 v1.1 endpoint method was applied to estimate the environmental impacts of wastewater treatment. The Egalitarian (E) perspective was selected, as it is the most precautionary approach, accounting for the longest time horizon and including impact categories that are not yet fully established, but for which preliminary evidence exists [53,54]. ReCiPe allows choosing to use midpoint indicators or endpoint indicators. Each method has been created from three different perspectives.
The endpoint method deals with human health, natural resources and the environment and offers long-term environmental impacts associated with uncertainty compared to the midpoint analysis. The global environmental impact is the weighted sum of endpoint damages to human health, ecosystems, and resources, providing a single overall indicator of environmental burden [55].
2.2. Goal and scope of the study
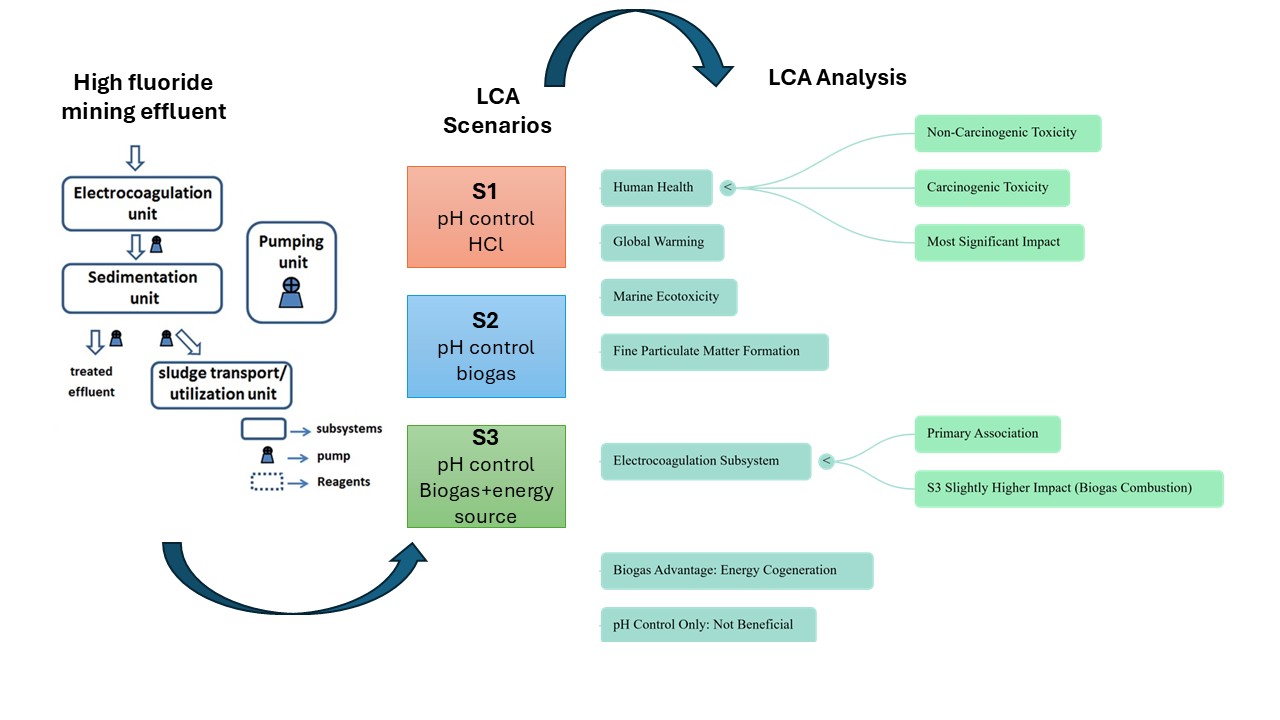
The functional unit for the electrocoagulation process was defined as 1 m3 of treated effluent [56], with a final fluoride concentration of less than 10 ppm. The process was divided into 5 subsystems (Figure 1): electrocoagulation unit, pH control unit, sedimentation unit, pumping, and waste transport.
Three different scenarios (Table 1) were evaluated. In scenario S1 HCl was used to control the pH while in scenarios S2 and S3, CO2 biogas was applied. Additionally, in scenario S3, after pH control the residual gas was used to produce electrical energy. The generated energy was reused in the system. The “Gate-to-Gate” methodology was considered, that is, starting with the collection of effluent and ending with its discharge.
2.3 Life Cycle inventory (LCI)
Experiments were carried out on a lab scale according to schematic setup shown in Figure 2. The biodigester used in this study (Homebiogas) was fed with 5kg of corn straw, able to produce about 700L of biogas per week. The biogas (50.1% CO2, 47.9% CH4, 0.8% O2, 40ppm CO, and 7ppm H2S) was analyzed by a gas analyzer Landtec GEM5000. For comparative purposes, experiments were also carried out using acid for pH control.
Energy spent, wear of aluminum plates, volume of gas or acid, residual fluoride concentration, among others, were collected from experiments and computed as a function of the volume of treated effluent. More information can be found on [30].
From experimental and literature data [30] an electrocoagulation unit of 23 m3/day was designed, as well as the measurement of pumping energy expenditure [57]. The unit shown in Figure 3 also includes solid-liquid separation by sedimentation.
The sludge generated in the process is stored in a stockpile, collected and transported to a brick factory. The inputs used in the structural part of the project, as well as the spending during use, such as aluminum, energy and reagents, are shown in tables 2 – 6, divided into subsystems as described in item 2.2.
A real stream from mining industry with the characteristics shown in Table 2 was used in this study. According to the Brazilian guidelines [58] the residual fluoride in a treated effluent cannot exceed 10mg.L-1. After treatment, the effluent presented 7.9-10.3 mg.L-1 of fluoride with a pH of 6.5-7.1 thus complying with the regulation [30].
2.4. Electrocoagulation
The electrocoagulation unit of 1x1x0.8m3 was built in polyethylene structure, pointed by Rech [41], for better economic viability, long durability and low cost compared to other materials. Energy expenditures and aluminum plates were obtained experimentally, as mentioned above. In scenario S3, the energy generated by biogas was allocated to the process and the excess was accounted for as output in the system. Data are shown in Table 3.
2.5. Sedimentation unit
The costs of inputs and energy with the structure and operation of the sedimentation unit were estimated based on the study of Cashman et al. [59], presented in Table 4. The sedimentation unit of concrete and steel frame structures supported the polyethylene apparatus and stirring system. For all scenarios, the output of effluent treated to 10mg.L-1 of fluoride was considered, including the other parameters shown in Table 2, except for COD (Chemical oxygen demand) and aluminum.
2.6. pH adjustment unit
The pH adjustment unit is composed by 200L polyethylene barrel and receives the controlling-pH reagents (Table 5). As mentioned earlier, in scenarios S2 and S3, biogas was injected into the effluent for pH control. According to Nigri et al. [30], only the CO2 reacts with the effluent reducing the pH. Methane content in biogas increases due to CO2 removal, which benefits the energy generation process.
The consumption of CO2 of 5.31kg.m-3 was obtained by modeling the system using the geochemical software PHREEQC, Version 3.4.0.1 2927 (llnl.dat), for a closed system. Furthermore, the energy capacity of gas after pH control can be increased by the generation of hydrogen in the electrocoagulation process. For scenario S2, the output of methane (1,894kg.m-3) was allocated to the atmosphere, regarding the consumption of CO2 in the process. Considering that biogas can generate 8.25kWh.m-3as pointed by Dalpaz [60], and a 40% yield due to losses in the collection and in the process of obtaining electricity, the energy generated by the volume of gas spent in the process was 17.81kWh.m-3. In scenario S3 the biogas was converted into electrical energy that was used in the process.
2.7. Pumping unit
2.8. Transport and use of sludge
The sludge removed from the sedimentation unit is conditioned in an open-air place to reduce its humidity. The sludge was transported 40.5 km from the storage area to the brick factory with a moisture content of 20%. In the adopted project, the sludge replaces 10% of mass compounds used in the production of bricks [45]. Thus, at this stage, the clay that will be replaced by the sludge is considered as an output (Table 7).
2.9. System constraints and uncertainties
This study simplifies the environmental impact assessment by considering selected constraints: installing the electrocoagulation unit, wiring and electrical systems, pumps, sludge removal and transport, disposal from the treatment unit, and used HCl transport. Biogas production impacts were modeled in SimaPro® as Biogas (CH) from grass – APOS, S. Aluminum plate exchange was excluded, and outdoor storage of sludge incurred no energy or moisture loss costs.
The parameters for obtaining an effluent with a fluoride concentration below 10 mg/L, such as cathode consumption and energy expenditure were obtained from laboratory scale and estimated for a full-scale unit, which can cause some degree of variation. The amount of biogas used in the process, and consequently the CO2 consumed, were estimated by simulation in PHREEQC software. A yield of 40% was considered, including the process of obtaining electricity. However, the actual value depends on the generator used and the efficiency of capturing the gas, which was not carried out in this study. The variation of 7.9-10.3mg.L-1 in fluoride concentration with a pH variation of 6.5-7.1 was considered.
Results and Discussion
3.1. Environmental impacts assessed by scenario
The life cycle environmental impacts of the three scenarios were assessed using the ReCiPe Endpoint Method (E) and are shown in Figure 4. In general, the environmental impact presented in scenario S3 (6,37 Pt) was lower than S1 (12,52 Pt) and S2 (13,09 Pt) mainly due to the use of biogas for pH control and electricity co-generation. Scenario S2 shows the largest environmental impact even with biogas as a pH regulator. This means that exclusive substitution of HCl for biogas was not beneficial, even though this origin from biomass residues. Perhaps, this increment on the impact evaluation comes from the release of methane and carbon dioxide into the environment. Furthermore, the impact on human health was the most significant compared to the impacts generated using natural resources and caused to ecosystems.
In general, the fluoride removal process by electrocoagulation had a negative environmental impact, even though the use of biogas for electric energy co-generation and the use of sludge in the production of bricks. It was observed a reduction in the overall score from 12.5 (S1), commonly used, to 6.4 (S3), when biogas was used, i.e., 50% lower environmental impact. The use of sludge in brick production was constant across all scenarios, so further consideration of this factor was unnecessary.
The individual impacts across 22 categories (in percentages) were assessed with the ReCiPe midpoint method, as shown in Figure 5. Scenario S3 had the lowest overall environmental impact but showed a drawback in stratospheric ozone depletion. Its primary benefit is converting biogas into electrical energy for process use, with additional surplus generation.
Figure 6 compares environmental impacts by category and normalized score. The main impacts from fluoride removal were human non-carcinogenic and carcinogenic toxicity, global warming, human health, marine ecotoxicity, and fine particulate formation. Scenario 3 had the lowest environmental impact.
Among the subsystems evaluated (electrocoagulation unit, pH adjustment unit, sedimentation unit, pumping unit, and sludge transport unit), the electrocoagulation unit exhibits the greatest environmental impact. Conversely, in scenario S3 (Figure 7), the pH adjustment unit demonstrates a net negative impact, attributed to electricity generation from biogas.
3.2. Environmental impacts by subsystems
Figure 8 shows the individual impacts. Scenario S3 has the greatest environmental impact, likely because of differences in electrical energy sources. Since Brazil’s energy mainly comes from hydroelectric power, its impact is lower than biogas, which emits CO2 directly.
In the analysis of the pumping and sedimentation subsystems (Figure 9), the processes differ only in their sources of electrical energy. Electricity derives from biogas combustion, which releases CO2 and other gases associated with human non-carcinogenic and carcinogenic toxicity as well as terrestrial ecotoxicity. These effects are reduced when electricity is produced by a hydroelectric power plant.
Figure 10 illustrates the adverse environmental impacts associated with employing biogas for electricity generation and pH adjustment subsystems. This outcome is attributed to the excess electricity produced in scenario S3. It should be noted that employing biogas exclusively for pH adjustment results in a higher environmental impact (S2) compared to conducting pH adjustment with acid (S1). In the sludge transport and utilization subsystem (Figure 11), a negative environmental effect has been identified when electrocoagulation waste is used as an input for brick production [45]. Additionally, there were no significant differences observed among these scenarios; the environmental impacts remained consistent across S1, S2, and S3 within the scope of this study.
4. Conclusions
Using biogas-derived CO₂ for cogeneration reduced environmental impacts from 12.52 Pt (S2) to 6.37 Pt (S3). In contrast, using biogas solely for pH adjustment (S2) increased impacts compared with traditional hydrochloric acid (S1). The main contributions, particularly toxicity, global warming potential, marine ecotoxicity, and particulate matter formation were associated with the electrocoagulation subsystem. Although S3 showed slightly higher impacts in these categories due to biogas combustion, this was offset by the energy gains and sludge reuse. Overall, the results indicate that biogas utilization provides environmental benefits primarily when applied to cogeneration, rather than as a substitute for HCl. Among all impact categories, effects on human health were the most pronounced.
Acknowledgements
The authors acknowledge the Brazilian research funding agencies CAPES for the postdoctoral scholarship, CNPq (Process 308044/2018-5), and FAPEMIG for financial support. The authors also thank SimaPro® for providing the academic free license.
References
- Santhi, V.M.; Periasamy, D.; Perumal, M.; Sekar, P.M.; Varatharajan, V.; Aravind, D.; Senthilkumar, K.; Kumaran, S.T.; Ali, S.; Sankar, S.; Vijayakumar, N.; Boominathan, C.; Krishnan, R.S. The global challenge of fluoride contamination: A comprehensive review of removal processes and implications for human health and ecosystems. Sustainability 2024, 16, 11056. [Google Scholar] [CrossRef]
- Ahmad, S.; Singh, R.; Arfin, T.; Neeti, K. Fluoride contamination, consequences and removal techniques in water: A review. Environmental Science: Advances 2022, 1, 620–661. [Google Scholar] [CrossRef]
- Reardon, E.J.; Wang, Y. A limestone reactor for fluoride removal from wastewaters. Environmental Science & Technology 2000, 34, 3247–3253. [Google Scholar] [CrossRef]
- de Luna, M.D.G.; Warmadewanthi; Liu, J. C. Combined treatment of polishing wastewater and fluoride-containing wastewater from a semiconductor manufacturer. Colloids and Surfaces A: Physicochemical and Engineering Aspects 2009, 347, 64–68. [Google Scholar] [CrossRef]
- Chiu, T.C.; Huang, H.-C.; Chen, L.J. Treatment of semiconductor wastewater by dissolved air flotation. Journal of Environmental Engineering 2002, 128, 974–980. [Google Scholar] [CrossRef]
- Drouiche, N.; Ghaffour, N.; Aoudj, S.; Hecini, M.; Ouslimane, T. Fluoride removal from photovoltaic wastewater by aluminium electrocoagulation and characteristics of products. Chemical Engineering Transactions 2009, 17, 1651–1656. [Google Scholar] [CrossRef]
- Ezzeddine, A.; Bedoui, A.; Hannachi, A.; Bensalah, N. Removal of fluoride from aluminum fluoride manufacturing wastewater by precipitation and adsorption processes. Desalination and Water Treatment 2015, 54, 2280–2292. [Google Scholar] [CrossRef]
- Khatibikamal, V.; Torabian, A.; Janpoor, F.; Hoshyaripour, G. Fluoride removal from industrial wastewater using electrocoagulation and its adsorption kinetics. Journal of Hazardous Materials 2010, 179, 276–280. [Google Scholar] [CrossRef] [PubMed]
- Toyoda, A.; Taira, T. A new method for treating fluorine wastewater to reduce sludge and running costs. IEEE Transactions on Semiconductor Manufacturing 2000, 13, 305–309. [Google Scholar] [CrossRef]
- Harrison, P.T.C. Fluoride in water: A UK perspective. Journal of Fluorine Chemistry 2005, 126, 1448–1456. [Google Scholar] [CrossRef]
- Tripathy, S.S.; Bersillon, J.-L.; Gopal, K. Removal of fluoride from drinking water by adsorption onto alum impregnated activated alumina. Separation and Purification Technology 2006, 50, 310–317. [Google Scholar] [CrossRef]
- Xiong, X.; Liu, J.; He, W.; Xia, T.; He, P.; Chen, X.; Yang, K.; Wang, A. Dose–effect relationship between drinking water fluoride levels and damage to liver and kidney functions in children. Environmental Research 2007, 103, 112–116. [Google Scholar] [CrossRef]
- Sharma, P.; Verma, P.K.; Sood, S.; Singh, M.; Verma, D. Impact of chronic sodium fluoride toxicity on antioxidant capacity, biochemical parameters, and histomorphology in cardiac, hepatic, and renal tissues of Wistar rats. Biological Trace Element Research 2022, 200, 229–241. [Google Scholar] [CrossRef]
- Sun, Y.; Zhang, C.; Ma, J.; Sun, W.; Shah, K.J. Review of fluoride removal technology from wastewater environment. Desalination and Water Treatment 2023, 299, 90–101. [Google Scholar] [CrossRef]
- Mameri, N.; Yeddou, A.R.; Lounici, H.; Belhocine, D.; Grib, H.; Bariou, B. Defluoridation of septentrional Sahara water of North Africa by electrocoagulation process using bipolar aluminium electrodes. Water Research 1998, 32, 1604–1612. [Google Scholar] [CrossRef]
- Guzmán, A.; Nava, J.L.; Coreño, O.; Rodríguez, I.; Gutiérrez, S. Arsenic and fluoride removal from groundwater by electrocoagulation using a continuous filter press reactor. Chemosphere 2016, 144, 2113–2120. [Google Scholar] [CrossRef]
- Drondina, R.V.; Drako, I.V. Electrochemical technology of fluorine removal from underground and waste waters. Journal of Hazardous Materials 1994, 37, 91–100. [Google Scholar] [CrossRef]
- Yang, C.-L.; Dluhy, R. Electrochemical generation of aluminum sorbent for fluoride adsorption. Journal of Hazardous Materials 2002, 94, 239–252. [Google Scholar] [CrossRef] [PubMed]
- Shen, F.; Chen, X.; Gao, P.; Chen, G. Electrochemical removal of fluoride ions from industrial wastewater. Chemical Engineering Science 2003, 58, 987–993. [Google Scholar] [CrossRef]
- Emamjomeh, M.M.; Sivakumar, M. An empirical model for defluoridation by batch monopolar electrocoagulation/flotation (ECF) process. Journal of Hazardous Materials 2006, 131, 118–125. [Google Scholar] [CrossRef]
- Zhu, J.; Zhao, H.; Ni, J. Fluoride distribution in electrocoagulation defluoridation process. Separation and Purification Technology 2007, 56, 184–191. [Google Scholar] [CrossRef]
- Tezcan Un, U.; Koparal, A.S.; Ogutveren, U.B. Fluoride removal from water and wastewater with a batch cylindrical electrode using electrocoagulation. Chemical Engineering Journal 2013, 223, 110–115. [Google Scholar] [CrossRef]
- Sandoval, M.A.; Fuentes, R.; Nava, J.L.; Rodríguez, I. Fluoride removal from drinking water by electrocoagulation in a continuous filter press reactor coupled to a flocculator and clarifier. Separation and Purification Technology 2014, 134, 163–170. [Google Scholar] [CrossRef]
- Yetilmezsoy, K.; Dehghani, M.H.; Saeedi, R.; Dalvand, A.; Heibati, B.; Askari, M.; Alimohammadi, M.; McKay, G. Elimination of natural organic matter by electrocoagulation using bipolar and monopolar arrangements of iron and aluminum electrodes. International Journal of Environmental Science and Technology 2017, 14, 2125–2134. [Google Scholar] [CrossRef]
- Garg, U.K.; Sharma, C.; Garg, U.K. Electrocoagulation: Promising technology for removal of fluoride from drinking water—A review. Biological Forum 2016, 8, 248–254. Available online: http://www.researchtrend.net (accessed on 18 March 2019).
- Nigri, E.; Santos, A.; Rocha, S. Electrocoagulation associated with CO₂ mineralization applied to fluoride removal from mining industry wastewater. Desalination and Water Treatment 2021, 209, 58–70. [Google Scholar] [CrossRef]
- Astuti, A.R.A.; Mutiara, S.; Saputera, N. Advances in carbon control technologies for flue gas: A step towards sustainable industrial CO₂ capture. International Journal of Greenhouse Gas Control 2024, 123, 103587. [Google Scholar] [CrossRef]
- Beiron, J.; Normann, F.; Kristoferson, L.; Strömberg, L.; Gardarsdóttir, S.Ö.; Johnsson, F. Enhancement of CO₂ absorption in water through pH control and carbonic anhydrase—A technical assessment. Industrial & Engineering Chemistry Research 2019, 58, 14275–14283. [Google Scholar] [CrossRef]
- Werkneh, A.A. Biogas impurities: Environmental and health implications, removal technologies and future perspectives. Heliyon 2022, 8, e10929. [Google Scholar] [CrossRef]
- Ahangarnokolaei, R.; Rahmanian, N.; Ramezani, M.; Khataee, A. Environmental performance of electrocoagulation and ozonation for wastewater treatment: A life cycle assessment approach. Journal of Environmental Management 2021, 287, 112345. [Google Scholar] [CrossRef]
- Choudhary, N.; Singh, P.; Kumar, R.; Gupta, S. Life cycle assessment of electrocoagulation processes: Energy consumption and global warming potential. Journal of Cleaner Production 2023, 408, 137137. [Google Scholar] [CrossRef]
- Li, Y.; Zhang, H.; Chen, Q.; Wang, J. Performance of aluminum electrodes in electrocoagulation for removal of heavy metals and phosphorus. Chemosphere 2024, 351, 139876. [Google Scholar] [CrossRef]
- Zailani, S.; Zin, R.M. Electrocoagulation for wastewater treatment: Influence of electrode material and process parameters. Environmental Technology & Innovation 2018, 10, 123–131. [Google Scholar] [CrossRef]
- Li, Y.; Zhang, S.; Zhang, W.; Xiong, W.; Ye, Q.; Hou, X.; Wang, C.; Wang, P. Life cycle assessment of advanced wastewater treatment processes: Involving 126 pharmaceuticals and personal care products in life cycle inventory. Journal of Environmental Management 2019, 238, 442–450. [Google Scholar] [CrossRef] [PubMed]
- ISO. ISO 14040:2006. Environmental Management—Life Cycle Assessment—Principles and Framework, 2nd ed.; International Organization for Standardization: Geneva, Switzerland, 2006; Available online: https://www.iso.org/standard/37456.html (accessed on 15 September 2025).
- Pell, R.; Tijsseling, L.; Palmer, L.W.; Glass, H.J.; Yan, X.; Wall, F.; Zeng, X.; Li, J. Environmental optimisation of mine scheduling through life cycle assessment integration. Resources, Conservation and Recycling 2019, 142, 267–276. [Google Scholar] [CrossRef]
- Rahman, S.M.; Eckelman, M.J.; Onnis Hayden, A.; Gu, A.Z. Comparative life cycle assessment of advanced wastewater treatment processes for removal of chemicals of emerging concern. Environmental Science & Technology 2018, 52, 11346–11358. [Google Scholar] [CrossRef]
- Opher, T.; Friedler, E. Comparative LCA of decentralized wastewater treatment alternatives for non-potable urban reuse. Journal of Environmental Management 2016, 182, 464–476. [Google Scholar] [CrossRef] [PubMed]
- Castellet, L.; Molinos-Senante, M. Efficiency assessment of wastewater treatment plants: A data envelopment analysis approach integrating technical, economic, and environmental issues. Journal of Environmental Management 2016, 167, 160–166. [Google Scholar] [CrossRef]
- Corominas, L.; Foley, J.; Guest, J.S.; Hospido, A.; Larsen, H.F.; Morera, S.; Shaw, A. Life cycle assessment applied to wastewater treatment: State of the art. Water Research 2013, 47, 5480–5492. [Google Scholar] [CrossRef]
- Goyal, H.; Mondal, P. Life cycle assessment (LCA) of the arsenic and fluoride removal from groundwater through adsorption and electrocoagulation: A comparative study. Chemosphere 2022, 304, 135243. [Google Scholar] [CrossRef]
- Thakur, L.S.; Goyal, H.; Mondal, P. Simultaneous removal of arsenic and fluoride from synthetic solution through continuous electrocoagulation: Operating cost and sludge utilization. Journal of Environmental Chemical Engineering 2019, 7, 102829. [Google Scholar] [CrossRef]
- Çetinkaya, A.Y. Integration of electrocoagulation and solar energy for sustainable wastewater treatment: A thermodynamic and life cycle assessment study. Environmental Monitoring and Assessment 2025, 197, 224. [Google Scholar] [CrossRef]
- Sharma, P.; Joshi, H. Utilization of electrocoagulation treated spent wash sludge in making building blocks. International Journal of Environmental Science and Technology 2016, 13, 349–358. [Google Scholar] [CrossRef]
- Rajaniemi, K.; Tuomikoski, S.; Lassi, U. Electrocoagulation sludge valorization—A review. Resources 2021, 10, 127. [Google Scholar] [CrossRef]
- Zhu, P.; Li, J.; Wang, L.; Zhou, R.; Liu, Y. Reuse of hazardous calcium fluoride sludge in ceramic products. Journal of Hazardous Materials 2013, 260, 855–860. [Google Scholar] [CrossRef]
- Yilmaz, A.E.; Boncukcuoğlu, R.; Kocakerim, M.; Karakaş, İ.H. Waste utilization: The removal of textile dye (Bomaplex Red CR L) from aqueous solution on sludge waste from electrocoagulation as adsorbent. Desalination 2011, 277, 156–163. [Google Scholar] [CrossRef]
- García Gómez, C.; Rivera Huerta, M.L.; Almazán García, F.; Martín Domínguez, A.; Romero Soto, I.C.; Burboa Charis, V.A.; Gortáres Moroyoqui, P. Electrocoagulated metal hydroxide sludge for fluoride and arsenic removal in aqueous solution: Characterization, kinetic, and equilibrium studies. Water, Air, & Soil Pollution 2016, 227, 96. [Google Scholar] [CrossRef]
- Golder, A.K.; Samanta, A.N.; Ray, S. Removal of phosphate from aqueous solutions using calcined metal hydroxides sludge waste generated from electrocoagulation. Separation and Purification Technology 2006, 52, 102–109. [Google Scholar] [CrossRef]
- Santana, J.J.; Mena, V.F.; Betancor Abreu, A.; Rodríguez Raposo, R.; Izquierdo, J.; Souto, R.M. Use of alumina sludge arising from an electrocoagulation process as functional mesoporous microcapsules for active corrosion protection of aluminum. Progress in Organic Coatings 2021, 151, 106044. [Google Scholar] [CrossRef]
- ISO. ISO 14044:2006. Environmental Management—Life Cycle Assessment—Requirements and Guidelines, 1st ed.; International Organization for Standardization: Geneva, Switzerland, 2006; Available online: https://www.iso.org/standard/38498.html (accessed on 15 September 2025).
- Bonton, A.; Bouchard, C.; Barbeau, B.; Jedrzejak, S. Comparative life cycle assessment of water treatment plants. Desalination 2012, 284, 42–54. [Google Scholar] [CrossRef]
- Goedkoop, M.; Heijungs, R.; Huijbregts, M.; de Schryver, A.; Struijs, J.; van Zelm, R. ReCiPe 2008: A Life Cycle Impact Assessment Method Which Comprises Harmonised Category Indicators at the Midpoint and the Endpoint Level; Report I: Characterisation; Ministry of Housing, Spatial Planning and the Environment (VROM): The Hague, The Netherlands, 2009; Available online: https://www.rivm.nl/en/life-cycle-assessment-lca/recipe (accessed on 15 September 2025).
- Zepon Tarpani, R.R.; Azapagic, A. Life cycle environmental impacts of advanced wastewater treatment techniques for removal of pharmaceuticals and personal care products (PPCPs). Journal of Environmental Management 2018, 215, 258–272. [Google Scholar] [CrossRef] [PubMed]
- Nakhate, P.H.; Moradiya, K.K.; Patil, H.G.; Marathe, K.V.; Yadav, G.D. Case study on sustainability of textile wastewater treatment plant based on life cycle assessment approach. Journal of Cleaner Production 2020, 245, 118929. [Google Scholar] [CrossRef]
- Hauschild, M.; Rosenbaum, R.K.; Olsen, S.I. Life Cycle Assessment: Theory and Practice; Springer: Cham, Switzerland, 2018. [Google Scholar] [CrossRef]
- Singh, P.; Carliell-Marquet, C.; Kansal, A. Energy pattern analysis of a wastewater treatment plant. Applied Water Science 2012, 2, 221–226. [Google Scholar] [CrossRef]
- CONAMA. Resolução 430 (2011). Available online: http://www.suape.pe.gov.br/images/publicacoes/CONAMA_n.430.2011.pdf (accessed on 15 September 2025).
- Cashman, S.; Gaglione, A.; Mosley, J.; Weiss, L.; Hawkins, T.; Ashbolt, N.; Cashdollar, J.; Xue, X.; Ma, C.; Arden, S. Environmental and cost life cycle assessment of disinfection options for municipal drinking water treatment. Report; U.S. Environmental Protection Agency, Office of Research and Development: Cincinnati, OH, USA, 2014. Available online: https://cfpub.epa.gov/si/si_public_record_report.cfm?dirEntryId=298570 (accessed on 15 September 2025).
- Dalpaz, R. Avaliação energética do biogás com diferentes percentuais de metano na produção de energia térmica e elétrica; Master’s Thesis, Universidade do Vale do Taquari—Univates, Lajeado, Brazil, 2019. Available online: http://bdtd.ibict.br/vufind/Record/UVAT_1ab6a3b372faa4d5ed630f6c2515c049 (accessed on 15 September 2025).
Figure 1.
System and subsystems units applied to this study.
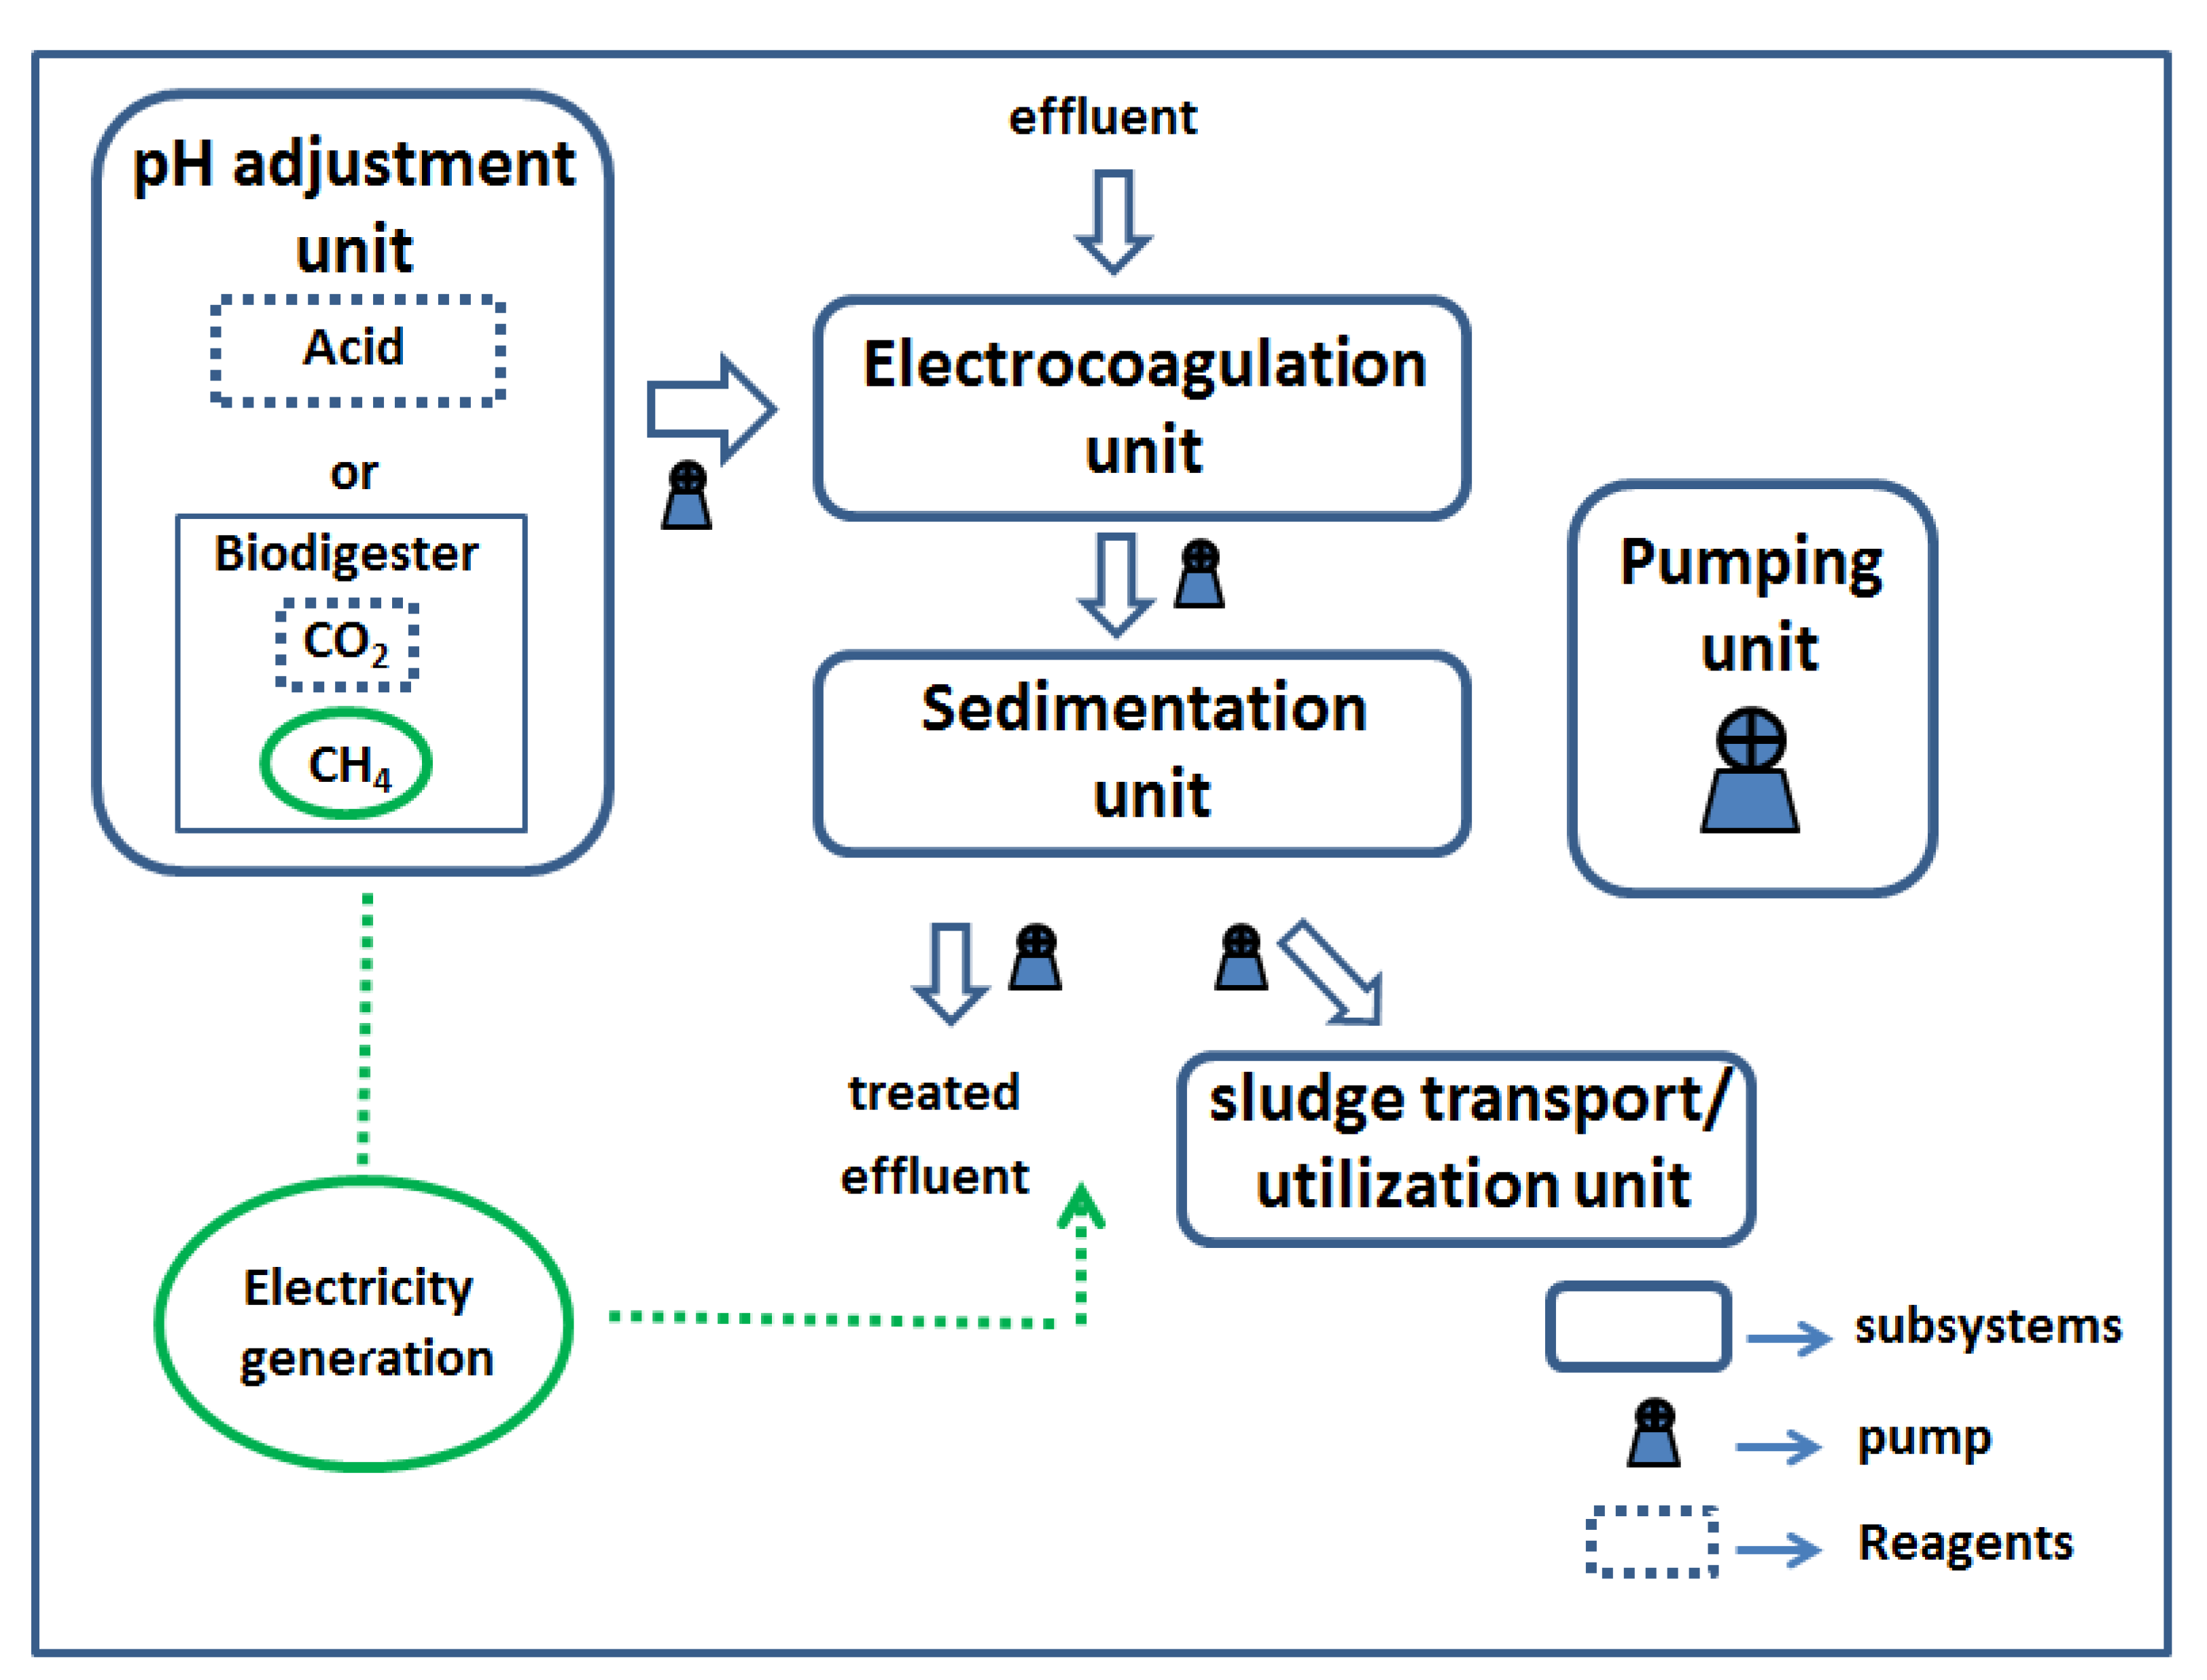
Figure 2.
Experimental setup: A - wastewater storage; B - peristaltic pump; C - biodigester or acid; D - gas and wastewater mixer; E - DC power supply; F - electrochemical cell; G - gas/wastewater sprinkler; H - magnetic stirrer; I - aluminum electrodes.
Figure 2.
Experimental setup: A - wastewater storage; B - peristaltic pump; C - biodigester or acid; D - gas and wastewater mixer; E - DC power supply; F - electrochemical cell; G - gas/wastewater sprinkler; H - magnetic stirrer; I - aluminum electrodes.
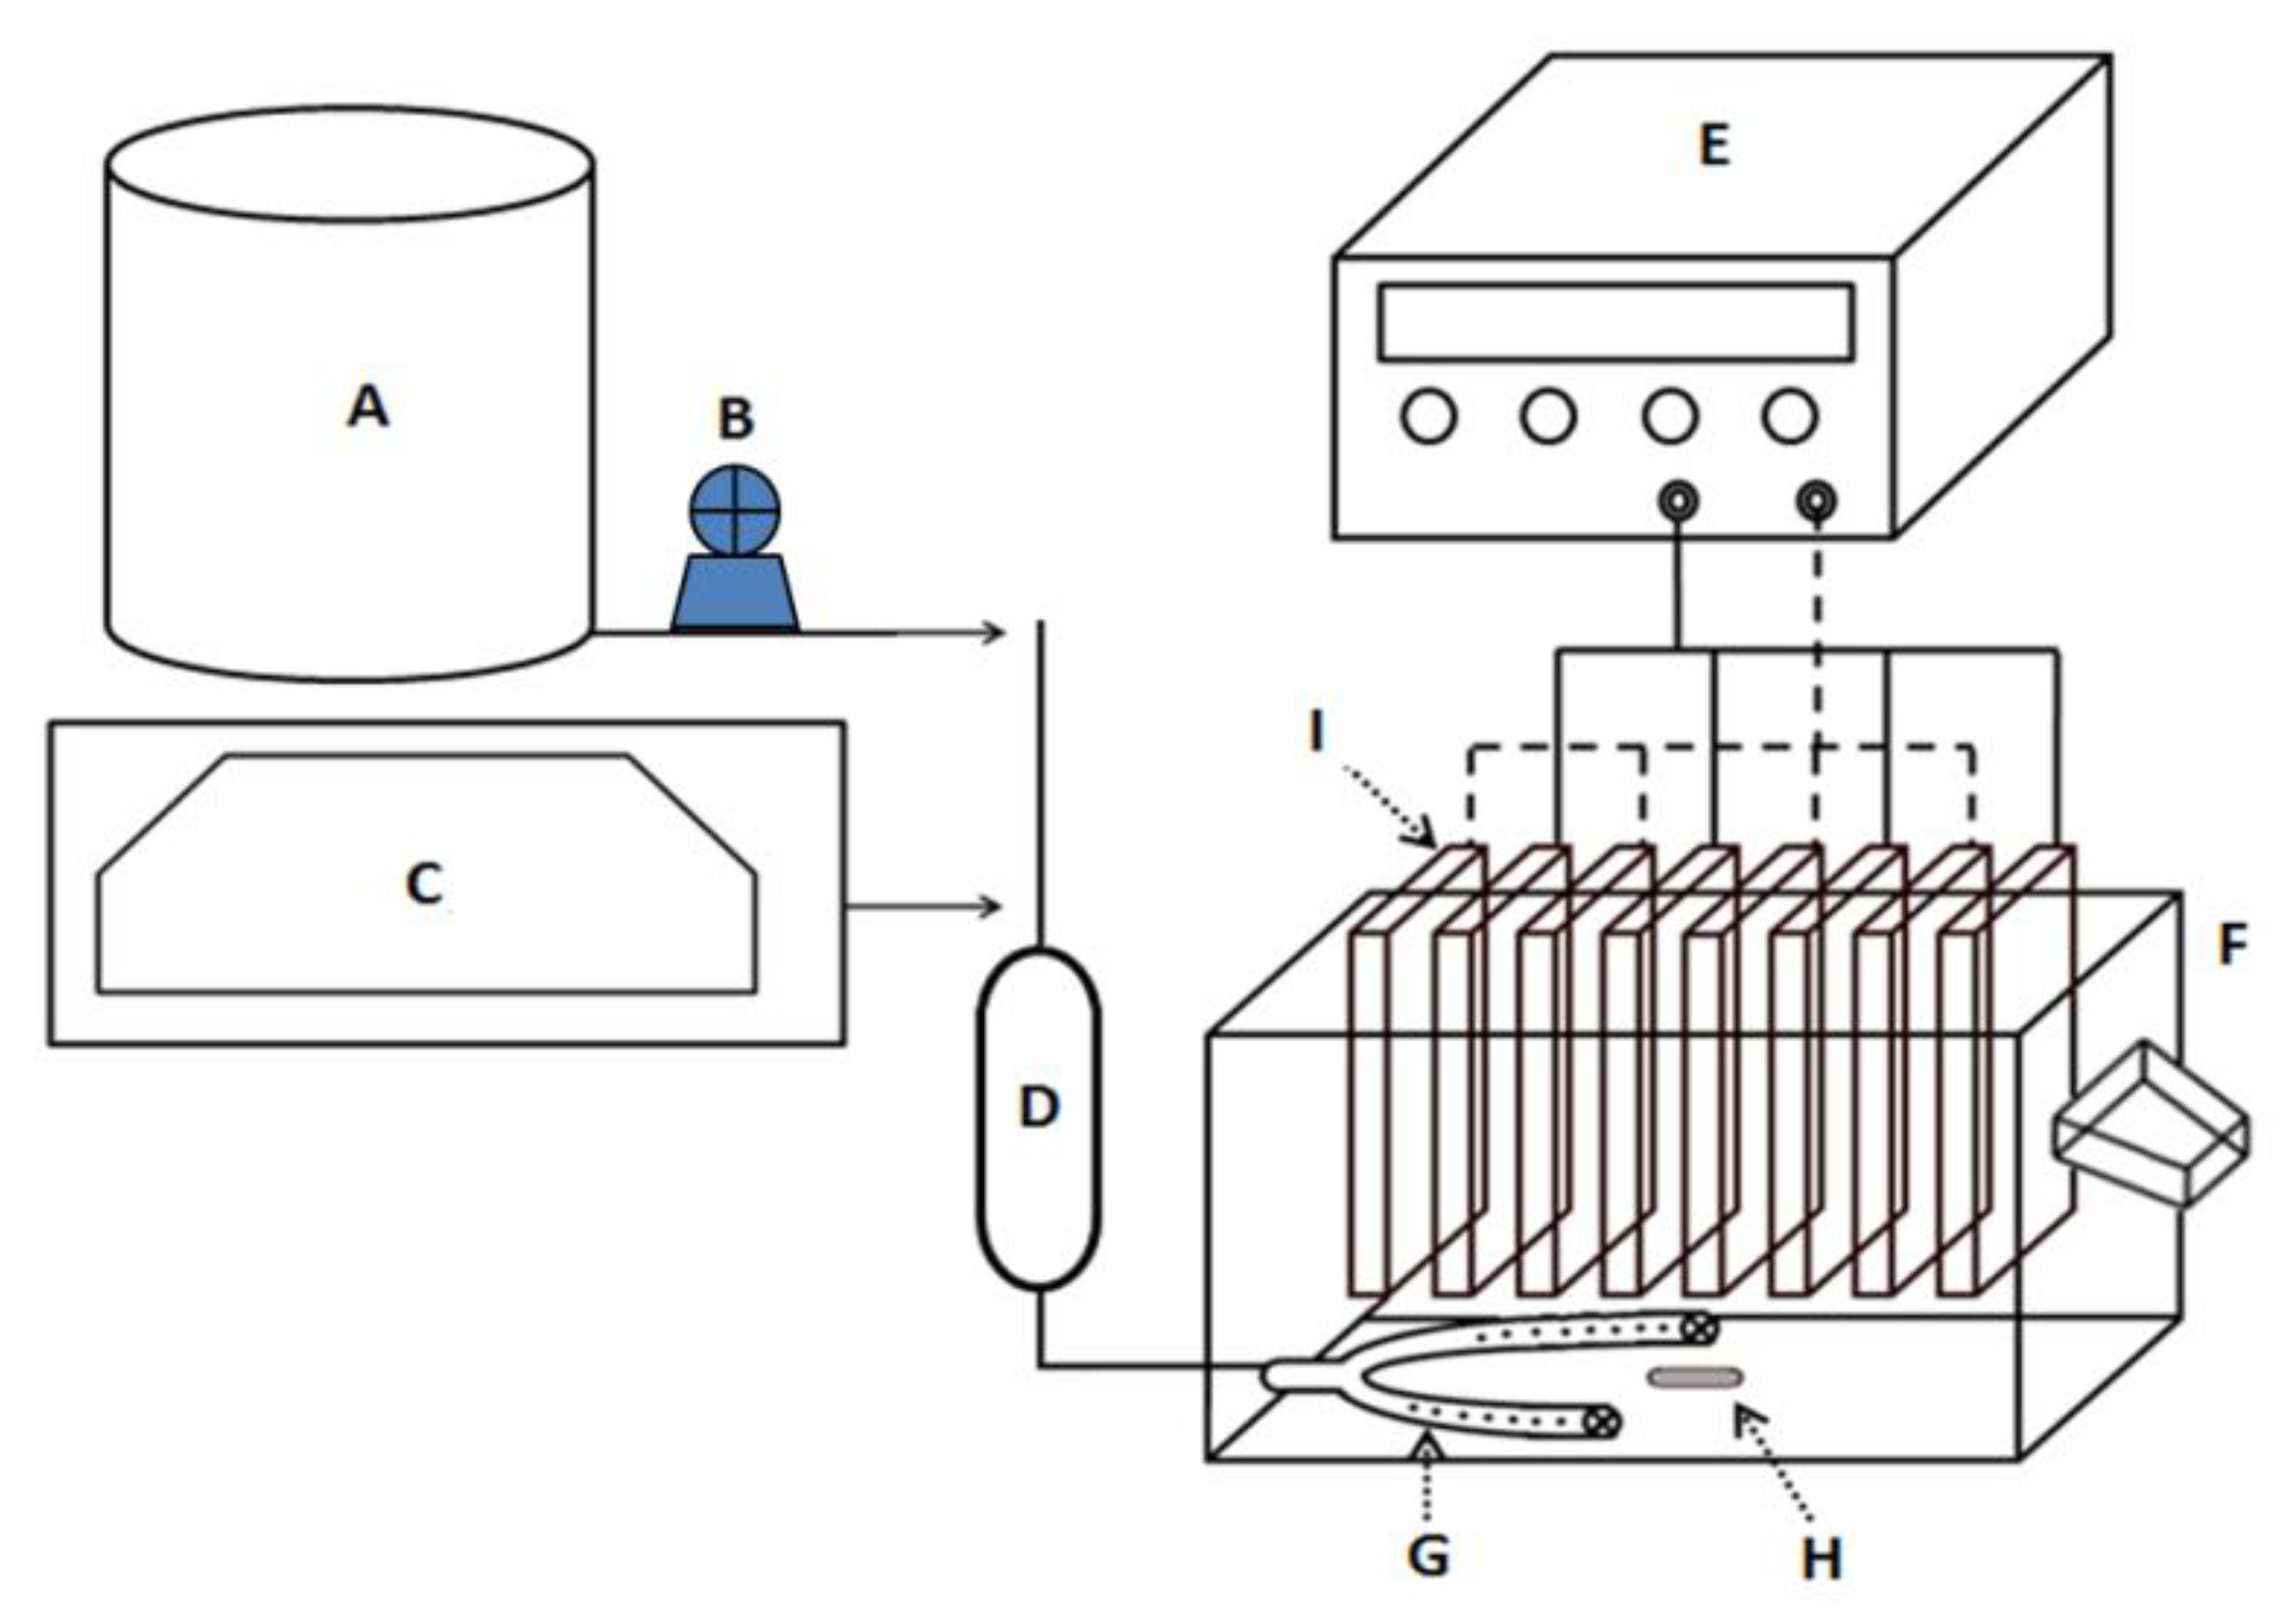
Figure 3.
Schematic of the electrocoagulation treatment plant for fluoride removal.
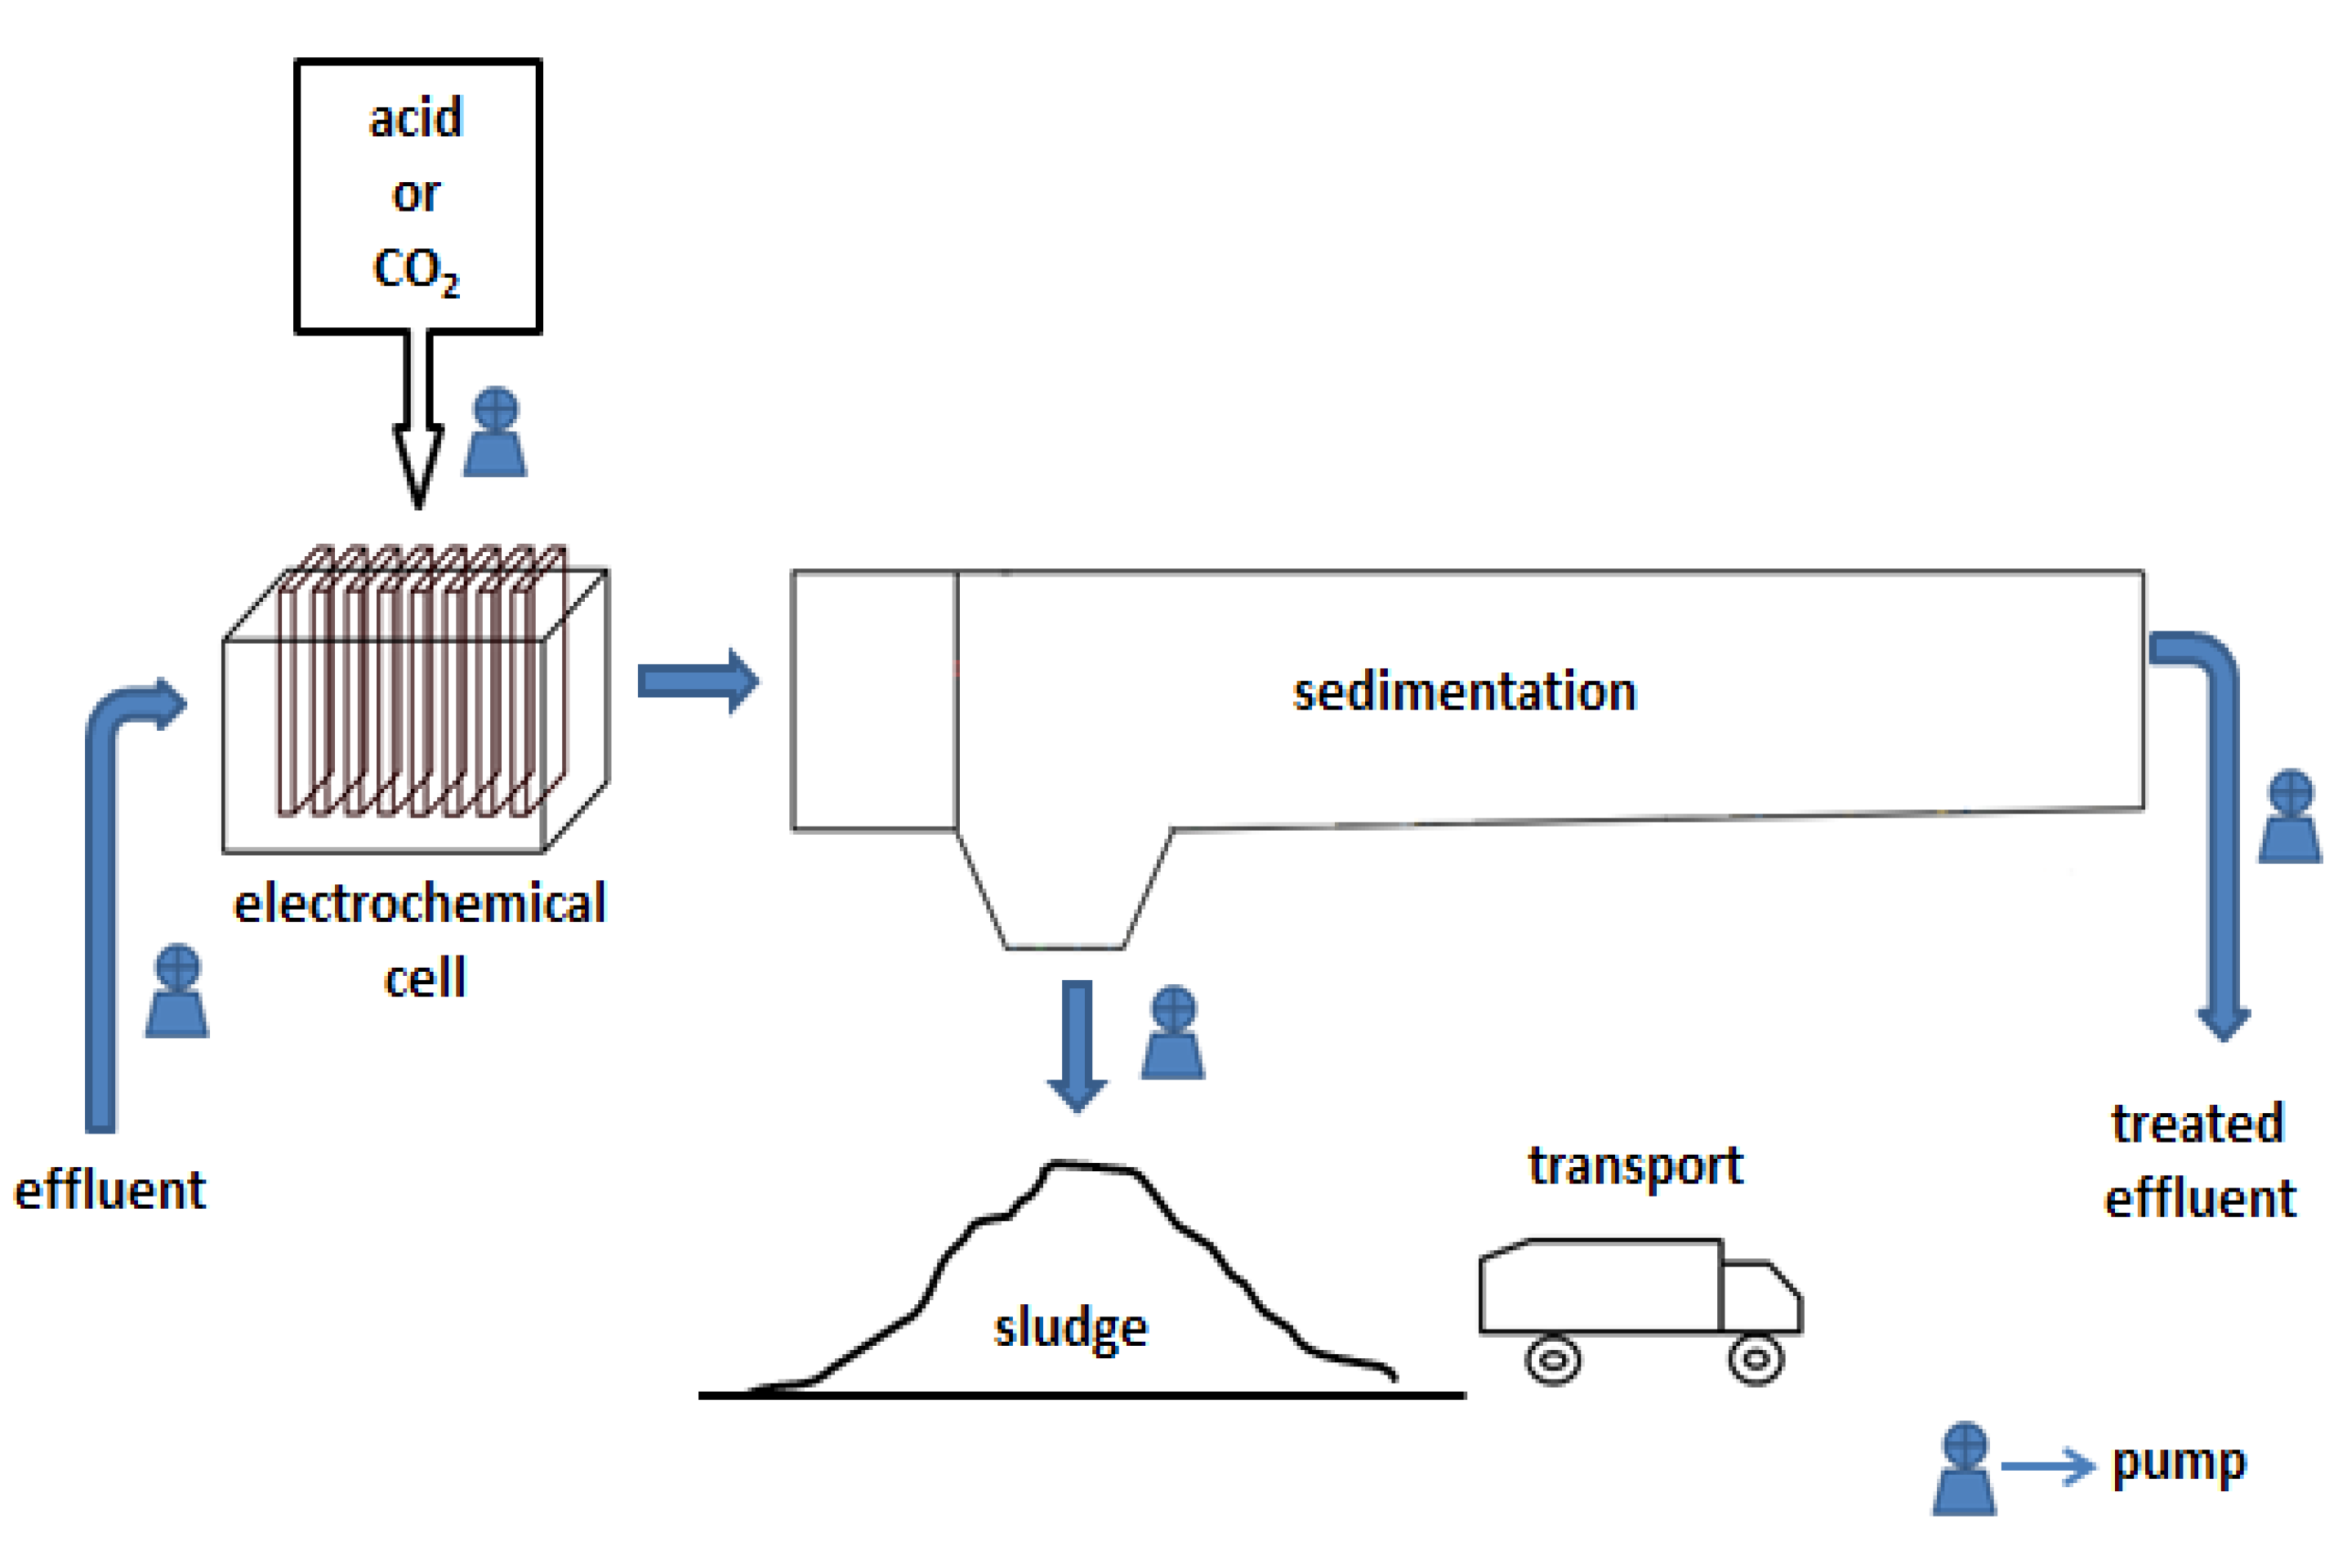
Figure 4.
Overall impacts of three water treatment scenarios using ReCiPe endpoint method (E). S1- Scenario 1; S2- Scenario 2; S3- Scenario 3.
Figure 4.
Overall impacts of three water treatment scenarios using ReCiPe endpoint method (E). S1- Scenario 1; S2- Scenario 2; S3- Scenario 3.

Figure 5.
Percentage-based normalized environmental impacts for 22 categories, generated from three scenarios using the ReCiPe endpoint method. S1 refers to Scenario 1; S2 to Scenario 2; S3 to Scenario 3.
Figure 5.
Percentage-based normalized environmental impacts for 22 categories, generated from three scenarios using the ReCiPe endpoint method. S1 refers to Scenario 1; S2 to Scenario 2; S3 to Scenario 3.
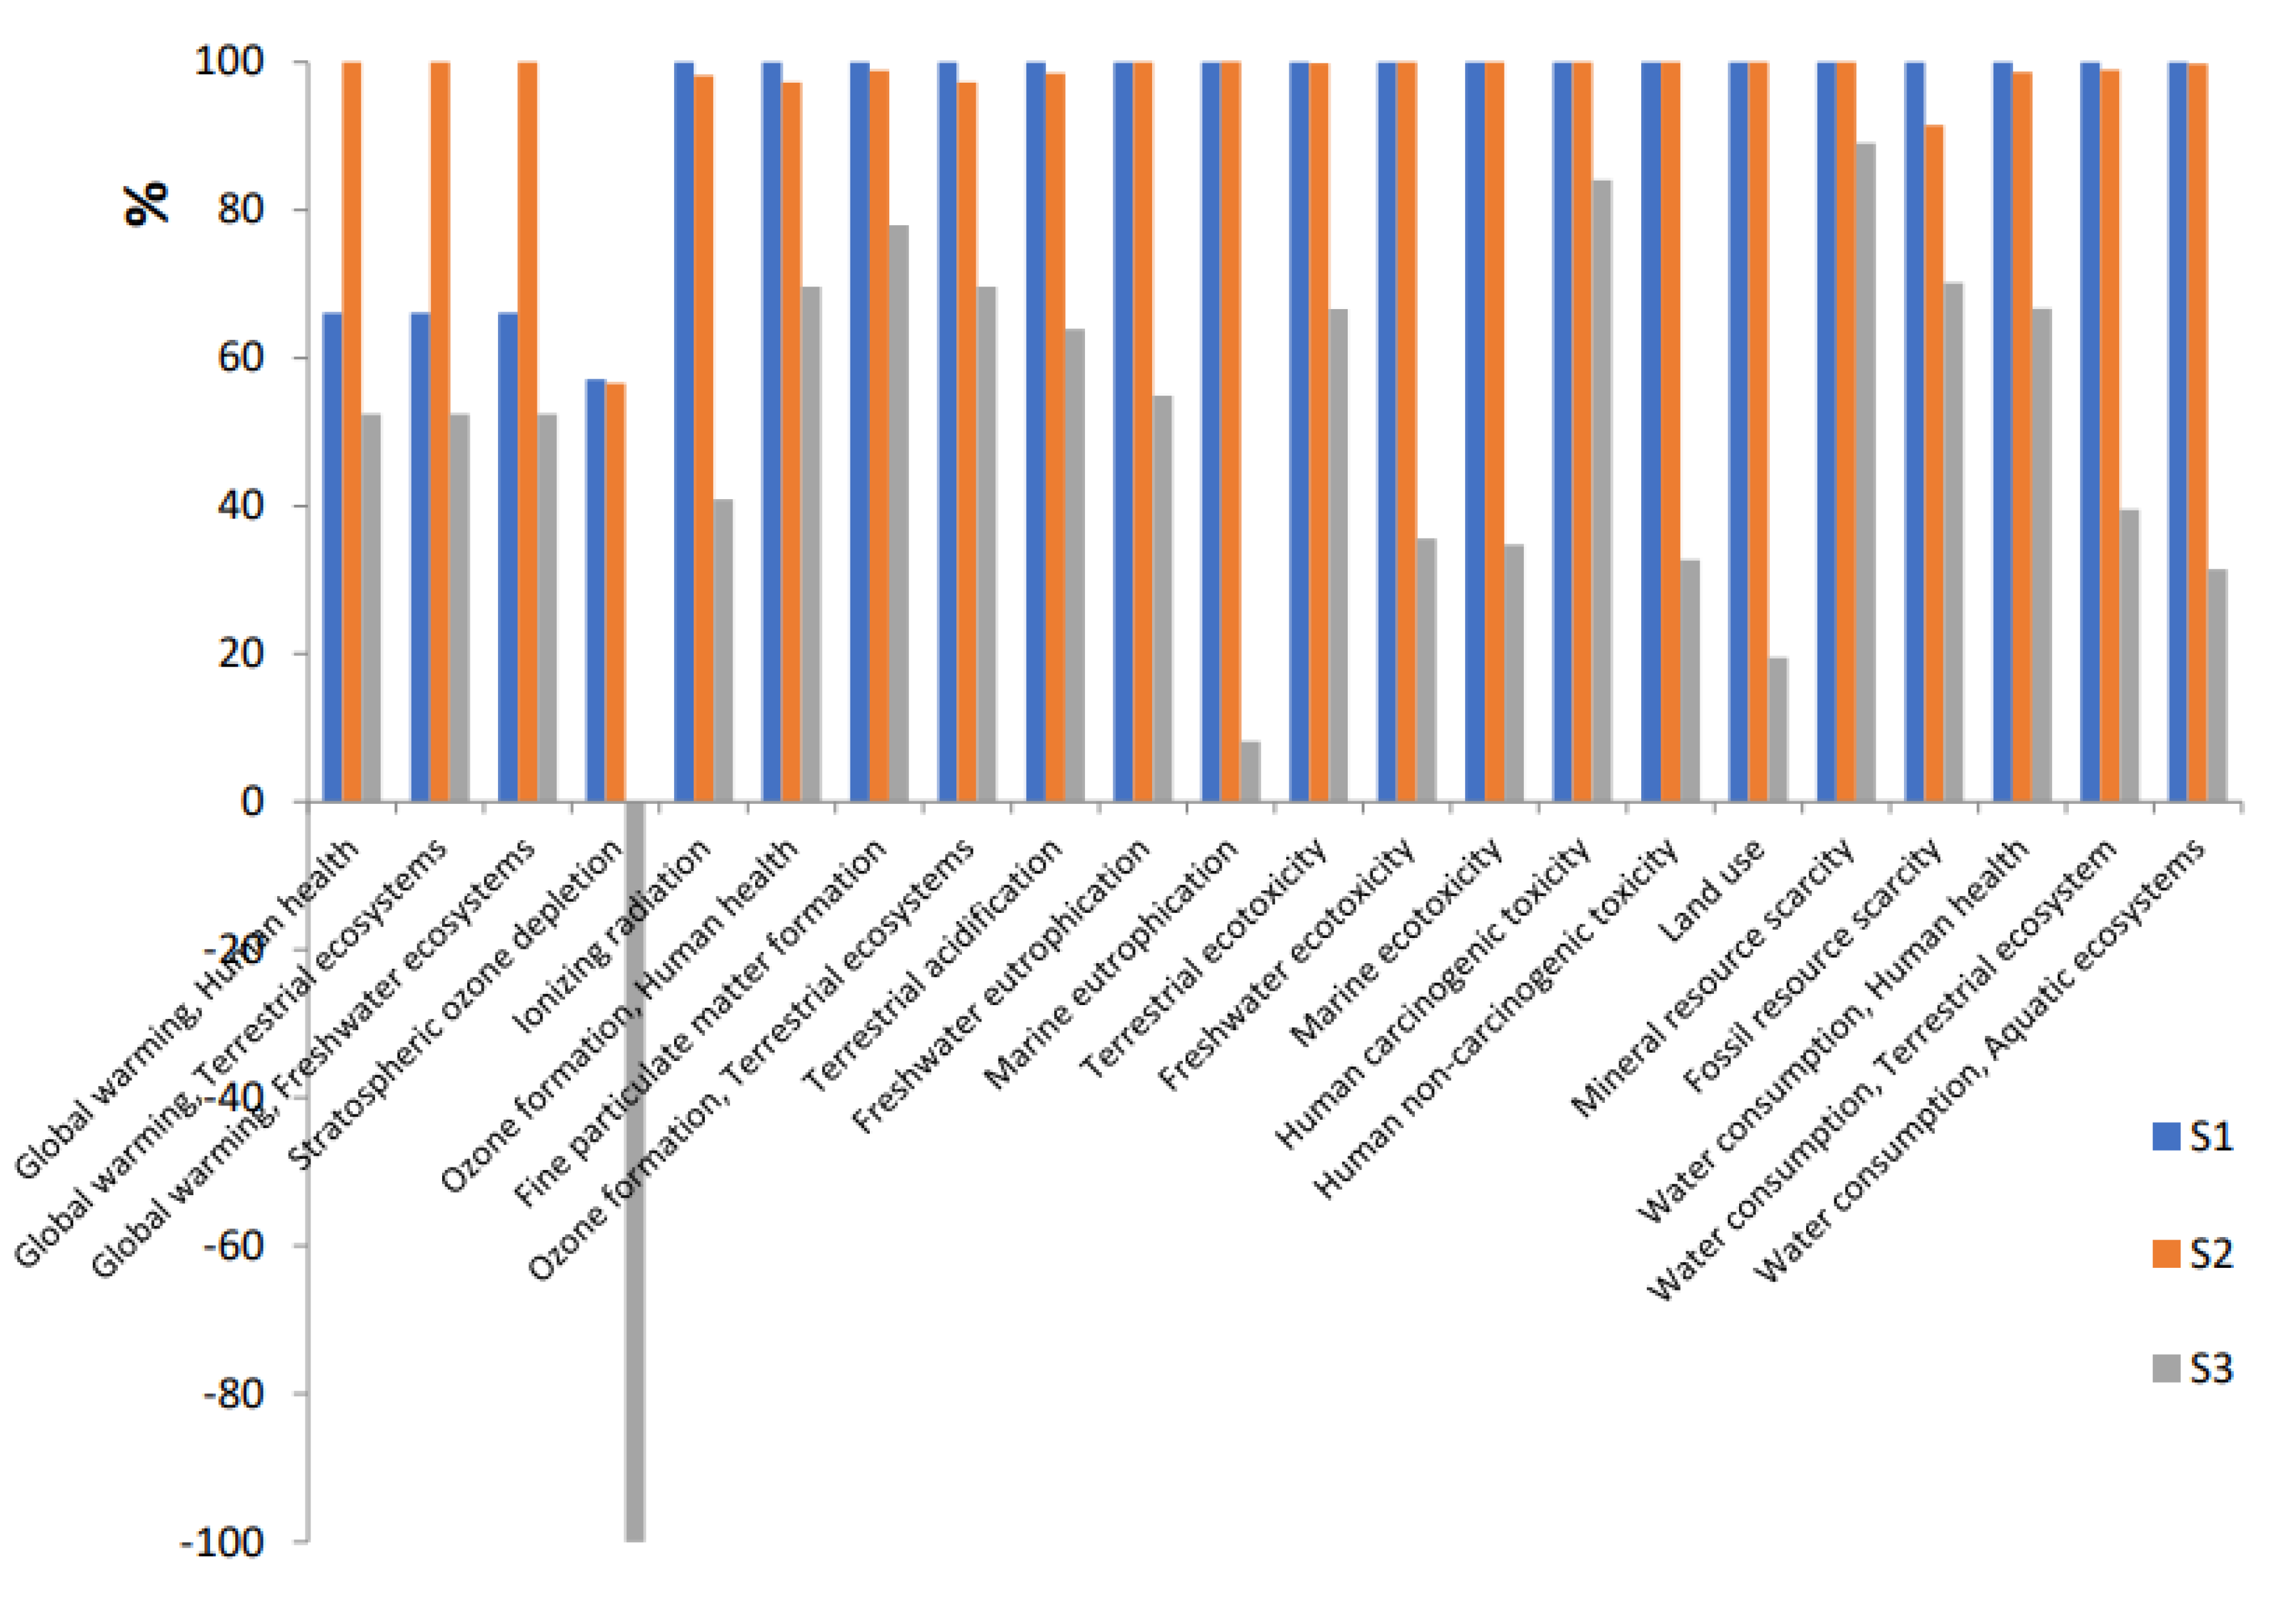
Figure 6.
Individual environmental impacts normalized of 22 categories generated from three scenarios using ReCiPe endpoint method. S1- Scenario 1; S2- Scenario 2; S3- Scenario 3.
Figure 6.
Individual environmental impacts normalized of 22 categories generated from three scenarios using ReCiPe endpoint method. S1- Scenario 1; S2- Scenario 2; S3- Scenario 3.
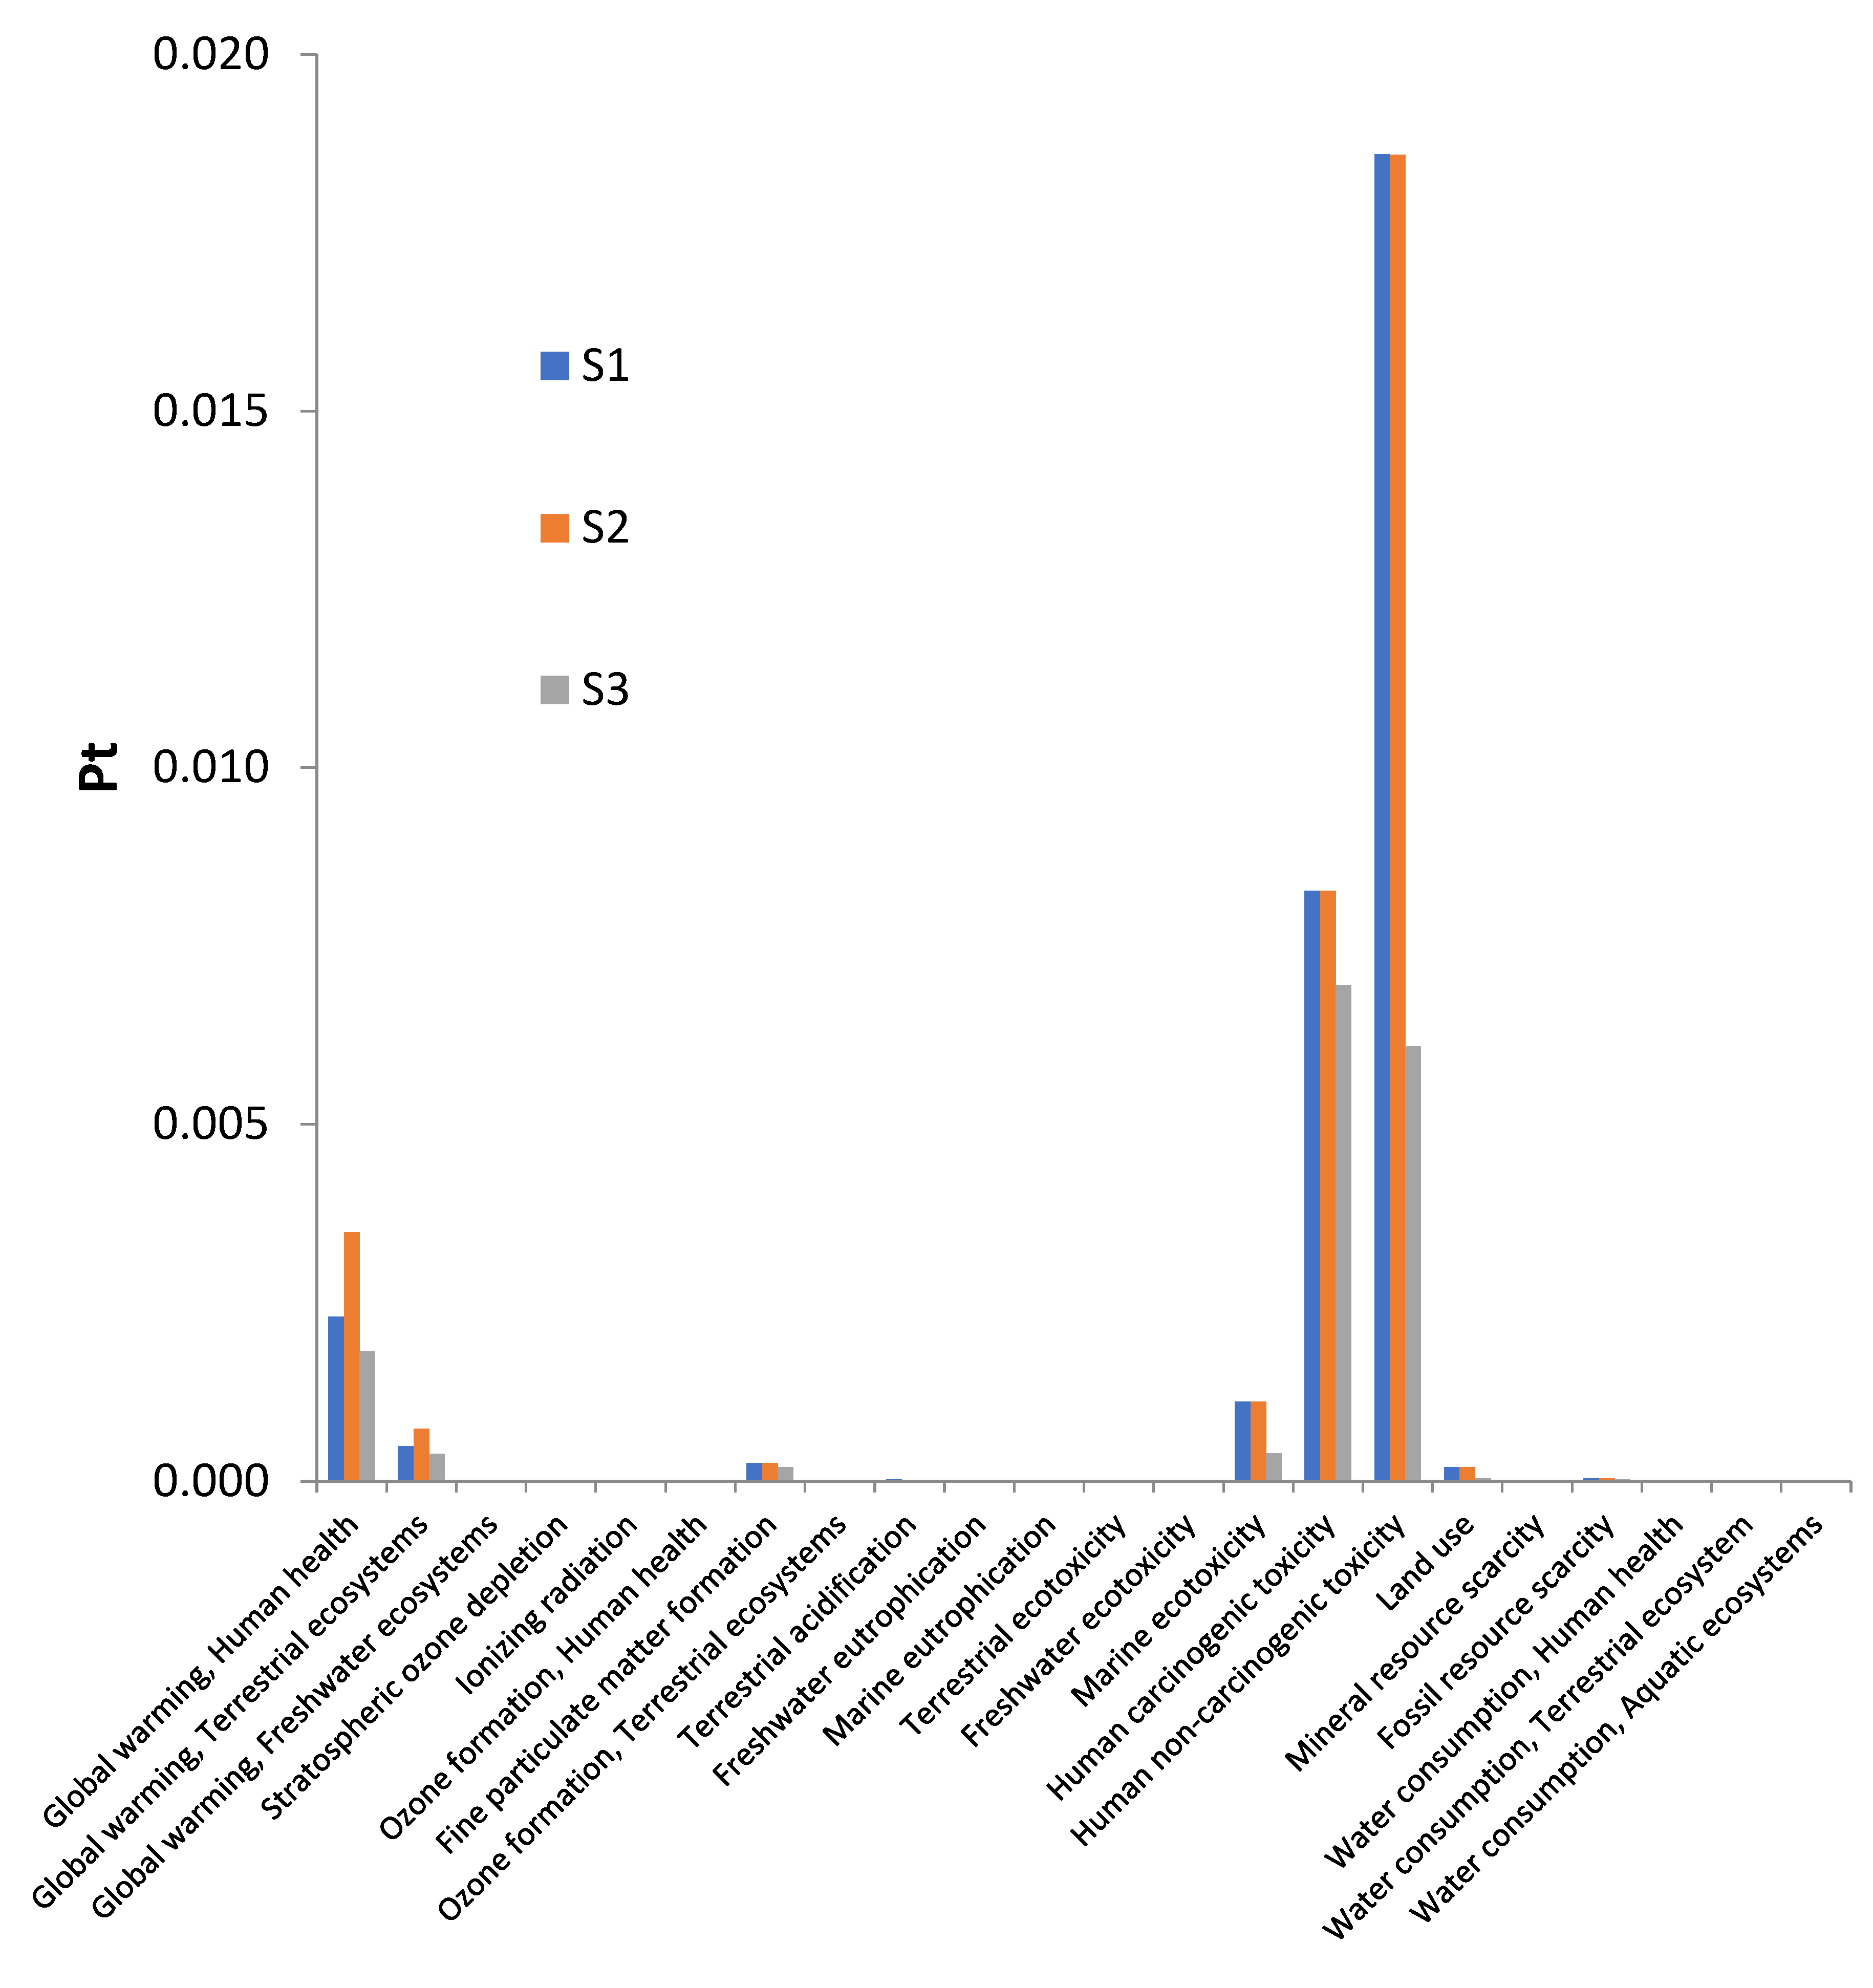
Figure 7.
Overall impacts of subsystems units from three water treatment scenarios using ReCiPe endpoint method (E), S1- Scenario 1; S2- Scenario 2; S3- Scenario 3.
Figure 7.
Overall impacts of subsystems units from three water treatment scenarios using ReCiPe endpoint method (E), S1- Scenario 1; S2- Scenario 2; S3- Scenario 3.
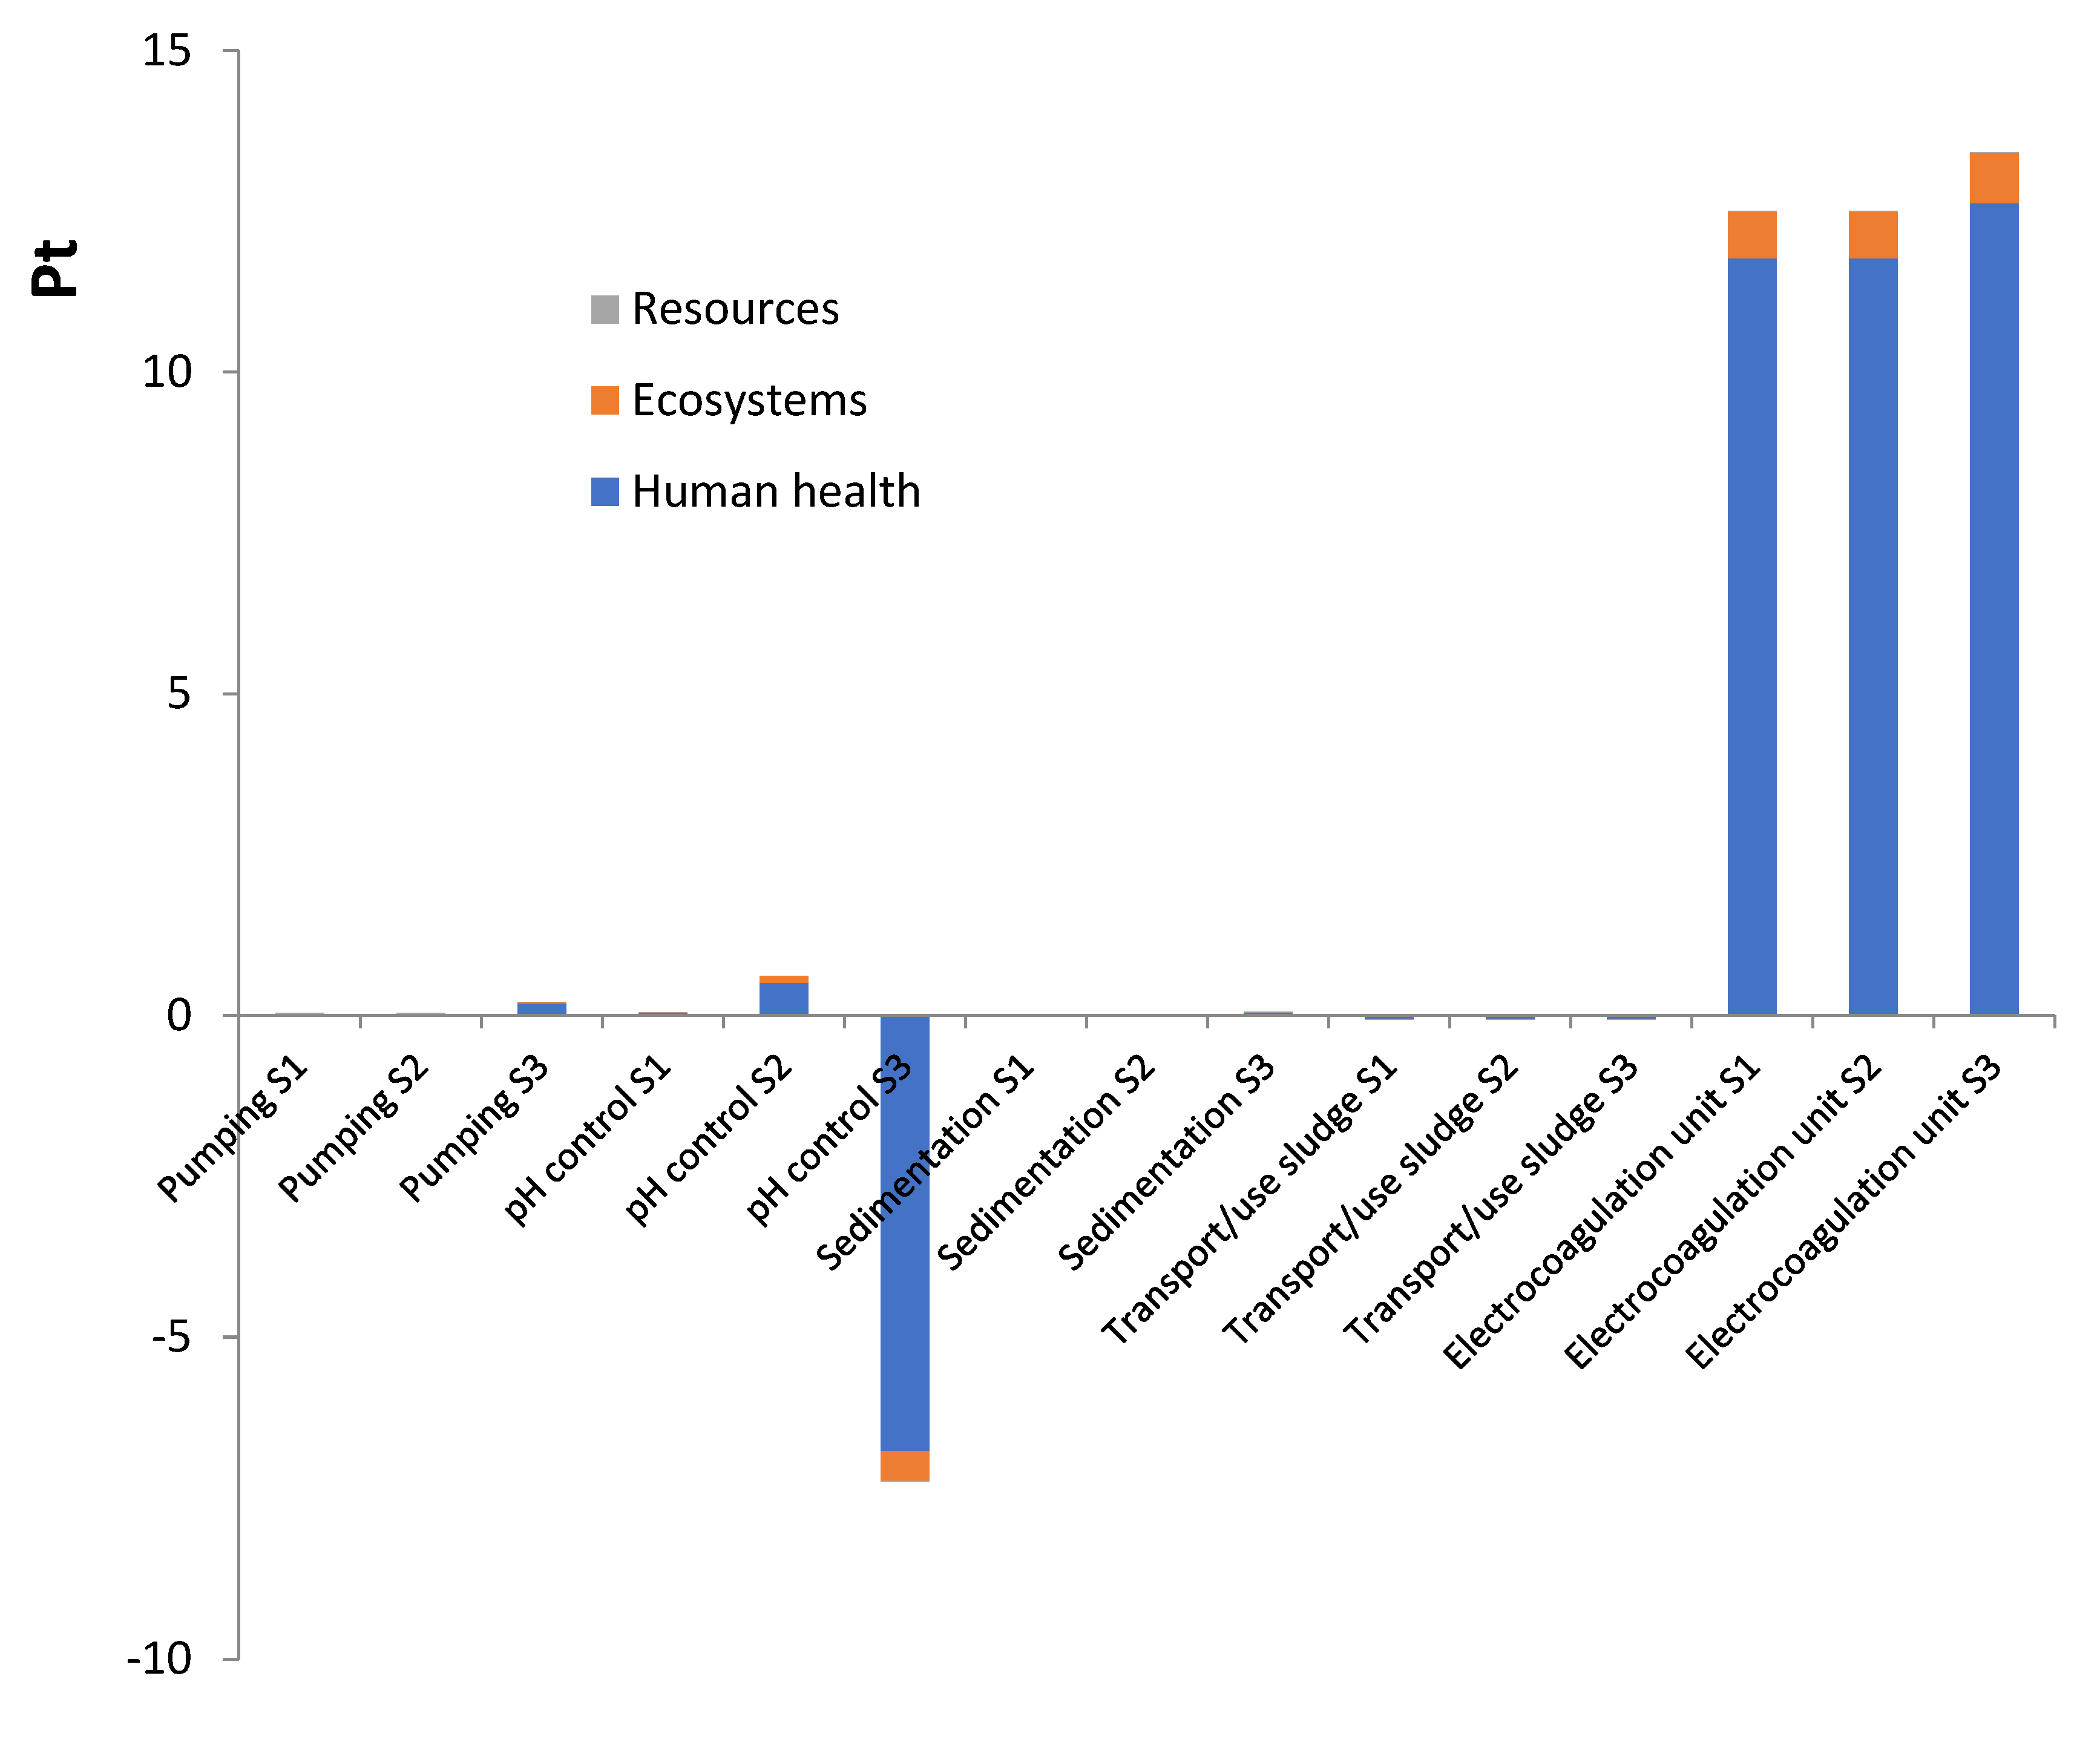
Figure 8.
Environmental impacts from electrocoagulation subsystem with ReCiPe endpoint method (E), S1- Scenario 1; S2- Scenario 2; S3- Scenario 3.
Figure 8.
Environmental impacts from electrocoagulation subsystem with ReCiPe endpoint method (E), S1- Scenario 1; S2- Scenario 2; S3- Scenario 3.
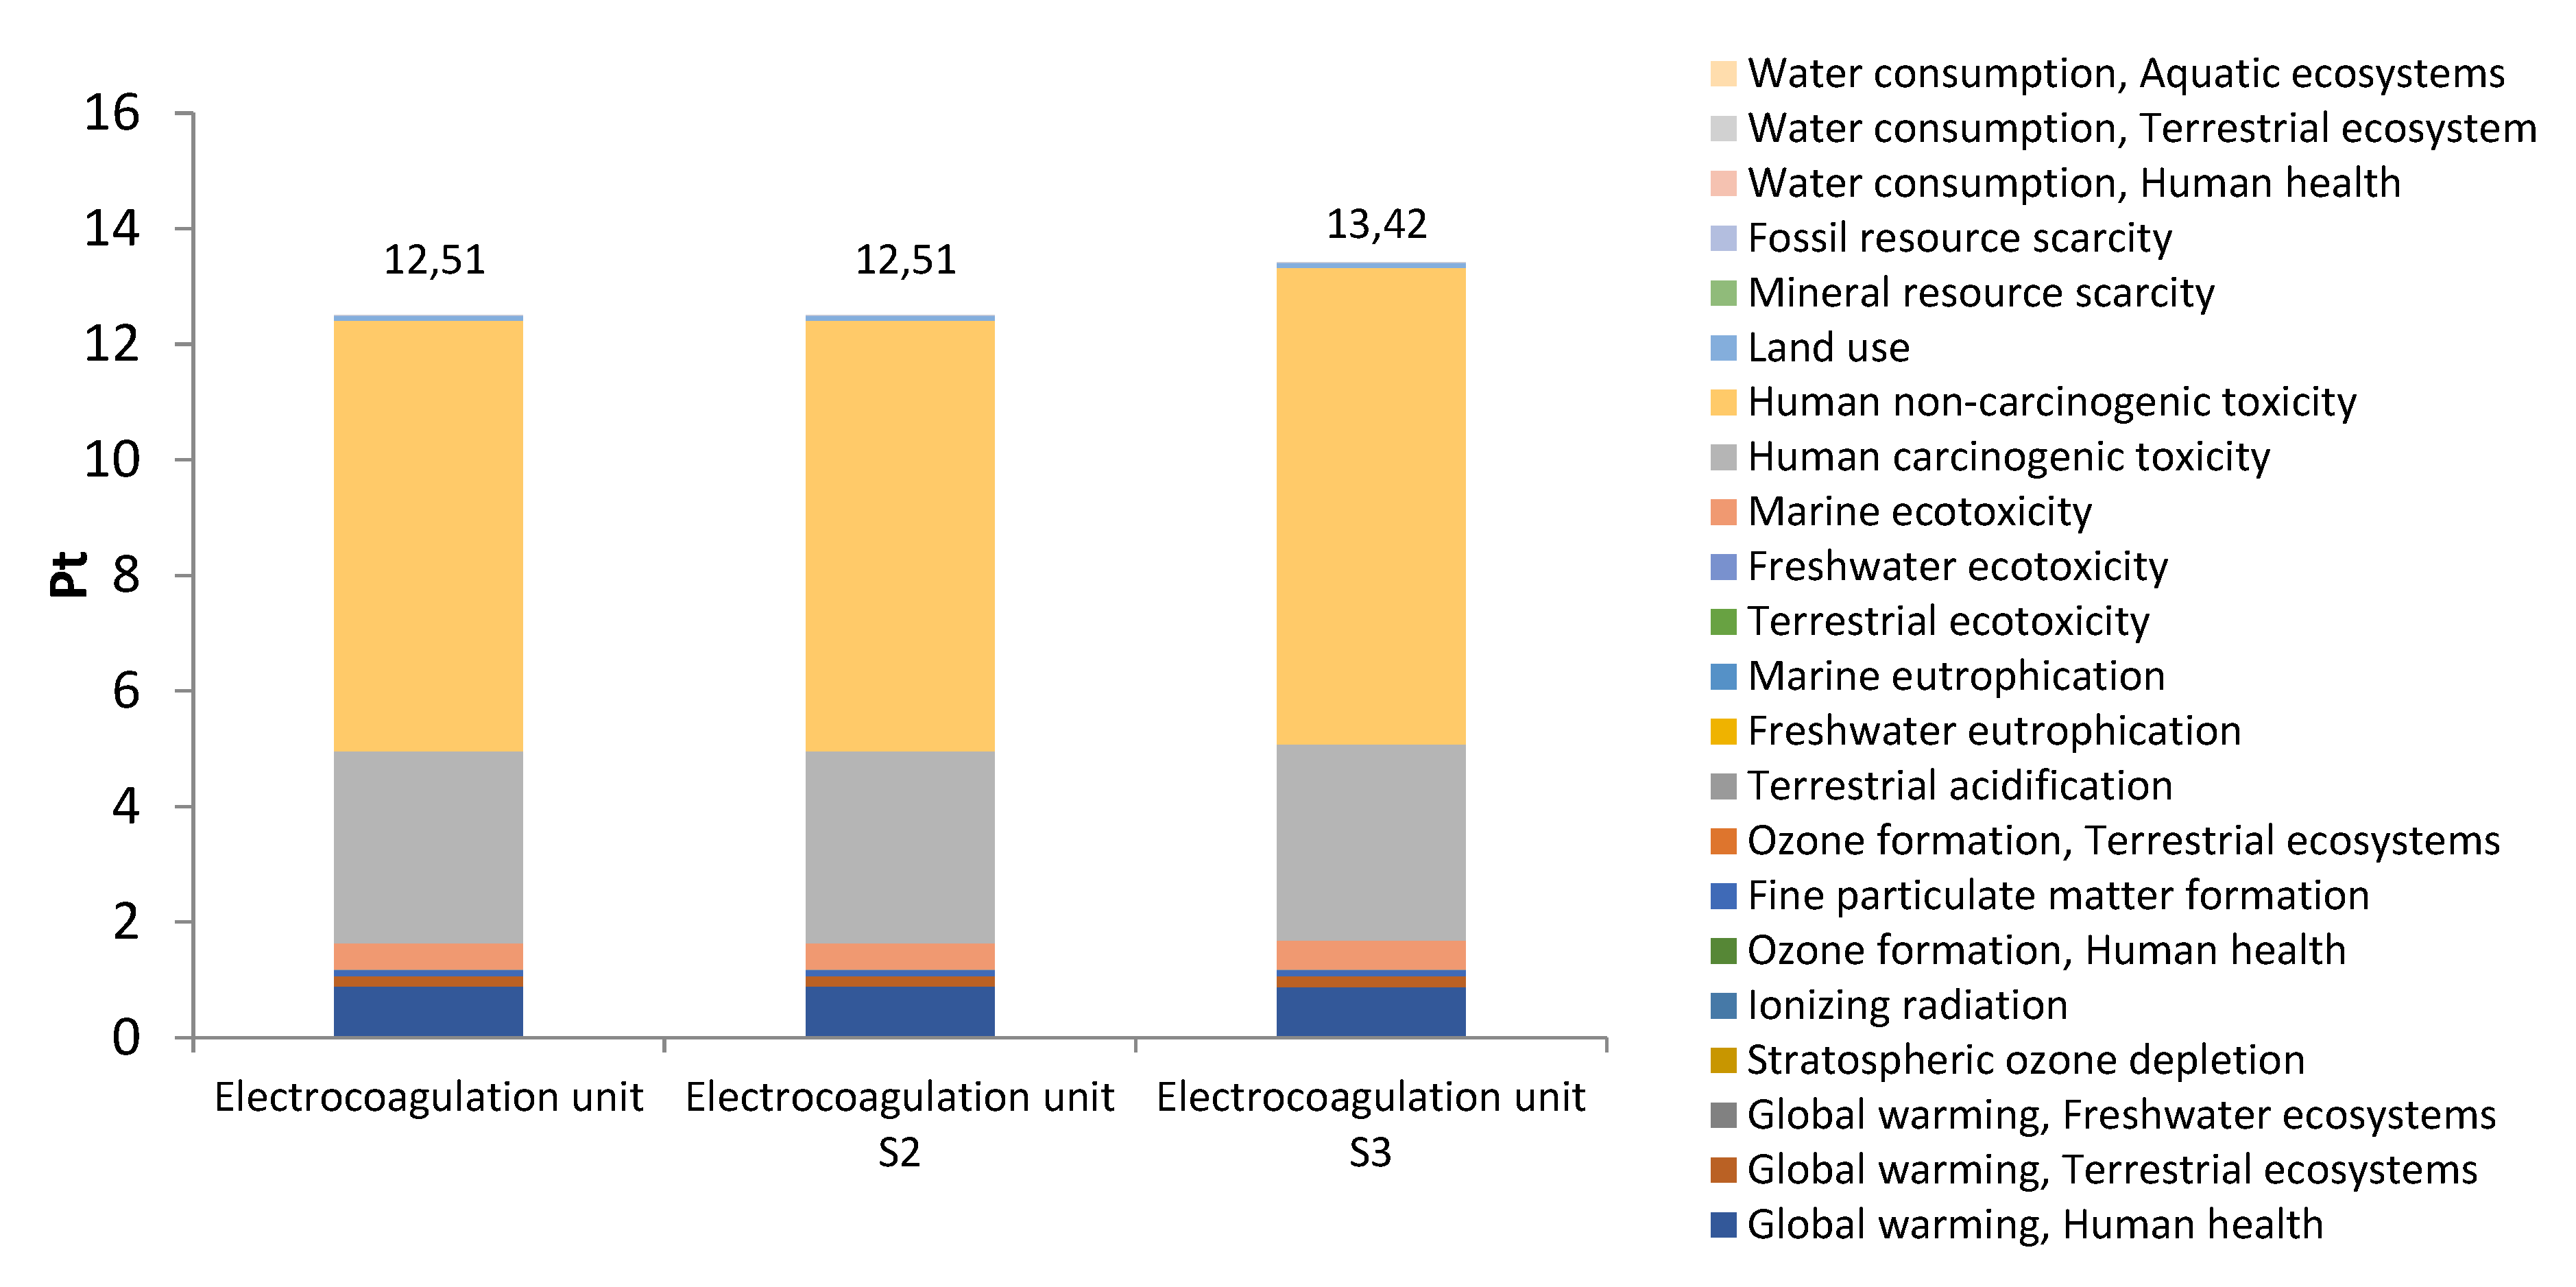
Figure 9.
Environmental impacts from pumping and sedimentation subsystems with ReCiPe endpoint method (E), S1- Scenario 1; S2- Scenario 2; S3- Scenario 3.
Figure 9.
Environmental impacts from pumping and sedimentation subsystems with ReCiPe endpoint method (E), S1- Scenario 1; S2- Scenario 2; S3- Scenario 3.
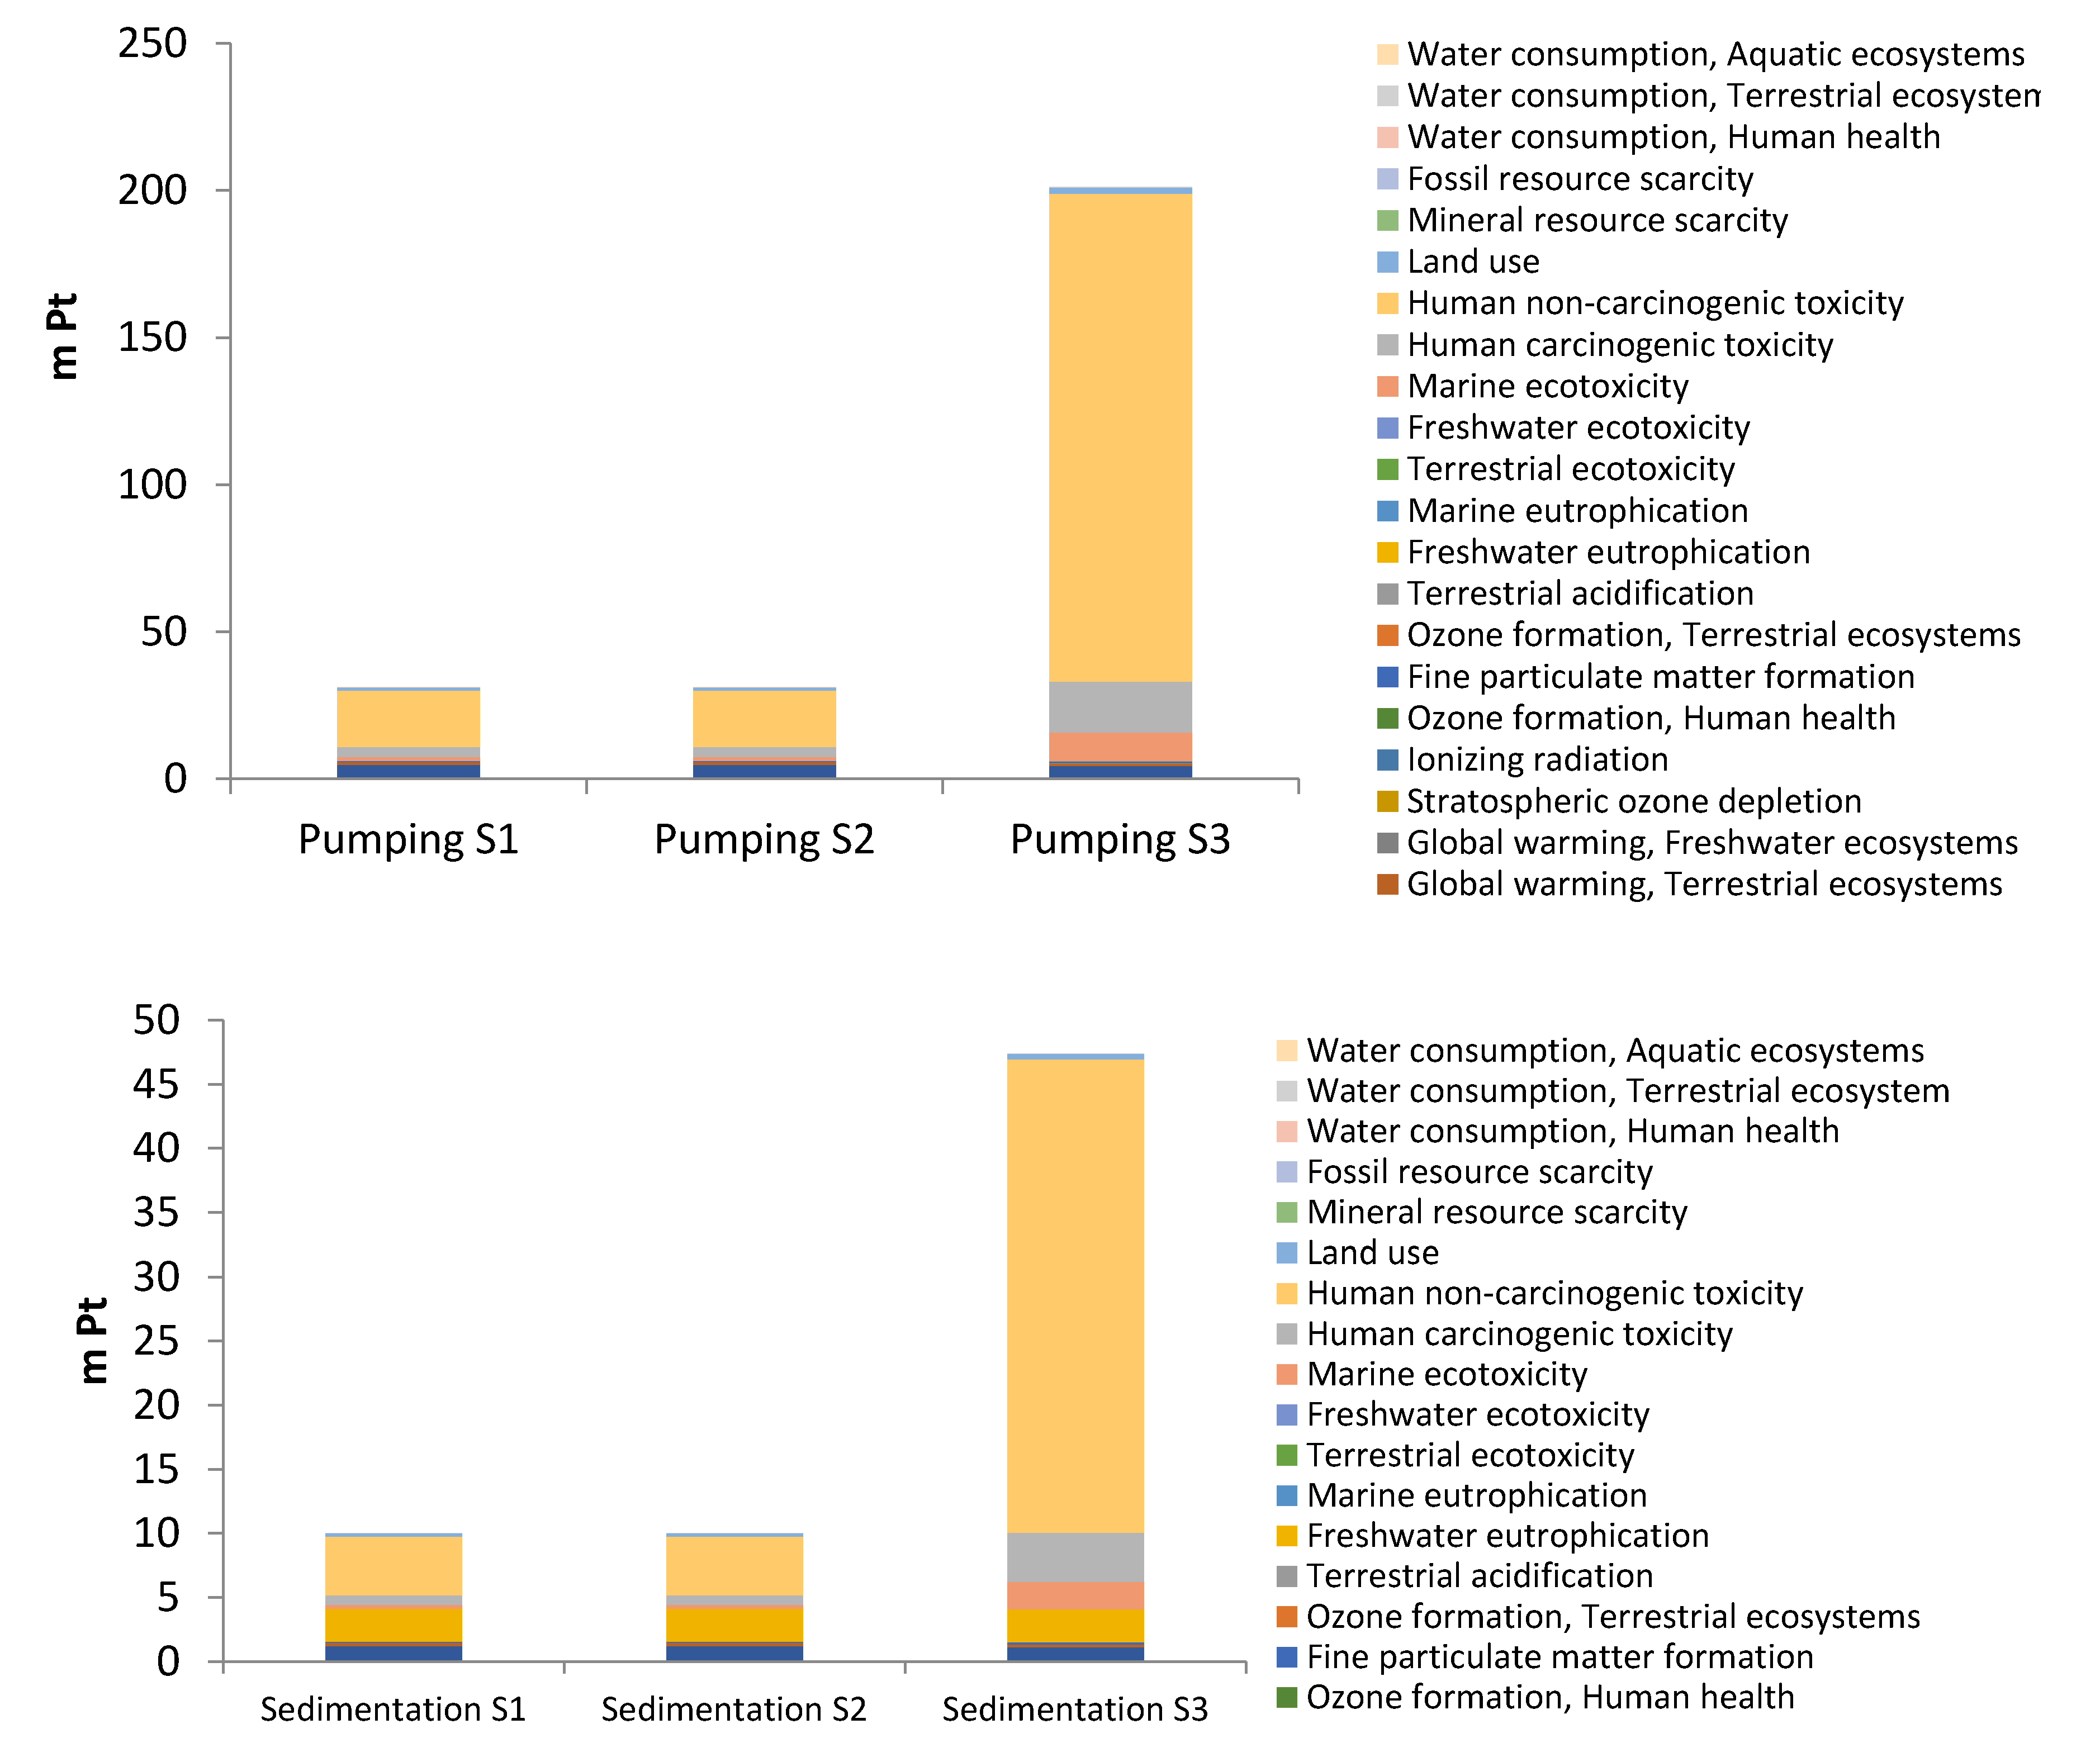
Figure 10.
Environmental impacts from pH adjustment subsystem with ReCiPe endpoint method (E), S1- Scenario 1; S2- Scenario 2; S3- Scenario 3.
Figure 10.
Environmental impacts from pH adjustment subsystem with ReCiPe endpoint method (E), S1- Scenario 1; S2- Scenario 2; S3- Scenario 3.
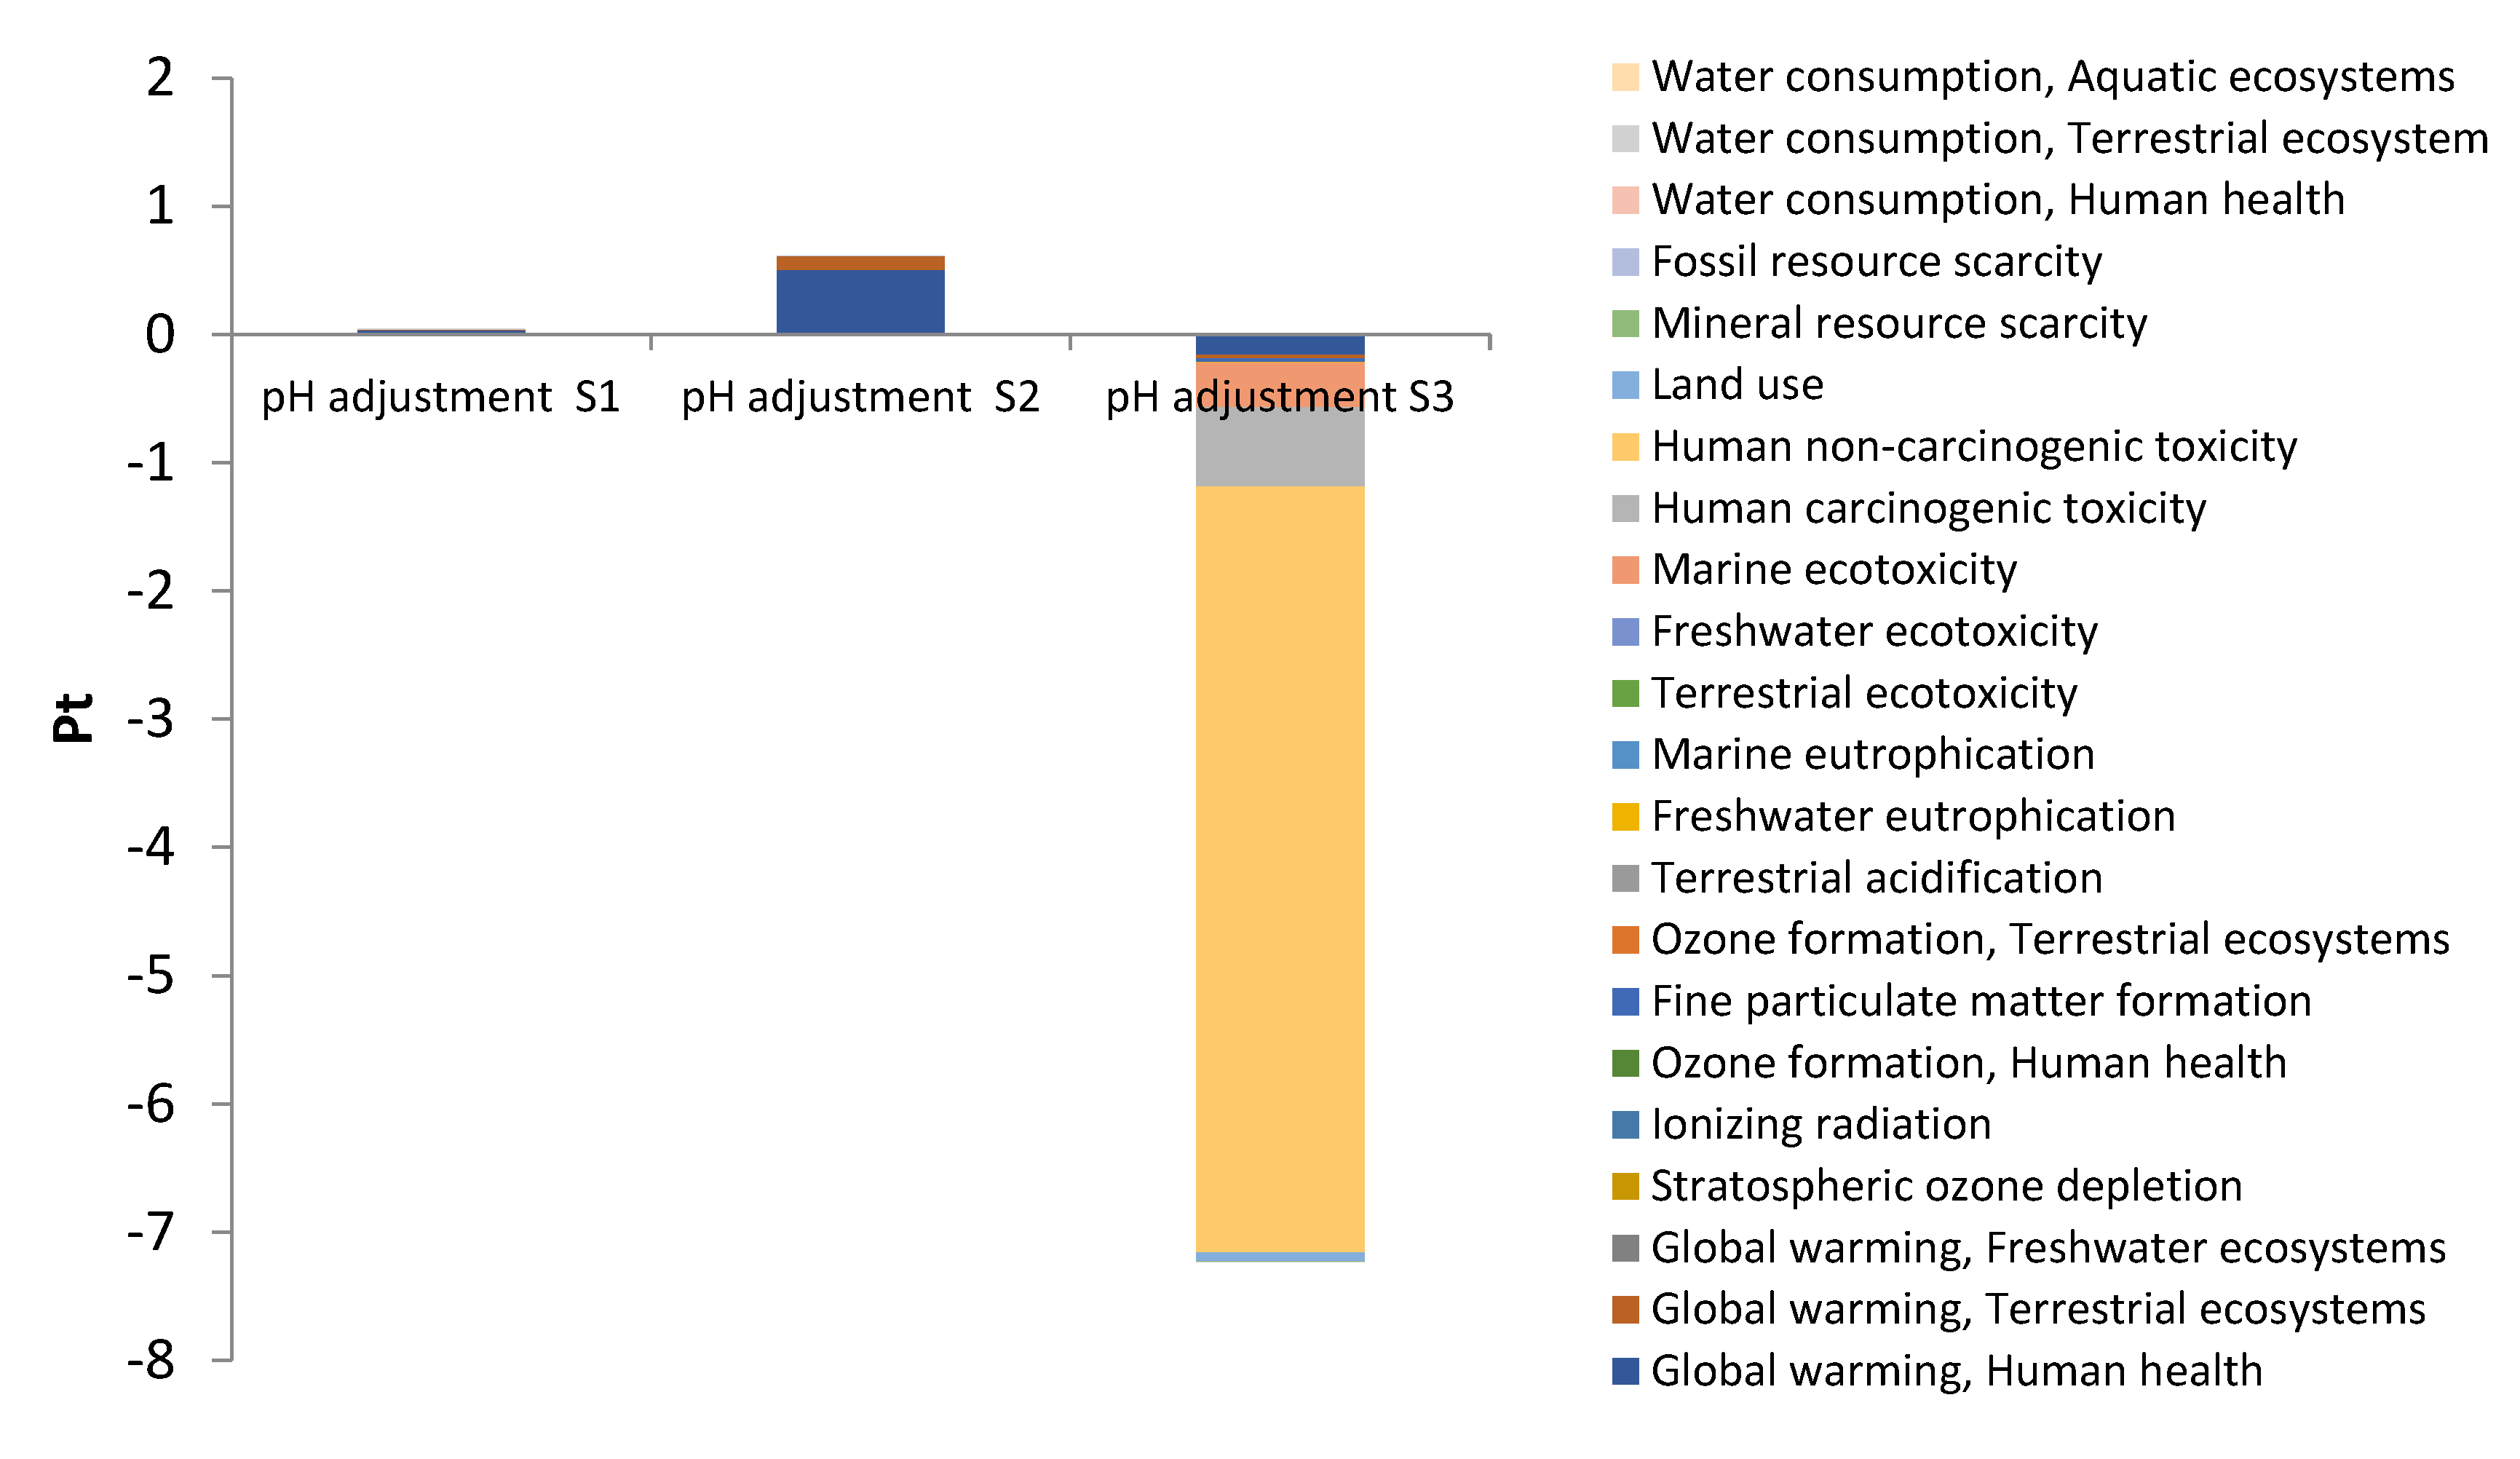
Figure 11.
Environmental impacts from sludge transport subsystem and its use as an input in brick production with ReCiPe endpoint method (E), S1- Scenario 1; S2- Scenario 2; S3- Scenario 3.
Figure 11.
Environmental impacts from sludge transport subsystem and its use as an input in brick production with ReCiPe endpoint method (E), S1- Scenario 1; S2- Scenario 2; S3- Scenario 3.
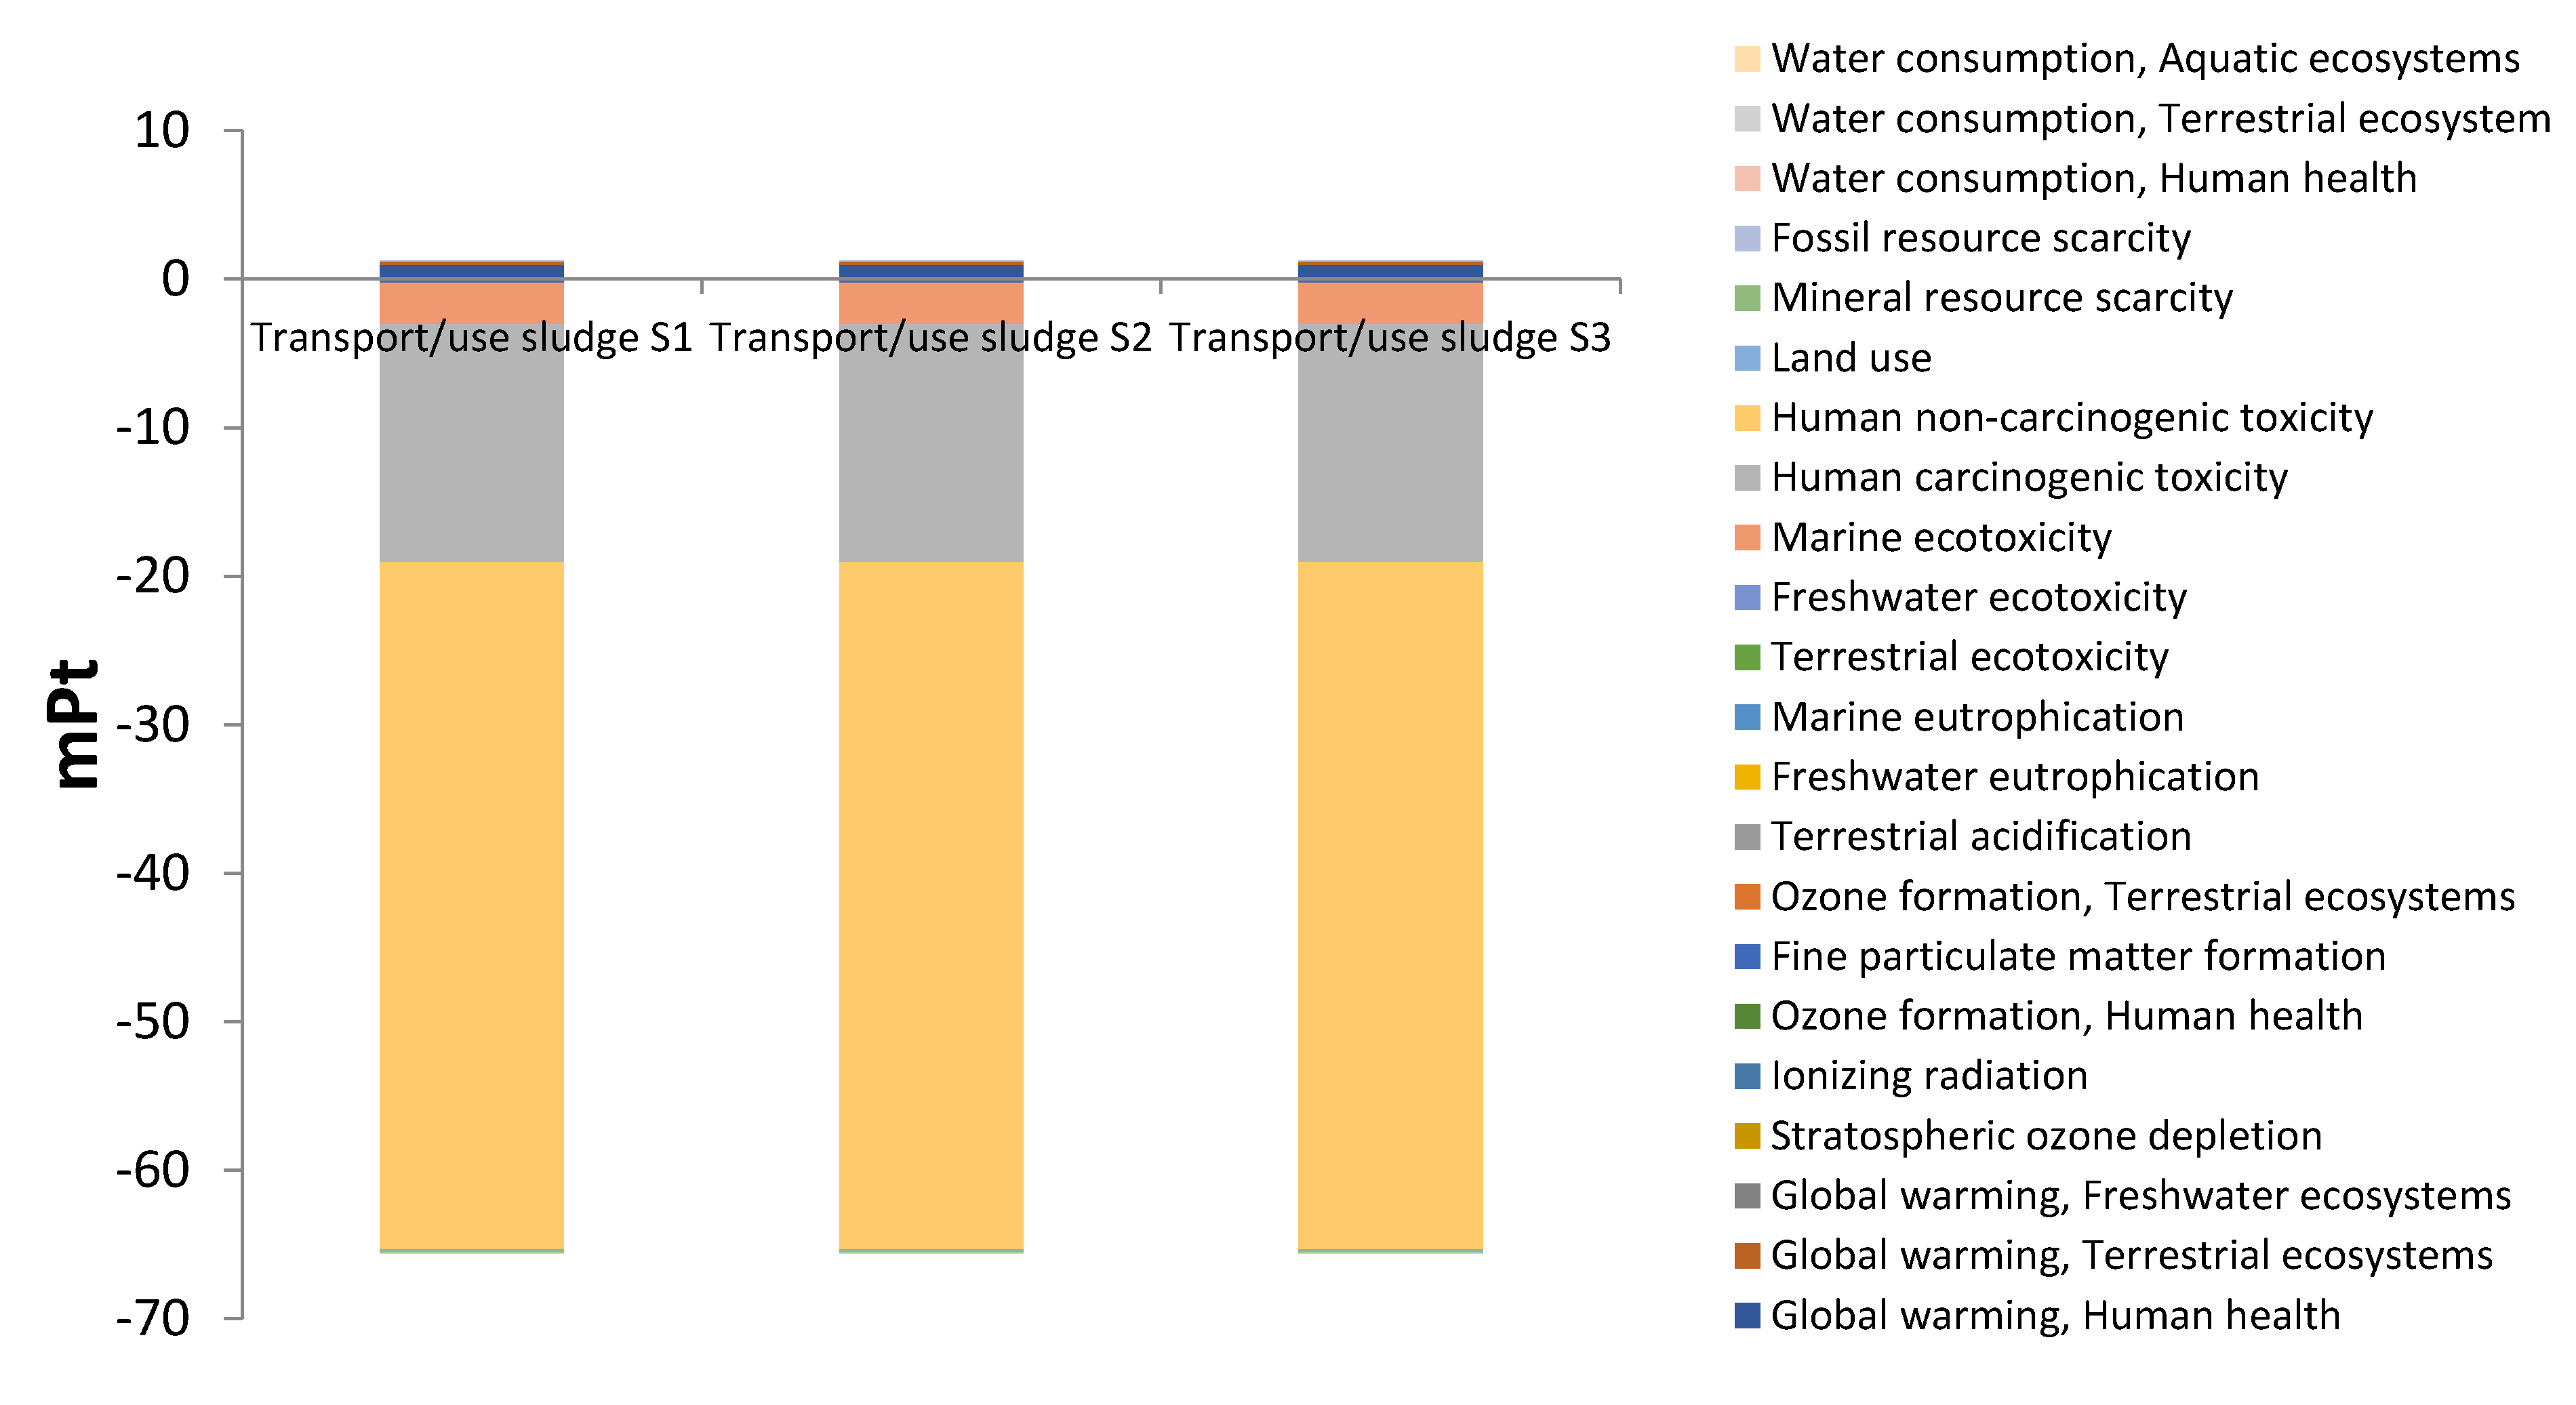

Table 1.
Scenarios description.
| Scenario | Reagent | Function |
|---|---|---|
| S1 | HCl | pH control |
| S2 | CO2 from biogas | pH control |
| S3 | CO2 from biogas | pH control and energy source |
| In scenarios S1, S2 and S3, the generated sludge was used to manufacture building bricks. | ||
Table 2.
Chemical characterization of the wastewater [30].
Table 2.
Chemical characterization of the wastewater [30].
| Parameter | Value |
|---|---|
| pH | 7.8 |
| Conductivity (µS.cm-1) | 6056.0 |
| Fluoride (mg.L-1) | 134.0 |
| Calcium (mg.L-1) | 4.4 |
| Sodium (mg.L-1) | 632.0 |
| Aluminum (mg.L-1) | <5.0* |
| Chloride (mg.L-1) | 1424.0 |
| Sulfate (mg.L-1) | 69.0 |
| Alkalinity carbonates and hydroxides (mg.L-1) | 0.0 |
| Alkalinity bicarbonates (mg.L-1) | 660.0 |
| Total phosphorus (mg.L-1) | 8.0 |
| COD (mgO2.L-1) | 106.0 |
| * Detection limit of the adopted analysis |
Table 3.
Electrocoagulation unit.
| Scenario | Input | Quantity | SimaPro® data | |
|---|---|---|---|---|
| S1, S2, S3 | Polyethylene (kg) | 2.4948E-4 | Polyethylene high density granulates (PE-HD), production mix, at plant RER | |
| S1, S2, S3 | Polyethylene molding (kg) | 2.4948E-4 | Injection molding (CA-QC) injection molding - APOS, S |
|
| S1, S2, S3 | Aluminum plate (kg) | 2.52 | Aluminum, cast alloy GLO market for APOS, S |
|
| S1, S2 | Electricity (kWh) | 2.25 | Electricity, low voltage (BR- south-eastern grid) market for electricity, low voltage APOS, S | |
| S3 | Electricity (kWh) | 2.25 | Electricity, low voltage (CH) biogas, burned in micro gas turbine 100kWe - APOS, S | |
| Functional unit: 1m3 of effluent; lifetime 25 years. | ||||
Table 4.
Sedimentation unit.
| Scenario | Input | Quantity | SimaPro® data | |
|---|---|---|---|---|
| Sedimentation tank structure | S1, S2, S3 | Steel (kg) | 8.8E-4 | Iron and steel, production mix/US |
| S1, S2, S3 | HDPE (kg) | 5.8E-6 | Polyethylene high density granulates (PE-HD), production mix, at plant RER | |
| S1, S2, S3 | Concrete (m3) | 1.0E-5 | Concrete, normal (BR) market for concrete, normal - APOS, S | |
| Motor | S1, S2, S3 | Steel (kg) | 2.4E-8 | Iron and steel, production mix/US |
| S1, S2, S3 | Steel (kg) | 6.0E-9 | Iron and steel, production mix/US | |
| S1, S2, S3 | Cast iron (kg) | 1.8E-7 | Cast iron (GLO) market for - APOS S | |
| S1, S2, S3 | Aluminum (kg) | 5.4E-9 | Aluminum alloy, AlLi (GLO) market for - APOS, S | |
| S1, S2, S3 | Cooper (kg) | 4.6E-9 | Copper sheet, technology mix, consumption mix, at plant, 0.6mm thickness EU-15 S | |
| S1, S2 | Electricity (kWh) | 0.092 | Electricity, low voltage (BR- south-eastern grid) market for electricity, low voltage APOS, S | |
| S3 | Electricity (kWh) | 0.092 | Electricity, low voltage (CH) biogas, burned in micro gas turbine 100kWe - APOS, S | |
| Functional unit: 1m3 of effluent; Lifetime of sedimentation tank: 100 years; Motor lifetime: 25 years. APOS (Allocation at the point of substitution) | ||||
Table 5.
pH adjustment unit inventory.
| Scenario | Input | Output | Quantity | SimaPro® data |
|---|---|---|---|---|
| S1, S2, S3 | Polyethylene (g) | 0.044074 | Polyethylene high density granulates (PE-HD), production mix, at plant RER | |
| S1, S2, S3 | Polyethylene molding (g) |
0.044074 | Injection molding (CA-QC) injection molding - APOS, S |
|
| S1 | HCl (L) | 2.627 | Hydrochloric acid, Mannheim process (30% HCl), at plant/RER Mass | |
| S2, S3 | Biogas (L) | 5.3966 | Biogas, from grass (CH) biogas production from grass – APOS S | |
| S3 | Electricity (kwh) | *15.04857 | Electricity, low voltage (CH) biogas, burned in micro gas turbine 100kWe - APOS, S | |
| Functional unit: 1m3 of effluent; lifetime: 25 years. *Excess energy in the process | ||||
Table 6.
Pumping unit inventory.
| Scenario | Input | Quantity | SimaPro® data | |
|---|---|---|---|---|
| Pickup pump | S1, S2, S3 | Cast iron (kg) | 2.4E-5 | Cast iron (GLO) market for – APOS, S |
| S1, S2, S3 | Stainless steel (kg) | 2.2E-6 | Steel, stainless 304, flat rolled coil/kg/RNA | |
| S1, S2 | Electricity (kWh) | 0.203 | Electricity, low voltage (BR- south-eastern grid) market for electricity, low voltage APOS, S | |
| S3 | Electricity (kWh) | 0.203 | Electricity, low voltage (CH) biogas, burned in micro gas turbine 100kWe - APOS, S | |
| Acid or biogas injection pump | S1, S2, S3 | Cast iron (kg) | 1.3E-7 | Cast iron (GLO) market for – APOS, S |
| S1, S2, S3 | Stainless steel (kg) | 9.1E-8 | Steel, stainless 304, flat rolled coil/kg/RNA |
|
| S1, S2 | Electricity (kWh) | 0.0156 | Electricity, low voltage (BR- south-eastern grid) market for electricity, low voltage APOS, S | |
| S3 | Electricity (kWh) | 0.0156 | Electricity, low voltage (CH) biogas, burned in micro gas turbine 100kWe - APOS, S | |
| Sludge pump | S1, S2, S3 | Cast iron (kg) | 2.8E-7 | Cast iron (GLO) market for – APOS, S |
| S1, S2, S3 | Stainless steel (kg) | 1.9E-7 | Steel, stainless 304, flat rolled coil/kg/RNA |
|
| S1, S2 | Electricity (kWh) | 0.0165 | Electricity, low voltage (BR- south-eastern grid) market for electricity, low voltage APOS, S | |
| S3 | Electricity (kWh) | 0.0165 | Electricity, low voltage (CH) biogas, burned in micro gas turbine 100kWe - APOS, S | |
| Treated effluent pump | S1, S2, S3 | Cast iron (kg) | 2.4E-5 | Cast iron (GLO) market for – APOS, S |
| S1, S2, S3 | Stainless steel (kg) | 2.2E-6 | Steel, stainless 304, flat rolled coil/kg/RNA |
|
| S1, S2 | Electricity (kWh) | 0.183 | Electricity, low voltage (BR- south-eastern grid) market for electricity, low voltage APOS, S | |
| S3 | Electricity (kWh) | 0.183 | Electricity, low voltage (CH) biogas, burned in micro gas turbine 100kWe - APOS, S | |
|
Pipe line |
S1, S2, S3 | PVC pipeline (m) |
3.0983E-5 | PVC pipe E |
| Functional unit: 1m3 of effluent; pumps lifetime: 25 years; pipes lifetime: 100 years (30m; 100mm). | ||||
Table 7.
Transport and use of sludge unit inventory.
| Scenario | Input | Output | Quantity | SimaPro® data |
|---|---|---|---|---|
| S1, S2, S3 | Transport (t.km) | 0.360045 | Transport, truck 10-20t, EURO5, 80%LF, empty return/GLO Mass | |
| S1, S2, S3 | Sludge (kg) | 7.41 | Clay (RoW) market for clay - APOS.U | |
| Functional unit: 1m3 of effluent; distance 40.5km; t.km – tons.km | ||||
Disclaimer/Publisher’s Note: The statements, opinions and data contained in all publications are solely those of the individual author(s) and contributor(s) and not of MDPI and/or the editor(s). MDPI and/or the editor(s) disclaim responsibility for any injury to people or property resulting from any ideas, methods, instructions or products referred to in the content. |
© 2025 by the authors. Licensee MDPI, Basel, Switzerland. This article is an open access article distributed under the terms and conditions of the Creative Commons Attribution (CC BY) license (http://creativecommons.org/licenses/by/4.0/).
Copyright: This open access article is published under a Creative Commons CC BY 4.0 license, which permit the free download, distribution, and reuse, provided that the author and preprint are cited in any reuse.


