

Submitted:
16 September 2025
Posted:
17 September 2025
You are already at the latest version
Abstract
In the context of China’s ongoing ecological restoration and livelihood transition policies, understanding how large-scale environmental interventions shape the economic resilience and well-being of herder households is crucial for designing sustainable and socially inclusive conservation strategies. Based on 266 household-level survey data from the Yellow River Source Region of Sanjiangyuan National Park, we construct an indicator system for evaluating economic resilience and employ multiple linear regression to examine the impacts of the three-decade-long Grazing Withdrawal Project on herders’ economic resilience and subjective well-being, while simultaneously testing the mediating role of economic resilience in translating the project into enhanced welfare. Results reveal that households in the Yellow River Source Region were characterized by "low economic resilience yet high subjective well-being." Among the three resilience dimensions, recovery capacity and reorganization capacities were comparatively weak; economic resilience had a significant positive impact on herders' well-being, partially mediating the relationship between policy variables and subjective well-being; compared with other policy measures, subsidy adequacy and emergency support remained the primary drivers of subjective well-being. Future policy should innovate a diversified subsidy regime that maintains herders’ subjective well-being while making up for the shortcomings of reorganization capacity, thereby securing the sustainability of livelihoods alongside ecological conservation.
Keywords:
economic resilience
; subjective well-being
; Sanjiangyuan
; Grazing Withdrawal Project
1. Introduction
In recent years, the rapid transformation of global socioeconomic development and the increasing frequency of extreme climatic disasters have severely compromised the livelihood stability of impoverished and vulnerable groups, particularly agro-herders [1,2,3,4]. In the context of sustainable development, resilience has attracted increasing attention due to its integration of the multi-dimensional capabilities of “resistance - recovery - transformation”, and international anti-poverty programs have prioritized supporting rural households in building resilience to multiple shocks [5,6]. In China, with the historic eradication of absolute poverty after 2020, the focus of academic and policy circles has shifted from “income attainment” to “endogenous motivation” [7]. Grassland ecosystems, covering approximately 40% of the global terrestrial area and serving as one of the world’s most critical carbon sinks while supplying 30–50% of global livestock products [8,9], currently face severe threats from persistent degradation driven by climate change and socioeconomic activities. As grasslands gain increasing prominence in the sustainable development agenda, and researching the resilience of herder households and its influencing mechanisms is crucial for policy formulation [10].
The Tibetan Plateau is a global research hotspot for grassland degradation [11], while the Sanjiangyuan region—located in its hinterland and known as “Asia’s Water Tower” for being the source of the Yangtze, Yellow, and Lancang Rivers—holds exceptional ecological significance [12]. For nearly two decades, scholars have focused on human–environment conflicts in this region, where a series of conservation policies—primarily the Grazing Withdrawal Project (GWP, launched in 2003) [13,14]—have been implemented, and have conducted extensive research on herders’ livelihood capital, adaptation strategies, and subjective well-being under the influence of these policies. These studies reveal that such policies have substantially altered traditional nomadic pastoralism—including changes in grazing rights, pastoral practices, settlement patterns, and income sources [15]. Overall, supported by China’s protected area system and targeted poverty alleviation strategy, herders’ subjective well-being and policy satisfaction remain relatively high [16,17]. Yet, it remains uncertain whether current policies can sustainably consolidate these achievements in the face of future shocks such as rising living costs and sudden emergencies; a resilience lens is therefore needed to examine the viability of sustained well-being protection and its underlying issues.
However, existing literature has paid limited attention to the impact of the GWP on herders’ resilience [18,19], leaving the mechanisms through which such policy interventions affect household resilience and well-being poorly understood. To address these gaps, this study takes Maduo County, located in the Yellow River source region, as an empirical case. We construct a composite index of household economic resilience and apply multiple linear regression to assess the effects of the GWP on both economic resilience and subjective well-being among herder households. Furthermore, a mediation analysis is conducted to test whether economic resilience serves as a transmission mechanism linking the GWP to improved well-being outcomes. This approach provides a nuanced understanding of the pathways through which conservation policies enhance herders’ welfare, thereby offering insights for the design of targeted and effective socio-ecological policies. The remainder of this paper is structured as follows. Section 2 introduces the analytical framework, study area, data sources, and methodology. Section 3 presents the empirical results, Section 4 provides a comprehensive discussion, and Section 5 concludes the study by summarizing key findings and outlining policy implications.
2. Literature Review and Analytical Framework
The concept of resilience originated in physics and engineering, referring to a material’s capacity to absorb external forces and return to its original state after deformation [20]. It has since been adopted across disciplines including ecology, psychology, sociology, computer science, and public administration [21]. Reggiani et al. argue that resilience serves as a key explanatory factor for differential responses to shocks across systems [22]. In the context of household development, related conceptualizations include economic resilience, household developmental resilience, livelihood resilience, etc. [18,19,23,24]. Economic resilience, applicable to various economic entities such as individuals, families, and countries, constitutes a key dimension of resilience theory [24,25,26]. Household economic resilience includes capabilities in various aspects such as adaptation, recovery, learning and innovation [19,27], enabling families to avoid poverty when facing various pressures [2,28]. Families with strong economic resilience usually have stronger risk resistance, adaptability and livelihood sustainability [29].
As an ecologically sensitive region of high national priority, Sanjiangyuan has received growing scholarly attention concerning herders’ resilience and its determinants, and studies have revealed a complex and often contradictory picture. For instance, Li et al. measured livelihood resilience among herders in the headwater zones, finding moderately high levels overall, with greater resilience observed among households engaged in livelihood diversification, multi-household joint grazing, and new energy adoption [15]. In contrast, Zhao et al. reported notably low overall livelihood resilience—particularly in self-organizing capacity—among herders in Tongde and Gonghe Counties [18]. Factors influencing resilience also varied. Some studies indicate that climate stressors such as rising temperatures and reduced precipitation have been shown to negatively affect resilience, and cash subsidies could serve as a key mechanism for enhancing household economic resilience and mitigating these climatic impacts [1,28]. However, the effectiveness of such subsidies was found to be non-significant in certain regional contexts [7]. Beyond financial transfers, infrastructure improvement, credit access, and information sharing have also demonstrated positive effects on resilience in some agro-pastoral zones [7]. Overall, these findings underscore considerable spatial heterogeneity in both resilience levels and policy effectiveness, reflecting the diverse socio-ecological conditions across the Tibetan Plateau.
In recent years, international consensus has increasingly recognized economic growth as a means toward sustainable development, with human well-being constituting its ultimate end. Well-being encompasses both objective and subjective dimensions. Subjective well-being—while grounded in objective conditions—captures cultural, spiritual, and aspirational variations, thus gaining scholarly traction [30]. Existing studies indicate that household resilience positively influences subjective well-being [31]. Economically resilient households adjust development pathways more effectively to buffer shocks, thereby maintaining stable welfare improvements amid uncertainty [32]. Key mechanisms underpinning this stability include income and consumption smoothing, strengthened intra-household social and material support, as well as improved self-esteem and sense of achievement among members [2,23].
To elucidate the mechanisms shaping resilience of herder households and their relationship with subjective well-being in specially protected pastoral regions such as Sanjiangyuan, and to identify key influencing variables, this study develops an analytical framework based on a synthesis of existing literature. As shown in Figure 1, the framework positions the GWP as the independent variable, subjective well-being as the dependent variable, and household economic resilience as the mediating variable, positing that the GWP influences herders’ subjective well-being both directly and indirectly through this mediating mechanism. The study further proposes the following three hypotheses:
H1:
The GWP has a significant positive effect on household economic resilience.
H2:
The GWP has a significant positive effect on herders’ subjective well-being.
H3:
Household economic resilience mediates the relationship between the GWP and subjective well-being.
3. Materials and Methods
3.1. Overview of GWP in the Sanjiangyuan Region
By the early 21st century, severe grassland degradation had occurred in China, displacing many herders as “ecological refugees”. In response, China launched the GWP and designated Sanjiangyuan region as one of the first pilot zones for grazing prohibition. As a pioneering reform in pastoral management without precedent, the measures of GWP have been continuously adjusted based on operational feedback (See Table 1). Core interventions include grazing bans, ecological relocation, grassland-livestock balance systems, construction of enclosed sheds and pens, and degraded black-soil beach rehabilitation. Additionally, as a nationally prioritized protected area, the region has seen its conservation status elevated from a provincial nature reserve to a national park since 2000. While ecological protection efforts have been continuously strengthened, grazing restrictions imposed on local herders have also intensified.
3.2. Profile of Research Area
Situated in the northeastern Qinghai-Tibet Plateau (96°50′–99°20′ E, 33°50′–35°40′ N) at an average elevation exceeding 4,200 meters, Maduo County features gentle topography and numerous rivers and lakes, serving as the headwater of the Yellow River (Figure 2). It spans approximately 25,300 km² and administers four townships: Machali, Huashixia, Huanghe, and Zhalinghu. By the end of 2023, the resident population was 14,870, over 90% of whom were Tibetan. Benefiting from abundant water and pasture resources, in the early 1980s, Maduo recorded the highest per capita net income among herders nationwide for three consecutive years through extensive expansion of animal husbandry. Subsequently, severe ecological degradation caused by overgrazing and mining, exacerbated by stringent conservation restrictions, led to the stagnation of pastoral development, ultimately resulting in its designation as a nationally recognized poverty-stricken county in 2011.
The most impactful policy measures on the Maduo include grazing restrictions, resettlement programs, ecological compensation, and eco-guardian system, etc. Approximately 84.66% of the county’s utilizable grassland falls under conservation measures, with grazing bans and grassland-livestock balance systems covering 74.22% and 25.78% of this area, respectively. Two large-scale relocations have occurred: first, an ecological migration from 2004 to 2007 transferred about 2,022 herders (≈25% of the population then) to collective villages; second, a poverty-alleviation relocation initiated in 2016 resettled 4,473 herders (over one-third of the population then) around the county seat. Against the backdrop of a growing population, the allocation of grassland ecological subsidies has shifted from a land area-based model to a per capita system, currently amounting to approximately CNY 9,000 per person per year. Other forms of subsidies include support for vulnerable groups (CNY 5,600/year for individuals under 16 or over 55), fuel subsidies (CNY 2,000/year), pensions, and subsistence allowances. Additionally, 3,142 ecological inspector positions have been created, providing an annual income of CNY 21,600 per family. Overall, policy-driven subsidies have become a major component of herder households’ annual income. In 2019, Maduo County achieved full poverty alleviation under targeted national strategies. By 2023, per capita disposable income of rural residents reached CNY 11,738, a 7.0% year-on-year increase.
3.3. Data Sources
Field surveys were conducted in July and August of 2021–2023 using participatory questionnaire survey method to understand the socio-economic situation and implementation of GWP in Maduo County, as well as the livelihood status, subjective well-being, and GWP evaluation of herdsmen. A stratified random sampling approach was employed, covering 283 herders’ households across Maduo’s four townships, with 266 valid questionnaires retained. The sample distribution was 36.09% from Huanghe Township, 31.20% from Zhalinghu Township, 20.30% from Machali Town, and 12.41% from Huashixia Town. In Huanghe Township, the survey focused on herders relocated in 2006 to Guoluo New Village in Tongde County, Hainan Prefecture; in Zhalinghu Township, the survey focused on herders relocated in 2004 to Heyuan New Village in Maqin County, Guoluo Prefecture. Additional methods included government seminars, field visits to project sites, and interviews with key grassroots staff, generating nearly 30,000 words of qualitative records. The sample was gender-balanced (55% male, 45% female). Among the respondents, approximately 82 % were household heads aged 20–60, of whom 76.7 % had received no formal schooling. Average household size was 3.85 members, and 62.93% of the surveyed households experienced expenditures exceeding incomes.
3.4. Variable Selection
The variables selected for this study are presented in Table 2, consisting of four main components: the dependent variable, control variables, explanatory variables, and the mediating variable. The dependent variable is the subjective well-being of herders. Control variables include basic characteristics at both the individual and household levels. Explanatory variables comprise key policy measures and policy implementation variables. The mediating variable is the household economic resilience of herders under the GWP.
3.4.1. Dependent Variable
Subjective well-being, as defined by the OECD Guidelines on Measuring Subjective Well-being (2013), comprises three core dimensions: life evaluation, affective experience, and eudaimonic well-being [33]. Psychologists often treat subjective well-being as an umbrella term capturing how individuals perceive their lives. Measurement typically relies on self-reporting through: 1) a single-item global life satisfaction question, 2) a weighted composite score of satisfaction across life domains, or 3) multi-dimensional scales [34,35]. This study employed a single-item measure to assess subjective well-being: respondents were asked, “How would you rate your overall subjective well-being?” Responses were recorded on a 5-point Likert scale ranging from 1 (very unhappy) to 5 (very happy).
3.4.2. Control Variables
Subjective well-being is influenced by numerous factors, including individual characteristics (e.g., age, gender, education, health, marital status, income), living conditions (e.g., housing, food security, transportation), and socio-cultural elements (e.g., religion, cultural norms), all of which have demonstrated significant correlations in various studies [36,37,38]. Given the context of Maduo County, we selected three individual-level variables (gender, age, occupation) and three household-level variables (labor force ratio, highest education level in the household, per capita health status) as control variables.
3.4.3. Explanatory Variables
The grassland conservation program employs a mix of policy instruments to regulate herders’ land-use behaviors, including coercive measures (e.g., grazing bans, livestock reduction, resettlement), incentive-based tools (e.g., forage subsidies, grassland awards), and supply-side interventions (e.g., artificial pasture construction, degraded grassland restoration). While this regulatory network aims to steer behaviors toward policy goals, it simultaneously disrupts livelihood foundations, income sources, social roles, and networks, and often opportunistic adaptation strategies from affected households. As the headwater of the Yellow River and an early pilot zone for the GWP , Maduo’s experience highlighted the pronounced impacts of resettlement, cash subsidies, and public welfare employment on herders’ livelihoods [39]. Thus, this study selected three policy measure variables (subsidy adequacy, resettlement distance, effectiveness of employment support) and two policy implementation variables (awareness of policy communication, availability of emergency support) as explanatory variables.
3.4.4. Mediating Variable
High resilience implies the ability to rapidly restore function and supply chains during crises by mobilizing internal and external resources, typically encompassing three core capacities: resistance capacity, recovery capacity, and reorganization capacity [2,40]. Drawing on established resilience frameworks and local conditions, we constructed a household economic resilience index with these three dimensions. Resistance capacity reflects a household’s capacity to withstand shocks in the post-GWP context, measured by changes in annual income, relative living standards, and income-expenditure balance. Recovery capacity captures the ability to recover quickly after shocks, assessed through income stability, expenditure-income ratio, number of available helpers and access to credit. Reorganization capacity indicates self-reconfiguring and developmental capacity, evaluated via market accessibility, development willingness, potential livelihood channels, and long-term planning. Indicators were normalized using Min-Max Normalization Method, and weights were assigned via Entropy Weight Method. The composite economic resilience index and its three dimensional sub-indices were calculated accordingly. Detailed indicators are presented in Table 3.
3.5. Research Methods
3.5.1. Mediation Effect Model
Following the approach of Wen [41] and using SPSS Statistics 26 (International Business Machines Corp, Armonk, New York, USA), a three-step regression analysis, utilizing multiple linear regression modeling, was employed to examine the mediating role of household economic resilience. The analysis was performed using SPSS Statistics 26 (International Business Machines Corp, Armonk, New York, USA). (International Business Machines Corp, Armonk, New York, the United States of America). This approach investigates how support policies under the GWP influence subjective well-being through economic resilience. The modeling procedure is as follows:
where represents the subjective well-being of herder i; represents the mediating variable, household economic resilience; denotes the core explanatory policy variables; includes individual and household characteristics; and are the intercept; ,,,, and are parameters to be estimated; and is the error term. Equation 1 specifies the impact of policy variables on subjective well-being as the baseline regression model. Equations 2 and 3 construct the model for examining the mediating effect of economic resilience. If, , and are statistically significant, while becomes non-significant, full mediation is indicated. If all four coefficients (, , and ) are significant but the magnitude of decreases relative to , partial mediation is indicated.
3.5.2. Coupling Coordination Degree Model
The coupling coordination degree model is widely employed to assess the synergistic development between different systems. In this study, it is adopted to evaluate the coordination level among the three dimensions of household economic resilience. The formulas are specified as follows:
where C denotes the coupling degree, reflecting the intensity of interaction and interdependence among the three capacities., and represent risk resistance, inherent adaptability, and reorganization capacity, respectively. CD indicates the coupling coordination degree, quantifying the level of benign synergy among these dimensions. A higher CD value implies greater consistency and harmonization in the public value delivered by the GWP. Given the equal importance of each capacity, the coefficients are all set to 1/3 . The C is classified into ten progressive levels from 0 to 1, ranging from “extremely uncoordinated” (0.000–0.099) to “premium coordination” (0.900–1.000), following the widely accepted decile partitioning scheme [42].
4. Results
4.1. Descriptive Statistics
4.1.1. Herders’ Subjective Well-Being
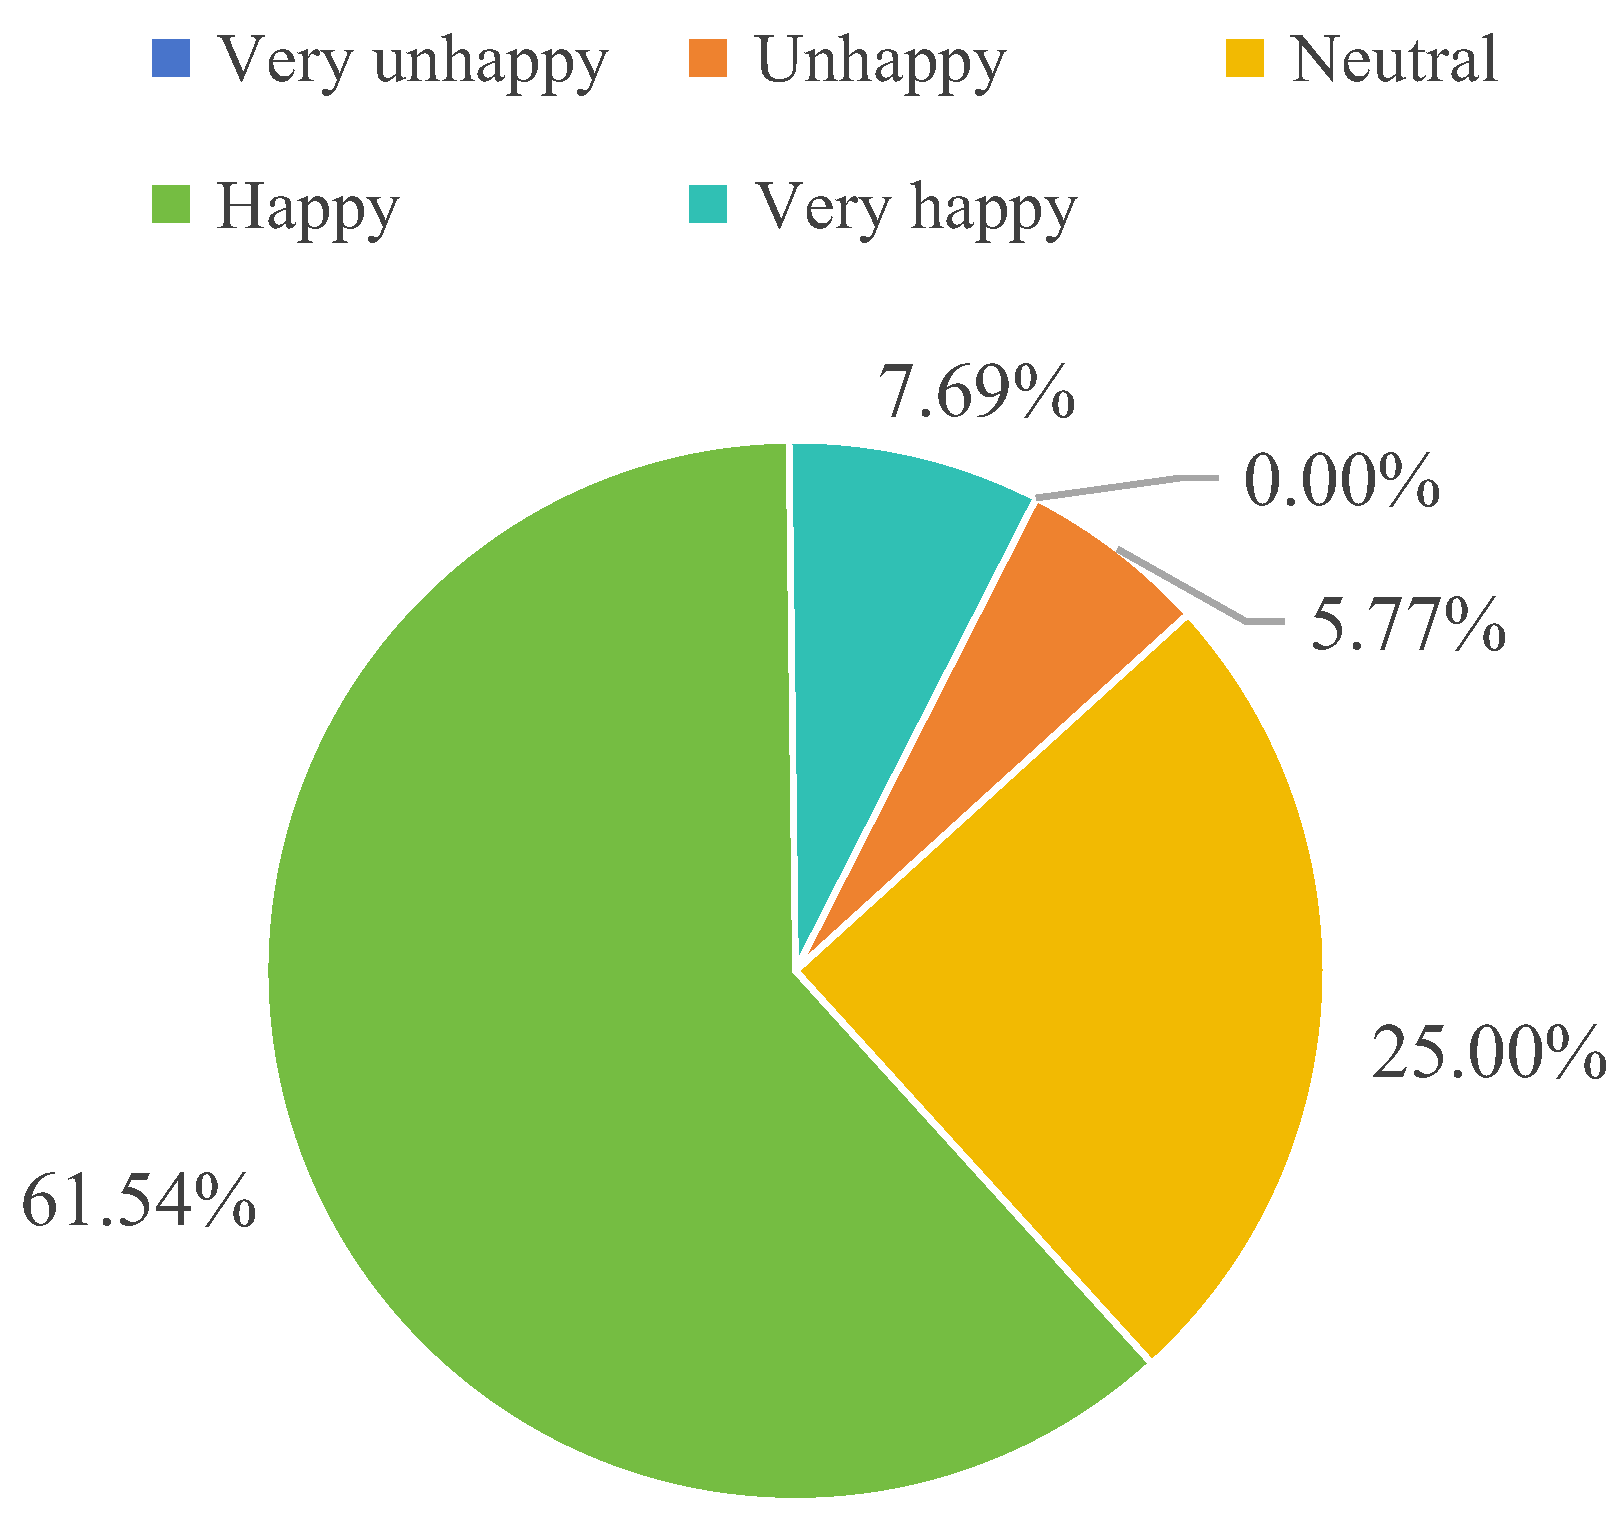
The average self-reported happiness score was 3.71, falling between “moderately happy” and “very happy. Specifically, the distribution was as follows: 5.77% reported being unhappy, 25.00% neutral, 61.54% happy, and 7.69% very happy. No households reported being “Very unhappy,” indicating a generally high level of subjective well-being among herders in Maduo. Across life domains, satisfaction scores all exceeded 3.0, with particularly high ratings for neighborhood relationships, leisure time, and work conditions [39]. This suggests that despite local economic underdevelopment and restrictions on grassland use, extensive and sustained fiscal transfers and support policies at the national level have effectively safeguarded living standards, fostering considerable life satisfaction—a finding consistent with previous studies.
Figure 3.
Distribution of happiness among herders in Maduo County.
4.1.2. Herders’ Household Economic Resilience
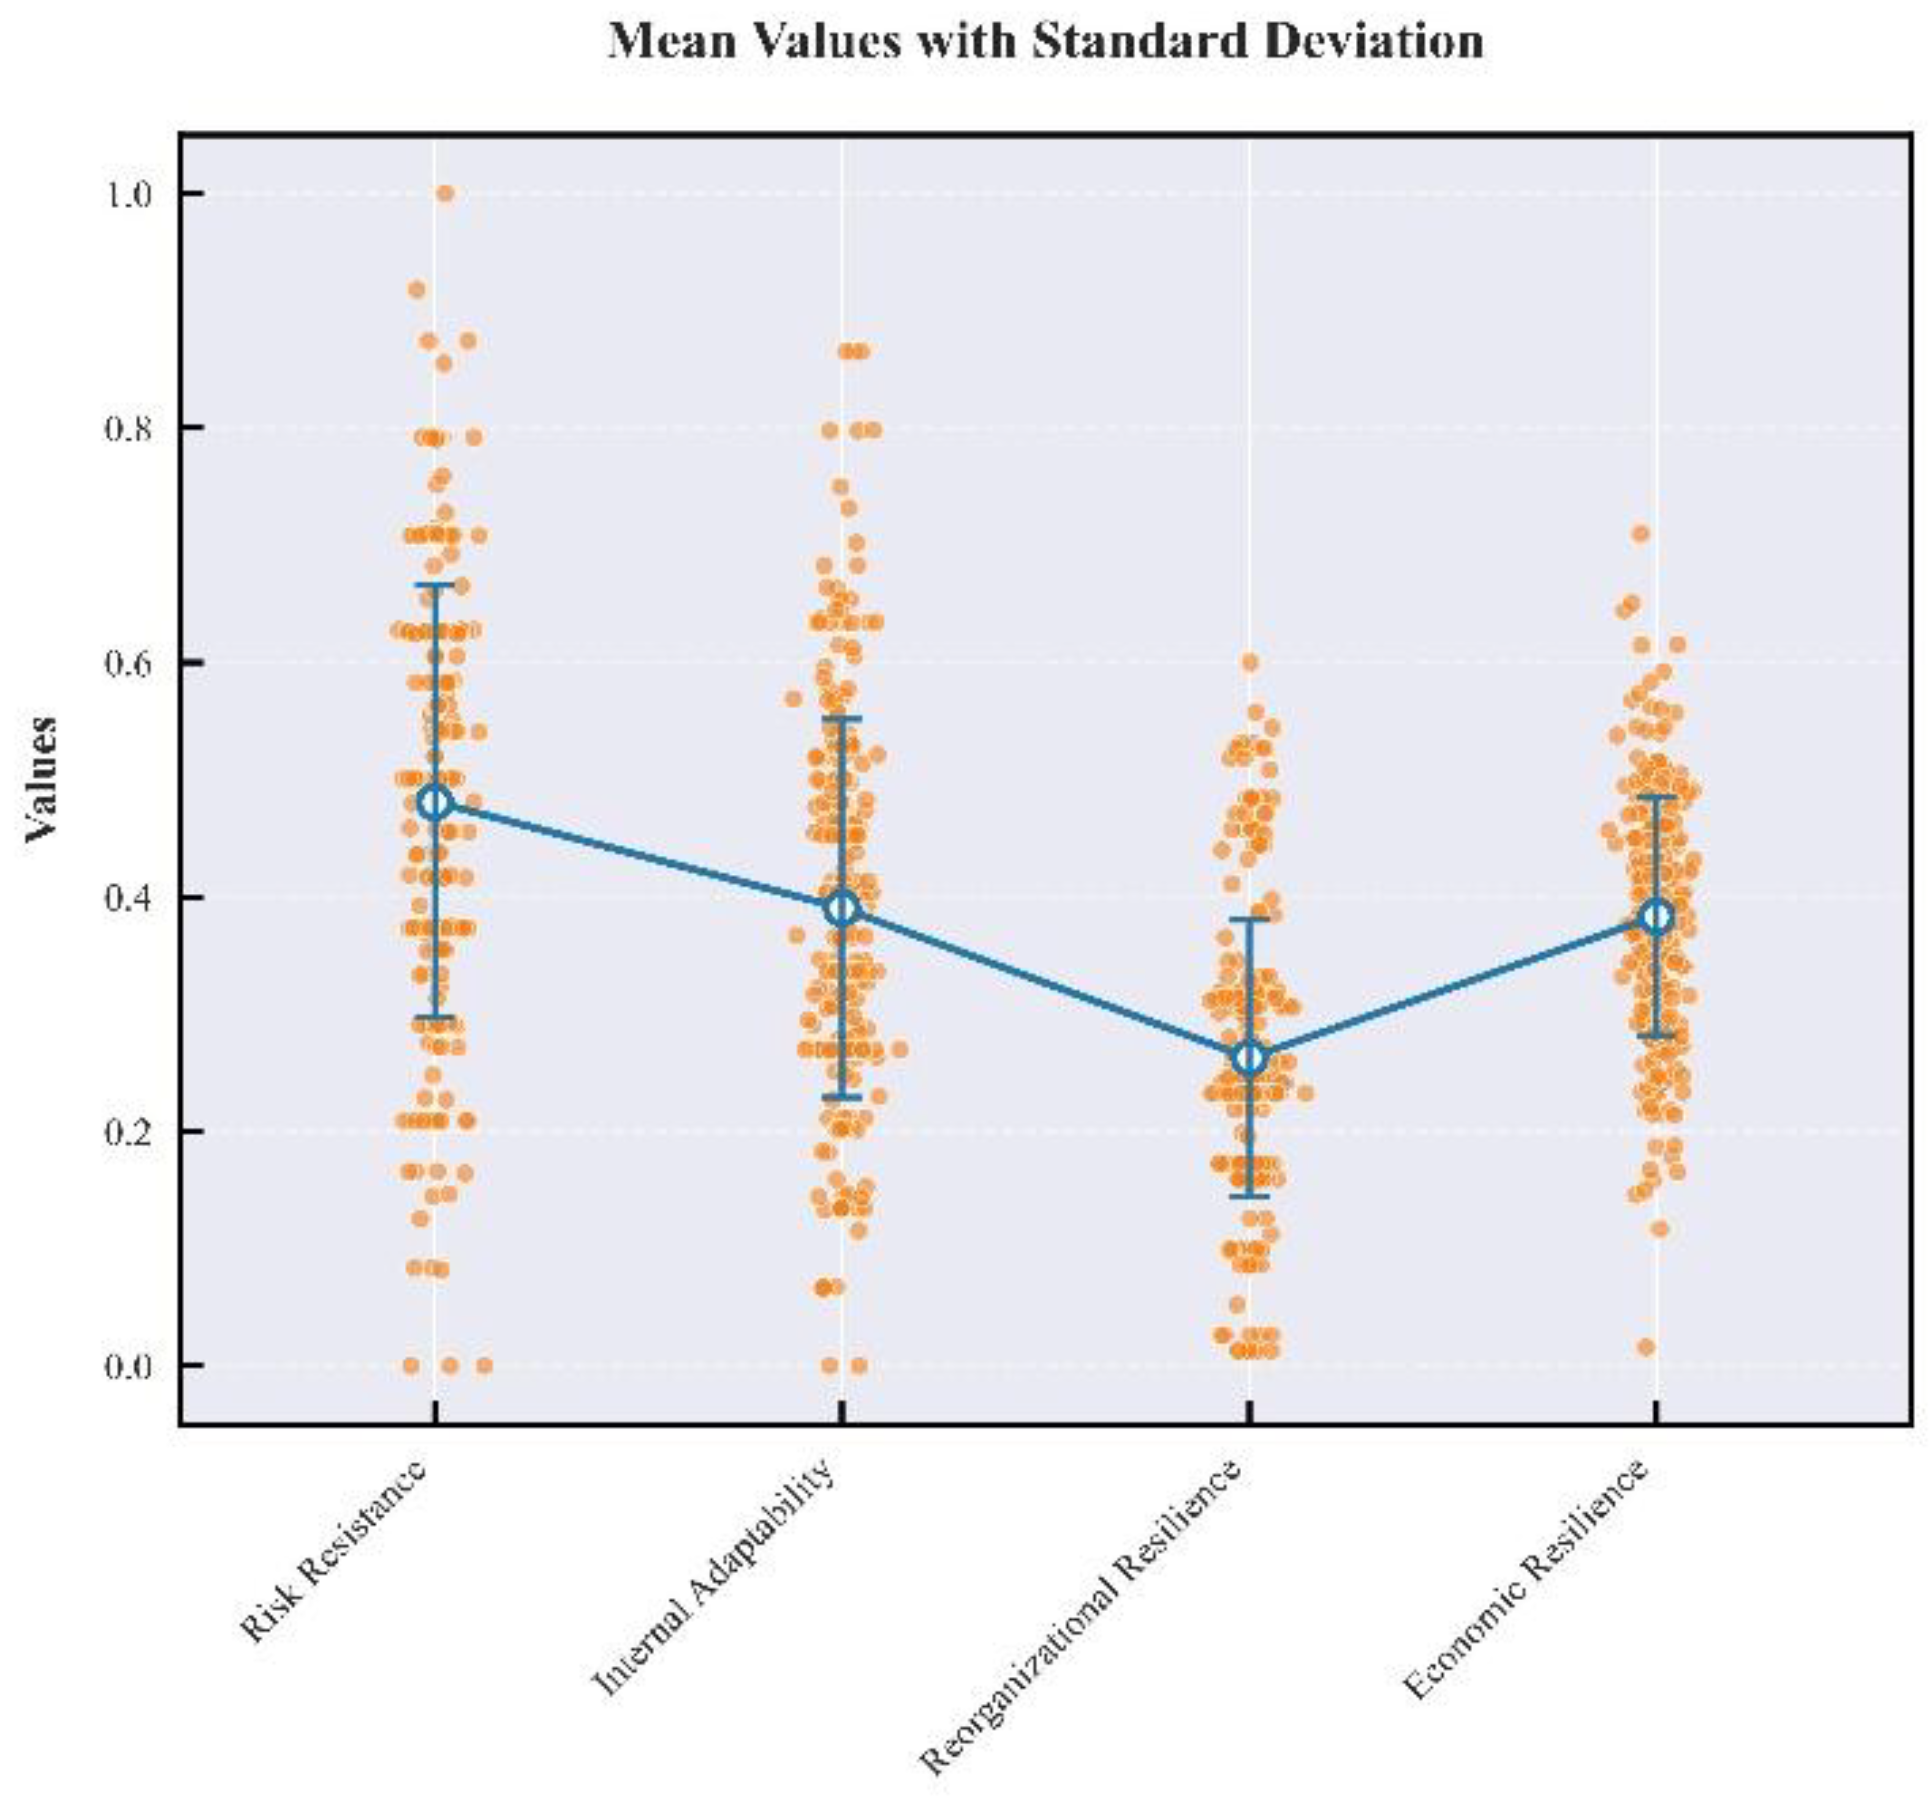
The household economic resilience and its three dimensional sub-indices were shown in Figure 1. Household economic resilience was notably low (mean = 0.384). The dimensional scores—resistance capacity (0.481), recovery capacity (0.391), and reorganization capacity (0.263)—were all below 0.5, indicating a “low-level, low-disparity” pattern. This suggests that local herders remain highly vulnerable to poverty when confronted with external shocks, with reorganization capacity persisting as the most critical constraint. Considering the standard deviation, the risk resistance was slightly stronger but the standard deviation (SD = 0.184) was large, indicating that under the supportive GWP measures, the overall livelihood level of herders had not been significantly negatively impacted, but there were significant differences between households. In contrast, reorganization capacity showed the lowest dispersion (SD = 0.118), indicating uniformly limited self-reorganizing abilities among households. Overall, the development of herders’ families remains trapped in an “absorption-recovery” phase, lacking momentum for transition to “learning and reorganization” phase, which poses risks for long-term sustainability.
Figure 4.
The economic resilience of herders’ household in Maduo County.
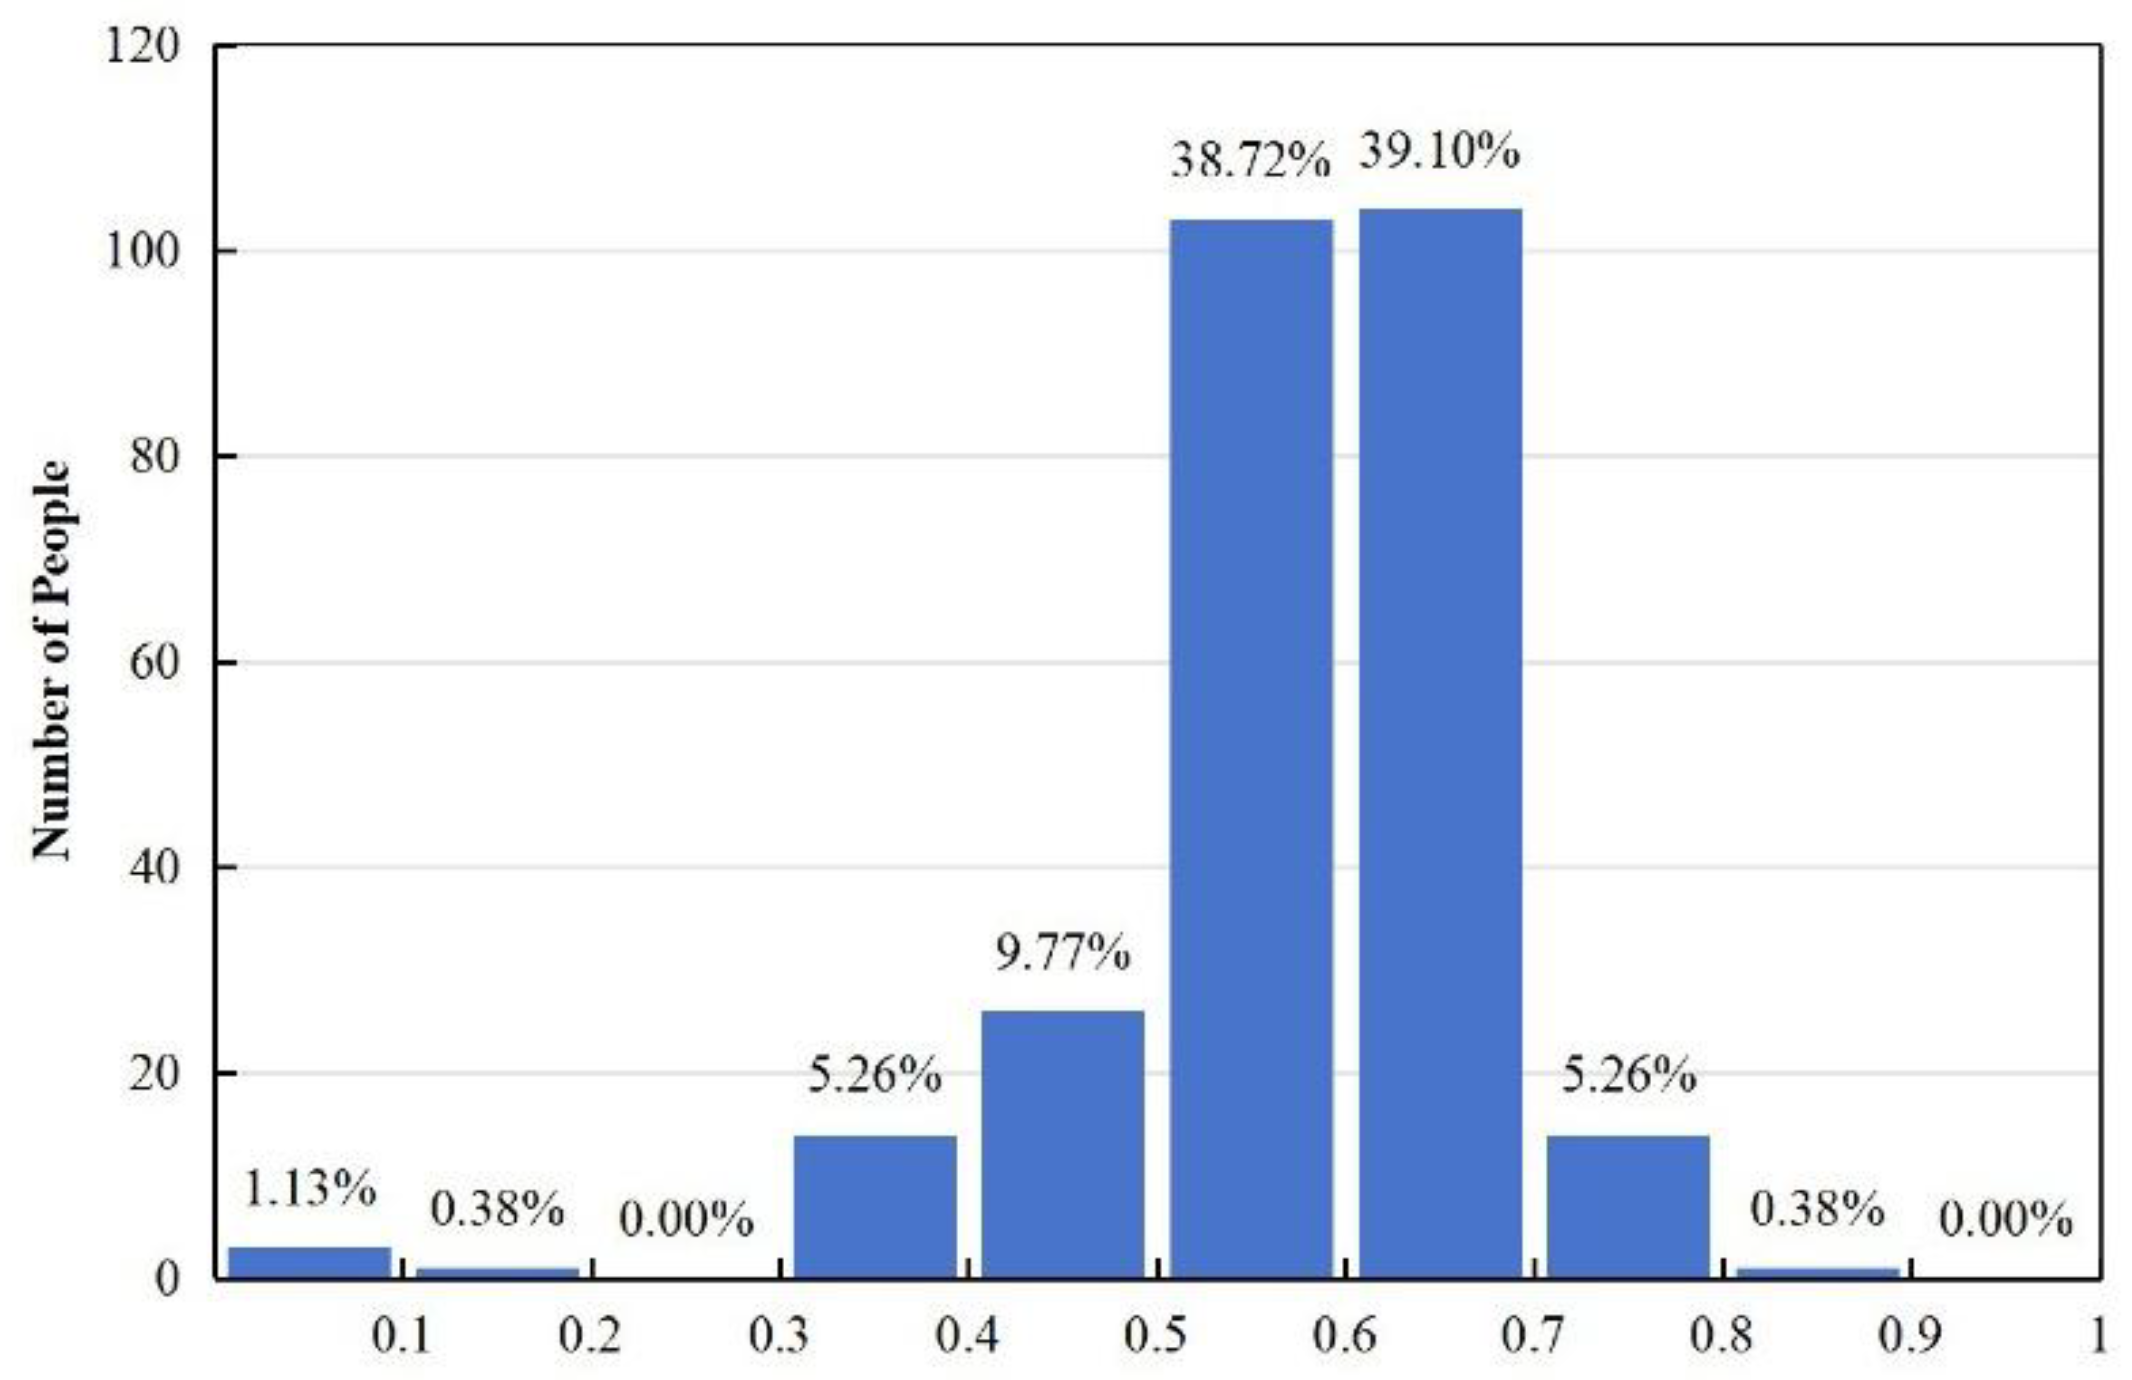
The coordination among resistance, adaptability, and reorganization capacities enables households to maintain functional and structural integrity amid environmental changes. The results of coupling coordination degree analysis revealed a “central clustering with bipolar divergence” pattern, with a mean CD of 0.575, indicating a barely coordinated level. Primary coordination (39.10%) and marginal coordination (38.72%) dominated, while only 5.7% reached moderate or good coordination levels. Conversely, 16.6% of households experienced varying degrees of imbalance. This indicates weak mutual reinforcement among resilience dimensions for most households. Without targeted interventions—particularly to bolster reorganization capacity—current policies are unlikely to break the stagnant coordination pattern, potentially exacerbating dissonance and triggering renewed risks of herders returning to pastoralism and poverty.
Figure 5.
Coupling coordination degree of herders’ household economic resilience in Maduo County.
4.2. Impact of the GWP on Subjective Well-being and Household Economic Resilience
4.2.1. Impact of the GWP on Subjective Well-Being
Three OLS regression models were constructed with the herders’ subjective well-being as the dependent variable. Results in Table 5 indicate that control variables—including gender, age, occupation, and household characteristics—showed no significant effects on subjective well-being. Among policy variables, both subsidy adequacy and emergency support exhibited statistically significant positive coefficients at the 1% level (β = 0.359 and β = 0.227, respectively). The stronger effect of subsidy adequacy suggests it plays a relatively more substantial role in enhancing herders’ well-being. Moreover, as herders in Maduo County live with significant uncertainty due to policy impacts, government support during times of hardship is crucial for consolidating their well-being.
4.2.2. Impact of the GWP on Household Economic Resilience
Three OLS regression models were constructed with the household economic resilience as the dependent variable, sequentially incorporating personal characteristics, household attributes, and policy variables. Results in Table 6 indicate that among individual and household variables, only occupation exerted a significant positive effect on economic resilience, underscoring the role of policy-supported public welfare employment in consolidating household adaptive capacity. Among policy variables, subsidy adequacy emerged as the most critical factor, demonstrating a statistically significant positive impact (P < 0.01) in Model 3.
Distinct drivers influenced each resilience dimension. Subsidy adequacy and emergency support significantly enhanced resistance capacity, with subsidy adequacy exhibiting the strongest effect (P < 0.01), confirming its dominant role in bolstering risk resistance. No policy variables significantly improved adaptive recovery capacity. For reorganization capacity, the highest education level within the household, popularity of policy promotion, and effectiveness of employment support showed significant positive effects. Household education level was particularly influential (P < 0.01), suggesting that families with higher educational attainment—often those prioritizing children’s schooling—demonstrate greater long-term developmental planning.
In summary, while subsidy policies strengthened overall resilience, their impact was primarily channeled through risk resistance (β = 0.142), with negligible effects on recovery capacity (0.031) and reorganization capacity (0.018). This indicates that prolonged subsidy provision alone insufficiently fosters self-sustaining development capabilities. Conversely, enhancing educational access effectively targets the reorganization capacity deficit, offering a strategic pathway for resilience building.
4.2.3. Mediating Role of Household Economic Resilience
A three-step regression approach was used to test the mediating effect of economic resilience between the GWP and subjective well-being. When separately regressing the two significant policy variables, subsidy adequacy and availability of emergency support, on subjective well-being without resilience, the coefficients were 0.379 (Model 1) and 0.265 (Model 4), both significant at the 1% level. When regressing these two policy variables on economic resilience in Models 2 and 5, they significantly affected household economic resilience at the 1% level (β = 0.045) and 5% level (β = 0.028), respectively. After introducing economic resilience into the regression of policy variables on subjective well-being, the coefficients decreased from 0.379 to 0.276 (Model 3) and from 0.265 to 0.198 (Model 6), but remained significant, indicating partial mediation. The modest mediation range suggests that while resilience transmits part of the policy effect, a considerable proportion of well-being improvement stems directly from the immediate satisfaction provided by subsidies and emergency aid. Additional, the positive impact of economic resilience on subjective well-being (β = 2.343 in Model 3, β = 2.581 in Model 6) was much greater than that of the policy variables, suggesting that household resilience plays a dominant role in well-being.

Table 7.
Results of the mediating effect analysis.
| Variable category | Variable name | Model1 | Model2 | Model3 | Model4 | Model5 | Model6 | |
|---|---|---|---|---|---|---|---|---|
| individual variables | gender | 0.047 (0.086) | 0.004 (0.012) | 0.034 (0.081) | 0.082 (0.088) | 0.006 (0.013) | 0.060 (0.082) | |
| age | -0.002 (0.003) | -0.001 (0.000) | -0.000 (0.003) | -0.001 (0.003) | -0.001 (0.000) | 0.001 (0.003) | ||
| occupation | -0.023 (0.055) | 0.026***(0.008) | -0.084 (0.053) | -0.013 (0.056) | 0.027***(0.008) | -0.086 (0.053) | ||
| household variables | proportion of household labor force | 0.180 (0.169) | -0.024 (0.025) | 0.236 (0.160) | 0.164 (0.174) | -0.024 (0.025) | 0.229 (0.162) | |
| the highest education level within the household | 0.003 (0.124) | 0.000 (0.018) | 0.007 (0.116) | -0.037 (0.126) | -0.004 (0.018) | -0.013 (0.117) | ||
| average health level | -0.146 (0.581) | 0.082 (0.085) | -0.339 (0.548) | 0.279 (0.589) | 0.140 (0.085) | -0.073 (0.550) | ||
| policy variables | subsidy adequacy | 0.379***(0.075) | 0.045***(0.011) | 0.276***(0.073) | ||||
| availability of emergency support | 0.265***(0.079) | 0.028**(0.011) | 0.198***(0.074) | |||||
| mediator variable | economic resilience | 2.343***(0.408) | 2.581***(0.406) | |||||
| constant | 2.729***(0.432) | 0.189***(0.063) | 2.290***(0.414) | 2.709***(0.472) | 0.196***(0.068) | 2.202***(0.446) | ||
| R2 | 0.105 | 0.135 | 0.210 | 0.058 | 0.092 | 0.189 |
*, P<0.1; **, P<0.05; ***, P<0.01.
4.3. Endogeneity Addressing and Robustness Checks
4.3.1. Addressing Endogeneity
To mitigate endogeneity concerns, an instrumental variable approach was adopted. “Relative living standard” was selected as the instrumental variable, significantly predicting subjective well-being only through economic resilience (i.e., it had no direct effect when resilience was controlled, as shown in Models 1 and 2). A two-stage least squares regression was conducted: in the first stage, relative living standard was regressed on economic resilience to obtain predicted values; in the second stage, these predicted values were incorporated into models with subjective well-being as the dependent variable. Results confirmed that relative living standard significantly predicted resilience in the first stage(Model 3, Model 5), and the instrumented resilience remained a significant predictor of subjective well-being in the second stage, supporting robustness(Model 4, Model 6).
Table 7.
Results of instrumental variable analysis.
| Variable | Model1 | Model2 | Model3 | Model4 | Model5 | Model6 |
|---|---|---|---|---|---|---|
| economic resilience | 2.692***(0.507) | 3.237***(0.668) | 0.265***(0.683) | |||
| relative living standards | 0.680***(0.175) | 0.029(0.206) | 0.239***(0.020) | 0.234***(0.02) | ||
| control variable | control | control | control | control | control | control |
| constant | 3.105***(0.429) | 2.671***(0.416) | 0.128**(0.055) | 1.971(0.474) | 0.105**(0.051) | 2.070(0.454) |
| availabilityofemergency support | 0.015***(0.009) | 0.210***(0.076) | ||||
| subsidy adequacy | 0.037***(0.009) | 0.351***(0.074) | ||||
| R2 | 0.072 | 0.166 | 0.408 | 0.170 | 0.435 | 0.156 |
*, P<0.1; **, P<0.05; ***, P<0.01.
4.3.2. Robustness Checks
To verify the robustness of the regression results, we employed two alternative approaches, with the results presented in Table 8. First, we replaced the core explanatory variable by using income satisfaction, reflecting both current economic conditions and future risk-coping capacity, as a proxy for economic resilience. As shown in Model 1 and Model 2, income satisfaction exerted a consistently significant positive effect on happiness under different policy variables. Second, we substituted the explained variable by adopting life satisfaction as an alternative measure of well-being. Model 3 and Model 4 demonstrated that the regression coefficients of economic resilience on life satisfaction remained statistically significant at the 1% level under different policy variables. These results collectively confirmed the robustness of our conclusions.
To directly test the significance of the mediation effect, the Bootstrap method was employed using Model 4 in the SPSS PROCESS macro with 5,000 resamples. The results indicated that the indirect effect of subsidy adequacy on subjective well-being through economic resilience was 0.036, with a 95% bootstrap confidence interval of [0.019, 0.057], which did not include zero. This confirmed that economic resilience played a statistically significant partial mediating role between subsidy adequacy and well-being, further robustly validating the mediation effect.
5. Discussion
Households in Maduo County exhibited notably low economic resilience (0.384), particularly in reorganization capacity, yet reported relatively high subjective well-being—a phenomenon termed the “low resilience–high well-being paradox”, consistent with findings from pastoral regions in southwestern China [23]. Results from regression and mediation analyses indicated that household economic resilience exerted a significant positive effect on herders’ subjective well-being, but it only partially mediated the impact of relevant policies. The sense of security engendered by well-designed subsidies and accessible emergency assistance continued to be a significant source of herders’ subjective well-being in Sanjiangyuan region. In terms of economic resilience, subsidies helped ensure livelihood stability and enhanced risk resistance [43], yet their effect on long-term developmental capacities remained insignificant. Overall, subjective well-being among herders in the Sanjiangyuan region was largely decoupled from endogenous developmental capabilities. Relying solely on subjective well-being as an indicator of policy success is therefore incomplete and potentially misleading, as high levels of reported well-being may conceal underlying vulnerabilities in household livelihood structure.
Studies conducted in other pastoral regions impacted by the GWP have shown that herders with large-scale grasslands have rented additional grassland and increased supplemental feeding, while herders with small-scale grasslands have transferred their grassland use rights and shifted their livelihoods toward off-farm employment. In contrast, herders with small-scale grasslands seeking alternative livelihood options have derived fewer benefits from the GWP [43,44]. In the Sanjiangyuan region, which has been designated as a national park, most herders have faced grazing bans and passive relocations, making the pursuit of alternative livelihoods an inevitable choice for long-term development. As a result, in recent years, their household livelihood resilience has been undergoing a slow recovery process from a previous low point [45].
Grassland ecological subsidies—as stable, predictable cash transfers—effectively compensate for income losses due to grazing restrictions [18]. However, long-term reliance on such “blood-transfusion-style” subsidies shows no positive effect on reorganization capacity. Path dependence theory suggests that once a policy regime is established, it creates an incentive structure that discourages behavioral change. If passive subsidy income is financially more secure than active market participation, it may systematically hinder reorganization efforts. Our surveys indicated that most pastoral households lacked long-term planning and accessed to potential livelihood channels, which may result from a combination of remote location, limited employment opportunities, and existing policy incentives. As one interviewee noted, “Finding a job voluntarily may lead to disqualification from subsistence allowances.” Thus, passively receiving subsidies rather than pursuing self-development may appear to be a more rational decision. Nonetheless, this approach inadvertently reduces incentives for market engagement, technological adoption, and skill acquisition—ultimately undermining long-term household adaptability. This aligns with Sen’s concept of “capability deprivation,” which emphasizes that providing commodities (such as cash) does not necessarily expand real freedoms (such as the capacity to choose alternative livelihoods) [46]. Therefore, reforms to the subsidy system should be placed on the agenda.
While China’s poverty alleviation initiatives have successfully eradicated absolute poverty, addressing issues of “relative poverty” and “developmental disparity” remains particularly challenging in ecologically vulnerable regions such as the Tibetan Plateau. Although there are government-led skill training activities and public welfare positions set up during the implementation of GWP, the limited reorganization capacity observed in this study indicates that such training initiatives have yielded suboptimal outcomes, largely due to their disconnection from viable economic opportunities within the constrained local market [47]. Therefore, we propose a policy shift from “protective support” toward “promotive support”. First, investment across the entire value chain of pastoral products—such as organic yak dairy, meat, and hides—as well as culturally and ecologically informed tourism, should be leveraged based on the region’s unique ecological and cultural assets. Such place-based development can generate locally adapted employment opportunities and retain benefits within the community. Second, given the significant positive correlation between the highest educational attainment within a household and reorganization capacity and the limited uptake of new skills among older herders, intergenerational investment in formal education represents the most effective long-term strategy. Enhancing human capital among the younger generation can enable their participation in a diversified economy beyond traditional pastoralism, offering a promising pathway to break the cycle of dependency. Finally, we advocate for conditional and transformative subsidy mechanisms. Subsidies could be partially linked to participation in skills certification programs, eco-friendly pastoral practices, or community conservation initiatives. This approach would gradually shift the incentive structure from passive receipt to active contribution and capability acquisition.
6. Conclusions
Based on 266 household surveys in Maduo County, this study examines the impact of the GWP on herders’ economic resilience and subjective well-being, and identifies the mediating role of economic resilience in well-being improvement. Key findings include: (1) Herders in Maduo County exhibited relatively high subjective well-being alongside low household economic resilience, with reorganization capacity identified as the critical bottleneck within the economic resilience framework; (2) Both subsidy adequacy and emergency support exerted a dominant positive effect on resilience and subjective well-being. Specifically, subsidies exerted the strongest influence on risk resistance, whereas investment in education significantly enhanced households’ reorganization capacity; and (3) economic resilience had a significant positive impact on herders’ well-being, partially mediating the relationship between policy variables and subjective well-being, while cash subsidy and emergency support remained the primary drivers of subjective well-being. These results underscore the importance of sustained fiscal transfers in ensuring well-being but also highlight collective deficiencies in reorganization capacity. To address these challenges, developing localized industries grounded in unique regional resources, strengthening investment in education, and transitioning toward a more sustainable “capacity-building” support system represent promising strategies to break the current impasse.
Several limitations of this study should be acknowledged. As our analysis relies exclusively on cross-sectional data, it cannot capture the dynamic evolution of herders’ resilience across different periods. Future research should employ longitudinal tracking and multi-phase comparisons to identify temporal changes in household economic resilience. It is also critical to assess resilience levels under subsidy-free scenarios and explore diversified policy support systems that better align with contemporary developmental challenges.
Author Contributions
Conceptualization, C.X., L.Z. and Y.W.; methodology, C.X. and Y.W.; data collection, C.X., L.Z., Y.W. and X.P.; writing original draft and preparation, C.X.; data analysis, C.X. and Y.W. All authors have read and agreed to the published version of the manuscript.
Funding
This research was funded by the Second Tibetan Plateau Scientific Expedition and Research Program (2019QZKK0404), The Strategic Priority Research Program of the Chinese Academy of Sciences (XDA26010301) and The Annual Project of the Western Urban and Rural Integration Development Institute (2025XB14).
Data Availability Statement
The original contributions presented in this study are included in the article. Further inquiries can be directed to the corresponding author.
Acknowledgements
We are deeply grateful for the substantial assistance we received throughout the data collection phase of this research. Our sincere thanks go to the four Tibetan college students from Qinghai Normal University, whose invaluable help enabled us to effectively communicate with the herders. We also extend our appreciation to the second Qinghai-Tibet Scientific Research Office of Qinghai Province and the staff of Maduo County government for their crucial support during the investigation. Lastly, we owe a special debt of gratitude to the herders themselves, who generously shared their first-hand insights with us.
Conflicts of Interest
The authors declare no conflict of interest.
Abbreviations
The following abbreviations are used in this manuscript:
| GWP | Grazing Withdrawal Project |
| OECD | Organization for Economic Co-operation and Development |
| SD | standard deviation |
References
- Zhang, R.; Zhou, S.; Chen, R. Moderating effects of grassland ecological compensation policy in linking climatic risk and farmers’ livelihood resilience in China. Climate Smart Agriculture. 2025, 2, 100040. [Google Scholar] [CrossRef]
- Giwa-Daramola, D.; James, H.S. COVID-19 and microeconomic resilience in Sub-Saharan Africa: A study on Ethiopian and Nigerian households. Sustainability. 2023, 15, 7519. [Google Scholar] [CrossRef]
- Farahani, H.; Jahansoozi, M. Analysis of rural households’ resilience to drought in Iran, case study: Bajestan County. International Journal of Disaster Risk Reduction. 2022, 82, 103331. [Google Scholar] [CrossRef]
- Barrett, C.B.; Constas, M.A. Toward a theory of resilience for international development applications. Proceedings of the National Academy of Sciences. 2014, 111, 14625–14630. [Google Scholar] [CrossRef] [PubMed]
- Phadera, L.; Michelson, H.; Winter-Nelson, A.; Goldsmith, P. Do asset transfers build household resilience? Journal of Development Economics. 2019, 138, 205–227. [Google Scholar] [CrossRef]
- Carr, E.R. Resilient livelihoods in an era of global transformation. Global Environmental Change. 2020, 64, 102155. [Google Scholar] [CrossRef]
- Wang, Y.; Yan, J.; Wu, Y. Impact of policy measures on smallholders’ livelihood resilience: Evidence from Hehuang Valley, Tibetan Plateau. Ecological Indicators. 2024, 158, 111351. [Google Scholar] [CrossRef]
- Zhao, G. Trends in grassland science: Based on the shift analysis of research themes since the early 1900s. Fundamental Research. 2023, 3, 201–208. [Google Scholar] [CrossRef]
- Jiang, Z.; Ma, H.; Li, S.; Zheng, C.; Bai, E. Towards smart soil carbon pool management of grassland: a bibliometric overview from past to future. Ecological Processes. 2025, 14, 54. [Google Scholar] [CrossRef]
- Bardgett, R.D.; Bullock, J.M.; Lavorel, S.; Manning, P.; Schaffner, U.; Ostle, N.; Chomel, M.; Durigan, G.; L. Fry, E.; Johnson, D.; et al. Combatting global grassland degradation. Nature Reviews Earth & Environment. 2021, 2, 720–735. [CrossRef]
- Li, T.; Cui, L.; Scotton, M.; Dong, J.; Xu, Z.; Che, R.; Tang, L.; Cai, S.; Wu, W.; Andreatta, D.; et al. Characteristics and trends of grassland degradation research. Journal of Soils and Sediments. 2022, 22, 1901–1912. [Google Scholar] [CrossRef]
- Xia, M.; Jia, K.; Zhao, W.; Liu, S.; Wei, X.; Wang, B. Spatio-temporal changes of ecological vulnerability across the Qinghai-Tibetan Plateau. Ecological Indicators. 2021, 123, 107274. [Google Scholar] [CrossRef]
- Tang, L.; Duan, X.; Kong, F.; Zhang, F.; Zheng, Y.; Li, Z.; Mei, Y.; Zhao, Y.; Hu, S. Influences of climate change on area variation of Qinghai Lake on Qinghai-Tibetan Plateau since 1980s. Scientific Reports. 2018, 8, 7331. [Google Scholar] [CrossRef]
- Zhou, S.Q.; Sun, P.F.; Zhao, K.; Wang, F.; Zuo, X.D. Implementation effects of the grazing withdrawal project in national key ecological function zones: A case study of Yanchi County in Ningxia Hui Autonomous Region. Pratacultural Science. 2020, 37, 201–212. (In Chinese) [Google Scholar] [CrossRef]
- Li, T.; Singh, R.K.; Cui, L.; Pandey, R.; Liu, H.; Xu, Z.; Tang, L.; Du, J.; Cui, X.; Wang, Y. Beyond grassland degradation: Pathways to resilience for pastoralist households in alpine grassland ecosystems. Journal of Environmental Management. 2024, 368, 121992. [Google Scholar] [CrossRef]
- Yang, Q.; Nan, Z.B.; Chen, Q.Q.; Tang, Z. Satisfaction and influencing factor to grassland eco-compensation and reward policies for herders: empirical study in Qinghai-Tibet Plateau and western desert area of Gansu. Acta Ecologica Sinica. 2020, 40, 1436–1444. (In Chinese) [Google Scholar] [CrossRef]
- Jiang, Z.; Gao, Y.H.; Jin, L.S. Herdsmen’s satisfaction and support to grassland eco-compensation policy: A SEM test based on CSI logic model. Acta Ecologica Sinica. 2024, 44, 196–208. (In Chinese) [Google Scholar] [CrossRef]
- Zhao, M.; Chen, H.; Shao, L.; Xia, X.; Zhang, H. Impacts of rangeland ecological compensation on livelihood resilience of herdsmen: an empirical investigation in Qinghai Province, China. Journal of Rural Studies. 2024, 107, 103245. [Google Scholar] [CrossRef]
- Bravo-Peña, F.; Yoder, L. Agrobiodiversity and smallholder resilience: A scoping review. Journal of Environmental Management. 2024, 351. [Google Scholar] [CrossRef]
- Bozza, A.; Asprone, D.; Manfredi, G. Developing an integrated framework to quantify resilience of urban systems against disasters. Natural Hazards. 2015, 78, 1729–1748. [Google Scholar] [CrossRef]
- Ifejika Speranza, C.; Wiesmann, U.; Rist, S. An indicator framework for assessing livelihood resilience in the context of social–ecological dynamics. Global Environmental Change. 2014, 28, 109–119. [Google Scholar] [CrossRef]
- Reggiani, A.; De Graaff, T.; Nijkamp, P. Resilience: An Evolutionary Approach to Spatial Economic Systems. Networks and Spatial Economics. 2002, 2, 211–229. [Google Scholar] [CrossRef]
- Fan, Y.L.; Cong, S.H. The Effect of Financial Transfer Payment on Rural Livelihood Resilience:Promoting or Restraining. Chinese Rural Economy. 2024, 1, 125–148. (In Chinese) [Google Scholar] [CrossRef]
- Cowell, M.M. Bounce back or move on: Regional resilience and economic development planning. Cities. 2013, 30, 212–222. [Google Scholar] [CrossRef]
- Schwark, F.; Tryphonides, A. Technical change and macroeconomic resilience to sectoral shocks. Economics Letters. 2025, 246, 112077. [Google Scholar] [CrossRef]
- Guo, Y.; Yan, X.H.; Huo, X.X. Can e-commerce improve the economic resilience of apple farmers?——Evidence from the micro-survey in the Loess Plateau region. Journal of Arid Land Resources and Environment. 2024, 38, 167–178. [Google Scholar] [CrossRef]
- Liu, W.; Li, J.; Xu, J. Effects of disaster-related resettlement on the livelihood resilience of rural households in China. International Journal of Disaster Risk Reduction. 2020, 49, 101649. [Google Scholar] [CrossRef]
- Li, H.; Lu, Q. The Impact of unconditional cash transfers on household development resilience: Evidence from China. Chinese Rural Economy. (In Chinese). 2022, 82–101. [Google Scholar]
- Durant, J.L.; Asprooth, L.; Galt, R.E.; Schmulevich, S.P.; Manser, G.M.; Pinzón, N. Farm resilience during the COVID-19 pandemic: The case of California direct market farmers. Agricultural Systems. 2023, 204. [Google Scholar] [CrossRef]
- Andrew, J. O.; Wu, S. Objective Confirmation of Subjective Measures of Human Well-Being:Evidence from the USA. Science. 2010, 327, 576–579. [Google Scholar] [CrossRef]
- Zhang, Q.; Gong, J.; Wang, Y. How resilience capacity and multiple shocks affect rural households’ subjective well-being: A comparative study of the Yangtze and Yellow River Basins in China. Land Use Policy. 2024, 142, 107192. [Google Scholar] [CrossRef]
- Cissé, J.D.; Barrett, C.B. Estimating development resilience: A conditional moments-based approach. Journal of Development Economics. 2018, 135, 272–284. [Google Scholar] [CrossRef]
- OECD. Subjective well-being measurement: Current practice and new frontiers. OECD Publishing: 2023. [CrossRef]
- Boardman, K.; Grimes, A. Traffic Accidents: The Contrasting Roles of Life Satisfaction and Anxiety. Applied Research in Quality of Life. 2024, 19, 3279–3304. [Google Scholar] [CrossRef]
- Sirgy, M.J.; Joshanloo, M.; Yu, G.B. How Does Work-Life Conflict Influence Wellbeing Outcomes? A Test of a Mediating Mechanism Using Data from 33 European Countries. Applied Research in Quality of Life. 2025, 20, 193–216. [Google Scholar] [CrossRef]
- Dolan, P.; Peasgood, T.; White, M. Do we really know what makes us happy? A review of the economic literature on the factors associated with subjective well-being. Journal of Economic Psychology. 2008, 29, 94–122. [Google Scholar] [CrossRef]
- Liao, L.; Du, M.; Huang, J. The Effect of Urban Resilience on Residents’ Subjective Happiness: Evidence from China. Land. 2022, 11, 1896. [Google Scholar] [CrossRef]
- Blanchflower, D.G. Is happiness U-shaped everywhere? Age and subjective well-being in 145 countries. Journal of Population Economics. 2021, 34, 575–624. [Google Scholar] [CrossRef]
- Xia, C.Z.; Zhou, L.H.; Wang, Y.; Pei, X.D. Tibetan herders’ life satisfaction and determinants under the Pastureland Rehabilitation Program: A case study of Maduo County, China. Sustainability. 2022, 14, 2381. [Google Scholar] [CrossRef]
- Angeon, V.; Bates, S. Reviewing composite vulnerability and resilience indexes: A sustainable approach and application. World Development. 2015, 72, 140–162. [Google Scholar] [CrossRef]
- Wen, Z.L.; Chang, L.; Hau, K.T.; Liu, H.Y. Testing and application of the mediating effects. Acta Psychologica Sinica. 2004, 36, 614–620. (In Chinese) [Google Scholar]
- Lin, D.X.; Wang, H.X.; Xu, J.F.; Niu, L. Evaluation of national fitness and national health development and coupling and coordination in 11 provinces and cities in Eastern China. PLoS One. 2024, 19, e0291515. [Google Scholar] [CrossRef] [PubMed]
- Hou, L.; Xia, F.; Chen, Q.; Huang, J.; He, Y.; Rose, N.; Rozelle, S. Grassland ecological compensation policy in China improves grassland quality and increases herders’ income. Nature Communications. 2021, 12, 4683. [Google Scholar] [CrossRef] [PubMed]
- Han, F.; Zhang, X.; Zhou, R.Z. A review and prospect of grassland ecological compensation and its impact on herders’ behavior. Resources Science. 2024, 46, 1447–1459. [Google Scholar] [CrossRef]
- Zhao, T.; Wu, X.; Cheng, Y.; Liu, W. Does disaster resettlement reshape household livelihood adaptive capacity in rural China? Frontiers in Sustainable Food Systems. 2024, 8, 2024. [Google Scholar] [CrossRef]
- Sen, A. Development as freedom. Oxford University Press: New York, 1999.
- Leng, G.X.; Feng, X.L.; Qiu, H.G. Income effects of poverty alleviation relocation program on rural farmers in China. Journal of Integrative Agriculture. 2021, 20, 891–904. [Google Scholar] [CrossRef]
Figure 1.
Research framework.
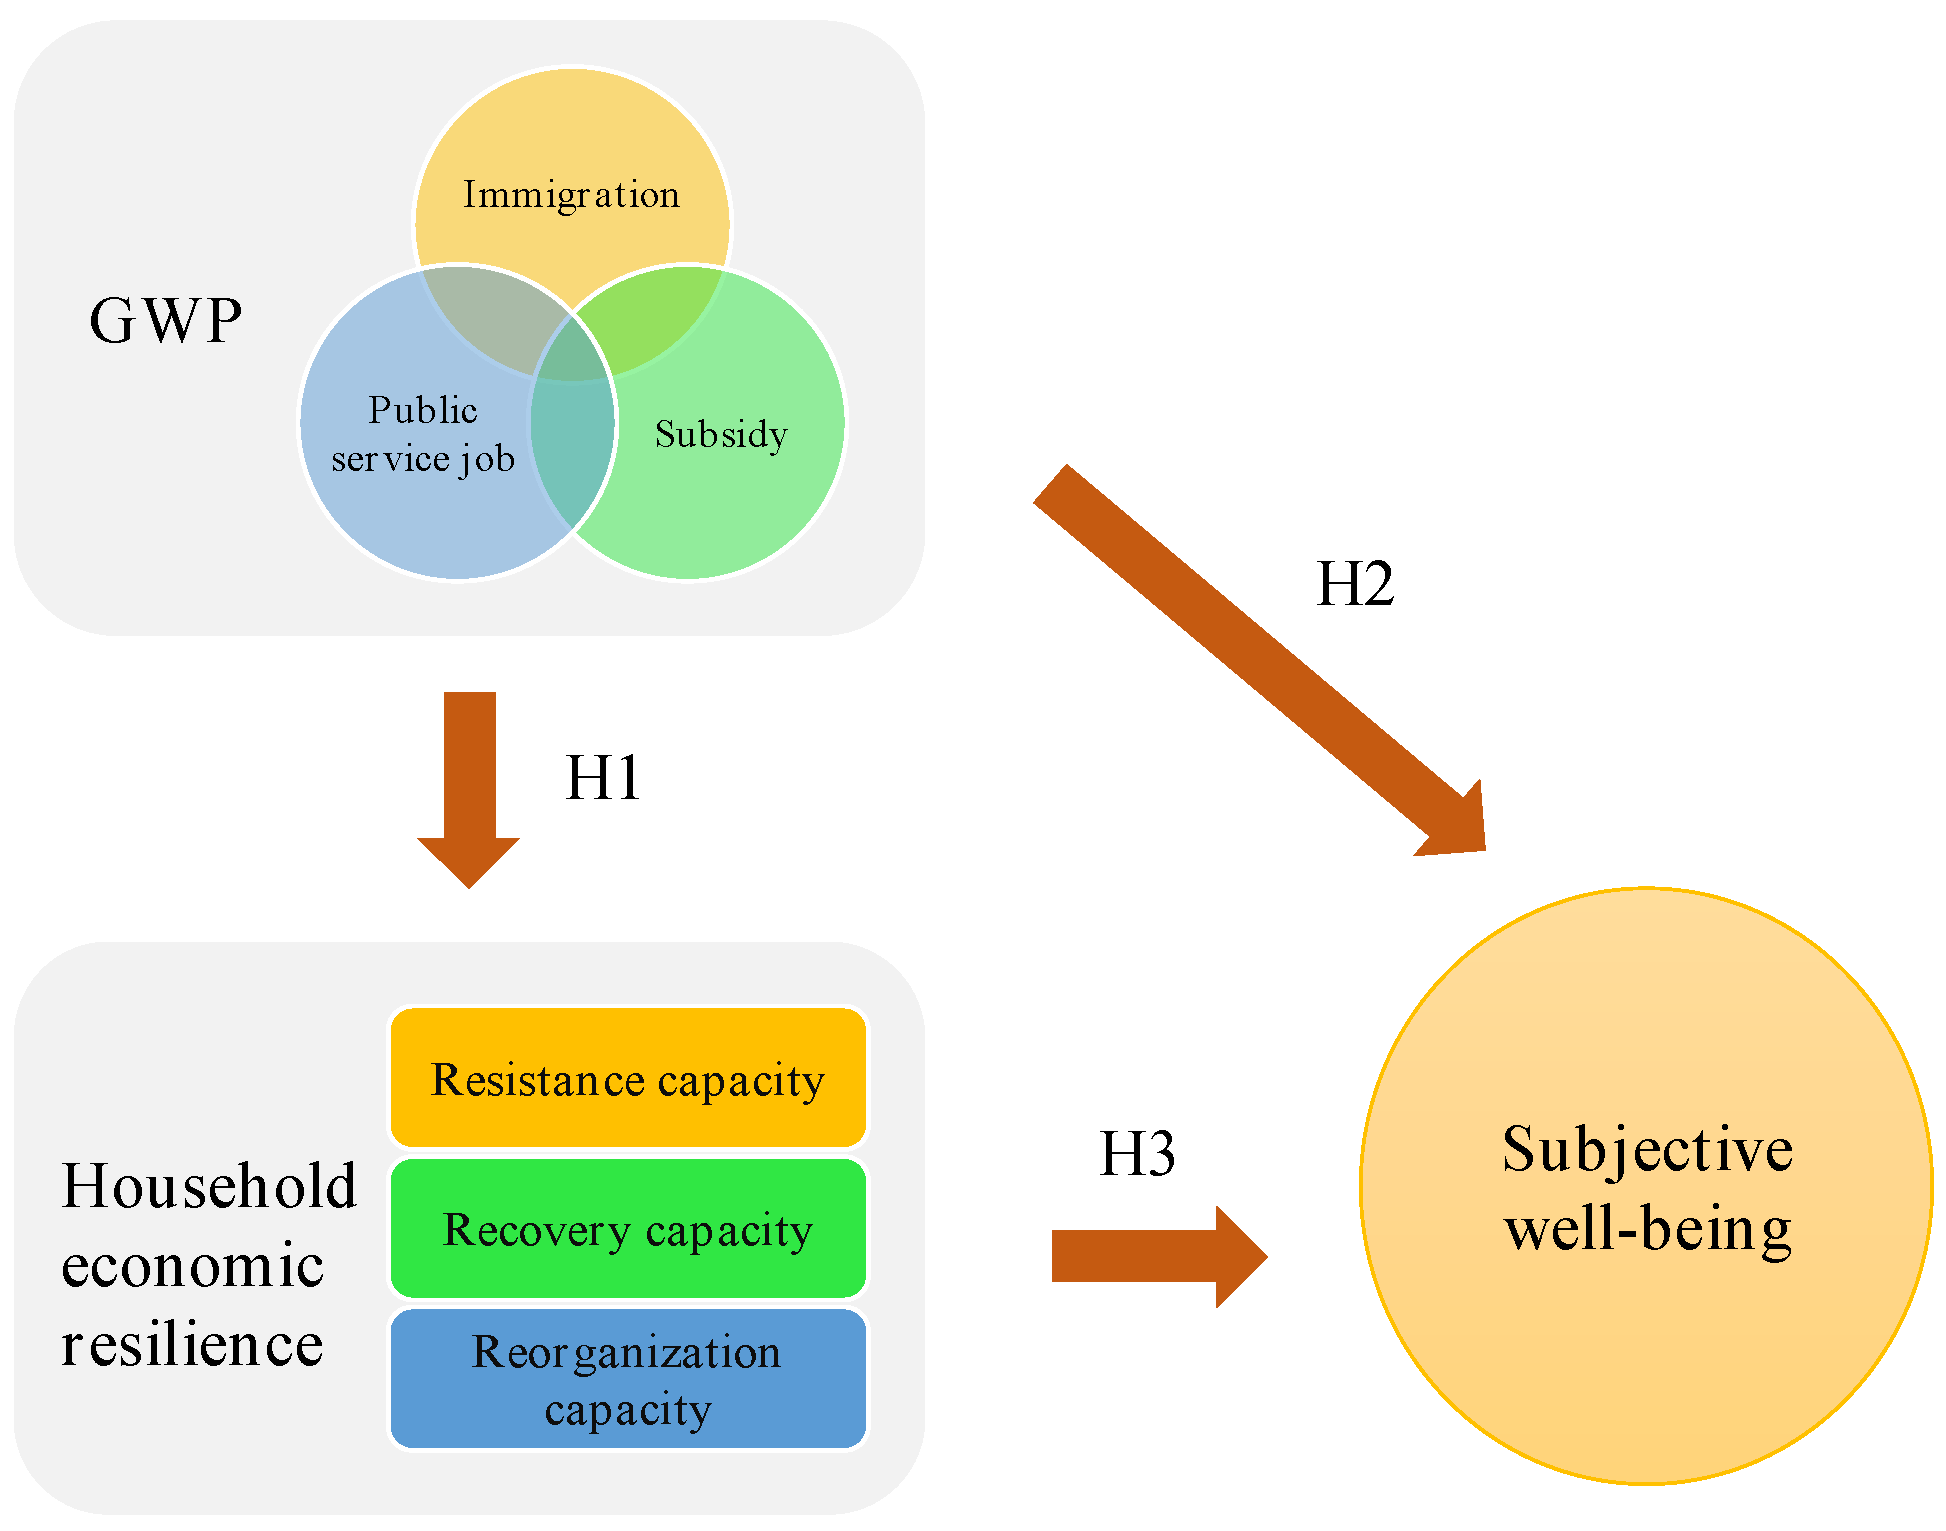
Figure 2.
Study area and survey sites.
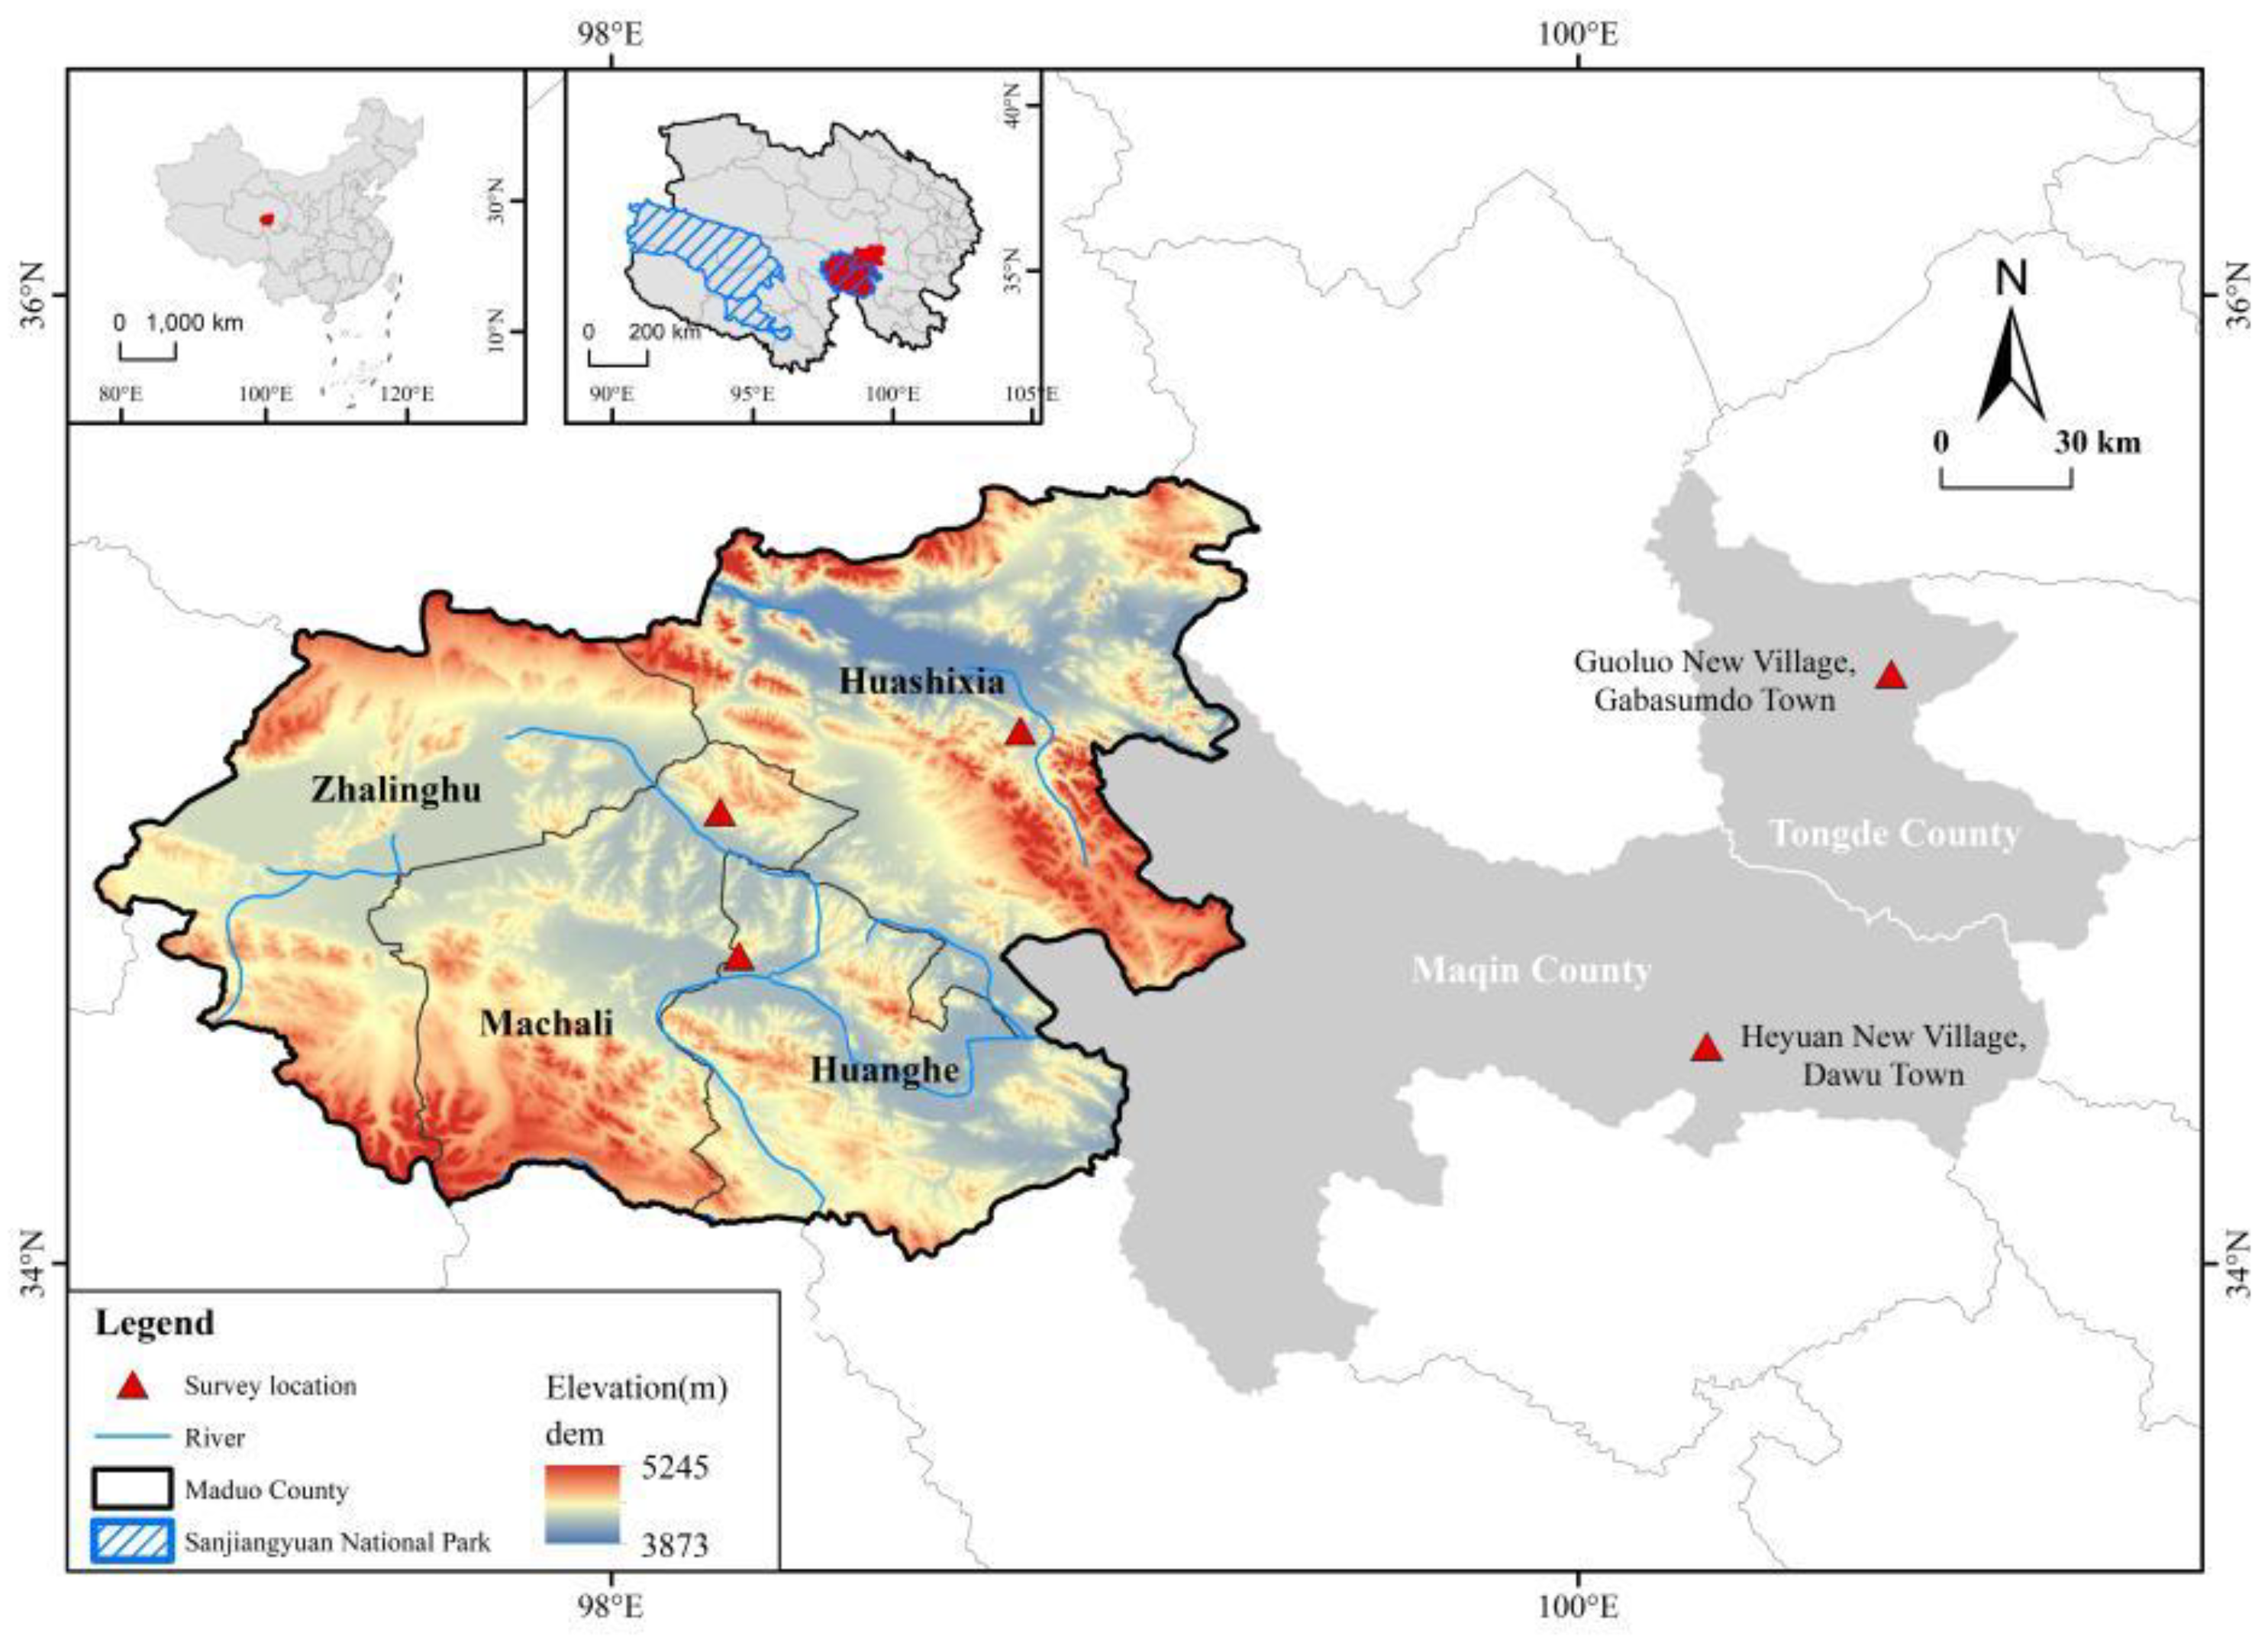
Table 1.
Ecological protection policies in Sanjiangyuan area.
| Ecological Policy | Specific measures | 2003-2011 | 2011-2016 | 2016-Present |
|---|---|---|---|---|
| establishmentof protected area | protection level | establishment of provincial and national nature reserves | construction of national nature reserves | establishment of sanjiangyuan national park |
| GWP | grassland fencing | Tibetan Plateau: CNY 262.5 /ha | Tibetan Plateau: 300 CNY/ha | Tibetan Plateau: CNY 450 /ha |
| reseeding and grass planting | CNY 150/ha | CNY 300/ha | CNY 900 /ha | |
| ecological compensation | grain subsidy( grazing ban: 41.25 kg/ha;grassland-livestock balance: 10.35 kg/ha) | cash subsidy(grazing ban: CNY 90 /ha;grassland-livestock balance: CNY 22.5 /ha) | cash subsidy(grazing ban: CNY 112.5 /ha; grassland-livestock balance: CNY 37.5 /ha) |
|
| artificial forage base construction | --- | 2400 CNY/ha | CNY 3000 /ha | |
| shed construction | --- | 3000 CNY/household | CNY 6000 /household | |
| black soil beach management | --- | --- | CNY 2700 /ha | |
| toxic-weed control | --- | --- | CNY 140 /ha | |
| resettlement | core-zone relocation | --- | continued relocation | |
| additional measures | ecological inspector | --- | --- | promotion of the eco-guardian system |
Table 2.
List of variables.
| Variable category | Variable name | Index | Index assignment | Min-Max | Mean (SD) |
|---|---|---|---|---|---|
| dependent variable | well-being | subjective well-being | very unhappy=1; not too happy=2;neutral=3; relatively happy=4; very happy=5 | 2–5 | 3.71 (0.69) |
| control variables | individual variables | gender | male=0; female=1 | 0–1 | 0.45 (0.50) |
| age | continuous variable | 17–87 | 44.87 (14.79) | ||
| occupation | unemployed=1; single occupation=2; multiple occupations=3 | 1–3 | 2.29 (0.77) | ||
| household variables | proportion of household labor force | number of laborers/total household population | 0–1.5 | 0.42 (0.26) | |
| highest education level within household | illiteracy=0; elementary school=0.25, junior high school=0.5, high school=0.75, college and above=1.0 | 0–1 | 0.48 (0.34) | ||
| average health level | lost labor capacity=0; poor=0.25; fair=0.5; good=0.75; excellent=1 (averaged after summation based on individual conditions) | 0–1 | 0.56 (0.07) | ||
| mediating variable | resilience | household economic resilience | continuous variable | 0.02–0.71 | 0.38 (0.10) |
| explanatory variables | policy measures | distance of immigration | cross-province migrant=1; cross-county migrant=2; local migrant household=3; local livestock-owning household=4 | 1–4 | 2.45 (0.86) |
| subsidy adequacy | too little subsidy=1; less subsidy=2; appropriate=3; a bit too much subsidy=4; too much subsidy=5 | 1–4 | 2.77 (0.57) | ||
| popularity of policy promotion | never heard of the promotion=1; heard of it a few times=2; heard of it many times=3 | 0–1 | 0.45 (0.18) | ||
| effectiveness of employment support | negative help=1; no help=2; little help=3; some help=4; significant help=5 | 2–5 | 3.83 (0.78) | ||
| availability of emergency support | unable=1; not necessarily=2; able=3 | 1–3 | 2.83 (0.54) |
Table 3.
Evaluation index system for herders’ household economic resilience in Maduo County.
| Dimension | Index | Index assignment | Mean (SD) | Weight |
|---|---|---|---|---|
| resistance capacity | household annual income | <CNY 30,000= 1; CNY 30,000–50,000= 2; CNY 50,000–100,000= 3; CNY 100,000-150,000= 4;> CNY 150,000= 5 | 3.27(0.80) | 0.0880 |
| income change | decreased a lot = 1; decreased a little = 2; no change = 3; increased a little = 4; increased a lot = 5 | 2.69(0.71) | 0.0894 | |
| change in income sources | fewer sources = 1; no change = 2; more sources = 3 | 1.52(0.68) | 0.0899 | |
| living-standard change | declined a lot = 1; declined a little = 2; no change = 3; improved a little = 4; improved a lot = 5 | 3.12(0.37) | 0.0898 | |
| recovery capacity | income stability | very unstable = 1; rather unstable = 2; neutral = 3; rather stable = 4; very stable = 5 | 3.48(0.93) | 0.0907 |
| balance of income and expenditure | expenditure > income = 1; balanced = 2; income > expenditure = 3 | 3.23(0.73) | 0.0774 | |
| number of available helpers | none = 1; 1–3 = 2; 4–6 = 3; 7–10 = 4; > 10 = 5 | 3.27(0.80) | 0.0772 | |
| difficulty of borrowing money | very difficult = 1; rather difficult = 2; depends = 3; rather easy = 4; very easy = 5 | 2.69(0.90) | 0.0895 | |
| reorganization capacity | market accessibility | very inconvenient=1; rather inconvenient=2; neutral=3; rather convenient=4; very convenient=5 | 3.60(1.03) | 0.0903 |
| development willingness | do nothing = 1; follow government arrangements = 2; depends = 3; rather willing = 4; eager to change = 5 | 2.84(1.54) | 0.0891 | |
| availability of alternative livelihood | no = 0; yes = 1 | 0.15(0.39) | 0.0635 | |
| long-term planning | no = 0; yes = 1 | 0.23(0.36) | 0.0654 |
Table 5.
Regression analysis results of the impact of GWP on subjective well-being.
| Variable category | Variable name | Model1 | Model2 | Model3 |
|---|---|---|---|---|
| individual variables | gender | 0.085 (0.088) | 0.099 (0.090) | 0.042 (0.087) |
| age | -0 .002(0.003) | -0.001 (0.003) | -0.001 (0.003) | |
| occupation | 0.008 (0.056) | -0.005 (0.057) | -0.007 (0.061) | |
| household variables | proportion of household labor force | 0.193 (0.177) | 0.183 (0.171) | |
| the highest education level within the household | -0.107 (0.127) | 0.055 (0.124) | ||
| average health level | 0.332 (0.600) | -0.082 (0.579) | ||
| policy variables | distance of immigration | 0.020 (0.050) | ||
| subsidy adequacy | 0.359*** (0.077) | |||
| popularity of policy promotion | -0.088 (0.228) | |||
| effectiveness of employment support | -0.054 (0.065) | |||
| availability of emergency support | 0.227*** (0.078) | |||
| constant | 3.646*** (0.241) | 3.392***(0.434) | 2.227 *** (0.472) | |
| R2 | 0.006 | 0.016 | 0.137 |
*, P<0.1; **, P<0.05; ***, P<0.01.
Table 6.
Regression analysis results of the impact of GWP on household economic resilience.
| Variable category | Variable name | Model1 | Model2 | Model3 | Resistance capacity | Recovery capacity | Reorganization capacity |
|---|---|---|---|---|---|---|---|
| individual variables | gender | 0.011(0.012) | 0.007 (0.013) | -0.001 (0.013) | 0.037 (0.022) | -0.035 (0.021) | -0.009 (0.014) |
| age | -0.001(0.000) | -0.001 (0.000) | -0.001 (0.000) | -0.001 (0.001) | 0 (0.001) | -0.002 (0) | |
| occupation | 0.026***(0.008) | 0.027*** (0.008) | 0.019** (0.009) | 0.011 (0.016) | 0.033** (0.015) | 0.013 (0.01) | |
| household variables | Proportion of household labor force | -0.021 (0.025) | -0.026 (0.025) | -0.003(0.052) | -0.031 (0.042) | 0.041 (0.028) | |
| the highest education level within the household | -0.011 (0.018) | 0.003 (0.018) | -0.051 (0.032) | 0.009 (0.031) | 0.06*** (0.02) | ||
| Average health level | 0.146* (0.086) | 0.072 (0.085) | 0.117 (0.151) | 0.155 (0.144) | -0.069 (0.094) | ||
| policy variables | Distance of immigration | 0.011 (0.007) | 0.014 (0.013) | 0.013 (0.012) | 0.004 (0.008) | ||
| subsidy adequacy | 0.037*** (0.011) | 0.064*** (0.02) | 0.027 (0.019) | 0.018 (0.012) | |||
| popularity of policy promotion | -0.005 (0.033) | -0.115(0.059) | 0.039 (0.056) | 0.074* (0.037) | |||
| effectiveness of employment support | 0.013 (0.009) | 0.027 (0.017) | -0.021 (0.016) | 0.032*** (0.01) | |||
| availability of emergency support | 0.016 (0.011) | 0.038* (0.02) | -0.002 (0.019) | 0.01 (0.013) | |||
| constant | 0.335***(0.034) | 0.268*** (0.062) | 0.124 (0.069) | 0.56(0.123) | 0.227*(0.117) | 0.082(0.076) | |
| R2 | 0.058 | 0.071 | 0.161 | 0.184 | 0.047 | 0.23 |
*, P<0.1; **, P<0.05; ***, P<0.01.
Table 8.
Results of robustness analysis.
| Variable | Change explanatory variables(1) | Change explanatory variables(2) | Change explained variable(2) | Change explained variable(1) |
|---|---|---|---|---|
| economic resilience | 2.225***(0.461) | 2.101***(0.48) | ||
| income satisfaction | 0.186***(0.058) | 0.121*(0.062) | ||
| control variable | control | control | control | control |
| constant | 2.294***(0.482) | 2.509***(0.444) | 1.789***(0.51) |
2.09***(0.488) |
| availability of emergency support | 0.230***(0.079) | 0.223***(0.085) | ||
| subsidy adequacy | 0.314***(0.082) | 0.164*(0.086) | ||
| R2 | 0.095 | 0.119 | 0.138 | 0.121 |
*, P<0.1; **, P<0.05; ***, P<0.01.
Disclaimer/Publisher’s Note: The statements, opinions and data contained in all publications are solely those of the individual author(s) and contributor(s) and not of MDPI and/or the editor(s). MDPI and/or the editor(s) disclaim responsibility for any injury to people or property resulting from any ideas, methods, instructions or products referred to in the content. |
© 2025 by the authors. Licensee MDPI, Basel, Switzerland. This article is an open access article distributed under the terms and conditions of the Creative Commons Attribution (CC BY) license (http://creativecommons.org/licenses/by/4.0/).
Copyright: This open access article is published under a Creative Commons CC BY 4.0 license, which permit the free download, distribution, and reuse, provided that the author and preprint are cited in any reuse.


