
Submitted:
13 September 2025
Posted:
16 September 2025
You are already at the latest version
Abstract
Hemoglobin A1C (HbA1C), a non-enzymatically glycated form of adult hemoglobin (HbA0), is a widely used biomarker for diabetes. However, beyond its diagnostic role, its physiological functions remain poorly understood. To fill this gap, we investigated the in-tracellular distribution of HbA1C and its potential impact on red blood cell (RBC) func-tions. Specifically, the differences in cytosolic and membrane pools of HbA1C in RBCs from individuals with prediabetes, overt type 2 diabetes (T2D), and healthy controls were explored. Our findings confirmed the intracellular heterogeneity of HbA1C and revealed a strong correlation between fluctuations in HbA1C and those of other hemoglobin isoforms, specifically HbA2 and HbA0. This correlation was particularly evident in the context of diabetes or acute exposure to Ca²⁺-depleted environments. We also observed that short-term hyperglycemia does not significantly alter HbA1C intracellular localization. Furthermore, we found that the intracellular distribution of HbA1C is correlated with sev-eral physiological properties of RBCs, with these links varying according to the specific pathological abnormalities associated with pre- and overt diabetes. Further research is required to fully understand the mechanisms and implications of these observations.
Keywords:
hemoglobin A1C
; hemoglobin distribution
; red blood cells
; prediabetes
; T2 diabetes
; calcium
1. Introduction
Type 2 (non-insulin dependent) diabetes mellitus (T2D) is a complex metabolic disorder affecting nearly half a billion people worldwide. It is characterized by hyperglycemia resulting from a combination of insulin resistance and inadequate insulin secretion by pancreatic beta cells[1]. This chronic condition not only imposes significant health burdens but also increases the risk of long-term complications, including nephropathy, retinopathy, neuropathy, cardiovascular disease, peripheral vascular disease, dental problems, and sexual dysfunction[2,3,4,5].
Prediabetes is a significant risk condition for T2D development. Individuals with impaired fasting glucose, impaired glucose tolerance, elevated levels of glycated hemoglobin (HbA1C)—between 5.7% and 6.4%, or a history of gestational diabetes fall into this category[6]. Globally, the number of adults with prediabetes is estimated to be around 400 million, with a rapid increase observed annually[7]. Individuals with prediabetes are at increased risk of developing both overt diabetes and cardiovascular disease. It is crucial to understand that prediabetes is a diverse condition; it can lead to rapid diabetes onset in some individuals, whereas others may stay in the prediabetic stage for a long time.
HbA1C, a non-enzymatically glycated form of major adult hemoglobin (HbA0), is of significant clinical interest. This modified hemoglobin (Hb) forms through a series of chemical reactions of glucose with the N-terminal amino group of the HbA0 β-chain[8]. It accounts for 80% of total glycated Hb; the remaining glycohemoglobins have glucose, glucose-6-phosphate, fructose-1-6-diphosphate, or pyruvic acid bound to ε-amino groups of lysine residues or the N terminus of the α-chain. HbA1C is more susceptible to oxidation and degradation than non-glycated Hb[9,10], contributing to oxidative stress by increasing the release of heme and free iron in association with free radicals[11,12,13,14]. Moreover, its negative charge exceeds that of the HbA0 variant, enabling easy detection of HbA1C using techniques such as HPLC[15]. However, although HbA1C is widely used as a diagnostic marker for diabetes, its physiological functions remain mostly unexamined.
To our knowledge, the intracellular distribution of HbA1C and the potential impact of Hb glycation on its localization have never been studied. We recently explored the distribution of adult Hb variants HbA0 and HbA2 between cytosolic and membrane fractions, and their potential selective localization under plasma-borne stress[16]. We observed preferential localization of HbA2 in the pre-membrane pool (5–9% of total Hb on the membrane vs. ~3% in intact red blood cells [RBCs] and cytosol), with a concurrent decrease in pre-membrane HbA0. Moreover, we identified a key role for both extracellular and intracellular Ca²⁺ and the potential involvement of anion exchanger 1 (AE1, also known as band 3 protein) in regulating the distribution of these Hb isoforms between the cytosol and the membrane. Considering the direct interrelationships between Ca²⁺, AE1, and membrane-associated Hb[17,18,19,20,21,22,23,24,25,26], we hypothesized that interaction of various Hb variants with the membrane may affect the RBCs’ morphology, redox state, rheology, membrane permeability, and glucose metabolism. This hypothesis motivated us to explore the subcellular localization preference of HbA1C, and its possible involvement in RBC physiology and rheological pathways. Furthermore, since HbA1C levels are relatively low in healthy individuals (<5.7%) and their elevation is caused by metabolic disturbances, we expanded our study to examine the corresponding features and pathways in erythrocytes obtained from individuals with prediabetes and overt T2D.
2. Results
Demographic and RBC data for the study participants are summarized in Table 1. Comparison of the intact and near-membrane fractions of HbA1C (Figure 1A) and other Hb isoforms (Table 2) in RBCs from healthy, prediabetic, and overt T2 diabetic individuals revealed significant isoform-dependent differences. Given the minimal variations in Hb isoform distribution between intact RBCs and their cytosol (Table S1), we considered the isoform ratios in intact RBCs to reflect those in the cytosolic compartment. Similar to HbA0 and in contrast to the membrane-enriched HbA2, the near-membrane fraction of HbA1C was lower at the membrane compared to the intact (cytosolic) portions across all examined individuals. Interestingly, the rise in intact HbA1C, which indicates prolonged exposure to high glucose levels in prediabetic and T2 diabetic individuals, was mirrored in the HbA1C levels in the RBC membranes of these patients (Figure 1B). Variations in intracellular Hb content and concentrations, specifically mean corpuscular hemoglobin (MCH) and its concentration (MCHC) (as detailed in Table 1 and Figure 1C), along with Hb concentration in the membrane fractions (Figure 1D), enable associating observed changes in the percentage of HbA1C and other Hb isoforms relative to total Hb with the quantitative abundance of these isoforms in different RBC compartments (Table S2).
To examine the relationship between the subcellular distribution of Hb variants and HbA1C, we pooled the data for intact (cytosolic) and membrane distributions of Hb isoforms across all cohorts and correlated their variation with HbA1C by calculating Pearson’s correlation coefficients (Table 3). This analysis revealed significant positive correlations for HbA0 and negative correlations for HbA2 in both intact RBCs and their membrane fractions. Correlations with HbF were non-significant. Analyzing correlations within individual groups, HbA1C was found to correlate with HbA0 (positively) and HbA2 (inversely) in both the cytosolic and membrane pools only in diabetic RBCs. The other cohorts exhibited significant correlations involving HbA1C and HbA0 or HbA2 only within the membrane fraction. No correlations were observed between HbA1C and HbF in any of the examined groups.
We then investigated the temporal dynamics of HbA1c and other Hb variants’ cellular redistribution by incubating RBCs in plasma-mimicking buffer (PMB) with a near-physiological hyperglycemic glucose concentration (10 mM) for 4 h. A comparison of the membrane distribution of Hb isoforms before and after incubation (Figure 2 and Table S3) showed only minimal changes in the near-membrane content of each isoform across all groups. Consistently, these minor isoform-specific changes did not result in significant alterations to the total Hb membrane concentration in any of the studied groups (Figure S1).
To explore whether HbA1C intracellular distribution is regulated by extracellular Ca2+, we collected erythrocytes in tubes supplemented with a Ca2+ chelator, K3EDTA, in parallel to their collection in tubes with heparin anticoagulant. Ca2+ chelation led to decreased membrane levels of HbA1C compared to control (heparin-preserved) RBCs (Figure 3A). This response was similar to the intracellular redistribution of HbA0 along with an increase in the membrane association of HbA2 (Table S4). Interestingly, similar to the cells exposed to physiological Ca2+ levels (in heparin tubes), no substantial variations were found in the HbA1C membrane-to-intact ratios among EDTA-treated RBCs from healthy, prediabetic, and diabetic individuals (Figure 3B).
To further explore the relationship between HbA1C and RBC function, we examined the correlation between HbA1C and various RBC properties in healthy individuals, as well as in those with prediabetes and diabetes. Specifically, K+ loss (a marker of membrane permeability), median elongation rate (RBC deformability), glucose consumption, lactate efflux rate (RBC metabolism), and intracellular levels of reduced thiols (redox state) vs. HbA1C levels in intact cells and in pre-membrane Hb fraction were analyzed (Table 4). The raw data and a statistical comparison of these parameters in healthy, prediabetic, and overt T2 diabetic RBCs are presented in Table S5. We found that the fraction of intact HbA1C was specifically correlated with lactate efflux rate (inversely) and reduced thiol content (positively) in healthy RBCs, and with mean elongation rate (inversely) in prediabetic erythrocytes. The membrane-bound HbA1C pool was negatively correlated with glucose consumption rate in prediabetic RBCs. These observed correlations imply a possible relationship between HbA1C and the physiological regulation of metabolic processes, highlighting abnormalities in these processes within diabetic conditions.
3. Discussion
In light of the global diabetes epidemic[30], HbA1C has become one of the most important biomarkers in clinical practice in the last few decades. This study aimed to clarify specific questions regarding the cellular properties of this form of Hb. The present study reveals three major findings. First, the distribution of HbA1C is heterogeneous, with a lower concentration at the RBC membrane than in the cytosolic compartment. This ratio remained consistent, regardless of overall HbA1C levels, in all tested groups of study participants. Second, there was a correlation between changes in HbA1C level and those of other Hb isoforms, specifically HbA2. Third, our findings suggest that HbA1C intracellular levels correlate with certain specific metabolic and rheological RBC properties, and these effects may vary depending on diabetes-related changes in the distribution of HbA1C between the intact cell and the membrane compartments.
3.1. Heterogeneous Intracellular Distribution of HbA1C and Interference with Other Hb Isoforms
The proportion of HbA1C in the pre-membrane pool was significantly lower than in the cytosolic compartment (Figure 1A). Interestingly, our recent findings ([16]; see also Table S1) revealed a significantly higher proportion of the HbA2 isoform in the pre-membrane pool compared to intact RBCs and the cytosol. This raises the question of whether particular features of the Hb molecules are used for the sorting of particular isoforms at the membrane. One such feature might be Hb charge. Positively charged HbA2[31] seems to favor binding to the membrane, whereas negatively charged HbA1C[15] has a lower probability of joining the pre-membrane Hb pool. The total amount of all Hb variants in the pre-membrane pool remained constant in healthy, prediabetic, and T2 diabetic individuals (Figure 1D), suggesting a constant number of “binding sites” for all Hb molecules at the membrane. Different isoforms of Hb seem to compete for these binding sites as tthe fractions of Hb isoforms are inversely related, as observed in the RBC membranes of all experimental groups (Table 3).
As already noted, N-terminal cytosolic domain of AE1 enriched with anionic amino acids, is widely recognized as a primary membrane binding site for Hb [22,23,24,25,26]. This negatively charged domain docks within the central cavity formed by the four globins of Hb, which is positively charged. This cavity opens wider as Hb deoxygenates, making the interaction O2-dependent. Notably, HbA2 exhibits a high affinity for AE1, with its membrane association not being solely dependent on electrostatic interactions[32]. Considering that a single RBC typically contains around 260 million Hb molecules[33], our data reveal approximately 507,000 HbA2 and 585,000 HbA1C molecules in the pre-membrane fraction of erythrocytes from healthy individuals. Given AE1's overwhelming presence (~1.2 x 10⁶ copies per cell), it logically represents a principal target for interaction with various Hb isoforms, but not the only one, as oxygenated Hb is less prone to dock to the cytosolic domain of AE1.
Hb has also been reported to interact with spectrin [34], as well as with anionic phosphatidylserine[35,36]. To the best of our knowledge, no data have been reported regarding a preferential interaction of HbA1C with any specific membrane component. Moreover, the modifications that convert HbA0 to HbA1C could potentially influence its binding properties. However, these reasons may provide an explanation for the small, but significant decrease in the membrane vs. intact proportion of HbA1C, especially in T2 diabetic individuals (Figure 1b). Given the significant alterations observed in the RBC membrane proteome in patients with T2D and impaired glucose tolerance[37,38], identifying the specific membrane targets of HbA1C, both those that are unique and those that are shared with other Hb isoforms, is crucial.
Although all samples were oxygenated prior to their examination, the potential contribution of Hb oxygenation should also be considered. As mentioned above, the mechanisms governing AE1’s interaction with Hb, in either oxygenated or deoxygenated form, are well described[23,26,39,40,41,42]. HbA1C exhibits an approximately 10-fold higher affinity to oxygen than the non-glycosylated form of HbA0[43]. Therefore, we might expect a lower prevalence of HbA1C the pre-membrane fraction compared to the HbA0 (a hypothesis supported by our data). If this holds true, O2 release occurs first from the pre-membrane Hb fraction enriched with HbA0 and A2 with lower average oxygen affinity, followed by O2 release by the cytosolic Hb fraction enriched with HbA1C. This further suggests that oxygenation of HbA1C occurs at a much lower partial pressure of oxygen than for HbA0 or HbA2, reducing its probability of docking at the cytosolic domain of AE1 with a higher affinity for the deoxygenated Hb state when in the circulation. Oxygen affinity of HbA2 is comparable to that of HbA0[32]; and the preferential binding of HbA2 to the cytosolic domain of AE1 compared to HbA0 is governed by other factors, including a positive surface charge.
Taken together, the obtained data suggest the following order of preference for binding to the membrane for the Hb isoforms: HbA2 > HbA0 > HbA1C, which reflects the differences in Hb isoform distribution between the cytosol and the pre-membrane pool (Table 2). This uneven distribution of Hb isoforms at the membrane defines functional differences between the pre-membrane and bulk cytosolic Hb; the physiological role remains to be explored. We acknowledge that direct experimental validation of this hypothesis is still lacking, warranting further studies.
In contrast to the inverse relationship between HbA1C and HbA2 contents observed in the membrane fractions of all examined groups, bulk levels of these Hb variants showed an opposite correlation exclusively in the RBCs of subjects with overt T2D. This phenomenon may be explained by several mechanisms that become prominent during the development of diabetic pathogenesis (Figure 4). A more chronic mechanism, particularly associated with overt diabetes, could be the onset of iron deficiency anemia (IDA). T2D and iron deficiency share a recognized and complex bidirectional relationship. IDA is notably more prevalent in individuals with T2D, with reported rates ranging from 13% to 47% across various studies[44]. This increased incidence of IDA in diabetic patients is driven by several interconnected mechanisms, such as diminished erythropoiesis due to decreased erythropoietin production in diabetic nephropathy[45]. The chronic inflammation characteristic of T2D elevates the level of hepcidin, a key regulator of iron homeostasis, impairing intestinal iron absorption and restricting the release of stored iron, thus promoting iron deficiency[46,47]. In addition, while not a direct cause of IDA, metformin, a common T2D medication, has been linked to vitamin B12 deficiency, which can contribute to or exacerbate anemia[48,49]. Finally, dietary modifications or altered eating habits in individuals with T2D may lead to insufficient iron intake[50]. Consequently, IDA commonly presents with a decrease in HbA2 [51], likely due to the more pronounced impact of iron deficiency on δ-globin synthesis and potentially reduced α-globin availability. Consistent with this, our study also revealed a decline in intact HbA2 within the T2 diabetic cohort samples (Table 2).
Variations in blood Ca²⁺ levels are a well-documented phenomenon in patients with T2D[52]. Specifically, several studies have reported elevated Ca²⁺ concentrations in individuals with T2D compared to healthy controls [53,54]. Moreover, a potential association between increased Ca²⁺ levels in the blood and a higher risk of developing diabetes has also been suggested [55]. To address these abnormalities, EDTA-based Ca²⁺-chelation therapies, such as the recent Trial to Assess Chelation Therapy (TACT) project, have been proposed as a means of preventing side-effect complications in diabetes treatment [56]. Intriguingly, our findings (Figure 3B and Table S4) demonstrate a significant decrease in HbA1C and an increase in HbA2 fractions in the total membrane Hb pool following EDTA treatment. Consequently, we can suggest that EDTA changes the influence of HbA1C on RBC mechanisms regulated by membrane components. Our prior work[16] established a direct link between plasma Ca2+ depletion by EDTA, Hb relocation within the RBC, and alterations in erythrocyte membrane permeability and metabolic properties. The current study suggests that some of these mechanisms are connected to, and potentially regulated by, HbA1C (Table 4, and see Section 3.2). This hypothesis warrants further investigation to understand clinical outcomes associated with RBC transfusion (where Ca²⁺-free storage solutions are routinely used)[57] and hypocalcemia-related complications[58,59,60,61,62,63].
In contrast, acute hyperglycemia did not significantly alter the intracellular distribution of HbA1C (or other Hb isoforms) (Figure 2). Erythrocytes exhibit a substantial metabolic requirement for glucose[64], which enters the cells via insulin-independent glucose transporter 1 (GLUT1), the primary glucose carrier in human RBCs [65]. Glucose binding and transport induce significant conformational changes in GLUT1[66,67,68,69]. Given the high abundance of GLUT1 in the RBC membrane, these dynamic structural changes likely contribute to the membrane’s overall organization and function[68]. Our findings of a modest effect of acute hyperglycemia on HbA1C’s intracellular arrangement present several interesting perspectives. Our data suggest the lack of direct interaction between GLUT1 and any Hb isoform. However, the lack of observed effects of glucose influx and/or its utilization on HbA1C redistribution does not rule out a potential influence of HbA1C on these processes. Investigating this possibility warrants a separate future study.
3.2. Possible Involvement of HbA1C in RBC Physiology and Rheology
Diabetes and its associated complications are characterized by hyperglycemic toxicity[70]. However, hyperglycemia is often a relatively late biomarker of diabetes. In many patients, insulin levels initially rise to compensate for increased insulin resistance. When the demand for insulin exceeds its production, glucose levels rise. In other words, before being exposed to high glucose concentrations (leading to increased HbA1C), RBCs are exposed to numerous non-hyperglycemic diabetic stimuli for a relatively extended period. This may explain why most of the examined features in both prediabetic and diabetic RBCs are poorly correlated with HbA1C levels (Table 4). In addition, a correlative approach can be useful to identify the physiological roles of HbA1C. This can be particularly useful when studying RBCs from prediabetic individuals, where the influence of hyperglycemia is still mild. Correlations between HbA1C and specific physiological features in non-hyperglycemic RBCs may also provide evidence for the possible regulatory function of HbA1C in the organism.
As demonstrated previously[71,72] and confirmed in the present study (Table 4), the rate of glucose uptake in diabetic erythrocytes is significantly reduced compared to that in healthy individuals. There were no significant changes in GLUT1 abundance in RBCs of healthy vs. diabetic individuals; however, increased glucose affinity of GLUT1 and structural alterations in the transporter [72], particularly in the outer domain[73], have been proposed as potential mechanisms for this reduced glucose uptake. Intriguingly, we observed an inverse correlation between the fraction of membrane-bound HbA1C and glucose-uptake rate only in prediabetic patients, but not in healthy or diabetic individuals. However, when analyzing the correlation between the intact HbA1C fraction and glucose-uptake rate across the combined cohort of healthy and T2 diabetic individuals, we found a significant inverse linear relationship between these parameters (p = 0.009). This result is similar to the findings of Porter-Turner and colleagues[72]. Despite similar trends in individual groups, overall significance for the total cohort was lacking. We hypothesize that this discrepancy may arise from different pathological stimuli affecting glucose-uptake and consumption rates in pre- and overt diabetic individuals; we will explore the nature of these stimuli in future studies.
Among the studied features, we found a correlation between intact HbA1C levels and lactate release in healthy erythrocytes. Lactate is an end-product of glycolysis, a key metabolic pathway that utilizes glucose to provide energy. Therefore, lactate production is directly linked to glucose uptake and glycolytic rate[64,74]. In contrast to the observed correlation for lactate release, we did not observe a corresponding correlation between HbA1C content and the rate of glucose consumption in healthy subjects, optionally suggesting that HbA1C primarily influences lactate efflux rather than production. To date, three primary pathways for lactate transport have been identified: (a) the H+-monocarboxylate transporter (MCT) pathway, (b) AE1-mediated exchange with inorganic anions, and (c) passive diffusion across the lipid bilayer (see more details in Ref.[75]). In human RBCs, the MCT pathway—specifically via the MCT1 transporter—is the predominant pathway for lactate exchange[76]. In general, regulation of all three pathways may potentially involve HbA1C, but the precise mechanisms underlying this link require further investigation. Moreover, the lack of correlation between HbA1C and lactate release in prediabetic and diabetic participants may relate to metabolic alterations in the native mechanism; therefore, further study may enhance clinical significance.
A positive correlation of the intact HbA1C pool with intracellular deprotonated reduced thiol (thiolate) content was revealed in healthy RBCs. Thiolate anions, formed by the deprotonation of sulfhydryl groups (R-SH), are present in proteins with free cysteine residues (e.g., Hb) and small substances such as glutathione (GSH). Previous studies have reported a negative correlation between HbA1C and thiol content in both healthy and diabetic individuals[77], suggesting that thiol groups may be targets of glycation[78,79]. Decreased intracellular GSH levels are well-documented in patients with T2D and diabetic complications (see literature summary in Ref.[80]). However, in the current study, we specifically evaluated intracellular levels of reduced thiols using the fluorescent dye monobromobimane (MBBR), and found a positive correlation with HbA1C levels. It is important to point out that the content of thiolate anions and their reactivity with MBBR are strongly pH-dependent[81]. In light of the previously confirmed positive correlation between intracellular pH and HbA1C levels[54], further investigation into the interplay of pH, thiol and HbA1C concentrations holds significant potential for future insights.
RBC deformability, a crucial hemodynamic property, enables the cells to dynamically alter their shape in response to flow conditions, thereby minimizing vascular resistance. This adaptability is essential for navigating narrow capillaries and the splenic vasculature, preventing their sequestration and premature clearance [82,83]. Reduced deformability impairs perfusion and oxygen delivery to peripheral tissues[84,85]. Notably, interactions between Hb and the RBC membrane have been implicated in compromised deformability[86], with recent evidence suggesting that deoxyHb-binding contributes to this reduction[87]. Our recent findings further indicate a correlation between decreased RBC deformability and the altered distribution of specific oxygenated Hb isoforms, particularly HbA2 and HbA0, between the cytosol and the cell membrane[24]. Decreased RBC deformability is a well-established characteristic in T2 diabetic patients [88,89,90,91,92,93]. However, despite significant research efforts to define a precise HbA1C threshold for the onset of impaired RBC deformability (e.g., Ref.[94]), the underlying mechanisms linking HbA1C to this alteration remain unclear. Surprisingly, in our study, we did not observe significant differences in mean elongation rate values between the studied groups. Importantly, all groups were well-matched and did not exhibit substantial differences in age or other examined RBC indices, except for cellular and membrane HbA1C levels. A significant correlation was found between deformability and HbA1C levels only in prediabetic RBCs (Table 4). Moreover, the overall correlation between HbA1C and mean elongation rate was minimal, suggesting a direct link between early diabetic events occurring in normoglycemia and changes in deformability. As a possible scenario, the contribution of hyperinsulinemia, which is associated with the developed insulin resistance in early diabetic pathogenesis[95,96,97], may be considered. Several previous studies[98,99] have linked metabolic abnormalities associated with insulin resistance to negative alterations in blood rheology. However, the absence of plasma insulin measurements in our study precludes confirmation of the hypothesized hyperinsulinemic nature of the observed correlations.
4. Materials and Methods
4.1. Blood Samples
Residual adult blood samples collected in heparin sulfate- or K3EDTA-supplemented tubes for routine clinical analysis at the central laboratory of Emek Medical Center (EMC) in Afula (Israel) between 2022 and 2025 were randomly selected by participant’s age (>20 years), and HbA1C levels of <5.7% (defined as healthy individuals), 5.7–6.4% (prediabetes), and >6.5% (T2D). The study was conducted following the Declaration of Helsinki and approved by the EMC ethics committee (EMC-0085-21).
4.2. Buffers and Chemicals
Plasma-mimicking buffer (PMB) contained 140 mM NaCl, 4 mM KCl, 0.75 mM MgSO4, 10 mM glucose, 0.015 mM ZnCl2, 0.2 mM glycine, 0.2 mM sodium glutamate, 0.2 mM alanine, 0.1 mM arginine, 0.6 mM glutamine, and 20 mM HEPES, adjusted to pH 7.4 with imidazole, and then supplemented with 0.01% w/v bovine serum albumin and 2 mM CaCl2. These and other chemicals were purchased from Sigma-Aldrich Israel (Rehovot, Israel), unless otherwise specified.
4.3. Hemoglobin Variant Analysis
HbA1C and other Hb variants were quantified by HPLC. The VARIANT™ II TURBO Hemoglobin Testing System (Bio-Rad, Hercules, CA, USA) was employed to separate Hb variants by cation-exchange chromatography in a salt gradient. Calibrations and controls were provided by the manufacturer with each batch. Samples were analyzed using the VARIANT™ II β-thalassemia Short Program. The analysis involved monitoring retention times, area percentages, and concentrations of various peaks and windows corresponding to different Hb variants: HbF (retention time of 1.1 min, 0.98–1.2 min window), HbA0 (2.5 min, 2.0–3.0 min), HbA2 (3.65 min, 3.57–3.75 min), and p2 (related to HbA1C; 1.39 min, 1.28–1.5 min). The measured p2 values exhibited a strong correlation (p = 0.9932) with the corresponding, clinically accepted HbA1C index (determined by the D-100 Hemoglobin Testing System; Bio-Rad), as shown in Figure 5. The intact and membrane HbA1C values presented in this study were recalculated from the corresponding p2 values.
4.4. RBC Membrane Preparation
The membrane fraction of RBCs was isolated following a previously described protocol with minimal modifications[16]. Briefly, a 150-µL aliquot of blood was incubated in 20 volumes of ice-cold HEPES-based hypoosmotic solution (20 mM HEPES/NaOH, 1 mM PMSF, pH 7.4) for 10 min, followed by centrifugation at 4 °C for 15 min at 14,000g. This procedure was repeated three times before proceeding with measurements of Hb isoform distribution or other cellular features. The Hb content was determined as cyanmethemoglobin using Drabkin’s reagent according to the manufacturer’s protocol.
4.5. Glucose Consumption, Lactate Release, and Potassium (K+)-Leakage Studies
The tests were performed using a GEM® Premier™ 5000 blood gas analyzer according to our previously published protocol[16]. Changes in K+, glucose, and lactate concentrations in PMB, reflecting K+ loss and glucose conversion to lactate, over 4 h, were expressed as millimoles per gram of Hb per hour. To correlate these changes with alterations in intact and membrane HbA1C and other Hb variants, RBC samples were collected and analyzed at both 0- and 4-h time points.
4.6. Determination of RBC Deformability
RBC deformability was assessed using a computerized cell flow analyzer[27,28,29]. Briefly, a 50-µL aliquot of RBC suspension (1% hematocrit, in the same medium used for pretreatment) was applied to an uncoated glass slide in a flow chamber. After a 10-min adhesion period, buffer flow was initiated, and the deformation of adherent RBCs was monitored at a shear stress of 3 Pa. For each measurement, 15–20 randomly selected fields (0.1 mm² each) were analyzed. Image analysis was used to determine the elongation ratios (ER) of individual cells and their distribution within the RBC population (ranging from 12,000 to 15,000 cells per sample). ER was calculated as the ratio of the major axis to the minor axis of each cell. An ER of 1 indicates a round, non-deformed RBC, while an ER of 3 signifies an extra- deformed, elongated erythrocyte.
4.7. Measurement of Deprotonated Reduced Thiols
The abundance of deprotonated reduced thiols in intact cells was measured using flow cytometry and FluoroPure MBBR (Thermo Fischer Scientific, Waltham, MA, USA). RBCs were first washed to remove plasma and buffy coat; 1 µL of packed RBCs was resuspended in 1 mL PMB supplemented with 100 µM MBBR dye. The samples were incubated for 1 h at 37 °C in the dark for thiol-labeling. Fluorescence intensity of stained RBCs was measured using a Navios EX flow cytometer (Beckman Coulter, Brea, CA, USA). Measurements were repeated at least twice, analyzing over 30,000 cells per sample. All data were analyzed using Kaluza Analysis Software (Beckman Coulter, https://www.beckman.co.il/flow-cytometry/software/kaluza).
4.8. Statistics
Data for the entire study were analyzed using GraphPad 5 software. The normality of distribution of the values obtained in each experimental set was evaluated by Shapiro–Wilk test, and those with p > 0.05 were considered normally distributed. For those parameters showing normal distribution, paired-matched values were compared by paired Student’s t-test. For the datasets that were not normally distributed, the Wilcoxon signed-rank test was used. For all analyses, a two-tailed test with p < 0.05 was accepted as statistically significant. For more details, see the figure legends.
5. Conclusions
This study reveals a heterogeneous distribution of HbA1c in human RBCs, specifically noting a reduced presence in the pre-membrane pool. We observed a strong correlation between fluctuations in HbA1C and other Hb isoforms, such as HbA2 and HbA0, especially under conditions of overt T2D or acute exposure to Ca²⁺-depleted environments. Notably, short-term hyperglycemia had a minimal impact on HbA1C intracellular localization. Furthermore, our findings indicate a significant correlation between HbA1C intracellular distribution and several physiological properties of RBCs. These relationships may vary based on the specific pathological abnormalities associated with pre- and overt diabetic conditions. Further research is essential to fully elucidate the underlying causes and consequences of these observed phenomena.
Supplementary Materials
The following supporting information can be downloaded at the website of this paper posted on Preprints.org, Figure S1: Minimal changes in membrane Hb concentrations after a 4-h incubation in PMB supplemented with 10 mM glucose; Table S1: Distribution of hemoglobin (Hb) isoforms in intact red blood cells (RBCs) and in their membrane and cytosolic compartments; Table S2: Mean content and concentrations of Hb isoforms in intact RBCs and their membranes from healthy, prediabetic, and T2 diabetic individuals; Table S3: Alterations in the near-membrane distribution of Hb isoforms following 4-h incubation of erythrocytes in a hyperglycemic environment (10 mM D-glucose in plasma-mimicking buffer [PMB]); Table S4: Effect of EDTA on Hb isoform distribution in RBC membranes; Table S5: RBC functional markers in healthy, prediabetic, and T2 diabetic individuals.
Author Contributions
Conceptualization, A.B., A.K., C.L., and L.L.; methodology, G.P., A.W., G.B., L.L.; formal analysis, G.P., A.W., G.B., L.L.; investigation, G.P., A.W., G.B. L.L.; data curation, A.K., C.L., L.L.; writing—original draft preparation, A.B., L.L.; writing—review and editing, G.P., G.B., A.K., and C.L.; visualization, G.P., L.L.; supervision, A.K., C.L., L.L.; project administration, C.L., L.L.; funding acquisition, C.L., L.L. All authors have read and agreed to the published version of the manuscript.
Funding
This research received no external funding.
Institutional Review Board Statement
The study was conducted in accordance with the Declaration of Helsinki, and approved by the Emek Medical Center ethics committee (EMC-0085-21).
Informed Consent Statement
In view of the specificity of the study's protocol, informed consent was not obtained from the subjects whose blood samples were investigated.
Data Availability Statement
Data is contained within the article. The data presented in this study are available on request from the corresponding author.
Acknowledgments
The authors express their sincere gratitude to the staff of the Pediatric Hematology Unit and the Laboratory Division at Emek Medical Center (Afula, Israel), particularly Dr. Sari Peretz, Omaila Fahoum, Nofar Ifrach, and Liora Voskoboinik, for their exceptional technical assistance.
Conflicts of Interest
The authors declare no conflict of interest.
References
- Roden, M.; Shulman, G.I. The Integrative Biology of Type 2 Diabetes. Nature 2019, 576, 51–60. [CrossRef]
- Sobel, B.E.; Schneider, D.J. Cardiovascular Complications in Diabetes Mellitus. Curr Opin Pharmacol 2005, 5, 143–148. [CrossRef]
- Faselis, C.; Katsimardou, A.; Imprialos, K.; Deligkaris, P.; Kallistratos, M.; Dimitriadis, K. Microvascular Complications of Type 2 Diabetes Mellitus. Curr Vasc Pharmacol 2020, 18, 117–124. [CrossRef]
- Avogaro, A.; Fadini, G.P. Microvascular Complications in Diabetes: A Growing Concern for Cardiologists. Int J Cardiol 2019, 291, 29–35. [CrossRef]
- Brownlee, M. Biochemistry and Molecular Cell Biology of Diabetic Complications. Nature 2001, 414, 813–820. [CrossRef]
- Genuth, S.M.; Palmer, J.P.; Nathan, D.M. Classification and Diagnosis of Diabetes. . In Diabetes in America.; Cowie CC, Casagrande SS, Menke A, et al, Eds.; National Institute of Diabetes and Digestive and Kidney Diseases (US): Bethesda (MD), 2018; Vol. Chapter 1.
- Saeedi, P.; Petersohn, I.; Salpea, P.; Malanda, B.; Karuranga, S.; Unwin, N.; Colagiuri, S.; Guariguata, L.; Motala, A.A.; Ogurtsova, K.; et al. Global and Regional Diabetes Prevalence Estimates for 2019 and Projections for 2030 and 2045: Results from the International Diabetes Federation Diabetes Atlas, 9th Edition. Diabetes Res Clin Pract 2019, 157, 107843. [CrossRef]
- Liddy, A.M.; Grundy, S.; Sreenan, S.; Tormey, W. Impact of Haemoglobin Variants on the Use of Haemoglobin A1c for the Diagnosis and Monitoring of Diabetes: A Contextualised Review. Irish Journal of Medical Science (1971 -) 2023, 192, 169–176. [CrossRef]
- Raghothama, C.; Rao, P. Degradation of Glycated Hemoglobin. Clinica Chimica Acta 1997, 264, 13–25. [CrossRef]
- Sen, S.; Kar, M.; Roy, A.; Chakraborti, A.S. Effect of Nonenzymatic Glycation on Functional and Structural Properties of Hemoglobin. Biophys Chem 2005, 113, 289–298. [CrossRef]
- Kar, M.; Chakraborti, A.S. Release of Iron from Haemoglobin--a Possible Source of Free Radicals in Diabetes Mellitus. Indian J Exp Biol 1999, 37, 190–192.
- de Orué Lucana, D.O.; Roscher, M.; Honigmann, A.; Schwarz, J. Iron-Mediated Oxidation Induces Conformational Changes within the Redox-Sensing Protein HbpS. Journal of Biological Chemistry 2010, 285, 28086–28096. [CrossRef]
- Shetty, J.K.; Prakash, M.; Ibrahim, M.S. Relationship between Free Iron and Glycated Hemoglobin in Uncontrolled Type 2 Diabetes Patients Associated with Complications. Indian Journal of Clinical Biochemistry 2008, 23, 67–70. [CrossRef]
- Atamna, H.; Ginsburg, H. Heme Degradation in the Presence of Glutathione. Journal of Biological Chemistry 1995, 270, 24876–24883. [CrossRef]
- Chen, Z.; Shao, L.; Jiang, M.; Ba, X.; Ma, B.; Zhou, T. Interpretation of HbA1c Lies at the Intersection of Analytical Methodology, Clinical Biochemistry and Hematology (Review). Exp Ther Med 2022, 24, 707. [CrossRef]
- Livshits, L.; Peretz, S.; Bogdanova, A.; Zoabi, H.; Eitam, H.; Barshtein, G.; Galindo, C.; Feldman, Y.; Pajic-Lijakovic, I.; Koren. Ariel; et al. The Impact of Ca2+ on Intracellular of Hemoglobin in Human Erythrocytes. Cells 2023, 12, 2280. [CrossRef]
- Low, P.S.; Allen, D.P.; Zioncheck, T.F.; Chari, P.; Willardson, B.M.; Geahlen, R.L.; Harrison, M.L. Tyrosine Phosphorylation of Band 3 Inhibits Peripheral Protein Binding. J Biol Chem 1987, 262, 4592–4596.
- Harrison, M.L.; Rathinavelu, P.; Arese, P.; Geahlen, R.L.; Low, P.S. Role of Band 3 Tyrosine Phosphorylation in the Regulation of Erythrocyte Glycolysis. J Biol Chem 1991, 266, 4106–4111.
- Passing, R.; Schubert, D. The Binding of Ca 2⊕ to Solubilized Band 3 Protein of the Human Erythrocyte Membrane. Hoppe Seylers Z Physiol Chem 1983, 364, 873–878. [CrossRef]
- Makhro, A.; Hänggi, P.; Goede, J.S.; Wang, J.; Brüggemann, A.; Gassmann, M.; Schmugge, M.; Kaestner, L.; Speer, O.; Bogdanova, A. N-Methyl-d-Aspartate Receptors in Human Erythroid Precursor Cells and in Circulating Red Blood Cells Contribute to the Intracellular Calcium Regulation. American Journal of Physiology-Cell Physiology 2013, 305, C1123–C1138. [CrossRef]
- Makhro, A.; Haider, T.; Wang, J.; Bogdanov, N.; Steffen, P.; Wagner, C.; Meyer, T.; Gassmann, M.; Hecksteden, A.; Kaestner, L.; et al. Comparing the Impact of an Acute Exercise Bout on Plasma Amino Acid Composition, Intraerythrocytic Ca2+ Handling, and Red Cell Function in Athletes and Untrained Subjects. Cell Calcium 2016, 60, 235–244. [CrossRef]
- Puchulu-Campanella, E.; Chu, H.; Anstee, D.J.; Galan, J.A.; Tao, W.A.; Low, P.S. Identification of the Components of a Glycolytic Enzyme Metabolon on the Human Red Blood Cell Membrane. Journal of Biological Chemistry 2013, 288, 848–858. [CrossRef]
- Issaian, A.; Hay, A.; Dzieciatkowska, M.; Roberti, D.; Perrotta, S.; Darula, Z.; Redzic, J.; Busch, M.P.; Page, G.P.; Rogers, S.C.; et al. The Interactome of the N-Terminus of Band 3 Regulates Red Blood Cell Metabolism and Storage Quality. Haematologica 2021, 106, 2971–2985. [CrossRef]
- Barshtein, G.; Livshits, L.; Gural, A.; Arbell, D.; Barkan, R.; Pajic-Lijakovic, I.; Yedgar, S. Hemoglobin Binding to the Red Blood Cell (RBC) Membrane Is Associated with Decreased Cell Deformability. Int J Mol Sci 2024, 25, 5814. [CrossRef]
- Walder, J.A.; Chatterjee, R.; Steck, T.L.; Low, P.S.; Musso, G.F.; Kaiser, E.T.; Rogers, P.H.; Arnone, A. The Interaction of Hemoglobin with the Cytoplasmic Domain of Band 3 of the Human Erythrocyte Membrane. J Biol Chem 1984, 259, 10238–10246.
- Castagnola, M.; Messana, I.; Sanna, M.T.; Giardina, B. Oxygen-Linked Modulation of Erythrocyte Metabolism: State of the Art. Blood Transfus 2010, 8 Suppl 3, s53–s58. [CrossRef]
- Standl, E.; Khunti, K.; Hansen, T.B.; Schnell, O. The Global Epidemics of Diabetes in the 21st Century: Current Situation and Perspectives. Eur J Prev Cardiol 2019, 26, 7–14. [CrossRef]
- Fischer, S.; Nagel, R.L.; Bookchin, R.M.; Roth, E.F.; Tellez-Nagel, I. The Binding of Hemoglobin to Membranes of Normal and Sickle Erythrocytes. Biochimica et Biophysica Acta (BBA) - Biomembranes 1975, 375, 422–433. [CrossRef]
- Steinberg, M.H.; Rodgers, G.P. HbA2: Biology, Clinical Relevance and a Possible Target for Ameliorating Sickle Cell Disease. Br J Haematol 2015, 170, 781–786. [CrossRef]
- Yoshida, T.; Prudent, M.; D’alessandro, A. Red Blood Cell Storage Lesion: Causes and Potential Clinical Consequences. Blood Transfus 2019, 17, 27–52. [CrossRef]
- Datta, P.; Chakrabarty, S.B.; Chakrabarty, A.; Chakrabarti, A. Interaction of Erythroid Spectrin with Hemoglobin Variants: Implications in β-Thalassemia. Blood Cells Mol Dis 2003, 30, 248–253. [CrossRef]
- Shviro, Y.; Zilber, I.; Shaklai, N. The Interaction of Hemoglobin with Phosphatidylserine Vesicles. Biochimica et Biophysica Acta (BBA) - Biomembranes 1982, 687, 63–70. [CrossRef]
- Bucki, R.; Bachelot-Loza, C.; Zachowski, A.; Giraud, F.; Sulpice, J.-C. Calcium Induces Phospholipid Redistribution and Microvesicle Release in Human Erythrocyte Membranes by Independent Pathways. Biochemistry 1998, 37, 15383–15391. [CrossRef]
- Zhang, Q.; Tang, N.; Schepmoes, A.A.; Phillips, L.S.; Smith, R.D.; Metz, T.O. Proteomic Profiling of Nonenzymatically Glycated Proteins in Human Plasma and Erythrocyte Membranes. J Proteome Res 2008, 7, 2025–2032. [CrossRef]
- Zhang, Q.; Monroe, M.E.; Schepmoes, A.A.; Clauss, T.R.W.; Gritsenko, M.A.; Meng, D.; Petyuk, V.A.; Smith, R.D.; Metz, T.O. Comprehensive Identification of Glycated Peptides and Their Glycation Motifs in Plasma and Erythrocytes of Control and Diabetic Subjects. J Proteome Res 2011, 10, 3076–3088. [CrossRef]
- Chu, H.; Low, P.S. Mapping of Glycolytic Enzyme-Binding Sites on Human Erythrocyte Band 3. Biochemical Journal 2006, 400, 143–151. [CrossRef]
- Schuck, P.; Schubert, D. Band 3-hemoglobin Associations The Band 3 Tetramer Is the Oxyhemoglobin Binding Site. FEBS Lett 1991, 293, 81–84. [CrossRef]
- Chu, H.; Breite, A.; Ciraolo, P.; Franco, R.S.; Low, P.S. Characterization of the Deoxyhemoglobin Binding Site on Human Erythrocyte Band 3: Implications for O2 Regulation of Erythrocyte Properties. Blood 2008, 111, 932–938. [CrossRef]
- Chu, H.; McKenna, M.M.; Krump, N.A.; Zheng, S.; Mendelsohn, L.; Thein, S.L.; Garrett, L.J.; Bodine, D.M.; Low, P.S. Reversible Binding of Hemoglobin to Band 3 Constitutes the Molecular Switch That Mediates O2 Regulation of Erythrocyte Properties. Blood 2016, 128, 2708–2716. [CrossRef]
- Marschner, J.P.; Rietbrock, N. Oxygen Release Kinetics in Healthy Subjects and Diabetic Patients. I: The Role of 2,3-Diphosphoglycerate. Int J Clin Pharmacol Ther 1994, 32, 533–535.
- Elsheikh, E.; Aljohani, S.S.; Alshaikhmubarak, M.M.; Alhawl, M.A.; Alsubaie, A.W.; Alsultan, N.; Sharif, A.F.; Ibrahim Ali, S. Implications of Iron Deficiency Anaemia on Glycemic Dynamics in Diabetes Mellitus: A Critical Risk Factor in Cardiovascular Disease. Cureus 2023, 15, e49414. [CrossRef]
- Symeonidis, A.; Kouraklis-Symeonidis, A.; Psiroyiannis, A.; Leotsinidis, M.; Kyriazopoulou, V.; Vassilakos, P.; Vagenakis, A.; Zoumbos, N. Inappropriately Low Erythropoietin Response for the Degree of Anemia in Patients with Noninsulin-Dependent Diabetes Mellitus. Ann Hematol 2006, 85, 79–85. [CrossRef]
- D’Angelo, G. Role of Hepcidin in the Pathophysiology and Diagnosis of Anemia. Blood Res 2013, 48, 10–15. [CrossRef]
- Camaschella, C.; Nai, A.; Silvestri, L. Iron Metabolism and Iron Disorders Revisited in the Hepcidin Era. Haematologica 2020, 105, 260–272. [CrossRef]
- Sahin, M.; Tutuncu, N.B.; Ertugrul, D.; Tanaci, N.; Guvener, N.D. Effects of Metformin or Rosiglitazone on Serum Concentrations of Homocysteine, Folate, and Vitamin B12 in Patients with Type 2 Diabetes Mellitus. J Diabetes Complications 2007, 21, 118–123. [CrossRef]
- Sayedali, E.; Yalin, A.E.; Yalin, S. Association between Metformin and Vitamin B12 Deficiency in Patients with Type 2 Diabetes. World J Diabetes 2023, 14, 585–593. [CrossRef]
- Wang, R.; Liu, Y.; Thabane, L.; Olier, I.; Li, L.; Ortega-Martorell, S.; Lip, G.Y.H.; Li, G. Relationship between Trajectories of Dietary Iron Intake and Risk of Type 2 Diabetes Mellitus: Evidence from a Prospective Cohort Study. Nutr J 2024, 23, 15. [CrossRef]
- Harthoorn-Lasthuizen, E.J.; Lindemans, J.; Langenhuijsen, M.M.A.C. Influence of Iron Deficiency Anaemia on Haemoglobin A 2 Levels: Possible Consequences for ß?Thalassaemia Screening. Scand J Clin Lab Invest 1999, 59, 65–70. [CrossRef]
- Tyczyńska, M.; Hunek, G.; Kawecka, W.; Brachet, A.; Gędek, M.; Kulczycka, K.; Czarnek, K.; Flieger, J.; Baj, J. Association Between Serum Concentrations of (Certain) Metals and Type 2 Diabetes Mellitus. J Clin Med 2024, 13, 7443. [CrossRef]
- Levy, J.; Stern, Z.; Gutman, A.; Naparstek, Y.; Gavin, J.R.; Avioli, L. V. Plasma Calcium and Phosphate Levels in an Adult Noninsulin-Dependent Diabetic Population. Calcif Tissue Int 1986, 39, 316–318. [CrossRef]
- Becerra-Tomás, N.; Estruch, R.; Bulló, M.; Casas, R.; Díaz-López, A.; Basora, J.; Fitó, M.; Serra-Majem, L.; Salas-Salvadó, J. Increased Serum Calcium Levels and Risk of Type 2 Diabetes in Individuals at High Cardiovascular Risk. Diabetes Care 2014, 37, 3084–3091. [CrossRef]
- Lorenzo, C.; Hanley, A.J.; Rewers, M.J.; Haffner, S.M. Calcium and Phosphate Concentrations and Future Development of Type 2 Diabetes: The Insulin Resistance Atherosclerosis Study. Diabetologia 2014, 57, 1366–1374. [CrossRef]
- Diaz, D.; Fonseca, V.; Aude, Y.W.; Lamas, G.A. Chelation Therapy to Prevent Diabetes-Associated Cardiovascular Events. Current Opinion in Endocrinology & Diabetes and Obesity 2018, 25, 258–266. [CrossRef]
- Hall, C.; Nagengast, A.K.; Knapp, C.; Behrens, B.; Dewey, E.N.; Goodman, A.; Bommiasamy, A.; Schreiber, M. Massive Transfusions and Severe Hypocalcemia: An Opportunity for Monitoring and Supplementation Guidelines. Transfusion (Paris) 2021, 61, S188–S194. [CrossRef]
- Aleem, A.; Al-Momen, A.-K.; Al-Harakati, M.S.; Hassan, A.; Al-Fawaz, I. Hypocalcemia Due to Hypoparathyroidism in β-Thalassemia Major Patients. Ann Saudi Med 2000, 20, 364–366. [CrossRef]
- Jankowski, S.; Vincent, J.-L. Calcium Administration for Cardiovascular Support in Critically Ill Patients: When Is It Indicated? J Intensive Care Med 1995, 10, 91–100. [CrossRef]
- McMahon, M.J.; Woodhead, J.S.; Hayward, R.D. The Nature of Hypocalcaemia in Acute Pancreatitis. British Journal of Surgery 2005, 65, 216–218. [CrossRef]
- Decaux, G.; Hallemans, R.; Mockel, J.; Naeije, R. Chronic Alcoholism: A Predisposing Factor for Hypocalcemia in Acute Pancreatitis. Digestion 1980, 20, 175–179. [CrossRef]
- Qi, X.; Kong, H.; Ding, W.; Wu, C.; Ji, N.; Huang, M.; Li, T.; Wang, X.; Wen, J.; Wu, W.; et al. Abnormal Coagulation Function of Patients With COVID-19 Is Significantly Related to Hypocalcemia and Severe Inflammation. Front Med (Lausanne) 2021, 8, 638194-.. [CrossRef]
- Zaloga, G.P.; Chernow, B. The Multifactorial Basis for Hypocalcemia During Sepsis. Ann Intern Med 1987, 107, 36–41. [CrossRef]
- Chatzinikolaou, P.N.; Margaritelis, N. V.; Paschalis, V.; Theodorou, A.A.; Vrabas, I.S.; Kyparos, A.; D’Alessandro, A.; Nikolaidis, M.G. Erythrocyte Metabolism. Acta Physiologica 2024, 240, e14081. [CrossRef]
- Montel-Hagen, A.; Kinet, S.; Manel, N.; Mongellaz, C.; Prohaska, R.; Battini, J.-L.; Delaunay, J.; Sitbon, M.; Taylor, N. Erythrocyte Glut1 Triggers Dehydroascorbic Acid Uptake in Mammals Unable to Synthesize Vitamin C. Cell 2008, 132, 1039–1048. [CrossRef]
- Carruthers, A.; DeZutter, J.; Ganguly, A.; Devaskar, S.U. Will the Original Glucose Transporter Isoform Please Stand Up! American Journal of Physiology-Endocrinology and Metabolism 2009, 297, E836–E848. [CrossRef]
- Galochkina, T.; Ng Fuk Chong, M.; Challali, L.; Abbar, S.; Etchebest, C. New Insights into GluT1 Mechanics during Glucose Transfer. Sci Rep 2019, 9, 998. [CrossRef]
- Guizouarn, H.; Allegrini, B. Erythroid Glucose Transport in Health and Disease. Pflugers Arch 2020, 472, 1371–1383. [CrossRef]
- Domene, C.; Wiley, B.; Gonzalez-Resines, S.; Naftalin, R.J. Insight into the Mechanism of <scp>d</Scp> -Glucose Accelerated Exchange in GLUT1 from Molecular Dynamics Simulations. Biochemistry 2025, 64, 928–939. [CrossRef]
- Zheng, H.; Wu, J.; Jin, Z.; Yan, L.-J. Protein Modifications as Manifestations of Hyperglycemic Glucotoxicity in Diabetes and Its Complications. Biochem Insights 2016, 9, 1–9. [CrossRef]
- Nielsen, M.F.; Basu, R.; Wise, S.; Caumo, A.; Cobelli, C.; Rizza, R.A. Normal Glucose-Induced Suppression of Glucose Production but Impaired Stimulation of Glucose Disposal in Type 2 Diabetes: Evidence for a Concentration-Dependent Defect in Uptake. Diabetes 1998, 47, 1735–1747. [CrossRef]
- Porter-Turner, M.M.; Skidmore, J.C.; Khokher, M.A.; Singh, B.M.; Rea, C.A. Relationship between Erythrocyte GLUT1 Function and Membrane Glycation in Type 2 Diabetes. Br J Biomed Sci 2011, 68, 203–207. [CrossRef]
- Hu, X.; Peng, F.; Zhou, H.; Zhang, Z.; Cheng, W.; Feng, H. The Abnormality of Glucose Transporter in the Erythrocyte Membrane of Chinese Type 2 Diabetic Patients. Biochimica et Biophysica Acta (BBA) - Biomembranes 2000, 1466, 306–314. [CrossRef]
- Martins Freire, C.; King, N.R.; Dzieciatkowska, M.; Stephenson, D.; Moura, P.L.; Dobbe, J.; Streekstra, G.; D’Alessandro, A.; Toye, A.M.; Satchwell, T.J. Complete Absence of GLUT1 Does Not Impair Human Terminal Erythroid Differentiation. Blood Adv 2024, bloodadvances.2024012743. [CrossRef]
- Li, X.; Yang, Y.; Zhang, B.; Lin, X.; Fu, X.; An, Y.; Zou, Y.; Wang, J.-X.; Wang, Z.; Yu, T. Lactate Metabolism in Human Health and Disease. Signal Transduct Target Ther 2022, 7, 305. [CrossRef]
- Pattillo, R.E.; Gladden, L.B. Red Blood Cell Lactate Transport in Sickle Disease and Sickle Cell Trait. J Appl Physiol 2005, 99, 822–827. [CrossRef]
- Mahmoud, A.A.; Nor El-Din, A.K.A. Glucose-6-Phosphate Dehydrogenase Activity and Protein Oxidative Modification in Patients with Type 2 Diabetes Mellitus. J Biomark 2013, 2013, 1–7. [CrossRef]
- Zeng, J.; Davies, M.J. Protein and Low Molecular Mass Thiols as Targets and Inhibitors of Glycation Reactions. Chem Res Toxicol 2006, 19, 1668–1676. [CrossRef]
- Uceda, A.B.; Mariño, L.; Casasnovas, R.; Adrover, M. An Overview on Glycation: Molecular Mechanisms, Impact on Proteins, Pathogenesis, and Inhibition. Biophys Rev 2024, 16, 189–218. [CrossRef]
- Livshits, L.; Barshtein, G.; Arbell, D.; Gural, A.; Levin, C.; Guizouarn, H. Do We Store Packed Red Blood Cells under “Quasi-Diabetic” Conditions? Biomolecules 2021, 11, 992–992. [CrossRef]
- Kosower, E.M.; Kosower, N.S. [12] Bromobimane Probes for Thiols. In; 1995; pp. 133–148.
- Warkentin, T.; Barr, R.; Ali, M.; Mohandas, N. Recurrent Acute Splenic Sequestration Crisis Due to Interacting Genetic Defects: Hemoglobin SC Disease and Hereditary Spherocytosis. Blood 1990, 75, 266–270. [CrossRef]
- Mohandas, N.; Chasis, J.A. Red Blood Cell Deformability, Membrane Material Properties and Shape: Regulation by Transmembrane, Skeletal and Cytosolic Proteins and Lipids. Semin Hematol 1993, 30, 171–192.
- Parthasarathi, K.; Lipowsky, H.H. Capillary Recruitment in Response to Tissue Hypoxia and Its Dependence on Red Blood Cell Deformability. American Journal of Physiology-Heart and Circulatory Physiology 1999, 277, H2145–H2157. [CrossRef]
- Sakr, Y.; Chierego, M.; Piagnerelli, M.; Verdant, C.; Dubois, M.-J.; Koch, M.; Creteur, J.; Gullo, A.; Vincent, J.-L.; De Backer, D. Microvascular Response to Red Blood Cell Transfusion in Patients with Severe Sepsis*. Crit Care Med 2007, 35, 1639–1644. [CrossRef]
- Friederichs, E.; Farley, R.A.; Meiselman, H.J. Influence of Calcium Permeabilization and Membrane-attached Hemoglobin on Erythrocyte Deformability. Am J Hematol 1992, 41, 170–177. [CrossRef]
- Jin, X.; Zhang, Y.; Wang, D.; Zhang, X.; Li, Y.; Wang, D.; Liang, Y.; Wang, J.; Zheng, L.; Song, H.; et al. Metabolite and Protein Shifts in Mature Erythrocyte under Hypoxia. iScience 2024, 27, 109315. [CrossRef]
- McMillan, D.E.; Utterback, N.G.; Puma, J. La Reduced Erythrocyte Deformability in Diabetes. Diabetes 1978, 27, 895–901. [CrossRef]
- Bareford, D.; Jennings, P.E.; Stone, P.C.; Baar, S.; Barnett, A.H.; Stuart, J. Effects of Hyperglycaemia and Sorbitol Accumulation on Erythrocyte Deformability in Diabetes Mellitus. J Clin Pathol 1986, 39, 722–727. [CrossRef]
- Fujita; Tsuda; Takeda; Yu; Fujimoto; Kajikawa; Nishimura; Mizuno; Hamamoto; Mukai; et al. Nisoldipine Improves the Impaired Erythrocyte Deformability Correlating with Elevated Intracellular Free Calcium-ion Concentration and Poor Glycaemic Control in NIDDM. Br J Clin Pharmacol 1999, 47, 499–506. [CrossRef]
- Schwartz, R.S.; Madsen, J.W.; Rybicki, A.C.; Nagel, R.L. Oxidation of Spectrin and Deformability Defects in Diabetic Erythrocytes. Diabetes 1991, 40, 701–708. [CrossRef]
- Babu, N. Influence of Hypercholesterolemia on Deformability and Shape Parameters of Erythrocytes in Hyperglycemic Subjects. Clin Hemorheol Microcirc 2009, 41, 169–177. [CrossRef]
- Cahn, A.; Livshits, L.; Srulevich, A.; Raz, I.; Yedgar, S.; Barshtein, G. Diabetic Foot Disease Is Associated with Reduced Erythrocyte Deformability. Int Wound J 2016, 13, 500–504. [CrossRef]
- Li, Q.; Yang, L.Z. Hemoglobin A1c Level Higher than 9.05% Causes a Significant Impairment of Erythrocyte Deformability in Diabetes Mellitus. Acta Endocrinol (Buchar) 2018, 14, 66–75. [CrossRef]
- Petersen, M.C.; Shulman, G.I. Mechanisms of Insulin Action and Insulin Resistance. Physiol Rev 2018, 98, 2133–2223. [CrossRef]
- Hamley, S.; Kloosterman, D.; Duthie, T.; Dalla Man, C.; Visentin, R.; Mason, S.A.; Ang, T.; Selathurai, A.; Kaur, G.; Morales-Scholz, M.G.; et al. Mechanisms of Hyperinsulinaemia in Apparently Healthy Non-Obese Young Adults: Role of Insulin Secretion, Clearance and Action and Associations with Plasma Amino Acids. Diabetologia 2019, 62, 2310–2324. [CrossRef]
- Janssen, J.A.M.J.L. Hyperinsulinemia and Its Pivotal Role in Aging, Obesity, Type 2 Diabetes, Cardiovascular Disease and Cancer. Int J Mol Sci 2021, 22, 7797. [CrossRef]
- Brun, J.-F.; Aloulou, I.; Varlet-Marie, E. Hemorheological Aspects of the Metabolic Syndrome: Markers of Insulin Resistance, Obesity or Hyperinsulinemia? Clin Hemorheol Microcirc 2004, 30, 203–209.
- Farber, P.L.; Dias, A.; Freitas, T.; Pinho, A.C.; Viggiano, D.; Saldanha, C.; Silva-Herdade, A.S. Evaluation of Hemorheological Parameters as Biomarkers of Calcium Metabolism and Insulin Resistance in Postmenopausal Women. Clin Hemorheol Microcirc 2021, 77, 395–410. [CrossRef]
- Barshtein, G.; Gural, A.; Zelig, O.; Arbell, D.; Yedgar, S. Unit-to-Unit Variability in the Deformability of Red Blood Cells. Transfusion and Apheresis Science 2020, 59, 102876. [CrossRef]
- Barshtein, G.; Rasmusen, T.L.; Zelig, O.; Arbell, D.; Yedgar, S. Inter-donor Variability in Deformability of Red Blood Cells in Blood Units. Transfusion Medicine 2020, 30, 492–496. [CrossRef]
- Barshtein, G.; Pries, A.R.; Goldschmidt, N.; Zukerman, A.; Orbach, A.; Zelig, O.; Arbell, D.; Yedgar, S. Deformability of Transfused Red Blood Cells Is a Potent Determinant of Transfusion-Induced Change in Recipient’s Blood Flow. Microcirculation 2016, 23, 479–486. [CrossRef]
Figure 1.
Subcellular distribution of HbA1C in healthy, prediabetic, and T2 diabetic individuals. The percentage of HbA1C relative to total hemoglobin (A) and membrane-to-intact compartment HbA1C ratios (B) for healthy (n = 56), prediabetic (n = 53), and T2 diabetic (n = 56) individuals are shown. Blood samples collected into heparin-supplemented tubes were kept at room temperature for no more than 4 h before measurement. RBCs were isolated from plasma and buffy coat by brief centrifugation at 1700×g, and Hb isoform measurements were immediately performed on intact RBCs; RBC membranes were isolated as described in Section 4.4. Wilcoxon signed-rank test was used to assess significance for the membrane and intact fractions, and the ratios between them, within each group; data are presented as median ± CI. Significance level: p < 0.05; NS, non-significant. Hb concentrations in intact RBCs (C) and their membrane fractions (D) were determined using Drabkin’s reagent as described in Section 4.4. The data were found to be normally distributed and were compared using paired Student’s t-test (all p > 0.05).
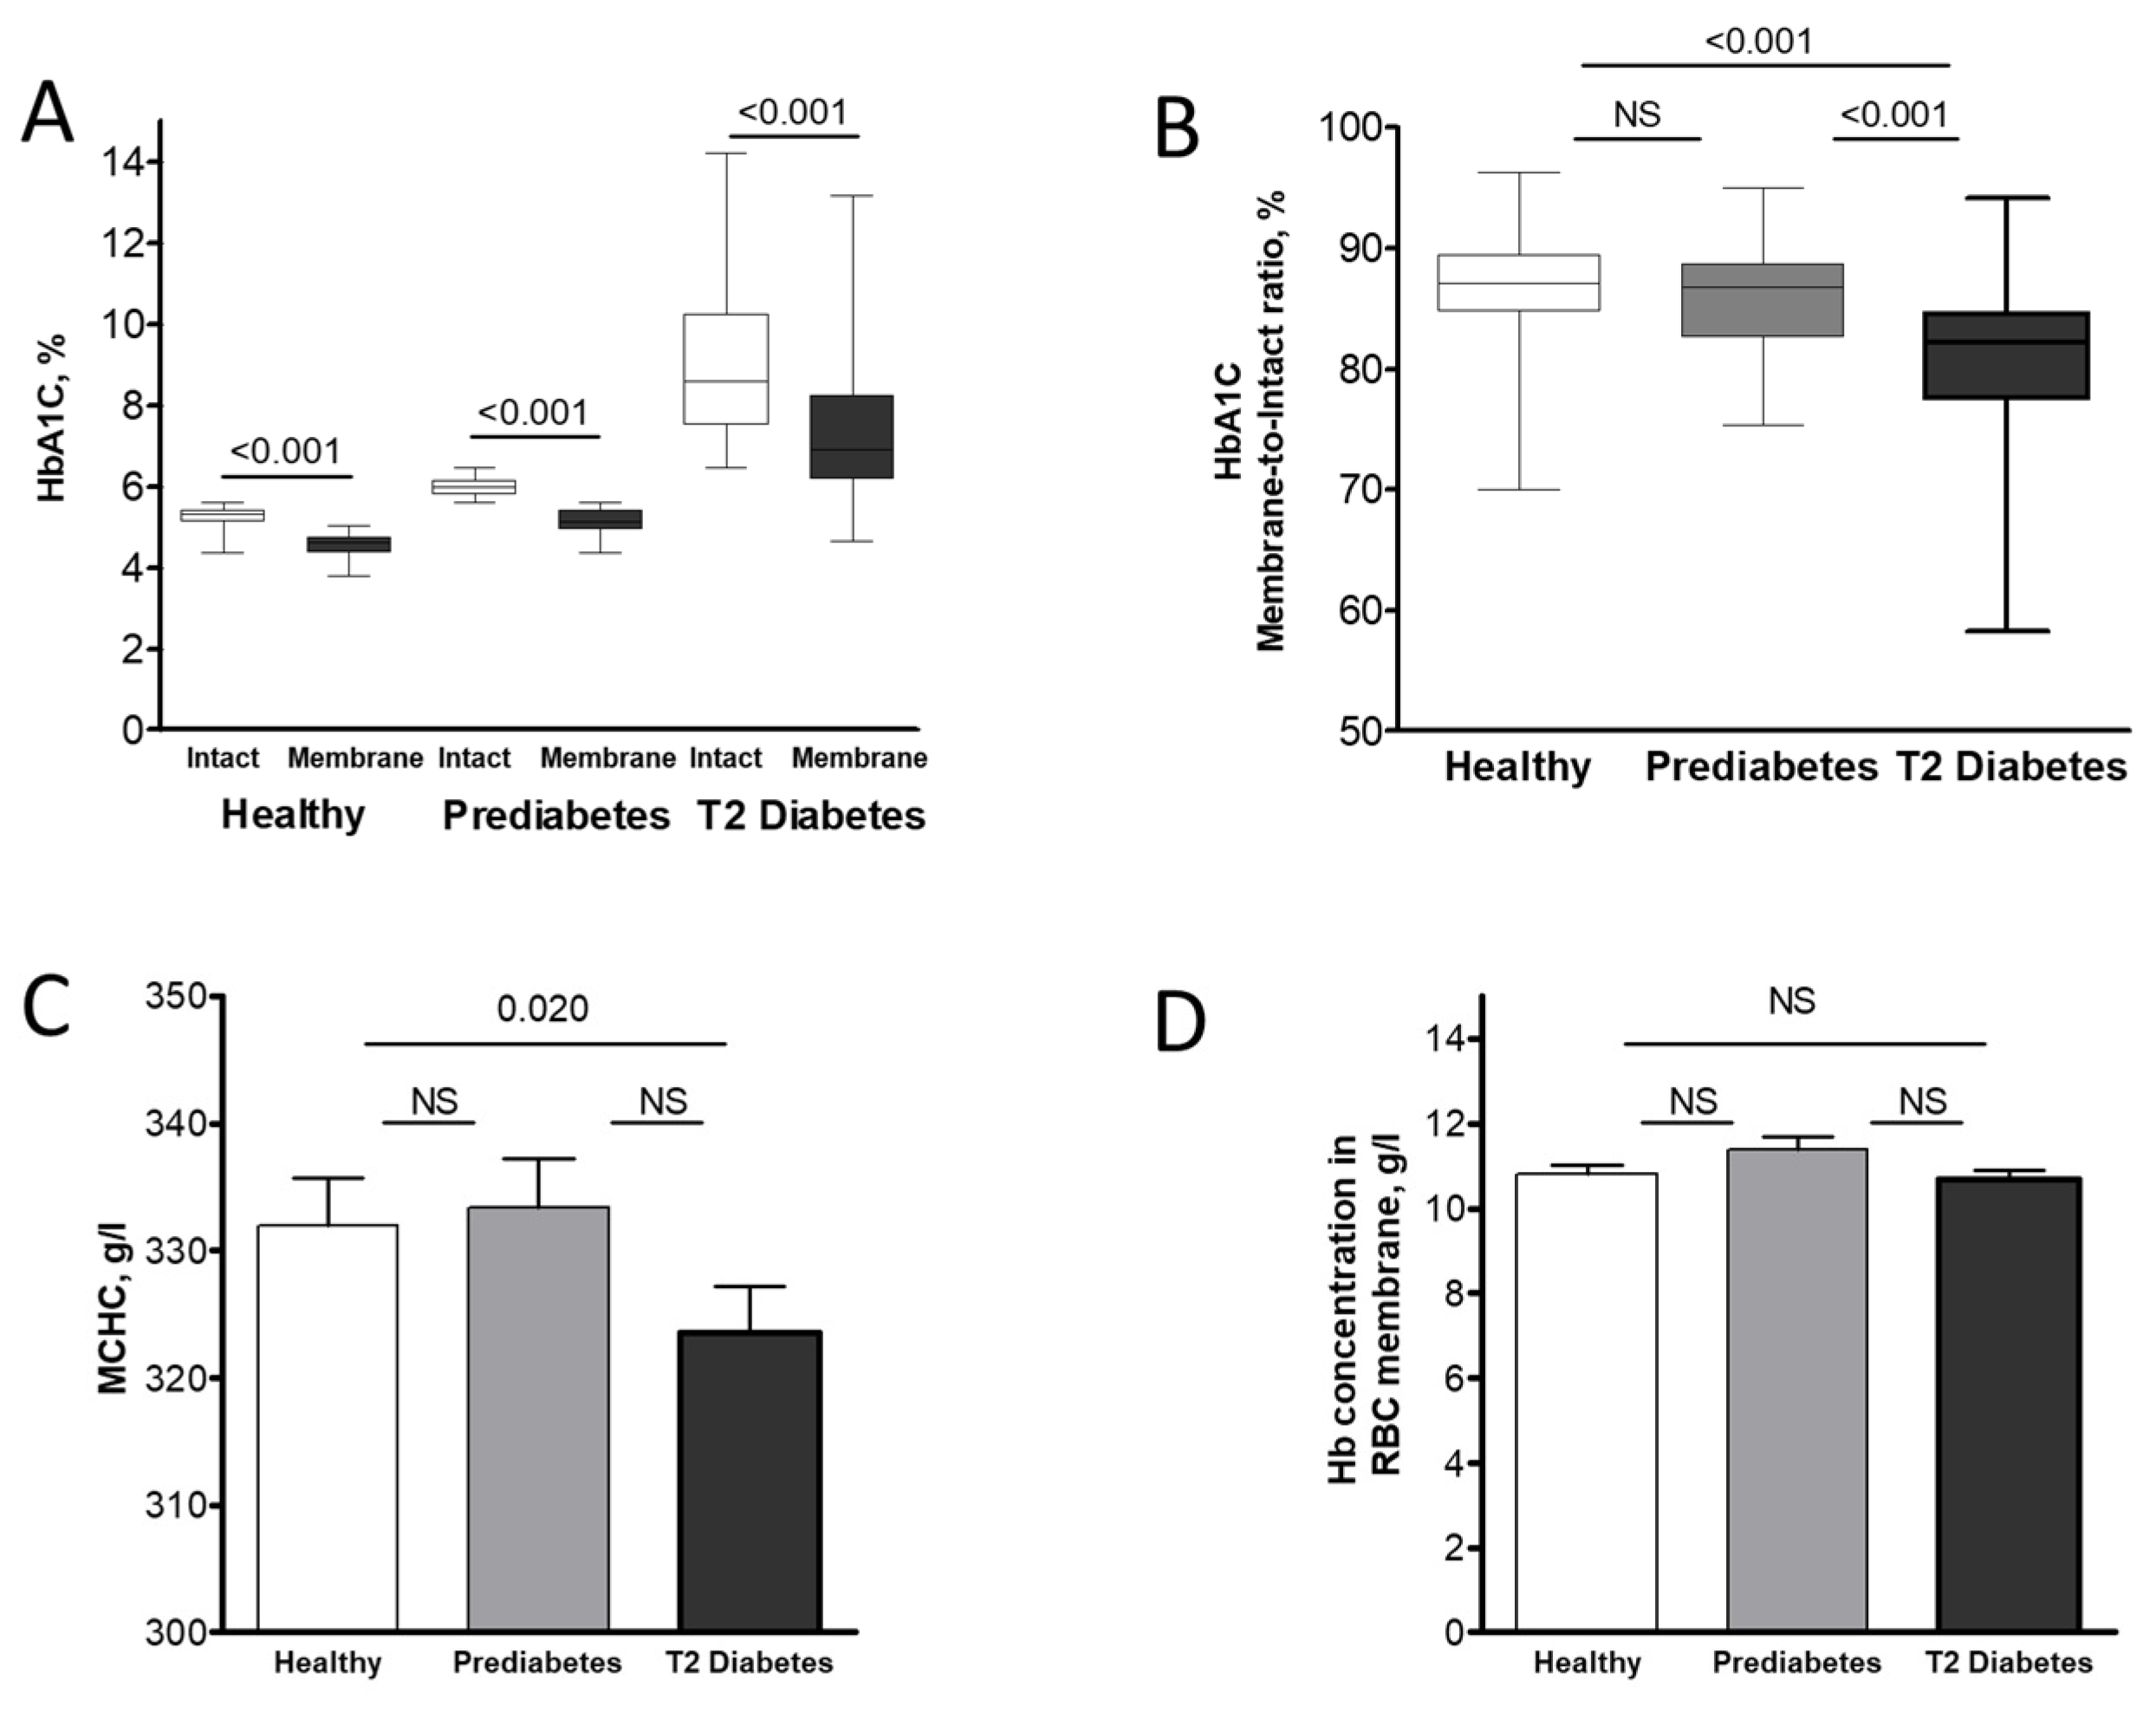
Figure 2.
Changes in HbA1C concentration in intact RBCs and their membrane compartments following a 4-h incubation under hyperglycemic conditions. RBCs from healthy (n = 18), prediabetic (n = 17), and T2 diabetic (n = 17) individuals were incubated in plasma-mimicking buffer (PMB) supplemented with 10 mM glucose. The percentage of HbA1C relative to total Hb was determined in both intact cells and isolated membrane fractions before and after the 4-h incubation period. Statistical significance of changes within each group (baseline vs. 4 h) for RBC membrane data was determined using the Wilcoxon signed-rank test. Significance level: p < 0.05; NS, non-significant.
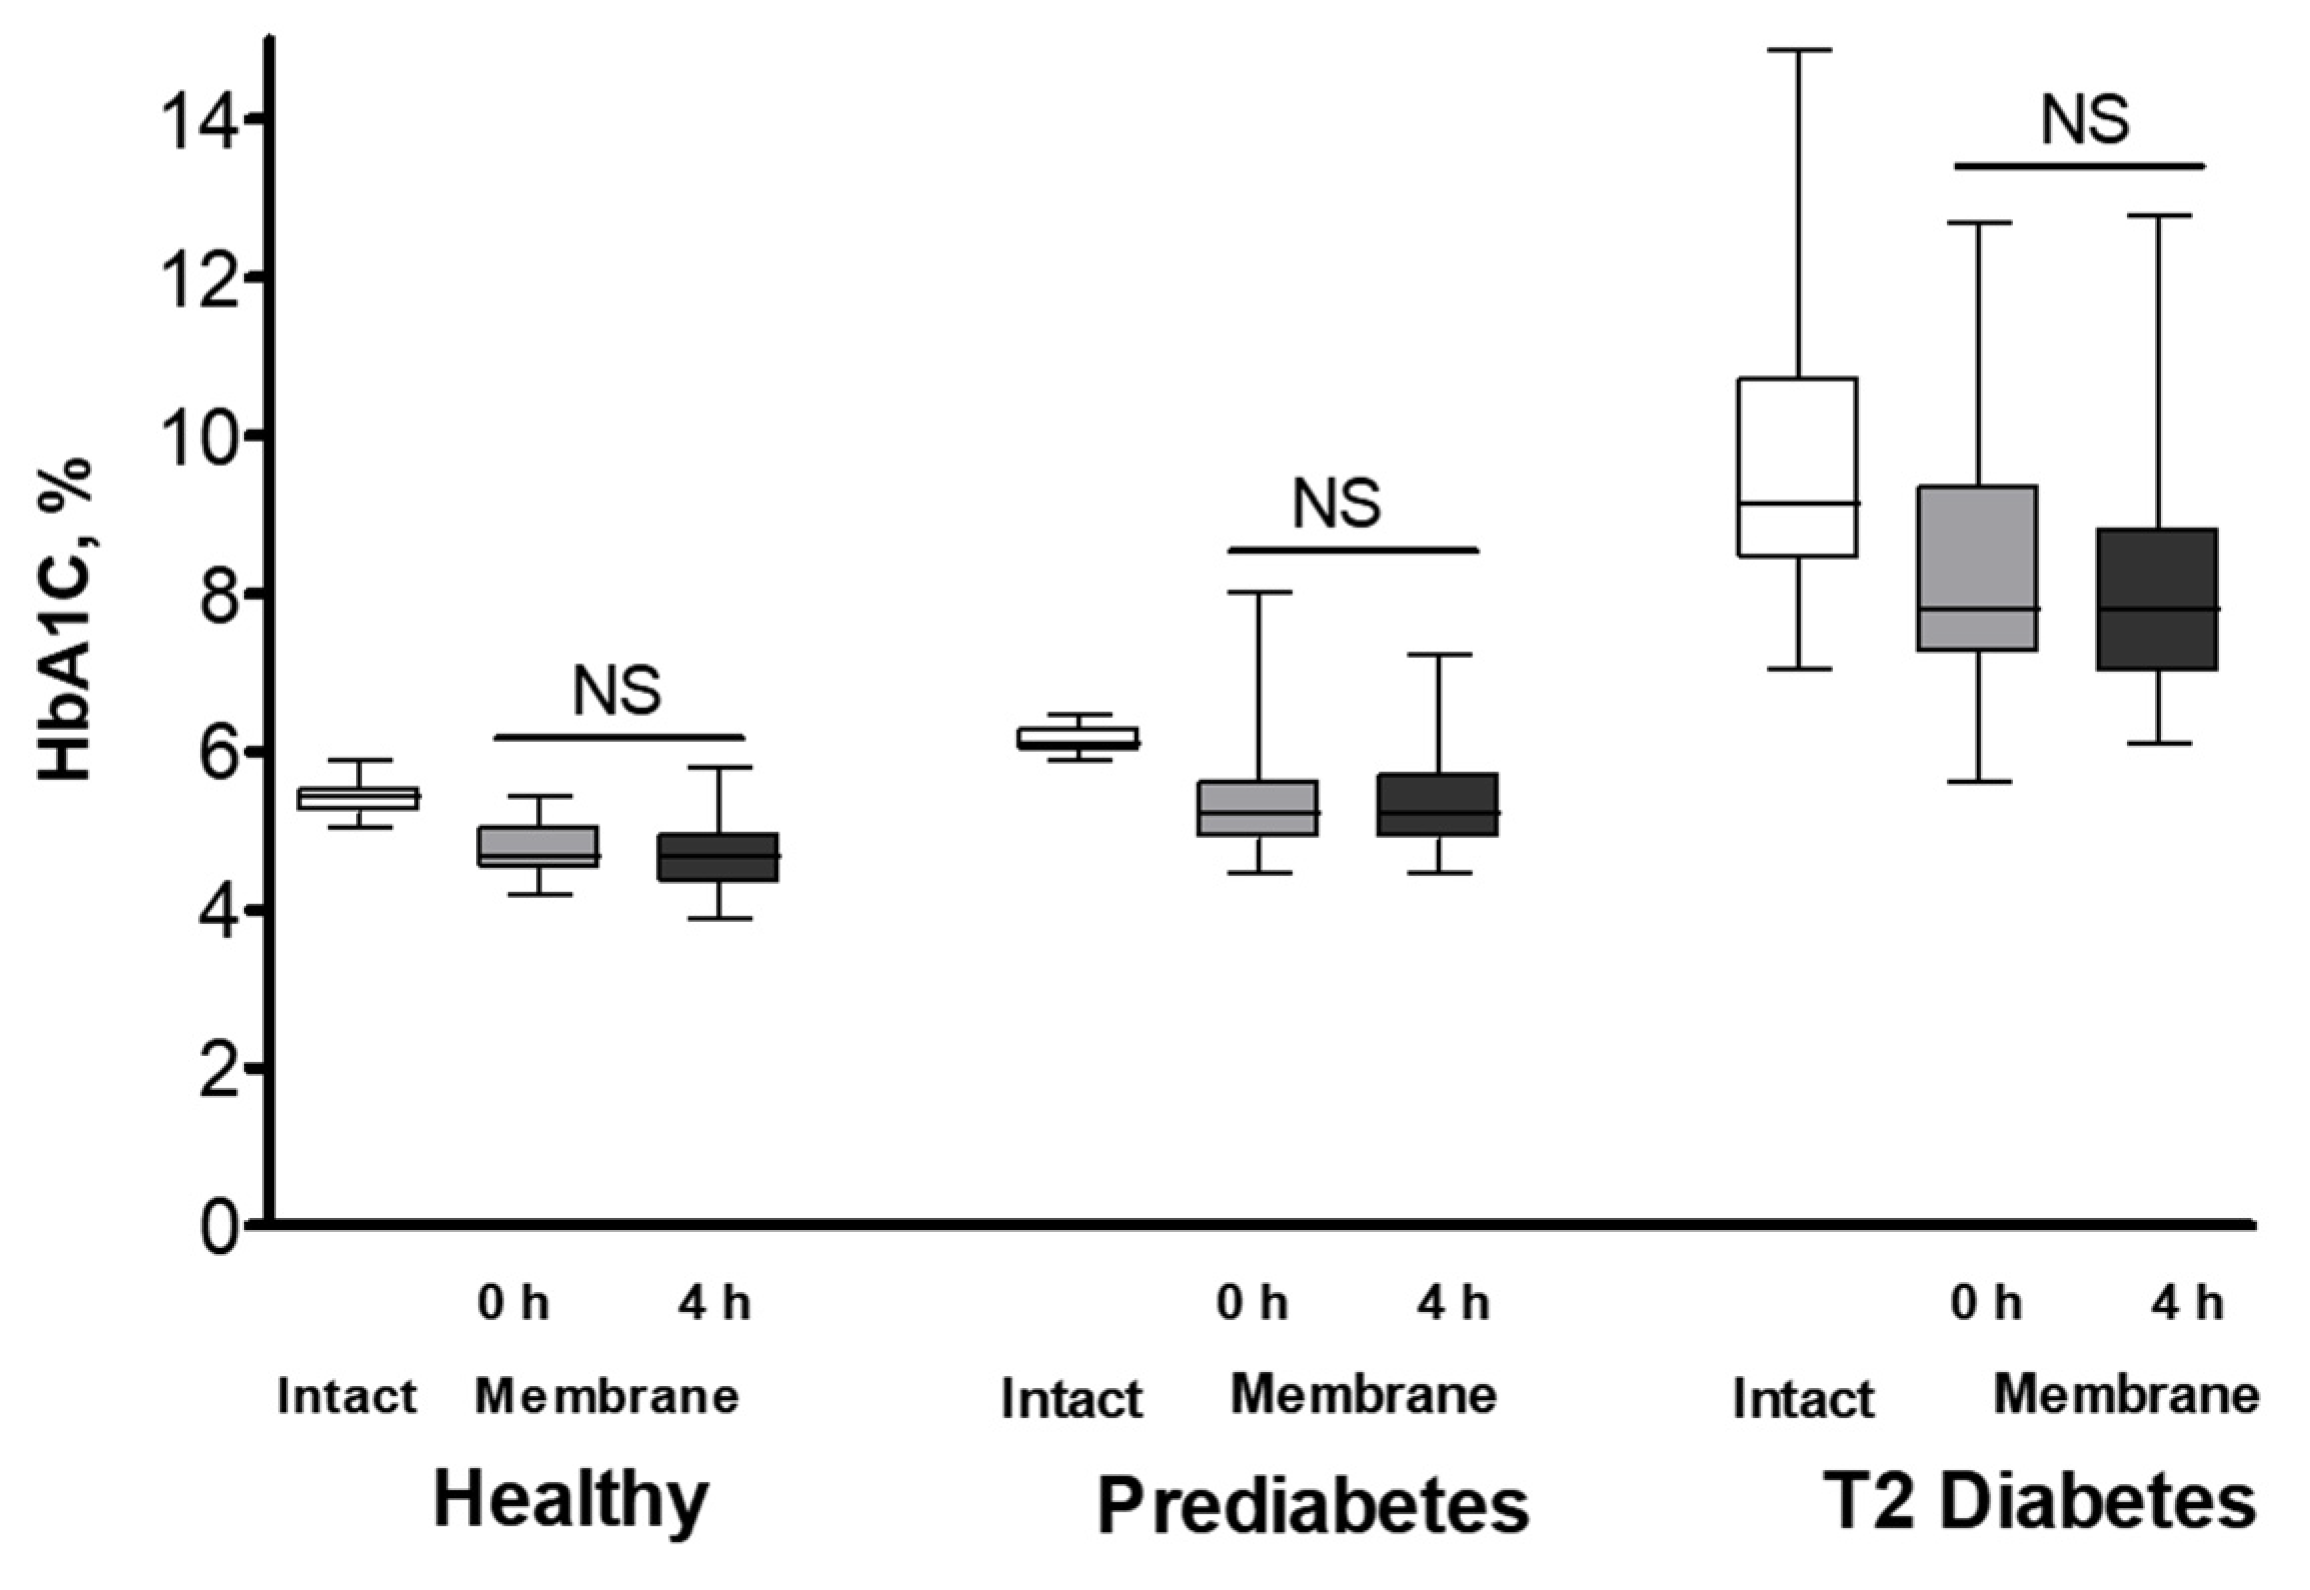
Figure 3.
Effect of EDTA on HbA1C subcellular distribution in healthy (n = 10), prediabetic (n = 9), and T2 diabetic (n = 8) individuals. The percentage of HbA1C relative to total Hb (A) and membrane-to-intact HbA1C ratios (B) in RBCs, which were collected in parallel into K3EDTA- or heparin-supplemented tubes, are displayed. RBCs were isolated and measured as described in Material and Method section. Significance was determined by comparing the corresponding RBC membrane datasets within each group using Wilcoxon signed-rank test. Significance level: p < 0.05; NS, non-significant.
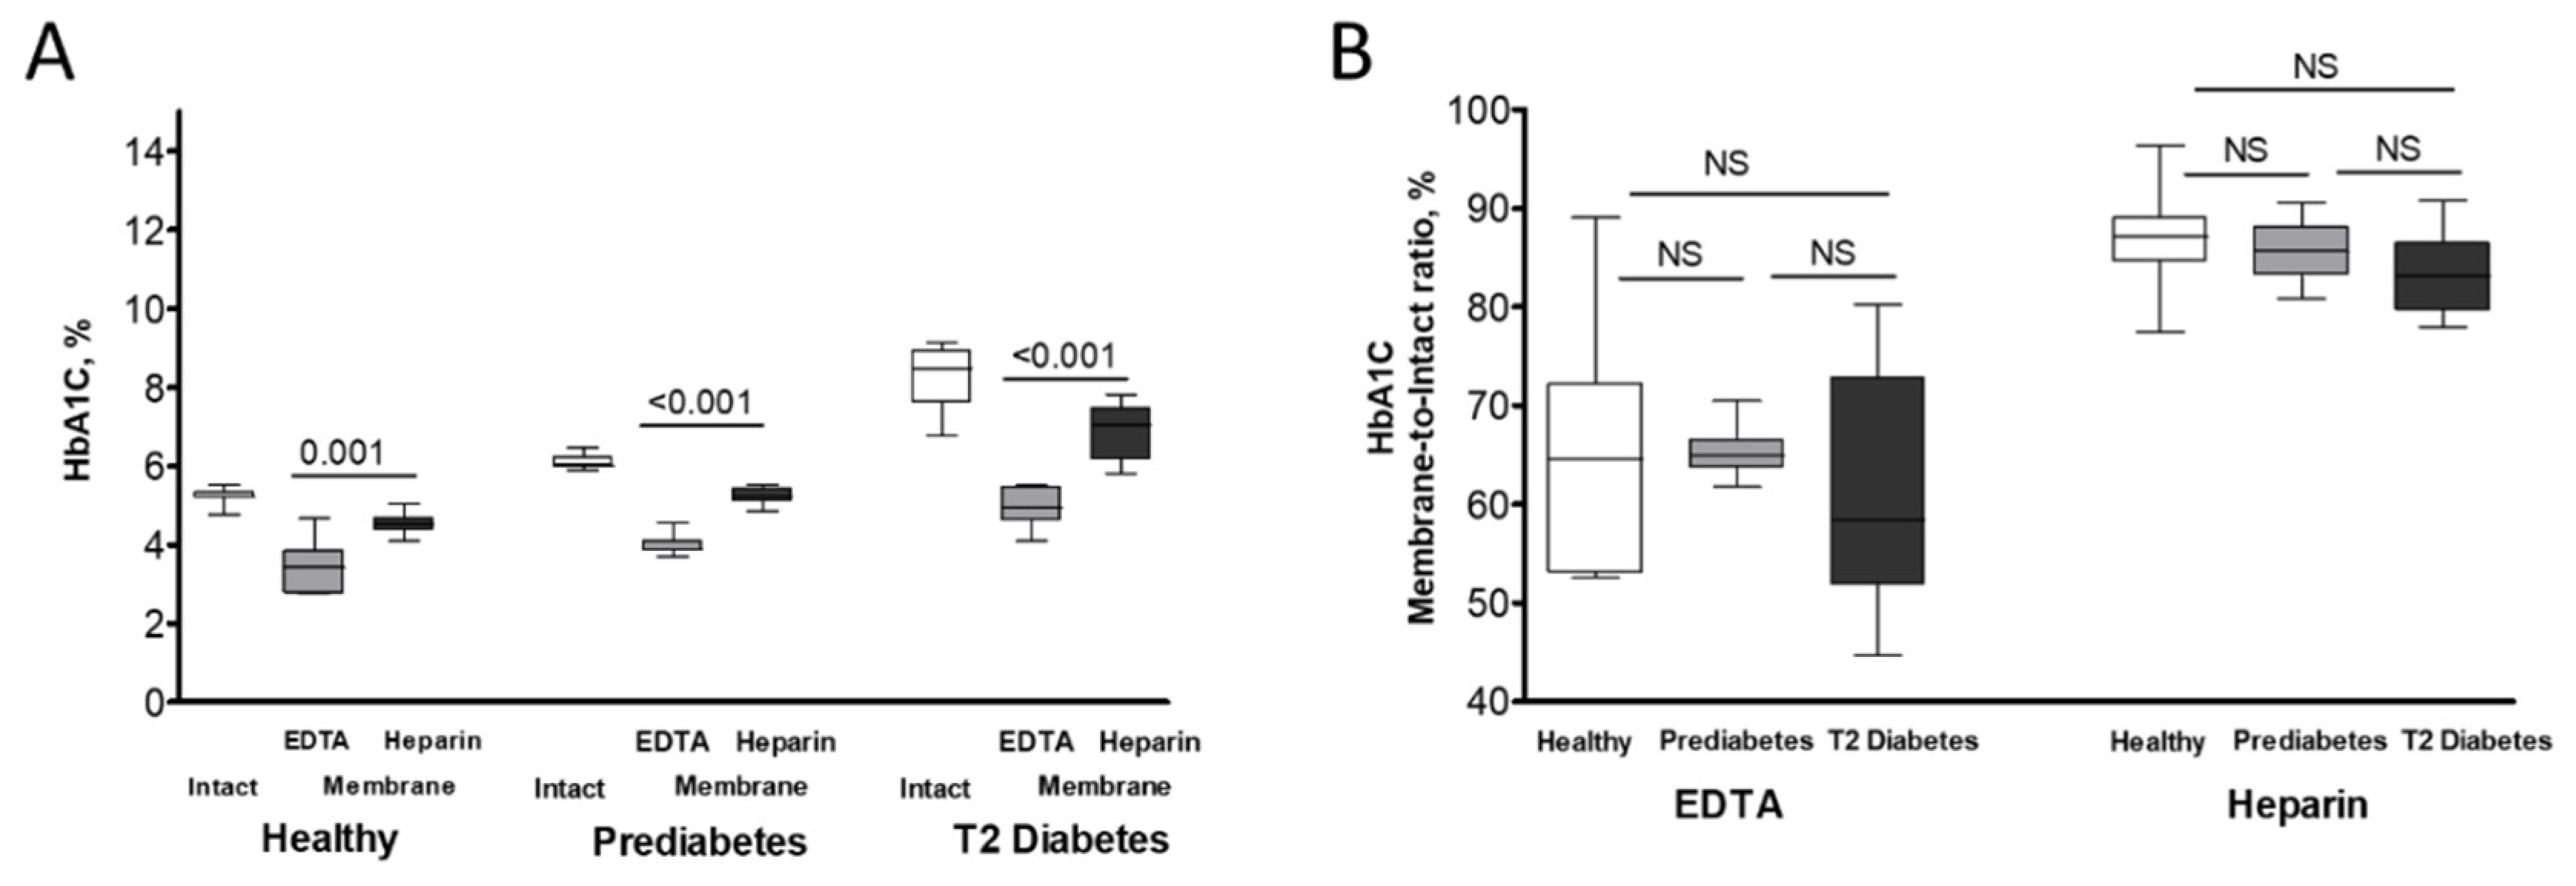
Figure 4.
Proposed mechanisms of reciprocal influence between HbA1C and HbA2 isoforms on their intracellular levels and localization.
Figure 4.
Proposed mechanisms of reciprocal influence between HbA1C and HbA2 isoforms on their intracellular levels and localization.
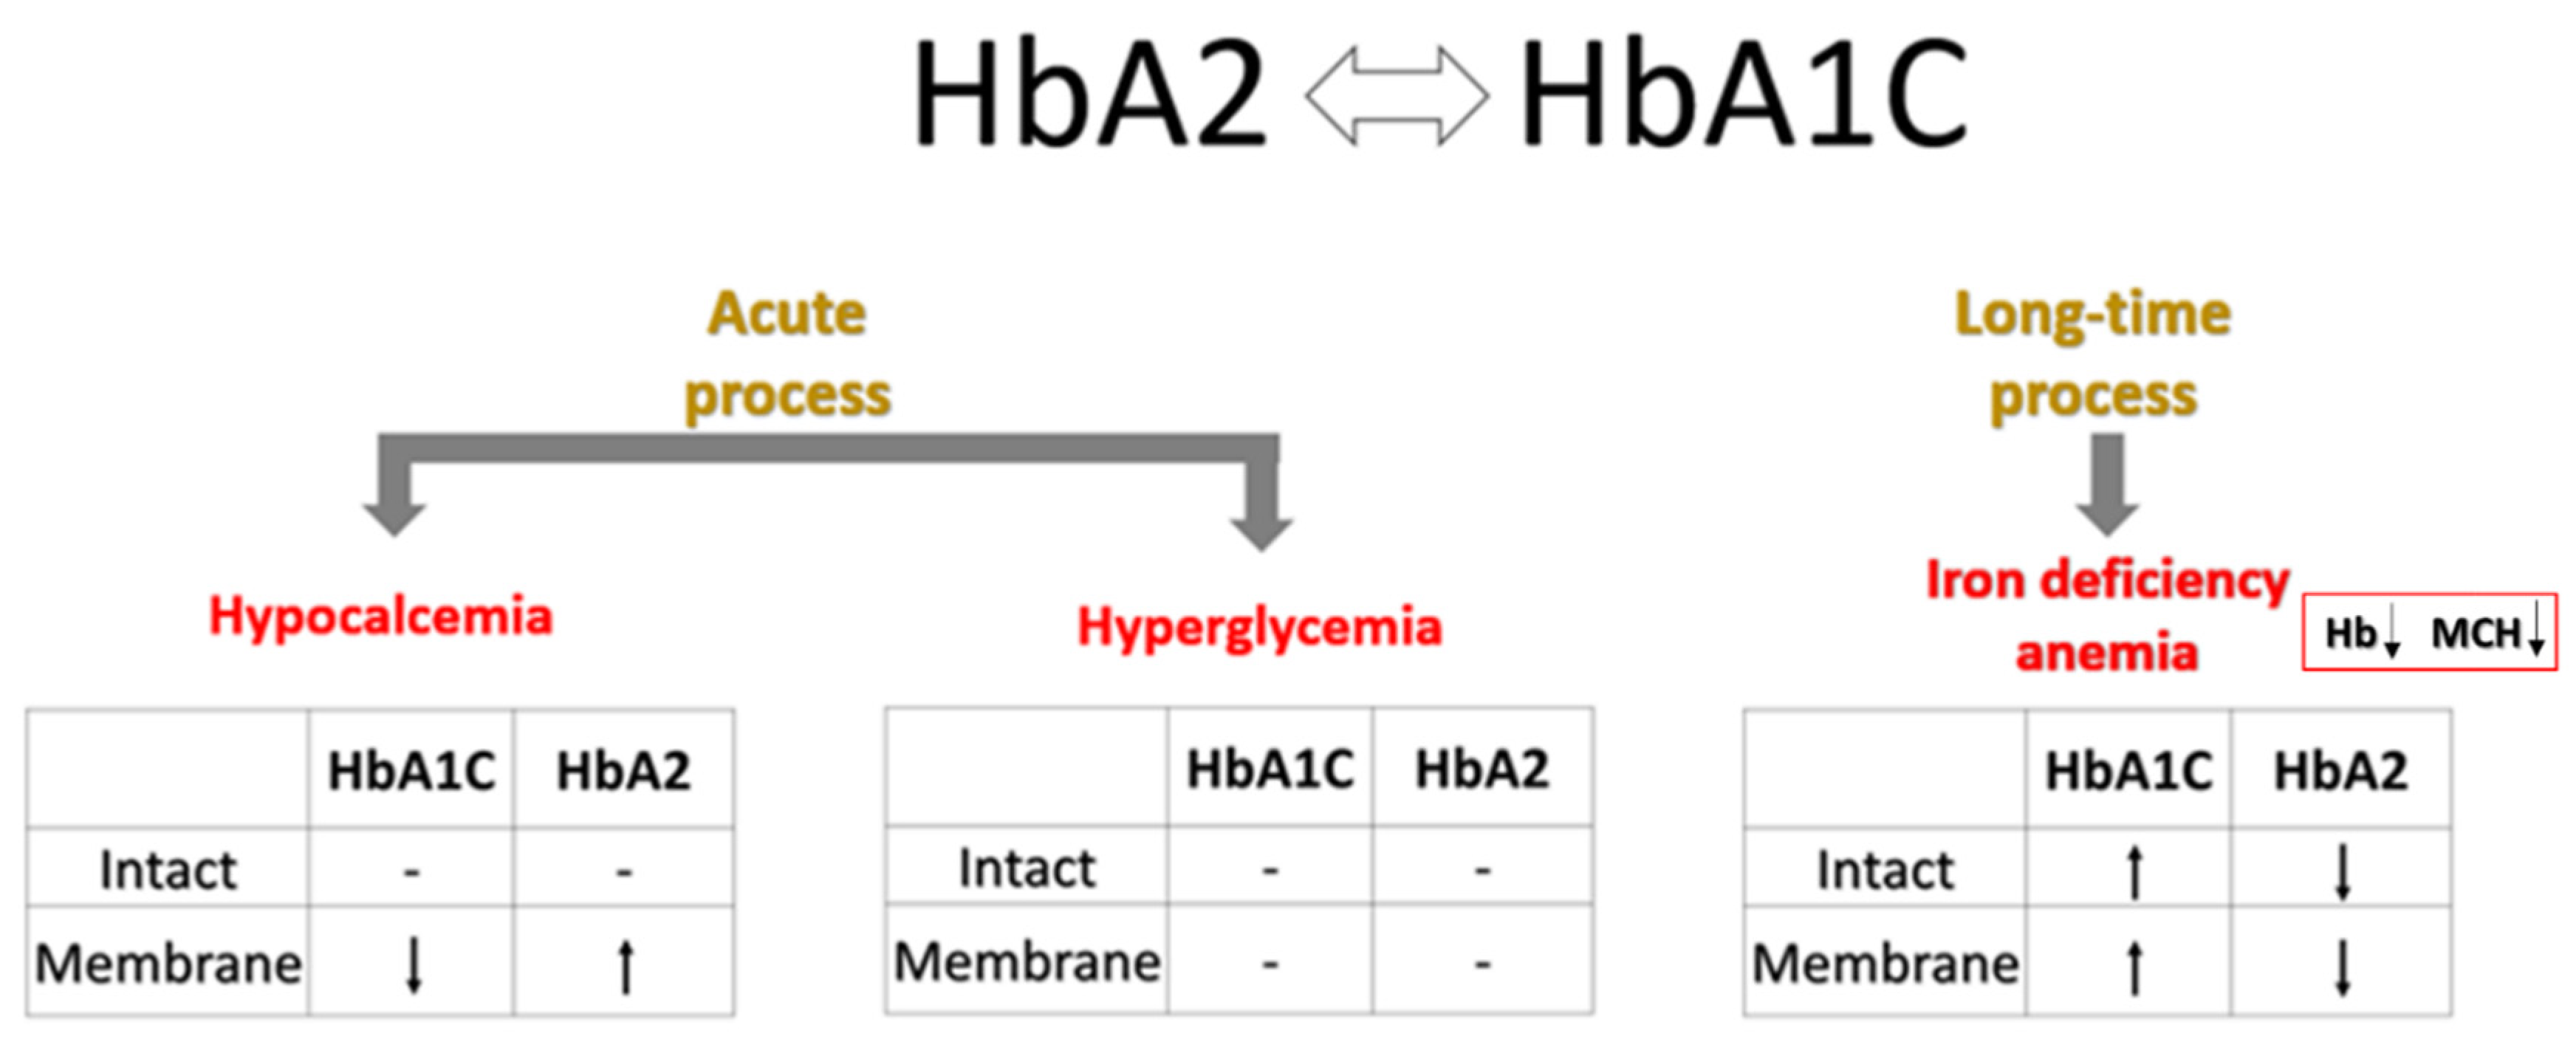
Figure 5.
Correlation between p2, measured by the VARIANT™ II TURBO Hemoglobin Testing System, and the routine clinical index HbA1C, measured by the D-100 Hemoglobin Testing System.
Figure 5.
Correlation between p2, measured by the VARIANT™ II TURBO Hemoglobin Testing System, and the routine clinical index HbA1C, measured by the D-100 Hemoglobin Testing System.
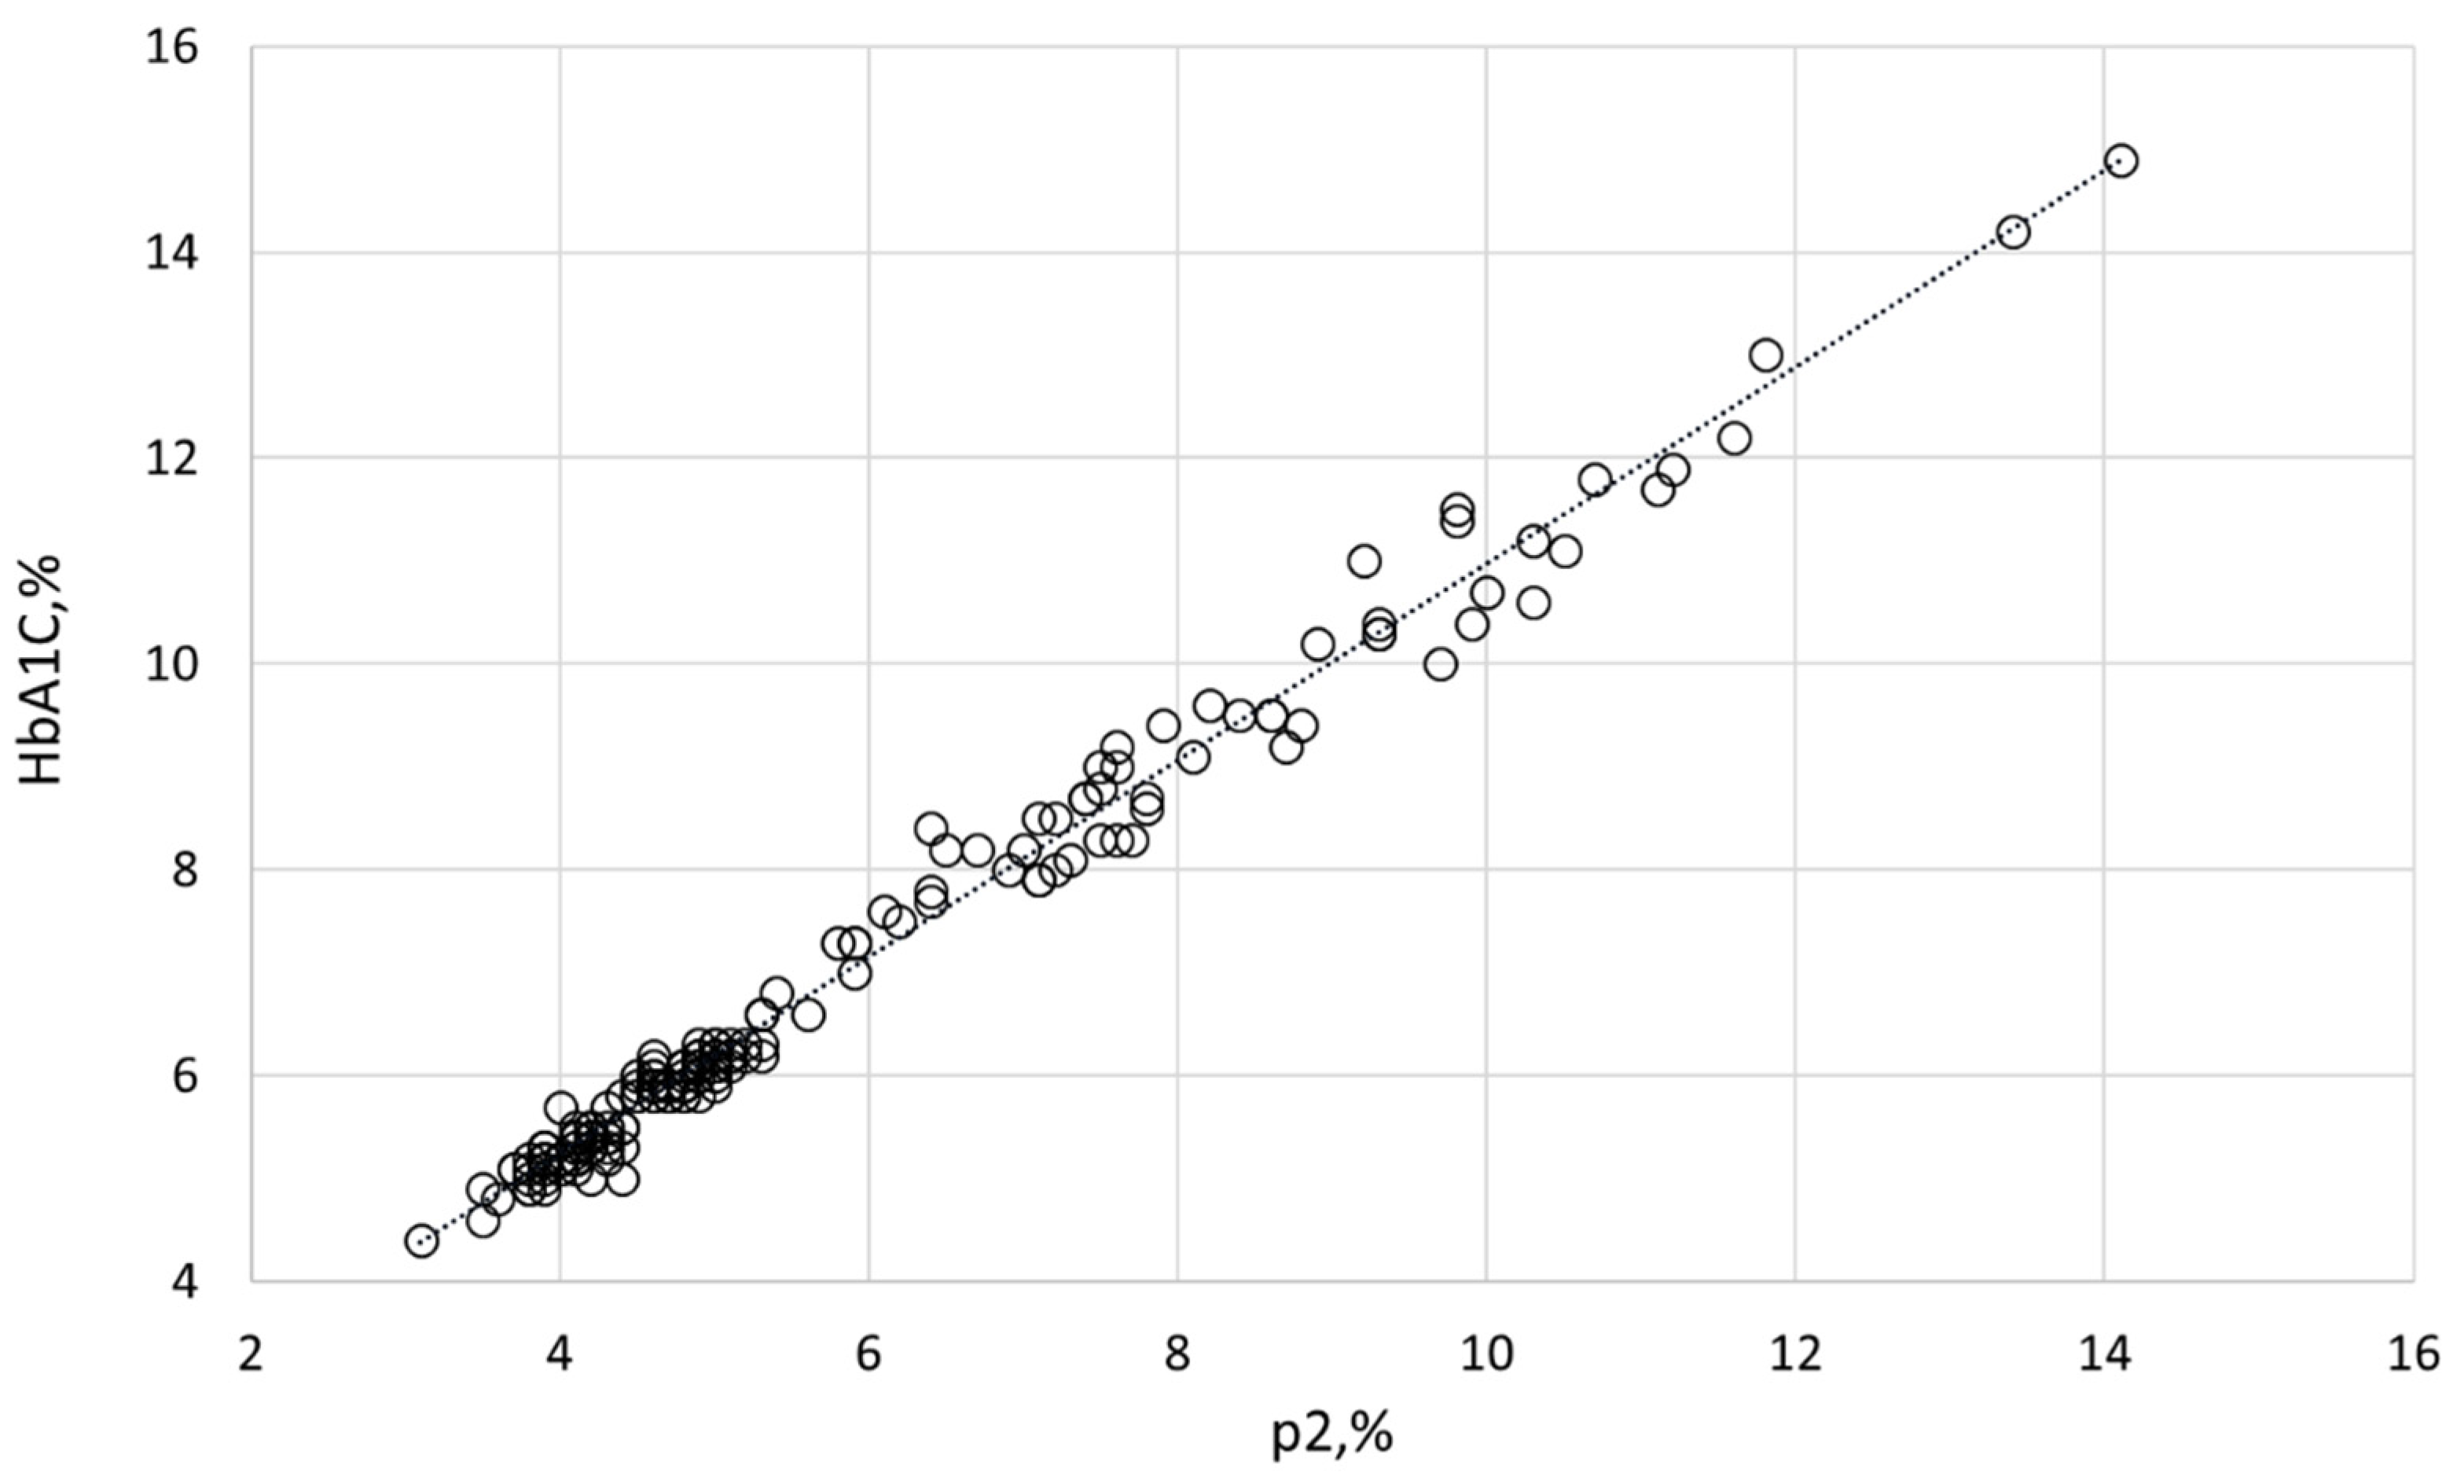

Table 1.
Red blood cell (RBC) properties and distribution of hemoglobin (Hb) isoforms in the participants. Abbreviations: M, male, F, female; RBC, red blood cell count; HCT, hematocrit; MCV, mean corpuscular volume; MCH, mean corpuscular hemoglobin; MCHC, mean corpuscular hemoglobin concentration; RDW, RBC distribution width. RBC indices were measured by Advia2120 analyzer (Siemens, Germany). Hb variants (HbF, HbA2, HbA0, and p2) were analyzed using the VARIANT™ II TURBO Hemoglobin Testing System. HbA1C was measured with the D-100 Hemoglobin Testing System. The percentage of each Hb isoform out of the total Hb is shown. Data are presented as means ± SD. Statistical significance was determined using paired Student’s t-test compared to the healthy group for prediabetic individuals and compared to healthy/prediabetic groups for type 2 (T2) diabetic individuals. Significance level: p < 0.05; NS, non-significant.
| Reference Ranges | Healthy | Prediabetes | Type 2 (T2) Diabetes | |
| n | 56 | 53 | 56 | |
| Age (years) | 58.3±14.0 | 65.3±11.3 | 62.6±14.3 | |
| M/F | 24/32 | 29/24 | 30/26 | |
| HbA1C (%) | <5.7 | 5.24±0.26 | 6.01±0.16 | 8.88±1.67 |
| RBC (106/µL) |
Female: 4.0-5.0 Male: 4.5-5.5 |
4.71±0.55 | 4.77±0.51NS | 5.03±0.630.005/0.021 |
| HCT (%) |
Female: 37.0-47.0 Male: 40.0-54.0 |
41.1±4.6 | 41.8±3.8 NS | 42.6±4.9NS/NS |
| Hb (g/dL) |
Female: 12.0-15.0 Male: 14.0-17.0 |
13.6±1.6 | 13.8±1.2 NS | 13.9±1.8 NS/NS |
| MCV (fL) |
Female: 80.0-94.0 Male: 80.0-95.0 |
87.1±8.2 | 88.2±5.8 NS | 84.8±6.6 NS/0.007 |
| MCH (pg) | 27.0-31.0 | 29.0±2.9 | 29.1±2.0 NS | 27.7±2.4 0.008/0.002 |
| MCHC (g/dL) | 32.0-35.0 | 33.1±1.3 | 33.0±1.2 NS | 32.5±1.4 0.020/NS |
| RDW (%) | 11.5-14.5 | 13.9±1.7 | 13.9±0.9 NS | 14.3±1.4 NS/0.046 |
| HbF (%) | 0.5-1.3 | 0.41±0.34 | 0.33±0.13 NS | 0.40±0.26 NS/NS |
| HbA2 (%) | 1.5-3.6 | 2.83±0.34 | 2.81±0.32 NS | 2.64±0.35 0.005/0.009 |
| HbA0 (%) | >95.9 | 96.8±0.5 | 96.9±0.3 NS | 97.0±0.5 0.027/NS |
| p2 (related to HbA1C) (%) | <4.5 | 4.06±0.26 | 4.79±0.22<0.001 | 7.92±1.87 <0.001/<0.001 |
Table 2.
Compartmentalization of Hb isoforms in healthy, prediabetic, and T2 diabetic individuals. The percentage of each Hb isoform in relation to total Hb is shown. Data are presented as median ± CI. Statistical significance was determined by Wilcoxon signed-rank test compared to the healthy group for prediabetic individuals and compared to healthy/prediabetic groups for T2 diabetic individuals. Significance level: p < 0.05; NS, non-significant.
|
Healthy (n = 56) |
Prediabetes (n = 53) |
T2 Diabetes (n = 56) |
||||
| Intact | Membrane | Intact | Membrane | Intact | Membrane | |
| HbF | 0.30±0.9 | 0.30±0.11 | 0.30±0.04NS | 0.30±0.06NS | 0.30±0.07NS/NS | 0.30±0.08NS/0.043 |
| HbA2 | 2.80±0.09 | 4.50±0.17 | 2.80±0.09NS | 4.30±0.19NS | 2.60±0.090.001/0.003 | 4.20±0.24 NS/NS |
| HbA0 | 96.8±0.1 | 95.2±0.2 | 96.8±0.09NS | 95.4±0.2NS | 97.0±0.10.021/0.049 | 95.2±0.3NS/NS |
| HbA1C | 5.33±0.07 | 4.61±0.08 | 6.00±0.06<0.001 | 5.14±0.08<0.001 | 8.58±0.47<0.001/<0.001 | 6.91±0.43<0.001/<0.001 |
Table 3.
Pearson’s correlation coefficients for HbA1C vs. other Hb isoforms. The significance of the correlations (numerical values in parentheses below the coefficient) was accepted as p ≤ 0.05; NS, non-significant.
Table 3.
Pearson’s correlation coefficients for HbA1C vs. other Hb isoforms. The significance of the correlations (numerical values in parentheses below the coefficient) was accepted as p ≤ 0.05; NS, non-significant.
|
Whole Cohort (n = 165) |
Healthy (n = 56) |
Prediabetes (n = 53) |
T2 Diabetes (n = 56) |
|||||
| Intact | Membrane | Intact | Membrane | Intact | Membrane | Intact | Membrane | |
| HbF | 0.013 (NS) |
-0.018 (NS) |
0.146 (NS) |
-0.011 (NS) |
0.107 (NS) |
-0.013 (NS) |
-0.063 (NS) |
-0.186 (NS) |
| HbA2 |
-0.334 (<0.001) |
-0.318 (<0.001) |
-0.263 (NS) |
-0.525 (<0.001) |
0.176 (NS) |
-0.449 (<0.001) |
-0.391 (0.003) |
-0.630 (<0.001) |
| HbA0 |
+0.259 (<0.001) |
+0.281 (<0.001) |
0.082 (NS) |
+0.415 (0.001) |
-0.213 (NS) |
+0.406 (0.003) |
+0.342 (0.010) |
+0.629 (<0.001) |
Table 4.
Pearson’s correlation coefficients for HbA1C vs. RBC functional markers. The correlations (numerical values in parentheses below the coefficient) were accepted as significant if p ≤ 0.05; NS, non-significant; n is number of independent tests.
Table 4.
Pearson’s correlation coefficients for HbA1C vs. RBC functional markers. The correlations (numerical values in parentheses below the coefficient) were accepted as significant if p ≤ 0.05; NS, non-significant; n is number of independent tests.
| Healthy | Prediabetes | T2 Diabetes | ||||
| Intact HbA1C | Membrane HbA1C | Intact HbA1C | Membrane HbA1C | Intact HbA1C | Membrane HbA1C | |
| K+ loss (mM/h per Hb) | - 0.040 +0.043 (NS) (NS) (n=15) |
+0.010 +0.009 (NS) (NS) (n=14) |
-0.037 +0.166 (NS) (NS) (n=14) |
|||
| Glucose consumption (mg/dL per hour per Hb) | +0.083 -0.193 (NS) (NS) (n=15) |
+0.011 -0.561 (NS) (0.037) (n=14) |
-0.222 -0.206 (NS) (NS) (n=14) |
|||
|
Lactate release (mM/h per Hb) |
-0.515 +0.469 (0.049) (NS) (n=15) |
-0.489 -0.034 (NS) (NS) (n=14) |
+0.318 +0.264 (NS) (NS) (n=14) |
|||
| Intact deprotonated reduced thiol (A.U., normalized) |
+0.629 +0.403 (0.012) (NS) (n=15) |
+0.497 +0.252 (NS) (NS) (n=15) |
-0.144 -0.284 (NS) (NS) (n=17) |
|||
| Median elongation rate | +0.013 +0.175 (NS) (NS) (n=9) |
-0.839 -0.256 (0.005) (NS) (n=9) |
-0.345 -0.222 (NS) (NS) (n=9) |
|||
Disclaimer/Publisher’s Note: The statements, opinions and data contained in all publications are solely those of the individual author(s) and contributor(s) and not of MDPI and/or the editor(s). MDPI and/or the editor(s) disclaim responsibility for any injury to people or property resulting from any ideas, methods, instructions or products referred to in the content. |
© 2025 by the authors. Licensee MDPI, Basel, Switzerland. This article is an open access article distributed under the terms and conditions of the Creative Commons Attribution (CC BY) license (http://creativecommons.org/licenses/by/4.0/).
Copyright: This open access article is published under a Creative Commons CC BY 4.0 license, which permit the free download, distribution, and reuse, provided that the author and preprint are cited in any reuse.


