Submitted:
12 September 2025
Posted:
17 September 2025
You are already at the latest version
Abstract
Urogenital cancers represent one of leading causes of death, and thus novel simple, highly sensitive and reliable methods are required for their revelation at early stages in order to provide effective therapy and improve patients’ survival rate. Here we demonstrate parallel rapid label-free detection of a pool of (urogenital cancer)-associated non-coding RNA molecules of three different types — microRNAs, circular RNAs (circRNAs) and small nucleolar RNAs (snoRNAs) — in human blood with sub-femtomolar concentration sensitivity. This is achieved by employing a biosensor, whose nanotechnology-based sensor chip bears an array of oligonucleotide-sensitised silicon-on-insulator (SOI) nanoribbons fabricated using a ‘top-down’ technology. The simultaneous detection of different types of cancer-associated ncRNAs in one sample will increase the reliability of the diagnostic results, helping to avoid both false-positives and false-negatives. Owing to the high detection sensitivity, which reaches several thousands of target ncRNA molecules in 1 mL of the analysed sample, the nanoribbon biosensor proposed herein represents a promising tool for early revelation of urogenital cancers in humans.
Keywords:
urogenital cancer
; nanoribbon
; biosensor
; non-coding RNA
; biomarker detection
; silicon nanowire
1. Introduction
Urogenital cancers are widely spread across the globe, being responsible for every fifth cause of cancer [1] and every seventh death of cancer [2]. Namely, the prostate cancer (PrC) is the fifth leading cause of death worldwide [3]. Furthermore, ovarian cancer (OvC) is the fifth leading cause of death of cancer among women [4]. Kidney (KiC) and bladder (BlC) cancers also occur quite often, amounting to 2 and 3% of all cancers registered worldwide, respectively [5] — while urethral cancer is relatively rare [6]. Urogenital cancers can be quite effectively cured at early stages, and their early diagnosis improves treatment outcomes and survival rate [7]. Unfortunately, the existing methods, which are employed in clinical practice for the diagnosis of urogenital cancers, do not allow their early revelation due to either poor sensitivity [8] or use of insufficiently specific markers (such as prostate specific antigen (PSA) in case with PrC [9,10] or carbohydrate antigen 125 (CA 125) in case with OvC [11]). Namely, cystoscopy [12,13] and biopsy are invasive and painful procedures, which potentially can cause complications [14]. Furthermore, in case of using tumour visualisation using ultrasound, magnetic resonance imaging and/or computer tomography one may lose sight of very small tumours and have troubles with correct interpretation of the results [15]. In this respect, non-invasive methods based on the so-called “liquid biopsy” are quite convenient [16], and so the task consists in the development of methods, which provide the detection of sufficiently specific biomarkers of urogenital cancers with high sensitivity.
The problem consists in proper selection of sufficiently specific biomarkers in order to reliably reveal urogenital cancers in humans at the early stages [9,10]. In this respect, various types of non-coding ribonucleic acids (ncRNAs) such as microRNAs [17,18], circular RNAs (circRNAs) [19] and small nucleolar RNAs (snoRNAs) [20,21,22] were reported to be promising cancer-specific biomarkers. At that, it should be emphasized that polymerase chain reaction (PCR)-based methods of RNA detection (such as northern blotting, next generation sequencing and in situ hybridisation) are very sensitive to contamination [23,24,25], which can cause RNA degradation [26] — in contrast to amplification-free nanoribbon-based detection. In contrast, nanotechnology-based approaches imply direct amplification-free and label-free detection of the target ncRNAs. These approaches to studying biological macromolecular compounds such as proteins and nucleic acids have allowed the scientists to detect and visualise single biomarker macromolecules, performing their in-deep studies [27,28]. The great potential of diagnostic use of nanotechnology-based biosensors with nanowires and nanoribbons as sensing elements was shown in 2000s [29], and one of the first reports on the use of nanowire-based biosensor, for direct label-free biomarker detection in blood samples was in 2009 [30]. The very high surface-to-volume ratio of nanowires and nanoribbons, achieved owing to their low thickness, provides their extremely high charge sensitivity, which can reach the value of several charged molecules per one nanoribbon [31]. This is why nanoribbon and nanowire biosensors allow one to directly detect proteins [32] and nucleic acids [33,34] at subfemtomolar concentrations, and single viral particles [35].
Herein, we propose the use of nanoribbon biosensor with the sensor chip bearing an array of twelve oligonucleotide-sensitised silicon nanoribbons for non-invasive, highly sensitive and amplification-free parallel detection of three different types of (urogenital cancer)-associated ncRNAs in human blood. Such an approach provides early diagnosis of urogenital cancer with increased (as compared to the analysis of only one ncRNA type) diagnosis reliability. The use of sensor chips bearing a large array of multiple nanoribbons/nanowires on a single chip provides parallel detection of multiple biomarkers [35], and this is what we have realised in our work reported. For fabrication of SOI nanoribbons, we have employed a complementary metal oxide semiconductor (CMOS)-compatible ‘top-down’ technology, whose advantages were justified by M. Reed et al. [29]. The application of CMOS-compatible “top-down” technology for fabrication of nanoribbon sensor chips allows to avoid typical problems of “bottom-up” approach [36].
2. Results
The optical image of the entire nanoribbon chip (bearing an array of twelve individual 3-µm-wide nanoribbons) is shown in Figure 1a), and Figure 1b,c display optical and scanning electron microscopy (SEM) images of an individual nanoribbon.
The very high surface-to-volume ratio (Figure 1d) of nanowires and nanoribbons, achieved owing to their low thickness, provides their extremely high charge sensitivity, which can reach the value of several charged molecules per one nanoribbon [31]. The latter circumstance favours the use of nanoribbon biosensors for highly sensitive detection of nucleic acid markers (which bear strong negative charge), explaining very low (down to ~10-17 M = 10 aM) limit of ncRNA detection observed in our experiments. The surface of the nanoribbons has been coated with an amine-terminated silane layer and sensitised with DNA oligonucleotide probes (oDNAs) complementary to the target ncRNAs to be detected (Figure 1e). The latter procedure has allowed us to selectively capture the target ncRNA molecules onto the nanoribbons’ surface. The sensitisation efficiency has been confirmed by a characteristic right-shift of drain-source current vs. gate voltage (Ids(Vg); current-voltage charateristics, CVC) curves towards higher Vg values, which indicates successful immobilisation of oDNAs onto the nanoribbon surface (Figure 1e). Each nanoribbon has been sensitised individually, thus allowing us to simultaneously determine the presence of three different types of ncRNAs — namely, miRNAs, circRNAs and snoRNAs — in one and the same sample by recording time dependencies of the biosensor response signal (drain-source current flowing through respective functionalised nanoribbons of the chip). This approach, if introduced into clinical practice, will increase the reliability of cancer diagnosis results, since simultaneous analysis of several different types of ncRNA markers of a particular cancer helps to avoid both false-positives and false-negatives.
The operation of oDNA-functionalised nanoribbons in solutions containing known concentrations of DNA-analogues of the target ncRNAs has indicated high sensitivity of (nanoribbon biosensor)-based detection of ncRNA biomarkers of urogenital cancers; Figure 2 displays typical time dependencies of the biosensor response obtained in this way.
The target cancer-specific ncRNAs have been selected based on literature sources reporting that the change in blood level of certain miRNAs [37,38,39,40], circRNAs [41,42,43,44] and snoRNAs [22,45,46] is associated with the development of urogenital cancers (Table 1).
In the experiments on the determination of the lowest detectable concentration of the target ncRNAs, we have used purified buffered solutions containing known concentrations of their respective oDNA analogues (see Methods and Table 2 therein).
The resulting time dependencies of the biosensor response indicate that the biosensor response was still registerable at oDNA concentrations of 10 aM, while at lower (1 aM) concentration it was indistinguishable from the noise level observer with pure (nucleic acid)-free buffer (Figure 2). Accordingly, the lower concentration limit of detection of target nucleic acids with the nanoribbon biosensor was determined to be 10 aM.
After the assessment of biosensor operation at known concentrations of target nucleic acids and the determination of the lower limit of detection, we switched to analysis of target ncRNAs in blood plasma of patients suffering from urogenital cancers. With this purpose, target ncRNAs have been determined in samples of total RNA isolated from patients’ plasma (Figure 3).
Typical ΔIds(t) curves obtained upon the analysis of total RNA samples isolated from urogenital cancer patients (with I and II stages of the diseases) indicate markedly high biosensor response after the addition of the analysed samples (Figure 3, red curves). In contrast, with samples obtained from patients with non-oncological diseases there was either virtually no response from the biosensor, or its magnitude was low (Figure 3, blue curves). We emphasise that this consentient behaviour of the signal from the nanoribbons sensitised with oDNAs against three different types of target ncRNAs (microRNAs, circRNAs, and snoRNAs) has been observed in each sample analysed. This fact clearly demonstrates how the simultaneous determination of different ncRNA types improves reliability of urogenital cancer diagnosis.
3. Discussion and Conclusions
Herein, we propose the non-invasive and highly sensitive approach to the early diagnosis of urogenital cancer, and parallel analysis of three different ncRNA types increases the diagnosis reliability. This is in contrast to the methods commonly employed in clinical practice. Namely, cystoscopy and biopsy require invasive and painful procedures, which potentially can cause complications [46]. Visualisation using ultrasound [47], magnetic resonance imaging [48] and/or computer tomography [15] have certain limitations on the tumour size (one may lose sight of very small tumours), and the interpretation of the results [15] (that is, it can be difficult to distinguish between benign and malignant tumours). Liquid biopsy with further analysis of cancer biomarkers in blood helps to avoid invasive procedures [16]. And this is where nanoribbon-based approach is of use [30], since its high sensitivity meets the requirements for the methods of early diagnosis of cancer [8].
In this regard, one just needs careful selection of cancer biomarkers suitable for reliable diagnosis. The example of insufficiently specific biomarker is prostate specific antigen (PSA), whose use can lead to false-positives [9,10] and, consequently, to hyperdiagnosis of PrC. Other example is the use of carbohydrate antigen-125 (CA 125) in OvC, whose level can be elevated in endometriosis, during menstruation or in menopause [17]. Various ncRNA types represent good alternative to insufficiently specific protein biomarkers of urogenital cancers. Of those, microRNAs are short (typically 21 to 25 nt [49]) molecules, which are stable against degradation in blood (and also in urine) [50]. Inhibition or overexpression of certain microRNAs was reported to be associated with the development of cancers, including urogenital ones [17,18,50]. Another type of ncRNAs, circRNAs, represent single-stranded non-coding molecules with a covalently closed loop structure devoid of both the 5’cap and the 3’ poly-A sequence [51]; these structural features provide stability of circRNAs. Certain circRNAs are involved in the development of urogenital cancers [37,38]. Furthermore, to date, the third type of ncRNAs considered in our study — snoRNAs — attract growing attention as promising cancer biomarkers [52]. These relatively short (60 to 300 nt) RNA molecules are present in stable state in blood and in other fluids of the body [53], and certain snoRNAs were reported to be associated with urogenital cancers [21,22,37,38,39,40,41,42,43,44,45].
At that, polymerase chain reaction (PCR)-based methods of RNA analysis (such as northern blotting, next generation sequencing and in situ hybridisation) are quite sensitive to contamination and require long multistep procedures, thus complicating the analysis, limiting the reliability of its results and impairing its cost-effectiveness [23,24]. In contrast, nanotechnology-based approach employed in our study implies direct amplification-free and label-free detection of the target ncRNAs. Since nanoribbon biosensor proposed has been demonstrated to provide simultaneous real-time label-free detection of three different cancer-associated ncRNAs, it represents a very attractive tool for revelation of various urogenital cancers in humans at early stages (I and II). The simultaneous detection of three different types of cancer-associated ncRNAs in one sample helps to avoid false results, thus preventing overdiagnosis, providing timely revelation of cancer and increasing the treatment effectiveness. Furthermore, immobilisation of oDNA probes against ncRNA markers of several different cancer types and use of high-throughput electronic circuits for simultaneous acquisition of signal from numerous sensor chips will further expand the capabilities of the approach proposed, making it suitable for cancer screening of humans. This is a considerable societal impact of nanotechnology, since nanoribbon-based approach to cancer diagnosis can make a significant contribution to improving the quality of human life.
4. Materials and Methods
The silicon nanoribbons were arranged in pairs on the surface of a sensor chip (Figure 1). The nanoribbons were fabricated using a ‘top-down’ CMOS-compatible technology [33,34]. The process of sensor chip fabrication comprised the following steps. At the first step, a 500 to 600-nm-thick “silicon-on-insulator” structure was fabricated by hydrogen delamination. The second step was the reduction of the SOI layer to the nanoscale by a serial cycle of thermal oxidation followed by oxide removal in HF solution. At the third step, lateral structuring of SOI layers was performed by optical and electron beam lithography in order to form nanowire structures and Ohmic contacts on the SOI layer. At the fourth step, the SOI layers were structured laterally by electron beam lithography and gas–chemical plasma etching. The final steps included metal sputtering, contact wiring, and chip packaging [33,34]. The nanoribbons’ thickness, width and length were 32 nm, 3 µm and 10 µm, respectively.
Biospecific capturing of target ncRNA molecules on the surface of the nanoribbons was achieved by covalent immobilisation of oDNA probe molecules (whose nucleotide sequences were complementary to those of the target ncRNAs; see Table 2) on the nanoribbon surface coated with amino silane layer.
The silanisation was performed in order to form a monolayer of silane with terminal primary amine groups on the surface of the nanoribbons. The silane monolayer was formed by vapour-phase silanisation with 3-aminopropyltriethoxysilane (APTES) of the sensor chip according to the technique reported by Yamada et al. [54] The oDNA probes were further immobilised onto the silanised nanoribbons’ surface, which was activated with a bifunctional 3,3′-dithiobis (sulfosuccinimidyl propionate) (DTSSP) cross-linker [33,34]. The DTSSP cross-linker was allowed to bind to these amine groups with its one end, while the other end of the cross-linker further was bound to the (NH2)-(T)10 linker at the 5’-end of either of the oDNA probes. The nanoribbons were immobilised with the oDNA probes individually: ~3 nL droplets of 1 mM solution of either oDNA probe in 10 mM phosphate buffer were precisely dispensed onto the surface of individual nanoribbons with a Perkin Elmer Piezorray dispensing system and incubated thereon for 24 hours in a humid chamber, and then washed off with ultrapure water. In such a way, covalent immobilisation of oDNA probes complementary to the target oDNA and RNA molecules on the surface of the nanoribbons was achieved. Silicon nanowires with immobilised oDNA probes were used as working ones for specific capturing of the target nucleic acid molecules from the analysed samples. The nanoribbons, whose surface was not immobilised with the oDNA probes, acted as control nanoribbons. The signal from the control nanoribbons was used to account for non-specific binding of sample components with the nanoribbon surface.
All blood plasma samples, used in the experiments, were obtained from patients suffering from either urogenital cancer (working samples) or non-oncological diseases (control samples) (Table 3).
The blood plasma samples were obtained and prepared in Institute of Urology and Reproductive Health (Sechenov University). The study was conducted according to the guidelines of the Declaration of Helsinki, and approved by independent ethical committee organized on the basis of Institute of Urology and Reproductive Health (Sechenov University) (Protocol No. 10–19 of 17 July 2019). All experiments with human plasma were carried out in compliance with Order no. 1177n (Ministry of Health of Russian Federation, 20 December 2012). Written voluntary consent to participate in the study was obtained from each patient.
The 1.5 mL samples of venous blood were taken before treatment on an empty stomach from the cubital vein into containers with 3.8% sodium citrate anticoagulant (S-Monovett®, SARSTEDT, Germany). These blood samples were then centrifuged at 3000 rpm for 6 min at room temperature. 500 µL volume of each of the so-obtained plasma samples was collected into two dry sterile test tubes, frozen and stored at −80 °C until further use.
RNA samples for the analysis were isolated from the plasma samples prepared as described above. For the isolation of total RNA from the plasma samples, ExtractRNA RNA isolation kit (Evrogen, Russia) was used according to the kit manufacturer instructions.
Biosensor measurements were performed in real time with a ten-channel data collection and storage system (Agama+ LLC, Moscow, Russia). Buffer solutions, used in the biosensor measurements, contained low (1 mM) concentration of buffer salts in order to avoid Debye screening effect [55,56]. Throughout the measurements, time dependencies of the drain-source current were monitored at drain-source voltage Vds = 0.1 V and gate voltage Vg = 50 V.
In order to determine the lower limit of detection of target nucleic acids, measurements with purified buffered (in 1 mM potassium phosphate buffer, pH 7.4) solutions containing known concentrations of synthetic oDNA analogues of the target ncRNAs were performed. In the measurements, a 150 µL volume of the oDNA solution (with oDNA concentration of 3.3 aM, 33 aM, 330 aM or 3.3 fM) was pipetted into the measuring cell containing 300 µL of pure potassium phosphate buffer. Accordingly, the final concentrations of the synthetic oDNAs in the measuring cell were 1.1 aM, 11 aM, 110 aM or 1.1 fM, respectively. In blank measurements, pure (nucleic acid)-free buffer was pipetted into the measuring cell instead of oDNA solution. After each measurement, the sensor chip was washed with 50 mL of pure hot (60°C) ultrapure water.
The experiments with the samples of total RNA isolated from samples of patients suffering from either urogenital cancer (working samples) or non-oncological disease (control samples) were performed analogously, but the volume of pure puffer in the measuring cell was 100 µL, into which a 7 µL volume of the sample was pipetted. With each sample studied, the measurements were performed in at least three independent technical replicates.
The signals acquired from each nanoribbon were normalized to 1 by dividing the signal value by the initial value of drain-source current. In order to exclude the signal caused by non-specific adsorption of sample components onto the nanoribbon surface, the signals obtained in the control measurement in pure 1 mM PPB, were subtracted from the signals obtained during the detection of target nucleic acid molecules. The difference signal was obtained by subtracting the values of the signal received from the control nanoribbons from those received from the working nanoribbons. The results were presented as sensorgrams, which show the time dependencies of the signal. The standard root-mean-square deviation function was used to check the reliability of the results [33,34].
Author Contributions
Y.D.I. designed the research workflow and wrote the paper; I.D.S. wrote the paper and prepared the artwork; D.V.E. collected and provided the plasma samples; N.V.P. collected and provided the plasma samples; K.V.G. performed the biosensor measurements, analysed data and participated in the artwork preparation; A.F.K. prepared the sensor chips for the biosensor measurements (silanisation procedures); A.N.A. prepared the sensor chips for the biosensor measurements (verification of correct operation of the chips); V.P.P. designed the sensor chips and the procedure of their fabrication; A.V.G. fabricated the sensor chips; E.D.N., A.V.V., and S.I.K. performed the biosensor measurements with plasma samples; V.S.Z. and A.Y.D. prepared the sensor chips for the biosensor measurements (surface treatment before silanisation); O.V.P. developed the workflow of chip surface treatment procedures; O.B.K. validated the clinical samples and analysed clinical data; N.D.I., M.A.A. and D.I.O. analysed data generated in biosensor experiments; V.Y.T. provided the chemicals and analysed data generated in biosensor experiments; A.A.L. designed the signal treatment workflow and analysed data generated in biosensor experiments; A.N.M. designed the biosensor setup (hardware mounting); N.E.K. designed the protocol of analysis of clinical samples and interpretation of the results; A.I.A. generated the scientific idea, designed and supervised the research workflow.
Funding
The biosensor measurements were performed within the framework of the Program for Basic Research in the Russian Federation for a long-term period (2021-2030) (No. 122030100168-2). The experimental work on the preparation and surface modification of sensor chips was supported by was supported by the Ministry of Science and Higher Education of the Russian Federation (State Assignment No. 075-00269-25-00).
Data Availability Statement
Correspondence and requests for materials should be addressed to Y.D.I.
Conflicts of Interest
The authors declare no conflict of interest.
References
- Holtedahl, K.; Borgquist, L.; Donker, G.A.; Buntinx, F.; et al. Symptoms and signs of urogenital cancer in primary care. BMC Primary Care, 2023, 24, 107. [Google Scholar] [CrossRef]
- Bray, F. ; Ferlay, J; Soerjomataram, I.; Siegel, R.L.; Torre, L.A.; Jemal, A. Global cancer statistics 2018: GLOBOCAN estimates of incidence and mortality worldwide for 36 cancers in 185 countries. CA Cancer J. Clin, 2018; 68, 394–424. [Google Scholar] [CrossRef]
- Rawla, P. Epidemiology of Prostate Cancer. World J. Oncol. 2019, 10(2), 63–89. [Google Scholar] [CrossRef] [PubMed]
- Chien, J.; Poole, E.M. Ovarian Cancer Prevention, Screening, and Early Detection: Report From the 11th Biennial Ovarian Cancer Research Symposium. Int. J. Gynecol. Cancer 2017, 27 (Suppl.5), S20–S22. [Google Scholar] [CrossRef]
- Sung, H. , et al. Global Cancer Statistics 2020: GLOBOCAN Estimates of Incidence and Mortality Worldwide for 36 Cancers in 185 Countries. CA: A Cancer Journal for Clinicians, 2021; 71, 209–249. [Google Scholar] [CrossRef]
- Maek, M. Penis-preserving surgery in patients with primary penile urethral cancer (Ger). Urologe A 2014, 53, 1800–1804. [Google Scholar] [CrossRef]
- Funston, G.; O’Flynn, H.; Ryan, N.A.J.; Hamilton, W. , Crosbie, E.J. Recognizing Gynecological Cancer in Primary Care: Risk Factors, Red Flags, and Referrals. Adv. Ther. 2018; 35, 577–589. [Google Scholar] [CrossRef]
- Rissin, D. , et al. Single-molecule enzyme-linked immunosorbent assay detects serum proteins at subfemtomolar concentrations. Nat. Biotechnol. 2010, 28, 595–599. [Google Scholar] [CrossRef] [PubMed]
- Chen, J. , et al. Translational Bioinformatics for Diagnostic and Prognostic Prediction of Prostate Cancer in the Next-Generation Sequencing Era. BioMed Res. Int. 2013; 2013, 901578. [Google Scholar] [CrossRef]
- Lumbreras, B. , et al. Variables Associated with False-Positive PSA Results: A Cohort Study with Real-World Data. Cancers 2023, 15, 261. [Google Scholar] [CrossRef]
- Dochez, V.; Caillon, H.; Vaucel, E.; Dimet, J.; Winer, N.; Ducarme, G. Biomarkers and algorithms for diagnosis of ovarian cancer: CA125, HE4, RMI and ROMA, a review. J. Ovarian Res. 2019, 12, 28. [Google Scholar] [CrossRef]
- Zhu, C.-Z.; Ting, H.-N.; Ng, K.-H.; Ong, T.-A. A Review on the Accuracy of Bladder Cancer Detection Methods. J. Cancer 2019, 10(17), 4038–4044. [Google Scholar] [CrossRef]
- Yoo, J. W.; Koo, K. C.; Chung, B. H.; Baek, S. Y.; Lee, S. J.; Park, K. H.; Lee, K. S. Deep Learning Diagnostics for Bladder Tumor Identification and Grade Prediction Using RGB Method. Sci. Rep. 2022, 12(1), 17699. [Google Scholar] [CrossRef]
- Chang, L.; Ni, J.; Zhu, Y.; Pang, B.; Graham, P.; Zhang, H.; Li, Y. Liquid Biopsy in Ovarian Cancer: Recent Advances in Circulating Extracellular Vesicle Detection for Early Diagnosis and Monitoring Progression. Theranostics 2019, 9(14), 4130–4140. [Google Scholar] [CrossRef]
- Hafeez, S.; Huddart, R. Advances in Bladder Cancer Imaging. BMC Med. 2013, 11, 104. [Google Scholar] [CrossRef] [PubMed]
- Li, J.; Zhang, Z.; Trau, M.; Wuethrich, A. Digital platforms enabling single-molecule analysis for cancer detection. Trends Anal. Chem. 2024, 171, 117502. [Google Scholar] [CrossRef]
- Waseem, M.; Ahmad, M.K.; Serajuddin, M.; Bhaskar, V.; Sankhwar, S.N.; Mahdi, A.A. MicroRNA-183-5p: A New Potential Marker for Prostate Cancer. Ind. J. Clin. Biochem. 2019, 34, 207–212. [Google Scholar] [CrossRef]
- Xu, Y.-Z.; Xi, Q.-H.; Ge, W.-L.; Zhang, X.-Q. Identification of Serum MicroRNA-21 as a Biomarker for Early Detection and Prognosis in Human Epithelial Ovarian Cancer. Asian Pac. J. Cancer Prev. 2013, 14, 1057–1060. [Google Scholar] [CrossRef]
- Zhang, Z.; Wang, Y.; Zhang, Y.; Zheng, S.F.; Feng, T.; Tian, X.; Abudurexiti, M.; Wang, Z.D.; Zhu, W.K.; Su, J.Q.; Zhang, H.L.; Shi, G.H.; Wang, Z.L.; Cao, D.L. , Ye, D.W. The function and mechanisms of action of circular RNAs in Urologic Cancer. Mol. Cancer 2023, 22, 61. [Google Scholar] [CrossRef]
- Wang, H. , Feng, Y., Zheng, X., Xu, X. The Diagnostic and Therapeutic Role of snoRNA and lincRNA in Bladder Cancer. Cancers (Basel) 2023, 15(4), 1007. [Google Scholar] [CrossRef]
- Crea, F.; Quagliata, L.; Michael, A.; Liu, H. H.; Frumento, P.; Azad, A. A.; Xue, H.; Pikor, L.; Watahiki, A.; Morant, R.; Eppenberger-Castori, S.; Wang, Y.; Parolia, A.; Lennox, K. A.; Lam, W. L.; Gleave, M.; Chi, K. N.; Pandha, H.; Wang, Y.; Helgason, C. D. Integrated Analysis of the Prostate Cancer Small-Nucleolar Transcriptome Reveals SNORA55 as a Driver of Prostate Cancer Progression. Mol. Oncol. 2016, 10(5), 693–703. [Google Scholar] [CrossRef]
- Gong, J.; Li, Y.; Liu, C.; Xiang, Y.; Li, C.; Ye, Y.; Zhang, Z.; Hawke, D. H.; Park, P. K.; Diao, L.; Putkey, J. A.; Yang, L.; Guo, A.-Y.; Lin, C.; Han, L. A Pan-Cancer Analysis of the Expression and Clinical Relevance of Small Nucleolar RNAs in Human Cancer. Cell Rep. 2017, 21(7), 1968–1981. [Google Scholar] [CrossRef] [PubMed]
- Gillespie, P. , Ladame, S., O’Hare, D. Molecular Methods in Electrochemical MicroRNA Detection. Analyst 2019, 144(1), 114–129. [Google Scholar] [CrossRef]
- Ye, J.; Xu, M.; Tian, X.; Cai, S.; Zeng, S. Research Advances in the Detection of MiRNA. J. Pharm. Analysis 2019, 9(4), 217–226. [Google Scholar] [CrossRef] [PubMed]
- El Aamri, M.; Yammouri, G.; Mohammadi, H.; Amine, A.; Korri-Youssoufi, H. Electrochemical Biosensors for Detection of MicroRNA as a Cancer Biomarker: Pros and Cons. Biosensors 2020, 10(11), 186. [Google Scholar] [CrossRef]
- Yang, T. , Zhang M., Zhang N. Modified Northern blot protocol for easy detection of mRNAs in total RNA using radiolabeled probes. BMC Genomics 2022, 23(1), 66. [Google Scholar] [CrossRef]
- Crampton, N. , Bonass, W.A., Kirkham, J., Thomson, N.H. Formation of aminosilane-functionalized mica for atomic force microscopy imaging of DNA. Langmuir, 7884. [Google Scholar] [CrossRef]
- Ivanov, Y.D.; Pleshakova, T.O.; Shumov, I.D.; Kozlov, A.F.; Ivanova, I.A.; Valueva, A.A.; Tatur, V.Y.; Smelov, M.V.; Ivanova, N.D.; Ziborov, V.S. AFM imaging of protein aggregation in studying the impact of knotted electromagnetic field on a peroxidase. Sci. Rep. 2020, 10, 9022. [Google Scholar] [CrossRef] [PubMed]
- Stern, E.; Klemic, J.; Routenberg, D.; Wyrembak, P.; Turner-Evans, D.; Hamilton, A.; LaVan, D.; Fahmy, T.; Reed, M.A. Label-free immunodetection with CMOS-compatible semiconducting nanowires. Nature 2007, 445, 519–522. [Google Scholar] [CrossRef]
- Stern, E.; Vlacic, A.; Rajan, N,K. ; Criscione, J.M.; Park, J.; Ilic, B.R.; Mooney, D.J.; Reed, M.A.; Fahmy, T.M. Label-free biomarker detection from whole blood. Nature Nanotech. 2010, 5, 138–142. [Google Scholar] [CrossRef] [PubMed]
- Elfström, N.; Juhasz, R.; Sychugov, I.; Engfeldt, T.; Eriksson Karlström, A.; Linnros, J. Surface Charge Sensitivity of Silicon Nanowires: Size Dependence. Nano Lett. 2007, 7, 2608–2612. [Google Scholar] [CrossRef] [PubMed]
- Ivanov, Y.D.; Pleshakova, T.O.; Kozlov, A.F.; Malsagova, K.A.; Krohin, N.V.; Shumyantseva, V.V.; Shumov, I.D.; Popov, V.P.; Naumova, O.V.; Fomin, B.I.; et al. SOI nanowire for the high-sensitive detection of HBsAg and α-fetoprotein. Lab Chip. 2012, 12, 5104–5111. [Google Scholar] [CrossRef]
- Ivanov, Y.; et al. Detection of Marker miRNAs, Associated with Prostate Cancer, in Plasma Using SOI-NW Biosensor in Direct and Inversion Modes. Sensors 2019, 19, 5248. [Google Scholar] [CrossRef]
- Ivanov, Y.D.; Malsagova, K.A.; Goldaeva, K.V.; Kapustina, S.I.; Pleshakova, T.O.; Popov, V.P.; Kozlov, A.F.; Galiullin, R.A.; Shumov, I.D.; Enikeev, D.V.; et al. Nanoribbon Biosensor-Based Detection of microRNA Markers of Prostate Cancer. Sensors 2023, 23, 7527. [Google Scholar] [CrossRef]
- Patolsky, F.; Zheng, G.; Hayden, O.; Lakadamyali, M.; Zhuang, X.; Lieber, C.M. Electrical detection of single viruses. Proc. Natl. Acad. Sci. USA 2004, 101, 14017–14022. [Google Scholar] [CrossRef]
- Rajan, N.K.; Duan, X.; Reed, M.A. Performance limitations for nanowire/nanoribbon biosensors. WIREs Nanomed Nanobiotechnol 2013. [Google Scholar] [CrossRef] [PubMed]
- Miao, L. , Liu, H. Y., Zhou, C., He, X. LINC00612 Enhances the Proliferation and Invasion Ability of Bladder Cancer Cells as CeRNA by Sponging MiR-590 to Elevate Expression of PHF14. J. Exp. Clin. Cancer Res, 2019; 38, 143. [Google Scholar] [CrossRef]
- Jin, L.; et al. Identification of MiR-195-3p as an Oncogene in RCC. Mol. Medicine Rep. 2017, 15(4), 1916–1924. [Google Scholar] [CrossRef] [PubMed]
- Larne, O.; et al. miR-183 in Prostate Cancer Cells Positively Regulates Synthesis and Serum Levels of Prostate-specific Antigen. Eur. Urol. 2015, 68(4), 581–588. [Google Scholar] [CrossRef]
- Chen, S.-N.; et al. MicroRNA in Ovarian Cancer: Biology, Pathogenesis, and Therapeutic Opportunities. Int. J. Environ. Res. Public Health 2019, 16. [Google Scholar] [CrossRef] [PubMed]
- Salomo, K.; Huebner, D.; Boehme, M.U.; Herr, A.; Brabetz, W.; Heberling, U.; Hakenberg, O.W.; Jahn, D.; Grimm, M.-O.; Steinbach, D.; Horstmann, M.; Froehner, M.; Wirth, M. P.; Fuessel, S. Urinary Transcript Quantitation of CK20 and IGF2 for the Non-Invasive Bladder Cancer Detection. J. Cancer Res. Clin. Oncol. 2017, 143(9), 1757–1769. [Google Scholar] [CrossRef] [PubMed]
- Huang, Y.; Zhang, Y.; Jia, L.; Liu, C.; Xu, F. Circular RNA ABCB10 Promotes Tumor Progression and Correlates with Pejorative Prognosis in Clear Cell Renal Cell Carcinoma. Int. J. Biol. Markers 2019, 34(2), 176–183. [Google Scholar] [CrossRef]
- Xia, Q.; et al. Circular RNA Expression Profiling Identifies Prostate Cancer- Specific circRNAs in Prostate Cancer. Cell. Physiol. Biochem. 2018, 50(5), 1903–1915. [Google Scholar] [CrossRef]
- Gan, X. , et al. CircMUC16 promotes autophagy of epithelial ovarian cancer via interaction with ATG13 and miR-199a. Mol. Cancer, 2020; 19, 1–13. [Google Scholar] [CrossRef]
- Chow, R. D.; Chen, S. Sno-Derived RNAs Are Prevalent Molecular Markers of Cancer Immunity. Oncogene 2018, 37(50), 6442–6462. [Google Scholar] [CrossRef]
- Hirasawa, Y.; Pagano, I.; Chen, R.; Sun, Y.; Dai, Y.; Gupta, A.; Tikhonenkov, S.; Goodison, S.; Rosser, C.J.; Furuya, H. Diagnostic performance of Oncuria™, a urinalysis test for bladder cancer. J. Transl. Med. 2021, 19, 141. [Google Scholar] [CrossRef]
- Fischerova, D.; Burgetova, A. Imaging techniques for the evaluation of ovarian cancer. Best Practice & Research Clinical Obstetrics & Gynaecology, 2014; 28, 697–720. [Google Scholar] [CrossRef]
- Dewey, M.; Schink, T.; Dewey, C. F. Claustrophobia during Magnetic Resonance Imaging: Cohort Study in over 55,000 Patients. J. Magn. Reson. Imaging 2007, 26(5), 1322–1327. [Google Scholar] [CrossRef]
- Galvão-Lima, L.J.; et al. miRNAs as biomarkers for early cancer detection and their application in the development of new diagnostic tools. BioMed Eng. OnLine 2021, 20, 21. [Google Scholar] [CrossRef]
- Kosaka N., Yoshioka Y., Fujita Y., Ochiya T. Versatile roles of extracellular vesicles in cancer. J. Clin. Invest. 126(4), 1163-1172. [CrossRef]
- Ma, S. , Kong, S., Wang, F., Ju, S. CircRNAs: biogenesis, functions, and role in drug-resistant Tumours. Mol. Cancer 2020, 19, 119. [Google Scholar] [CrossRef]
- Wu, F.; Zhang, L.; Wu, P.; Wu, Y.; Zhang, T.; Zhang, D.; Tian, J. The Potential Role of Small Nucleolar RNAs in Cancers – An Evidence Map. Int. J. General Medicine, 2022; 2022, 3851–3864. [Google Scholar] [CrossRef]
- Wajahat, M. , Bracken, C. P., Orang, A. Emerging Functions for snoRNAs and snoRNA-Derived Fragments. Int. J. Mol. Sci. 2021, 22. [Google Scholar] [CrossRef] [PubMed]
- Yamada, K.; Yoshii, S.; Kumagai, S.; Fujiwara, I.; Nishio, K.; Okuda, M.; Matsukawa, N.; Yamashita, I. High-Density and Highly Surface Selective Adsorption of Protein–Nanoparticle Complexes by Controlling Electrostatic Interaction. Jpn. J. Appl. Phys. 2006, 45, 4259–4264. [Google Scholar] [CrossRef]
- Stern, E. E.; Wagner, R.; Sigworth, F.J.; Breaker, R.; Fahmy, T.M.; Reed, M.A. Importance of the Debye Screening Length on Nanowire Field Effect Transistor Sensors. Nano Lett. 2007, 7, 3405–3409. [Google Scholar] [CrossRef] [PubMed]
- Laborde, C.; Pittino, F.; Verhoeven, H.A.; Lemay, S.G.; Selmi, L.; Jongsma, M.A.; Widdershoven, F.P. Real-Time Imaging of Microparticles and Living Cells with CMOS Nanocapacitor Arrays. Nature Nanotech. 2015, 10, 791–795. [Google Scholar] [CrossRef]
Figure 1.
Physical dimensions and typical electrical properties of a single nanoribbon. Optical image of the sensor chip bearing an array of twelve nanoribbons (a), and optical (b) and SEM (c) image of a single nanoribbon, whose physical dimensions are shown in d. Typical CVC curves reflecting characteristic right-shift of CVC curves after silanisation (orange curve) of the nanoribbon and immobilisation of oDNA probes (violet curve) onto it in comparison with bare nanoribbon (red curve) are shown in e.
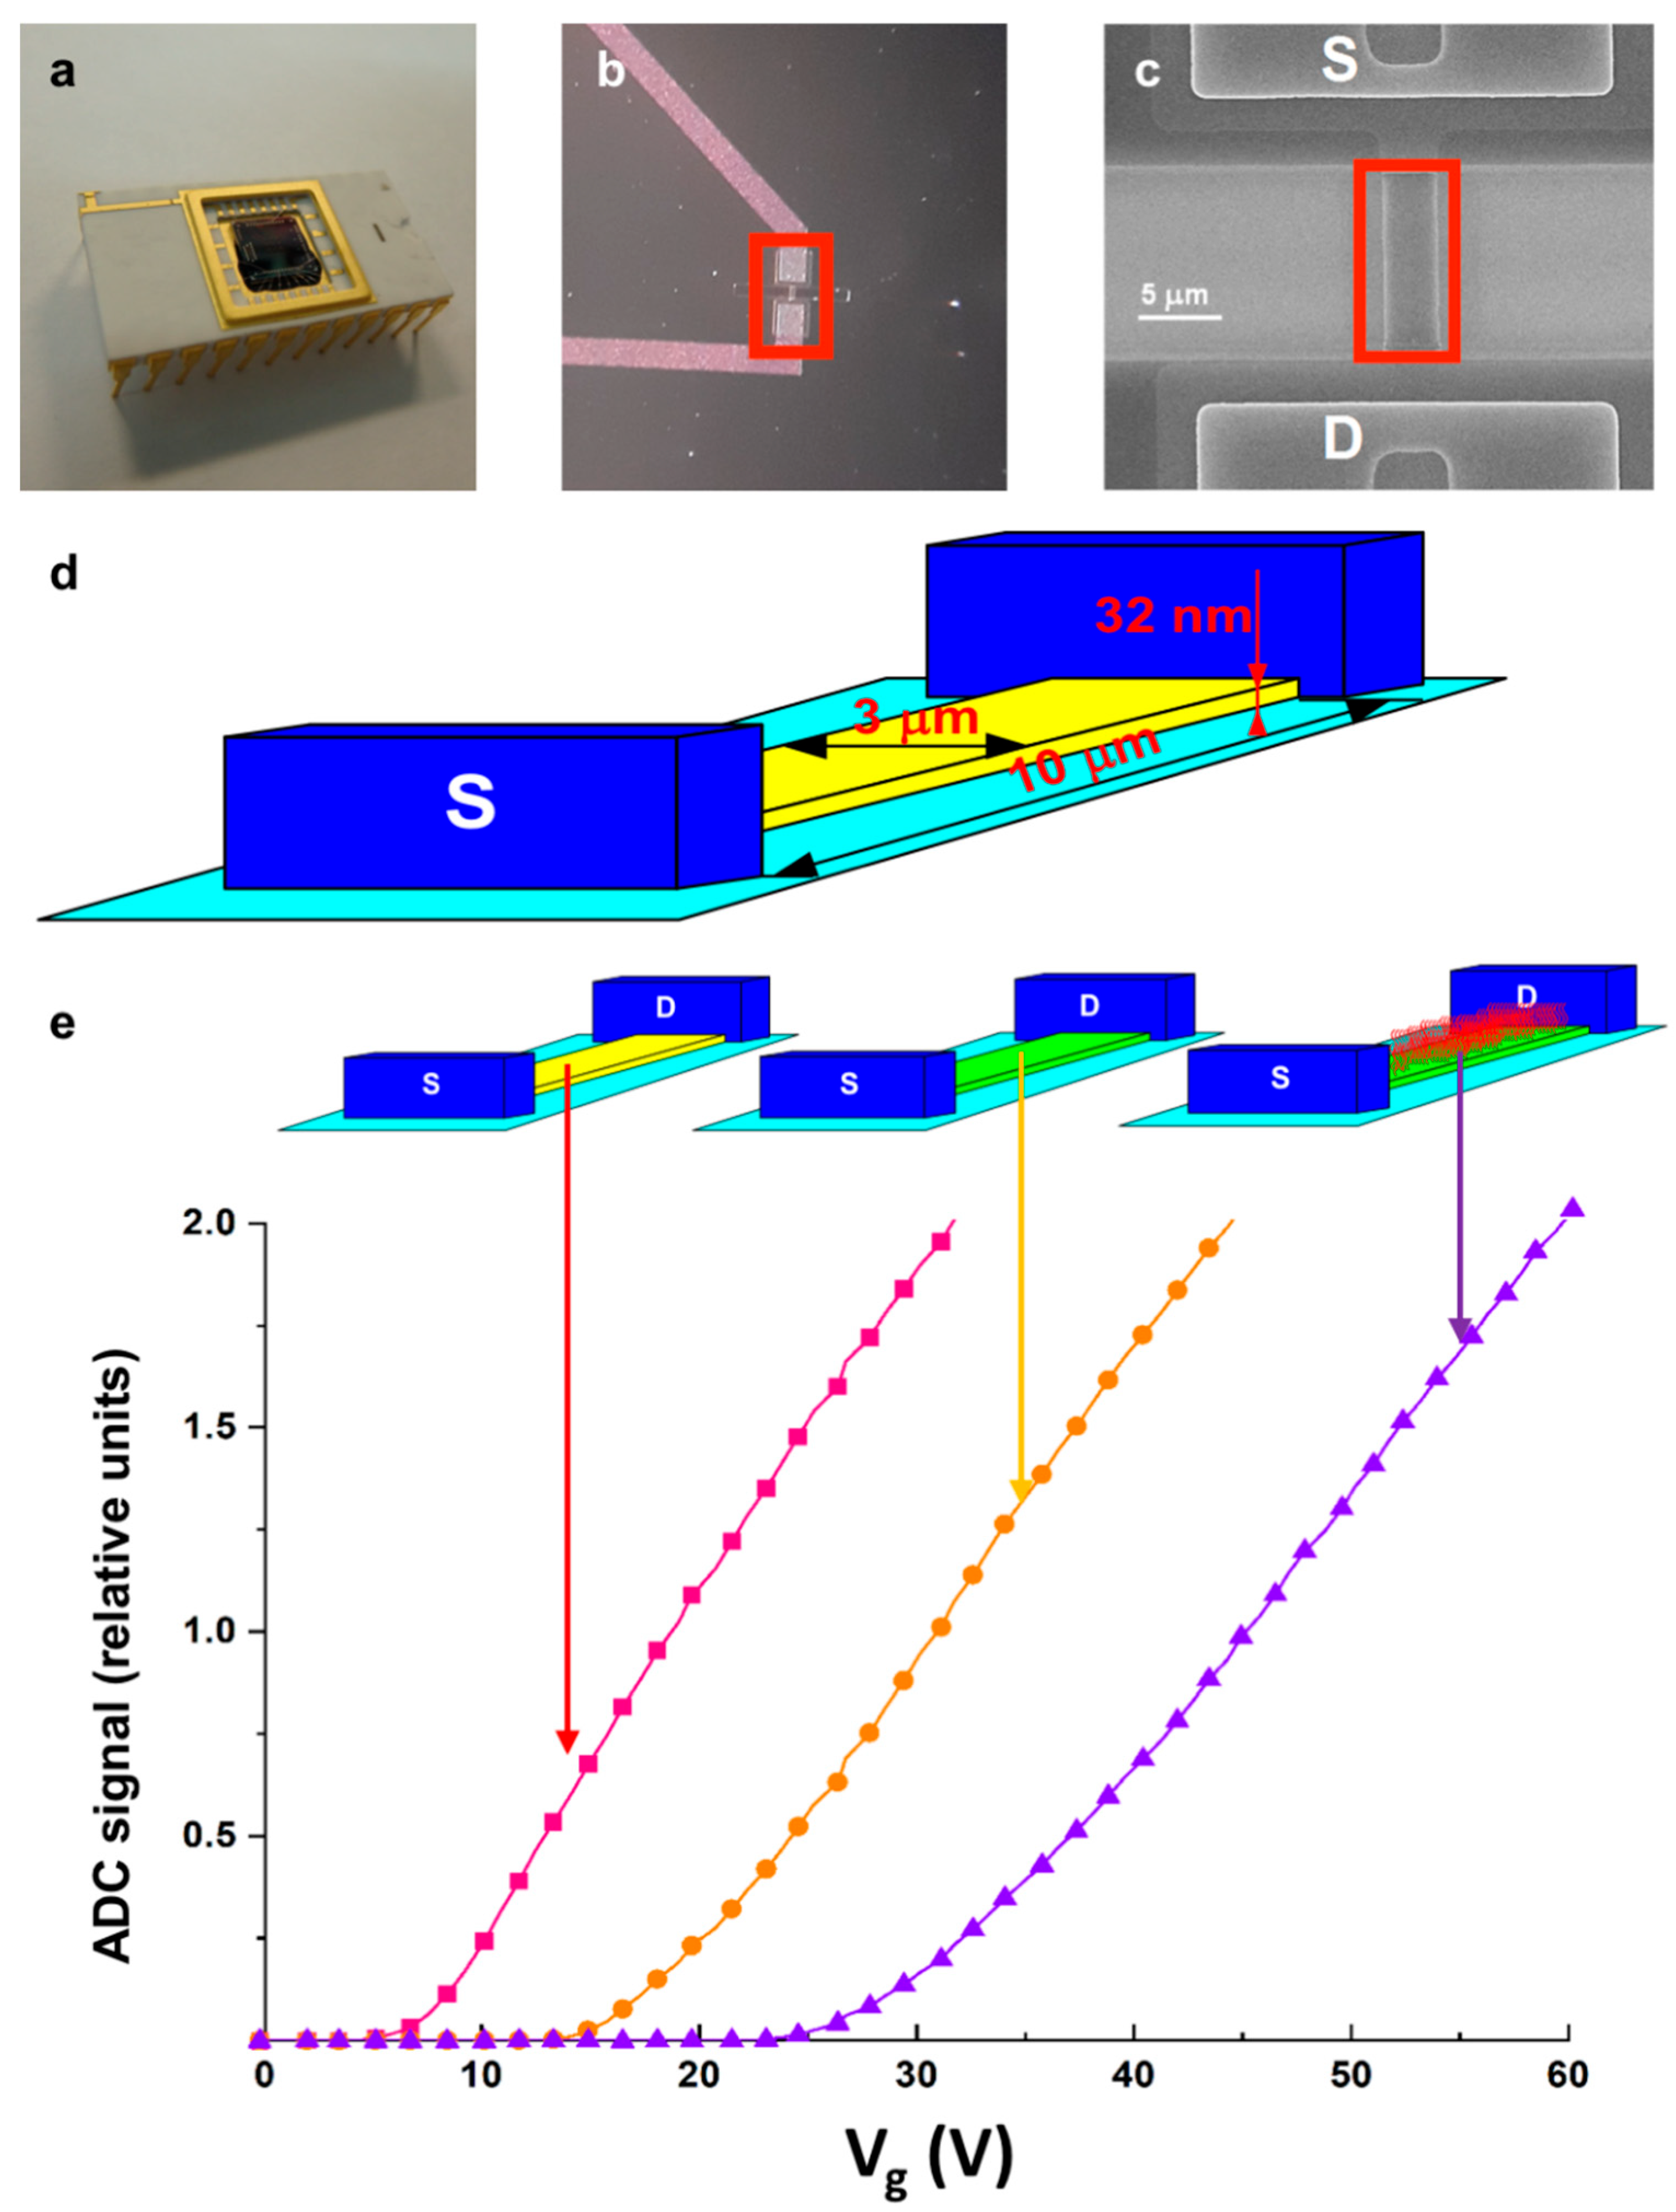
Figure 2.
Typical ΔIds(t) curves obtained in experiments on the determination of the lower limit of detection of target nucleic acid molecules with the nanoribbon biosensor. Purified solutions of oDNA analogues of target ncRNA (microRNA (a), circRNA (b) and snoRNA (c) markers of kindey cancer in 1 mM potassium phosphate buffer (pH 7.4) were used.. The concentrations of the oDNAs in the solutions were 1 aM (black curves), 10 aM (red curves), 100 aM (blue curves), and 1 fM (green curves). Arrows indicate the time points of addition of oDNA solutions into the biosensor’s measuring cell. Error bars indicate standard deviation obtained in three independent technical replicates of each experiment.
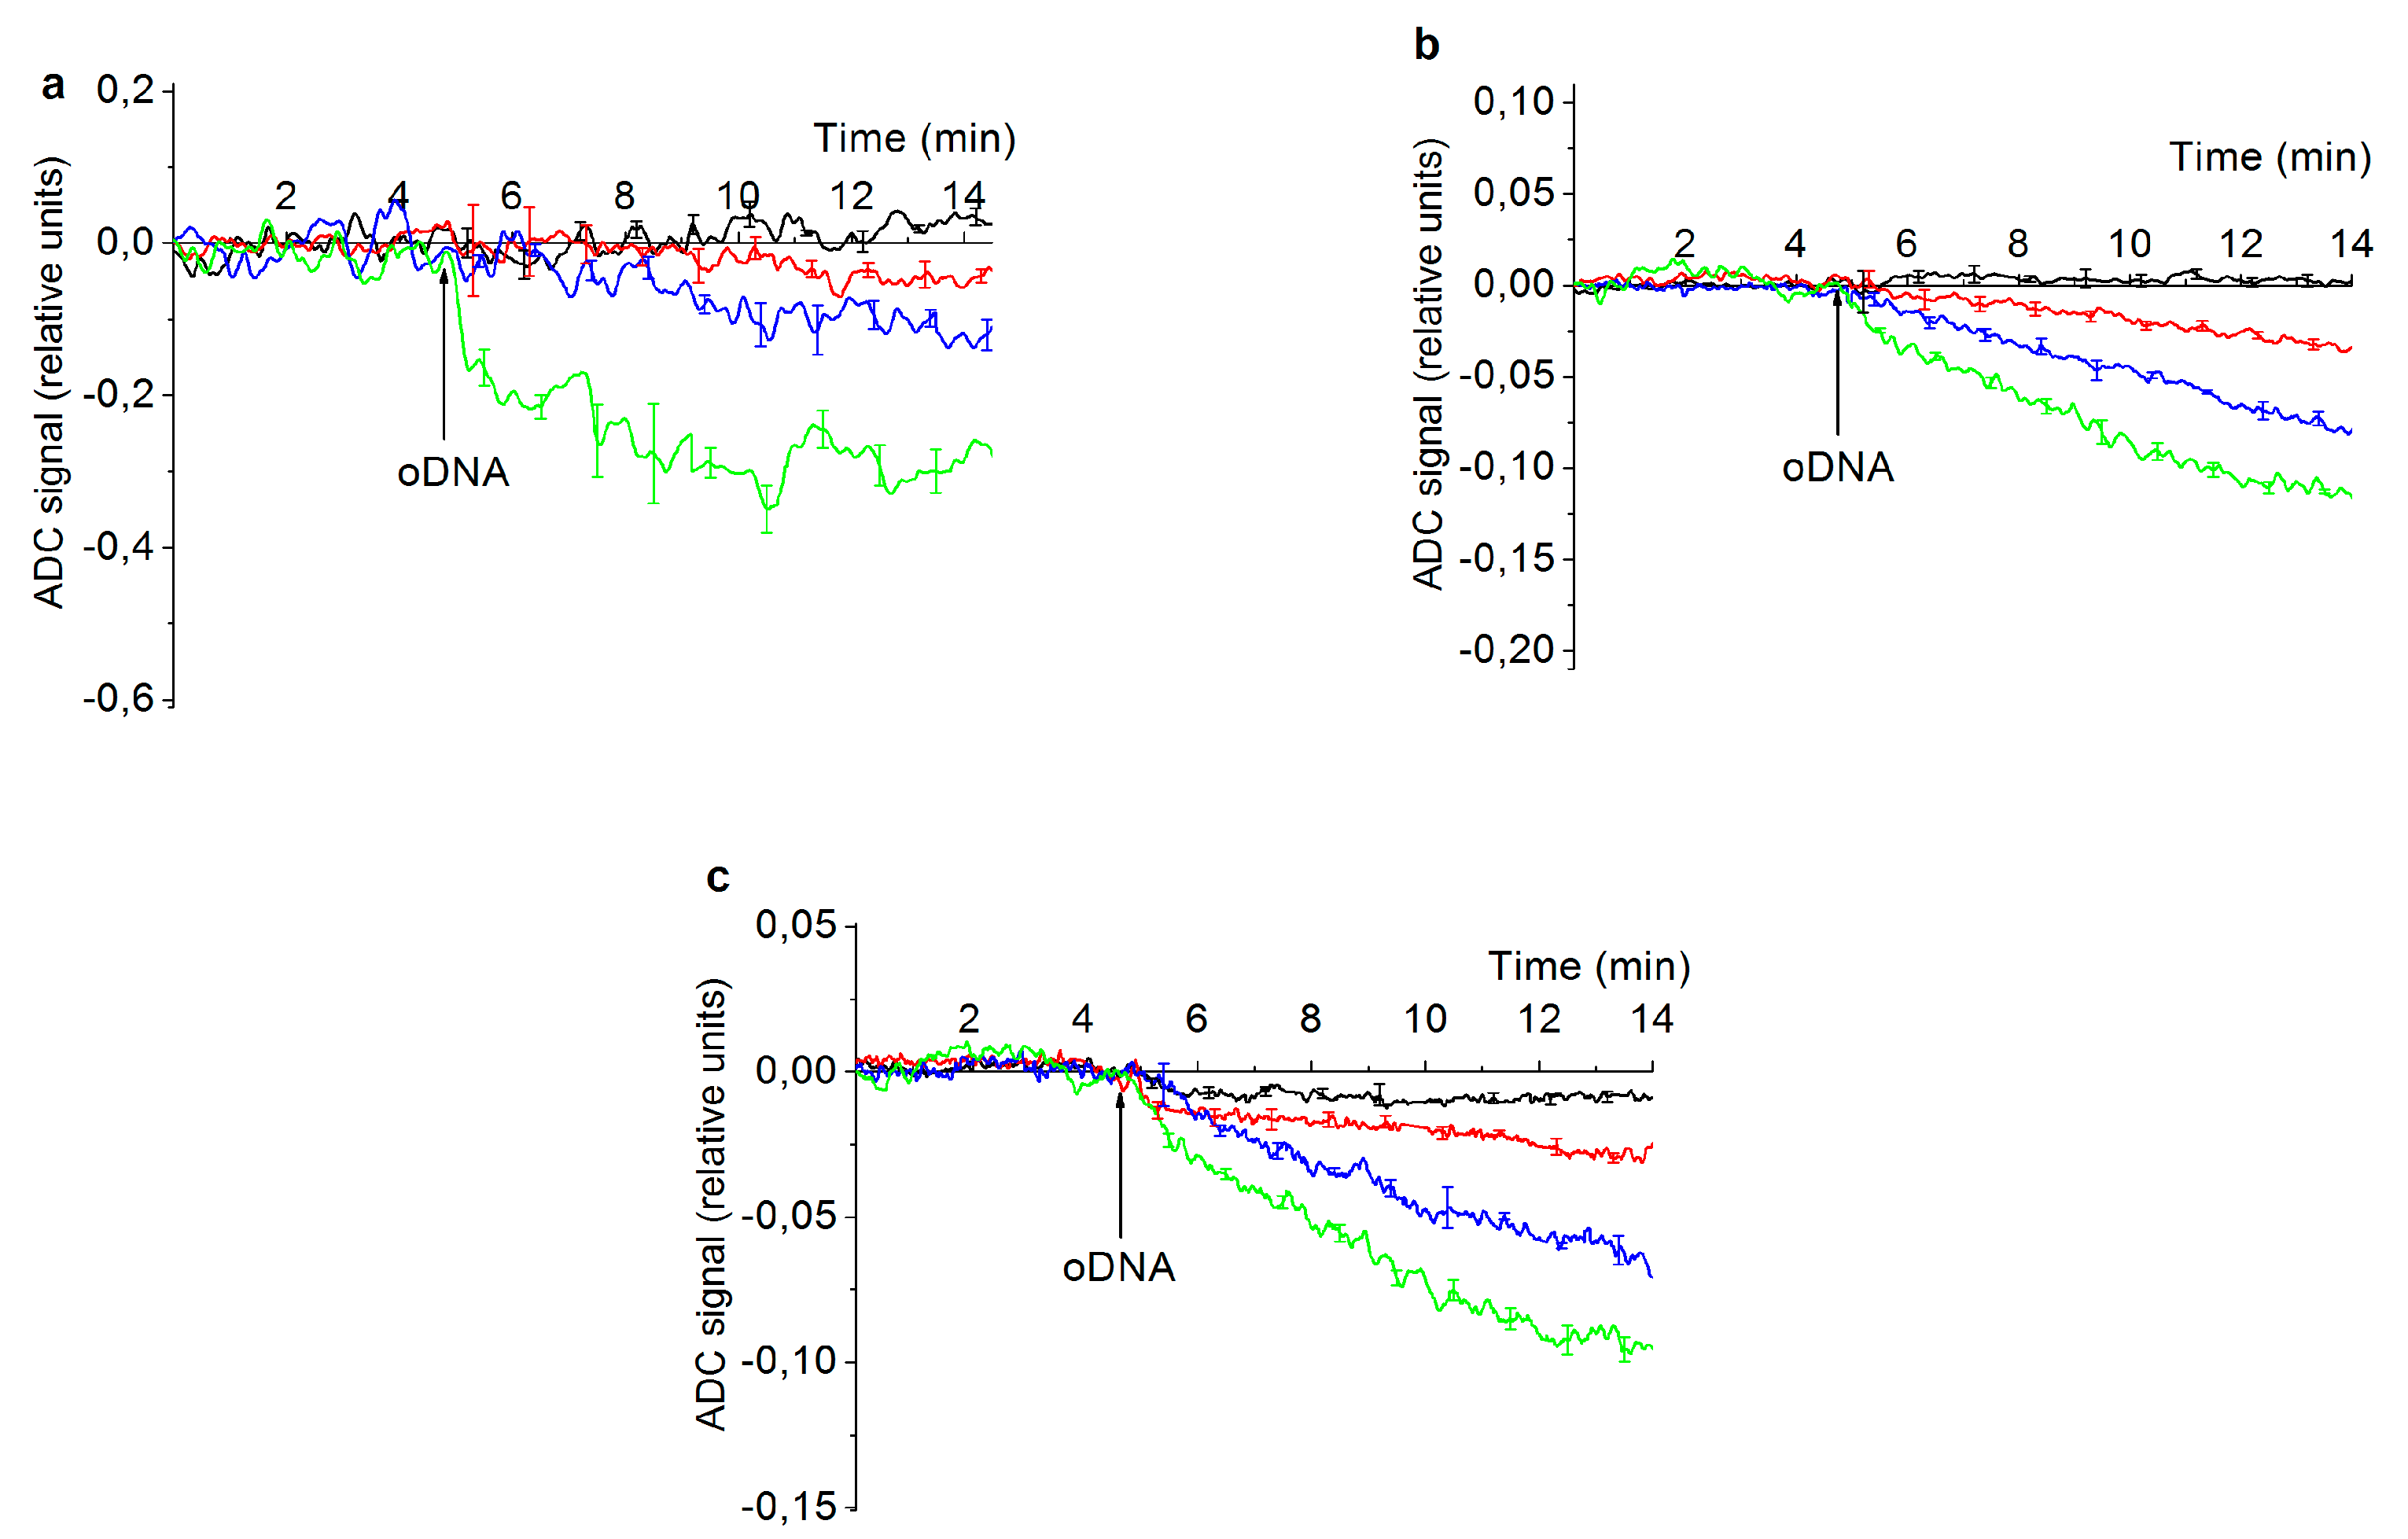
Figure 3.
Typical ΔIds(t) curves obtained upon the analysis of total RNA samples isolated from human plasma samples. The RNA samples were isolated from plasma of urogenital cancer patients (with I and II stages of the diseases) (red curves) and patients with non-oncological diseases (blue curves). The nanoribbon was immobilised with oDNA probes against microRNA (a, d, g, j), circRNA (b, e, h, k), or snoRNA (c, f, i, l) markers of bladder (a-c), kidney (d-f), prostate (g-i), or ovarian (j-l) cancer. Arrows indicate the time points of addition of the sample into the biosensor’s measuring cell. Error bars indicate standard deviation obtained in three independent technical replicates of each experiment.
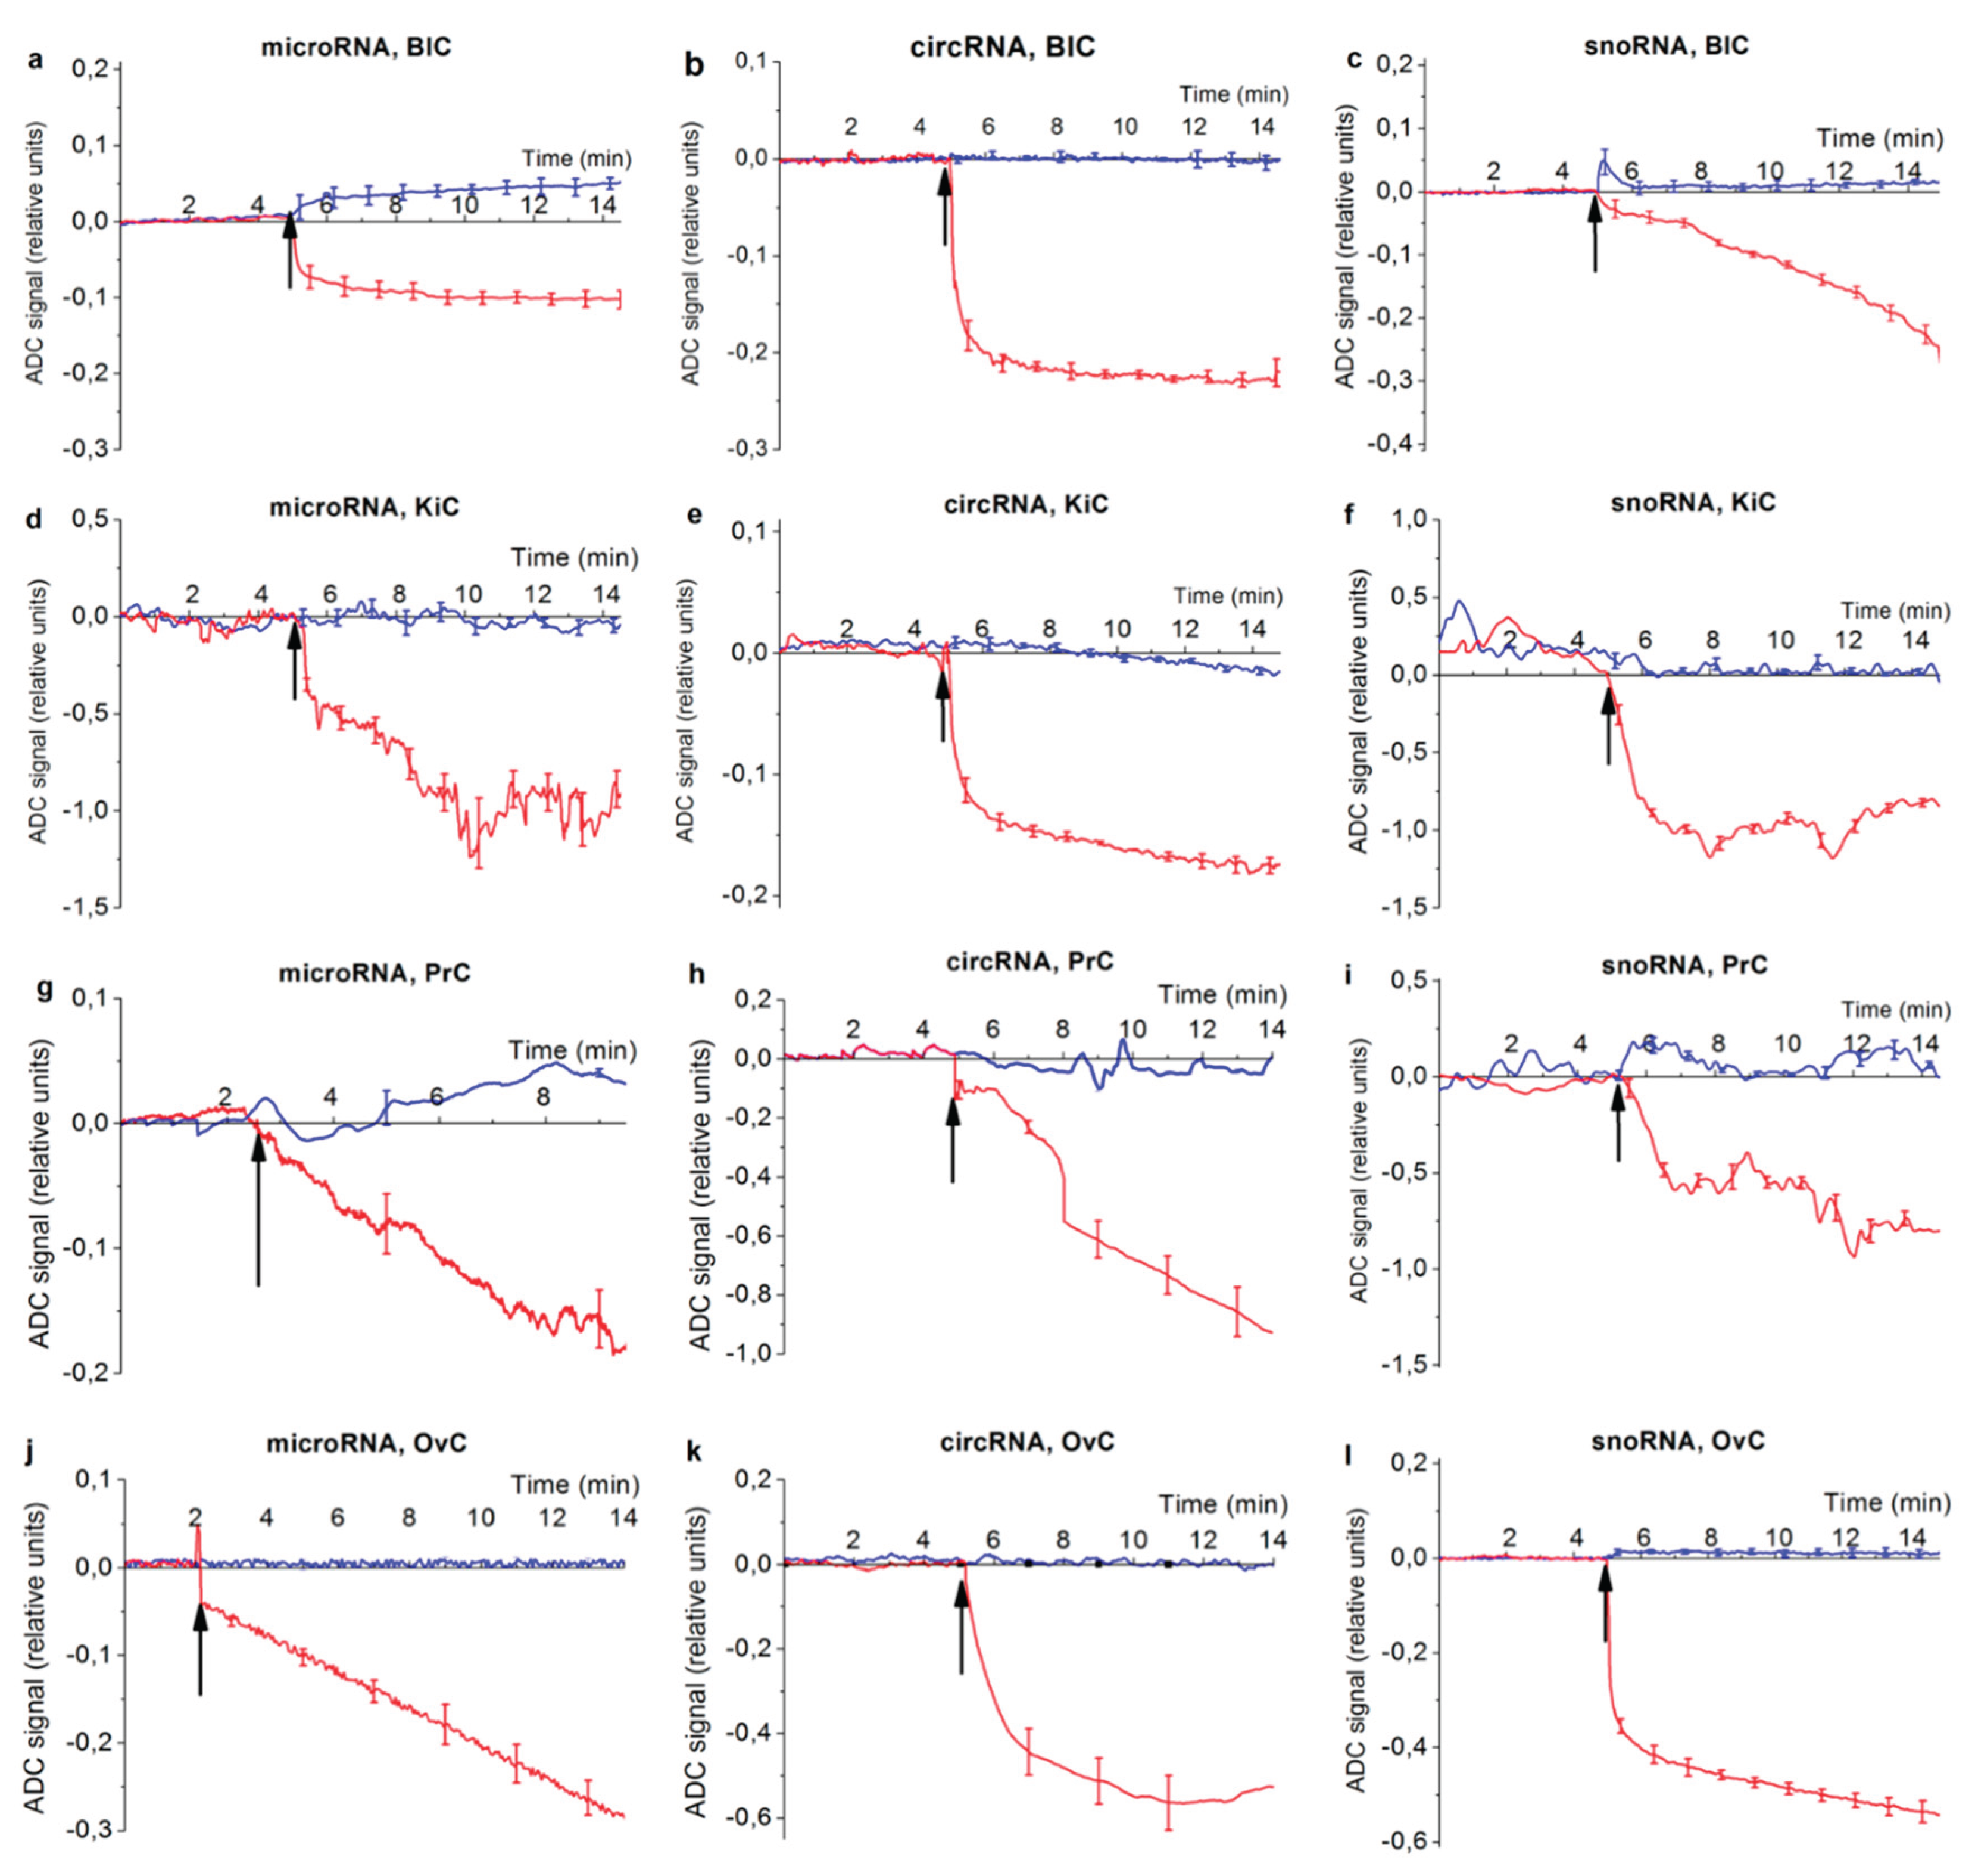

Table 1.
Target ncRNA markers of urogenital cancers considered in our study.
| Pathology | ncRNA type | ncRNA name | Ref. |
| BlC | microRNA | miRNA-590-3p | [37] |
| circRNA | circRNA_0020792 | [41] | |
| snoRNA | snoRNA _SNORD58С | [22] | |
| KiC | microRNA | miRNA-195-3p | [38] |
| circRNA | circRNA_0016825 | [42] | |
| snoRNA | snoRNА_SNORА77 | [45] | |
| PrC | microRNA | hsa-mir-198 | [39] |
| circRNA | circRNA 57558 | [43] | |
| snoRNA | SNORA55 | [21] | |
| OvC | microRNA | hsa-mir-21 | [40] |
| circRNA | hsa_circ_0049116 | [44] | |
| snoRNA | snoRNA _SNORD58С | [22] |
Table 2.
Nucleotide sequences of oDNA analogues (employed in the experiments on the determination of the lower limit of detection) and nanoribbon-immobilised oDNA probes. All oDNAs were synthesised by Evrogen LLC (Moscow, Russia).
Table 2.
Nucleotide sequences of oDNA analogues (employed in the experiments on the determination of the lower limit of detection) and nanoribbon-immobilised oDNA probes. All oDNAs were synthesised by Evrogen LLC (Moscow, Russia).
| ncRNA name | oDNA analogue sequence | Nanoribbon-immobilised oDNA probe sequence |
| miRNA-590-3p | TAATTTTATGTATAAGCTAGT | (NH2)-TTTTTTTTTT ACTAGCTTATACATAAAATTA |
| miRNA-195-3p | CCAATATTGGCTGTGCTGCTCC | 5’- (NH2)-(T)10-GGAGCAGCACAGCCAATATTGG |
| hsa-mir-198 | CCGCAGAGTGTGACTCCTGTTCT GTGTATGG CACTGGTAGAATTCACTGTGAAC AGTCTCAG TCAGTGAATTACCGAAGGGCCAT AAACAGAGCAGAGACAGATCCACGA | (NH2)-(T)10-TCGTGGATCTGTCTCTGCTCTGTTTA TGGCCCTTCGGTAATTCACTGACTGAGA CTGTTCACAGTGATTTCTACCAGTGCCA TACACAGAACAGGAGTCACACTCTGCGG |
| hsa-mir-21 | TGTCGGGTAGCTTATCAGACTG ATGTTGACTGTTGAATCTCATGGCAA CACCAGTCGATGGGCTGTCTGACA | 5’- (NH2)-(T)10-TGTCAGACAGCCCATCGACTGGT GTTGCCATGAGATTCAACAGT CAACATCAGTCTGATAAGCTACCCG |
| circRNA_0020792 | AGCCTCCTGGGGGGCACT GGCCACTGAGCCCCCTTGGA GAAGTCAGAGGG | (NH2)-(T)10-CCCTCTGACTTCTCCAA GGGGGCTCAGTGGCCAGTGCCCCCCA GGAGGCT |
| circ_0016825 | TATTTATAGTCTCAAAA TTCCTAAAGCAATGCTACAACCA TTGAATTTGC | (NH2)-(T)10-GCAAATTCAATGGTTG TAGCATTGCTTTAGGAATTTTGAGA CTATAAATA |
| circRNA 57558 | TCACTGCAGGCATGT | (NH2)-(T)10-ACATGCCTGCAGTGA |
| hsa_circ_0049116 | TGGAGTGGATGCCAT | (NH2)-(T)10-ATGGCATCCACTCCA |
| SNORA55 | GCAGAGGAAATCCAG | (NH2)-(T)10-CTGGATTTCCTCTGC |
| snoRNA _SNORD58С | TTAGGACACCTTTGG | (NH2)-(T)10-CCAAAGGTGTCCTAA |
| snorRNА_SNORА77 | TCCAGGGTGCTGTGG | (NH2)-(T)10-CCACAGCACCCTGGA |
| snoRNA _SNORD58С | TTAGGACACCTTTGG | (NH2)-T10-CCAAAGGTGTCCTAA |
Table 3.
Characteristics of plasma samples analysed in the study.
| Plasma Sample No. | Diagnosis |
| #1 | Bladder cancer (T3N0M0) |
| #2 | Right kidney stone (T0N0M0, control sample) |
| #33 | Bladder cancer (T3N0M0) |
| #3c | Left kidney cyst (T0N0M0, control sample) |
| #4 | Renal cell carcinoma (T1aN0M0) |
| #3 | Urolithiasis (T0N0M0, control sample) |
| #8pr | Prostate cancer (T2N0M0) |
| #38 | Left kidney cyst (T0N0M0, control sample) |
| #6ov | Ovarian cancer (T2N0M0) |
| #10 | Urolithiasis (T0N0M0, control sample) |
| #44 | Prostate cancer (T1cN0M0) |
| #8 | Ovarian cancer (T2N0M0) |
| #7 | Urethritis (T0N0M0) |
Disclaimer/Publisher’s Note: The statements, opinions and data contained in all publications are solely those of the individual author(s) and contributor(s) and not of MDPI and/or the editor(s). MDPI and/or the editor(s) disclaim responsibility for any injury to people or property resulting from any ideas, methods, instructions or products referred to in the content. |
© 2025 by the authors. Licensee MDPI, Basel, Switzerland. This article is an open access article distributed under the terms and conditions of the Creative Commons Attribution (CC BY) license (http://creativecommons.org/licenses/by/4.0/).
Copyright: This open access article is published under a Creative Commons CC BY 4.0 license, which permit the free download, distribution, and reuse, provided that the author and preprint are cited in any reuse.


