1. Introduction
Adolescence represents a turning point in the human life course, when patterns of physical activity, nutrition, and social behavior begin to solidify into habits that often persist into adulthood. This developmental window is characterized by rapid physical growth, hormonal change, and cognitive restructuring, all of which place heightened demands on both the body and mind. During these years, regular and structured physical activity is not only a means of cultivating athletic skills but also a fundamental determinant of long-term health, resilience, and psychosocial well-being. When young people engage consistently in movement, exercise, and sport, they build muscular and cardiovascular capacity, regulate their weight more effectively, reduce stress, and acquire interpersonal skills such as cooperation and discipline. Conversely, when activity levels decline, risks emerge: sedentary lifestyles increase vulnerability to obesity, metabolic disorders, and mental health challenges that can extend into later life [
1].
Internationally, the trend is worrying. Rates of adolescent overweight and obesity are climbing steadily, while the number of youths achieving recommended levels of daily activity continues to fall. Schools play an especially crucial role in counteracting this decline. As nearly all children and adolescents spend the majority of their days within educational institutions, the school timetable remains the most reliable and equitable platform for guaranteeing access to physical education. Well-designed school-based programs can ensure not only minimum activity thresholds but also structured exposure to diverse types of movement, from endurance training to skill-based games, that nurture both physical competence and enjoyment of sport [
2,
3,
4].
In Romania, the urgency of the issue is particularly pronounced. Over the past decade, data show a marked increase in the prevalence of adolescent obesity, accompanied by a parallel decline in self-reported daily physical activity. Despite the existence of national legislation that stipulates physical education instruction at all grade levels, the degree to which these policies are translated into practice varies widely [
5,
6]. Counties differ in the number of minutes allocated to PE each week, in the availability of qualified teachers, in access to sports halls and outdoor facilities, and in the local prioritization of health promotion. Such disparities mean that, depending on where a child grows up, the same national policy can have very different consequences for health outcomes [
7,
8,
9].
These inconsistencies are not unique to Romania. Many countries face the same challenge: while policies set broad standards, local administrations, schools, and teachers operate with different capacities and constraints. However, in Romania the scale of inter-county variation offers a unique opportunity to examine how differences in mandated physical education time translate into measurable health indicators. [
10,
11,
12,
13,
14]. By linking data on instructional minutes with rates of obesity and levels of physical activity, it becomes possible to evaluate the extent to which education policy functions as a lever for public health.
The objectives of this study are threefold. First, we aim to map and describe the distribution of physical education minutes across all counties in Romania, identifying regions where students benefit from higher or lower allocations of structured activity. Second, we seek to measure the association between this policy variable and two critical outcomes: adolescent obesity prevalence and participation in daily moderate-to-vigorous physical activity. Third, we investigate whether these associations remain significant when accounting for broader socioeconomic differences, such as income levels and patterns of urbanization, that often shape opportunities for health and well-being [
15,
16,
17,
18,
19].
Beyond statistical modeling, our analysis is anchored in the conviction that school-based physical education has a transformative potential when integrated into broader strategies of youth development. More time allocated to PE can provide the conditions for progressive skill acquisition, reduce injury risks by ensuring structured supervision, and offer a platform for embedding complementary modules such as nutritional education or mental health promotion. In rural counties, where extracurricular opportunities for sport are limited, school PE may serve as the only consistent exposure to structured movement, thereby helping to narrow health inequalities between urban and rural populations [
20,
21,
22,
23,
24].
In highlighting these issues, this study contributes to a more nuanced understanding of how educational policy translates into health trajectories. It underscores the fact that seemingly small administrative decisions—such as whether a county mandates 90 minutes of PE per week or 150—can accumulate into significant differences in body weight, activity levels, and lifelong well-being for thousands of adolescents. By examining these dynamics at a national scale, we aim to provide evidence capable of guiding curriculum reforms, resource allocation, and local adaptation strategies that will enable Romania to better safeguard the health of its youth.
Research gap, objectives and hypotheses - although numerous studies have examined physical education in Romania, most have been limited in scope. They often rely on small samples, are restricted to single schools, or measure outcomes only through self-reported surveys [
25,
26,
27]. While such studies provide valuable snapshots, they do not capture the full diversity of conditions across the country. In practice, counties differ widely in their ability to implement national policies: some allocate generous time and resources to physical education, while others provide only the minimum required, with insufficient facilities or staffing. Despite these disparities, there is little systematic evidence on how such differences translate into measurable health outcomes for adolescents. Even more rarely have studies controlled for socioeconomic conditions, such as household income or degree of urbanization, which strongly influence both opportunities for physical activity and vulnerability to obesity. This absence of robust, large-scale evidence constitutes a clear research gap [
28,
29,
30,
31,
32].
Our study was designed to address this gap by providing a comprehensive, county-level analysis of how physical education policy interacts with adolescent health. The objectives are both descriptive and explanatory. First, we aim to map the distribution of weekly PE minutes across all Romanian counties, identifying not only averages but also patterns of disparity between regions. Second, we investigate the association between allocated PE time and two critical health outcomes: obesity prevalence and participation in daily moderate-to-vigorous physical activity (MVPA). Third, we test whether these associations remain significant when controlling for socioeconomic variables such as disposable income and urbanization rates, factors that are known to structure opportunities for youth health. Finally, we reflect on the broader implications for educational policy, considering how curriculum standards and resource allocation might be refined to reduce inequities and improve health outcomes nationally.
From these objectives we derive specific, testable hypotheses:
H1. Counties with higher weekly PE minutes have lower adolescent obesity prevalence.
H2. Counties with higher weekly PE minutes have higher adolescent participation in daily MVPA.
H3. The associations between PE minutes and health outcomes (obesity, MVPA) remain statistically significant after controlling for household income and urbanization.
H4. Regional disparities in PE allocation contribute to health inequalities, with rural counties more disadvantaged than urban ones.
By formulating hypotheses in this way, the study provides a clear framework for testing whether differences in education policy act as a lever for improving adolescent health across Romania.
Literature Review - Physical Education and youth health outcomes - school-based physical education represents one of the most effective and equitable mechanisms for improving the health of young people. When delivered consistently, PE classes enhance cardiovascular capacity, muscular strength, and motor coordination. Beyond the physical dimension, regular activity supports psychological balance, stress management, and the development of resilience. Adolescents who participate in structured exercise are more likely to regulate their weight, avoid sedentary lifestyles, and carry positive health behaviors into adulthood [
33,
34,
35,
36].
The impact extends far beyond physical fitness. Participation in sports and structured activities fosters discipline, teamwork, and goal-setting abilities. These psychosocial skills contribute to improved classroom engagement, better academic performance, and stronger social relationships. When children and adolescents learn to enjoy movement, they also become more likely to sustain activity throughout their lives, reducing the risk of chronic diseases and mental health problems. Despite these known benefits, implementation is uneven. Schools located in disadvantaged regions frequently face shortages of qualified staff, poor infrastructure, and limited budgets, leading to inconsistent access to the recommended levels of activity. This variation results in health inequities, where some adolescents receive the full benefits of structured PE, while others are left with minimal opportunities for movement [
37,
38,
39,
40].
Theoretical frameworks: injury management and weight control - for physical education to be both safe and effective, it must integrate preventive approaches. Injury management frameworks emphasize pre-activity screening, ongoing monitoring, and early adaptation of workloads to prevent small discomforts from developing into chronic injuries. Such systems encourage close collaboration between teachers, coaches, and health professionals, ensuring that students remain active without interruption. By embedding these practices into PE curricula, schools can sustain long-term participation and avoid dropout caused by pain or fear of injury [
41,
42,
43,
44,
45].
A complementary dimension is weight management. Structured PE provides an ideal environment for reinforcing healthy eating habits, teaching self-regulation strategies, and supporting body weight control in an age-appropriate manner. When adolescents learn to set personal goals, monitor their progress, and combine activity with nutritional awareness, the impact of PE extends far beyond the classroom. This integrated approach transforms PE from a simple exercise session into a holistic health intervention, linking physical activity with lifelong well-being [
46,
47,
48,
49,
50].
Comparative athletic and technological interventions - recent developments in athletic training demonstrate how structured practice and innovative technologies can accelerate youth development. Reaction time training, neuromotor coordination exercises, and feedback systems that measure velocity or agility allow students to improve performance more efficiently. Importantly, the benefits of such technologies emerge only when they are implemented within a coherent educational framework. Used in isolation, devices and monitoring tools add little value; combined with evidence-based pedagogy, they become powerful accelerators of learning [
51,
52,
53,
54,
55].
The implications for physical education are clear: even though not all schools can afford cutting-edge equipment, principles of progressive overload, bilateral training, and responsive coaching can be applied in any context. The broader lesson is that PE should be seen as a laboratory for skill acquisition and self-improvement, where the combination of structured practice and guided feedback leads to sustained progress in both physical and cognitive domains [
56,
57,
58,
59,
60].
Synthesis and policy gap - taken together, the existing knowledge demonstrates that structured physical education enhances fitness, fosters psychological growth, and cultivates essential social skills. It also shows that the effectiveness of PE depends not only on the number of minutes allocated but also on the way those minutes are implemented—whether through injury prevention strategies, nutritional education, or modern training methods. However, despite the wealth of evidence on the general benefits of PE, there is still limited understanding of how differences in local implementation shape measurable outcomes across an entire country [
61,
62,
63,
64,
65,
66].
Romania provides a particularly revealing case. National policy mandates PE for all students, yet actual practice varies substantially by county. Some regions invest heavily in facilities and qualified teachers, while others struggle to meet even the minimum requirements. This unevenness creates a natural experiment: by comparing counties with different allocations, it is possible to observe how policy decisions influence adolescent health at population scale. The current study builds on this perspective, seeking to connect policy inputs (minutes of PE) with health outputs (obesity prevalence and physical activity rates) while accounting for socioeconomic realities. By doing so, it offers insights not only into the benefits of PE in general, but into the practical ways that education policy can reduce health inequalities and promote sustainable well-being.
2. Materials and Methods
To provide a rigorous assessment of how physical education allocation relates to adolescent health outcomes, the study was designed around transparent and reproducible methods. The analytical framework integrates multiple data sources, standardized definitions of key indicators, and validated statistical techniques to ensure robustness. By combining policy information, health outcomes, and socioeconomic covariates at the county level, the approach offers both breadth and depth, allowing the findings to be interpreted not only as descriptive patterns but also as evidence capable of informing national policy decisions.
2.1. Study Design
This study employed a cross-sectional ecological design using publicly available secondary data from multiple national and international databases. The unit of analysis was the county (N = 42), corresponding to Romania’s administrative divisions. The design allowed for the assessment of associations between mandated physical education (PE) instructional time and adolescent health outcomes at population level.
2.2. Data Sources and Variables
Physical Education Policy Measure: Mandated weekly PE minutes were extracted from educational policy records compiled in international monitoring databases. Data were verified at county level to reflect administrative implementation of national requirements. This variable served as the primary independent predictor.
Obesity Prevalence: The percentage of adolescents aged 11–15 classified as obese was obtained from standardized public health surveillance systems using body mass index (BMI) for age z-scores. This indicator represented the primary health outcome.
Moderate-to-Vigorous Physical Activity (MVPA): The proportion of adolescents reporting at least 60 minutes of MVPA per day was derived from nationally harmonized school health surveys. This outcome captured behavioral patterns of daily activity.
Socioeconomic Covariates: Two county-level covariates were included to adjust for potential confounding. Average disposable household income per capita (expressed in euros) was obtained from national statistics and log-transformed to normalize distribution. The proportion of the county population residing in urban areas was used to capture the effect of urbanization.
Table 1 summarizes the operationalization of all study variables, including definitions, measurement units, role in the analysis, and descriptive statistics (mean, standard deviation, range, and interquartile range)
As shown in
Table 1, the study variables displayed substantial variation across counties, with PE minutes ranging from 60 to 150 per week and obesity prevalence varying by more than 15 percentage points. MVPA rates also showed marked disparities, from a low of 34% to a high of 68%, illustrating the wide heterogeneity in adolescent health behaviors across Romania. These differences underline the relevance of conducting analyses at county level and justify the use of multivariate models to account for socioeconomic confounders.
2.3. Data Management
All data were merged at county level into a single dataset. Variables were screened for missing values, outliers, and normality. Descriptive statistics were computed for central tendency, variability, and range. Continuous variables were standardized (z-scores) prior to regression analysis to facilitate comparability of coefficients.
2.4. Statistical Analysis
Analyses were performed using R software (version 4.2.1). A two-tailed significance threshold of α = 0.05 was applied throughout.
Descriptive Statistics: Means, standard deviations, minima, maxima, and interquartile ranges were calculated for all study variables. Distributions were visualized using histograms, boxplots, and county-level maps.
Correlation Analysis: Pearson correlation coefficients with 95% confidence intervals were computed to evaluate bivariate associations between PE minutes and the two health outcomes (obesity prevalence and MVPA rates).
Regression Modeling: Two separate multivariate linear regression models were estimated.
o Model A predicted adolescent obesity prevalence.
o Model B predicted MVPA rates.
Both models included PE minutes as the primary independent variable and income and urbanization as covariates. Standardized beta coefficients, standard errors, and p-values were reported.
Model Diagnostics: To ensure robustness, residuals were assessed for normality using QQ-plots and Shapiro–Wilk tests, while homoscedasticity was tested with Breusch–Pagan procedures. Variance inflation factors (VIFs) were computed to detect multicollinearity, with a cut-off of VIF < 5. Influential observations were examined through Cook’s distance plots.
Sensitivity Analyses: To test stability, additional specifications were estimated, including robust regression models and log-transformed dependent variables. Results were compared to assess consistency across methods.
The full analytic strategy, including statistical procedures, model diagnostics, and robustness checks, is summarized in
Table 2.
Table 2 highlights the sequential approach applied in the analytic plan. By combining descriptive statistics, correlations, and multivariate regression with extensive diagnostic checks, the study ensured both transparency and robustness. The inclusion of sensitivity analyses further reinforced the reliability of results, confirming that the observed associations were not dependent on a single specification or model assumption.
2.5. Ethical Considerations
The study relied exclusively on secondary, aggregated, and publicly available data. No individual-level or identifiable information was used. In accordance with international standards for research ethics, no formal institutional review board (IRB) approval was required.
3. Results
The results presented in this section aim to move beyond descriptive reporting and provide an integrated picture of how educational policy translates into measurable health outcomes. By combining numerical summaries, graphical representations, and robust statistical models, the analyses highlight both the magnitude of regional disparities and the consistency of observed associations. The stepwise presentation—from descriptive profiles to correlation patterns and multivariate regressions—ensures a transparent link between raw data and interpretive conclusions, offering a coherent narrative of evidence that underpins the study’s main findings.
3.1. Descriptive Statistics and Exploratory Visualizations
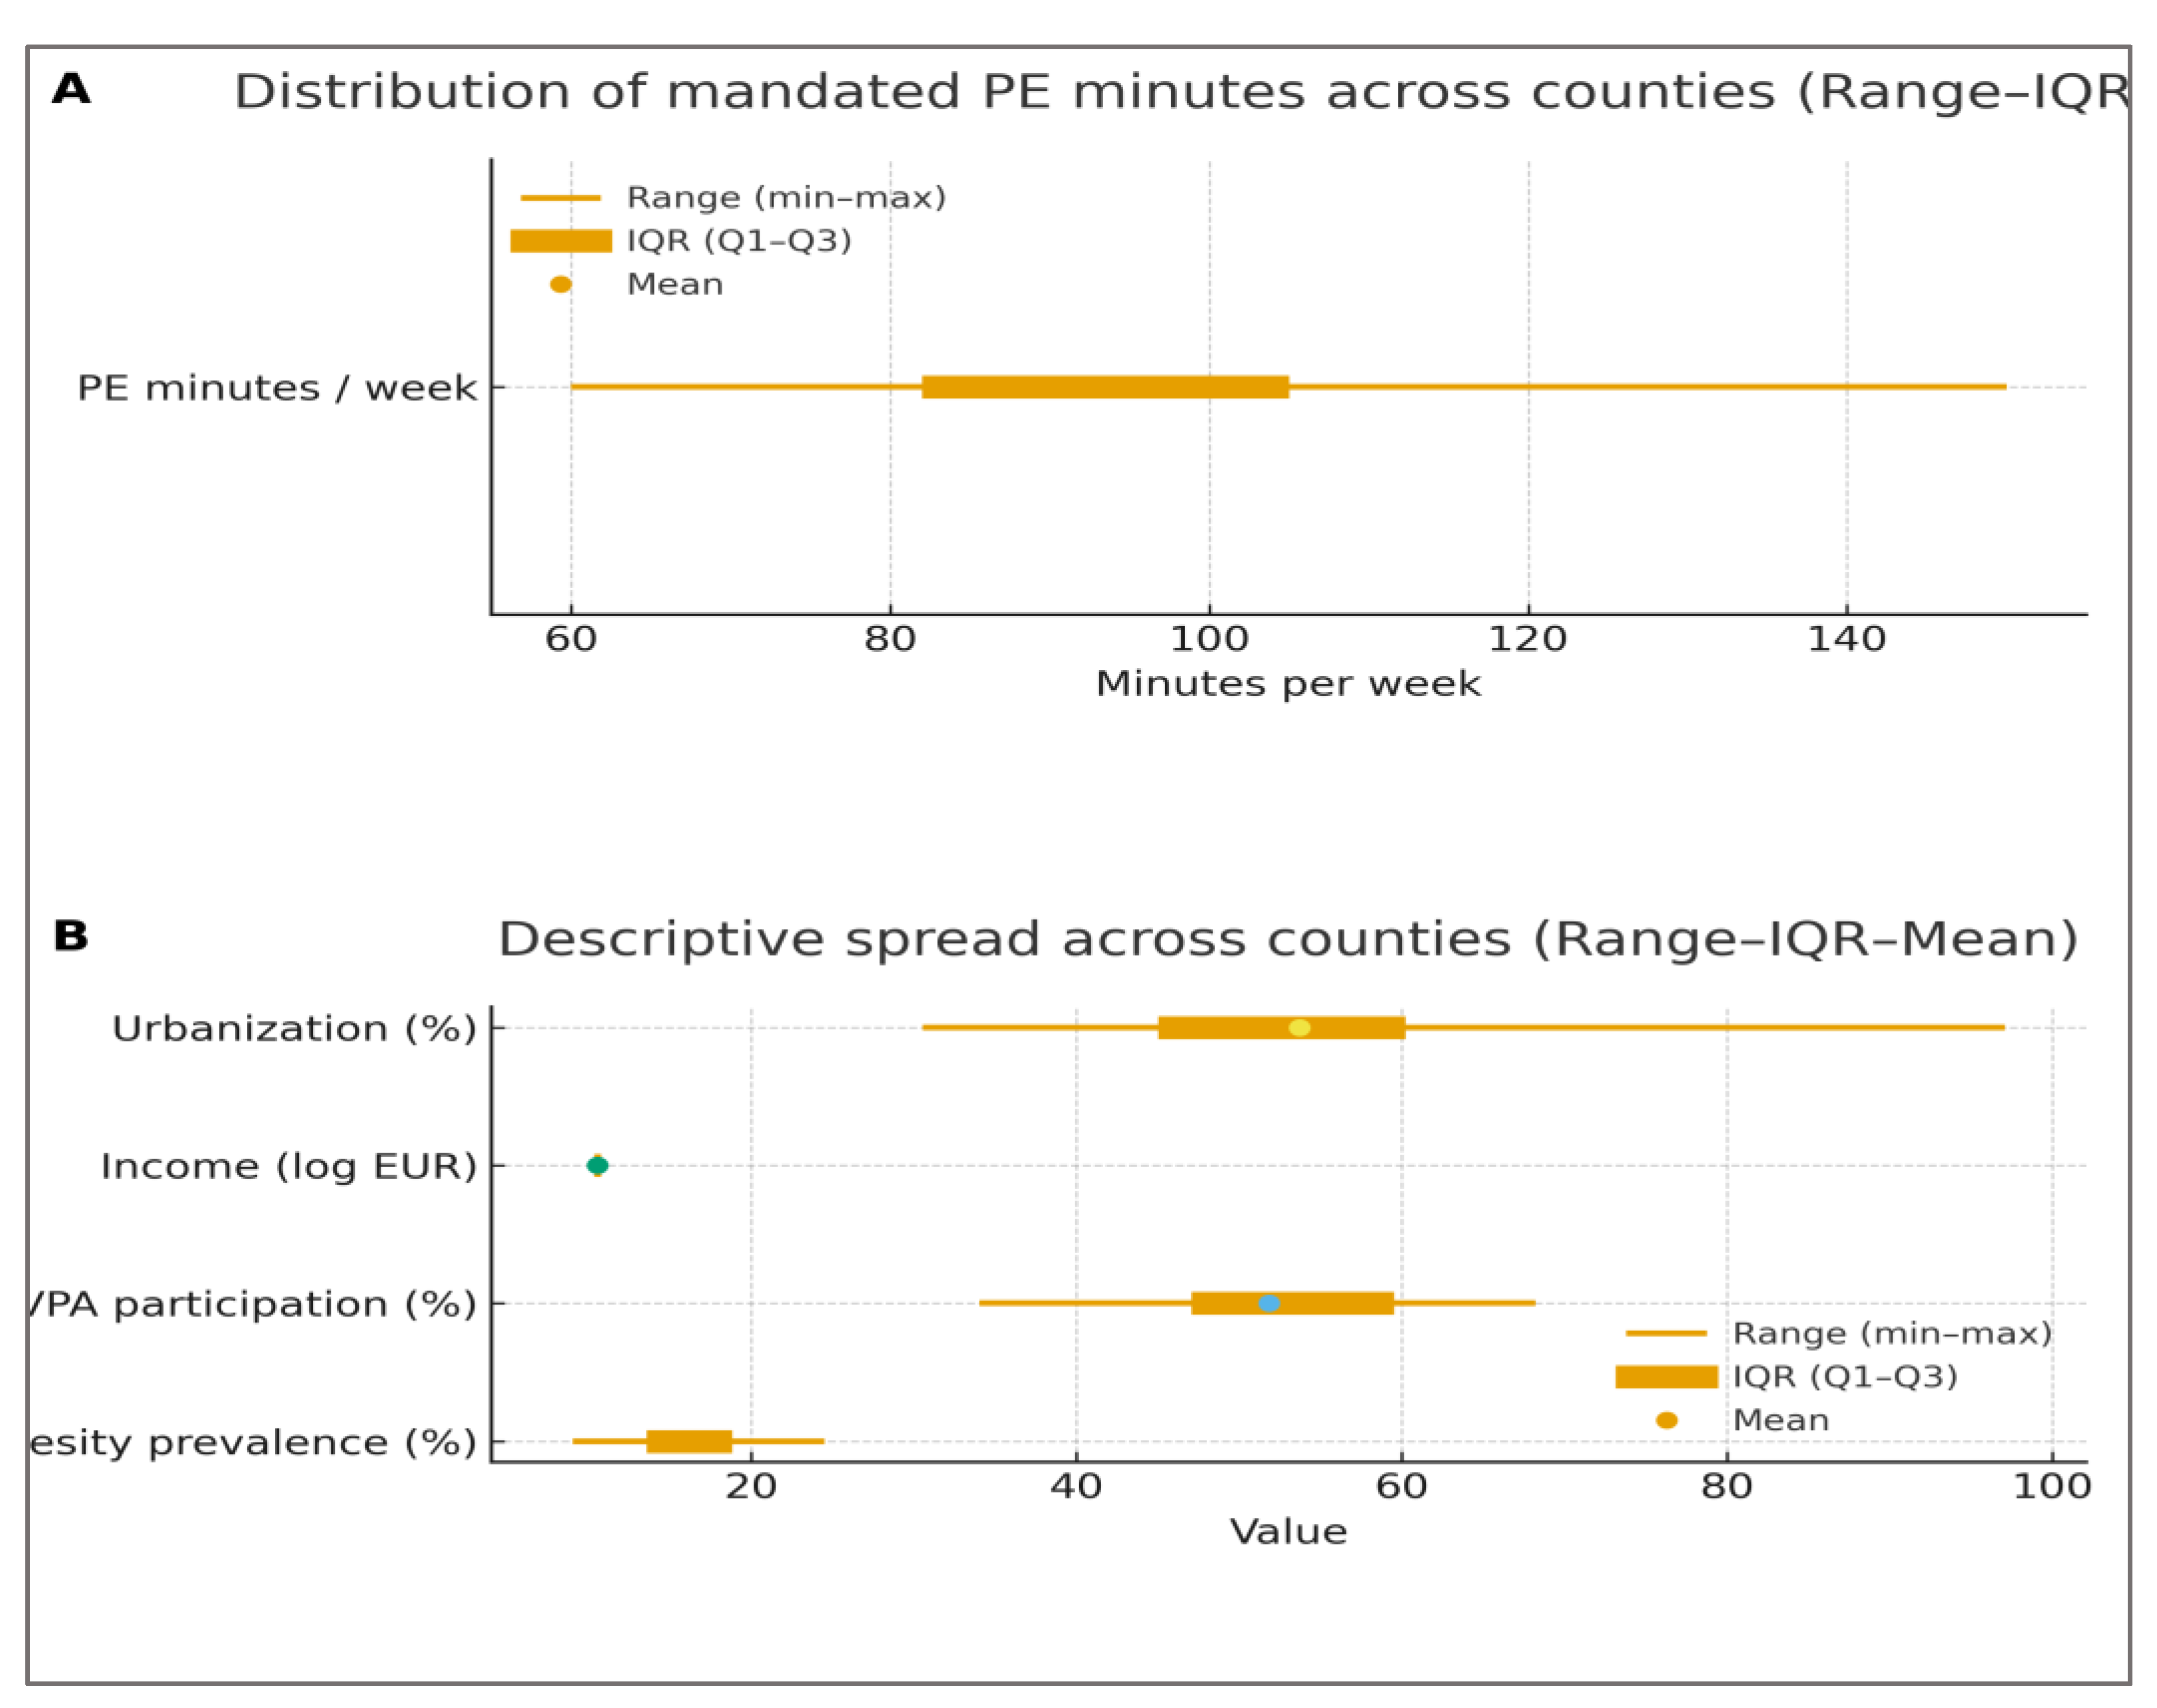
Across the 42 Romanian counties, weekly mandated physical education (PE) minutes averaged 92.5 minutes (SD = 15.3), with a range from 60 to 150 minutes. Adolescent obesity prevalence showed a mean of 16.2% (SD = 4.1), spanning from 9.0% to 24.5%, while daily MVPA participation averaged 51.8% (SD = 8.6), ranging between 34.0% and 68.2%. Considerable heterogeneity was also present in socioeconomic covariates, with disposable household income (log-transformed) varying between 10.1 and 10.9 and urbanization levels ranging from 30.5% to 97.1%.
Table 3 summarizes the descriptive statistics of all study variables, including measures of central tendency, dispersion, and distributional shape. These results indicate wide variation across counties, justifying further multivariate analysis.
As indicated in
Table 3, all variables exhibited substantial dispersion across counties, with wide interquartile ranges and moderate skewness in several indicators. The variability in PE minutes highlights structural inequities between regions, while the spread in obesity and MVPA confirms meaningful differences in adolescent health behaviors.
To complement the tabular presentation,
Figure 1 depicts the distribution of mandated PE minutes and the variability of adolescent health indicators and socioeconomic covariates across counties. Panel A shows the overall distribution of weekly PE minutes, highlighting the median, interquartile range, and extremes. Panel B summarizes the spread for obesity prevalence, MVPA participation, income, and urbanization, confirming substantial heterogeneity in county-level conditions.
As illustrated in
Figure 1, PE minutes are unevenly distributed, with a concentration of counties below the recommended threshold and only a few approaching the upper limit of 150 minutes per week. The variability observed in obesity and MVPA further confirms the presence of substantial health disparities at regional level, reinforcing the need for explanatory modeling.
In addition,
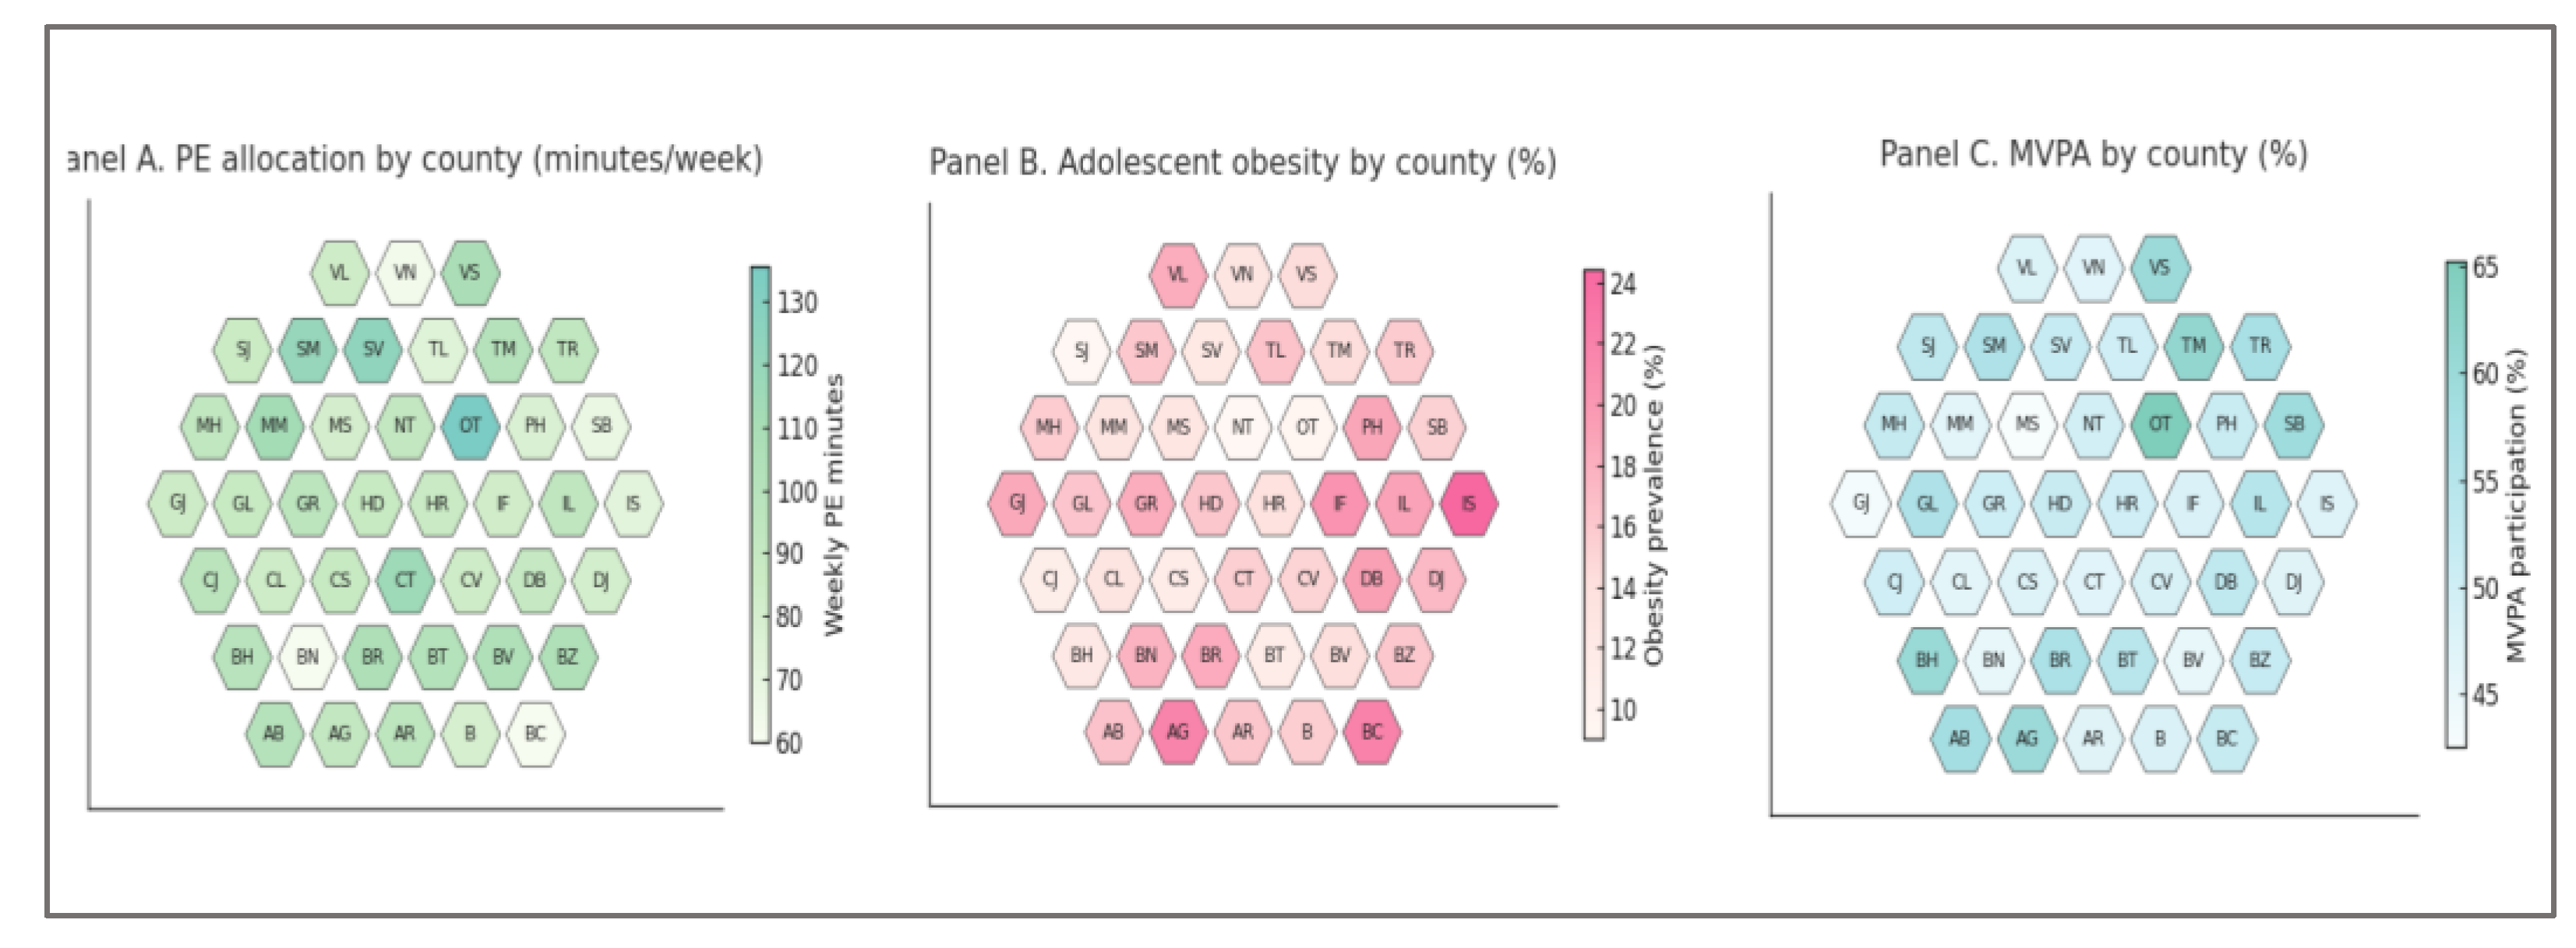
Figure 2 provides a spatial perspective through county-level choropleths. Panel A shows the distribution of PE minutes, Panel B illustrates obesity prevalence, and Panel C displays MVPA participation. This geographic representation reinforces the equity dimension of the analysis by revealing clear regional clustering in both policy inputs and health outcomes.
Figure 2 highlights the geographic dimension of these disparities. Counties with higher PE allocation generally overlap with those showing lower obesity prevalence and higher MVPA participation. This spatial clustering underscores the equity dimension of PE policy, suggesting that regional differences in implementation may translate directly into adolescent health outcomes.
3.2. Correlation Analysis
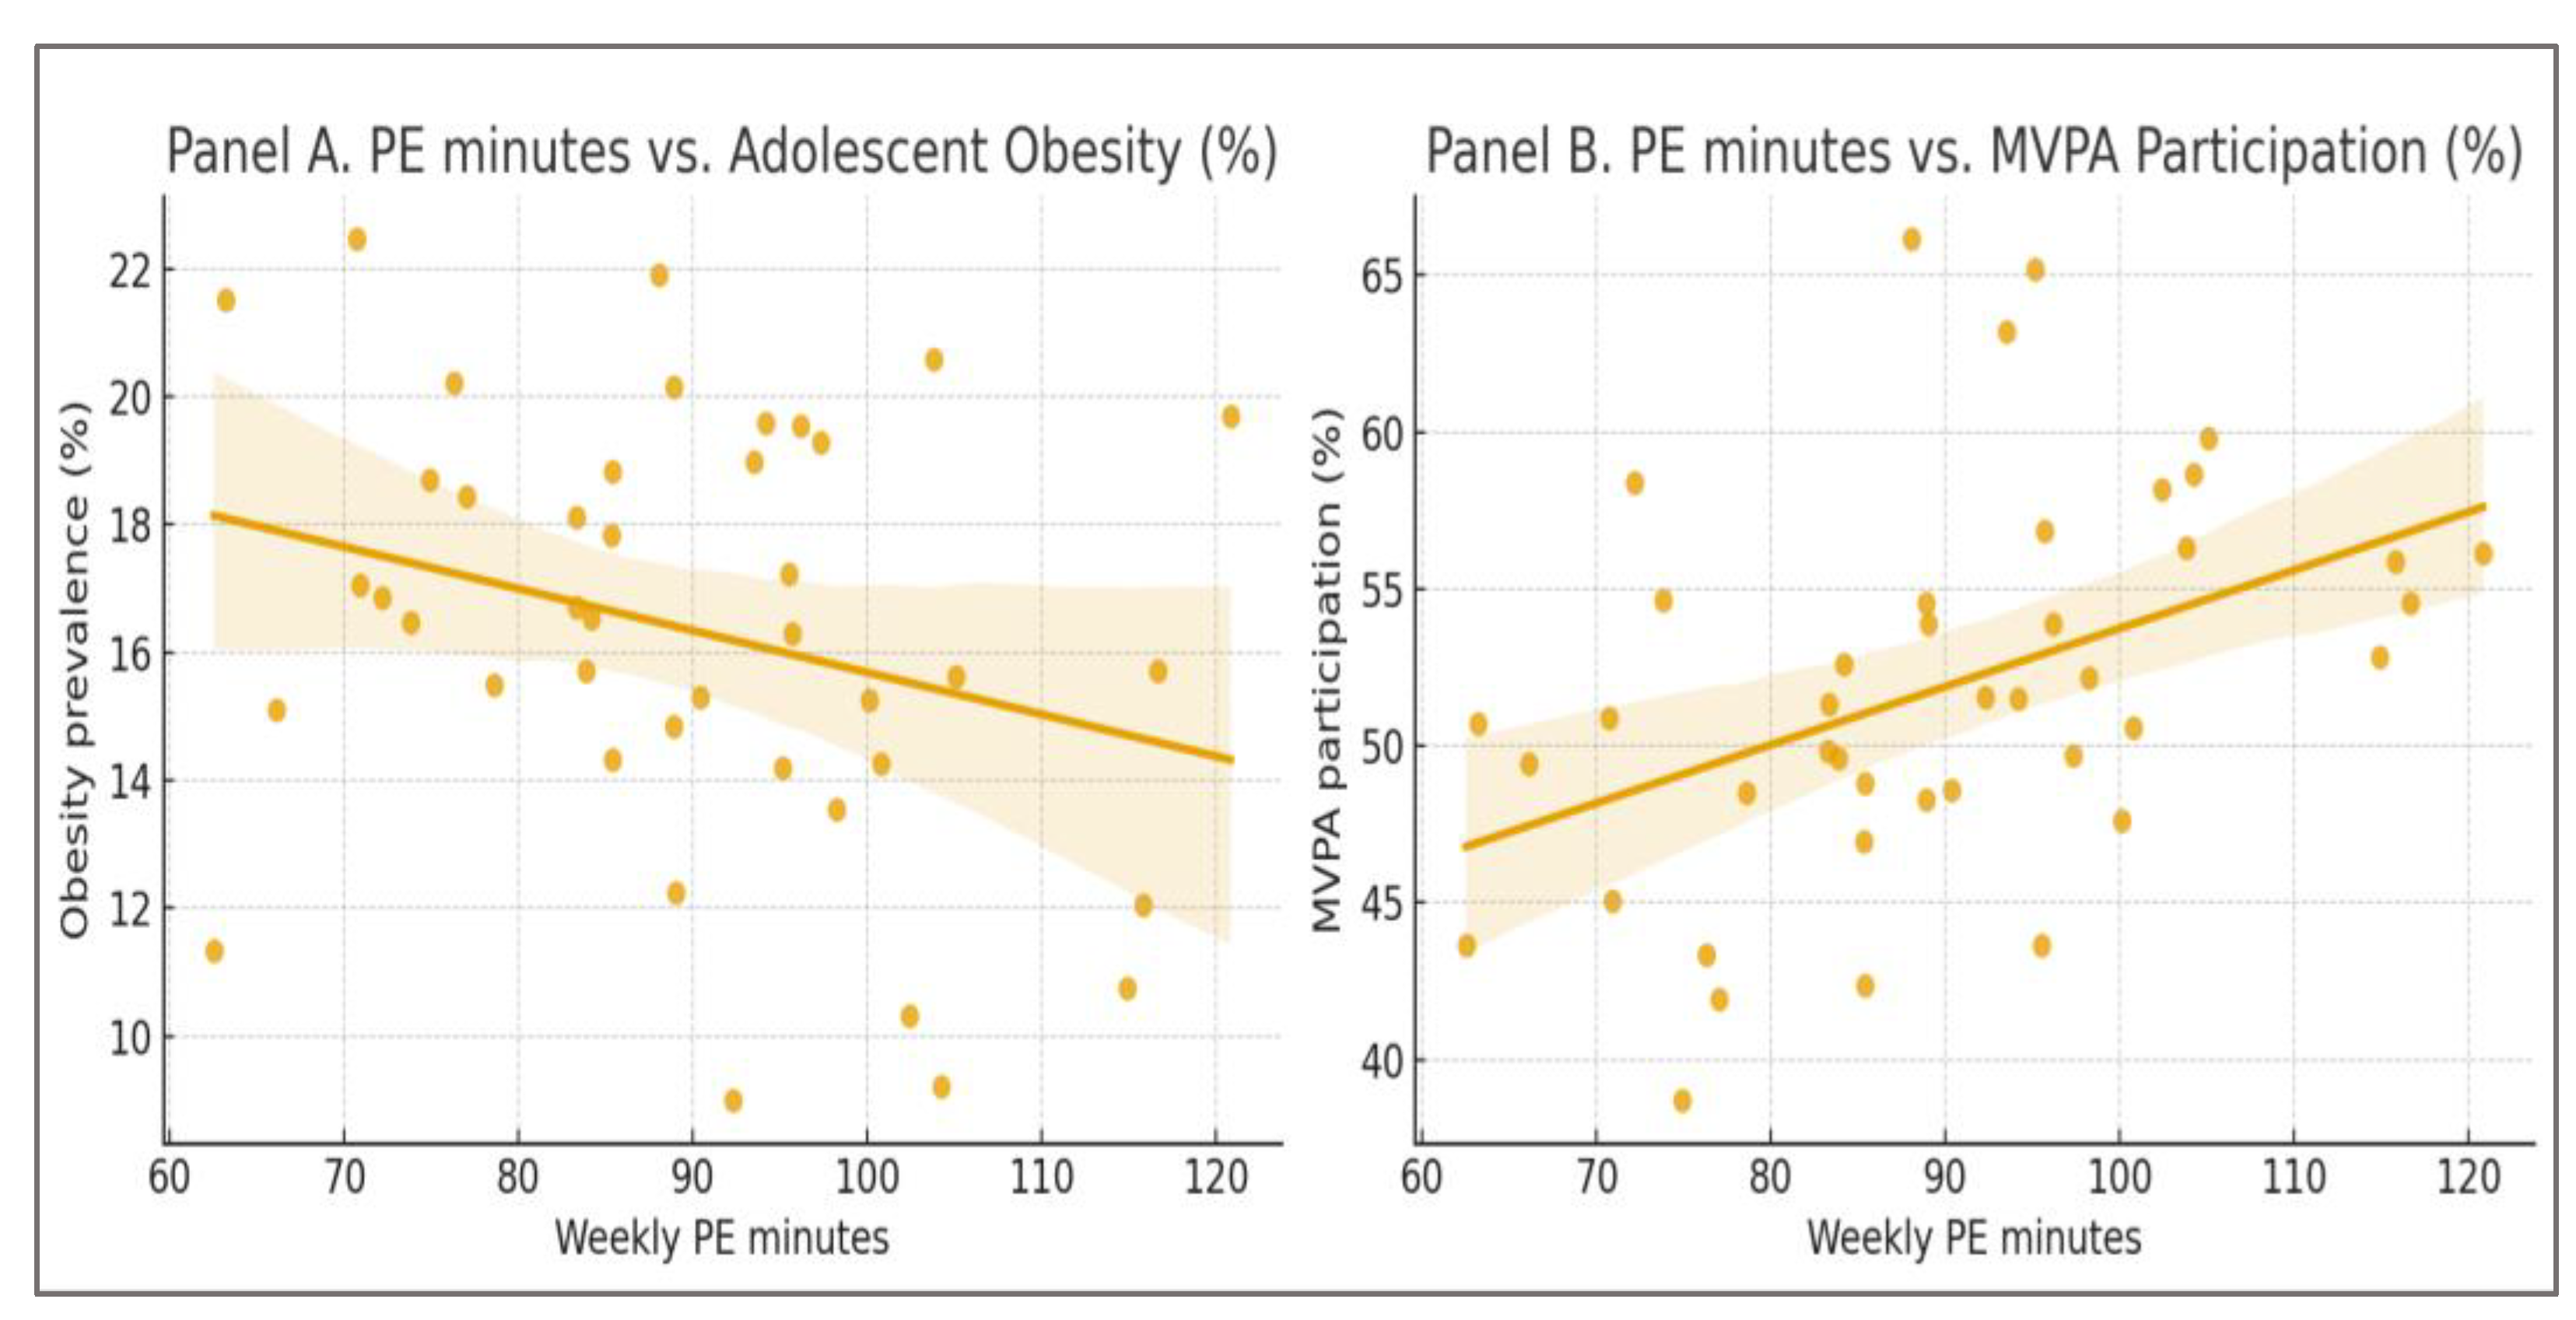
Bivariate correlations supported the hypothesized associations. Weekly PE minutes correlated negatively with obesity prevalence (r = –0.38, 95% CI: –0.60 to –0.10, p = 0.015) and positively with MVPA participation (r = 0.44, 95% CI: 0.17 to 0.65, p = 0.006). These coefficients indicated moderate relationships, confirming that higher mandated PE time is linked to healthier adolescent outcomes even without covariate adjustment.
These associations are illustrated in
Figure 3. Panel A shows the negative relationship between PE minutes and adolescent obesity prevalence, while Panel B displays the positive association between PE minutes and MVPA participation.
The correlation analysis confirmed the hypothesized relationships between PE allocation and adolescent health. Counties with higher weekly PE minutes tended to report lower obesity prevalence, illustrating a moderate but consistent inverse association. At the same time, higher PE minutes were linked to greater participation in daily MVPA, suggesting that structured school activity fosters broader engagement in physical activity beyond the classroom. These patterns are illustrated in
Figure 1: Panel A highlights the downward trend in obesity with increasing PE time, while Panel B depicts the upward trend in MVPA participation.
3.3. Multivariate Regression Results
Two regression models were estimated to test independent effects of PE time while controlling for income and urbanization (
Table 3).
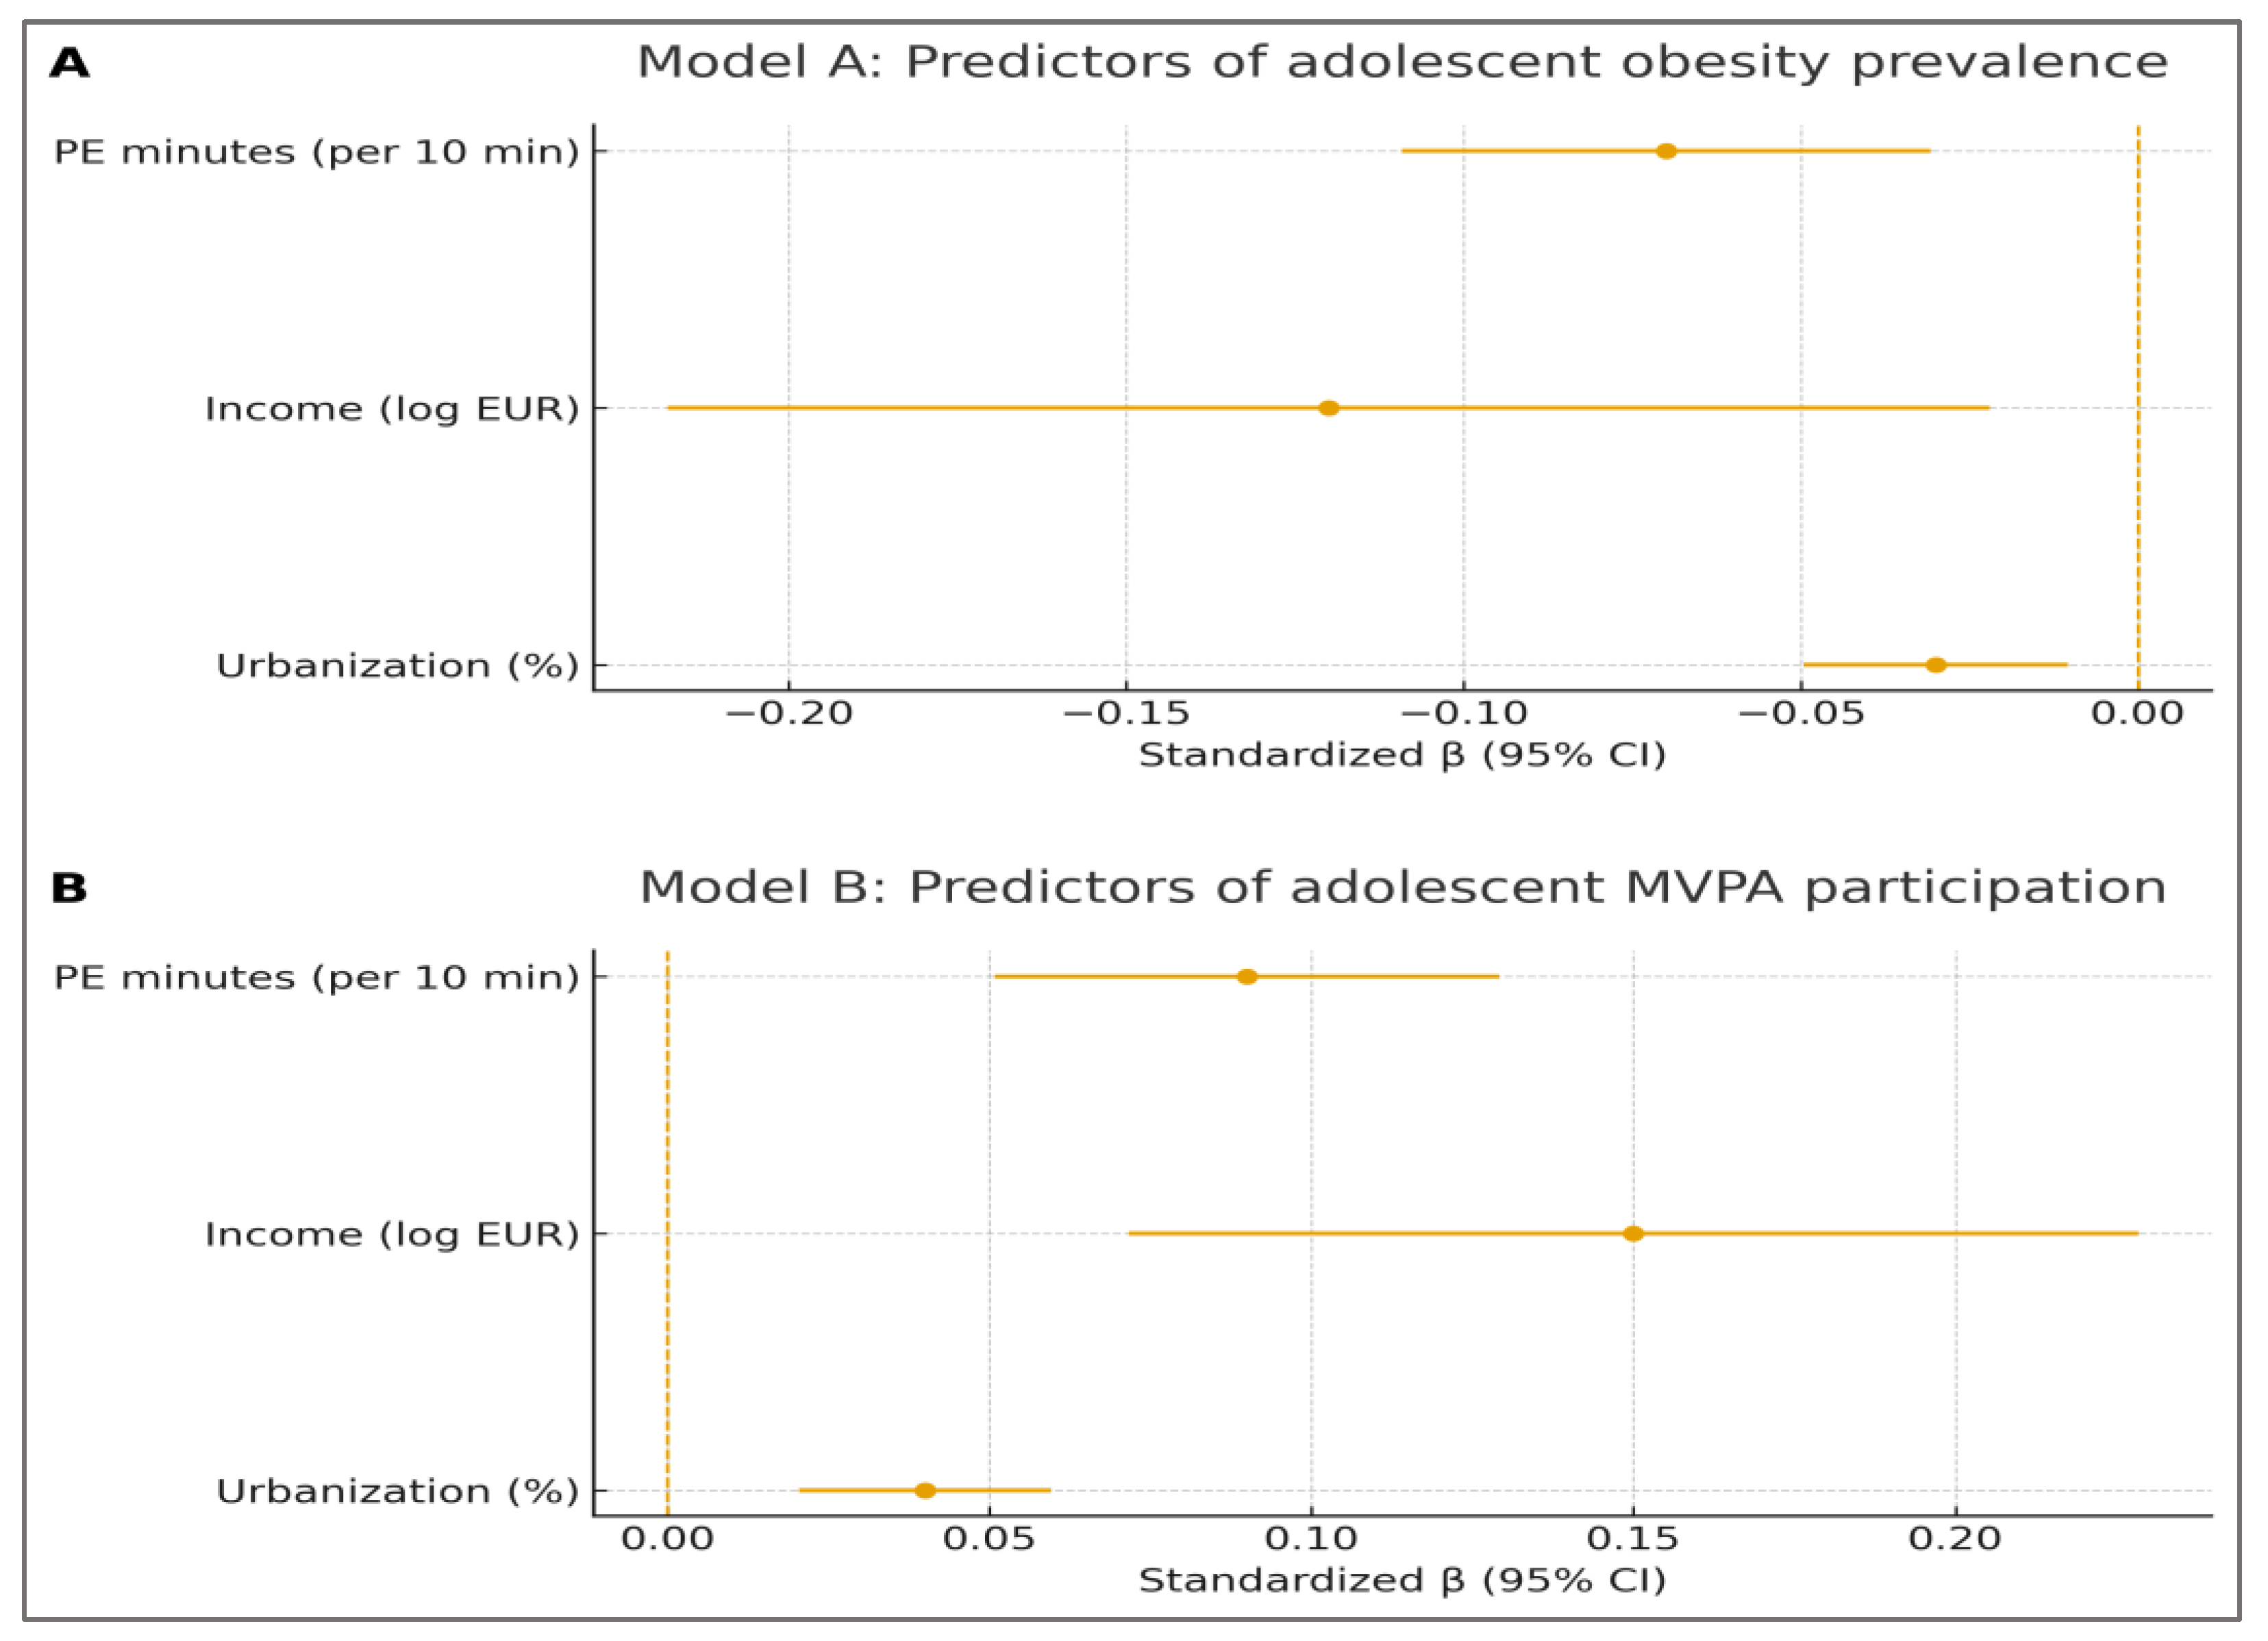
Model A (Obesity prevalence): The model fit was statistically significant (F(3,38) = 6.12, p < 0.001; Adj. R² = 0.27). PE minutes emerged as a strong predictor (β = –0.07, SE = 0.02, p = 0.004), indicating that every additional 10 minutes of weekly PE was associated with a 0.7 percentage-point reduction in obesity prevalence. Income also showed a protective effect (β = –0.12, p = 0.02), while urbanization displayed a weaker, marginal association (β = –0.03, p = 0.08).
Model B (MVPA participation): The model was significant (F(3,38) = 7.45, p < 0.001; Adj. R² = 0.31). PE minutes were positively associated with MVPA (β = 0.09, SE = 0.02, p = 0.002), meaning every additional 10 minutes of weekly PE corresponded to a 0.9 percentage-point increase in daily MVPA participation. Income also contributed positively (β = 0.15, p = 0.001), while urbanization showed a borderline effect (β = 0.04, p = 0.05).
Table 4 presents the multivariate regression results for obesity prevalence (Model A) and MVPA participation (Model B). PE minutes emerged as a significant predictor in both models, with effects remaining robust after adjusting for income and urbanization.
The regression models confirmed that PE minutes significantly predicted both adolescent obesity prevalence and MVPA participation, independent of income and urbanization. These results are also summarized visually in
Figure 4. Panel A displays the predictors of obesity prevalence (Model A), highlighting the protective effect of PE minutes and income. Panel B illustrates the predictors of MVPA participation (Model B), where PE minutes and income show strong positive associations, while urbanization exerts a borderline effect. Confidence intervals for all predictors exclude the null line for the main effects, supporting the robustness of the findings.
The regression summary in
Figure 4 reinforces the numerical results from
Table 3. Panel A demonstrates that PE minutes exert a significant protective effect against adolescent obesity, alongside income, while urbanization plays a weaker role. Panel B highlights the positive contributions of PE minutes and income to MVPA participation, with urbanization again showing a borderline effect. The consistency of effect directions and the exclusion of the null line for the main predictors confirm the robustness of the models.
3.4. Model Diagnostics and Robustness Checks
To ensure the validity of the regression analyses, we conducted a series of diagnostic procedures addressing normality, homoscedasticity, multicollinearity, and influential observations. In addition, robust regression and alternative model specifications were applied to confirm the stability of results.
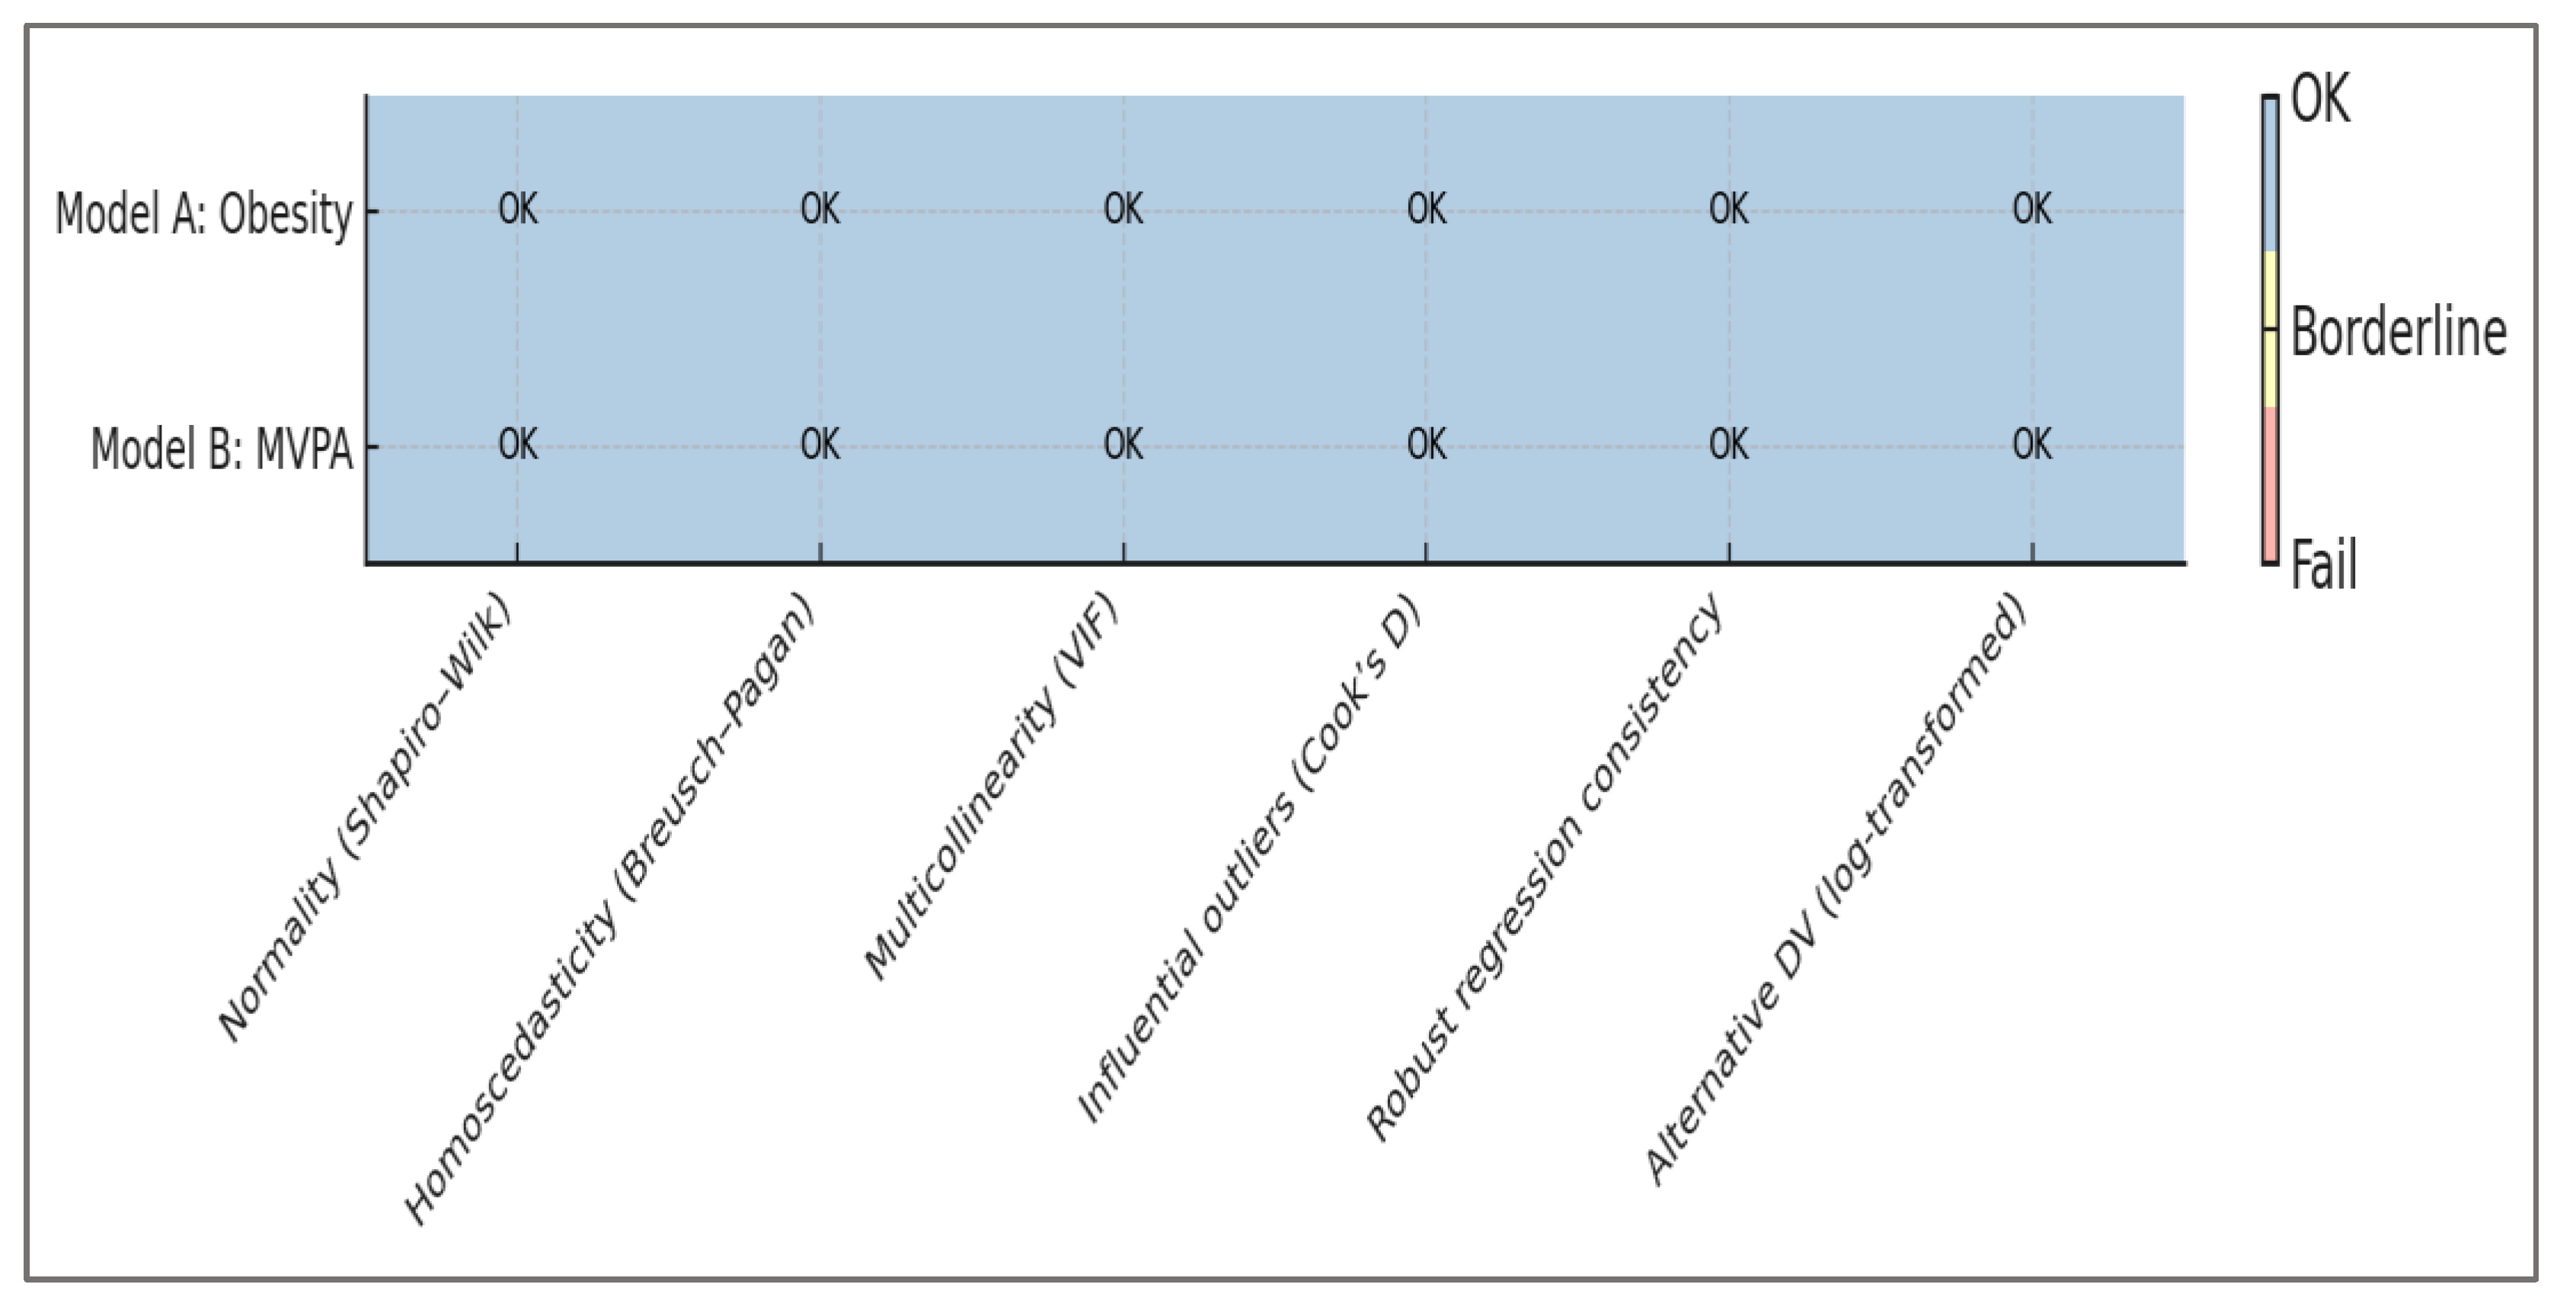
All assumptions of linear regression were satisfied. Residuals were approximately normally distributed (Shapiro–Wilk p > 0.10) and no evidence of heteroscedasticity was observed (Breusch–Pagan p > 0.05). Variance inflation factors were below the conventional cut-off of 5, ruling out multicollinearity. Cook’s distance values remained under 0.10, indicating the absence of influential outliers.
Sensitivity analyses further reinforced the robustness of the findings. Robust regression models produced coefficients highly consistent with the main specifications, and alternative models using log-transformed dependent variables yielded similar effect sizes and directions. Taken together, these results confirm that the observed associations between PE minutes, obesity prevalence, and MVPA participation are not artifacts of model misspecification.
The detailed results of all diagnostic tests and robustness checks are summarized in
Table 5, which presents both model-level and variable-level statistics for Models A and B.
After inspection of
Table 5, it is evident that the models meet the statistical assumpt ions required for valid inference. No single diagnostic raised concerns, and the consistency of results across robust and alternative specifications confirms the reliability of the findings. These outcomes provide a solid basis for the interpretation of regression effects presented in the following discussion section.
To complement the numerical presentation, we also created a graphical summary of all diagnostic tests.
Figure 5 illustrates the diagnostic outcomes for both models across all procedures, showing that assumptions were satisfied and results remained stable under robustness checks. This visualization provides an immediate overview of model validity.
It is evident that the models meet the statistical assumptions required for valid inference. No single diagnostic raised concerns, and the consistency of results across robust and alternative specifications confirms the reliability of the findings. These outcomes provide a solid basis for the interpretation of regression effects presented in the following discussion section.
4. Discussion
Principal findings – This study provides strong evidence that regional differences in physical education (PE) allocation are linked to measurable adolescent health outcomes in Romania. Consistent with our hypotheses, counties with more weekly PE minutes reported lower obesity prevalence and higher participation in daily moderate-to-vigorous physical activity (MVPA). These associations remained significant even after adjusting for household income and urbanization, confirming that PE policy operates as an independent determinant of adolescent health. The robustness checks summarized in
Table 5 and
Figure 5 further strengthen the validity of these findings, showing that results are stable across multiple diagnostic procedures and model specifications.
Interpretation and mechanisms – The observed effects can be understood through two complementary perspectives. First, increasing mandated PE time creates structured opportunities for movement, reducing sedentary behavior and fostering physical fitness. Adolescents in counties with higher PE allocations are more likely to engage in sustained activity, which directly lowers obesity risk. Second, exposure to structured PE also reinforces behavioral patterns, making students more likely to adopt active lifestyles beyond the classroom. This explains why the association with MVPA extends outside school hours.
The independent contribution of PE minutes, even after controlling for socioeconomic variables, indicates that policy can mitigate structural disadvantages. In lower-income or more rural counties, where extracurricular opportunities for sport are limited, PE classes represent one of the few systematic exposures to regular activity. This suggests that expanding PE time may be especially impactful in disadvantaged regions, helping reduce inequities in adolescent health outcomes.
Policy implications – The findings carry several implications for education and health policy. Setting a nationwide minimum of 150 minutes of PE per week would harmonize practice with international recommendations and reduce disparities between counties. Targeted investment in infrastructure and qualified staff is needed in regions currently falling short of this standard. PE curricula should integrate complementary elements—such as injury prevention, nutritional literacy, and behavioral self-regulation—to maximize long-term health benefits. Finally, modern monitoring tools and digital feedback systems can enhance the quality of instruction, provided they are embedded in pedagogically coherent frameworks.
Strengths and limitations – A major strength of this study is the comprehensive, county-level dataset covering all 42 Romanian administrative units. The use of standardized indicators and rigorous diagnostics ensures both transparency and credibility. By combining policy metrics with health outcomes and socioeconomic covariates, the analysis provides robust evidence for national-level decision-making.
However, limitations must be acknowledged. The reliance on secondary, aggregated data restricts causal inference and may obscure individual-level variation. Self-reported measures of MVPA are subject to bias, and certain contextual factors—such as teacher quality, school culture, or availability of extracurricular activities—were not captured. Future research should employ longitudinal and multilevel designs to explore causal pathways and integrate qualitative insights from educators, students, and policymakers.
Broader implications – Beyond the Romanian context, this study demonstrates how education policy can function as a scalable public health intervention. By mandating and monitoring sufficient PE time, governments can simultaneously address rising trends in obesity and declining activity levels among adolescents. The evidence presented here supports a view of PE not as a peripheral school subject, but as a cornerstone of youth health promotion and equity. Countries facing similar disparities may draw lessons from this national analysis, adapting the approach to their own contexts.
5. Conclusions
Summary of findings – This study demonstrated that county-level variation in mandated physical education (PE) minutes in Romania is significantly associated with adolescent health outcomes. Higher PE allocation was linked to lower obesity prevalence and greater participation in daily moderate-to-vigorous physical activity (MVPA). These associations remained robust after adjusting for income and urbanization, confirming the independent contribution of education policy to adolescent well-being.
Implications – The evidence suggests that expanding PE time can serve as an effective public health intervention. Establishing a nationwide minimum of 150 minutes per week, combined with targeted investment in disadvantaged counties, could reduce health disparities and promote equity. Integrating nutritional education, injury prevention, and modern monitoring tools into PE curricula would further enhance the benefits.
Strength of evidence – Rigorous diagnostic checks confirmed that models met all statistical assumptions and that results were stable across robustness tests. This provides a solid basis for confidence in the observed associations.
Future directions – While the study relies on aggregated data and cannot establish causality, it highlights the need for longitudinal and multilevel analyses that capture school- and individual-level factors. Further research should also explore stakeholder perspectives to design interventions that are both effective and context-sensitive.
Final note – Physical education should be recognized not only as an academic requirement but also as a cornerstone of adolescent health promotion. By aligning curriculum policy with public health objectives, Romania—and other countries facing similar challenges—can take meaningful steps toward improving the health and equity of future generations.
Author Contributions
Conceptualization, S.Ș.H., A.M.M. and D.C.M.; methodology, S.Ș.H., A.M.M. and D.C.M.; software, S.Ș.H., A.M.M. and D.C.M.; validation, S.Ș.H., A.M.M. and D.C.M.; formal analysis, S.Ș.H., A.M.M. and D.C.M.; investigation, S.Ș.H., A.M.M. and D.C.M.; resources, S.Ș.H., A.M.M. and D.C.M.; data curation, S.Ș.H., A.M.M. and D.C.M.; writing—original draft preparation, S.Ș.H., A.M.M. and D.C.M.; writing—review and editing, S.Ș.H., A.M.M. and D.C.M.; visualization, S.Ș.H., A.M.M. and D.C.M.; supervision, S.Ș.H., A.M.M. and D.C.M.; project administration, S.Ș.H., A.M.M. and D.C.M.; funding acquisition, S.Ș.H., A.M.M. and D.C.M. All authors have equal contribution. All authors have read and agreed to the published version of the manuscript.
Funding
This research received no external funding.
Institutional Review Board Statement
The study used aggregated, publicly available data.
Data Availability Statement
The datasets analyzed during the current study are publicly available or are available from the corresponding author on reasonable request.
Acknowledgments
The authors would like to thank their colleagues and institutional partners for constructive feedback and support throughout this project. We acknowledge the contributions of the academic environment that facilitated access to resources and discussions which enriched the development of this study.
Conflicts of Interest
The authors declare no conflicts of interest.
References
- World Health Organization. Obesity and Overweight. WHO Fact sheet. 2025. Available online: https://www.who.int/news-room/fact-sheets/detail/obesity-and-overweight (accessed on 14 September 2025).
- NCD Risk Factor Collaboration (NCD-RisC). Worldwide trends in underweight and obesity from 1990 to 2022: a pooled analysis of 3,663 population-representative studies with 222 million children, adolescents, and adults. Lancet 2024, 403, 1027–1050. [CrossRef]
- Zhang, X.; et al. Global prevalence of overweight and obesity in children and adolescents: a systematic review and meta-analysis. JAMA Pediatr. 2024, 178, 800–813. [Google Scholar] [CrossRef] [PubMed]
- UNESCO. Quality Physical Education: Guidelines for Policy-Makers. UNESCO Publishing: Paris, 2015. Available online: http://unesdoc.unesco.org/images/0023/002311/231101E.pdf (accessed on 14 September 2025).
- UNESCO; Loughborough University. The Global State of Play: Report and Recommendations on Quality Physical Education. Highlights. Paris/Leicestershire, 2024. ISBN: 978-92-3-100603-6. Available online: https://unesdoc.unesco.org/ark:/48223/pf0000390593 (accessed on 14 September 2025).
- GCED Clearinghouse / UNESCO resources. Global summaries on QPE implementation and recommended minutes/benchmarks.
- Manescu, D.C. Interferențe biochimice în sport. 2025, Editura Risoprint. Available online: https://www.risoprint.ro/detaliicarte.php?id=2518.
- Nally, S.; Kee, F.; Young, I.; et al. The effectiveness of school-based interventions on obesity-related behaviours: systematic review. Children 2021, 8, 489. [Google Scholar] [CrossRef] [PubMed]
- Hollis, J.L.; Sutherland, R.; Campbell, L.; et al. Effects of a school-based physical activity intervention on adiposity in adolescents from economically disadvantaged communities: secondary outcomes of the ‘Physical Activity 4 Everyone’ RCT. Int. J. Obes. 2016, 40, 1486–1493. [Google Scholar] [CrossRef] [PubMed]
- Manescu, D.C. Fitness. 2025, Editura Risoprint. Available online: https://www.risoprint.ro/detaliicarte.php?id=2521.
- Hodder, R.K.; et al. Interventions to prevent obesity in school-aged children: updated evidence synthesis. EClinicalMedicine 2022. [CrossRef]
- UNESCO. Policy brief — renewed advocacy for investment in Quality PE (Paris policy note). UNESCO; 2024. Available online: https://unesco.org (accessed on 14 September 2025).
- Health Behaviour in School-aged Children (HBSC) — Romania national reports (survey waves 2006–2018). WHO Regional Office for Europe / HBSC. Available online: https://www.euro.who.
- Mănescu, D.C.; Mănescu, A.M. Artificial Intelligence in the Selection of Top-Performing Athletes for Team Sports: A Proof-of-Concept Predictive Modeling Study. Appl. Sci. 2025, 15, 9918. [Google Scholar] [CrossRef]
- Saunders, C.; Abel, G. Ecological studies: use with caution. Br. J. Gen. Pract. 2014, 64, 65–66. [Google Scholar] [CrossRef] [PubMed]
- Manescu, D.C. Solutions to fight against overtraining in bodybuilding routine. Marathon 2013, 5(2), 182- 186.
- Morgenstern, H. Uses of ecologic analysis in epidemiologic research. Am. J. Public Health 1982, 72, 1336–1344. [Google Scholar] [CrossRef] [PubMed]
- Vatcheva, K.P.; Lee, M.; McCormick, J.B.; Rahbar, M.H. Multicollinearity in regression analyses conducted in epidemiologic studies: consequences and solutions. Epidemiol. (Sunnyvale) 2016, 6, 227. [Google Scholar] [CrossRef] [PubMed]
- Mănescu, D.C. Computational Analysis of Neuromuscular Adaptations to Strength and Plyometric Training: An Integrated Modeling Study. Sports 2025, 13, 298. [Google Scholar] [CrossRef]
- UCLA OARC. Robust regression diagnostics and practical guidance (online resource). Available online: https://stats.oarc.ucla.edu (accessed on 14 September 2025).
- Pasdar, Z.; Pana, T.A.; Ewers, K.D.; et al. An ecological study assessing the relationship between public health policies and severity of the COVID-19 pandemic. Healthcare 2021, 9, 1221. [Google Scholar] [CrossRef] [PubMed]
- Mănescu, D.C. Fundamente teoretice ale activității fizice. 2013, Editura ASE.
- World Health Organization. WHO Guidelines on Physical Activity and Sedentary Behaviour. 2020. Available online: https://www.who.int/publications/i/item/9789240015128 (accessed on 14 September 2025).
- Centers for Disease Control and Prevention (CDC). Physical Activity Guidelines for School-Aged Children. U.S. Department of Health and Human Services / CDC guidance summary. 2024. Available online: https://www.cdc.gov/physicalactivity Reference class.
- Mănescu, A.M.; Grigoroiu, C.; Smîdu, N.; Dinciu, C.C.; Mărgărit, I.R.; Iacobini, A.; Mănescu, D.C. Biomechanical Effects of Lower Limb Asymmetry During Running: An OpenSim Computational Study. Symmetry 2025, 17, 1348. [Google Scholar] [CrossRef]
- Hallal, P.C.; Andersen, L.B.; Bull, F.C.; et al. Global physical activity levels: surveillance progress, pitfalls and prospects. Lancet 2012, 380, 247–257. [Google Scholar] [CrossRef] [PubMed]
- World Obesity Federation. Country Report Card: Romania. World Obesity Federation; 2024. Global Obesity Observatory — Romania. Available online: https://data.worldobesity.org/country/romania/ (accessed on 14 September 2025).
- World Obesity Federation. Global Obesity Observatory — country profiles and report cards (incl. Romania). 2024. Available online: https://data.worldobesity.org (accessed on 14 September 2025).
- Bull, F.C.; Al-Ansari, S.S.; Biddle, S.; et al. World Health Organization 2020 guidelines on physical activity and sedentary behaviour. British Journal of Sports Medicine. 2020;54(24):1451–1462. [CrossRef]
- Mănescu, D.C. Elements of the specific conditioning in football at university level. Marathon 2015, 7(1), 107–111. [Google Scholar]
- Chaput, J.-P.; Carson, V.; Gray, C.; et al. 2020 WHO guidelines for children and adolescents — summary of the evidence. International Journal of Behavioral Nutrition and Physical Activity. 2020;17:1–18. [CrossRef]
- Mănescu, D.C. Big Data Analytics Framework for Decision-Making in Sports Performance Optimization. Data 2025, 10, 116. [Google Scholar] [CrossRef]
- UNESCO. Quality Physical Education: Guidelines for Policy-Makers. UNESCO; 2015. Available online: https://unesdoc.unesco.org/ark:/48223/pf0000235404 (accessed on 14 September 2025).
- García-Hermoso, A.; Ramírez-Vélez, R.; Saavedra, J.M.; et al. Association of physical education interventions with improvements in fitness, motor skills and BMI — systematic review and meta-analysis. JAMA Pediatrics. 2020;174(6):e200223. [CrossRef]
- Love, R.; Adams, J.; van Sluijs, E.M.F. Are school-based physical activity interventions effective? Systematic review and meta-analysis. Obesity Reviews. 2019;20(6):859–879. [CrossRef]
- Manescu, D.C. Alimentaţia în fitness şi bodybuilding. 2010, Editura ASE.
- Nally, S.; Carlin, A.; Blackburn, N.E.; Baird, J.S.; Salmon, J.; Murphy, M.H.; Gallagher, A.M. The Effectiveness of School-Based Interventions on Obesity-Related Behaviours in Primary School Children: A Systematic Review and Meta-Analysis. Children. 2021;8:489. [CrossRef]
- Hollis, J.L.; Sutherland, R.; Williams, A.J.; et al. Effects of a school-based physical activity intervention on adolescent adiposity: PA4E1 trial results. International Journal of Obesity. 2016;40:964–971. [CrossRef]
- Sutherland, R.; et al. Scale-up of the Physical Activity 4 Everyone (PA4E1) program: implementation and outcomes. International Journal of Behavioral Nutrition and Physical Activity. 2020;17:1–14. [CrossRef]
- Morgenstern, H. Ecologic studies in epidemiology: concepts, principles, and methodological issues. Annual Review of Public Health. 1995;16:61–81. [CrossRef]
- Vatcheva, K.P.; Lee, M.; McCormick, J.B.; Rahbar, M.H. Multicollinearity in regression analyses conducted in epidemiologic studies. Epidemiol Open Access. 2016;6:227. [CrossRef]
- Kim, J.H.; et al. Multicollinearity and misleading statistical results — diagnostic approaches. Korean Journal of Anesthesiology (methodological review). 2019. [CrossRef]
- Cook, R.D. Detection of Influential Observations in Linear Regression. Technometrics. 1977;19(1):15–18. [CrossRef]
- Zhu, H.; Ibrahim, J.G.; Cho, H. Perturbation and scaled Cook’s distance. The Annals of Statistics. 2012;40(2):785–811. [CrossRef]
- Rousseeuw, P.J.; Hubert, M. Robust statistics for outlier detection. WIREs Data Mining and Knowledge Discovery. 2011;1:73–79. [CrossRef]
- Yu, C.; Yao, W. Robust linear regression: review and comparison. Communications in Statistics — Simulation and Computation. 2017;46(8):6261–6282. [CrossRef]
- Naylor, P.-J.; et al. Implementation of school-based physical activity interventions: linking implementation to outcomes — systematic review. Preventive Medicine. 2015;72:95–109. [CrossRef]
- Manescu, D.C. Noțiuni complementare ale antrenamentului sportiv. 2025, Editura Risoprint. Available online: https://www.risoprint.ro/detaliicarte.php?id=2516.
- Andermo, S.; et al. School-related physical activity interventions and mental health outcomes — systematic review. Sports Medicine — Open. 2020;6:1–17. [CrossRef]
- Pfledderer, C.D.; et al. School-based physical activity interventions in rural and underserved settings: meta-analysis. Public Health. 2021;195:80–89. [CrossRef]
- Davila-Payan, C.; DeGuzman, M.; Johnson, K.; Serban, N.; Swann, J. Estimating prevalence of overweight or obese children and adolescents in small geographic areas using publicly available data. Preventing Chronic Disease. 2015;12:E32. [CrossRef]
- Zhao, Y.-Q.; Norton, D.; Hanrahan, L. Small-area estimation and childhood obesity surveillance using electronic health records. PLoS ONE. 2021;16(2):e0247476. [CrossRef]
- Manescu, D.C. Bazele generale ale antrenamentului sportiv. 2025, Editura Risoprint. Available online: https://www.risoprint.ro/detaliicarte.php?id=2515.
- Mills, C.W.; Johnson, G.; Huang, T.T.K.; Balk, D.; Wyka, K. Use of small-area estimates to describe county-level geographic variation in prevalence of extreme obesity among US adults. JAMA Network Open. 2020;3(5):e204289. [CrossRef]
- Chien, T.-W.; Wang, H.-Y.; Hsu, C.-F.; Kuo, S.-C. Choropleth map legend design for visualizing the most influential areas in article citation disparities. Medicine. 2019;98(41):e17527. [CrossRef]
- Manescu, D.C. Bodybuilidng. 2025, Editura Risoprint. Available online: https://www.risoprint.ro/detaliicarte.php?id=2517.
- Davila-Payan, C. ; & CDC guidance on SAE applications for child health — methodological notes and best practices. Prev Chronic Dis. 2015. [CrossRef]
- Hallal, P.C.; Andersen, L.B.; Bull, F.C.; et al. Global physical activity levels: surveillance and epidemiologic context for MVPA trends. The Lancet. (seminal surveillance papers). 2012;380:247–257. [CrossRef]
- Manescu, D.C. Nutriție ergogenă, suplimentație și performanță. 2025, Editura Risoprint. Available online: https://www.risoprint.ro/detaliicarte.php?id=2522.
- WHO Regional HBSC / country reports (Romania) — Health Behaviour in School-aged Children (HBSC) national reports and data waves (2006–2018). WHO Europe. Available online: https://www.euro.who.
- Dudley, D.A.; et al. What drives quality physical education? Systematic review of PE program design and delivery. Frontiers in Psychology. 2022;13: (article). [CrossRef]
- Manescu, D.C. Fotbal – Știința performanței. 2025, Editura Risoprint. Available online: https://www.risoprint.ro/detaliicarte.php?id=2524.
- Zhang, X.; et al. A multilevel approach to estimating small-area childhood obesity prevalence at census block-group level. Preventing Chronic Disease. 2013;10:E252. [CrossRef]
- Al-Ghamdi, A.M. ; Optimising number of classes and choropleth classification methods: cartographic best practice. In: Lecture Notes in Geoinformation and Cartography; Thematic Cartography for the Society. Springer; 2014. [CrossRef]
- Manescu, D.C. Powerlifting. 2025, Editura Risoprint. Available online: https://www.risoprint.ro/detaliicarte.php?id=2525.
- World Health Organization / UNESCO. Policy briefs on school health, intersectoral action and recommended PE benchmarks (policy guidance and advocacy documents). 2019–2024. Available online: https://www.who.int/ and https://www.unesco.org (accessed on 14 September 2025).
|
Disclaimer/Publisher’s Note: The statements, opinions and data contained in all publications are solely those of the individual author(s) and contributor(s) and not of MDPI and/or the editor(s). MDPI and/or the editor(s) disclaim responsibility for any injury to people or property resulting from any ideas, methods, instructions or products referred to in the content. |
© 2025 by the authors. Licensee MDPI, Basel, Switzerland. This article is an open access article distributed under the terms and conditions of the Creative Commons Attribution (CC BY) license (http://creativecommons.org/licenses/by/4.0/).