
Submitted:
11 September 2025
Posted:
16 September 2025
You are already at the latest version
Abstract
Laser shock processing (LSP) is a surface treatment technique used to enhance mechanical properties such as hardness, corrosion resistance, and wear resistance. This study investigates the effects of LSP on a 6061-T6 aluminium alloy using four treatment conditions: nanosecond (ns-LSP), picosecond (ps-LSP), and a combination of nanosecond-picosecond (nsps-LSP) and picosecond-nanosecond (psns-LSP) pulses. Two laser systems were employed: a Q-switched Nd:YAG laser (850 mJ/pulse, 6 ns, 1064 nm, 10 Hz), and an Ekspla Atlantic 355-60 laser (0.110 mJ/pulse, 13 ps, 1064 nm, 1 kHz). All treatments induced compressive residual stresses up to 1 mm in depth. Additionally, improvements in microhardness were observed, particularly at deeper layers in the combined nsps-LSP treatment. Surface roughness was measured and compared. Among all configurations, the nsps-LSP treatment produced the highest compressive residual stresses (428 MPa) and greater microhardness at depth. These results suggest that the combined nsps-LSP treatment represents a promising approach to enhance the mechanical performance of metallic components.
Keywords:
1. Introduction
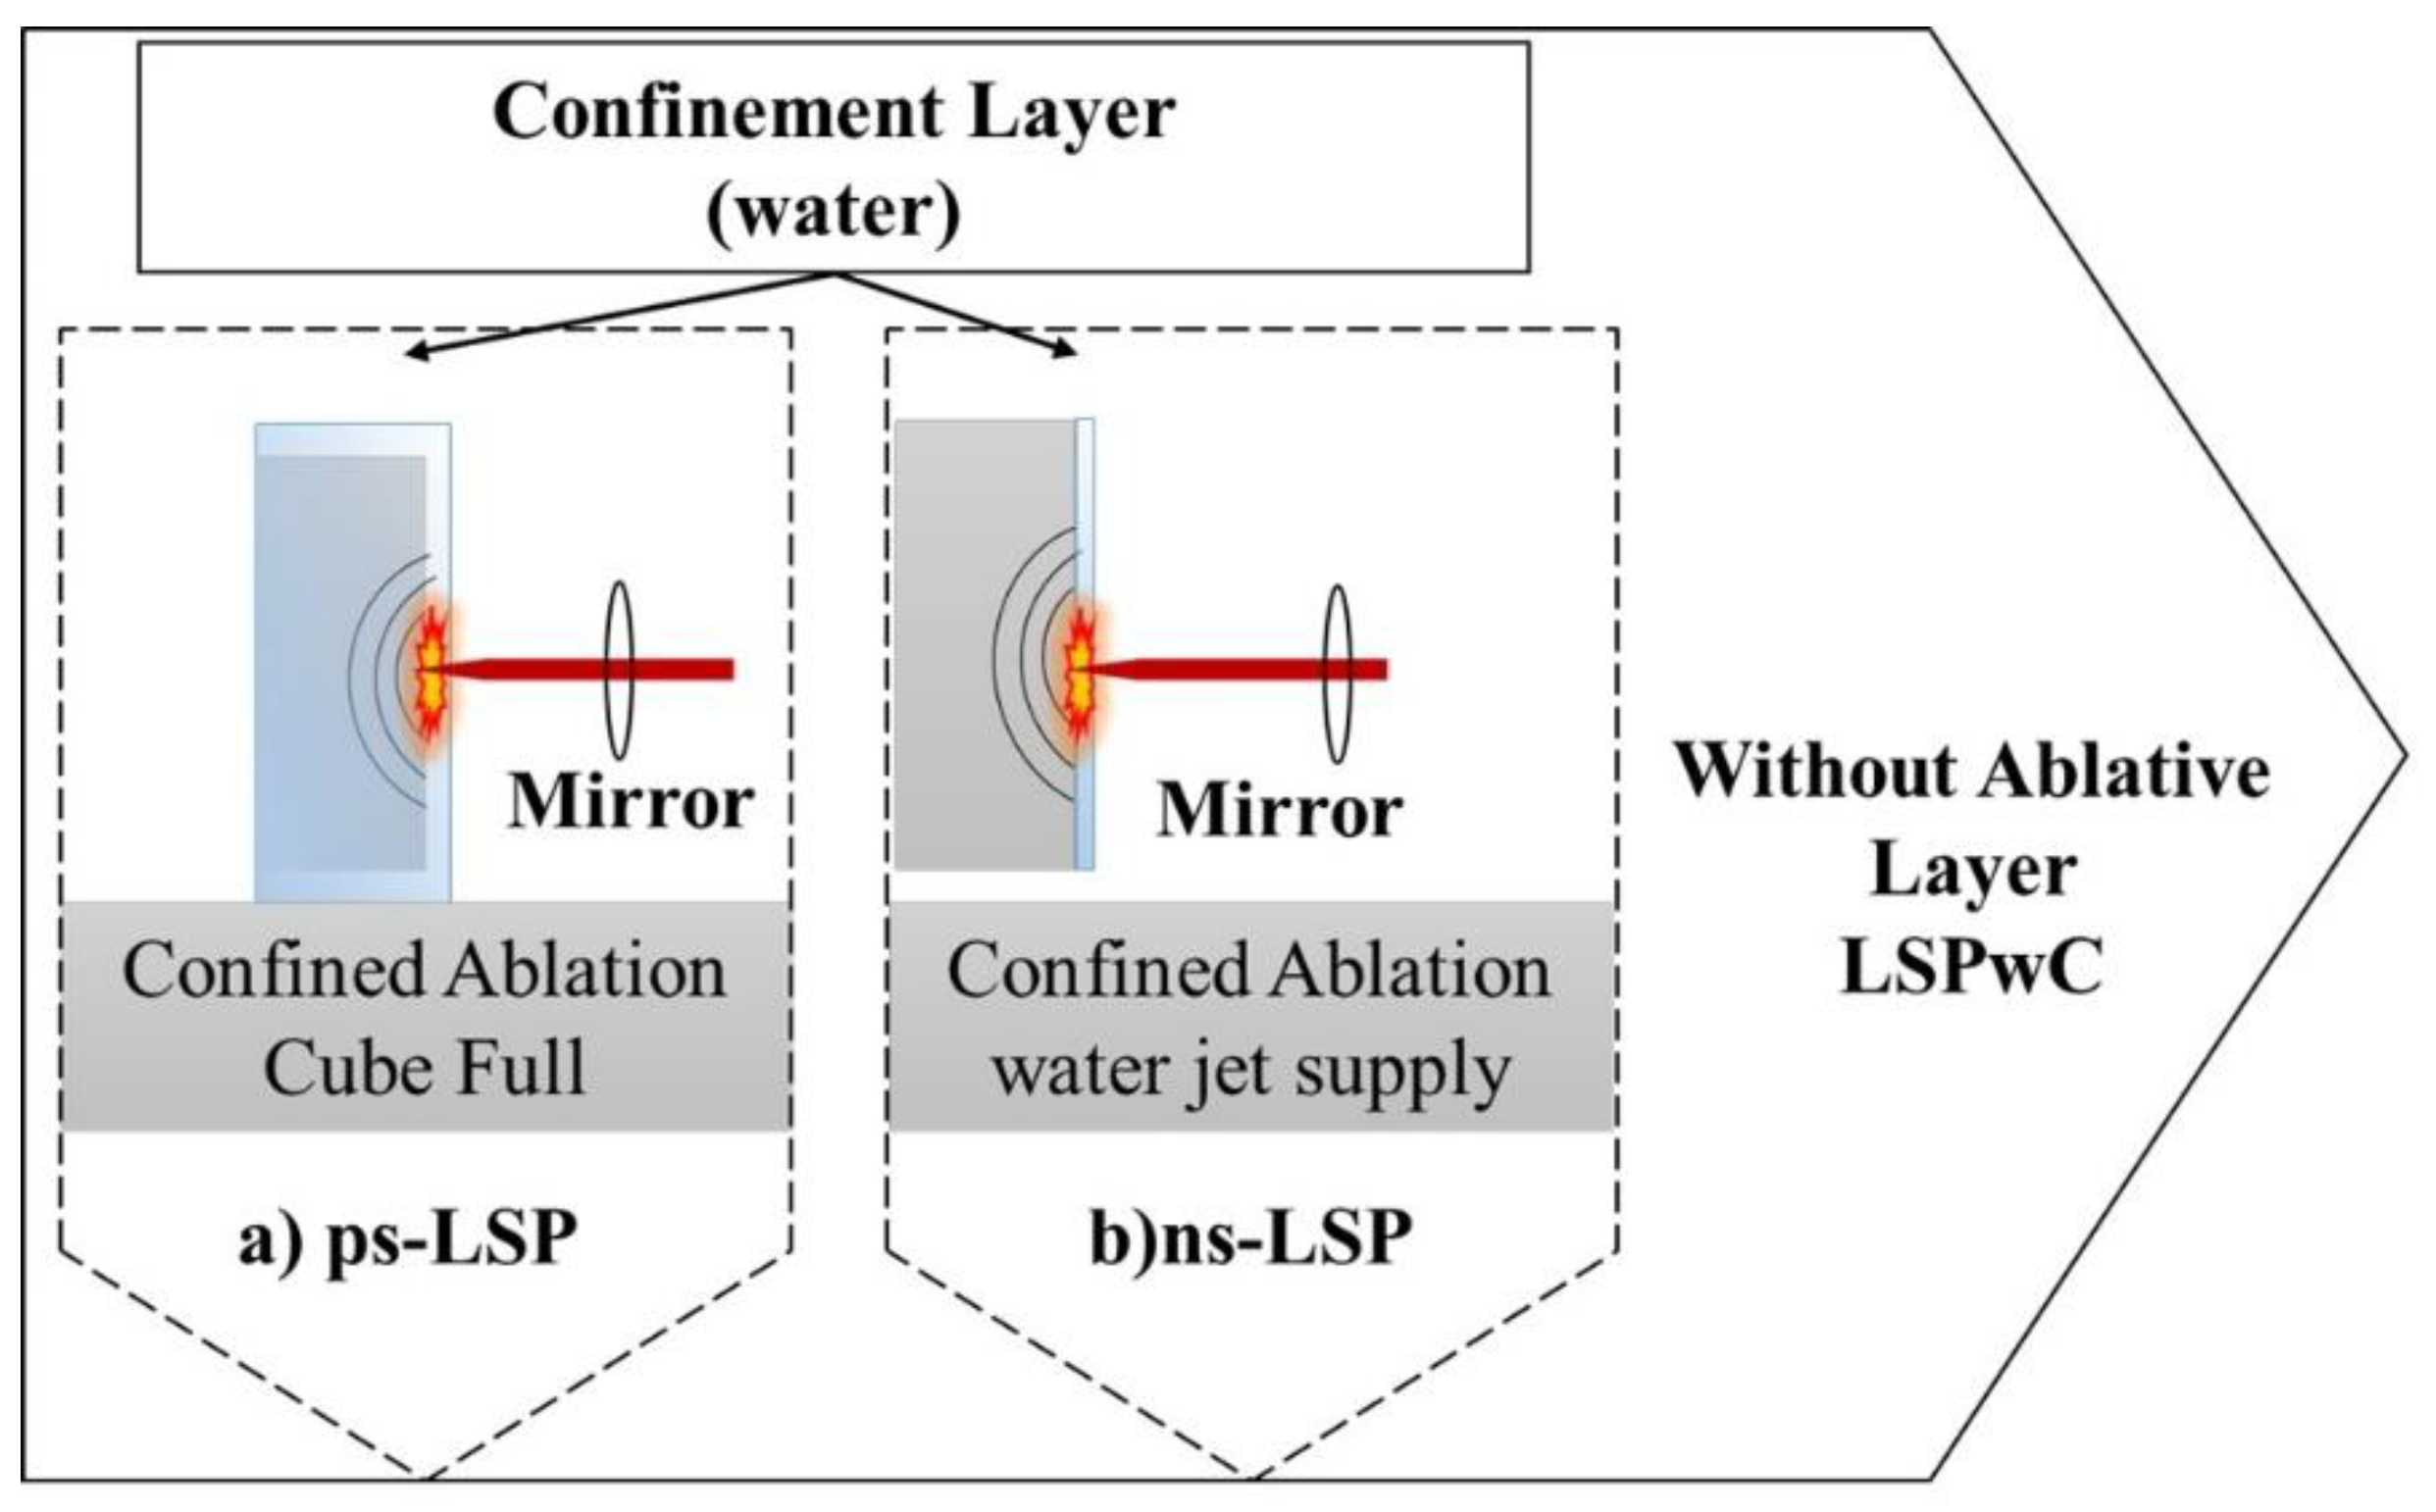
2. Materials and Methods
2.1. Preparation of Samples Before Treatment

| Chemical Composition | |||||||||||
| Element | Si | Mg | Fe | Cu | Mn | Cr | Zn | Ti | Others | ||
| % | 0.4-0.8 | 0.8-1.2 | 0.7 | 0.15 -0.40 | 0.8 -1.2 | 0.04 -0.35 | 0.25 | 0.15 | 0.15 | ||
| Mechanical Properties | |||||||||||
| Heat Treatment | Density | Poisson Coefficient | Tensile Strength | Yield Strength | Elongation (%) | Young Module | Vickers Hardness | ||||
| T6 | g/cm3 | 1/16 Thickness |
1/2 Diameter | ||||||||
| 2.70 | ~0.33 | ~310 | ~276 | ~12 | ~17 | 68.9 | 107 | ||||
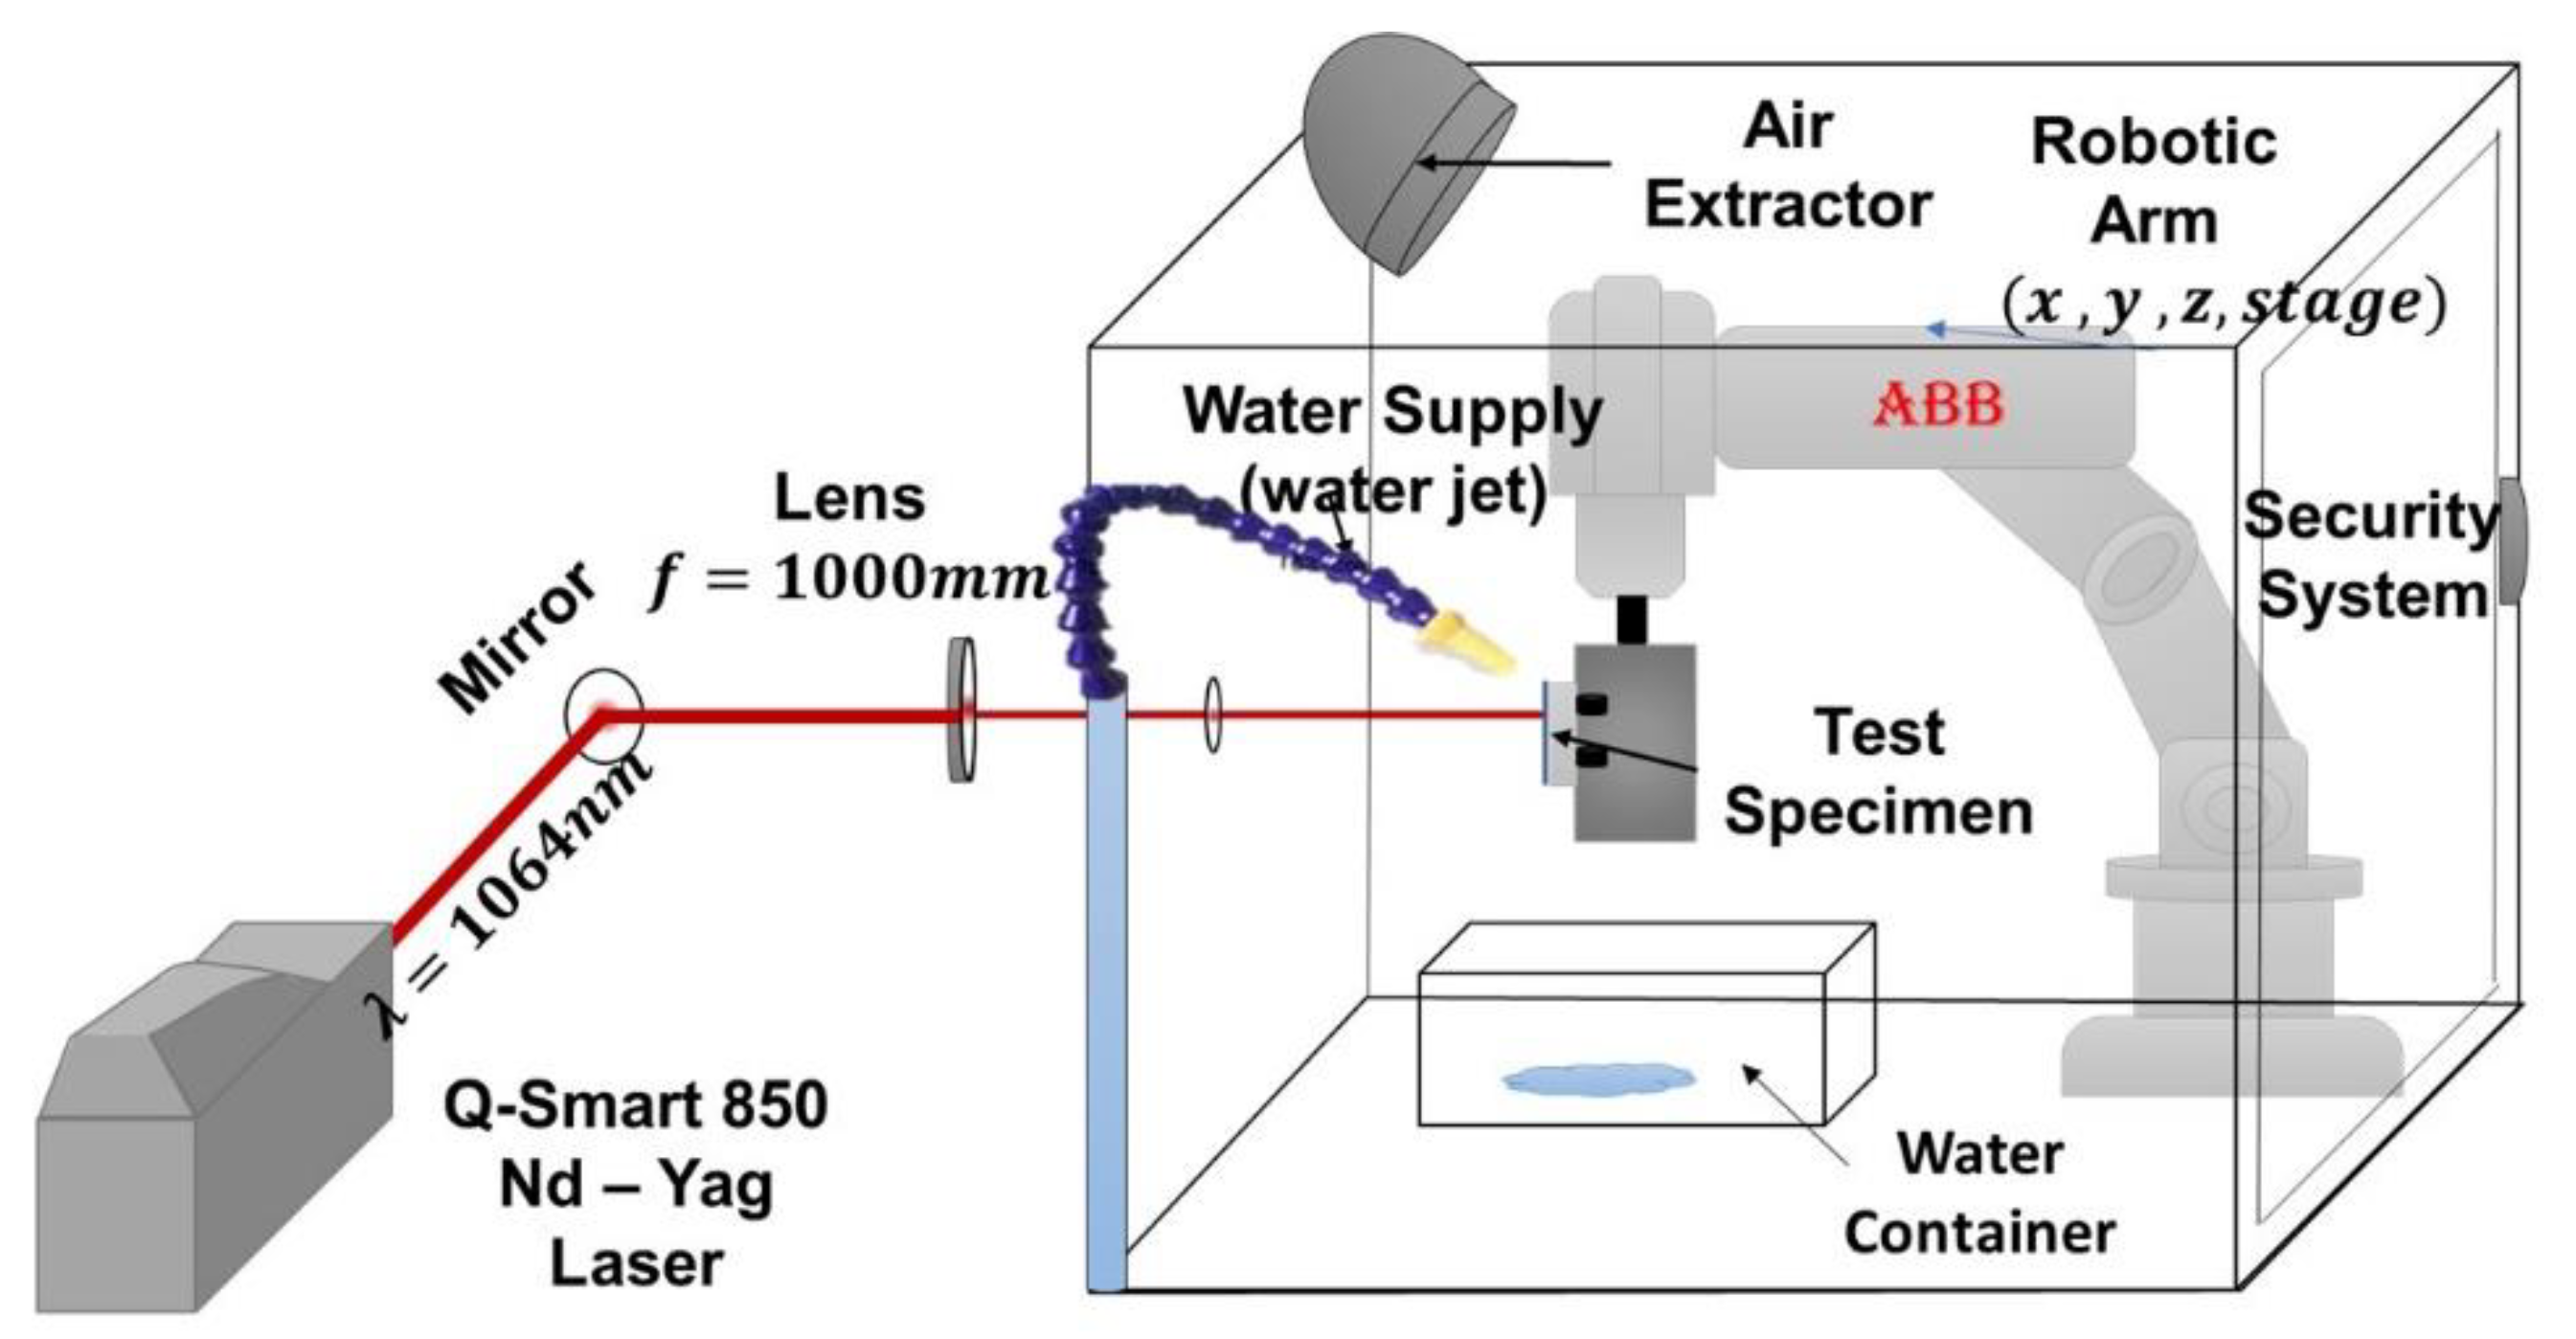
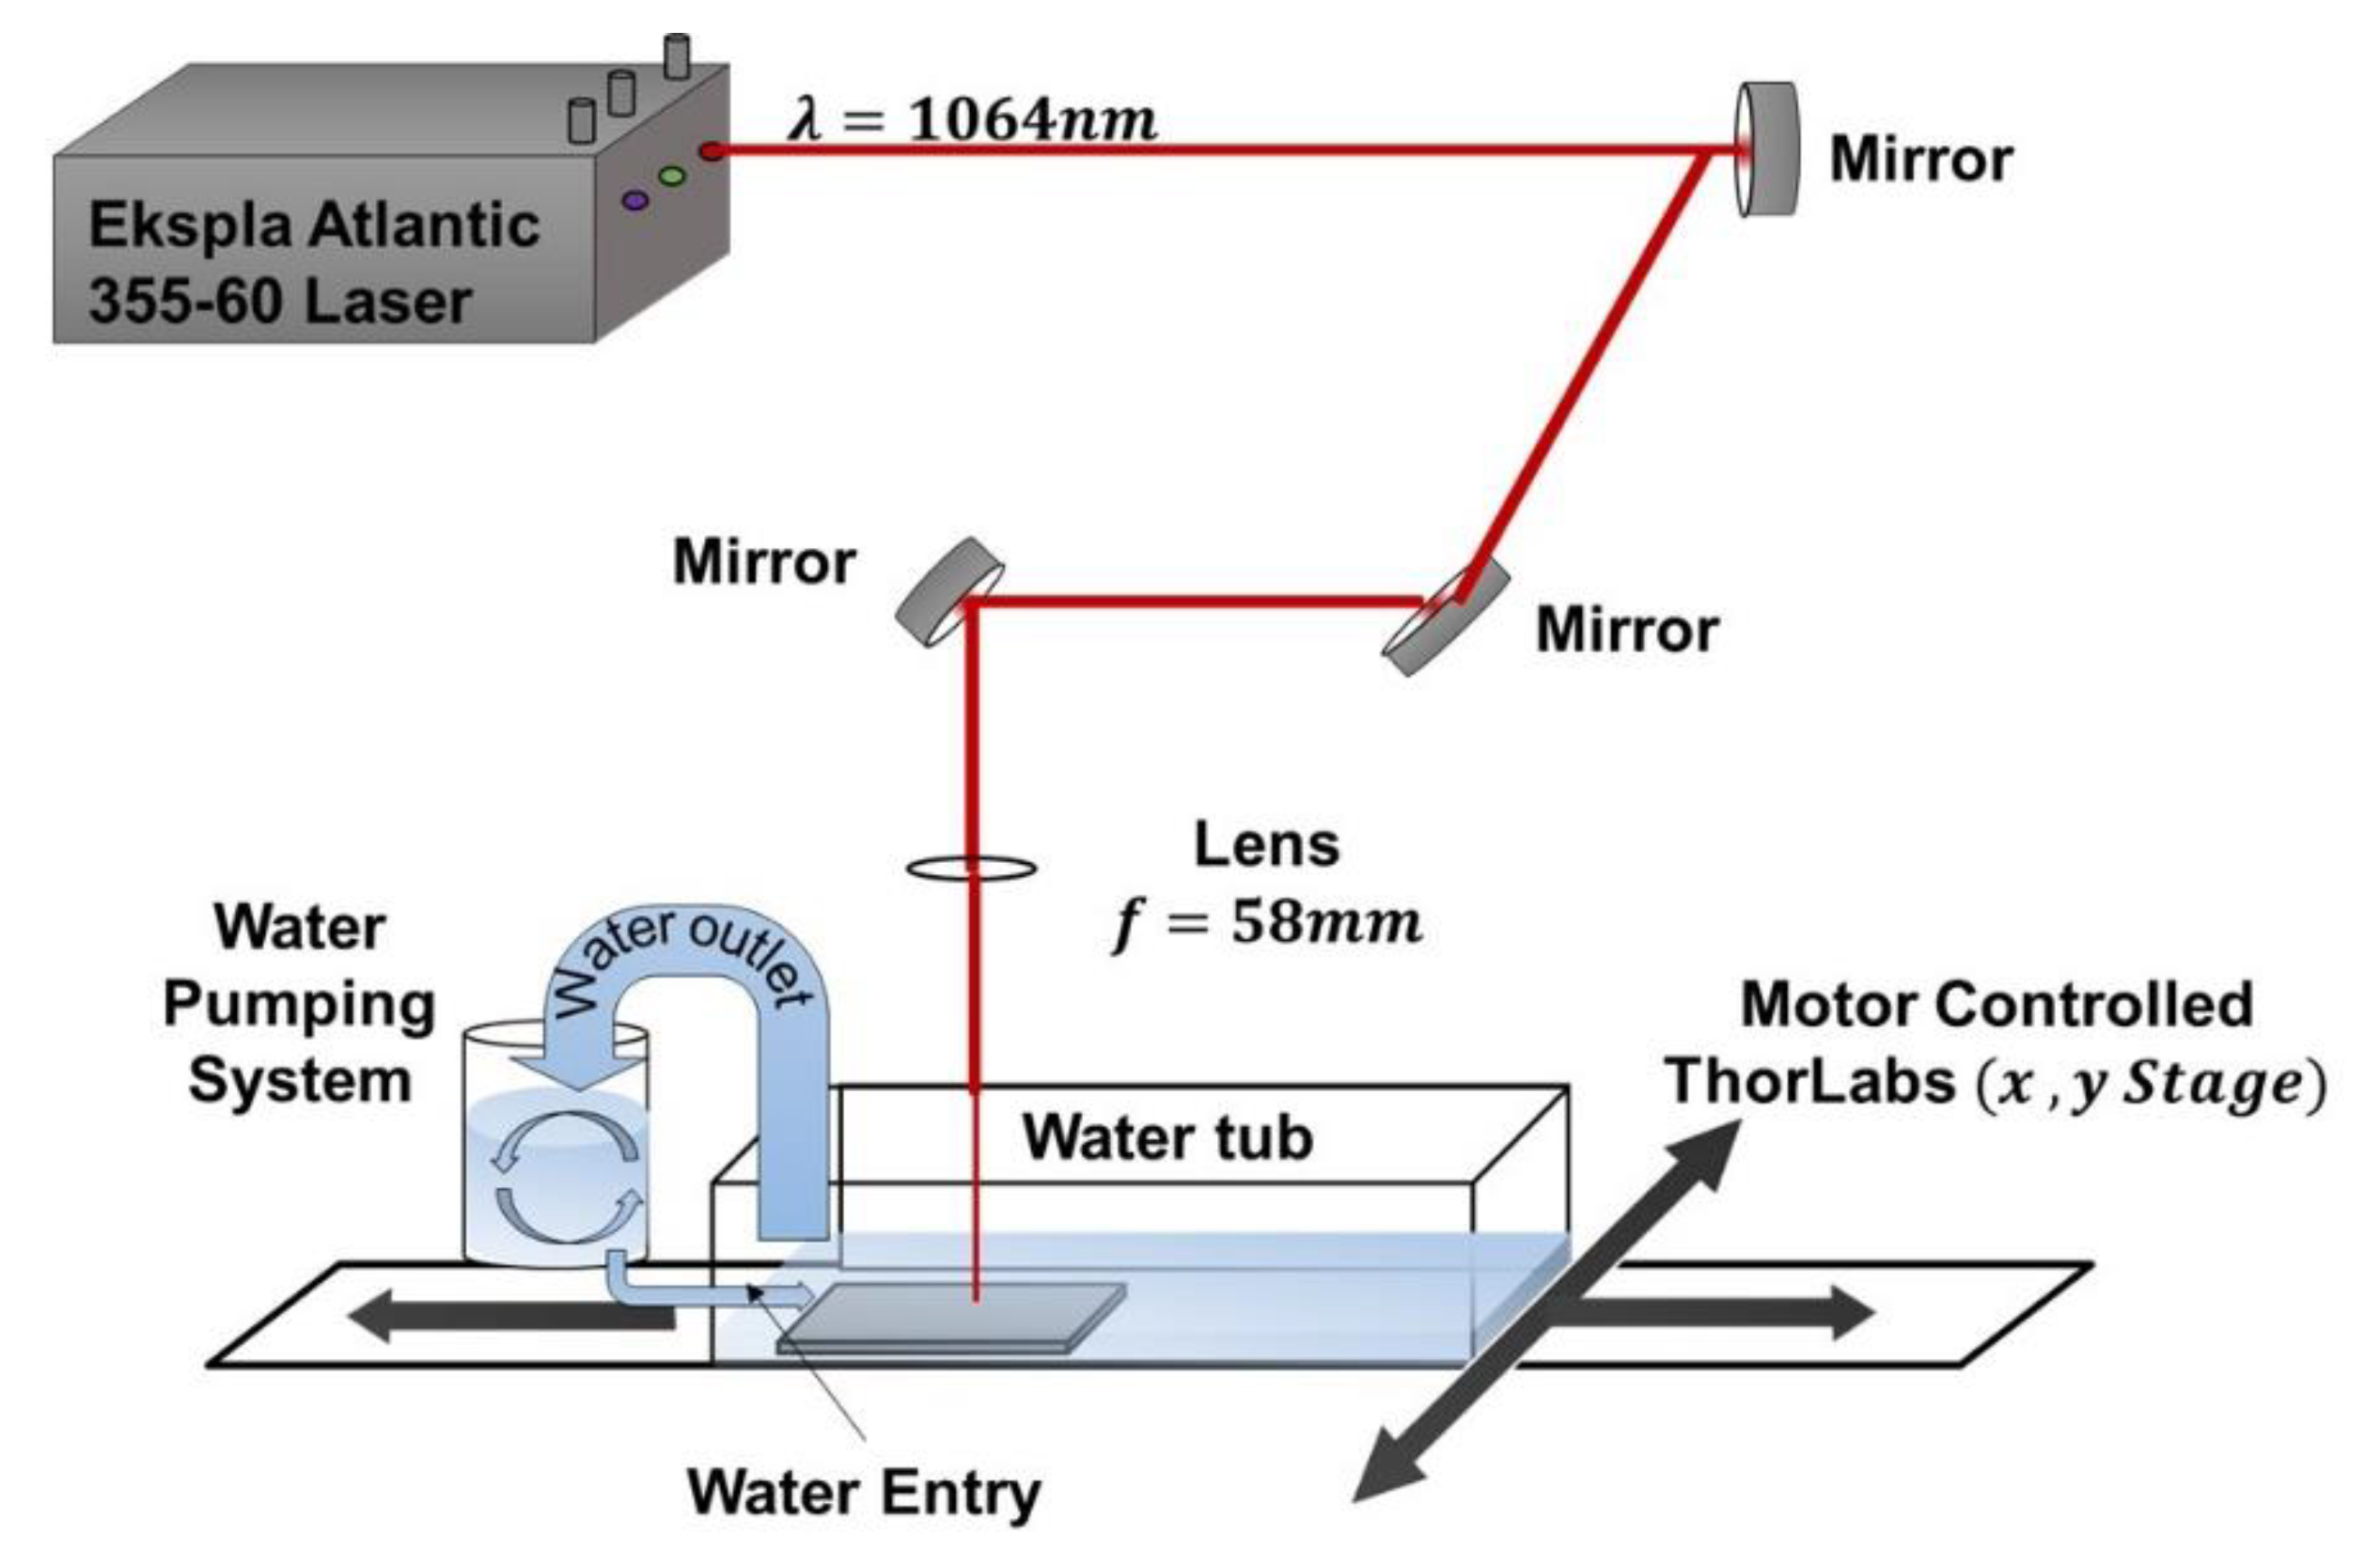
2.2. Experimental Setups and Mechanical Characterizations
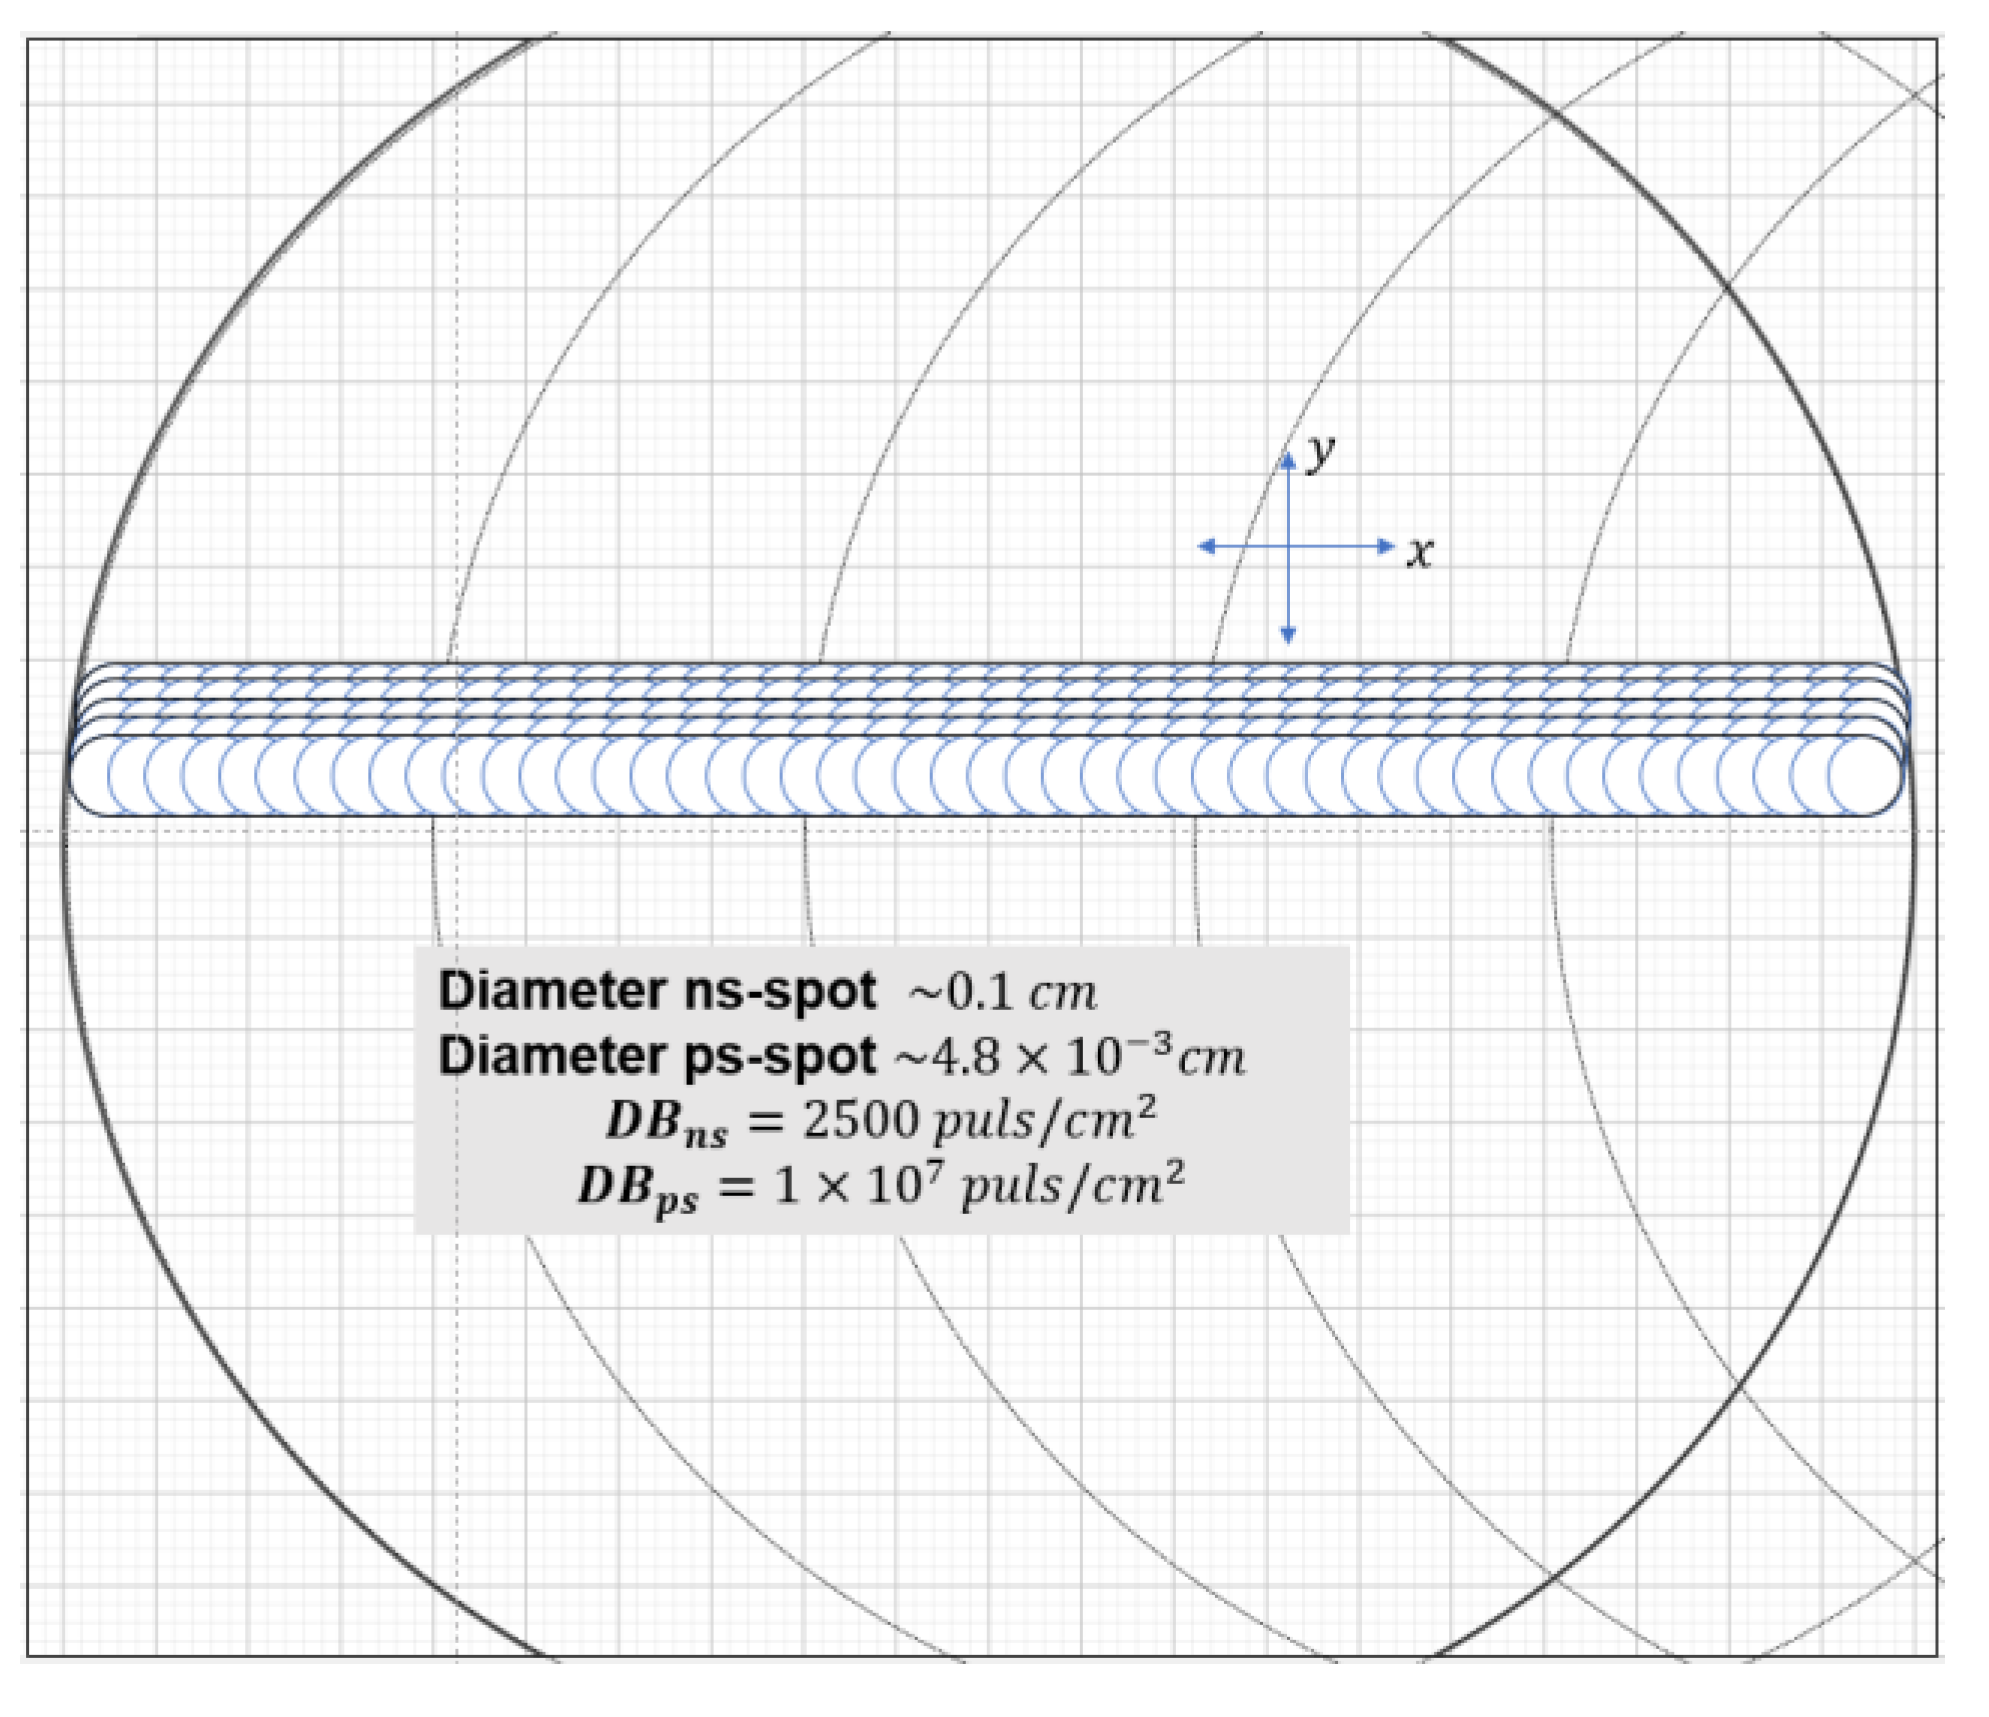
| Make and model | Pulse Energy | Pulse width | Pulse Frequency | Beam Diameter on Sample | Power Density | Pulse Density | |
| mJ | s | Hz | cm | W/cm2 | Pulse cm-2 | ||
|
Quantel Q-Smart 850 Nd-YAG |
850 | 6 × 10⁻⁹ | 10 | 0.1 | 1.2 × 10¹⁰ | 2500 | |
|
Ekspla Atlantic 355-60 |
0.110 | 13 × 10-12 | 1 × 10³ | 4.9 × 10⁻³ | 4.9 × 10¹¹ | 1 × 10⁷ |
| Nomenclature | Meaning |
Pulse Density |
Power Density |
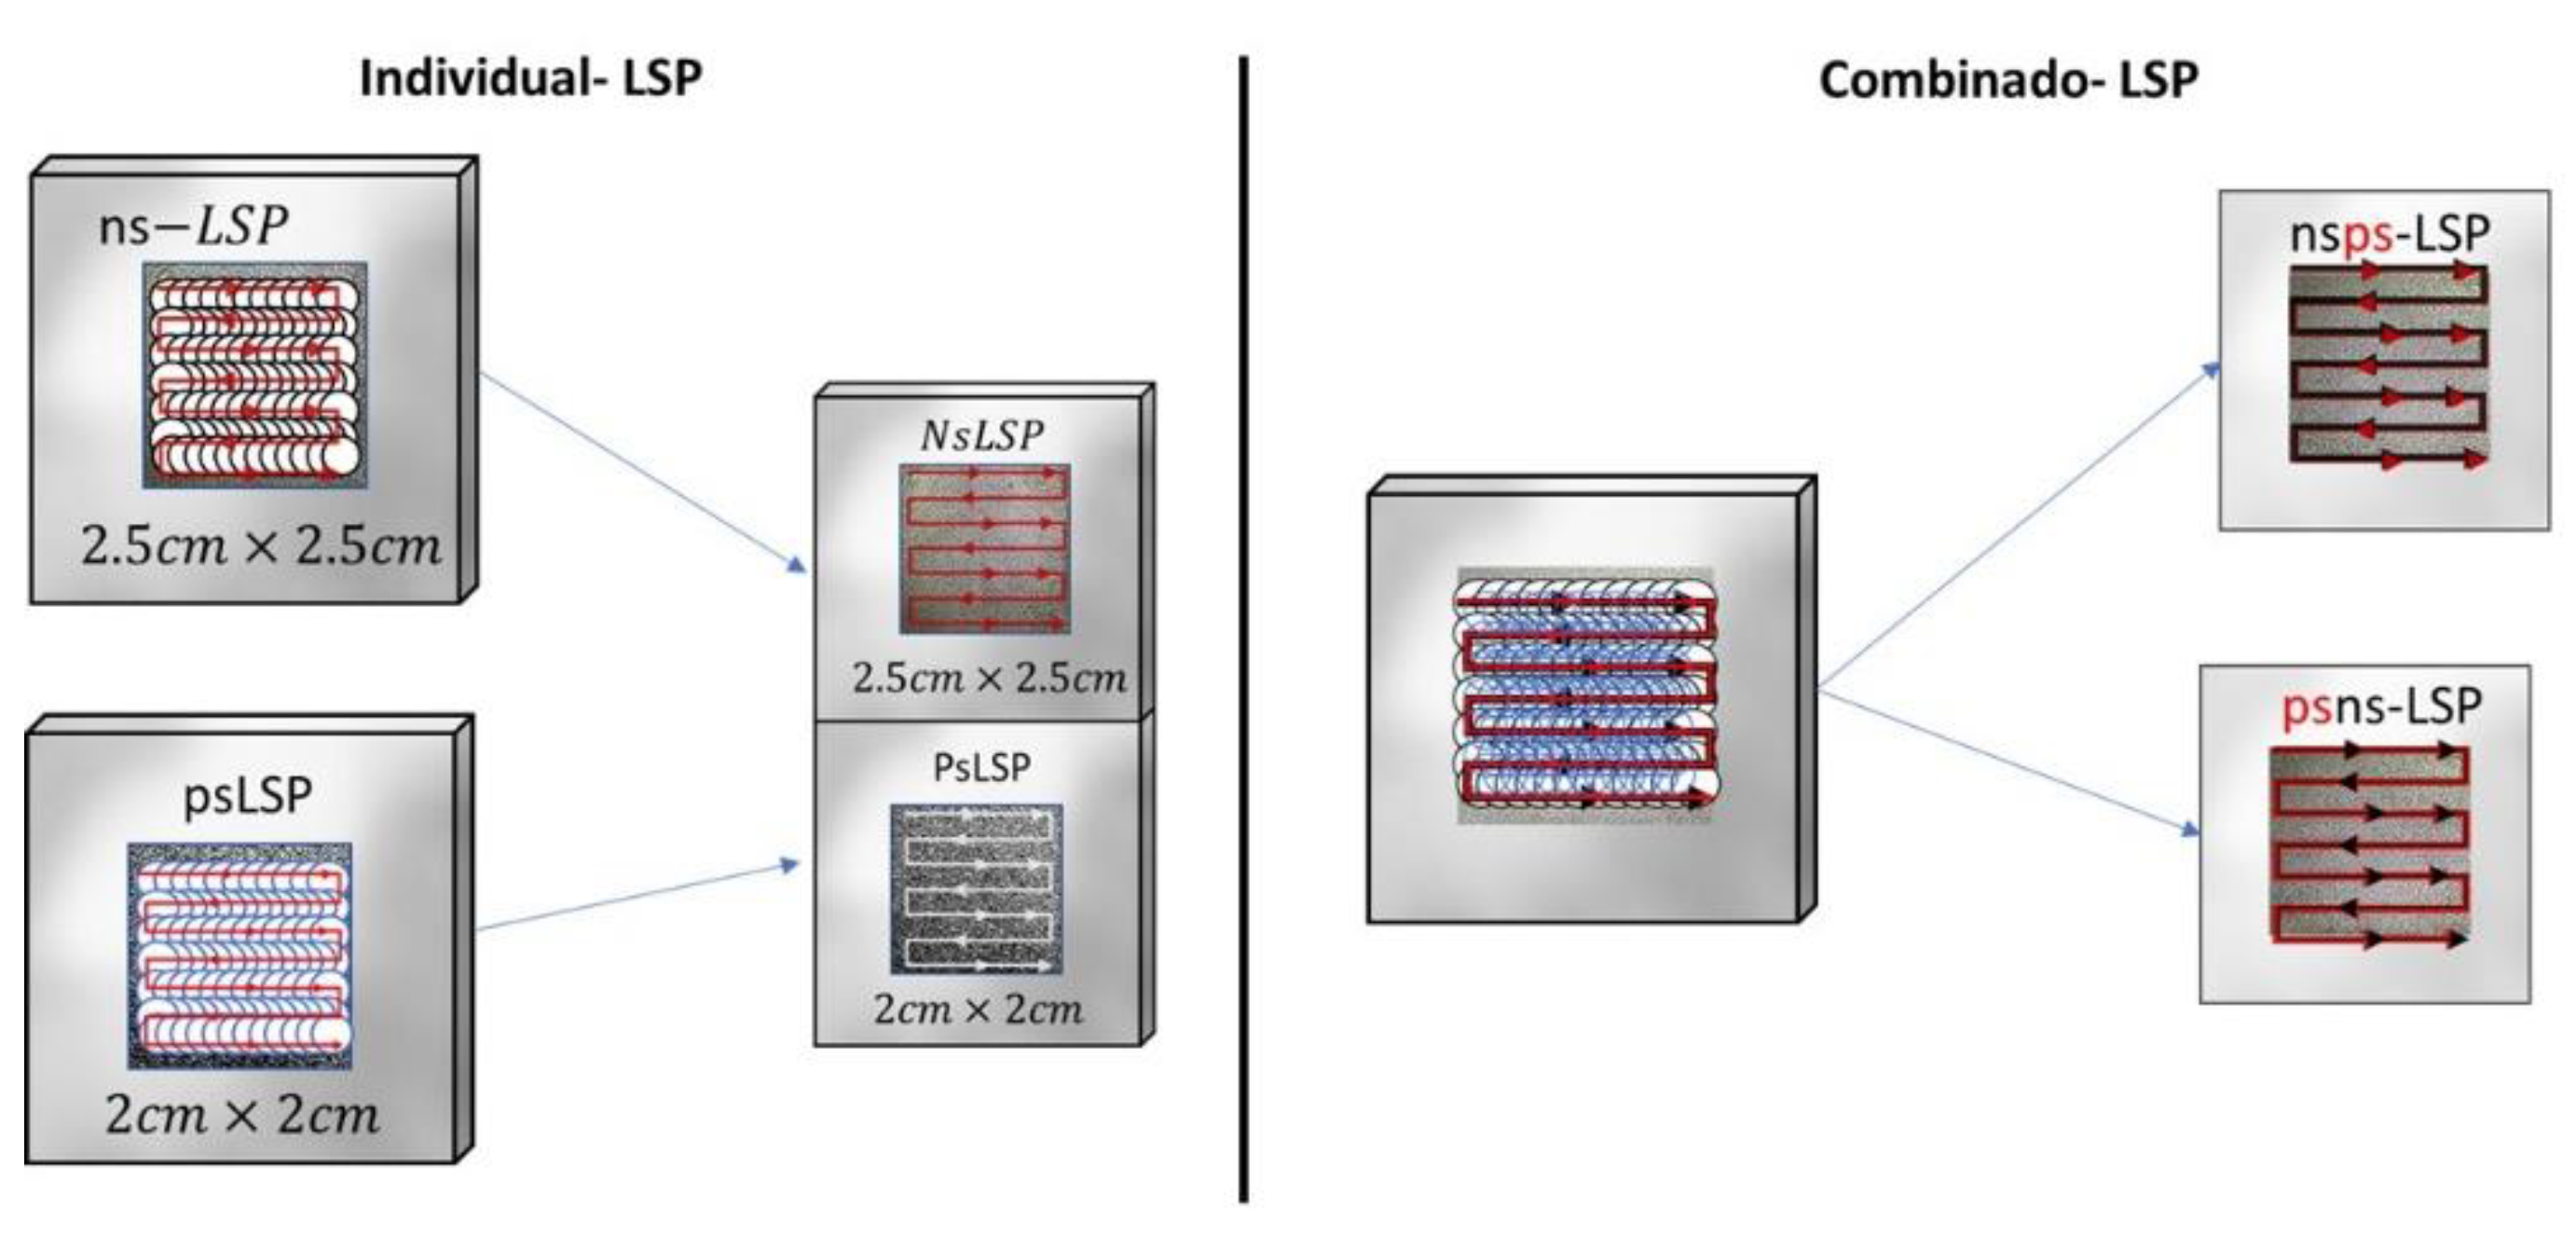
| Without-LSP | Targets without LSP treatment | ||
| ns-LSP | 2500 | ||
| ps-LSP | Targets treated with ps | 1 × 10⁷ | |
| nsps-LSP | Targets treated with ns and post ps |
2500 and 1 × 10⁷ |
|
| psns-LSP | Targets treated with ps and post ns |
1 × 10⁷ and 2500 |
|
3. Results
3.1. Residual Stresses (RS) Results
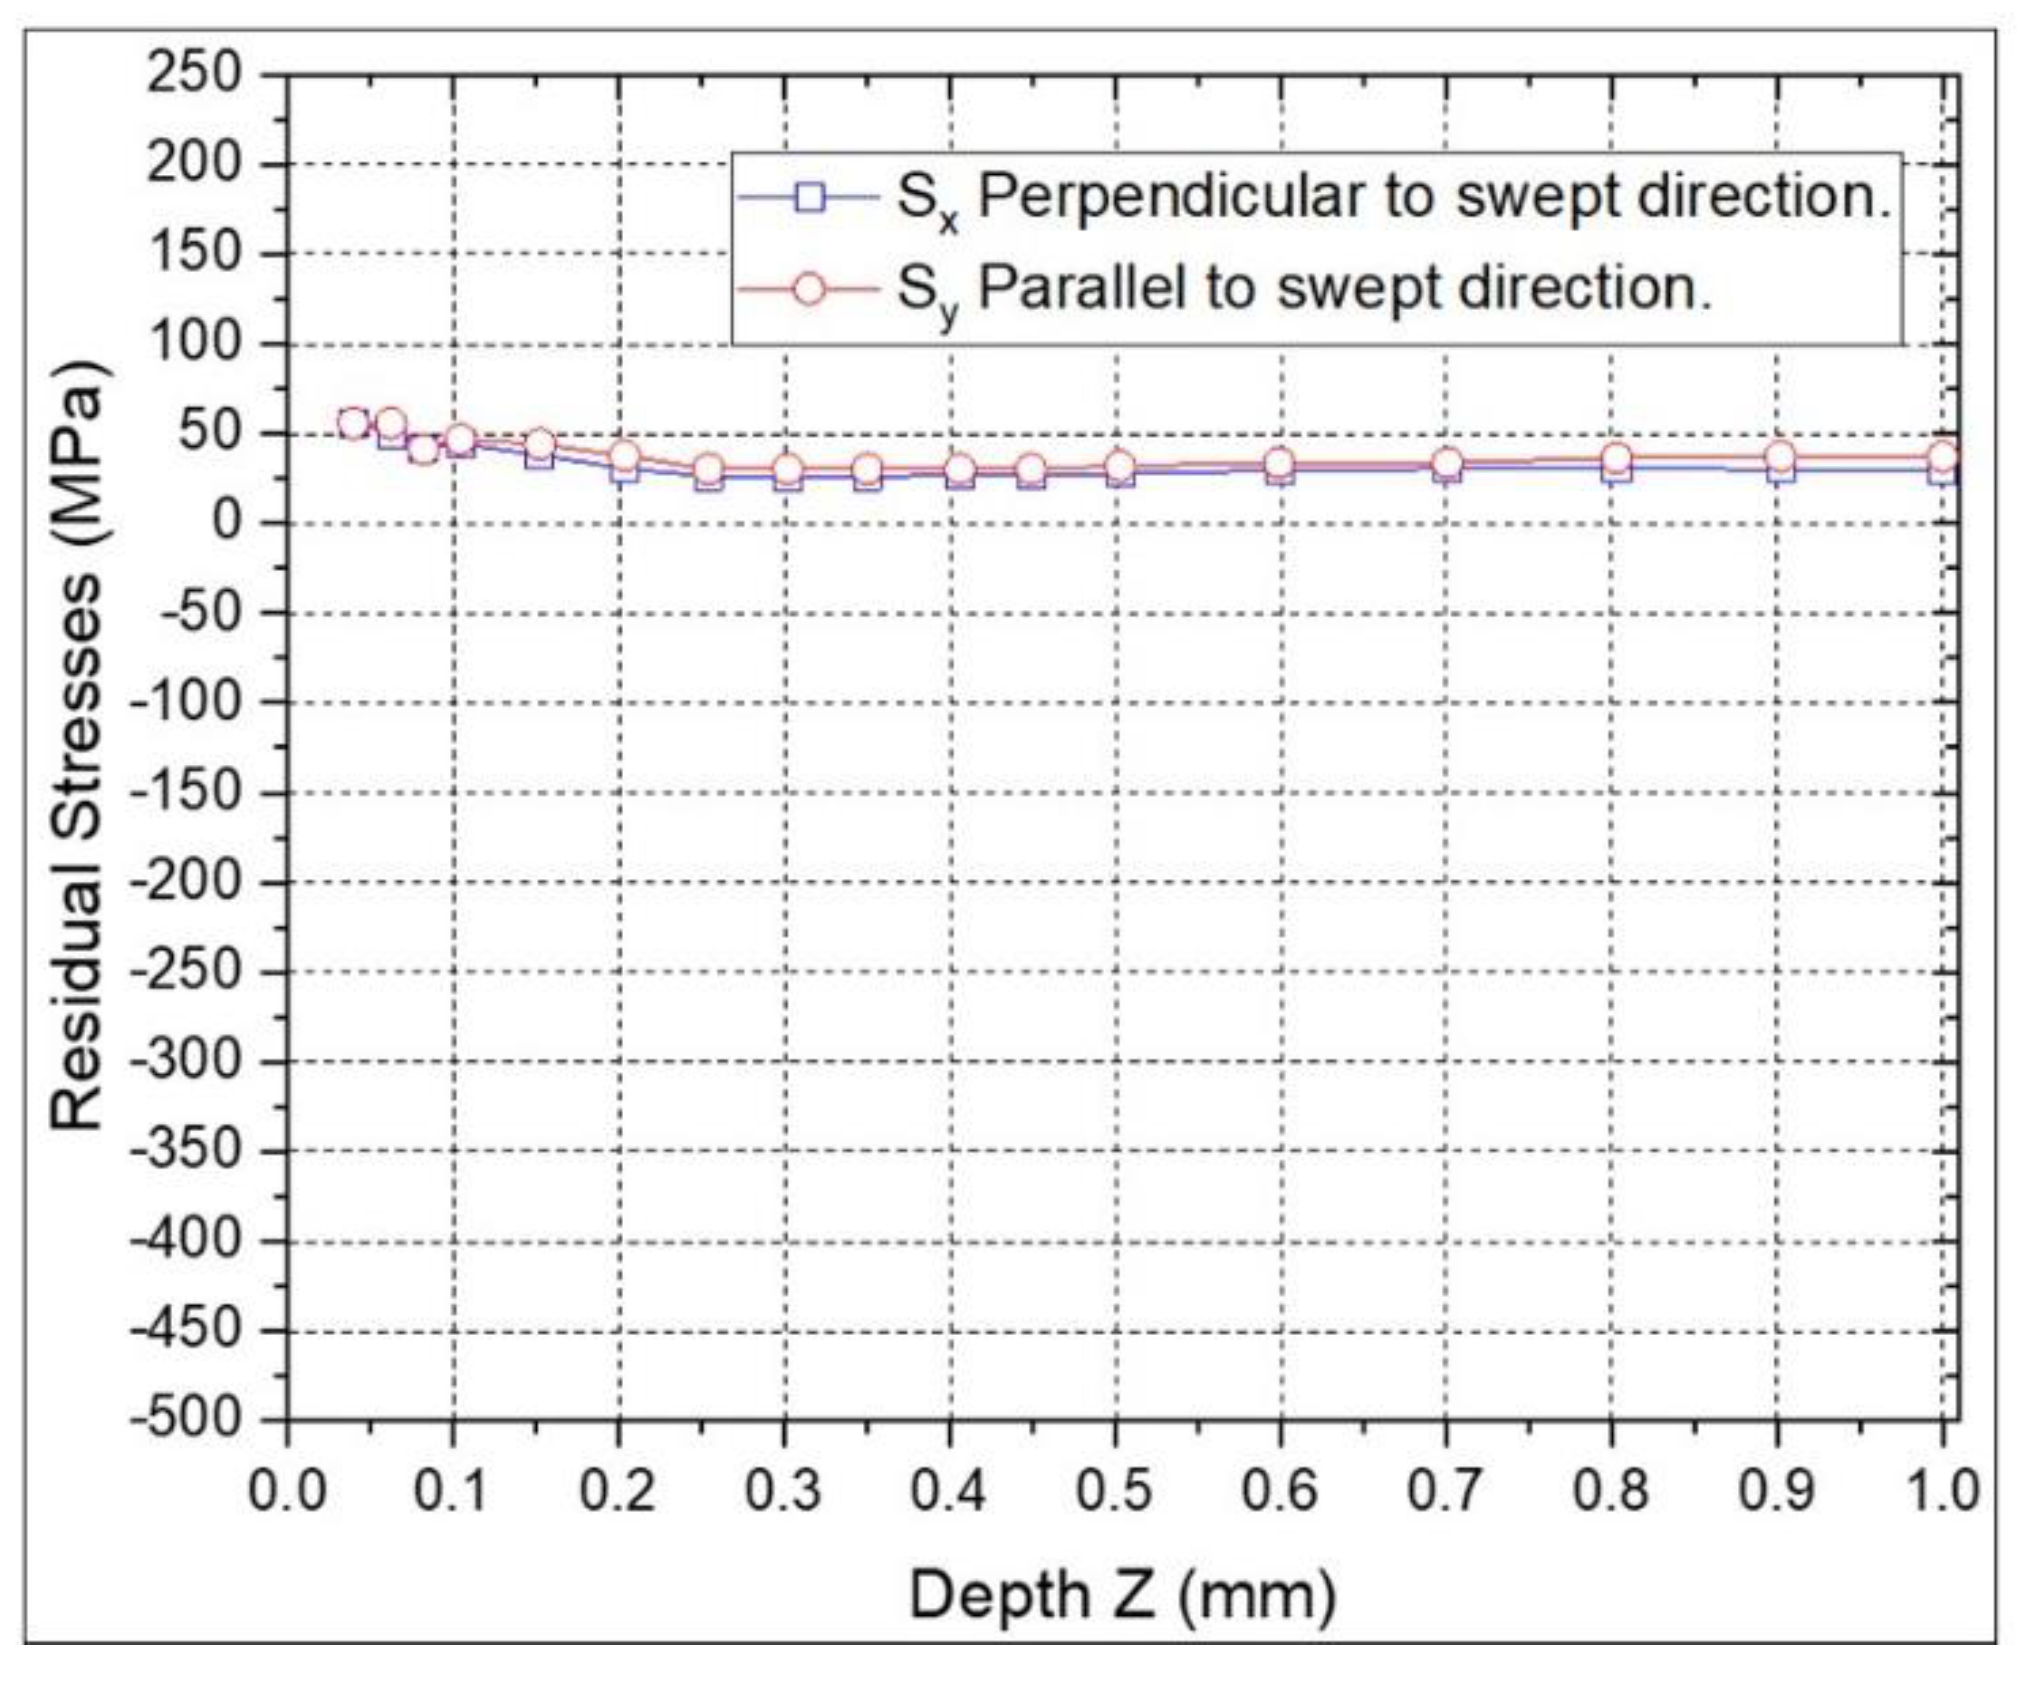
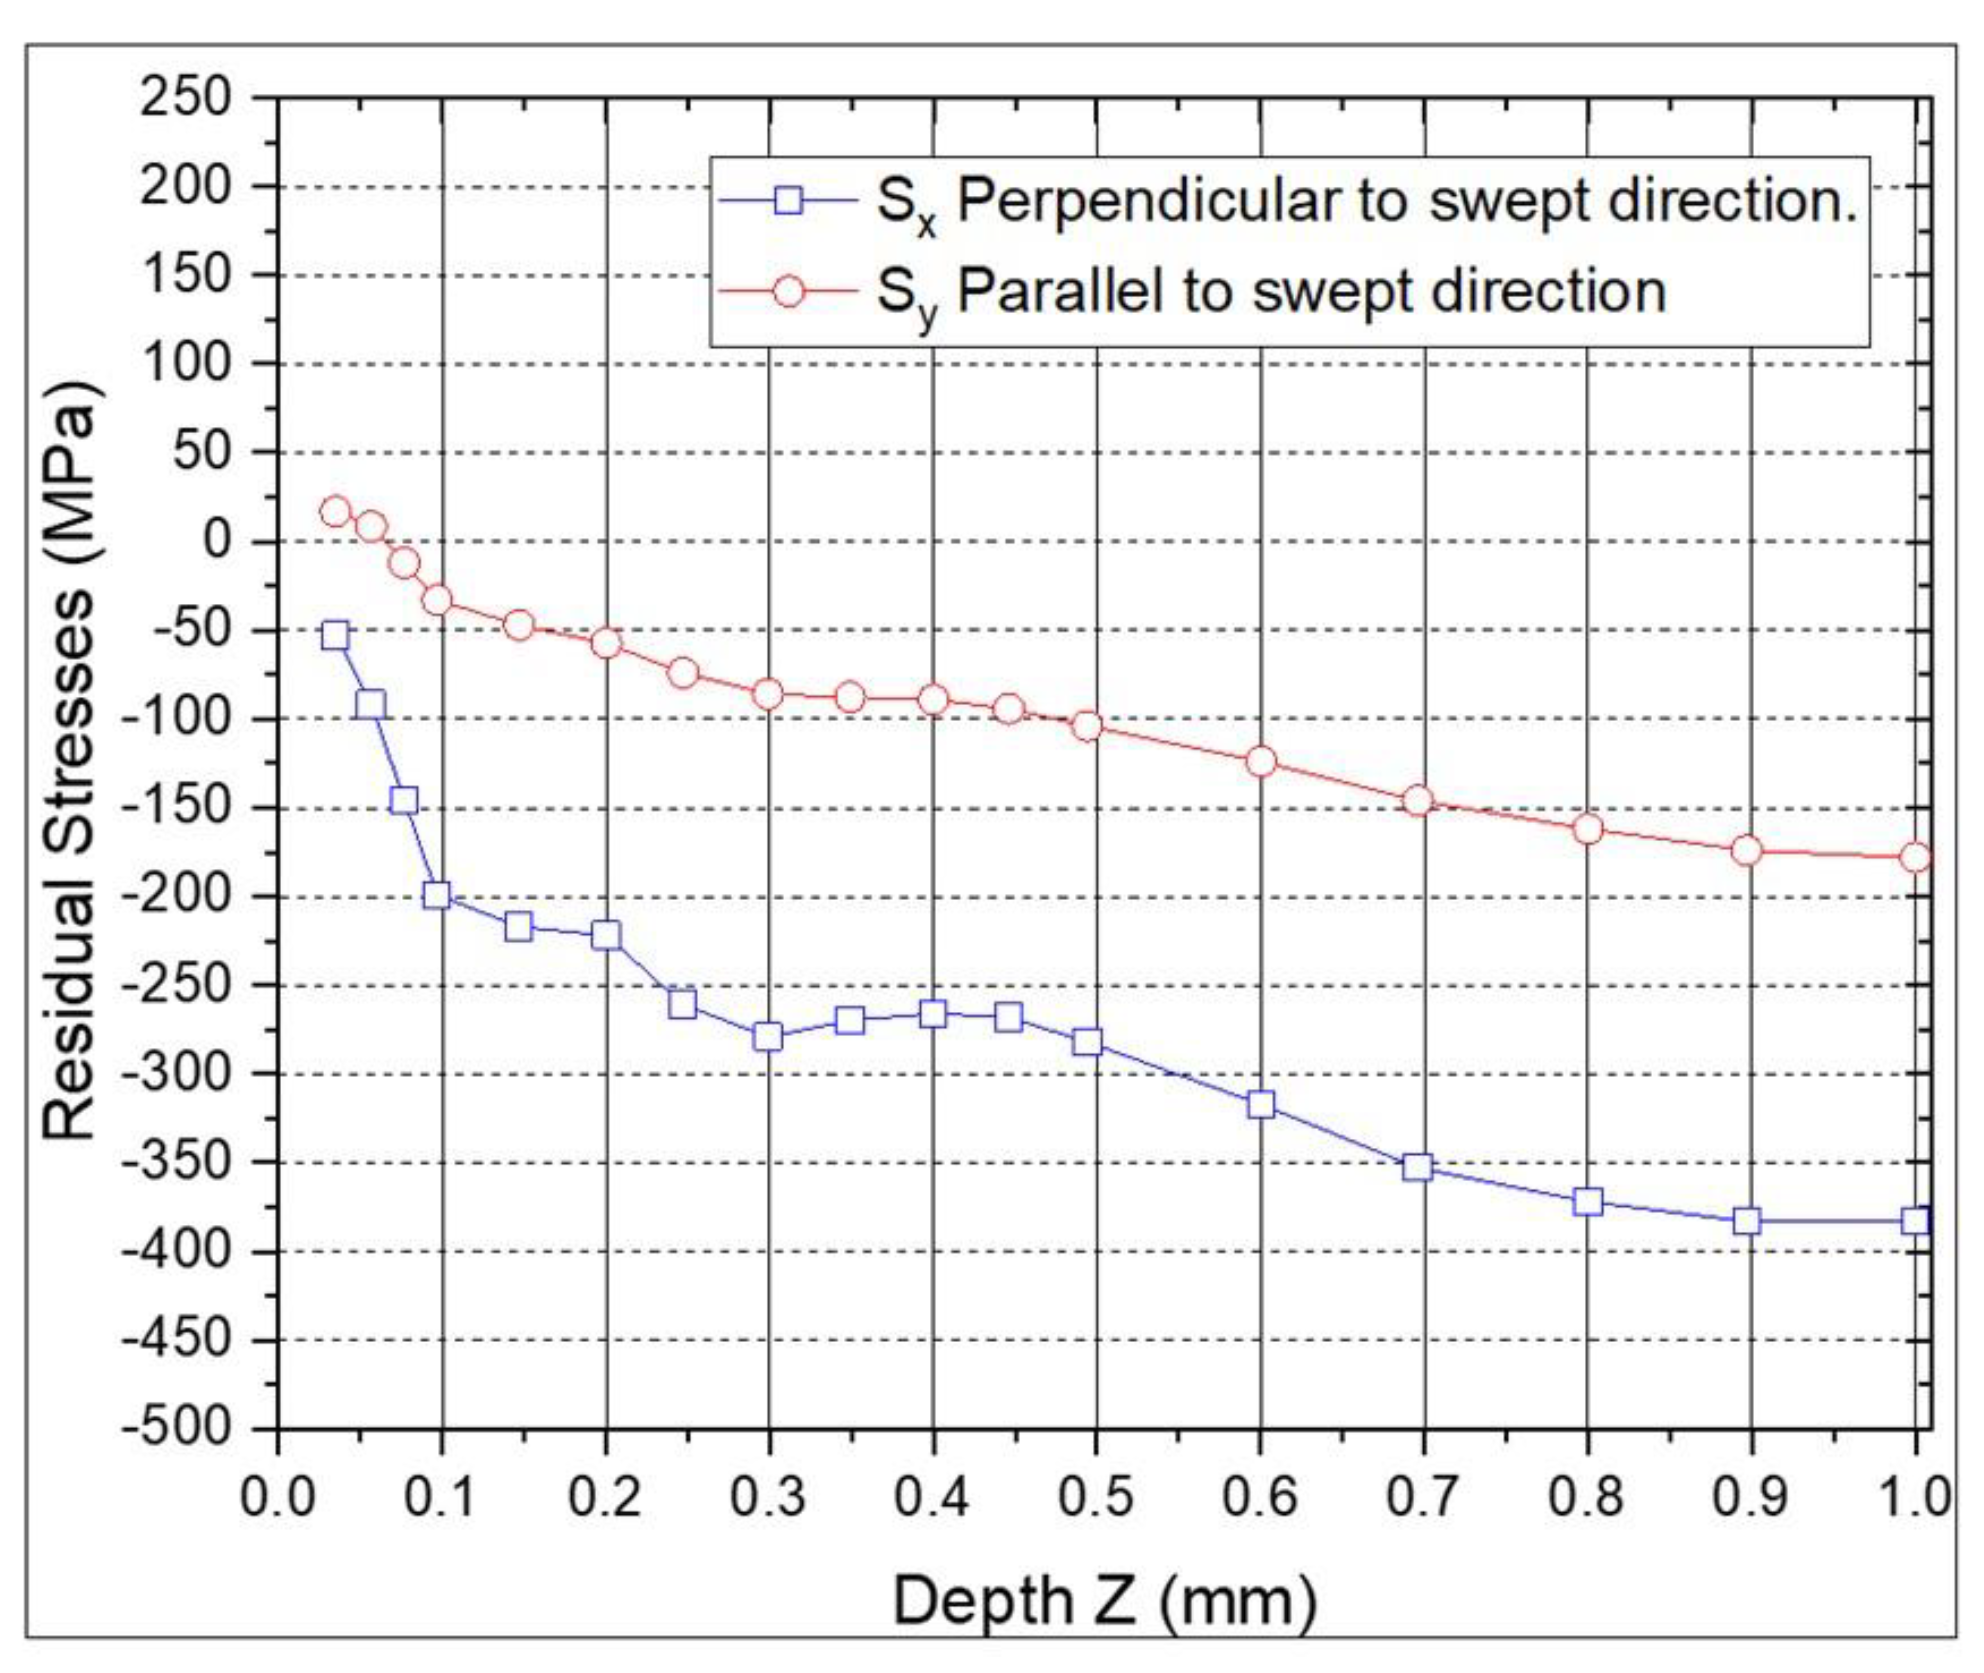
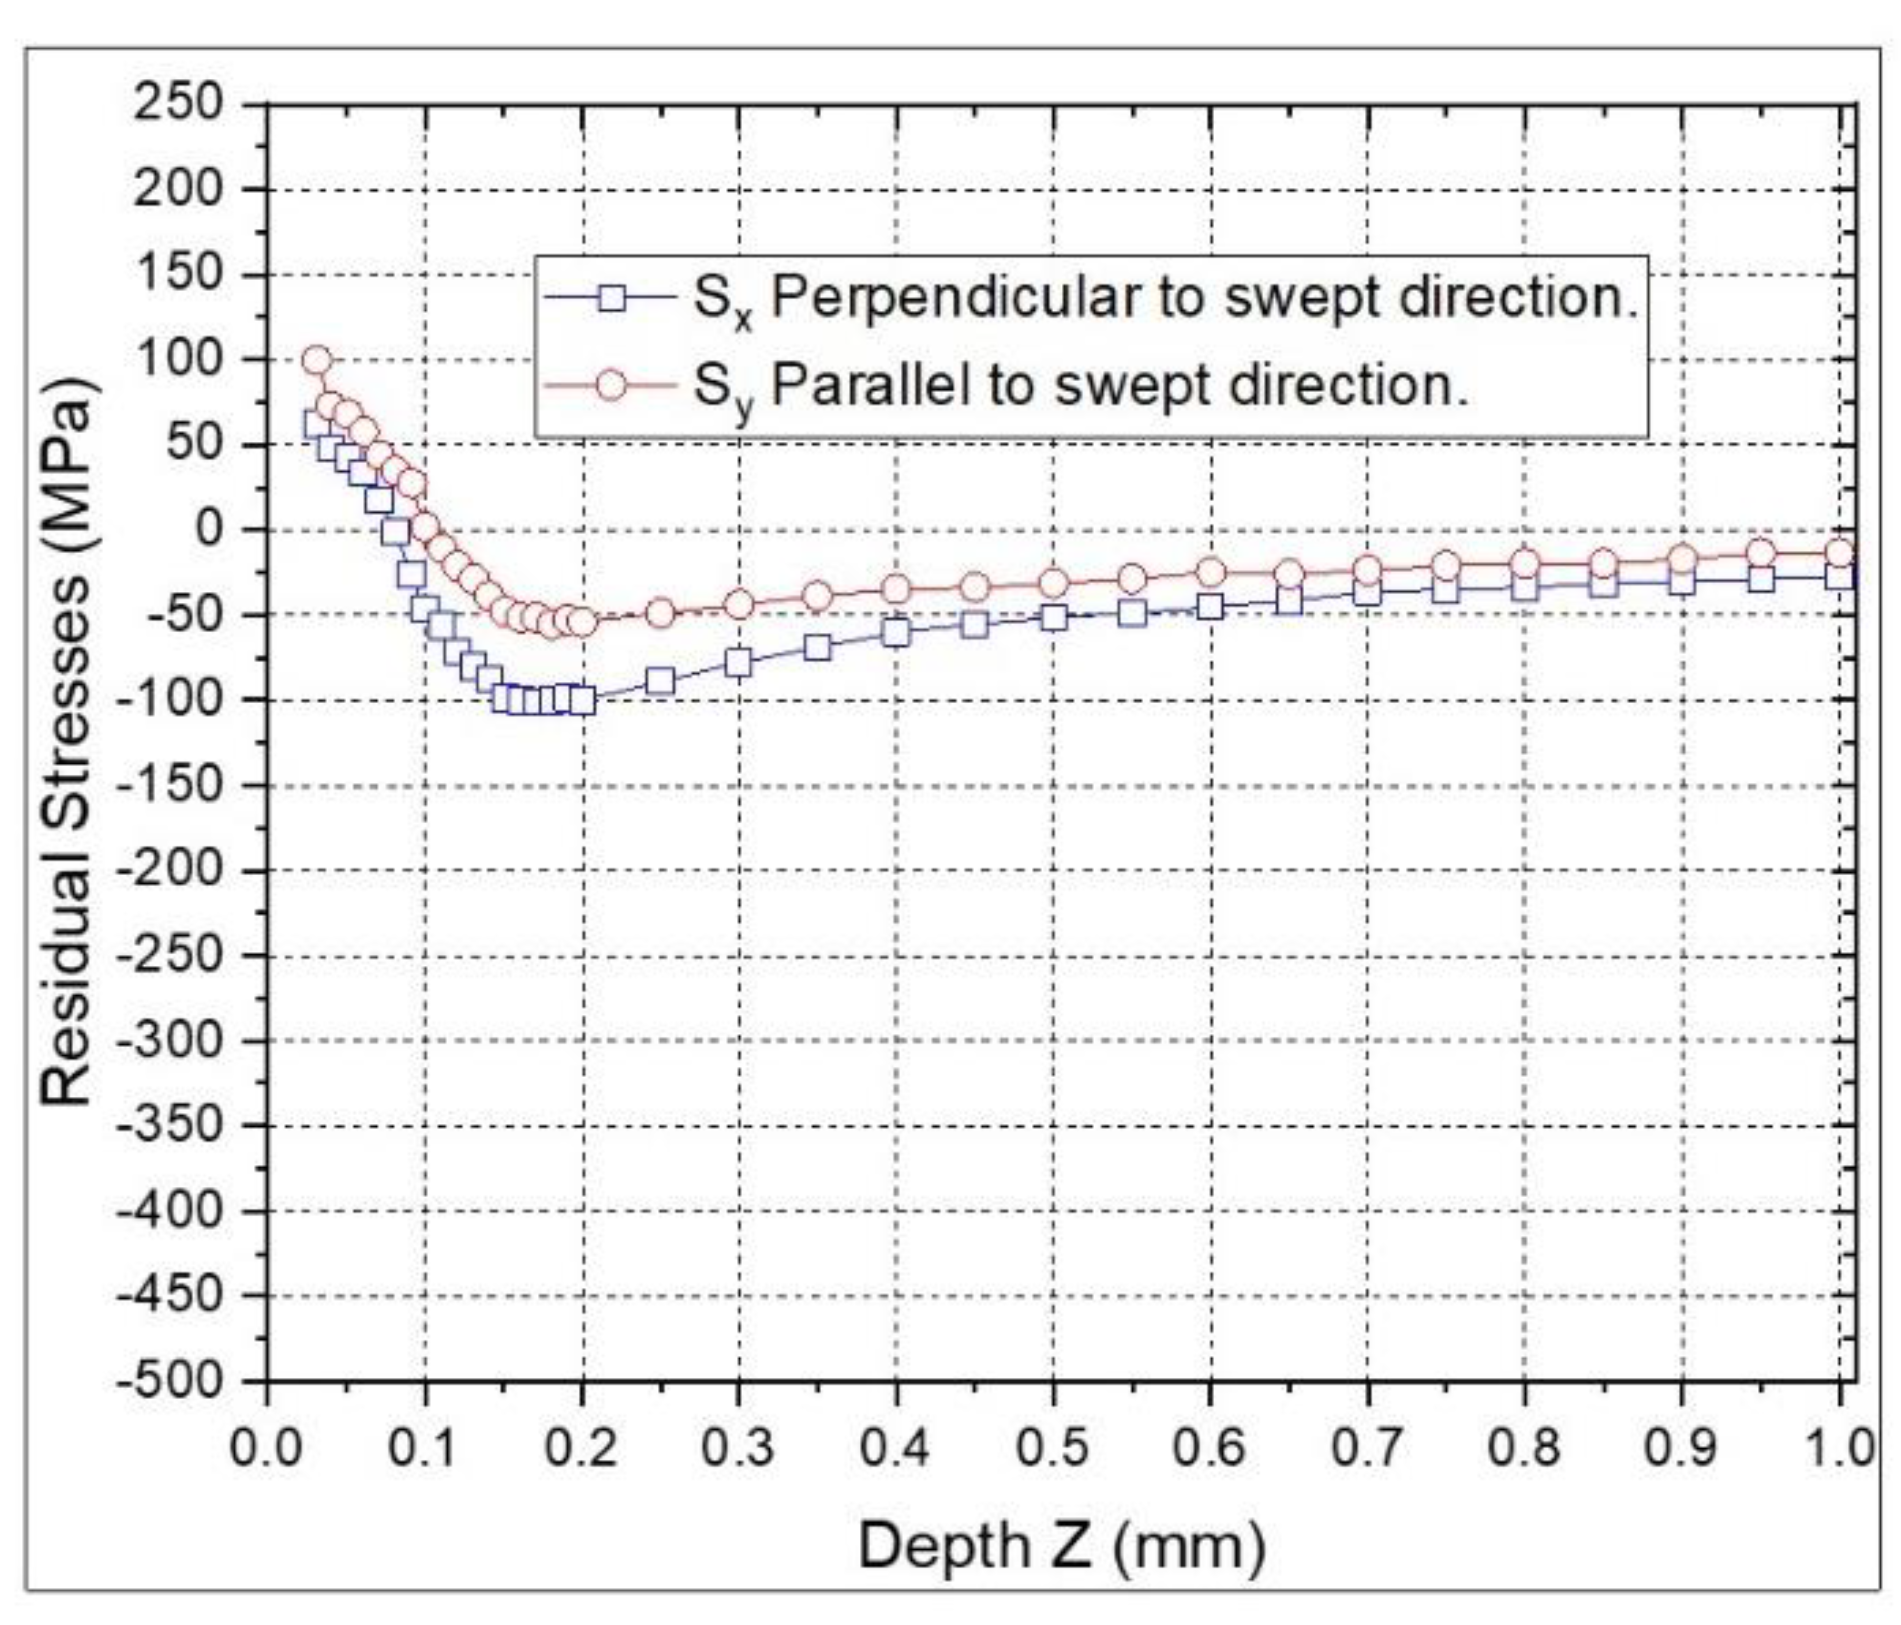
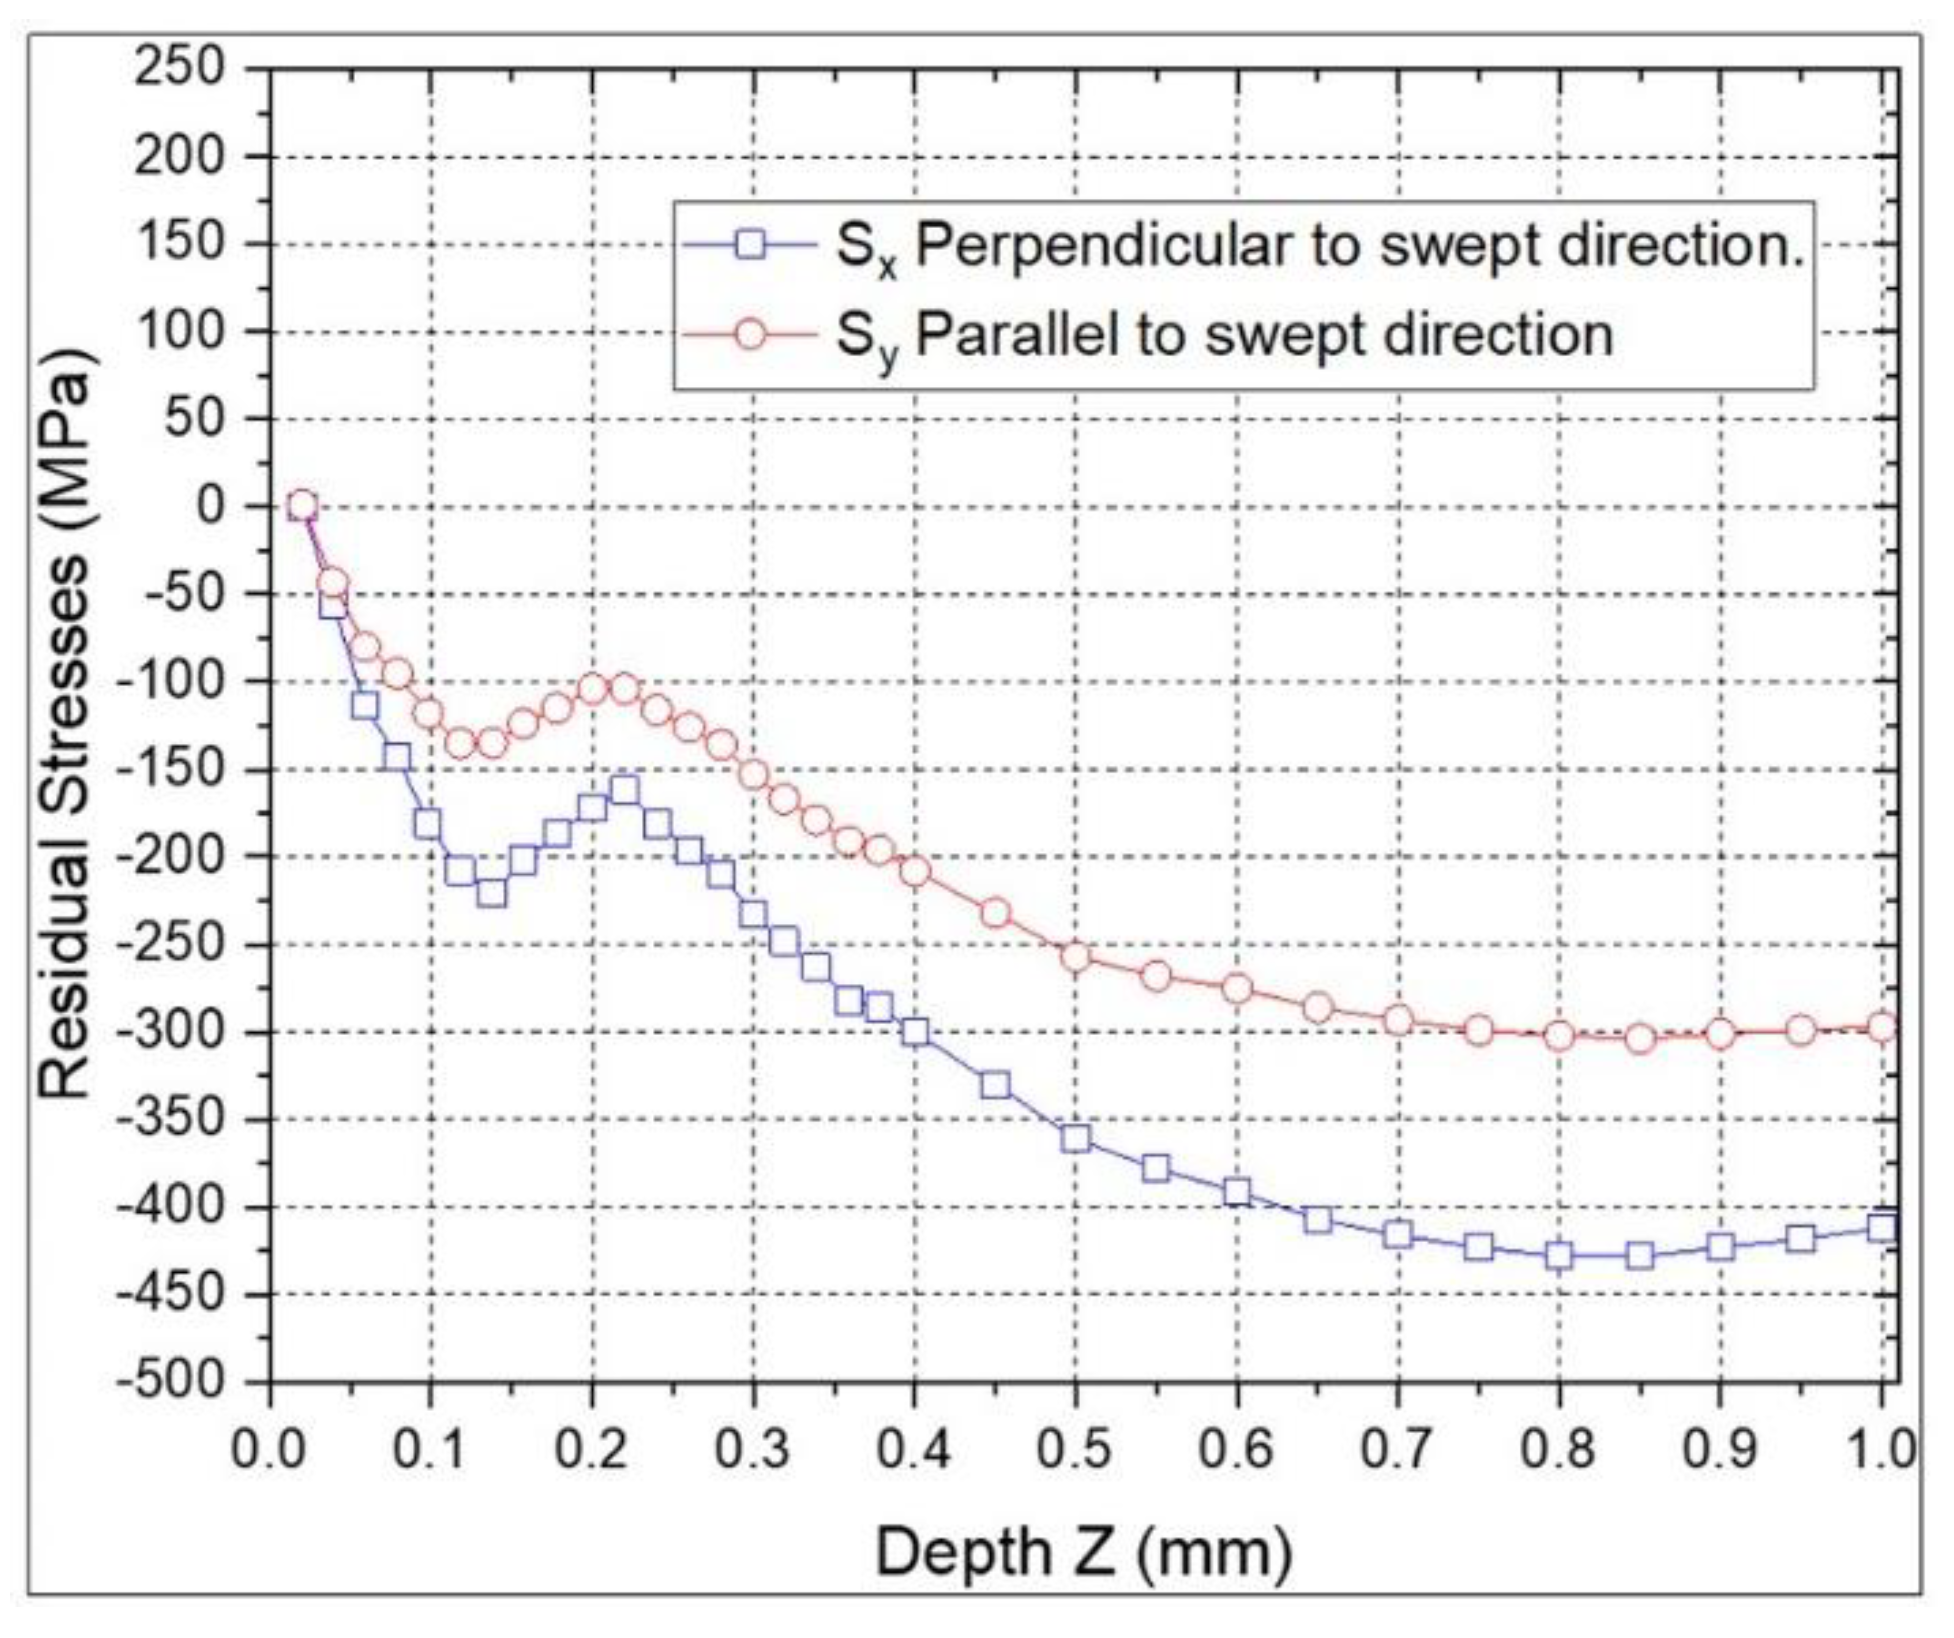
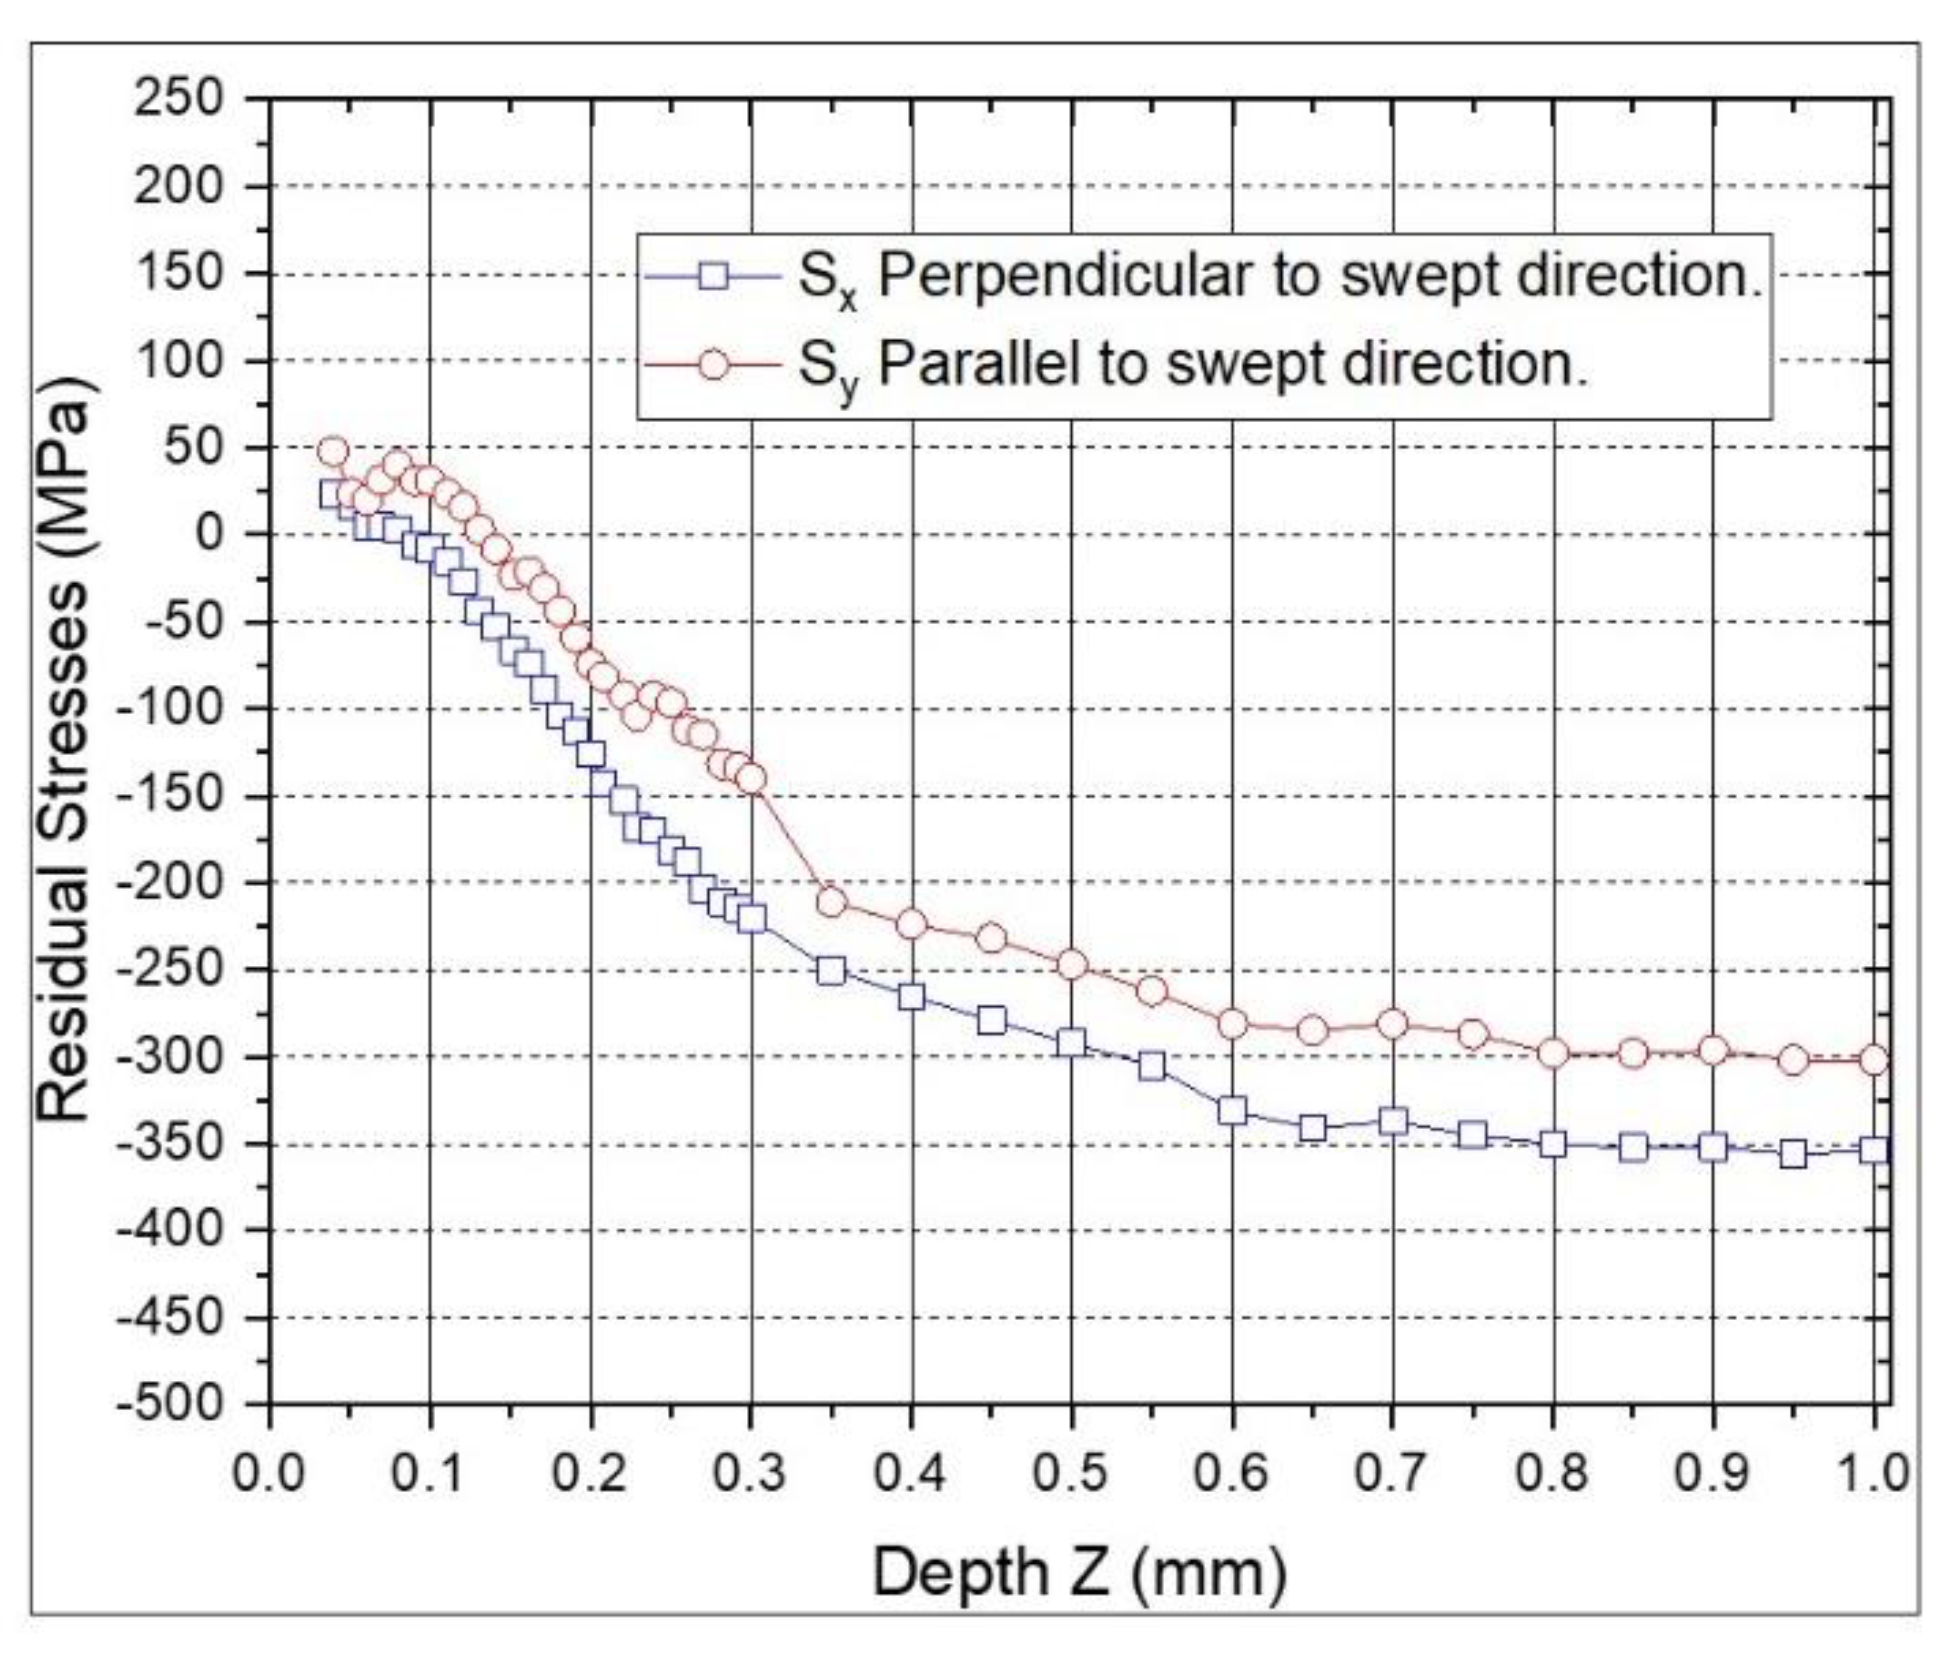
| LSP treatments | Compressive Residual Stresses Perpendicular (Sx) (MPa) |
Depth (mm) |
|---|---|---|
| ns-LSP | 383 | 1.0 |
| ps-LSP | 100 | 0.2 |
| nsps-LSP | 428 | 0.85 |
| psns-LSP | 356 | 0.95 |
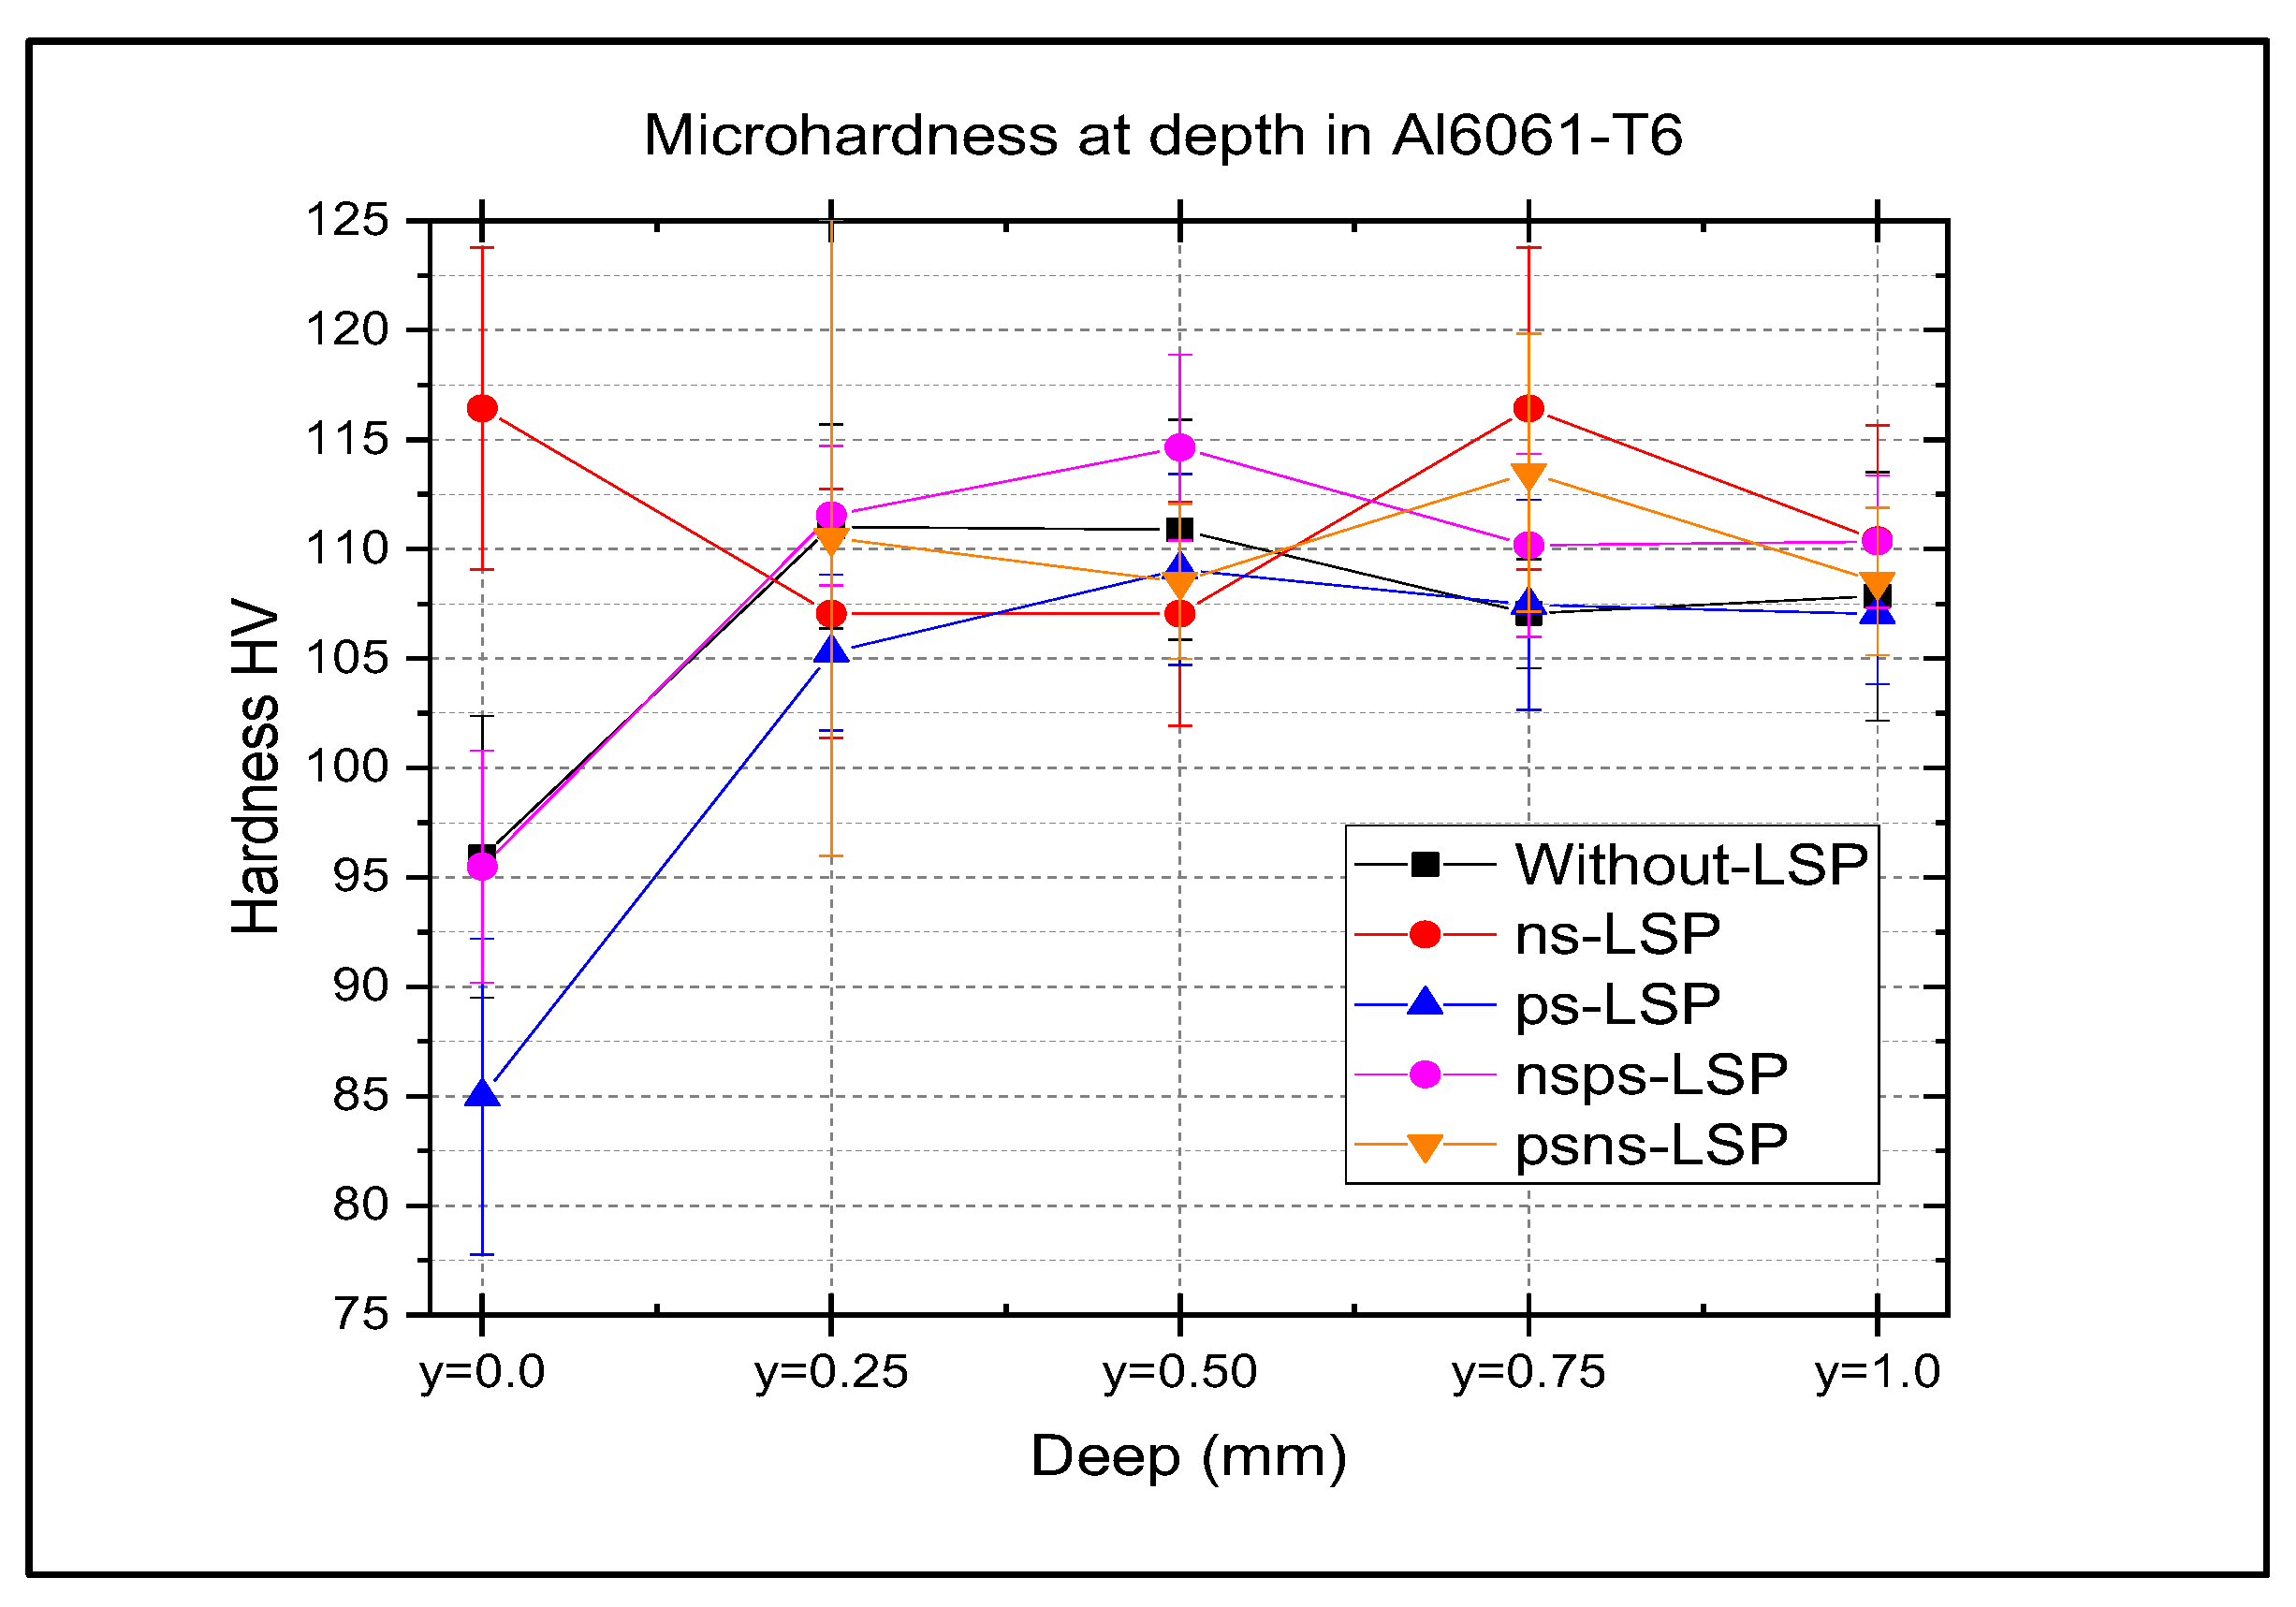
3.2. Microhardness Results
3.3. Roughness
| Target | Roughness (Ra) (μm) |
| without | 0.334 |
| ns | 7.276 |
| ps | 6.389 |
| nsps | 7.167 |
| psns | 12.109 |
4. Discussion
5. Conclusions
Author Contributions
Acknowledgments
Conflicts of Interest
References
- Uz, M.V.; Koçak, M.; Lemaitre, F.; Ehrström, J.C.; Kempa, S.; Bron, F. Improvement of damage tolerance of laser beam welded stiffened panels for airframes via local engineering. Int. J. Fatigue 2008, 31, 916–926. [Google Scholar] [CrossRef]
- Clauer, A.H. Laser shock peening, the path to production. Metals 2019, 9, 626. [Google Scholar] [CrossRef]
- Anderholm, N.C. Laser-generated stress waves. Appl. Phys. Lett. 1970, 16, 113–115. [Google Scholar] [CrossRef]
- Mallozzi, P.; Fairand, B. Altering material properties. U.S. Patent 3,850,698, Nov 26, 1974. [Google Scholar]
- Fox, J.A. Effect of water and paint coatings on laser-irradiated targets. Appl. Phys. Lett. 1974, 24, 461–464. [Google Scholar] [CrossRef]
- Fabbro, R.; Fournier, J.; Ballard, P.; Devaux, D.; Virmont, J. Physical study of laser-produced plasma in confined geometry. J. Appl. Phys. 1990, 68, 775–784. [Google Scholar] [CrossRef]
- Pacchione, M.; Hombergsmeier, E. Hybrid metal laminates for low weight fuselage structures. In Springer eBooks 2009, 41–57. [Google Scholar]
- Gómez-Rosas, G.; Rubio-González, C.; Ocaña, J.L.; Molpeceres, C.; Porro, J.A.; Morales, M.; Casillas, F.J. Laser shock processing of 6061-T6 Al alloy with 1064 nm and 532 nm wavelengths. Appl. Surf. Sci. 2010, 256, 5828–5831. [Google Scholar]
- He, Z.; Shen, Y.; Tao, J.; Chen, H.; Zeng, X.; Huang, X.; Abd El-Aty, A. Laser shock peening regulating aluminum alloy surface residual stresses for enhancing the mechanical properties: Roles of shock number and energy. Surf. Coat. Technol. 2021, 421, 127481. [Google Scholar] [CrossRef]
- Petronic, S.; Sibalija, T.; Burzic, M.; Polic, S.; Colic, K.; Milovanovic, D. Picosecond laser shock peening of Nimonic 263 at 1064 nm and 532 nm wavelength. Metals 2016, 6, 41. [Google Scholar] [CrossRef]
- Sun, R.; He, G.; Bai, H.; Yan, J.; Guo, W. Laser shock peening of Ti6Al4V alloy with combined nanosecond and femtosecond laser pulses. Metals 2021, 12, 26. [Google Scholar] [CrossRef]
- Loja, J.L.L.; Zulca, P.A.M.; Morales, J.E.T. Características del proceso de conformado en láminas de aluminio de la serie 6000. Polo del Conoc. 2020, 5, 3–21. [Google Scholar]
- Lopez, J.M.; Munoz-Martín, D.; Moreno-Labella, J.J.; Panizo-Laiz, M.; Gomez-Rosas, G.; Molpeceres, C.; Morales, M. Picose-cond laser shock micro-forming of stainless steel: Influence of high-repetition pulses on thermal effects. Materials 2022, 15, 4226. [Google Scholar] [CrossRef] [PubMed]
- Hu, C.; Zhang, Z.; Lu, W.; Li, J.; Pan, H.; Liu, L. Corrosion behavior of laser powder bed fusion TA2-Cu-Q345 composite plate subjected to picosecond laser shock peening. Opt. Laser Technol. 2025, 189, 113120. [Google Scholar] [CrossRef]
- Morales, M.; Ocaña, J.L.; Molpeceres, C.; Porro, J.A.; Garcia-Beltran, A. Model-based optimization criteria for the generation of deep compressive residual stress fields in high elastic limit metallic alloys by ns-laser shock processing. Surf. Coat. Technol. 2008, 202, 2257–2262. [Google Scholar] [CrossRef]
- Correa, C.; Peral, D.; Porro, J.A.; Diaz, M.; De Lara, L.R.; Garcia-Beltran, A.; Ocaña, J.L. Random-type scanning patterns in laser shock peening without absorbing coating in 2024-T351 Al alloy: A solution to reduce residual stress anisotropy. Opt. Laser Technol. 2015, 73, 179–187. [Google Scholar] [CrossRef]
- Sano, Y. Quarter century development of laser peening without coating. Metals 2020, 10, 152. [Google Scholar] [CrossRef]
- Rubio-Gonzalez, C.; Ocaña, J.L.; Gomez-Rosas, G.; Molpeceres, C.; Paredes, M.; Banderas, A. Effect of laser shock processing on fatigue crack growth and fracture toughness of 6061-T6 aluminum alloy. Mater. Sci. Eng. A 2004, 386, 291–295. [Google Scholar] [CrossRef]
- Flaman, M.T.; Manning, B.H. Determination of residual-stress variation with depth by the hole-drilling method. Exp. Mech. 1985, 25, 205–207. [Google Scholar] [CrossRef]
- Wang, J.Y. Measurement of residual stress by the hole-drilling method: General stress-strain relationship and its solution. Exp. Mech. 1988, 28, 355–358. [Google Scholar] [CrossRef]
- Cheng, J.; Perrie, W.; Edwardson, S.P.; Fearon, E.; Dearden, G.; Watkins, K.G. Effects of laser operating parameters on metals micromachining with ultrafast lasers. Appl. Surf. Sci. 2009, 256, 1514–1520. [Google Scholar] [CrossRef]
- Kukreja, L.M.; Hoppius, J.S.; Elango, K.; Macias Barrientos, M.; Pohl, F.; Walther, F.; Ostendorf, A. Optimization of processing parameters of ultrashort (100 fs-2 ps) pulsed laser shock peening of stainless steel. J. Laser App. 2021, 33. [Google Scholar] [CrossRef]
Disclaimer/Publisher’s Note: The statements, opinions and data contained in all publications are solely those of the individual author(s) and contributor(s) and not of MDPI and/or the editor(s). MDPI and/or the editor(s) disclaim responsibility for any injury to people or property resulting from any ideas, methods, instructions or products referred to in the content. |
© 2025 by the authors. Licensee MDPI, Basel, Switzerland. This article is an open access article distributed under the terms and conditions of the Creative Commons Attribution (CC BY) license (https://creativecommons.org/licenses/by/4.0/).


