Submitted:
13 September 2025
Posted:
15 September 2025
You are already at the latest version
Abstract
Iodine deficiency remains a significant nutritional problem, which stimulates the search for sustainable approaches to biofortification of vegetable crops. The aim of the work was to develop a "smart" bio-iodine fertilizer based on the organoiodide complex 1-carboxy-2-phenylethan-1-aminium iodide 2-azaniumyl-3-phenylpropanoate (PPI) and highly porous biochar from agro-waste, assessing its efficiency on the parsley model. PPI was synthesized and characterized (IR/UV spectroscopy, thermal analysis), biochar was obtained by KOH activation and studied by low-temperature nitrogen adsorption (S_BET) methods, as well as standard physicochemical characterization. The granulated composition PPI + biochar (BIOF) was tested in pot experiments in comparison with KI and control; The biomass of leaves and roots, iodine and organic nitrogen content, and antioxidant indices (ascorbic acid, total polyphenols, antioxidant activity) were assessed. BIOF provided a significant increase in yield and nutrition: leaf mass reached 86.55 g/plant versus 77.72 g/plant with KI and 65.04 g/plant in the control; root mass — up to 8.25 g/plant (p<0.05). Iodine content in leaves and roots increased to 11.86 and 13.23 mg/kg (d. w.), respectively, while organic nitrogen levels increased simultaneously (57.37 and 36.63 mg/kg). A significant increase in the antioxidant status was noted (ascorbic acid 36.46 mg/100 g dry weight; antioxidant activity 44.48 mg GA/g; polyphenols 23.79 mg GA/g). The presented data show that the combination of PPI with activated biochar forms an effective platform for controlled supply of iodine to plants, increasing the yield and functional qualities of products; the prospects for implementation are associated with field trials and dosage optimization.
Keywords:
iodine
; phenylalaninium phenylalanine iodide
; walnut shell biochar
; Parsley
; iodine fertilizer
; antioxidant activity
1. Introduction
The soil is the primary source of iodine for plants. The concentration of this trace element in different types of soil depends on several factors, including the direction and intensity of soil formation processes, climate, biological cycles of elements with migration, and the diversity of vegetation species. Most soils have a lack of iodine, and the rate of its intake into crop production has been decreasing, leading to concerns about its status among the human population and livestock industry.
One of the most effective and environmentally friendly methods to improve iodine levels in the population is using micro-fertilizer containing iodine. Iodine plays an important role in many physiological and biochemical processes in plants, influencing their elemental composition and productivity. It is found in proteins and amino acids as free ions, determining the pathways of their metabolism. The presence of iodine enhances the carbohydrate, nitrogen, and water metabolism in plants, leading to an increase in growth and photosynthetic activity.
Iodine has a positive impact on the quantity and quality of amino acids, as well as the ratio of protein to non-protein nitrogen in plants. This, in turn, enhances the resistance of crops to adverse environmental conditions.
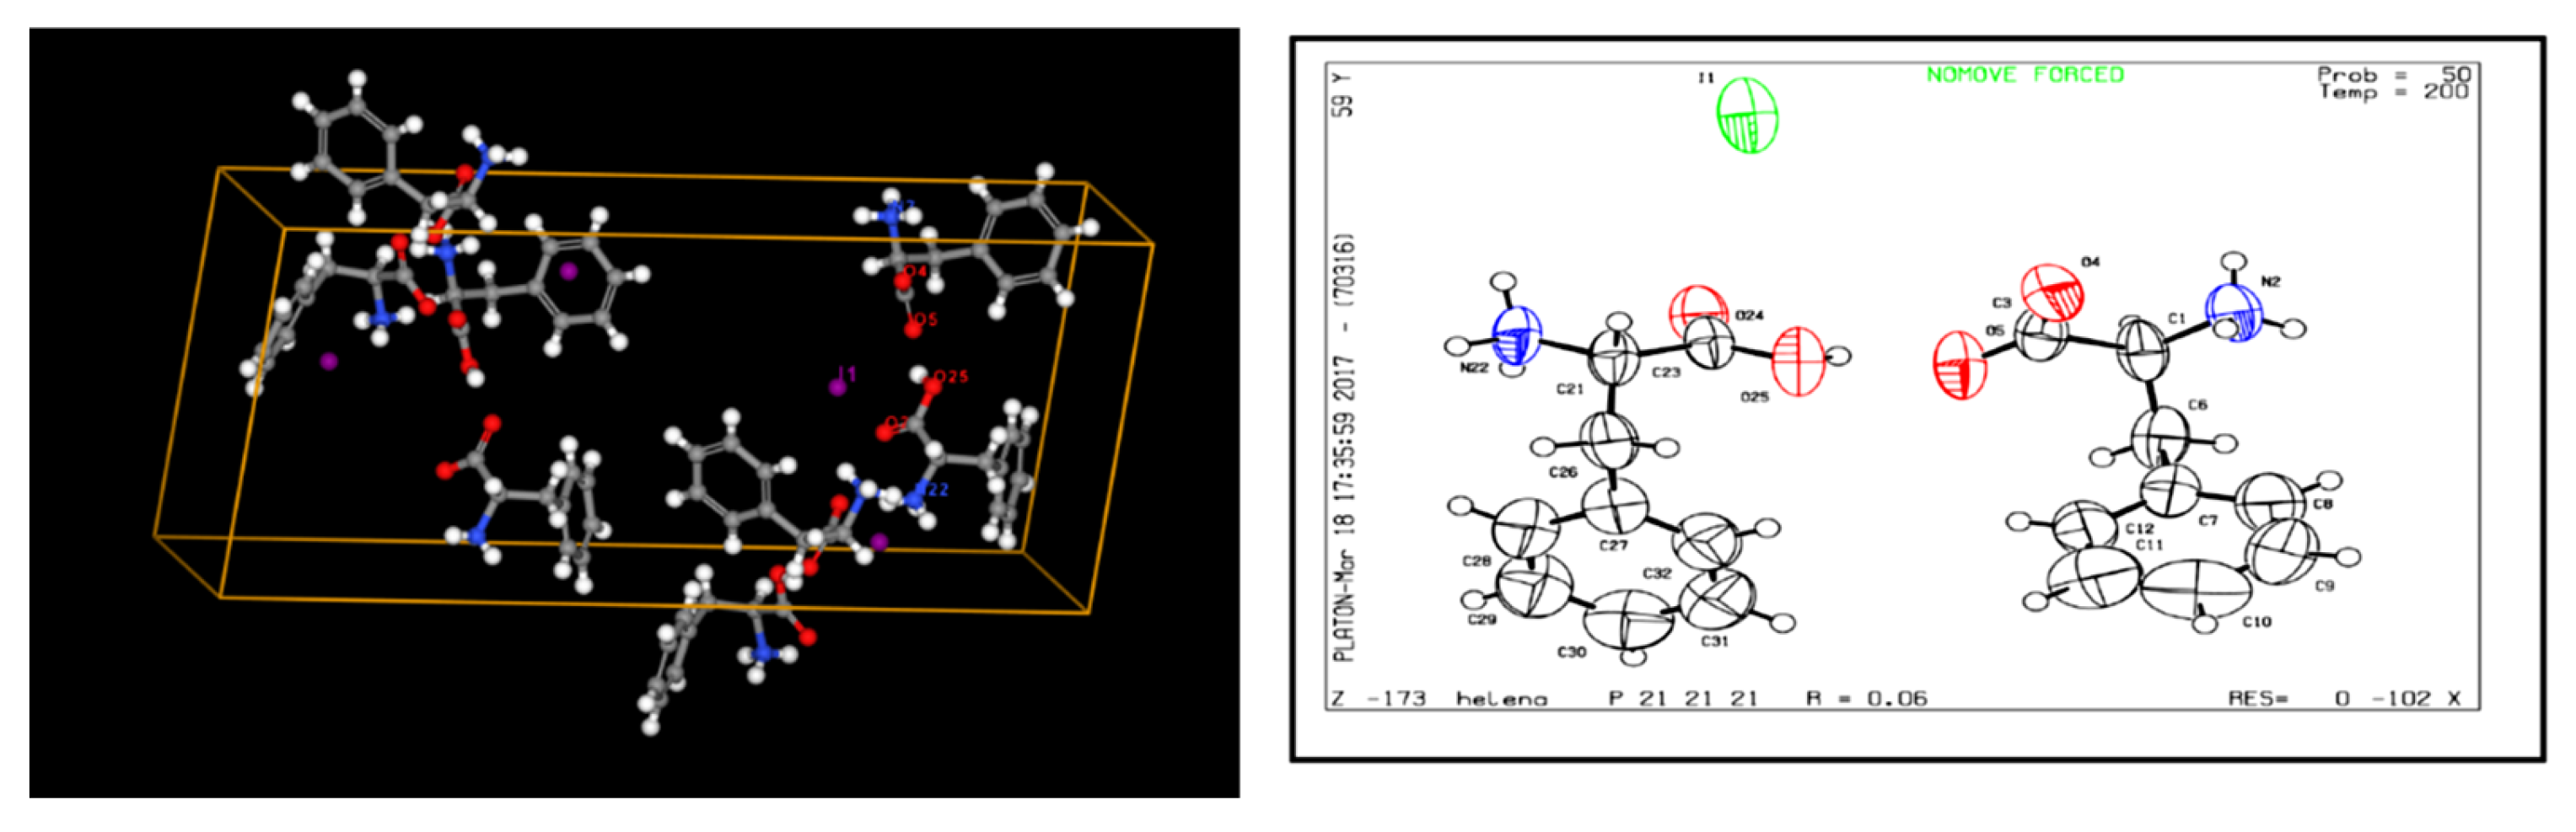
Previously our group under supervision Professor Alexander Ilyin obtained crystals of 1-carboxy-2-phenylethan-1-adminium iodide 2-azaniumyl-3-phenylpropanoate from the amino acid phenylalanine and alkali metal triiodide (KI3 or LiI3) and determined the parameters of the crystal cell [1,2]. This structure also calls as phenylalaninium phenylalanine iodide (PPI) and further in this article, for simplicity, we will use this abbreviation. It was established that the crystals obtained have rhombic syngonia and belong to the P212121 spatial group. The independent part of the unit cell contains two molecules of phenylalanine (C9H11NO2), and one anion I- (Figure 1).
Figure 1.
Crystal structure of PPI [1].
Figure 1.
Crystal structure of PPI [1].
Based on the presence of iodine, as well as amino acids in the composition of the new crystalline compound, we made a prediction about the biological activity of the compound in relation to microbial compounds, as well as as an iodine enrichment for agricultural plants. Taking into account the importance of nitrogen-containing substances, namely amino acids for plant growth and yield increase, as well as the contribution of iodine to nitrogen fixation in soil and plants [3,4,5], in this article we investigated the physico-chemical properties of PPI, as well as the possibility of its use in the environment as iodine containing fertilizer.
2. Materials and Methods
2.1. Materials
In this work, the characteristics of biochar obtained from the pyrolysis of biomass from the walnut shell, which belongs to the species Juglans regia L., also known as the common walnut, were studied.
2.2. Study of the Physicochemical and Technological Properties of PPI
The infrared (IR) spectra of the test sample were measured using a Thermo Scientific NICOLET 6700 Fourier Transform Infrared Spectrometer on a SmartPerformer instrument, equipped with a ZnSe internal reflection crystal. The ultraviolet (UV) spectra of the samples in aqueous solution were recorded using a PerkinElmer Lambda 35 two-beam ultraviolet spectrophotometer in the wavelength range between 190 and 1100 nm, employing quartz cuvettes with varying thicknesses between 1 and 10 mm.
Thermal analysis was performed using differential scanning calorimetry (DSC), utilizing a Netzsch STA 449F1 synchronous thermal analyzer. Samples weighing between 1 and 5 mg were heated from room temperature to 300 °C in corundum crucibles with a volume of 85 µl, at a heating rate of 10 degrees per minute, under a dry nitrogen atmosphere with a flow rate of 40 cm3 per minute. The heat capacity changes of the samples were recorded as differential curves in thermograms, and melting points were determined using Netzsch's Proteus software.
The bulk density of the samples was determined by weighing a measuring cylinder containing the material, using the method described by [6]. The bulk density was then calculated using the formula:
where:
ρb= m/V
ρb is the bulk density of the biochar sample, kg/m3;
m is the mass of biochar, kg;
V is the volume of biochar in the cylinder after pre–sealing, m3.
The solubility of the studied substance was determined according to [7]. Water, DMSO, ethanol, acetone, and cyclohexane were used as solvents
2.3. Obtaining Biochar from Walnut Shell
The preparation of activated biochar samples from walnut shell (WS) is carried out in two stages [8]. 5 g of conditioned (pre-cleaned and selected) plant waste is mixed with powdered KOH in a biomass/alkali ratio of 1:4 by weight. Next, it is preheated to 80 °C for 3 hours to ensure the access of KOH to the biomass. A weighed amount of the impregnated material is then placed in a vertical electric oven with air supply. In the second stage, the pyrolysis of the samples is carried out at 850 °C with a heating rate of 5 °C/min. After reaching maximum temperature, the samples are kept for 3 hours and then cooled to room temperature. The cooled material is thoroughly washed with a 0.1 M hydrochloric acid solution and distilled water to remove alkali residues. At the same time, the pH value of the washed solution is monitored. The optimal pH value is 6.0-7.0. After the washing process, the biochar samples were dried at a temperature of 100-105 °C. Non activated WS biochar obtained by the same method but without adding KOH.
2.4. Study of the Physicochemical and Technological Properties of WS Biochar
After samples of biochar were obtained, the chemical composition, bulk density, particle size distribution, and porosity were determined.
To determine the chemical composition of the samples, a QUANTA 3D 200i device (FEI, USA) was used, together with an EDAX energy dispersive X-ray spectrometer and a semiconductor-based detector with an energy tolerance of 128 eV (polymer material, sensitive area d = 0.3 mm).
The porosity of the biochar was determined by BET-sorptometry. The nitrogen adsorption-desorption process was carried out at a temperature of -196 °C using a specific surface analyzer 'Sorbtometer-M'. Surface areas were determined using the BET calculation method applied to the adsorption branch of the isotherm [9].
The features of the topography (surface) and morphology (microgeometry) of the biochar fragments were analyzed using scanning electron microscopy (JXA-8230, JEOL).
The Raman spectra of the Raman scattering of the samples were determined using an NTegra Spectra spectrometer (Al-Farabi Kazakh National University). Raman spectroscopy was performed by unpolarized radiation from a semiconductor diode laser at a wavelength of λ=473 nm. XRD was performed by S3-MICRO, The source of the X-ray is a 50-watt X-ray radiation system (with low divergence (< 1mrad) and a multilayer optical single-reflection system. The flux density (5.3 x 10⁷ photons per second). The beam divergence is up to 0.5 mrad, the resolution limit is 0.003Å-1 (Cu Ka). Multi-layer focusing mirror made of graduated W-Si. The mirror provides sagittal and meridional focus with a single reflection. The flux density (5.3 x 10⁷ photons per second).
2.5. Study of the Sorption Capacity of WS Biochar to Iodine
The iodine number is a widely used method for determining adsorption capacity due to its simplicity and rapid evaluation of the quality of activated carbon sorbent. The method is based on a three-point isotherm study. WS biochar is impregnated with iodine solution at room temperature, and the resulting mixture is filtered. The iodine content in the filtrate is determined by titration and expressed in milligrams per gram of biochar or as a percentage (weight fraction) at an iodine concentration of 0.02 M. Standard iodine solutions should be monitored at a concentration of (0.100 ± 0.001) M for all analyses [10].
2.6. Production of WS Biochar Based Fertilizer Under Laboratory Conditions
The closest in technical terms to fertilizer we are developing is a method for producing granular fertilizer based on biochar containing potassium iodide (KI) [11]. We have modified this method by using the studied PPI as the organic iodine source.
In 100 mL of distilled water, we dissolved 25-75 mg of the PPI and 0.1 grams of polyvinyl alcohol. We then added biochar to the resulting solution at a 1:1 weight ratio, mixed it thoroughly, and dried it with hot air until we obtained a crumbly mass with a moisture content between 17 % and 20 %.
2.7. Plants Planting
In laboratory conditions (average daytime temperature 22-24 °C, humidity 60 – 65 %), cultivation was carried out in plastic pots with a volume of 0.2 liters (diameter 7.5 cm), which had drainage holes at the bottom. The soil in which parsley seeds were planted had the following characteristics: humus content — 11-13 %; humidity — no more than 35 %; pH — 6.0-6.3; mineral nitrogen — 120-130 mg/kg; phosphorous compounds — 55-60 mg/kg; available potassium ions — 150-180 mg/kg.
For additional lighting, ULI-P20-18W/SPSB IP40 white fluorescent lamps with a maximum total power of 35 watts were installed at a height of 30 cm from the upper sashes.
As part of the experiment, the bio-enrichment of parsley with iodine was studied in the following variants:
1. Control without processing.
2. Pure biochar.
3. KI at a concentration of 15 mg/kg of soil.
4. Biochar with a total iodine content of 1.5 % in the sample (15 mg/kg of iodine or 51 mg of PPI).
2.8. Sample Preparation of Plant Specimens
After harvesting, the plants were washed with distilled water to remove any soil residues. Then the leaves, roots and petioles were separated, weighed and homogenized to create fresh homogenates, which were used to determine the content of ascorbic acid and photosynthetic pigments. The remaining material was dried at 50 °C to a constant weight to further determine the concentrations of nitrates, water-soluble compounds, antioxidant activity, and polyphenols. To determine dry matter content, samples were dried until they reached constant mass using the gravimetric method [12].
2.9. Determination of Ascorbic Acid Concentration, Polyphenols in Plants
The concentration of ascorbic acid was determined by a titrimetric method using Tilmans reagent (2,6-sodium dichlorophenolindophenolate) [13].
The polyphenol concentration in the plant samples was determined using a spectrophotometer and the Folin-Ciocalteau reagent [14]. One gram of dried parsley was extracted with 20 mL of 70 % ethanol for one hour at 70 °C. The extract was cooled to 22 to 25 °C and then quantitatively transferred to a 50 mL volumetric flask. The flask was then brought up to volume with 70 % alcohol.
The final solution was prepared by mixing and filtering it through a folded filter. One milliliter of the final extract was added to a twenty-five milliliter volumetric flask, along with 2.5 mL of saturated sodium carbonate solution and one-fourth milliliter Folin-Ciocalteu reagent diluted 1:1 with distilled water. The mixture was stirred and then brought up to the mark with distilled water. After one hour, the absorbance was measured at 730 nm on a SF-56 spectrophotometer.
To determine the polyphenol content, a standard curve was generated using six standard solutions of gallic acid with concentrations ranging from 0 to 90 mcg/ml. Gallic acid equivalents were calculated based on the standard curve and expressed as milligrams per gram dry weight.
2.10. Determination of the Antioxidant Activity of Samples (AOA)
To determine the antioxidant capacity (AOA) of the samples, a colorimetric method was used based on the titration of 0.01 N potassium permanganate in an acid medium with ethanol extract of parsley before discoloration, which indicates a complete reduction of Mn+7 to Mn+2. Gallic acid was used as a standard for comparison. The results were expressed in terms of milligrams of gallic acid per gram of dry weight (mg GA/g d.w.).
2.11. Determination of the Total Iodine Content
Total iodine was determined using an Ecotest voltammetric analyzer (Russia), equipped with a three-electrode electrochemical cell. The auxiliary and reference electrodes were made of silver chlorides in 1 M KCl, and a silver electrode was used as well.
2 ml of a 10 % potassium hydroxide solution was added to 0.1 g of the homogenized dried sample. The resulting mixture was then mineralized at 550 °C. After cooling, 1 ml of a 10 % zinc sulfate solution was added.
The sample was then dissolved in 10 ml of distilled water and the iodine concentration was determined. Formic acid was used as a background electrolyte, and standard solutions of potassium iodide with concentrations of 0.1 mg/L, 1 mg/L, and 10 mg/L were used [15].
2.12. Statistical Analysis.
Statistical differences between measurements were determined by analysis of variance (ANOVA) using Origin (data analysis software). Average values were compared using the least significant difference (LSD) test at p <0.05.
3. Results and Discussion
3.1. Determination of Physico-Chemical Parameters of PPI
Synthesis of the phenylalanine·iodine complex. Acetone (Sigma, USA) and iodine (Reachim, Russia) were mixed at a temperature of 60-65 °C to produce hydrogen iodide:
H3CCOCH3 + I2 → CH2ICOCH3 + HI
Then phenylalanine was added and acetone was slowly evaporated. As the acetone evaporates, crystals of black color form were obtained. Crystals has a rhombic syngony and are stable at a temperature of 25 °C. The chemical formula of this compound can be represented as: 2C9H11NO2·HI, and the formation reaction:
2С9H11NO2 + HI → [H(C9H11NO2)2I]
Figure 2 shows the vibrational IR spectra of the compound under study. Table 1 shows the spectral characteristics: band wavenumber, cm-1, band assignment [16,17,18].
Figure 2.
IR spectrum of PPI (a) and D-phenylalanine (b).
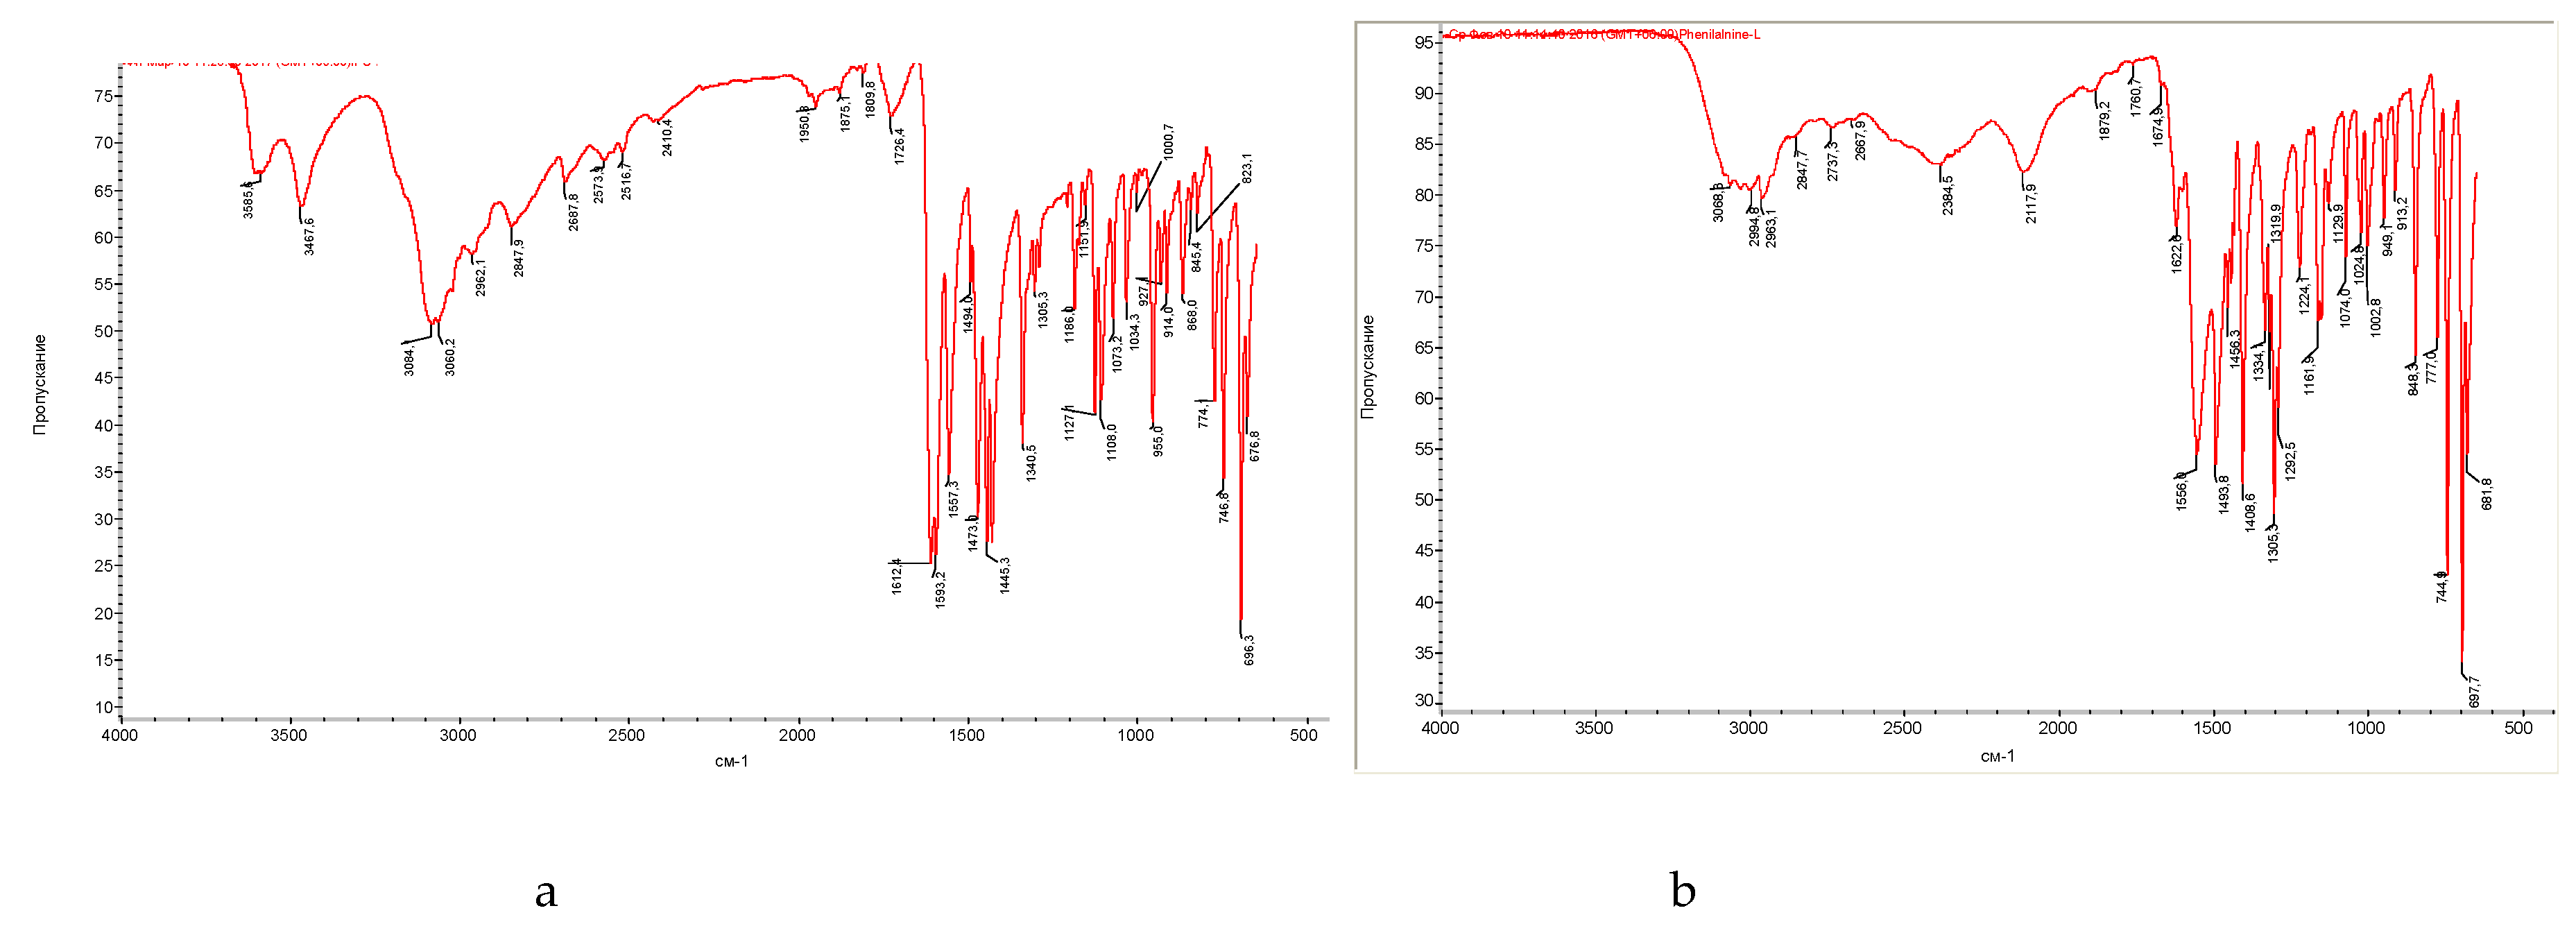

Table 1.
Spectral characteristics of PPI crystals and its components (IR spectra).
| Band number | Phenylalanine band, cm-1 |
Acetone band, cm-1 |
PPI band, cm-1 |
Band description |
| 1 | - | - | 3585,6 | 3602-3544, ν -ОН, (intramolecular hydrogen bonds) |
| 2 | - | - | 3467,6 | 3470-3410, ν – NH2 |
| 3 | 3068,3 | - | - | ν ─N-H |
| 4 | - | - | 3084,1 | 3100-3070, ─NH3+ |
| 5 | - | - | 3060,2 | 3080-3030, ν ─СH (aromatic) |
| 6 | 2994,8 | 3015,0 | - | ν ─CH2, ─CH3 |
| 7 | 2963,1 | 2966,0 | 2962,1 | 2988-2949, νs –CН2 |
| 8 | - | 2942,0 | - | |
| 9 | 2847,7 | - | 2847,9 | 3300-2500, ν –ОН, ν ─NH+, ─NH2+, ─NH3+ |
| 10 | - | - | 2687,8 |
2700-2250, ν – NH+, - NH2+ |
| 11 | - | - | 2573,9 | |
| 12 | - | - | 2516,7 | |
| 13 | 2384,5 | - | - | ν ─С-NH+ |
| 14 | 2117,9 | - | - | |
| 15 | - | - | 1950,3 |
2000-1650, overtones of aromatic groups |
| 16 | - | - | 1875,1 | |
| 17 | - | - | 1809,8 | |
| 18 | - | 1730,0 | 1726,4 | 1730-1710, ν ─C=O |
| 19 | 1622,6 | - | - | ν ─C-NH3+ |
| 20 | - | - | 1612,4 |
1640-1530, ν ─C=O |
| 21 | - | - | 1593,2 | |
| 22 | 1556,0 | - | 1557,3 | |
| 23 | 1493,8 | - | 1494,0 | 1520-1490, δs NH3+, ν ─COO- |
| 24 | - | - | 1473,0 | 1525-1475, aromatic ring oscillation |
| 25 | 1456,3 | 1456,0 | 1445,3 | 1465-1440, aromatic ring oscillation, δ ─CH2, ─CH3 |
| 26 | - | 1434,0 | - | δ ─CH2, ─CH3 |
| 27 | 1408,6 | - | - | ν ─COO-…HOOC─ (dimers) |
| 28 | - | 1365,0 | 1340,5 | 1350-1280, ν – С-N, δ– CH-C=O |
| 29 | 1334,1 | - | - |
ν С6Н5─СН2─СН─NH (aromatic amines) |
| 30 | 1319,9 | - | - | |
| 31 | 1305,3 | - | 1305,3 | 1335-1300, fluctuations of ionic carboxyl in amino acids |
| 32 | 1292,5 | - | - | 1350-1280, ν – С-N |
| 33 | 1224,1 | 1227,0 | - |
δ ─CH2, ─CH3 |
| 34 | - | 1215,0 | - | |
| 35 | 1161,9 | - | 1186,0 |
1200-1100, ν ─C-N─ |
| 36 | 1129,9 | 1090,0 | 1127,1 | |
| 37 | - | - | 1108,0 | |
| 38 | 1074,0 | - | 1073,2 | 1110-1070, δ -СН in aromatic |
| 39 | 1024,8 | - | 1034,3 | 1070-1000, δ -СН in aromatic |
| 40 | 1002,8 | - | - | ν C6H5─ |
| 41 | 949,1 | - | 955,0 | 1000-960, δ -СН in aromatic |
| 42 | - | - | 927,1 |
955-890, δ – ОН |
| 43 | 913,2 | - | 914,0 | |
| 44 | - | 892,0 | 868,0 | 900-860, δ ─CH (in aromatic) |
| 45 | 848,3 | - | 845,4 | 900-650, δ – NН, ν ─C-N─ |
| 46 | 777,0 | 765,0 | 774,1 |
900-650, δ ─C-H |
| 47 | 744,9 | - | 746,8 | |
| 48 | 697,7 | 697,0 | 696,3 | |
| 49 | 681,8 | 530,0 | 676,8 |
It has been determined that phenylalanine in the system exists in the form of a zwitterion, as indicated by the peak at 2847.7 cm-1, which is characteristic of the valence vibrations of amino groups with a positive charge. Based on the lack of significant changes in the position of the characteristic peaks for amino group vibrations in PPI, it can be inferred that these functional groups are not involved in coordination and remain in an unchanged state.
The band at 1161.9 cm⁻¹ indicates the dimeric configuration of phenylalanine in the system, formed by the binding of hydroxyl oxygen atoms from two amino acid molecules through an active proton. This active proton can be represented by hydrofluoric acid, which is formed through an exchange reaction between molecular iodine and acetone. The shift in the 1365.0 cm⁻¹ band of the acetone IR spectrum to the shorter wavelength region in PPI by 25 cm⁻¹ may indicate the addition of an iodine atom in place of a hydrogen. This band is associated with the deformation vibrations of methyl groups adjacent to a carbonyl carbon atom.
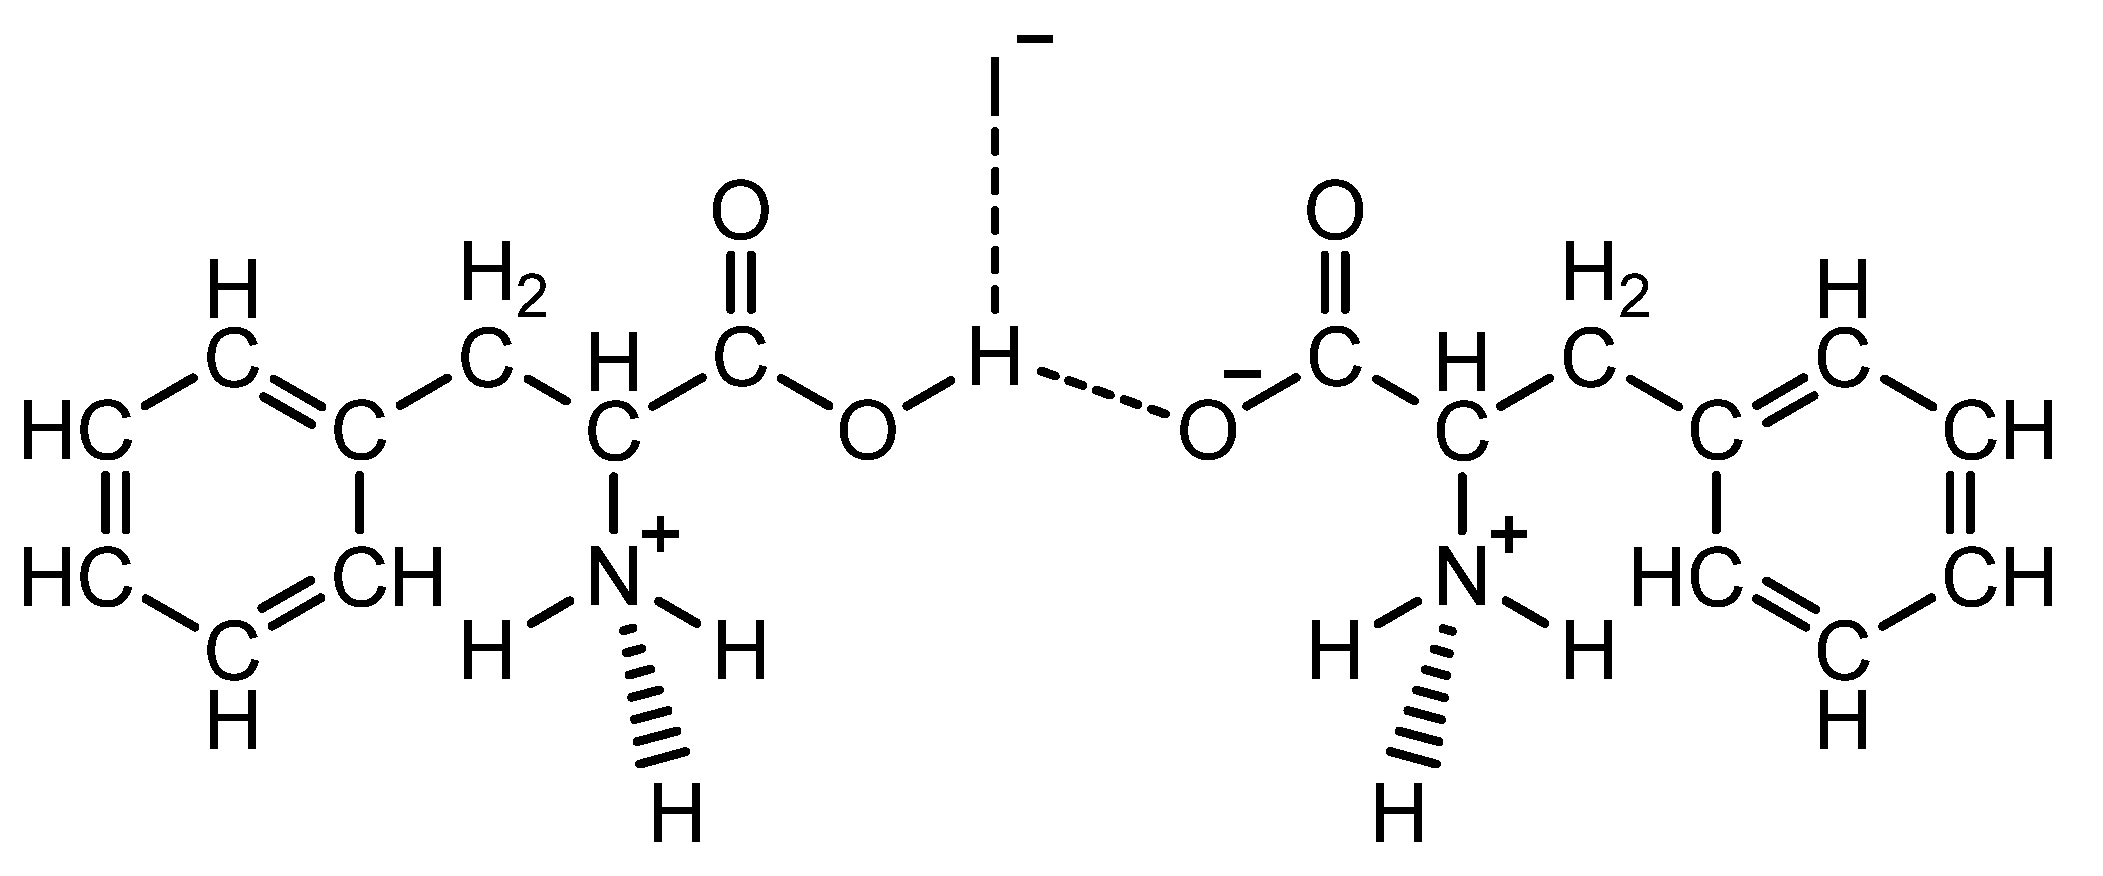
Figure 3 schematically shows the chemical formula of PPI.
Figure 3.
Formula of PPI crystals.
The UV spectra of a 0.1 % aqueous solution of phenylalanine (control) and a 0.1 % aqueous solution of the resulting iodine organocomplex were measured. The UV spectrum of phenylalanine showed one high peak at 205.95 nm and smaller peak at wavelengths between 251 and 263 nm (Figure 4b). The UV spectrum for PPI showed a main absorption peak at 223.98 nm, as well as smaller absorption peak at 289 nm (Figure 4a).
Figure 4.
UV spectrum of PPI (a) and phenylalanine solution in water (b).
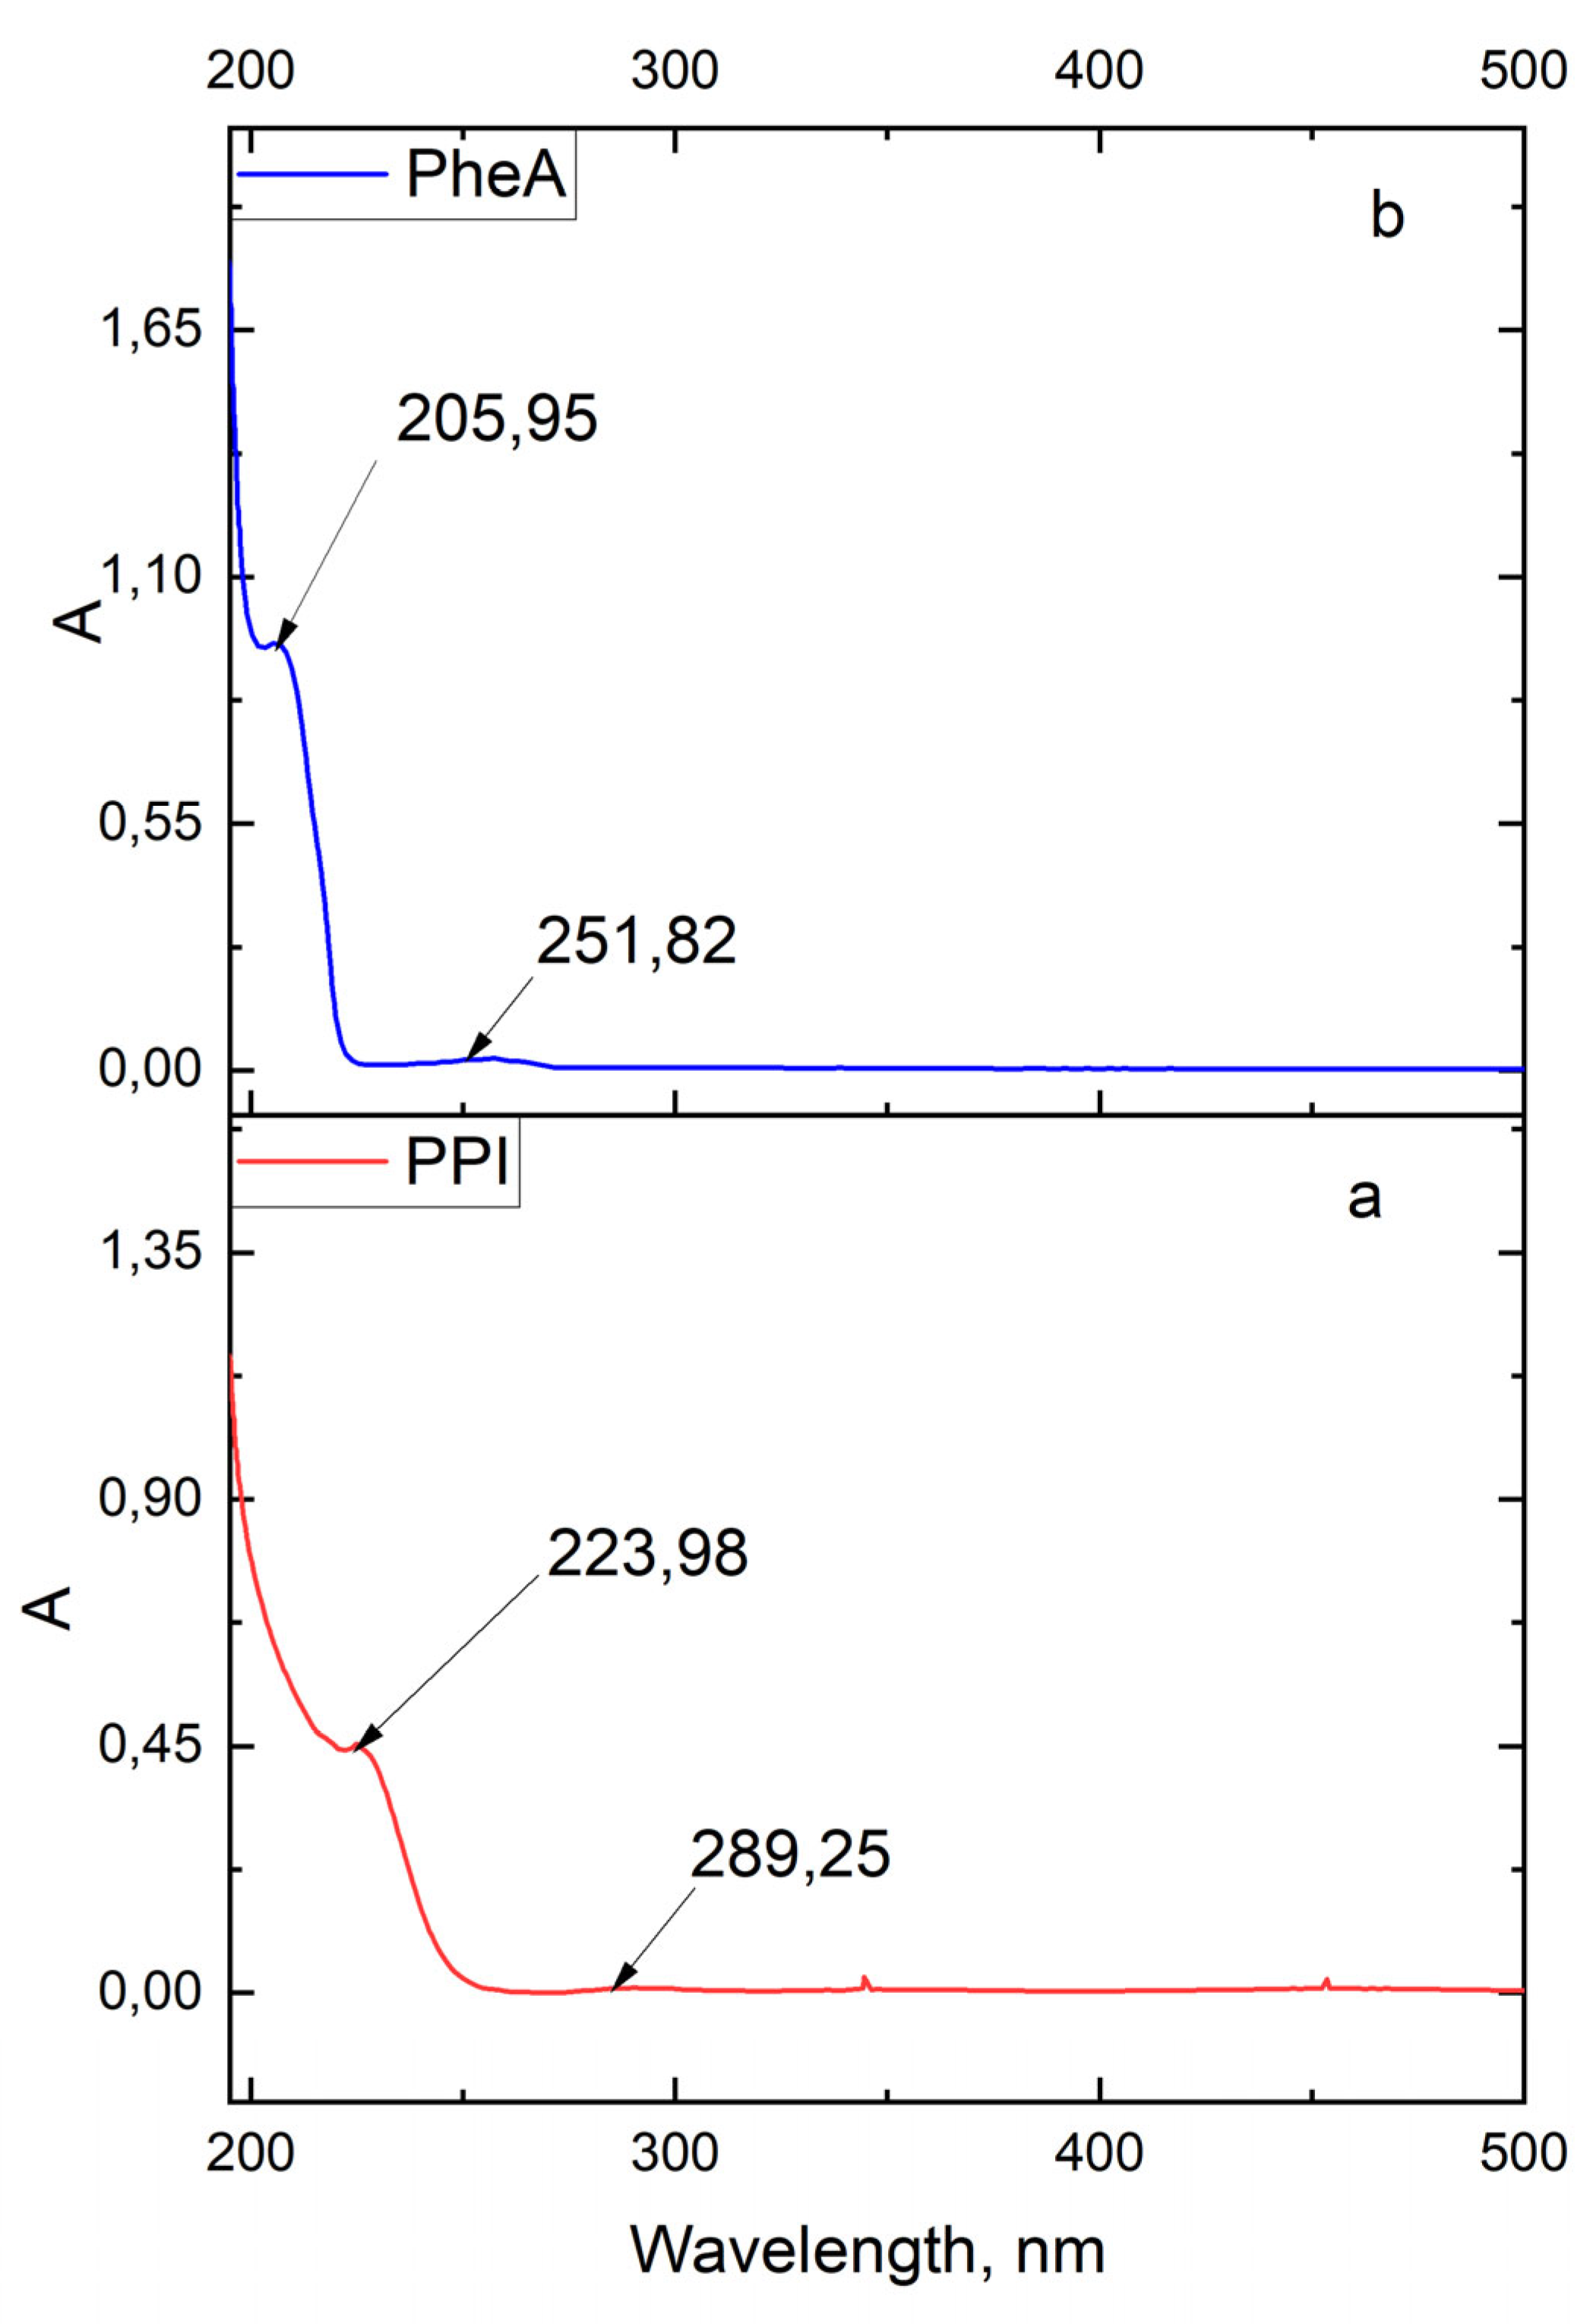
The shift of the main absorption peak to a longer wavelength region is associated with the coordination of two phenylalanine molecules with iodine, which is a characteristic of charge transfer systems. This shift in UV absorption peaks for solutions of nitrogen-containing aromatic compounds has been observed in Tong’s work, when studying the spectrum of aqueous solutions of beta-phenylethylamine under the influence of chloride ions [19], and in Gogoi’s work, when investigating the effect of iodine compounds on the UV spectrum of 2-chloropyridine [20].
To investigate the thermal stability of the newly synthesized compound, we recorded differential curves of heat capacity changes in the sample. Differential scanning calorimetry (DSC) curves for phenylalanine indicate that the melting point is 277.81 °C (see Figure 5b). The initial melting temperature is 271 °C, while the reference data from the literature for the melting temperature of D-phenylalanine range from 271 to 275 °C and depend on the purity of the compound [21].
Figure 5.
TGA thermograms of the of PPI (a) and phenylalanine (b).
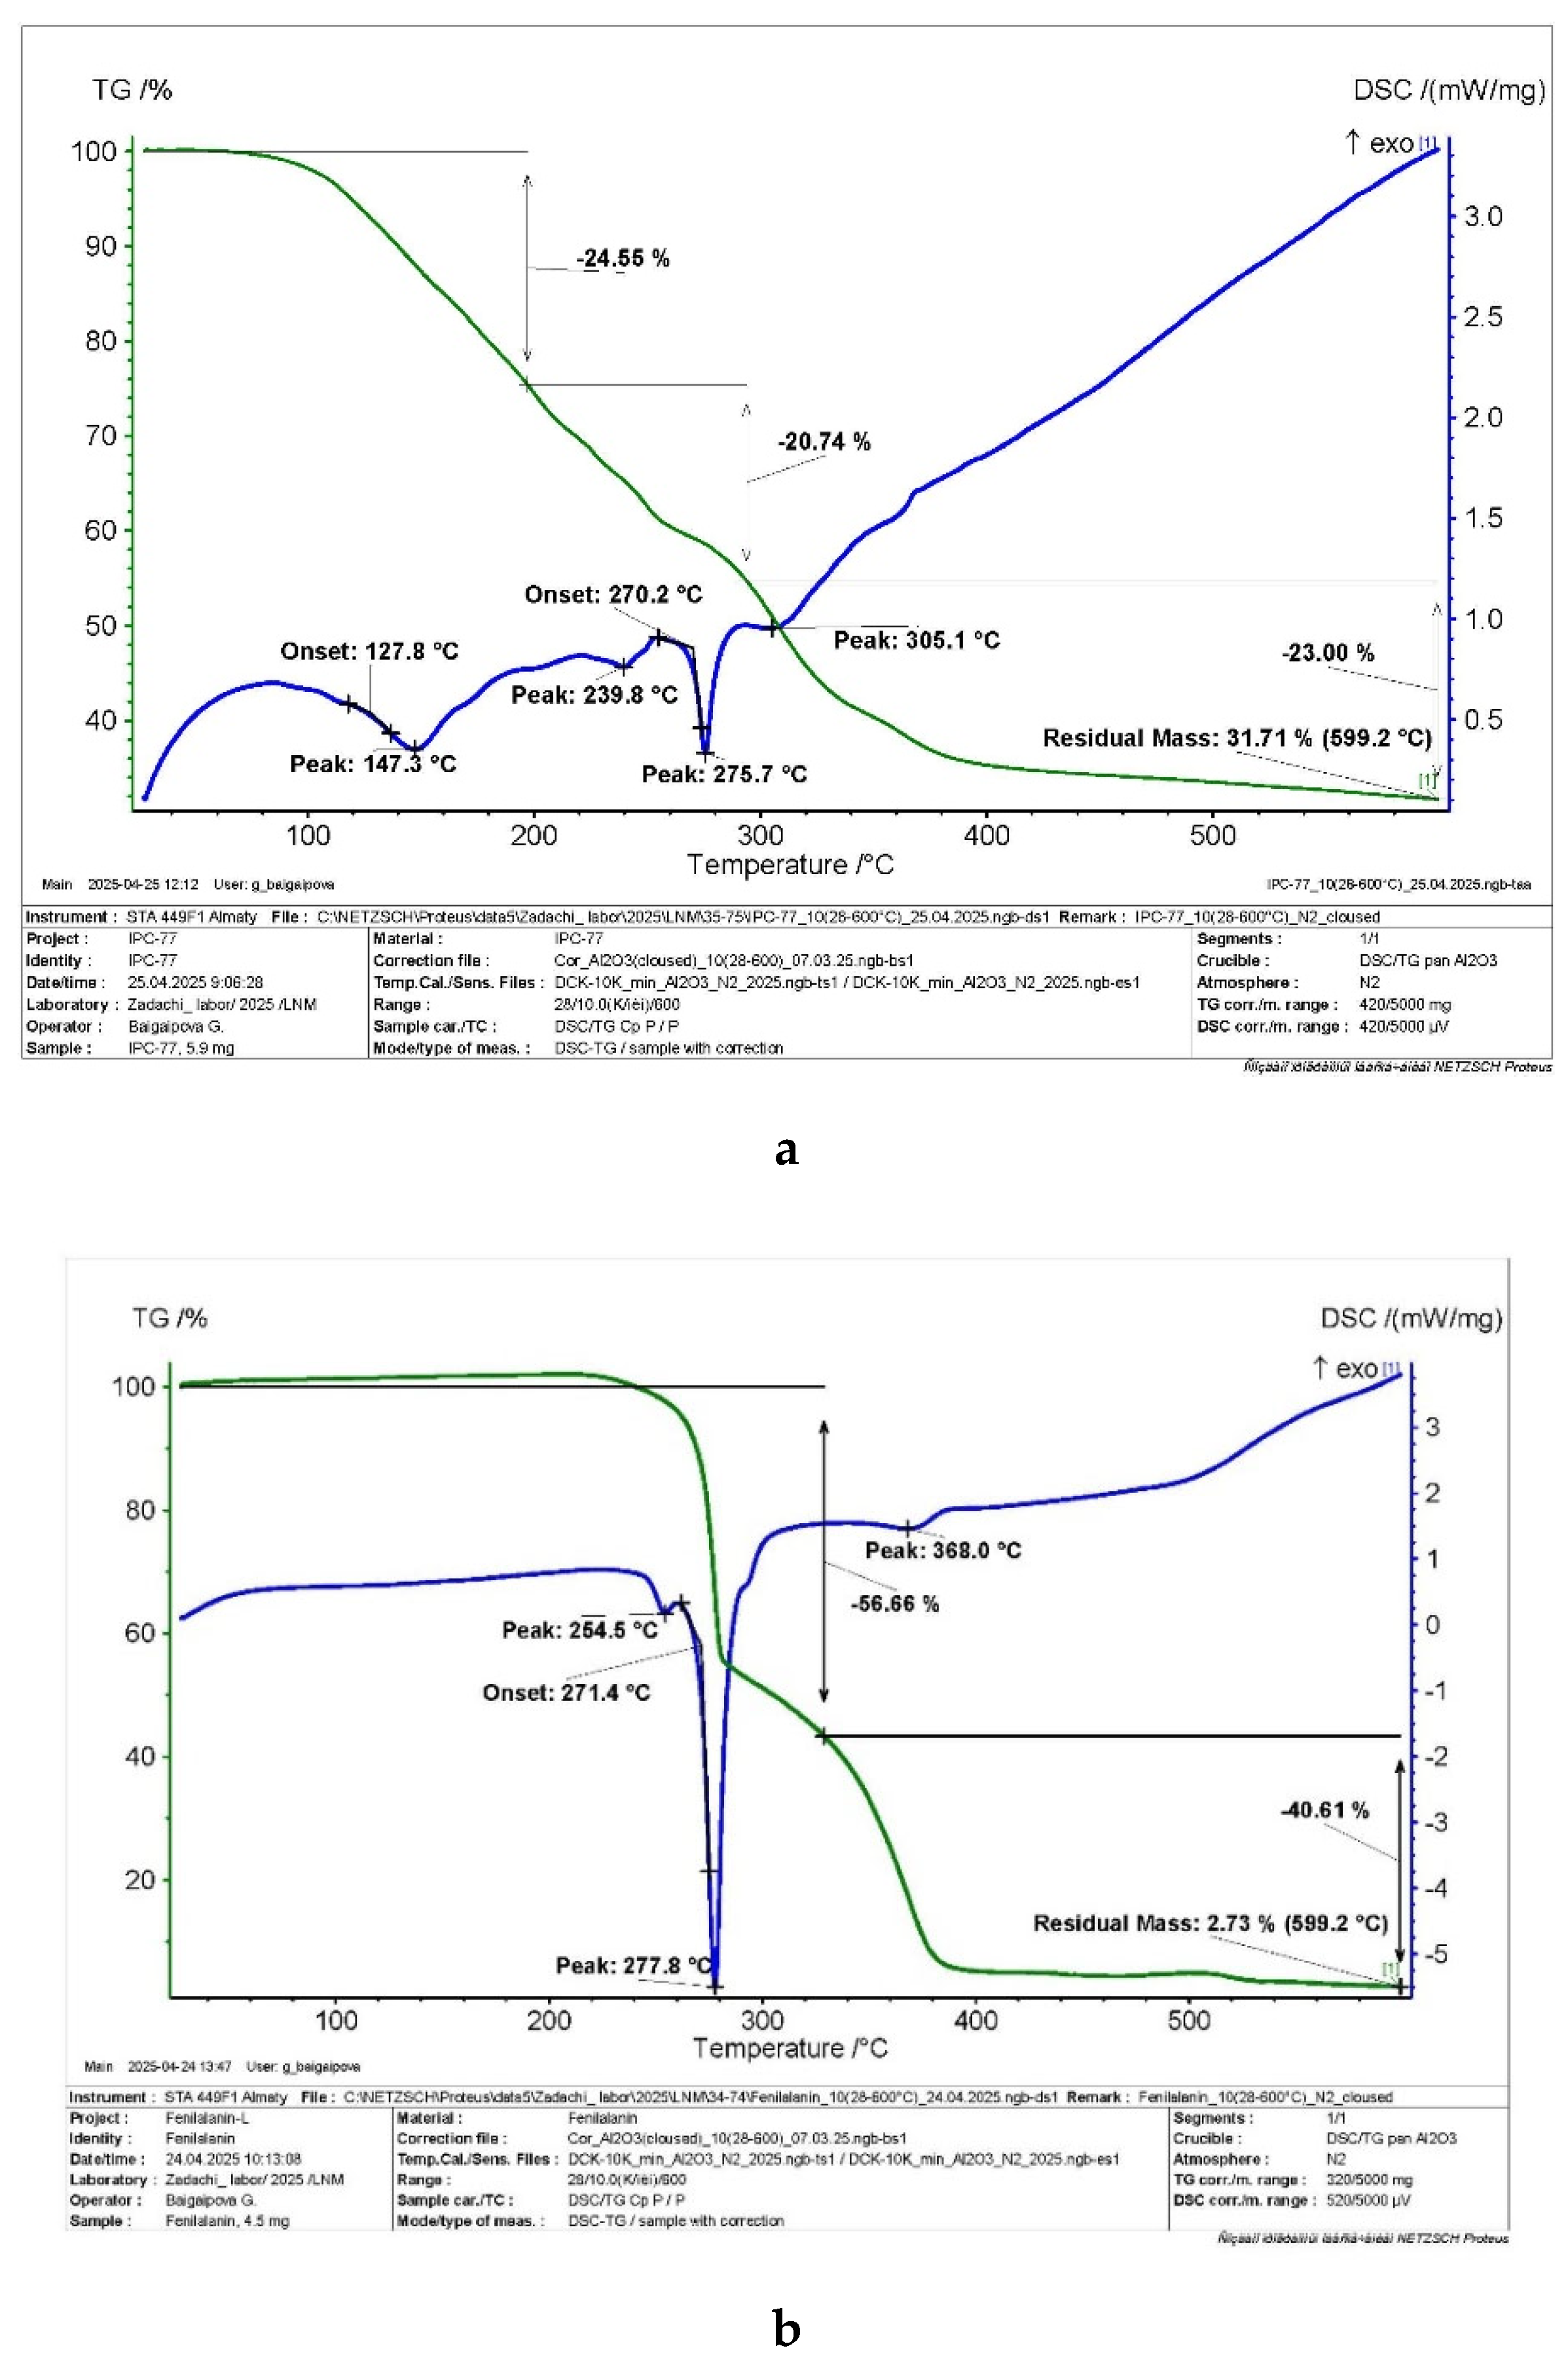
DSC curves for PPI show that up to a temperature of 100 °C, the new studied complex behaves stably and no changes are observed on the thermogram (Figure 5a). Above 127 °C, there is a sharp decrease in the residual mass of the sample by more than 45 %, which indicates the decomposition of the complex during the melting of the compound into separate components – phenylalanine and hydrochloric acid. The melting peak of the new complex is observed at 147 °C. When the temperature rises to 275.7 °C, a peak characteristic of the melting peak of pure D-phenylalanine is observed.
Some physico-chemical parameters of the PPI complex are presented in Table 2.
Table 2.
Physico-chemical parameters of the PPI complex.
| Parameter | Value |
|---|---|
| Bulkdensity, g/cm3 | 0.73 |
| Particlesize, μm | 2.8-3.1 |
| Solubility | Soluble in water, DMSO, slightly soluble in ethanol, acetone and cyclohexane. |
| pH of aqueous solutions | 3.0-3.2 |
Solubility studies have shown that the complex is well soluble in solvents with a polarity index of 7.2 and 10.2, and slightly soluble in solvents with a polarity index of 5.1, 4.3 and 0.04. The process of dissolution in organic solvents is accompanied by the formation of an intense brown color.
Thus, the studied organic iodide crystalline compound is highly soluble in polar liquids, stable up to 127 °C, has distinctive IR and UV spectra from the initial amino acid, phenylalanine, and can be easily detected as a separate compound.
3.2. Investigation of the Characteristics of Biochar from Walnut Shells
Earlier in [15] was prepared a fertilizer based on activated carbon from apricot kernels containing the organic iodide complex di-(2S)-2-amino-3-(1H-indole-3-yl)propionate))-dihydro-tetraiodide and Curly Parsley (Petroselinum crispum) was used as a test plant. In this work, we decided to use activated carbon from walnut shells as a carrier of the studied PPI. Parsley was also chosen as a test plant.
Figure 6 shows SEM images of bochar before and after KOH chemical activation. The biochar (a) exhibits a generally smooth, slightly perforated surface without developed open pores. It shows "surface deposits", probably of a resinous-coke nature, remaining after thermal degradation of the feedstock. The presence of such aggregates and the absence of pronounced porosity indicate that carbonation alone does not create a sufficient accessible microstructure for effective mass transfer.
After KOH activation, the morphology changes radically (b–d): a network of open cavities and pronounced hierarchical porosity are formed. The overview image (b) shows numerous large channels corresponding to the macropores of the inherited biostructure. Magnification (c) shows a typical macropore of the order of 10 µm, while detail (d) reveals perforation of its walls with many smaller pores ("pore-within-pore", marked with arrows). Given the resolution of the SEM, these holes can be correctly attributed primarily to mesopores.; Micropores (<2 nm) are not resolved by SEM and their presence is confirmed by adsorption/RA methods. The observed transformation is consistent with the mechanism of alkaline-oxidative etching [22] during KOH activation (formation/decarbonization of K2CO3, release of H2/CO/CO2, temporary intercalation of K), leading to expansion of channels, thinning of walls and their perforation, as well as removal of surface organic residues, visible in Figure 6a. As a result, a macro–meso- (and probably micro-) hierarchy of pores appears, combining transport channels with a high area of active walls, which is a prerequisite for increasing the adsorption and electrochemical characteristics of the material.
Figure 6.
SEM images of biochar before and after KOH chemical activation: (a) Carbonized sample (550 °C, N₂): smooth surface with surface deposits, without developed open pores (scale 50 µm); (b–d) After KOH activation (850 °C, Ar) a pronounced hierarchical porosity is formed: macropores with perforated walls containing smaller pores; (c) an example of a macropore of ~10 µm is shown; (d) "pore-within-pore" in the wall of the macropore (arrows). Scale: (b) 50 µm; (c) 20 µm; (d) 5 µm. is a figure. Schemes follow the same formatting.
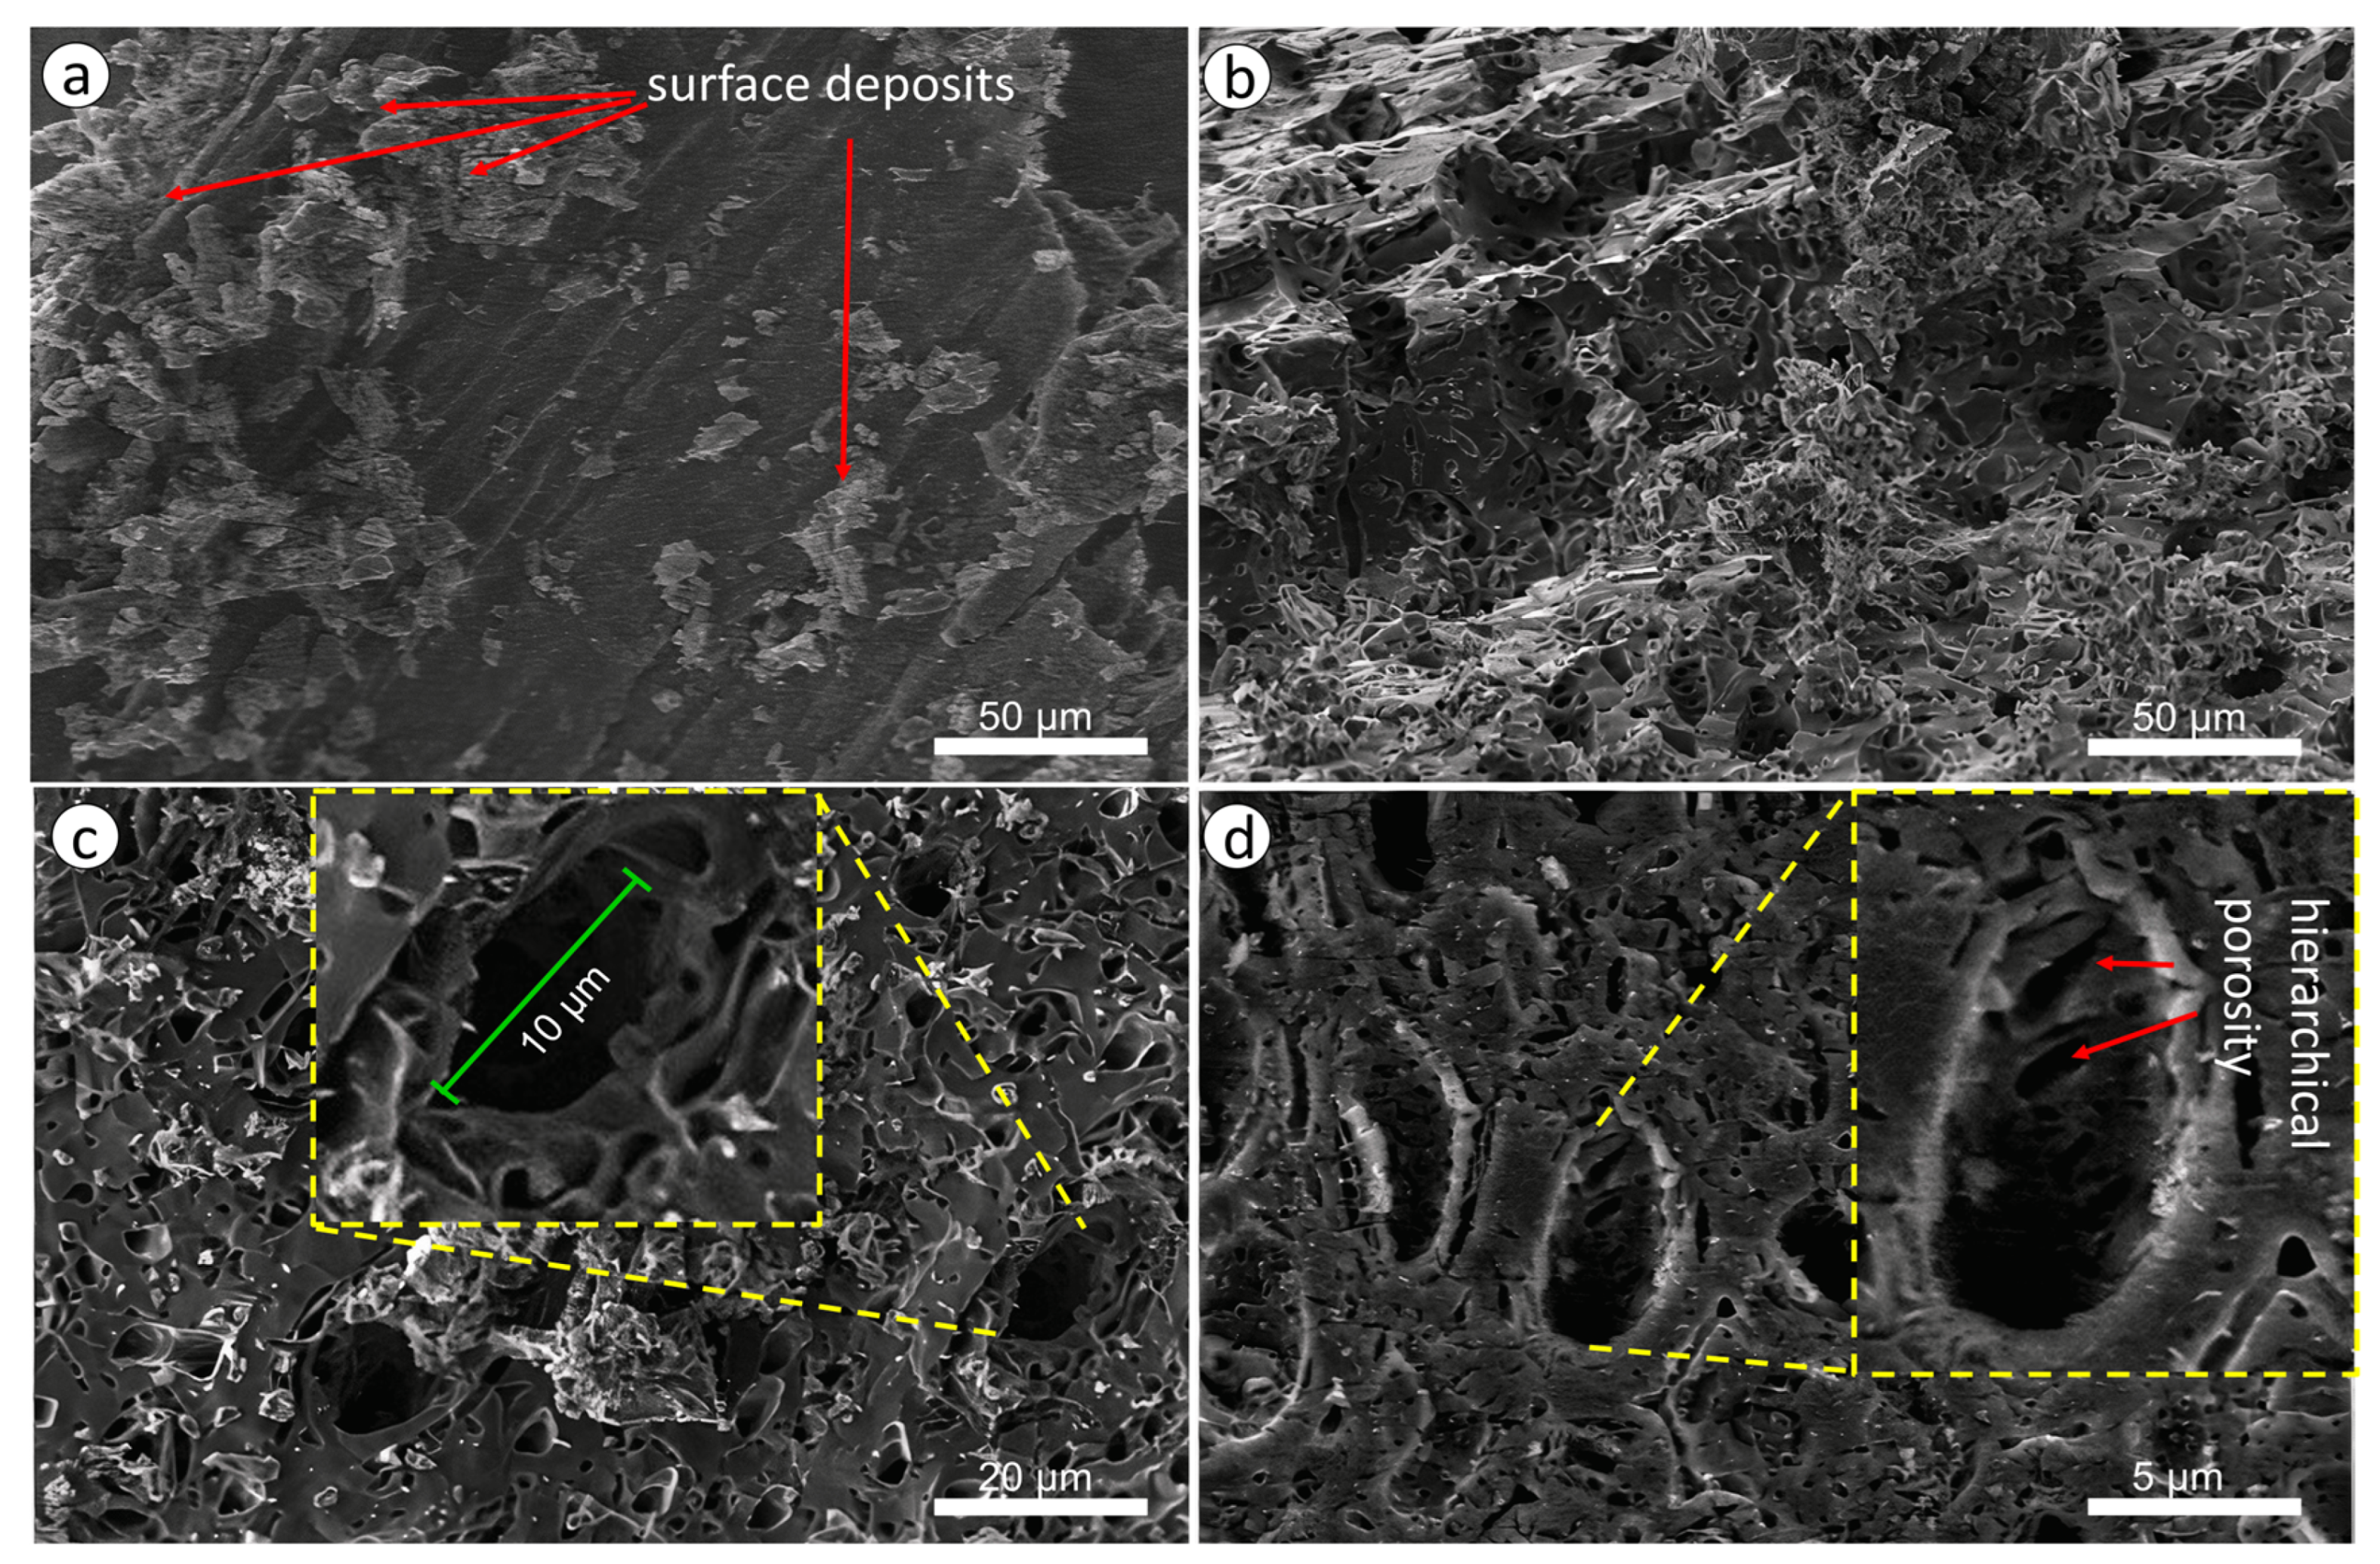
Figure 7 shows the Raman spectra of biochar samples before and after chemical activation: the black curve corresponds to carbonation at 550 °C in an atmosphere of N₂ (before activation), and the red curve corresponds to KOH activation at 850 °C in an atmosphere of Ar (after activation). The main D band (~1350 cm⁻1), G band (~1580 cm⁻1) and 2D band (~2700 cm⁻1) are clearly highlighted in both cases. A decrease in the intensity ratio ID/IGI_D/I_GID/IG from 0.83 to 0.58 after activation indicates a decrease in the concentration of defective zones in the carbon matrix and an increase in the size of ordered sp2 domains. At the same time, there is an increase in the ratio of IG/I2DI_G/I2D from 1.81 to 1.98, which indicates an increase in the contribution of multilayer graphene-like fragments. Such a redistribution of the characteristics of the Raman spectrum indicates an improvement in the crystallinity and electronic conductivity of the material due to the aggressive action of alkali, which promotes the “opening” of pores and the ordering of fragments of the graphite-like lattice [23].
The XRD diffractograms of both samples clearly show a wide amorphous hill in the region of 2θ ≈ 20-25°, corresponding to the reflection (002) of graphite-like planes (Figure 8).
Figure 7.
Raman spectra of WS biochar before and after KOH activation at 850 °C.
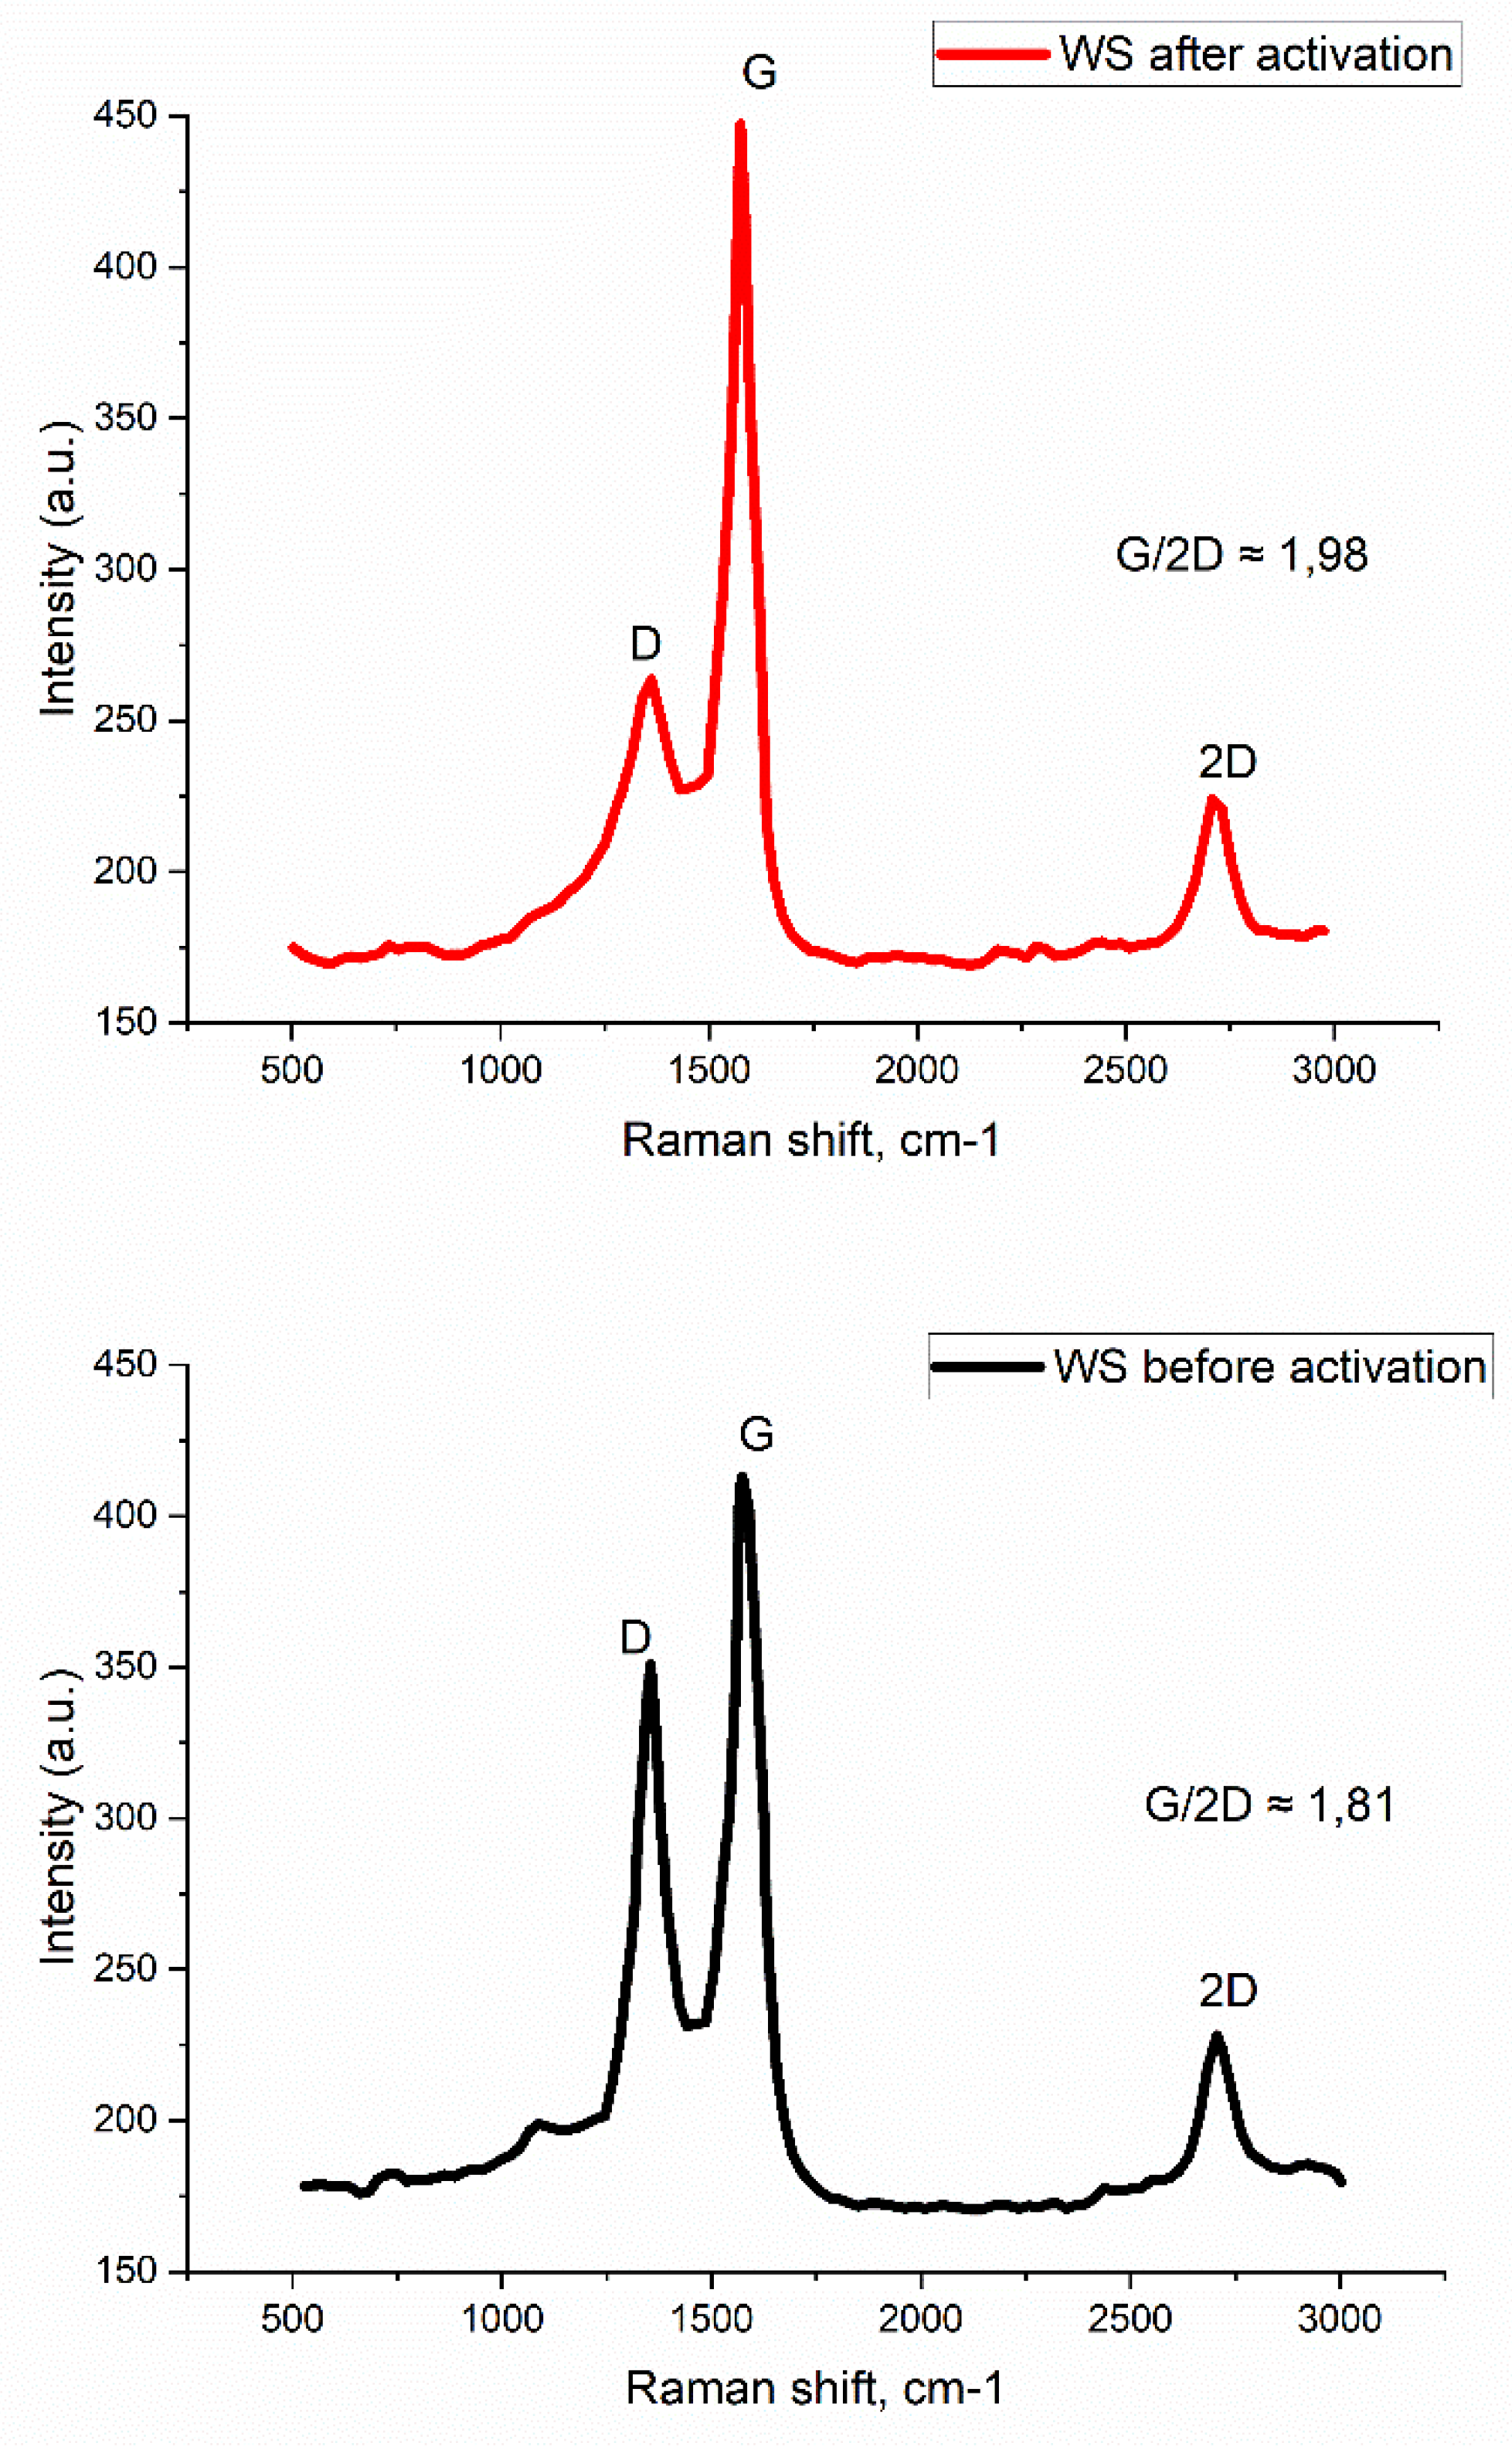
Figure 8.
XRD patterns of WS biochar before (black curve) and after (red curve) KOH activation at 850 °C.
Figure 8.
XRD patterns of WS biochar before (black curve) and after (red curve) KOH activation at 850 °C.
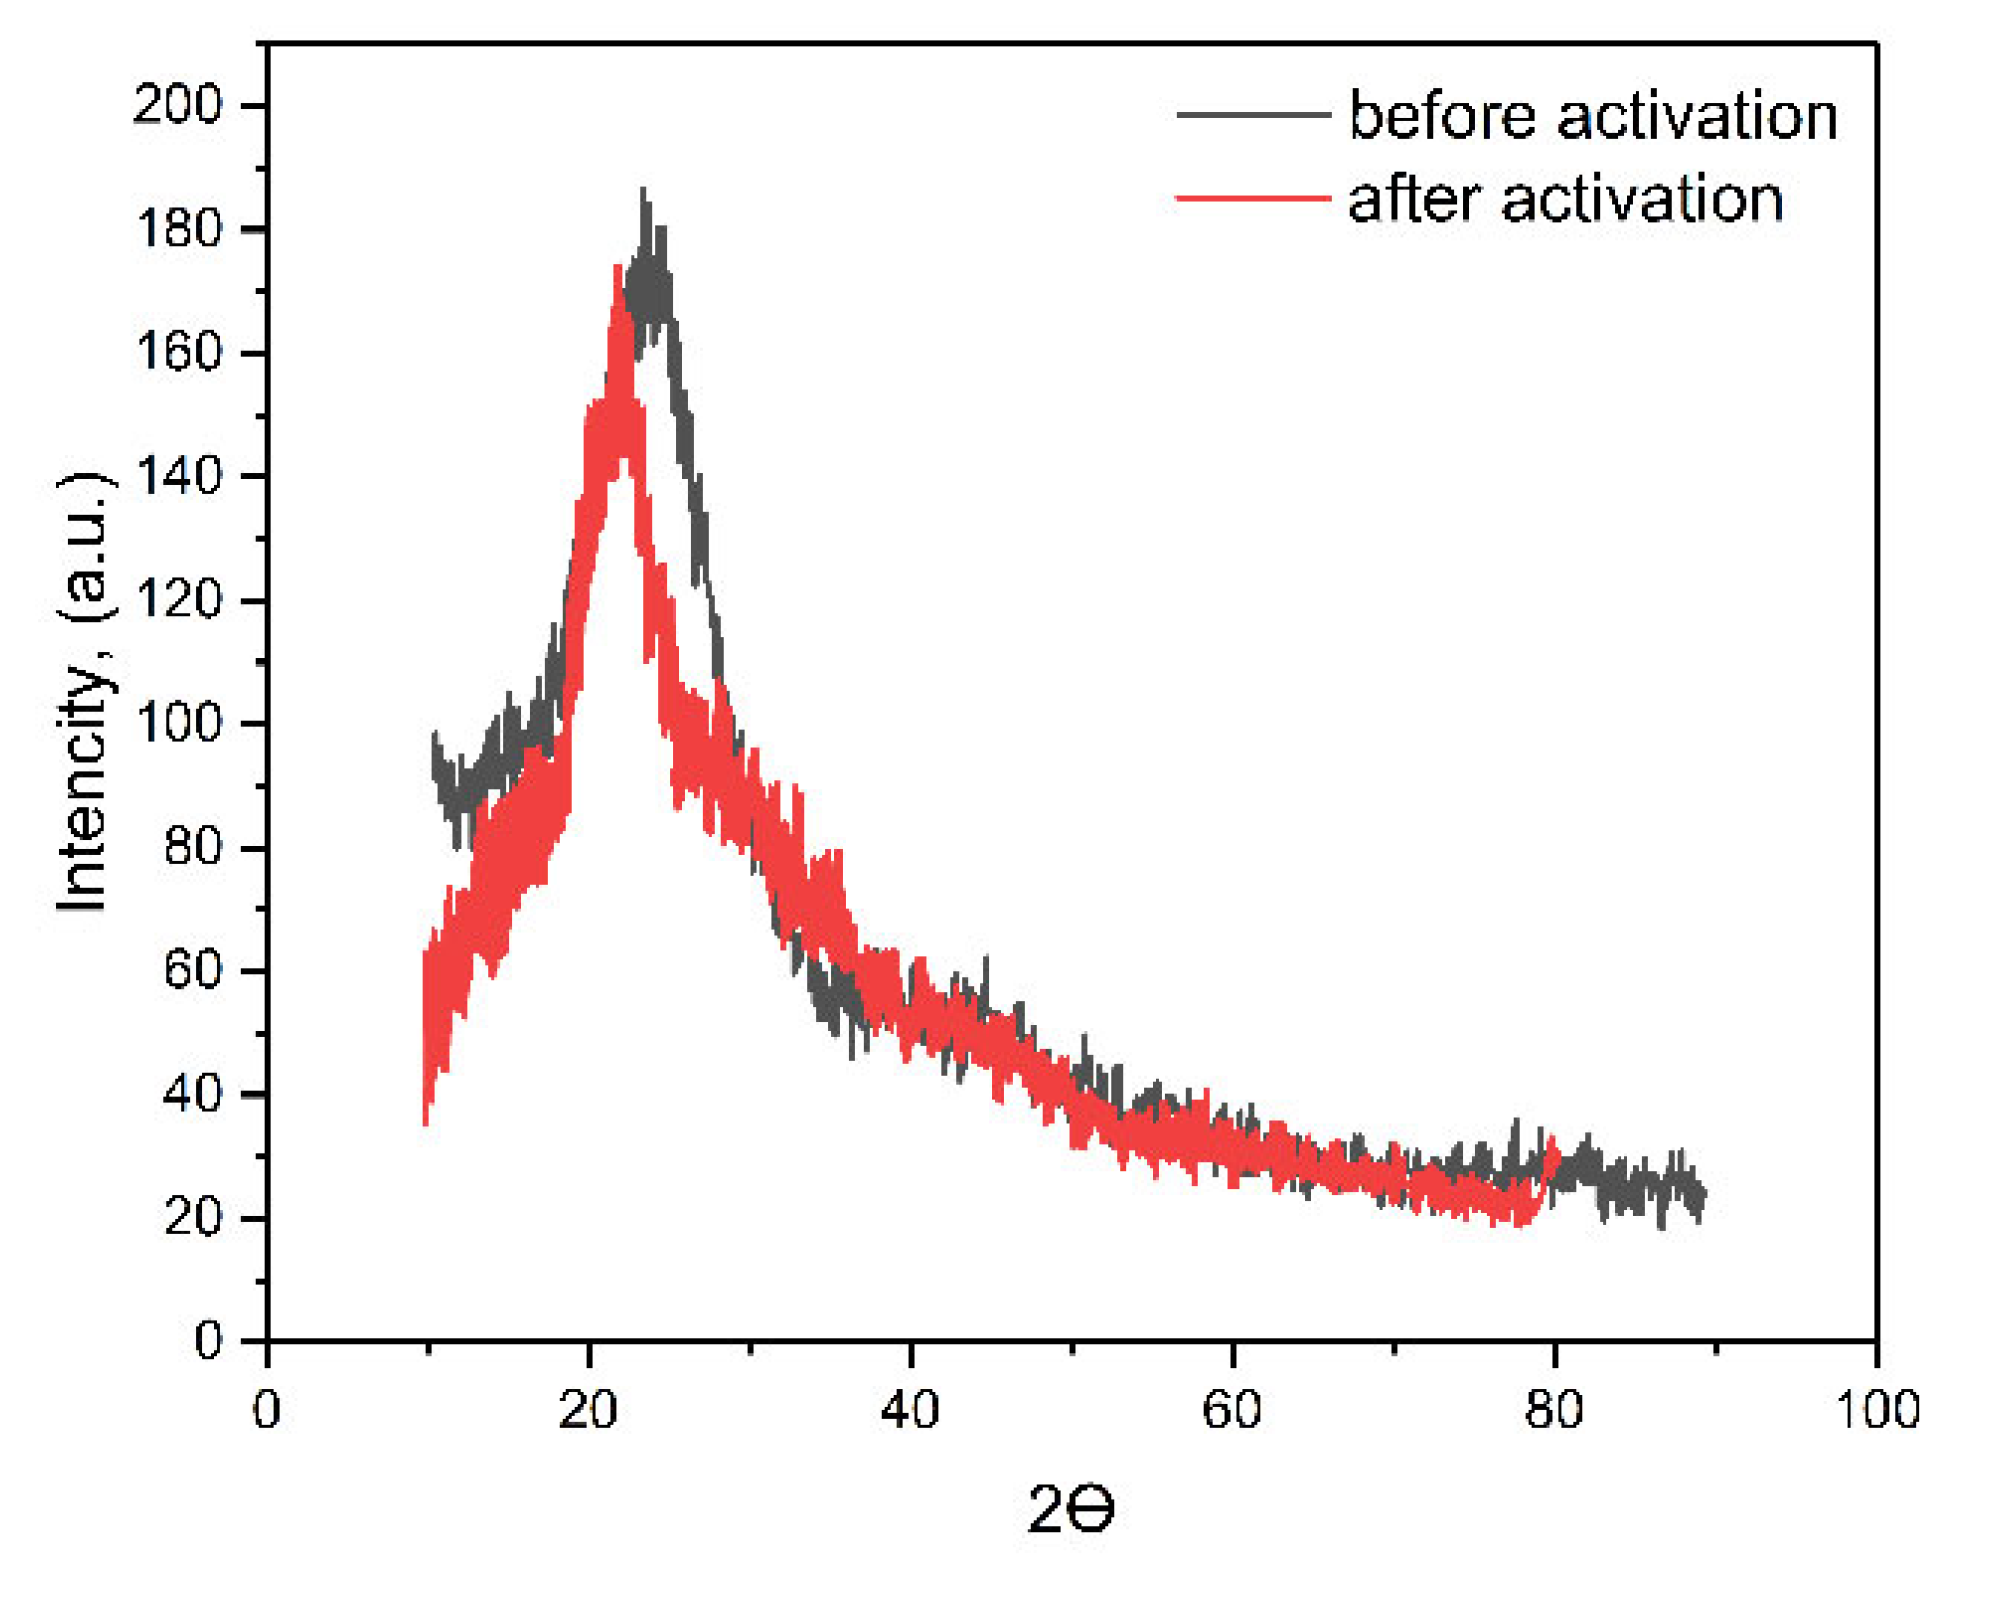
In the sample, before activation, the maximum intensity of this hill reaches ~185 au at 2θ ≈ 22.5°, which corresponds to the interlayer distance d002 ≈ 0.39 nm (according to Braga's law for CuKa). After KOH activation, there is a slight shift of the hill center to a region of smaller angles (2θ ≈ 22.0°) and a decrease in its maximum intensity to ~170 au, indicating an increase in d002 to ≈ 0.40 nm. The widening of the hill width (an increase in FWHM) indicates a decrease in the height of the crystallites along the c axis and an increase in the disorientation of graphite layers.
Despite the data from Raman analysis indicating an improvement in the ordering of sp2 domains in the plane of the layer, XRD demonstrates the opposite trend in the direction of the c axis: KOH activation leads to partial destruction of the stack of sheets and expansion of the interlayer space. This phenomenon is characteristic of alkaline activation, when aggressive KOH interaction tears out individual sheets and forms micropores between them, reducing the coherent length of the crystallites vertically. Thus, the combination of observations of the two methods indicates that activation contributes to the exfoliation of graphite bundles — the internal ordering of individual planes (Raman) increases, but their multilayer stacking (XRD) collapses.
Figure 9 shows the FTIR spectra of biochar before (blue) and after (red) KOH activation at 850 °C.
Figure 9.
FTIR spectra WS biochar before (a) and after (b) KOH activation at 850 °C.
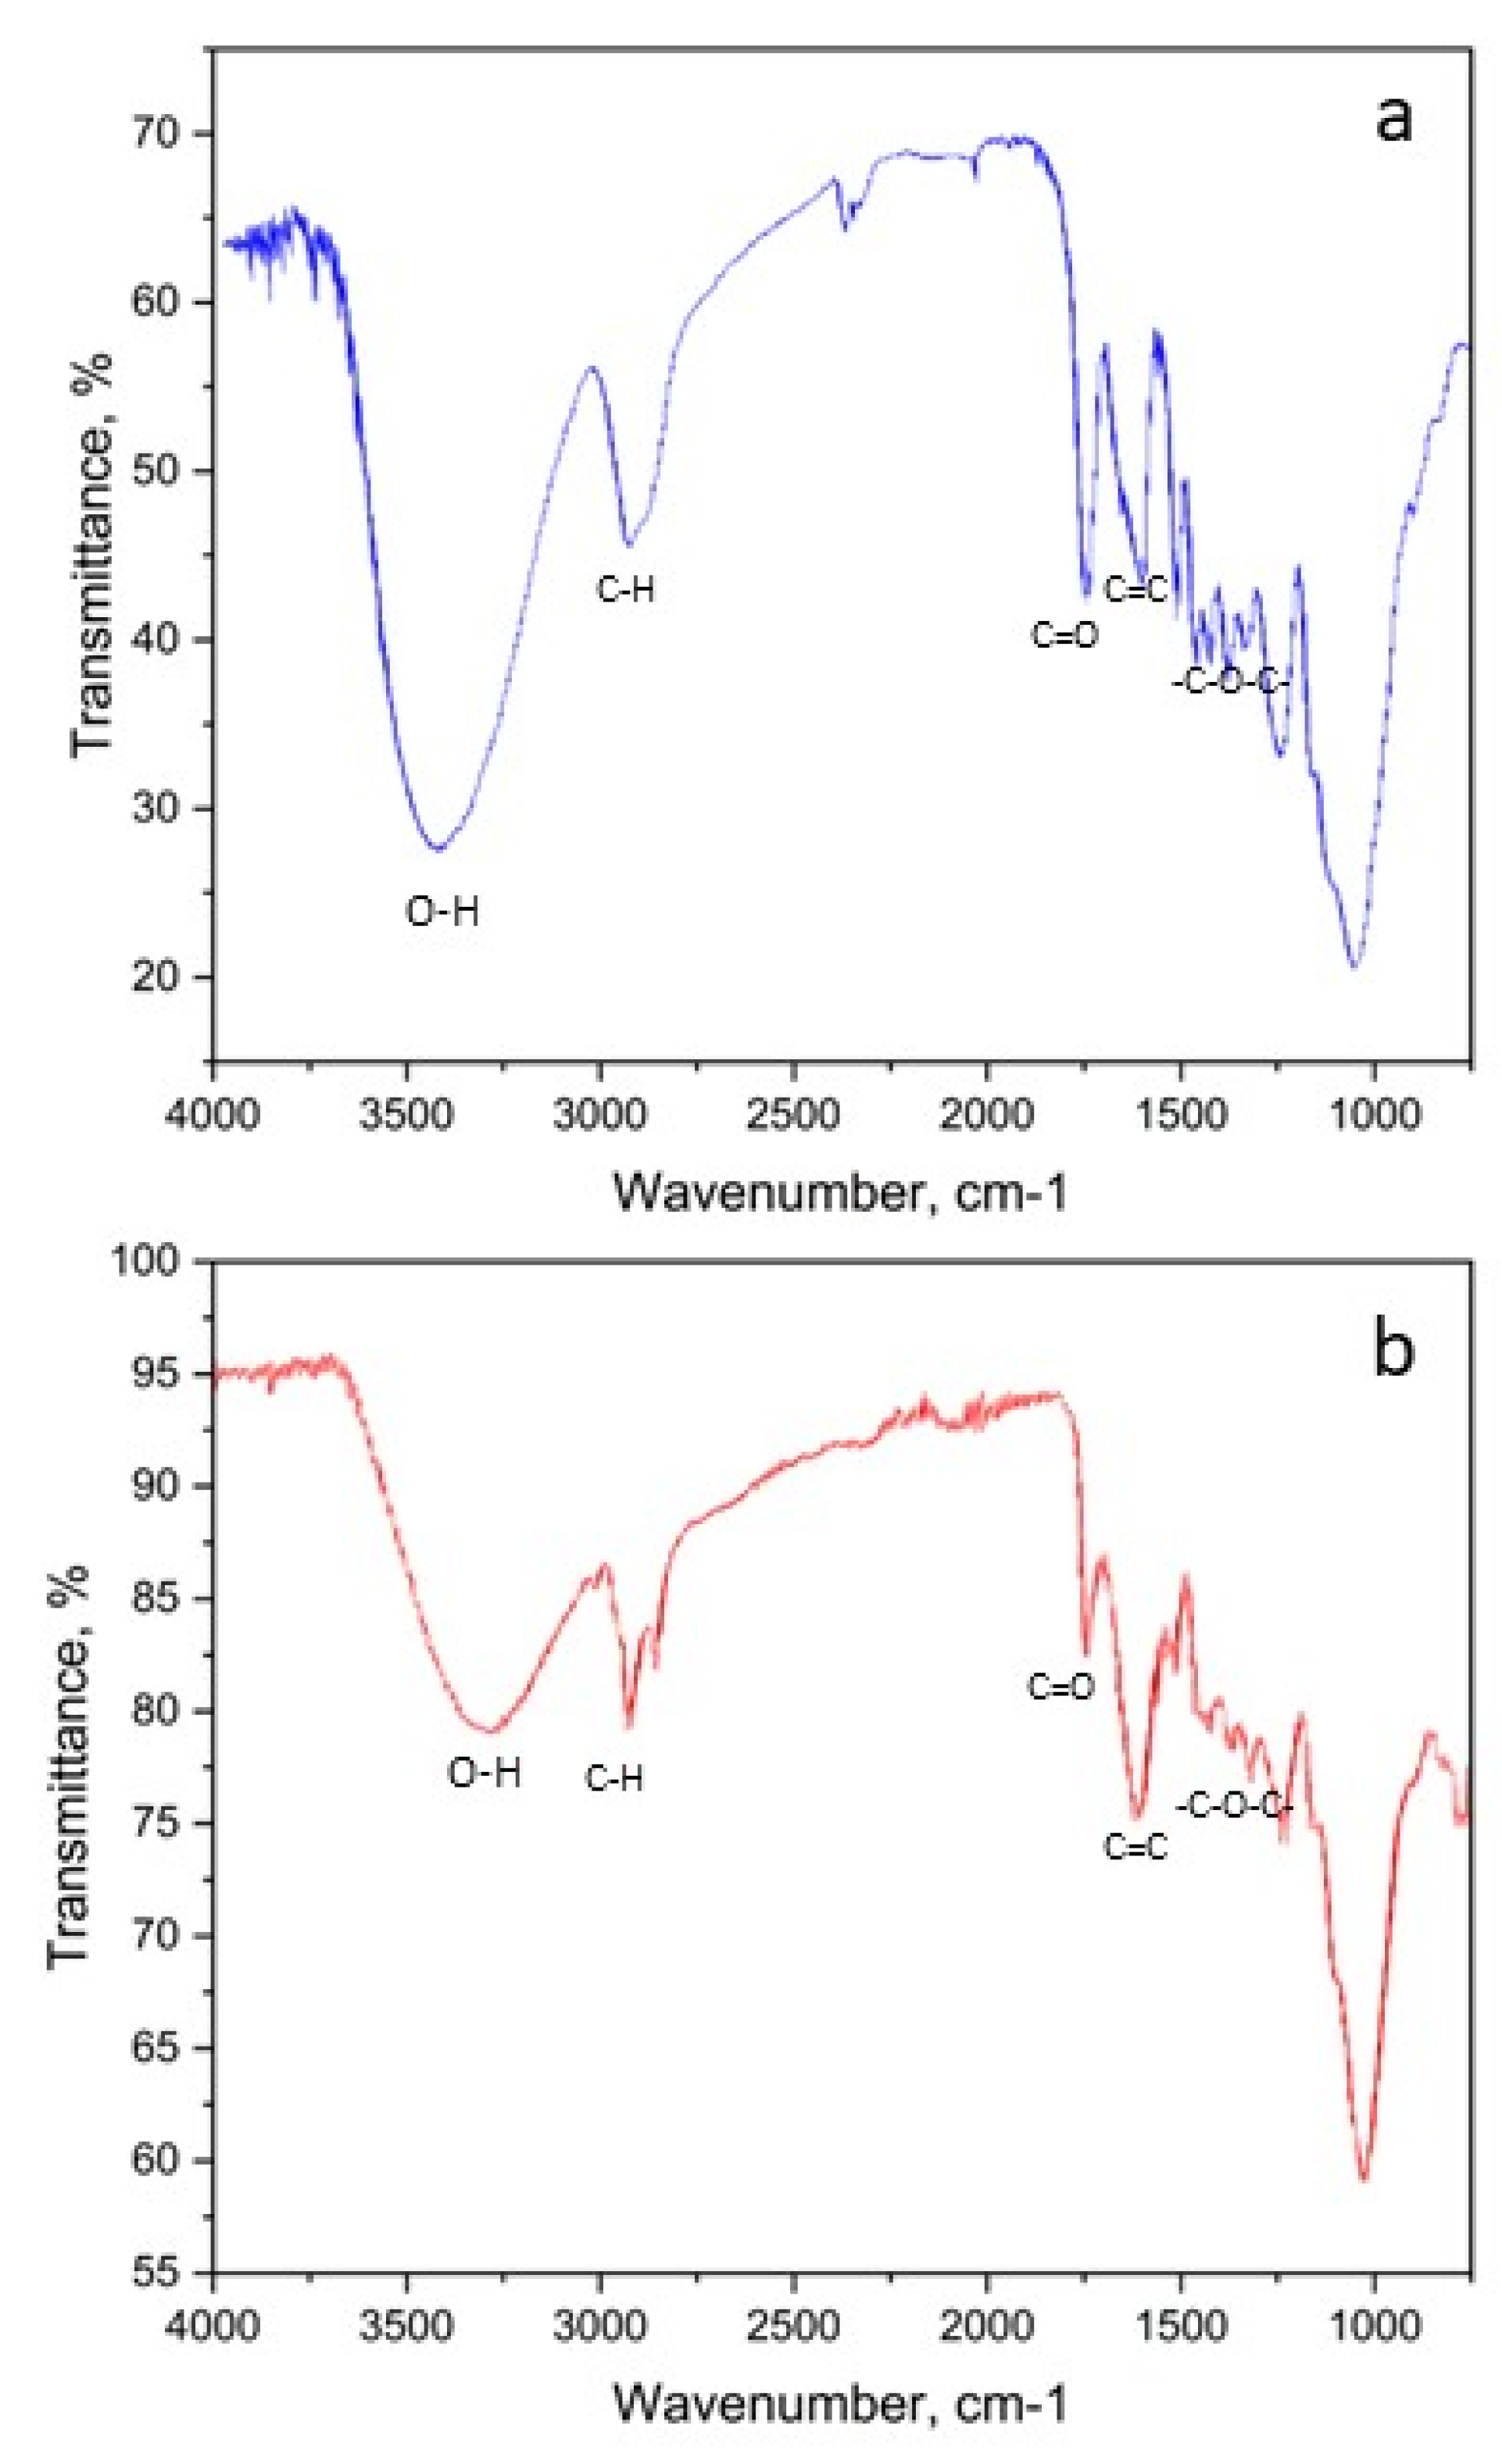
Before activation, a wide absorption band in the range of 3600-3000 cm⁻1 is observed in the spectrum, corresponding to v(O–H) hydroxyl groups and water-bound molecules, as well as distinct bands at ~2920 and ~2850 cm⁻1 corresponding to v(C–H) aliphatic fragments. The band at ~1715 cm-1 indicates the presence of carbonyl (C=O) groups, while the peak at ~1610 cm-1 is responsible for the v(C=C) aromatic skeleton. The C⁻O–C and C–O groups of various essential and phenolic structures are recorded in the region of 1200-1000 cm–1. After KOH activation, the intensity of all these bands is significantly reduced: the decrease in the amplitude of v(O–H) and v(C=O) is especially noticeable, which indicates the removal or degradation of oxygen-containing functional groups under the action of alkali and high temperatures.
It is important to note that a sharp decrease in absorption fields in the range of 3600-1000 cm-1 is indicates not only the dehydration of the surface, but also the elimination of carbonyl and hydroxyl active sites. This leads to an increase in specific surface hydrophobicity and can improve the adsorption of nonpolar molecules, but potentially reduces the ability to electrochemically interact with polar ligands. The simultaneous preservation of a weak band v(C=C) at ~1610 cm-1 indicates that the basic aromatic carbon skeleton retains its order despite the annealing of the surface groups.
Figure 10 shows the N₂ isotherms of adsorption at -196 °C for activated carbon before (a) and after (b) KOH activation at 850 °C. In the region of low relative pressures (p/p₀ < 0.1), both isotherms exhibit a sharp increase in adsorption, characteristic of type I according to the IUPAC classification, which indicates the predominance of micropores. Before activation, the volume of absorbed nitrogen in this region reaches about 180 cm3/g, whereas after activation it increases to about 235 cm3/g. Such a significant increase in microporous volume is due to aggressive KOH etching, which leads to the formation of new micropores and the expansion of existing ones.
Figure 10.
N₂ adsorption isotherms at -196 °C for activated carbon before (a) and after (b) KOH activation at 850 °C.
Figure 10.
N₂ adsorption isotherms at -196 °C for activated carbon before (a) and after (b) KOH activation at 850 °C.
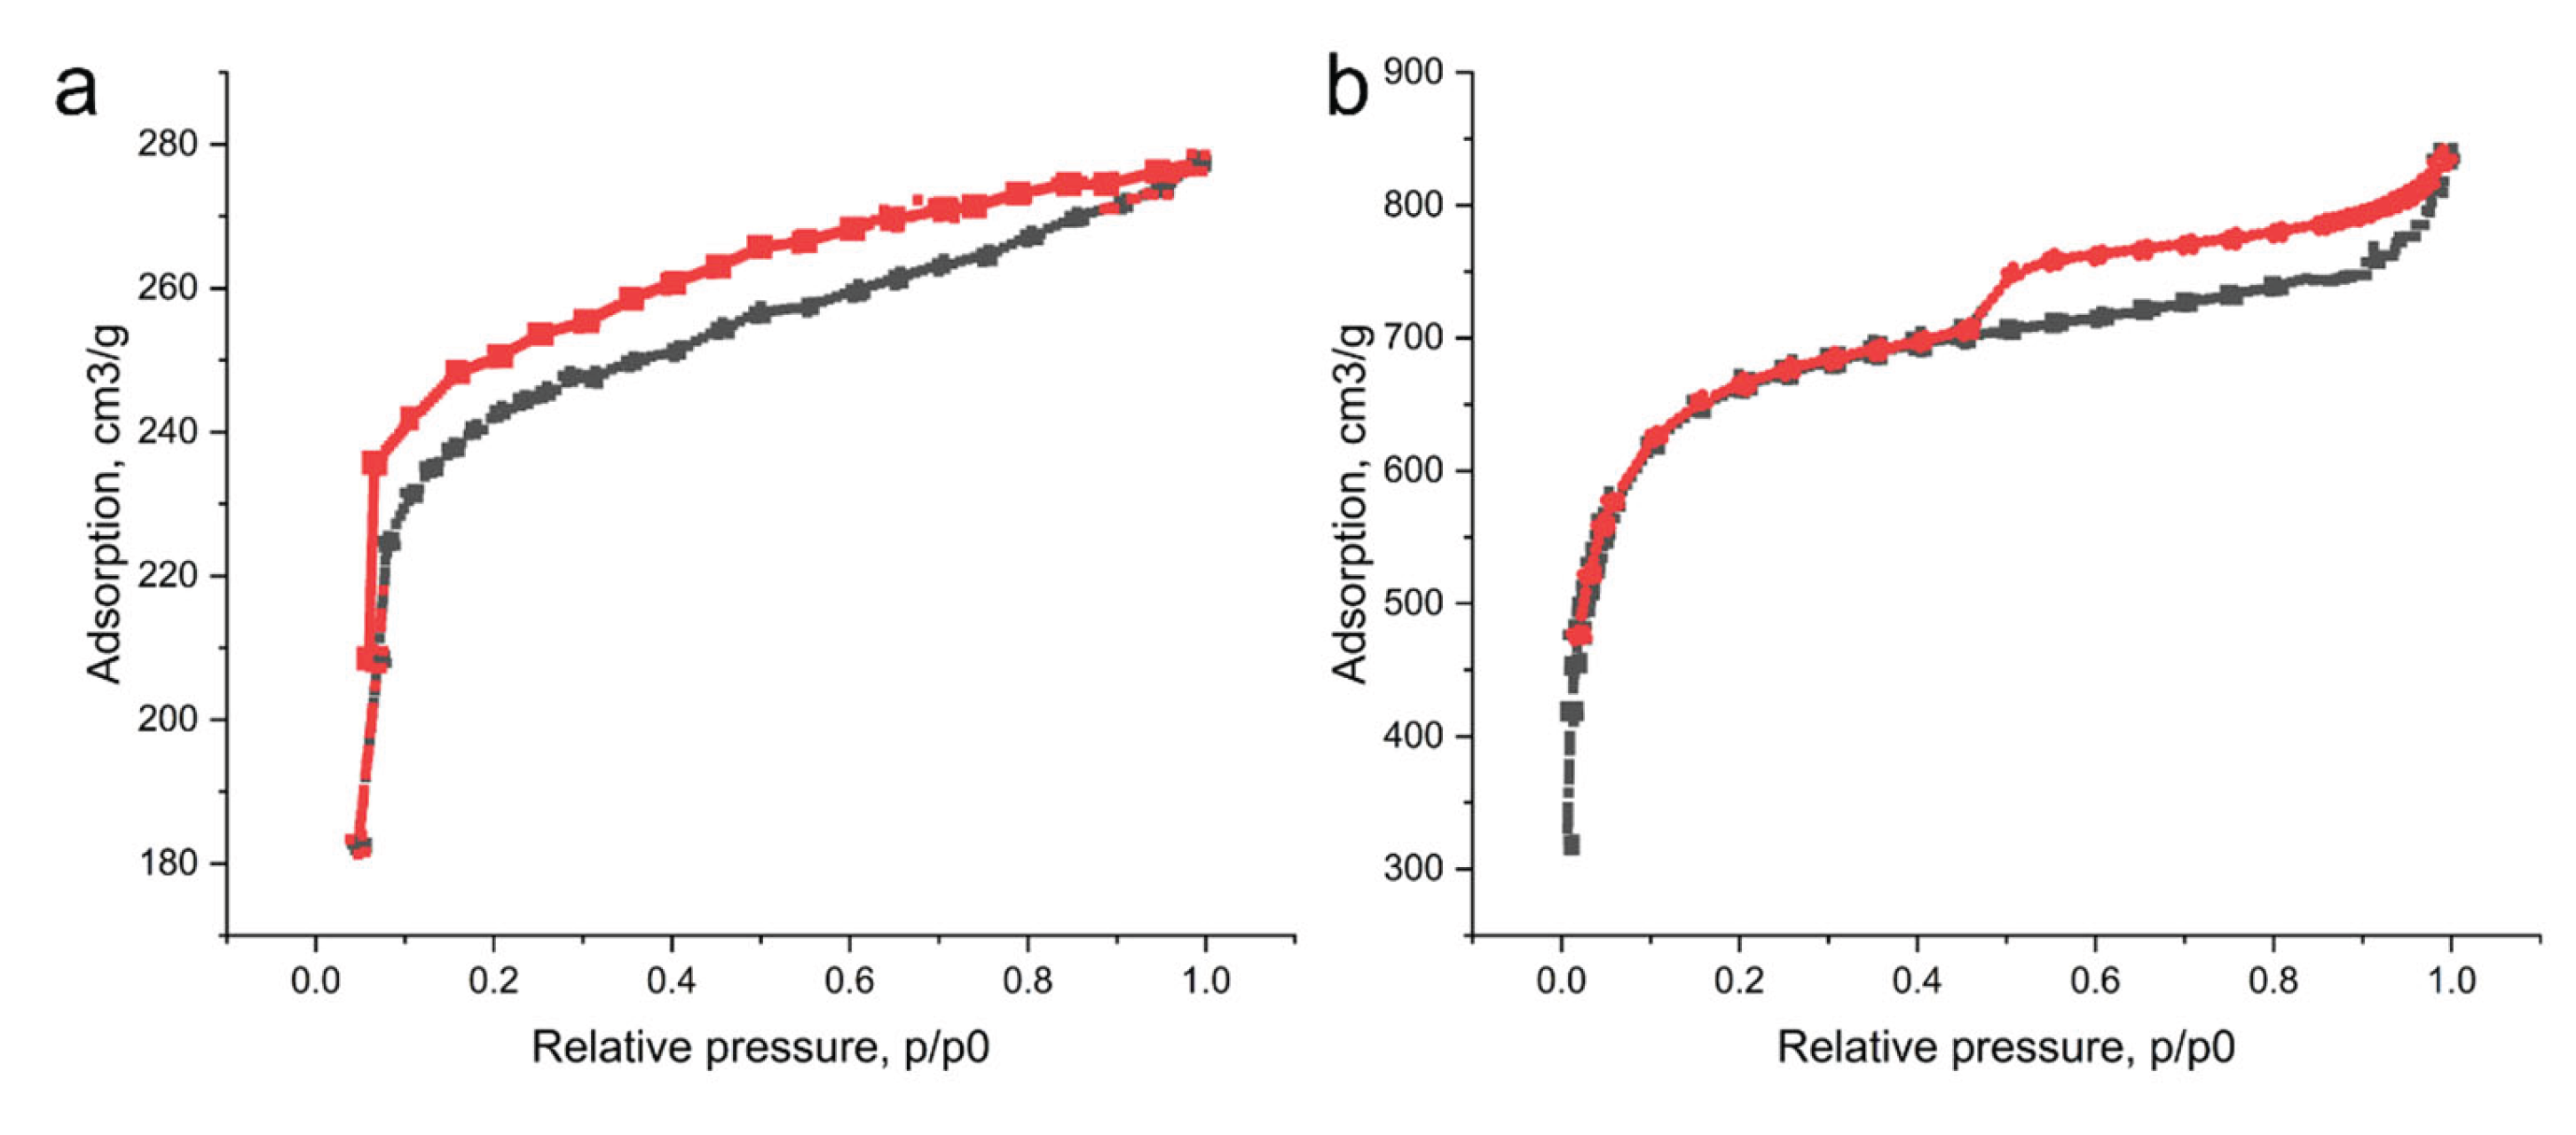
In the range of average relative pressures (0.1 < p/p₀ < 0.9), isotherms grow smoothly without a pronounced hysteresis loop, which indicates the formation of mesopores of moderate size. At p/p₀ ≈ 0.5, the adsorption volume increases from ≈650 to ≈760 cm3/g, and at the end of the isotherm (p/p₀ → 1) the total volume increases from ≈780 to ≈840 cm3/g. The presence of a small hysteresis indicates a narrow size distribution of meso and macropores and may slow down the rate of desorption during fast cycles [24].
One of the ultimate goals of this study is the development of a fertilizer, which is planned to be obtained in the form of a granular powder. The basis of the granular powder will be biochar obtained from WS, which should be characterized by developed porosity, large specific surface area, and high sorption activity in relation to the sorbed substances. The iodine number is a widely used method for determining the sorption capacity because of its simplicity and rapid assessment of the quality of biochar. The results of the sorption capacity of the biochar samples studied with respect to iodine are shown in Table 3.
Table 3.
Sorption capacities of WS biochar samples with respect to iodine.
| Biochar sample | Specific surface area according to BET, m2/g |
Volume of micropores, cm3/g |
Mesopore volume, cm3/g |
Iodine number, mg/g |
|---|---|---|---|---|
| WS before activation | 269.4±25.8 | 0.18±0.01 | 0.06±0.01 | 283.8±17.6 |
| WS after activation by KOH | 878.3±65.4 | 0.67±0.06 | 0.27±0.02 | 712.3±48.6 |
Biochar samples from walnut shell after activation by KOH characterized by a developed specific surface area and in this indicator exceed not activated WS biochar samples by at least 3 times. The porous structure of WS biochar after activation mainly represented by micropores, which account for 71.2 % of the total volume of pores. Iodine number of biochar after activation is 712.3 mg/g that also exceed the level of the not activated biochar samples iodine number for 2.5 times. Increasing of iodine number is a due to increasing of specific surface and the appearance of «new pores in pores» as it was shown in SEM images (Figure 6). Thus activated by KOH biochar obtained from walnut shell is It is suitable for use as a carrier for an organic iodine complex PPI.
3.3. Study of the Effect of Fertilizers on the Physiological Properties of Plants
In distilled water, we dissolved the PPI and polyvinyl alcohol. Then we adsorbed tis solution by adding biochar, mixed it thoroughly, and dried it with hot air until we obtained a crumbly mass. This mass was mixed with soil for growing plants seeds.
As a result of laboratory experiments on plants grown in pots and under controlled conditions, we found that the use of organic iodine fertilizer based on biochar, known as BIOF, increases the biomass of plants compared to the control. This is shown in Table 4.
Table 4.
Effect of iodine, and BIOF on the biometric parameters of parsley and dry matter content.
| Plant processing option | Plant height, cm | Weight of leaves, g/plant | Weight of roots, g/plant | Dry residue of plant, % |
|---|---|---|---|---|
| Control | 28.33±1.55a | 65.04±7.51a* | 7.12±0.42a | 13.15±0,92a |
| Pure biochar | 27.58±1.36a | 74.56±7.33b | 6.94±0.35a | 11.82±1,07a |
| KI | 28.86±0,89a | 77.72±7.42b | 7.31±0.30a | 13.27±1,33a |
| BIOF | 28.63±1.43a | 86.55±8.13c | 8.25±0.41b | 12.35±1,78a |
* Values of the same vertical column with the same indices do not differ statistically at p<0.05.
It is worth noting that the mass of fresh parsley leaves treated with BIOF was approximately 1.11 times greater (+11.4 %) than in plants treated with potassium iodide. While plants grown with potassium iodide also produced a higher leaf mass than the control, the difference was between 14.6 % and 19.3 %, depending on the specific conditions.
The iodine in both the organic iodide compound and potassium iodide exists in the form of iodide ions. The increase in leaf mass appears to be due to the interaction between the organic component, an amino acid, and the inorganic iodide. These data are in good agreement with the studies [25,26,27,28] that investigated the differences between the use of fertilizer with organic iodine compounds and inorganic compounds like potassium iodide and iodate, as well as the effect of phenylalanine on plant physiology.
The experiment on treating plants with BIOF showed an increase in root mass by %, indicating that iodine has a positive impact on the growth of plant roots, stimulating the development of their root systems. This is because iodine activates metabolic processes in plants, making them stronger. As a result, roots become more developed and better able to withstand adverse conditions like drought or waterlogging. [29,30] The dry residue analysis of the experimental and control plants did not show a statistically significant difference, remaining at around 11.8 % to 13.2 % of total plant weight in all cases.
It should also be noted that, according to [31,32,33], biochar has the ability to increase plant productivity. Biochar is a carbon-containing material that increases the amount of humus in soil and is used to solve problems related to soil fertility, growth, and development of plants under both normal and stressed conditions. It improves water retention [34,35], promotes nutrient absorption, and stimulates microbial activity [36,37,38], creating a favorable environment for sustainable agriculture [39,40].
3.4. The Effect of BIOF on the Content of Iodine and Organic Nitrogen in a Plant
The accumulation of iodine and nitrogen in plants is dependent on the content of these elements in the soil and the type and biological characteristics of the plant. Iodine accumulates mainly in the vegetative parts of plants, although its concentration can vary depending on various factors.
By reducing nitrogen loss and influencing nitrogen metabolism, the application of iodine can lead to an increase in nitrogen uptake by plants and improve nitrogen utilization efficiency, allowing the plant to use nitrogen more efficiently. Table 5 shows data on iodine accumulation in the leaves and roots of plants with different methods of application.
Table 5.
Effects of different iodine treatments on iodine and organic nitrogen concentration in leaves and roots.
Table 5.
Effects of different iodine treatments on iodine and organic nitrogen concentration in leaves and roots.
| Plant processing option | Iodine, mg/kg of d.w. |
Organic Nitrogen mg/kg of d.w. |
||
| leaves | roots | leaves | roots | |
| Control | - | - | 34.88±2.75a | 18.63±1.64a |
| Pure biochar | - | - | 35.25±2.66a | 17.32±1.81a |
| KI | 7.11±0.72a | 9.27±0.83a | 39.74±3.41a | 22.05±1.39b |
| BIOF | 11.86±1.13b | 13.23±1.19b | 57.37±3.82b | 36.63±2.07c |
The analysis results showed that the treatment of plants with potassium iodide leads to the accumulation of iodine in the plant, and inorganic iodine is distributed relatively equally in both parsley leaves and roots. In the case of the use of BIOF, the iodine content in plants increases by from 40 % in the roots to 66 % in the leaves of plants compared with inorganic iodine. In [43], this is explained by the fact that the iodide ion in potassium iodide, being an active reducing agent, easily enters into oxidation and halogenation reactions, and thus the transport of iodide to plant organs slows down slightly. In the composition of fertilizers, this oxidation process can be slowed down due to steric factors, as well as by sorption and desorption processes [44].
In turn, BIOF treatment allowed to obtain the highest concentration of organic nitrogen in the leaves and roots of plants, which increased by 22.49 mg / kg of dry weight compared with the control and 17.63 mg compared with potassium iodide. Thus, the use of a biocarbon fertilizer containing 1-carboxy-2-phenylethan-1-aminium iodide 2-azaniumyl-3-phenylpropanoate (PPI) increases the absorption of mineral nitrogen from the soil and increases the content of organic nitrogen. However, in this case, it is important to conduct extensive field studies of our fertilizer for nitrogen assimilation by other plants in order to gain an understanding of the use of bio-carbon-based iodine fertilizer for the selection of effective agricultural varieties.
3.5. The Effect of BIOF on the Antioxidant Activity of Plants
Iodine, as a trace element in plants, plays an important role in maintaining antioxidant activity, affecting photosynthesis, metabolism, and stress resistance. A lack of iodine can reduce the overall antioxidant protection, while its optimal content contributes to a more efficient work of the plant's antioxidant system [45,46,47].
The increase in plant AOA was more pronounced in the variants of plant treatment with sodium potassium iodide and in the variant with BIOF and averaged 1.3 – 1.5 times (Table 6). It should be noted that the level of accumulation of polyphenols, which is a more stable indicator compared to AOA, increased slightly only when using the BIOF variant. The findings of this research suggest that the application of biochar based iodine-organic fertilizers with 1-carboxy-2-phenylethan-1-aminium iodide 2-azaniumyl-3-phenylpropanoate may significantly enhance the antioxidant potential of parsley plants.
Table 6.
The effect of potassium iodine and BIOF on the accumulation of ascorbic acid, polyphenols, and parsley AOA.
Table 6.
The effect of potassium iodine and BIOF on the accumulation of ascorbic acid, polyphenols, and parsley AOA.
| Plant processing option | Ascorbic acid, mg/100 g d.w. (dry weight) |
AOA, mg GA/g d.w. |
Polyphenols, mg GA/g d.w. |
| Control | 23.31±2.43a* | 29.64±3.14a | 18.62±1.54a |
| Pure biochar | 25.17±2.32a | 30.25±3.03a | 20.07±1.37a |
| KI | 23.97±2.84a | 42.04±3.32b | 21.15±1.25ab |
| BIOF | 36.46±2.74b | 44.48±4.18b | 23.79±1.84b |
* Values with the same indices do not differ statistically at P<0.05.
This finding has significant implications for both agricultural production and human health, as it could potentially lead to the cultivation of parsley with enhanced health-promoting properties. Moreover, the improved antioxidative profile achieved through these treatments could also contribute to the resistance of the plants against environmental stressors, thus further supporting their utilization in sustainable agricultural systems.
rovide a concise and precise description of the experimental results, their interpretation, as well as the experimental conclusions that can be drawn.
4. Conclusions
In this work, the organoiodide complex 1-carboxy-2-phenylethan-1-aminium iodide 2-azaniumyl-3-phenylpropanoate (PPI) was synthesized and comprehensively characterized. It showed high solubility in polar media, characteristic IR/UV spectra, and thermal stability up to ~127 °C, confirming its suitability as an iodine source for agronomic applications. At the same time, a highly porous carrier based on walnut shell biochar was developed: KOH activation formed hierarchical porosity and increased S_BET at least threefold (up to ~878 m²/g) with an increase in iodine number to ~712 mg/g, making such biochar an effective matrix for immobilization and controlled release of PPI.
Soil and pot trials on parsley showed that granulated bio-iodine fertilizer (BIOF: PPI + biochar) provided consistent superiority over inorganic KI: leaf weight increased to 86.55 g/plant versus 77.72 g/plant with KI (and 65.04 g/plant in the control), root weight – to 8.25 g/plant (all differences were confirmed by letter indices at p < 0.05). At the nutritional level, BIOF ensured higher accumulation of iodine (leaves: 11.86 mg/kg, roots: 13.23 mg/kg d.m.) and organic nitrogen (leaves: 57.37 mg/kg, roots: 36.63 mg/kg) compared to KI, indicating improved digestibility and possible synergistic effects of the organic component of the fertilizer. Finally, BIOF significantly increased the antioxidant status of plants (ascorbic acid 36.46 mg/100 g d.v.; AOA 44.48 mg GA/g; polyphenols 23.79 mg GA/g), which complements the picture of functional biofortification.
The totality of the obtained results demonstrates that the combination of PPI with activated biochar from agrowaste forms a technologically simple and promising platform for biofortification of vegetable crops with iodine while simultaneously improving nutritional indicators and antioxidant activity. To translate the method into practice, field trials are needed on different soils and crops, optimization of PPI doses and loading, study of release kinetics and duration of action, as well as an assessment of economic efficiency in comparison with traditional forms of KI/KIO₃. The contribution of the work is the demonstration of a viable way to create a “smart” organo-mineral iodine source based on low-cost biochar, which opens up opportunities for sustainable biofortification and increasing the nutritional value of vegetable products.
Author Contributions
Conceptualization, A.S. and M.A.; methodology, S.T. and A.K.; validation, Y.D., K.S. and D.B.; formal analysis, A.Z.; investigation, A.K.; writing—original draft preparation, A.S.; writing—review and editing, A.K.; visualization, M.A., A.A.; supervision, Y.D.; project administration, A.S.; All authors have read and agreed to the published version of the manuscript.
Funding
This research is funded by a grant to young scientists from the Ministry of Science and Higher Education of the Republic of Kazakhstan AP19576946 "Development of the complex of iodine-coordinated biodegradable fertilizers based on natural sorbents to increase soil fertility".
Institutional Review Board Statement
Not applicable.
Informed Consent Statement
Not applicable.
Data Availability Statement
The data used to support the findings of this study are available from the corresponding author upon reasonable request.
Conflicts of Interest
The authors declare that they have no conflicts of interest.
Abbreviations
The following abbreviations are used in this manuscript:
| PPI | 1-carboxy-2-phenylethan-1-aminium iodide 2-azaniumyl-3-phenylpropanoate |
| BIOF | The granulated composition PPI + biochar |
| DSC | Differential scanning calorimetry |
| WS | Walnut shell |
| XRD | X-ray Diffraction analysis |
| AOA | Antioxidant activity |
References
- Ilin, A. I. (2017). Experimental Crystal Structure Determination (CCDC 1036670). Cambridge Crystallographic Data Centre. [CrossRef]
- N.A. Paretskaya, A.N. N.A. Paretskaya, A.N. Sabitov, R.A. Islamov, R.A. Tamazyan, S.Zh. Tokmoldin, A.I. Ilin, K.S. Martirosyan (2017). Phenylalanine – Iodine Complex and its Structure. News of The National Academy of Sciences of The Republic of Kazakhstan, Physico-Mathematical Series, ISSN 1991-346Х, Volume 2, Number 312 (2017), pp. 5 – 9.
- Grzanka, M.; Smoleń, S.; Skoczylas, Ł.; Grzanka, D. (2022). Synthesis of Organic Iodine Compounds in Sweetcorn under the Influence of Exogenous Foliar Application of Iodine and Vanadium. Molecules 27, 1822. [CrossRef]
- Medrano-Macías J, Leija-Martínez P, González-Morales S, Juárez-Maldonado A, Benavides-Mendoza A. Use of Iodine to Biofortify and Promote Growth and Stress Tolerance in Crops. Front Plant Sci. 2016 Aug 23;7:1146. [CrossRef] [PubMed] [PubMed Central]
- Adam Radkowski, Iwona Radkowska (2018). Influence of foliar fertilization with amino acid preparations on morphological traits and seed yield of timothy, Plant Soil Environ., 64(5):209-213. [CrossRef]
- GOST EN 1236-2013. Fertilizers. Method for determining bulk density without compaction. Interstate Standard (GOST) Мoscow, Russia, p.7, 2013. Available online: https://files.stroyinf.ru/Data/563/56357.pdf (accessed on 22 April 2025).
- Wolthuis, E. , Pruiksma, A. B., & Heerema, R. P. (1960). Determination of solubility: A laboratory experiment. Journal of Chemical Education, 37(3), 137. [CrossRef]
- Doszhanov E.O., Sabitov A.N., Mansurov Z.A., Doszhanov O.M., Zhandosov Zh.M., Rakhymzhan N. Method of obtaining sorbent from vegetable raw materials. Utility Model Patent No. 8681, 12/01/2023.
- M. Naderi, S. M. Naderi, S. Tarleton edition, “Surface Area: Brunauer–Emmett–Teller (BET), ” Progress in Filtration and Separation, Academic Press, pp. 585-608, 2015. ISBN 9780123847461. [CrossRef]
- GОST 33618-2015. Activated carbon. Standard method for determination of iodine value. Interstate standard. Мoscow, Russia, p.8, 2016. Available online: https://files.stroyinf.ru/Data2/1/4293756/4293756365.pdf (accessed on 22 April 2025).
- Sabitov Aitugan Nurbolatovich; Doszhanov Yerlan Ospanovich; Turganbai Seitzhan; Nurbolatuly Didar. RK patent for utility model No. 8791. A method for obtaining granular fertilizer based on pyrocarbon. IPC C05G 3/00 C05D 9/02. Published on 01/19/2024, Bulletin No. 3.
- GОST 31640-2012. Feeds. Methods for determination of dry matter content. Interstate standard. Мoscow, Russia, p. 11, 2012. Available online: https://files.stroyinf.ru/Data2/1/4293787/4293787414.pdf (accessed on 22 April 2025).
- Kharchenko, V. A., Moldovan, A. I., Golubkina, N. A., Gins, M. S., & Shafigullin, D. R. (2020). Comparative evaluation of several biologically active compounds content in Anthriscus sylvestris (L.) Hoffm. and Anthriscus cerefolium (L.) Hoffm. Vegetables of Russia, (5), 81-87. [CrossRef]
- N.A. Golubkina, H.G. N.A. Golubkina, H.G. Kekina, A.V. Molchanova, M.S. Antoshkina, S.M. Nadezhkin and A.V. Soldatenko (2020). Plant antioxidants and methods for their determination. Infra-M, vol. 1, p. 181. [CrossRef]
- Doszhanov, Y. , Atamanov, M., Jandosov, J., Saurykova, K., Bassygarayev, Z., Orazbayev, A.,... & Sabitov, A. (2024). Preparation of Granular Organic Iodine and Selenium Complex Fertilizer Based on Biochar for Biofortification of Parsley. Scientifica, 2024(1), 6601899. [CrossRef]
- Ramachandran, E. and Natarajan, S. (2007), XRD, thermal and FTIR studies on gel grown DL-Phenylalanine crystals. Cryst. Res. Technol., 42: 617-620. [CrossRef]
- Tomar, D. , Chaudhary, S., & Jena, K. C. (2019). Self-assembly of l-phenylalanine amino acid: electrostatic induced hindrance of fibril formation. RSC advances, 9(22), 12596-12605. [CrossRef]
- Max, J. J. , & Chapados, C. (2004). Infrared spectroscopy of acetone–water liquid mixtures. II. Molecular model. The Journal of chemical physics, 120(14), 6625-6641. [CrossRef]
- Tong, A. , Tang, X., Zhang, F., & Wang, B. (2020). Study on the shift of ultraviolet spectra in aqueous solution with variations of the solution concentration. Spectrochimica Acta Part A: Molecular and Biomolecular Spectroscopy, 234, 118259. [CrossRef]
- Gogoi, P. , Mohan, U., Borpuzari, M. P., Boruah, A., & Baruah, S. K. (2019). UV-Visible spectroscopy and density functional study of solvent effect on halogen bonded charge-transfer complex of 2-Chloropyridine and iodine monochloride. Arabian Journal of Chemistry, 12(8), 4522-4532. [CrossRef]
- ChemicalBook. (2025). Dimethyl sulfoxide – Product chemical properties. Available online: https://www.chemicalbook.com/ProductChemicalPropertiesCB9773699_EN.htm 22. (accessed on 20 April 2025).
- Moon, C. Y., Kim, Y. S., Lee, E. C., Jin, Y. G., & Chang, K. J. (2002). Mechanism for oxidative etching in carbon nanotubes. Physical Review B, 65(15), 155401. [CrossRef]
- Zhang, K. , Teng, J., Ding, L., Tang, X., Huang, J., Liu, S.,... & Li, J. (2025). Establishing structure-property relationships grounded in oxidation strategy engineering to unravel the triggering mechanism of Na+ filling in Hard Carbon closed pore. Electrochimica Acta, 146970. [CrossRef]
- Burgess, C. G., Everett, D. H., & Nuttall, S. (1989). Adsorption hysteresis in porous materials. Pure and Applied chemistry, 61(11), 1845-1852. [CrossRef]
- Halka, M. , Klimek-Chodacka, M., Smoleń, S., Baranski, R., Ledwożyw-Smoleń, I. and Sady, W. (2018), Organic iodine supply affects tomato plants differently than inorganic iodine. Physiol Plantarum, 164: 290-306. [CrossRef]
- Zhang, Y. , Cao, H., Wang, M., Zou, Z., Zhou, P., Wang, X., & Jin, J. (2023). A review of iodine in plants with biofortification: Uptake, accumulation, transportation, function, and toxicity. Science of The Total Environment, 878, 163203. [CrossRef]
- Jiao, Y. , Chen, Y., Ma, C., Qin, J., Nguyen, T. H. N., Liu, D.,... & Luo, Z. B. (2018). Phenylalanine as a nitrogen source induces root growth and nitrogen-use efficiency in Populus× canescens. Tree physiology, 38(1), 66-82. [CrossRef]
- Grey, C.B. , Cowan, D.P., Langton, S.D. et al. (1997). Systemic Application of L-Phenylalanine Increases Plant Resistance to Vertebrate Herbivory. J Chem Ecol 23, 1463–1470. [CrossRef]
- Dobosy, P., Vetési, V., Sandil, S., Endrédi, A., Kröpfl, K., Óvári, M., ... & Záray, G. (2020). Effect of irrigation water containing iodine on plant physiological processes and elemental concentrations of cabbage (Brassica oleracea L. var. capitata L.) and tomato (Solanum lycopersicum L.) cultivated in different soils. Agronomy, 10(5), 720. [CrossRef]
- Kiferle, C., Martinelli, M., Salzano, A. M., Gonzali, S., Beltrami, S., Salvadori, P. A., ... & Perata, P. (2021). Evidences for a nutritional role of iodine in plants. Frontiers in plant science, 12, 616868. [CrossRef] [PubMed] [PubMed Central]
- Xu, H. , Cai, A., Wu, D., Liang, G., Xiao, J., Xu, M.,... & Zhang, W. (2021). Effects of biochar application on crop productivity, soil carbon sequestration, and global warming potential controlled by biochar C: N ratio and soil pH: A global meta-analysis. Soil and Tillage Research, 213, 105125. [CrossRef]
- Khan, S. , Irshad, S., Mehmood, K., Hasnain, Z., Nawaz, M., Rais, A.,... & Ibrar, D. (2024). Biochar production and characteristics, its impacts on soil health, crop production, and yield enhancement: A review. Plants, 13(2), 166. [CrossRef]
- Li, X., Wu, D., Liu, X., Huang, Y., Cai, A., Xu, H., ... & Zhang, W. (2024). A global dataset of biochar application effects on crop yield, soil properties, and greenhouse gas emissions. Scientific Data, 11(1), 57. [CrossRef]
- Ndede, E. O., Kurebito, S., Idowu, O., Tokunari, T., & Jindo, K. (2022). The potential of biochar to enhance the water retention properties of sandy agricultural soils. Agronomy, 12(2), 311. [CrossRef]
- Lustosa Carvalho, M. , Tuzzin de Moraes, M., Cerri, C. E. P., & Cherubin, M. R. (2020). Biochar amendment enhances water retention in a tropical sandy soil. Agriculture, 10(3), 62. [CrossRef]
- Sharma, M. , Kaushik, R., Pandit, M. K., & Lee, Y. H. (2025). Biochar-induced microbial shifts: advancing soil sustainability. Sustainability, 17(4), 1748. [CrossRef]
- Kracmarova-Farren, M. , Alexova, E., Kodatova, A., Mercl, F., Szakova, J., Tlustos, P.,... & Stiborova, H. (2024). Biochar-induced changes in soil microbial communities: a comparison of two feedstocks and pyrolysis temperatures. Environmental Microbiome, 19(1), 87. [CrossRef]
- Barbosa, F. L., Santos, J. M., Mota, J. C., Costa, M. C., Araujo, A. S., Garcia, K. G., ... & Pereira, A. P. D. A. (2024). Potential of biochar to restoration of microbial biomass and enzymatic activity in a highly degraded semiarid soil. Scientific Reports, 14(1), 26065. [CrossRef]
- Vanapalli, K. R. , Samal, B., Dubey, B. K., & Bhattacharya, J. (2021). Biochar for sustainable agriculture: prospects and implications. In Advances in chemical pollution, environmental management and protection (Vol. 7, pp. 221-262). Elsevier. ISSN 2468-9289, ISBN 9780128201787. [CrossRef]
- Ayaz, M., Feizienė, D., Tilvikienė, V., Akhtar, K., Stulpinaitė, U., & Iqbal, R. (2021). Biochar role in the sustainability of agriculture and environment. Sustainability, 13(3), 1330. [CrossRef]
- Cezar, J. V. D. C. , Morais, E. G. D., Lima, J. D. S., Benevenute, P. A. N., & Guilherme, L. R. G. (2024). Iodine-enriched urea reduces volatilization and improves nitrogen uptake in maize plants. Nitrogen, 5(4), 891-902. [CrossRef]
- Smolen, S. , Sady, W., Rozek, S., Ledwozyw-Smolen, I., & Strzetelski, P. (2011). Preliminary evaluation of the influence of iodine and nitrogen fertilization on the effectiveness of iodine biofortification and mineral composition of carrot storage roots. Journal of Elementology, 16(2). [CrossRef]
- Zhu, Y-G., Huang, Y-Z., Hu, Y., & Liu, Y-X. (2003). Iodine uptake by spinach (Spinacia oleracea L.) plants grown in solution culture: effects of iodine species and solution concentrations. Environment International, 29, 33-37.
- Tiyogi Nath, T. N. , Priyankar Raha, P. R., & Amitava Rakshit, A. R. (2010). 9: Sorption and desorption behaviour of iodine in alluvial soils of Varanasi, India, Agricultura 7, 2010. [Google Scholar]
- Shalaby, O. A. (2025). Iodine application induces the antioxidant defense system, alleviates salt stress, reduces nitrate content, and increases the nutritional value of lettuce plants. Functional Plant Biology, 52(6). Jun;52:FP24273. [CrossRef]
- Blasco, B. , Rios, J.J., Cervilla, L.M., Sánchez-Rodrigez, E., Ruiz, J.M. and Romero, L. (2008), Iodine biofortification and antioxidant capacity of lettuce: potential benefits for cultivation and human health. Annals of Applied Biology, 152: 289-299. [CrossRef]
- Krzepiłko, A., Święciło, A., & Zych-Wężyk, I. (2021). The antioxidant properties and biological quality of radish seedlings biofortified with iodine. Agronomy, 11(10), 2011. [CrossRef]
Disclaimer/Publisher’s Note: The statements, opinions and data contained in all publications are solely those of the individual author(s) and contributor(s) and not of MDPI and/or the editor(s). MDPI and/or the editor(s) disclaim responsibility for any injury to people or property resulting from any ideas, methods, instructions or products referred to in the content. |
© 2025 by the authors. Licensee MDPI, Basel, Switzerland. This article is an open access article distributed under the terms and conditions of the Creative Commons Attribution (CC BY) license (https://creativecommons.org/licenses/by/4.0/).
Copyright: This open access article is published under a Creative Commons CC BY 4.0 license, which permit the free download, distribution, and reuse, provided that the author and preprint are cited in any reuse.


