Submitted:
14 September 2025
Posted:
15 September 2025
You are already at the latest version
Abstract
Pipeline projects are inherently complex, involving extensive logistics, regulatory compliance, environmental considerations, and significant financial investments. Managing these projects effectively requires robust scheduling and performance tracking mechanisms to mitigate delays and cost overruns. Earned Value Management (EVM) provides a structured framework for integrating cost, schedule, and performance metrics, allowing for real-time project assessment and informed decision-making. This paper explores the role of EVM in enhancing pipeline project scheduling and performance tracking. It delves into key EVM components, including Planned Value (PV), Earned Value (EV), and Actual Cost (AC), and examines critical performance indicators such as the Schedule Performance Index (SPI) and Cost Performance Index (CPI). By leveraging these metrics, project managers can predict schedule variances, optimize resource allocation, and improve project forecasting accuracy. Furthermore, the study highlights the importance of EVM in stakeholder engagement and standardized reporting, ensuring transparency and proactive issue resolution. Two case studies of successful EVM implementation in pipeline projects demonstrate its practical benefits, offering insights into best practices and lessons learned. Additionally, advanced forecasting techniques such as Estimate at Completion (EAC) and Variance at Completion (VAC) are discussed, illustrating their significance in cost and schedule control. As pipeline projects continue to expand in scale and intricacy, the integration of EVM into project management methodologies is becoming increasingly critical. This paper concludes that EVM is not only a valuable tool for tracking project progress but also a strategic enabler for improving efficiency, reducing risks, and ensuring the successful delivery of pipeline infrastructure projects.
Keywords:
Earned Value Management (EVM)
; Schedule Performance Index (SPI)
; Performance Tracking
; Cost Control
; Variance Analysis
; Estimate at Completion (EAC)
; Variance at Completion (VAC)
1. Introduction
Pipeline projects are unique in the realm of civil and industrial engineering, primarily because of the scale, length, and logistical intricacies involved [3]. Constructing pipelines requires planning and coordination across varied terrains, often spanning thousands of miles through rural areas, urban environments, and protected ecosystems [1]. The primary objective of these projects is to create a reliable conduit that can transport natural resources, such as oil, natural gas, or water, efficiently and safely from their source to the final destination, typically refineries, distribution facilities, or storage locations [4]. Each project stage, from route selection and environmental impact assessments to procurement, construction, and testing, involves significant resources, coordination, and a high degree of precision [2].
A typical pipeline project encompasses several phases, each presenting distinct engineering challenges and requiring specialized expertise [2]. In the initial phase, route planning and land acquisition take precedence, as this stage involves negotiating with landowners and regulatory authorities, conducting geological and environmental assessments, and designing an optimal route that minimizes environmental disruption while considering technical feasibility [5]. Once the necessary engineering approvals are obtained, the project advances into the procurement and logistics phase, where contractors and suppliers coordinate to acquire critical materials such as high-grade steel pipes, precision-engineered valves, and corrosion-resistant protective coatings [5]. Simultaneously, heavy construction equipment, including trenching machines, welding units, and pipeline inspection tools, is mobilized to remote and often challenging terrains to facilitate installation and ensure compliance with engineering specifications [6].
Beyond the inherent intricacy of coordinating multiple contractors and suppliers, pipeline projects are highly susceptible to external risks and uncertainties [9]. Environmental factors, such as adverse weather conditions, seasonal restrictions, and the sensitivity of local ecosystems, often necessitate adjustments to the schedule [1]. Additionally, pipeline projects face significant regulatory scrutiny, as these installations cross public and private land, potentially affecting communities and ecosystems [7]. These projects must comply with numerous standards and regulations governing environmental protection, worker safety, and structural integrity, adding additional layers of density to pipeline projects [5].
Given these factors, pipeline projects require more than traditional scheduling techniques, they demand robust methodologies that can adapt to changing conditions and provide engineers and managers with real-time insights into project performance [9]. Earned Value Management (EVM) has emerged as a powerful framework for addressing these challenges, offering a quantitative approach to integrating schedule, cost, and scope in a single, unified model [10].
2. Literature Review
2.1. Earned Value Management (EVM)
Earned Value Management (EVM) is a systematic approach to tracking project performance and progress through a combination of cost and schedule management [10,11,12,13,14,15,16]. It originated in the 1960s within the U.S. Department of Defense and has since become widely adopted across various industries for its effectiveness in managing large, multifaceted projects [17]. Unlike traditional project management approaches, such as the Critical Path Method (CPM) and Gantt charts, which primarily track budget adherence or schedule progress, Earned Value Management (EVM) provides a multi-dimensional view of project performance by integrating cost, schedule, and scope metrics [6,10].
The core principle of EVM is its ability to integrate three critical metrics
- a)
- Planned Value (PV)
- b)
- Earned Value (EV)
- c)
- Actual Cost (AC)
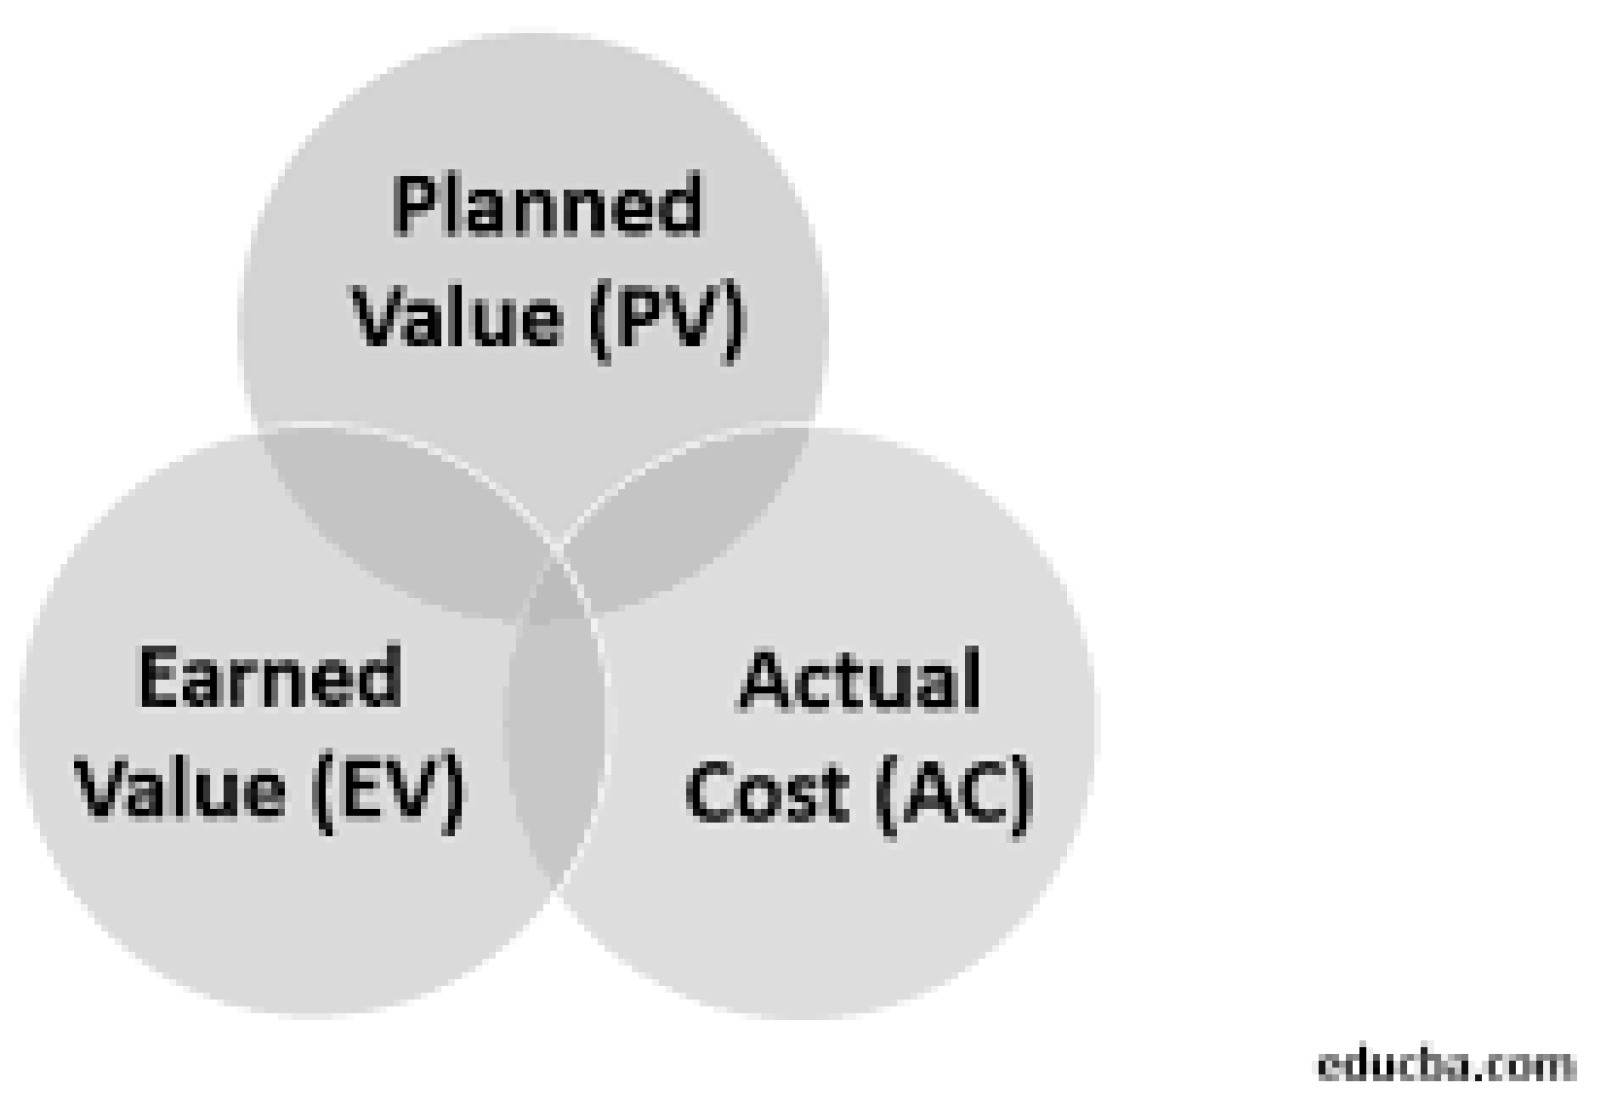
These metrics are used to generate performance indices, such as the Cost Performance Index (CPI) and Schedule Performance Index (SPI), which provide insights into how efficiently a project is performing against its budget and schedule [18].
In practice, EVM enables project managers to answer essential questions about a project’s health.
Are we on schedule?
Are we on budget?
What is the projected final cost?
EVM provides both a snapshot of current performance and predictive insights that help project managers make informed decisions [10]. By calculating metrics that show how much of the budgeted work has been completed for the amount spent, EVM facilitates a more accurate, data-driven approach to project control [1]. For engineers and project managers, EVM is invaluable in identifying potential issues early in the project lifecycle, thereby allowing for timely corrective actions and improved resource allocation [5,6,7,8,9,10,11,12,13,14,15,16,17,18].
- A.
- Planned Value (PV)
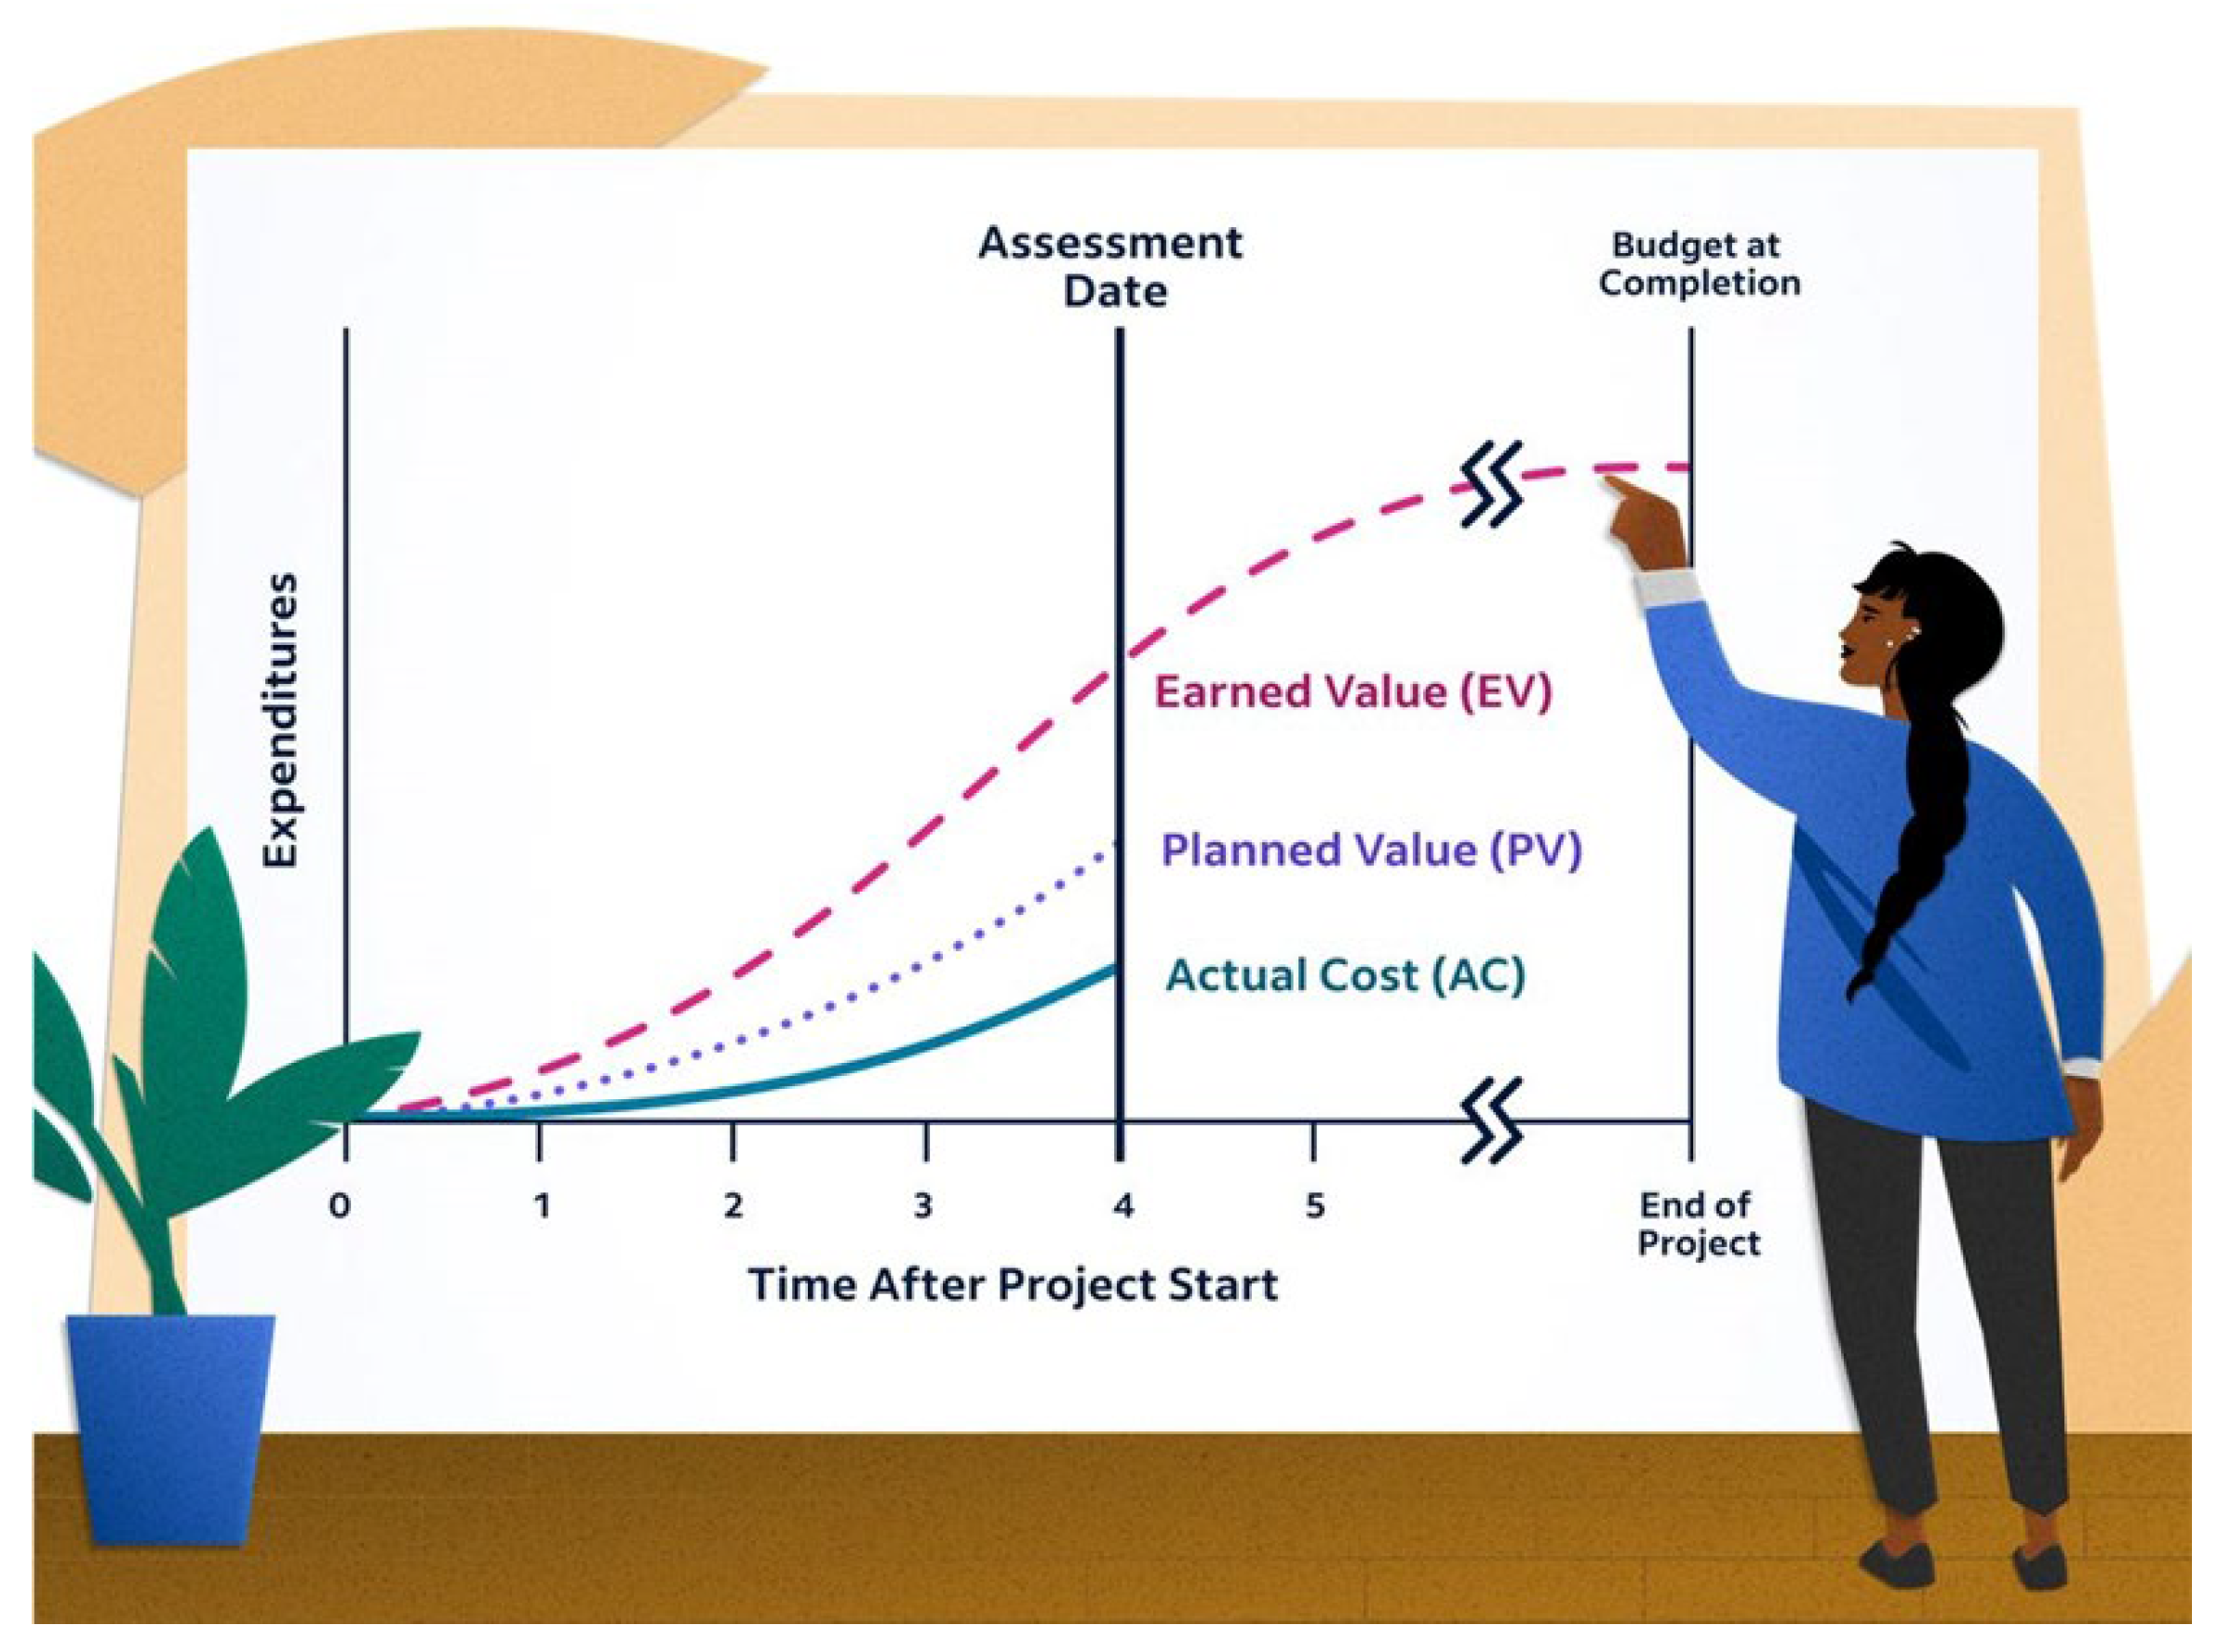
Planned Value (PV) represents the budgeted cost for the work scheduled to be completed up to a particular point in time [19]. It reflects the project’s baseline plan, serving as a reference against which progress and costs are measured [5]. For example, if a pipeline project has a planned timeline of twelve months, and the project has reached the six-month mark, the PV at this stage would be the budgeted cost of the work expected to have been completed by this point [10].
PV is essentially a measure of project progress as per the initial schedule and budget, providing an objective benchmark against which Earned Value (EV) and Actual Cost (AC) can be compared [19]. Project teams use PV to determine how much progress should have been made by a given time, based on the budget and schedule outlined in the project plan [2,3,4,5,6,7,8,9]. This metric is also essential in calculating the Schedule Performance Index (SPI), which reveals how the project is performing in terms of the timeline relative to the planned schedule [10].
- B.
- EarnedValue(EV)
Earned Value (EV) is the portion of the budgeted cost that corresponds to the actual work completed by a specific point in time [20]. This value is calculated based on the percentage of work that has been completed relative to the total project scope [10]. Unlike PV, which represents the budgeted cost of scheduled work, EV reflects the budgeted cost of the work that has actually been accomplished [19]. For instance, consider a pipeline project with a total budget of $10 million and an expected duration of 12 months. According to the project schedule, by month six, 40% of the work should be completed, meaning the Planned Value (PV) at this point is $4 million (40% of the total budget) [21]. However, due to unforeseen delays, only 30% of the work has actually been completed by this time.
In Earned Value Management (EVM) terms, the Earned Value (EV) will be calculated based on the actual progress made rather than the planned progress [10]. Since only 30% of the work is complete, the EV is $3 million (30% of the total budget) [21]. This means that while the project was expected to have delivered $4 million worth of work by month six, it has only achieved $3 million worth, indicating a schedule delay [19].
This discrepancy between PV and EV highlights potential risks, allowing project managers and engineers to analyze the causes of delays such as supply chain disruptions, adverse weather conditions, or labor shortages -and take corrective actions to bring the project back on track [1,2,3,4,5,6,7,8,9,10].
EV is one of the most critical components of EVM because it provides a real measure of performance, illustrating how much value has been earned for the amount spent [4]. By comparing EV to PV, project managers can calculate schedule variance (SV), which helps assess whether a project is ahead or behind schedule [8]. When EV is compared to AC, managers derive the Cost Performance Index (CPI), which shows how effectively the project is utilizing its budget. These comparisons make EV a key metric in understanding both project efficiency and effectiveness in terms of cost and schedule adherence [15].
- C.
- ActualCost(AC)
Actual Cost (AC), as the name suggests, is the total expenditure incurred for the work completed at any given time [19]. Unlike PV and EV, which are calculated based on the budgeted costs, AC represents the actual funds that have been spent on project activities [10]. For example, if a pipeline project was scheduled to spend $1 million by month six but has actually spent $1.2 million, the AC for that period would be $1.2 million [20]. AC is used to gauge how much has been spent to complete the work, regardless of whether it matches the planned or earned value [13].
In EVM, AC is a key metric in determining cost efficiency and identifying potential budget overruns. By comparing AC to EV, project managers can calculate the Cost Performance Index (CPI), which reflects how well the project is performing against its budget [16]. If the CPI shows that the AC is higher than EV, it indicates cost inefficiency, signaling that the project is consuming more resources than planned [12]. Conversely, if AC is lower than EV, it suggests cost efficiency. AC is thus integral to assessing project financial health, providing a realistic view of spending patterns and their impact on the project’s overall budget [7].
Source: https://community.atlassian.com/forums/App-Central-articles/Earned-Value-Management-EVM-Metrics-Your-Project-s-Financial-GPS/ba-p/2714330.
2.1.1. Benefits of Using EVM in Project Management
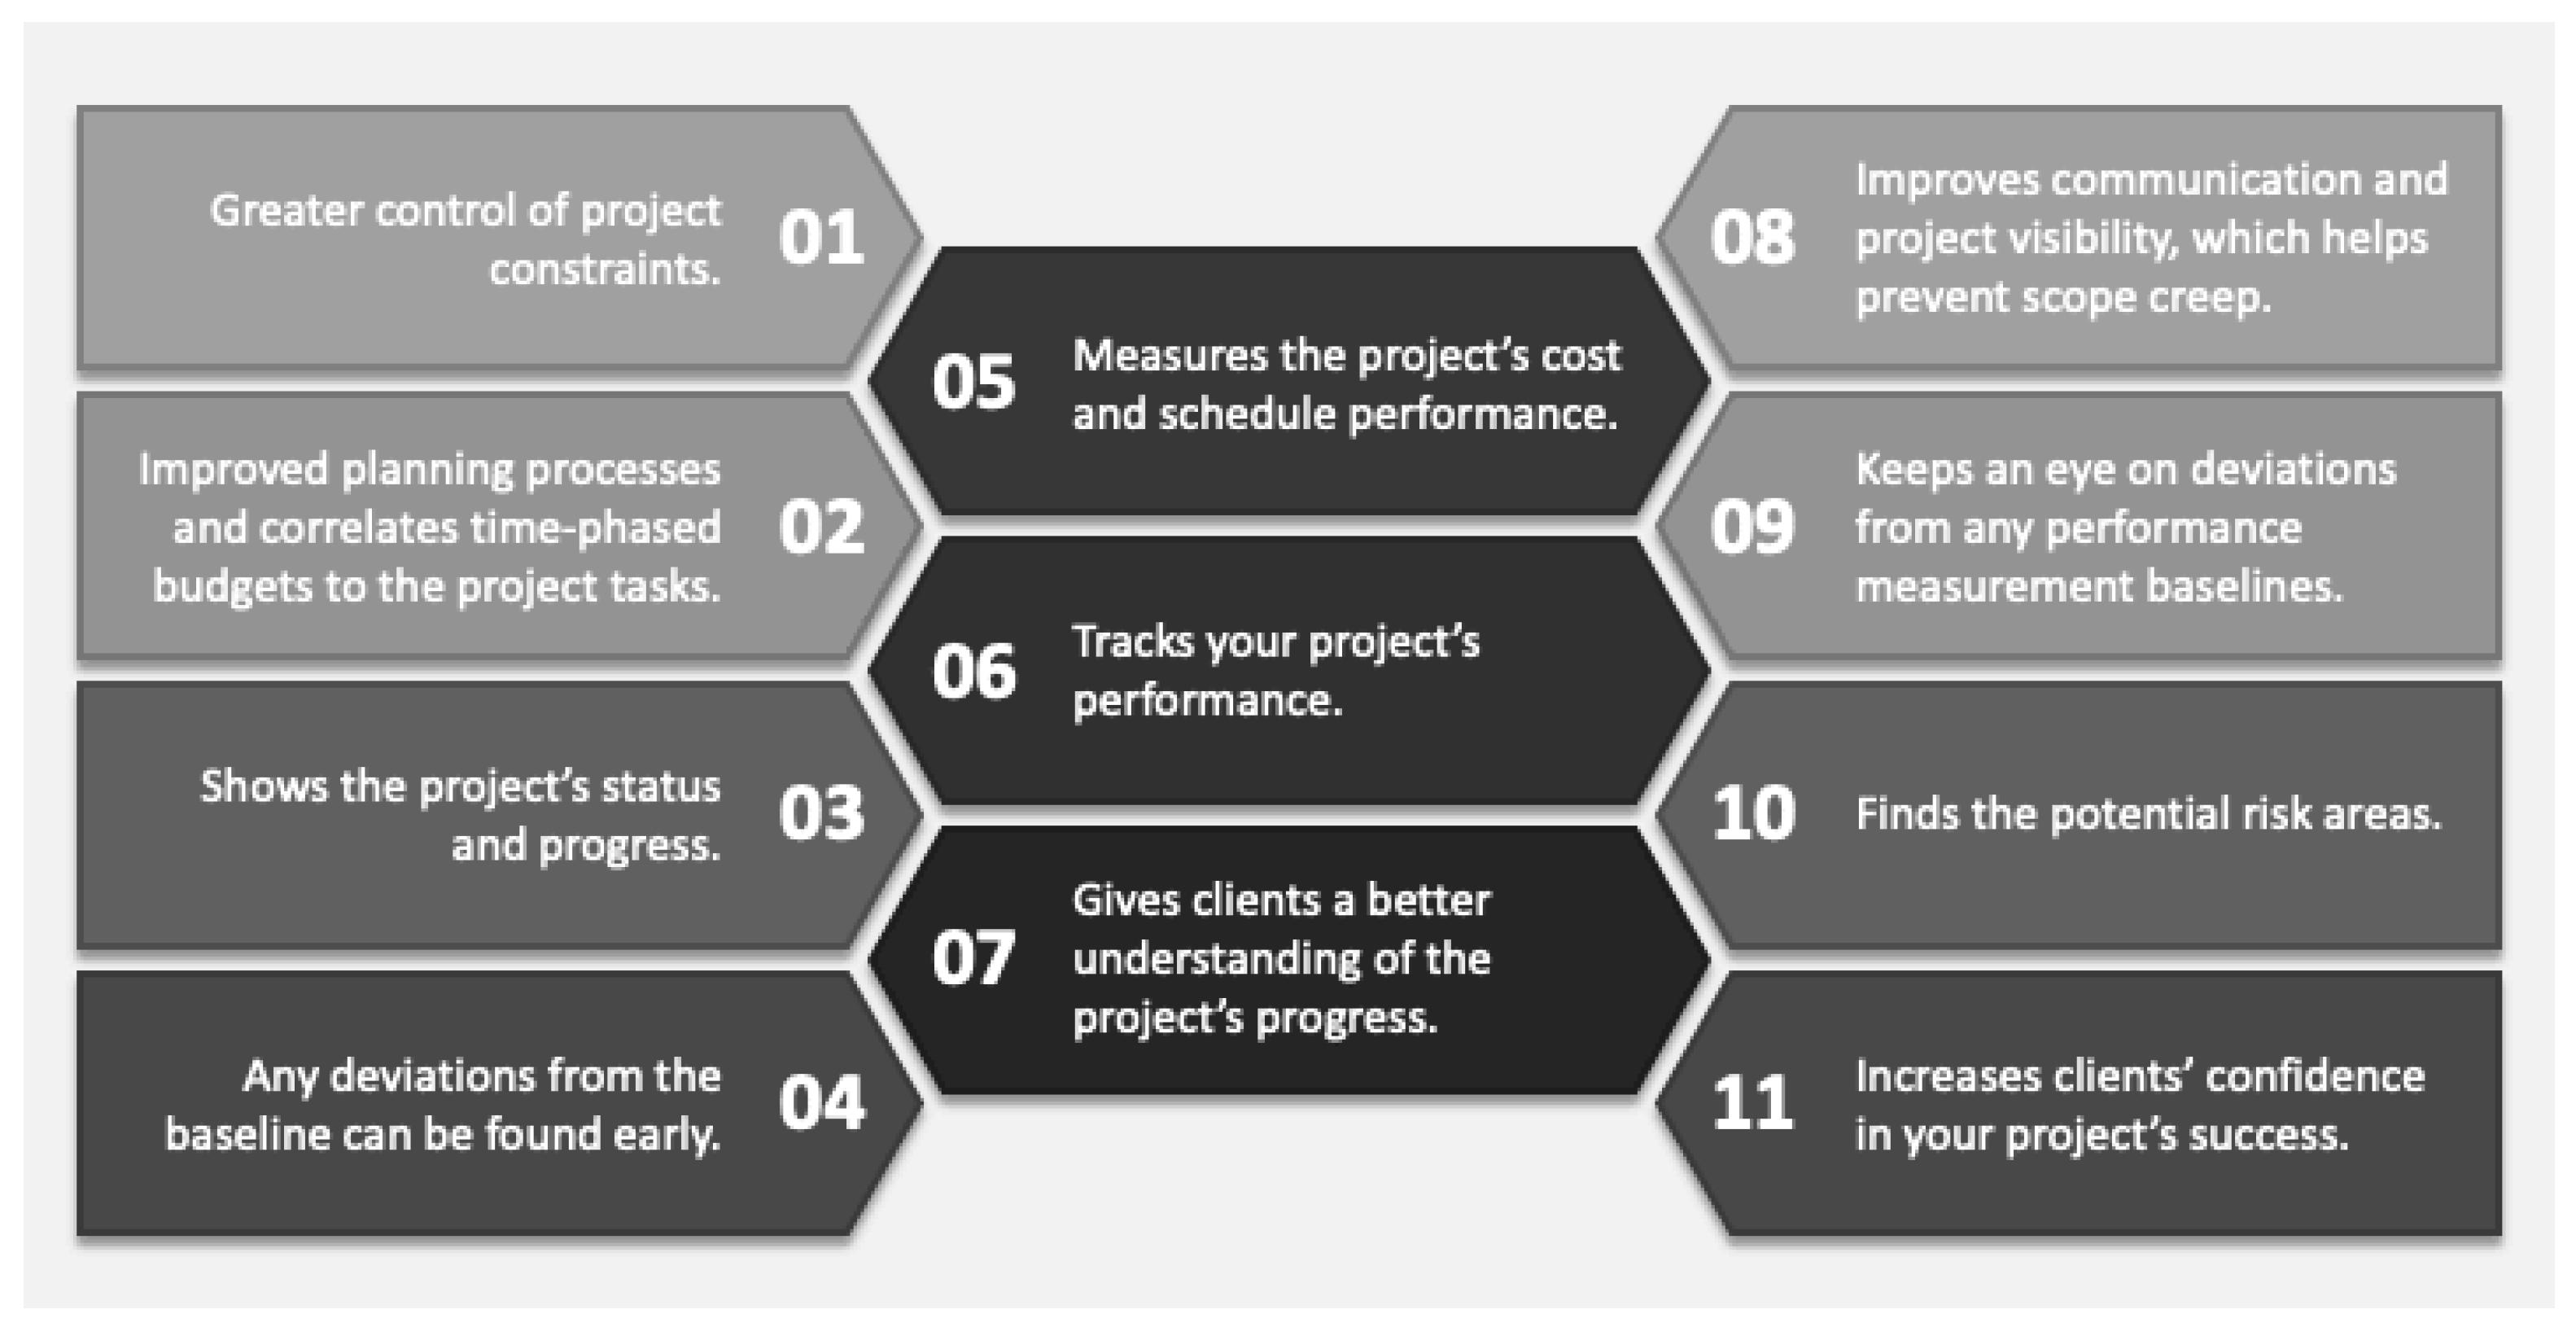
One of the primary benefits of EVM is its ability to provide early warnings of schedule or cost issues, allowing project teams to take corrective actions promptly [5]. Through EVM’s performance indices, such as CPI and SPI, project managers can detect deviations from the planned budget and schedule at an early stage, which is crucial for mitigating risks and optimizing resources [10].
Another significant benefit of EVM is its predictive capability. By analyzing trends in CPI and SPI, project managers can forecast the final project cost and completion date, providing valuable insights for decision-making [10,11,12,13,14,15,16,17,18,19]. This ability to anticipate future performance based on current data is particularly beneficial in projects with tight budgets and strict deadlines, as it enables proactive adjustments rather than reactive crisis management [14].
EVM also enhances communication and transparency within the project team and with stakeholders by providing a standardized method for reporting progress [5]. In pipeline projects, where multiple contractors, suppliers, and regulatory bodies are involved, EVM data can be used to create clear, concise reports that quantify performance in terms of cost and schedule. This standardization simplifies compound information, making it easier for stakeholders to understand project status, risks, and potential outcomes [20]. Transparent reporting using EVM not only builds trust but also aligns the expectations of all parties involved, reducing the likelihood of disputes and ensuring that everyone is informed of the project’s current health and future projections [19,20].
Additionally, EVM supports effective resource management by allowing project managers to allocate resources based on actual performance data. By understanding which parts of the project are over budget or behind schedule, managers can make informed decisions about reallocating personnel, equipment, or funding to critical areas [19]. In pipeline construction, where resources are often scarce and costly, the ability to optimize resource usage based on real-time data is invaluable. EVM’s comprehensive performance tracking helps avoid unnecessary expenditures and enables managers to make data-driven adjustments to maintain control over the project’s trajectory [5,6,7,8,9,10].
Therefore, EVM is an indispensable tool for maintaining control over project timelines and budgets, improving resource allocation, and fostering transparent communication with stakeholders [17]. Through EVM, project managers can not only track performance more accurately but also enhance the overall efficiency and success of project delivery [16].
Figure 1.
Benefits of Using EVM in Project Management [8].
Figure 1.
Benefits of Using EVM in Project Management [8].
2.2. Key Performance Indicators in EVM
Earned Value Management (EVM) uses specific Key Performance Indicators (KPIs) to provide insight into a project’s health and performance [19]. Among the most critical of these KPIs are the Cost Performance Index (CPI) and Schedule Performance Index (SPI) [10]. Both metrics serve distinct but complementary roles in evaluating project efficiency, CPI reflects the cost efficiency of the work accomplished, while SPI measures schedule efficiency [10,11,12,13,14,15,16,17,18,19,20]. By integrating cost and schedule data, these KPIs allow project managers and engineers to better understand, control, and forecast project performance [20].
2.2.1. Cost Performance Index (CPI)
The Cost Performance Index (CPI) is one of the most significant metrics within EVM. CPI measures the cost efficiency of the work performed on a project, offering insight into whether the project is staying within its budget [11]. Essentially, CPI assesses how much value is derived from each dollar spent, helping managers determine if project expenditures are in line with the planned budget [14].
CPI can be especially beneficial in large-scale and resource-intensive projects, such as pipeline construction, where budget control is essential for long-term success [7]. By monitoring CPI throughout the project lifecycle, project managers can identify areas of cost overruns early on, investigate their root causes, and implement corrective measures before the budget spirals out of control [9].
2.2.1.1. Calculation of CPI
CPI is calculated by dividing Earned Value (EV) by Actual Cost (AC).
This formula is represented as;
Earned Value (EV) represents the budgeted cost of work that has been completed up to a certain point in the project, while Actual Cost (AC) represents the total amount spent on that work [19].
For instance, if a project’s EV at a specific point is $500,000, but the AC is $550,000, the CPI would be calculated as;
In this example, a CPI of 0.91 indicates cost inefficiency, as the project has spent more than it has earned in terms of progress. The CPI value reveals that for every dollar spent, the project is only earning about 91 cents of value, highlighting the need for budget adjustments or resource reallocation.
2.2.1.2. Interpretation of CPI Results
Interpreting the CPI is straightforward but crucial for informed project management. A CPI equal to 1.0 indicates that the project is exactly on budget, meaning every dollar spent results in a dollar of earned value [20].
However, when CPI exceeds 1.0, the project is running under budget, suggesting high-cost efficiency. For example, a CPI of 1.2 implies that the project is generating $1.20 in value for every dollar spent.
When CPI falls below 1.0, it signals a cost overrun. A CPI of 0.85, for instance, would imply that for every dollar spent, only 85 cents of earned value is achieved, indicating inefficiency and the need for corrective action. Persistent CPI values below 1.0 can result from issues such as poor resource management, inaccurate budgeting, or project issues.
In pipeline projects, where costs are heavily impacted by fluctuating material prices, skilled labor availability, difficult terrain conditions, regulatory compliance, and unpredictable environmental factors such as extreme weather and geotechnical challenges, maintaining a Cost Performance Index (CPI) close to or above 1.0 is crucial [5,6,7,8,9,10]. Failure to do so can lead to significant budget overruns, financial strain, and potential project delays, ultimately jeopardizing the economic feasibility and successful completion of the pipeline [19].
2.2.2. Schedule Performance Index (SPI)
The Schedule Performance Index (SPI) is another fundamental KPI in EVM, measuring the efficiency of time or schedule in a project [22]. SPI compares the work accomplished to the work planned by a specific date, providing a measure of schedule adherence [22]. While CPI focuses on cost, SPI focuses on whether the project is progressing according to its planned schedule. SPI is particularly valuable in projects where meeting timelines is critical [19].
For instance, the Nord Stream 2 pipeline, designed to transport natural gas from Russia to Germany, experienced significant delays due to geopolitical tensions, sanctions, and environmental concerns [23]. These setbacks not only inflated project costs but also disrupted planned energy supply schedules, leading to financial losses for stakeholders [23]. Similarly, the Dakota Access Pipeline faced prolonged legal battles and environmental protests, causing delays that resulted in increased security costs, contractual penalties, and extended labor expenses [20]. These cases highlight how delays in pipeline projects can severely impact budgets, disrupt production schedules, and threaten overall project feasibility [22].
2.2.2.1. Calculation of SPI
SPI is calculated by dividing Earned Value (EV) by Planned Value (PV).
The formula is;
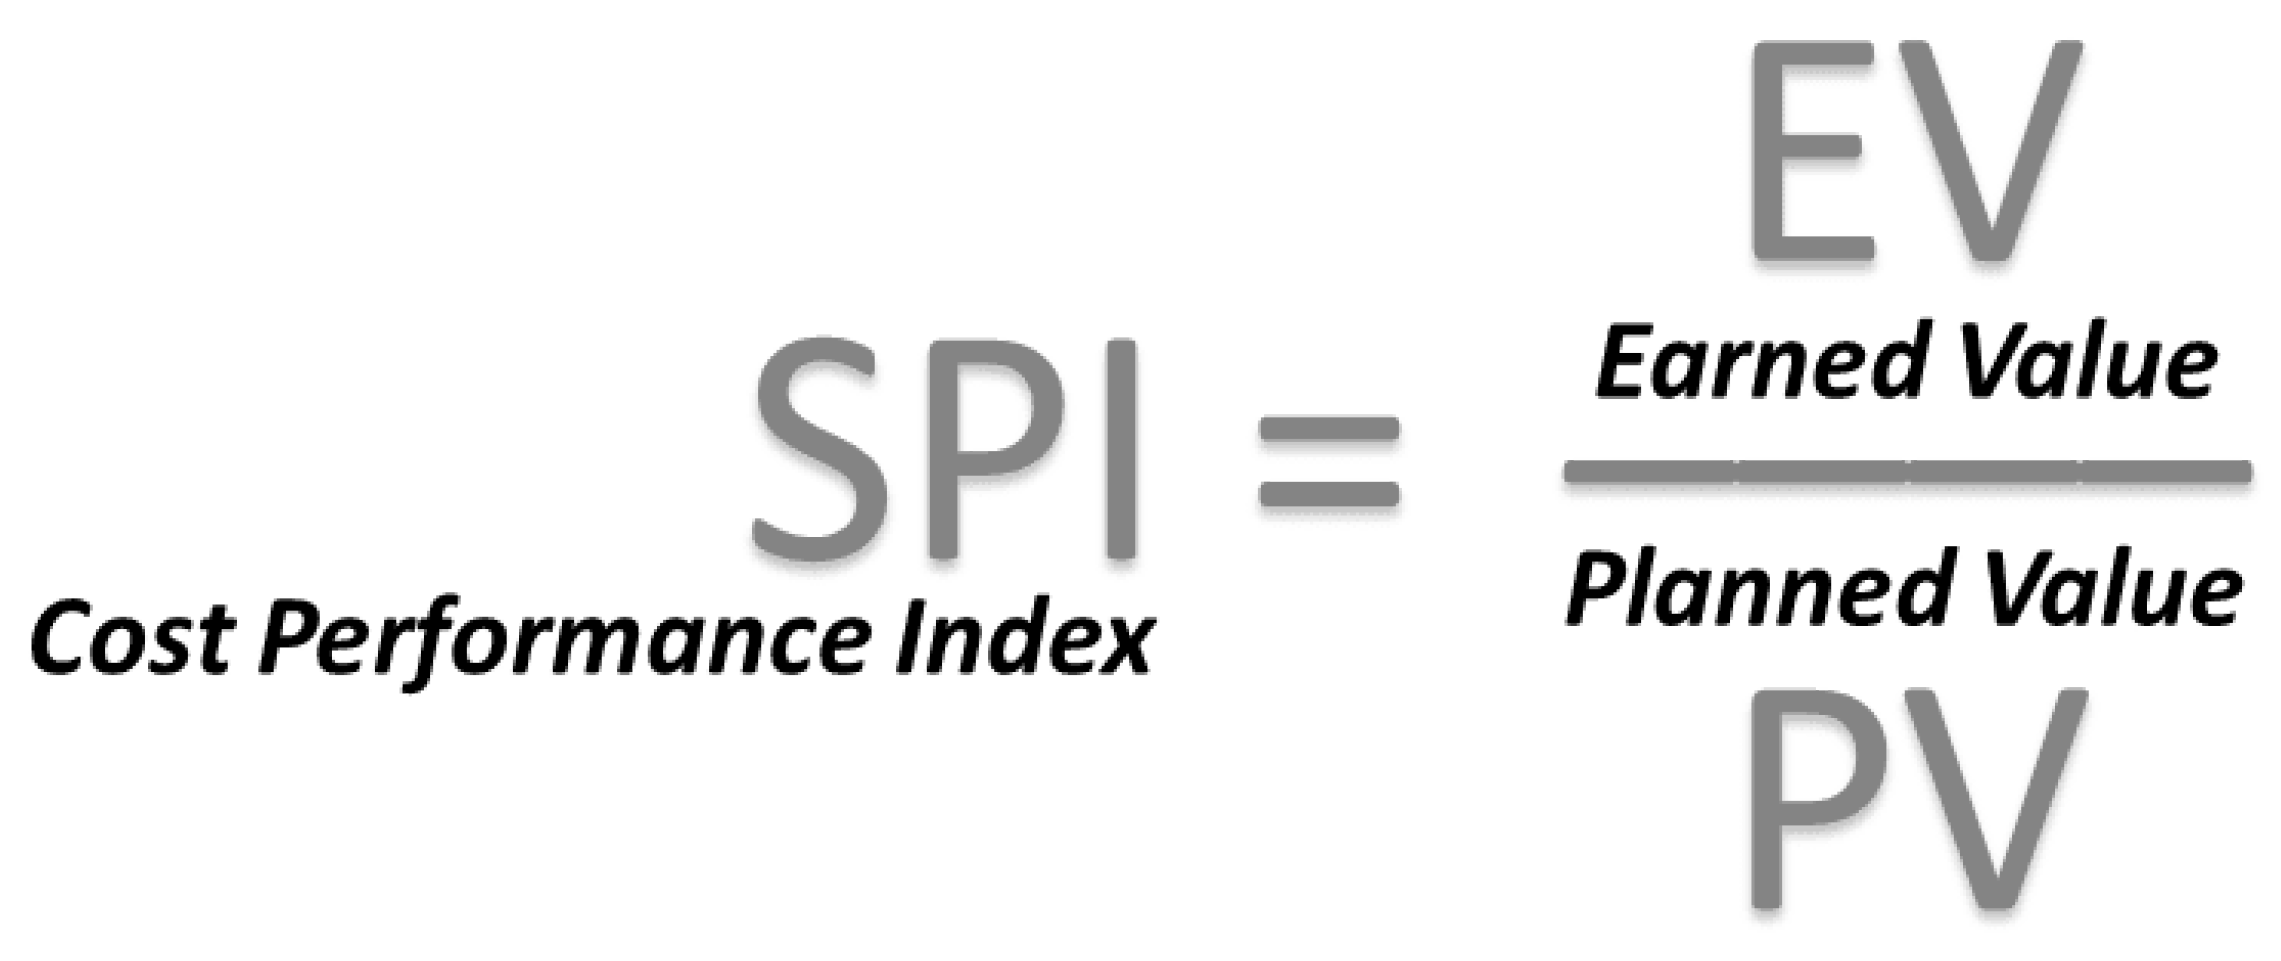
In this equation, Earned Value (EV) is the budgeted cost of the work completed to date, and Planned Value (PV) is the budgeted cost of the work scheduled to be completed by the same date [20].
For example, if the EV for a project phase is $400,000, but the PV is $450,000, the SPI calculation would be;
An SPI of 0.89 suggests that the project is behind schedule, as only 89% of the planned work has been completed. This metric helps managers pinpoint areas where work is lagging, prompting the exploration of corrective actions, such as redistributing resources, increasing labor [11]. Implementing faster processes properly seen in the examples, how The Trans Mountain Pipeline Expansion in Canada addressed delays by redistributing resources to critical sections, increasing labor, and implementing advanced construction techniques like horizontal directional drilling [24,25]. The TurkStream Pipeline overcame geopolitical and technical challenges by deploying additional skilled workers, using advanced pipeline-laying vessels, and prioritizing resources for deep-water segments [26]. The Southern Gas Corridor optimized processes with modular construction techniques and reallocated resources to bottlenecks like the Trans-Anatolian Pipeline in Turkey [27]. The TAPI Pipeline prioritized resources for secure sections, hired additional contractors, and used modular construction techniques to navigate geopolitical instability and security concerns [27]. These examples demonstrate how performance metrics help managers identify inefficiencies and implement corrective actions like resource redistribution, increased labor, and process optimization to keep pipeline projects on track [26].
2.2.2.2. Interpretation of SPI Results
Understanding SPI results is vital for effective schedule management. A SPI of exactly 1.0 indicates that the project is proceeding on schedule, achieving planned progress within the expected timeframe [19].
When SPI exceeds 1.0, it implies that the project is ahead of schedule [10]. For example, an SPI of 1.1 suggests that the project has completed 110% of the planned work for a particular period, indicating that time management and resource allocation are performing better than anticipated.
However, a SPI below 1.0 signifies that the project is behind schedule. An SPI of 0.75, for instance, indicates that only 75% of the planned work has been completed by the scheduled time, raising concerns about potential delays. SPI consistently below 1.0 could signal a serious risk to timely completion, as project timelines are often sensitive to environmental windows and regulatory constraints [5,6,7,8,9,10,11,12,13,14,15,16,17,18,19].
2.2.3. The Synergy Between CPI and SPI in EVM
While CPI and SPI are distinct metrics, they work together to provide a comprehensive picture of a project’s health [5]. CPI offers insight into cost efficiency, while SPI assesses schedule adherence. In combination, they enable project managers to evaluate whether a project is progressing within its approved budget and timeline, ensuring alignment with both financial and scheduling constraints [5,6,7,8,9,10,11,12,13,14,15,16,17,18,19]. The balanced application of CPI and SPI helps project managers maintain control over both cost and schedule, enabling them to adjust their strategies to align with overall project objectives [13].
2.2.4. Practical Implications of CPI and SPI in Pipeline Projects
Implications of CPI and SPI extend beyond basic budget and schedule control, given the examples of case studies of rework in pipeline installation projects [5]. An understanding of CPI allows managers to assess cost efficiency in real-time, crucial for a sector where resources like steel, labor, and machinery are often subject to price volatility [12]. By tracking CPI, managers can detect inefficiencies, identify areas with rising costs, and implement cost-control measures, such as negotiating better prices with suppliers or reallocating resources from over-performing areas to those experiencing cost overruns [8].
A falling SPI alerts managers to schedule risks, prompting actions such as increasing workforce on-site or deploying additional equipment to accelerate work [4,5]. Moreover, because pipeline projects often span remote or challenging locations, managers can use SPI insights to adjust logistical support, ensuring that materials and resources are available when needed to prevent schedule delays [2,3,4,5,6,7,8].
Therefore, it is important to note that CPI and SPI are essential KPIs within the EVM framework that provide project managers with powerful tools for managing costs and schedules effectively [11]. Where budget control and schedule adherence are paramount, these KPIs enable a proactive approach to managing resources, controlling expenses, and ensuring timely project delivery [3]. By understanding and leveraging CPI and SPI, engineers and project managers can achieve a higher level of project control, ensuring that complex projects stay on track, on budget, and within scope requires careful monitoring and timely corrective actions [18]. For example, the Trans Mountain Pipeline Expansion addressed delays by reallocating resources and using advanced construction techniques, while the TurkStream Pipeline overcame challenges by deploying additional skilled workers and optimizing processes [23,24,25,26]. Similarly, the Southern Gas Corridor prioritized resource allocation to critical sections, and the Diamond Pipeline accelerated progress by engaging local communities and using pre-fabricated segments [27]. These examples highlight how effective management ensures projects meet their approved budget, timeline, and scope [5].
2.3. Predicting Schedule Variances with EVM
Earned Value Management (EVM) is essential for identifying and addressing schedule variances in engineering projects, allowing project managers to anticipate delays and implement corrective measures [10]. Schedule variance refers to the difference between planned and actual progress, directly influencing resource allocation, budget management, and overall project performance [5].
In pipeline and other resource-intensive projects, unplanned delays can trigger cascading effects, increasing costs, straining resource availability, and extending timelines [12]. Accurate forecasting of schedule variances enables engineers and project managers to mitigate these risks by making informed adjustments, such as reallocating resources, optimizing workforce deployment, or modifying task sequencing [21]. This proactive approach helps maintain project momentum and prevents disruptions that could otherwise lead to financial and operational setbacks [5].
For instance, if an upcoming delay is detected early, project managers can reschedule critical activities, secure additional workforce or equipment, or implement contingency strategies to offset potential disruptions [5,6,7,8,9,10,11,12,13]. Such foresight also strengthens stakeholder communication by providing realistic progress updates and ensuring greater transparency in project execution [12].
Pipeline projects are particularly vulnerable to external factors such as environmental conditions, regulatory approvals, and logistical constraints [12]. The ability to anticipate and respond to schedule variances enables managers to take preemptive actions, such as securing regulatory exemptions, adjusting work sequences based on weather conditions, or refining construction strategies to maintain efficiency [14]. By integrating EVM into project scheduling, engineers can enhance decision-making, improve reliability, and ensure that key milestones are met within designated timeframes [5].
2.3.1. Monitoring EV, PV, and AC for Variance Prediction
Earned Value (EV) represents the budgeted cost of the work actually performed up to a given point in time [12]. It is a measure of the project’s actual progress and serves as a benchmark for comparing actual performance against planned progress [21]. Planned Value (PV), on the other hand, is the anticipated budget for the work that was scheduled to be completed by a certain date [12,13,14,15,16,17,18,19,20,21]. By comparing EV to PV, project managers can identify whether the project is on schedule, ahead of schedule, or behind schedule [20]. When EV is less than PV, it indicates a schedule variance in which the project lags; conversely, when EV exceeds PV, the project is ahead of schedule [10].
Actual Cost (AC), which represents the actual expenditure for the work performed, provides further insights into cost efficiency and project performance [21]. Although AC does not directly influence schedule variance, it allows project managers to correlate cost data with schedule metrics [19]. Monitoring AC alongside EV and PV helps identify cost-driven schedule variances and highlights areas where cost performance may be impacting schedule adherence [21].
These metrics also feed into two key indicators in EVM. Schedule Performance Index (SPI) and Cost Performance Index (CPI) [10].
SPI, calculated as EV divided by PV, is a ratio indicating schedule efficiency, while CPI, calculated as EV divided by AC, reflects cost efficiency [28]. Together, SPI and CPI form a foundational aspect of variance prediction in EVM, helping managers gauge whether project delays are due to inefficient scheduling, cost issues, or a combination of both [18]. For example, a low SPI may suggest that resources are not being utilized effectively, indicating potential scheduling challenges [20]. By continuously monitoring Earned Value (EV), Planned Value (PV), and Actual Cost (AC), project managers can analyze cost and schedule trends to anticipate deviations from the project plan. The relationship between these metrics provides insights into project efficiency, helping managers make data-driven decisions to maintain financial control and schedule adherence [21].
Planned Value (PV) represents the budgeted cost for scheduled work at a given point in time, while Actual Cost (AC) reflects the actual expenditure incurred for completed work [18]. When AC exceeds PV significantly, it indicates cost overruns, suggesting inefficiencies in resource utilization or unforeseen expenditures such as material price fluctuations or extended labor hours [10,11,12,13,14,15,16,17,18]. Conversely, if AC is lower than expected but project progress (EV) also lags, it may signal underperformance or resource shortages [20].
By tracking these metrics, project managers can detect patterns that indicate potential cost or schedule risks [20]. For example, if PV suggests that 50% of a pipeline installation should be completed by month six, but EV shows only 40% completion while AC has already reached 55% of the budget, it reveals both a schedule delay and cost overrun [20]. Recognizing such trends early enables corrective actions such as optimizing resource deployment, renegotiating supplier contracts, or adjusting workflow sequencing to improve efficiency [12].
This continuous assessment ensures that corrective measures are taken before variances escalate, maintaining project viability by balancing actual costs against planned budgets while keeping schedules aligned with strategic objectives [21].
2.3.2. Forecasting Techniques
In addition to monitoring EV, PV, and AC, project managers use various forecasting techniques to estimate future project performance and predict variances [21]. Among the most commonly used techniques are Estimate at Completion (EAC) and Variance at Completion (VAC). These metrics provide engineers with insights into the future costs and timelines of a project, taking into account the current rate of progress [28]. Forecasting with EAC and VAC enables managers to anticipate end-of-project outcomes, offering a clear picture of whether a project is likely to meet its initial schedule and budget goals [21,22,23,24,25,26,27,28].
2.3.2.1. Estimate at Completion (EAC)
Estimate at Completion (EAC) is a forecasting technique used to predict the total cost of the project at its conclusion, based on current performance data [21]. By calculating EAC, project managers gain an indication of whether the project will finish within its original budget or if additional funds will be necessary [29]. Although EAC primarily focuses on cost predictions, it also provides indirect insights into schedule performance because projects that are significantly over or under budget often experience schedule deviations as well [21]. EAC is calculated using several different methods, depending on the project’s specific circumstances and the rate of progress [5].
One common EAC formula assumes that cost performance will continue at the same rate as the current CPI. This approach, known as the “cumulative CPI” method, is particularly useful for projects with consistent cost efficiency, as it reflects a steady trend in spending relative to earned value [21,22,23,24,25,26,27,28,29].
The formula for EAC under this method is;
where BAC represents the Budget at Completion, or the project’s initial budget. If a pipeline project has a BAC of $2 million and a current CPI of 0.9, the EAC would be approximately $2.22 million, indicating an anticipated overrun.
Another approach to calculating EAC involves combining both CPI and SPI, especially when the project is experiencing schedule delays that may impact cost efficiency.
This “composite CPI/SPI” method is represented by the formula;
This approach provides a closer estimate, accounting for both cost and schedule performance when forecasting project completion [21]. For projects with fluctuating performance, such as those influenced by seasonal weather changes, regulatory requirements, terrain difficulties, geopolitical risks, supply chain disruptions, labor availability, or unexpected environmental conditions, the composite CPI/SPI method offers a more realistic projection [1,2,3,4,5,6,7,8,9,10,11,12].
For example, in pipeline construction, harsh winter conditions in northern regions can halt excavation and welding activities, while monsoon seasons may lead to flooding and access issues, delaying progress [1]. Regulatory approvals, such as environmental impact assessments or land acquisition permits, can introduce unpredictable delays [10]. Additionally, pipelines crossing mountainous or marshy terrains may require specialized construction techniques, increasing costs and slowing down progress [1]. Geopolitical tensions or trade restrictions can also disrupt material supply chains, causing unforeseen delays in procurement and construction [26].
By incorporating the composite CPI/SPI method, project managers can account for these uncertainties, producing more accurate forecasts that reflect real-world conditions affecting pipeline projects [21].
2.3.2.2. Variance at Completion (VAC)
Variance at Completion (VAC) is a metric closely related to EAC, representing the anticipated difference between the project’s Budget at Completion (BAC) and its Estimate at Completion (EAC) [30].
Calculated as VAC = BAC - EAC, this metric provides a straightforward measure of the projected budget overrun or underrun. While VAC is primarily a financial indicator, it is often used alongside SPI and CPI to infer potential schedule impacts, especially in cases were budget variances stem from schedule inefficiencies [30].
For example, a negative VAC, indicating an anticipated overrun, may prompt project managers to investigate whether cost overruns are linked to schedule delays or other inefficiencies in resource allocation. In pipeline projects, where delays often incur additional costs for materials, equipment, or labor, VAC offers valuable insight into how schedule inefficiencies may impact project costs [31].
A VAC of -$300,000, for instance, would suggest a budget overrun due to inefficiencies, signaling to managers that adjustments are necessary to prevent further delays. In combination with SPI, VAC helps project managers assess whether projected budget overruns stem from purely financial issues or from delays that affect cost performance [30].
2.3.3. EVM and Proactive Project Management
Together, EAC and VAC play a crucial role in proactive project management by allowing managers to predict both budget and schedule variances [32]. In pipeline projects, these metrics enable managers to take a forward-looking approach to managing project performance, responding to anticipated issues before they escalate [31]. By continuously monitoring EAC and VAC, project teams can adapt to changing project conditions, optimizing resource allocation and scheduling to minimize variances [12].
For example, if a pipeline project forecasts a negative VAC due to material cost increases, project managers can evaluate ways to reduce expenses in other areas, such as optimizing workforce deployment or negotiating better rates with suppliers [20]. Similarly, if an EAC projection indicates that a project is trending over budget due to schedule delays, project managers can focus on accelerating key project activities or re-sequencing tasks to improve schedule efficiency [32].
By combining real-time variance tracking with forecasting techniques like EAC and VAC, EVM empowers project managers to make data-driven decisions that align project performance with its initial goals [32]. This approach is essential in large-scale projects, where delays and cost overruns can have significant financial impacts [33]. Through continuous monitoring and forecasting, EVM enables engineers to maintain control over multifaceted projects, ensuring successful delivery within schedule and budget constraints.
2.4. Enhancing Communication and Stakeholder Engagement
Effective communication and engagement with stakeholders are critical aspects of successful project management, especially in intricate engineering projects like pipeline construction [4]. In these projects, stakeholders range from internal team members and contractors to external parties such as regulatory authorities, local communities, and project investors [4].
The involvement and alignment of these stakeholders throughout the project life cycle are essential for minimizing disruptions, fostering trust, and ensuring that project objectives are met on time and within budget [9].
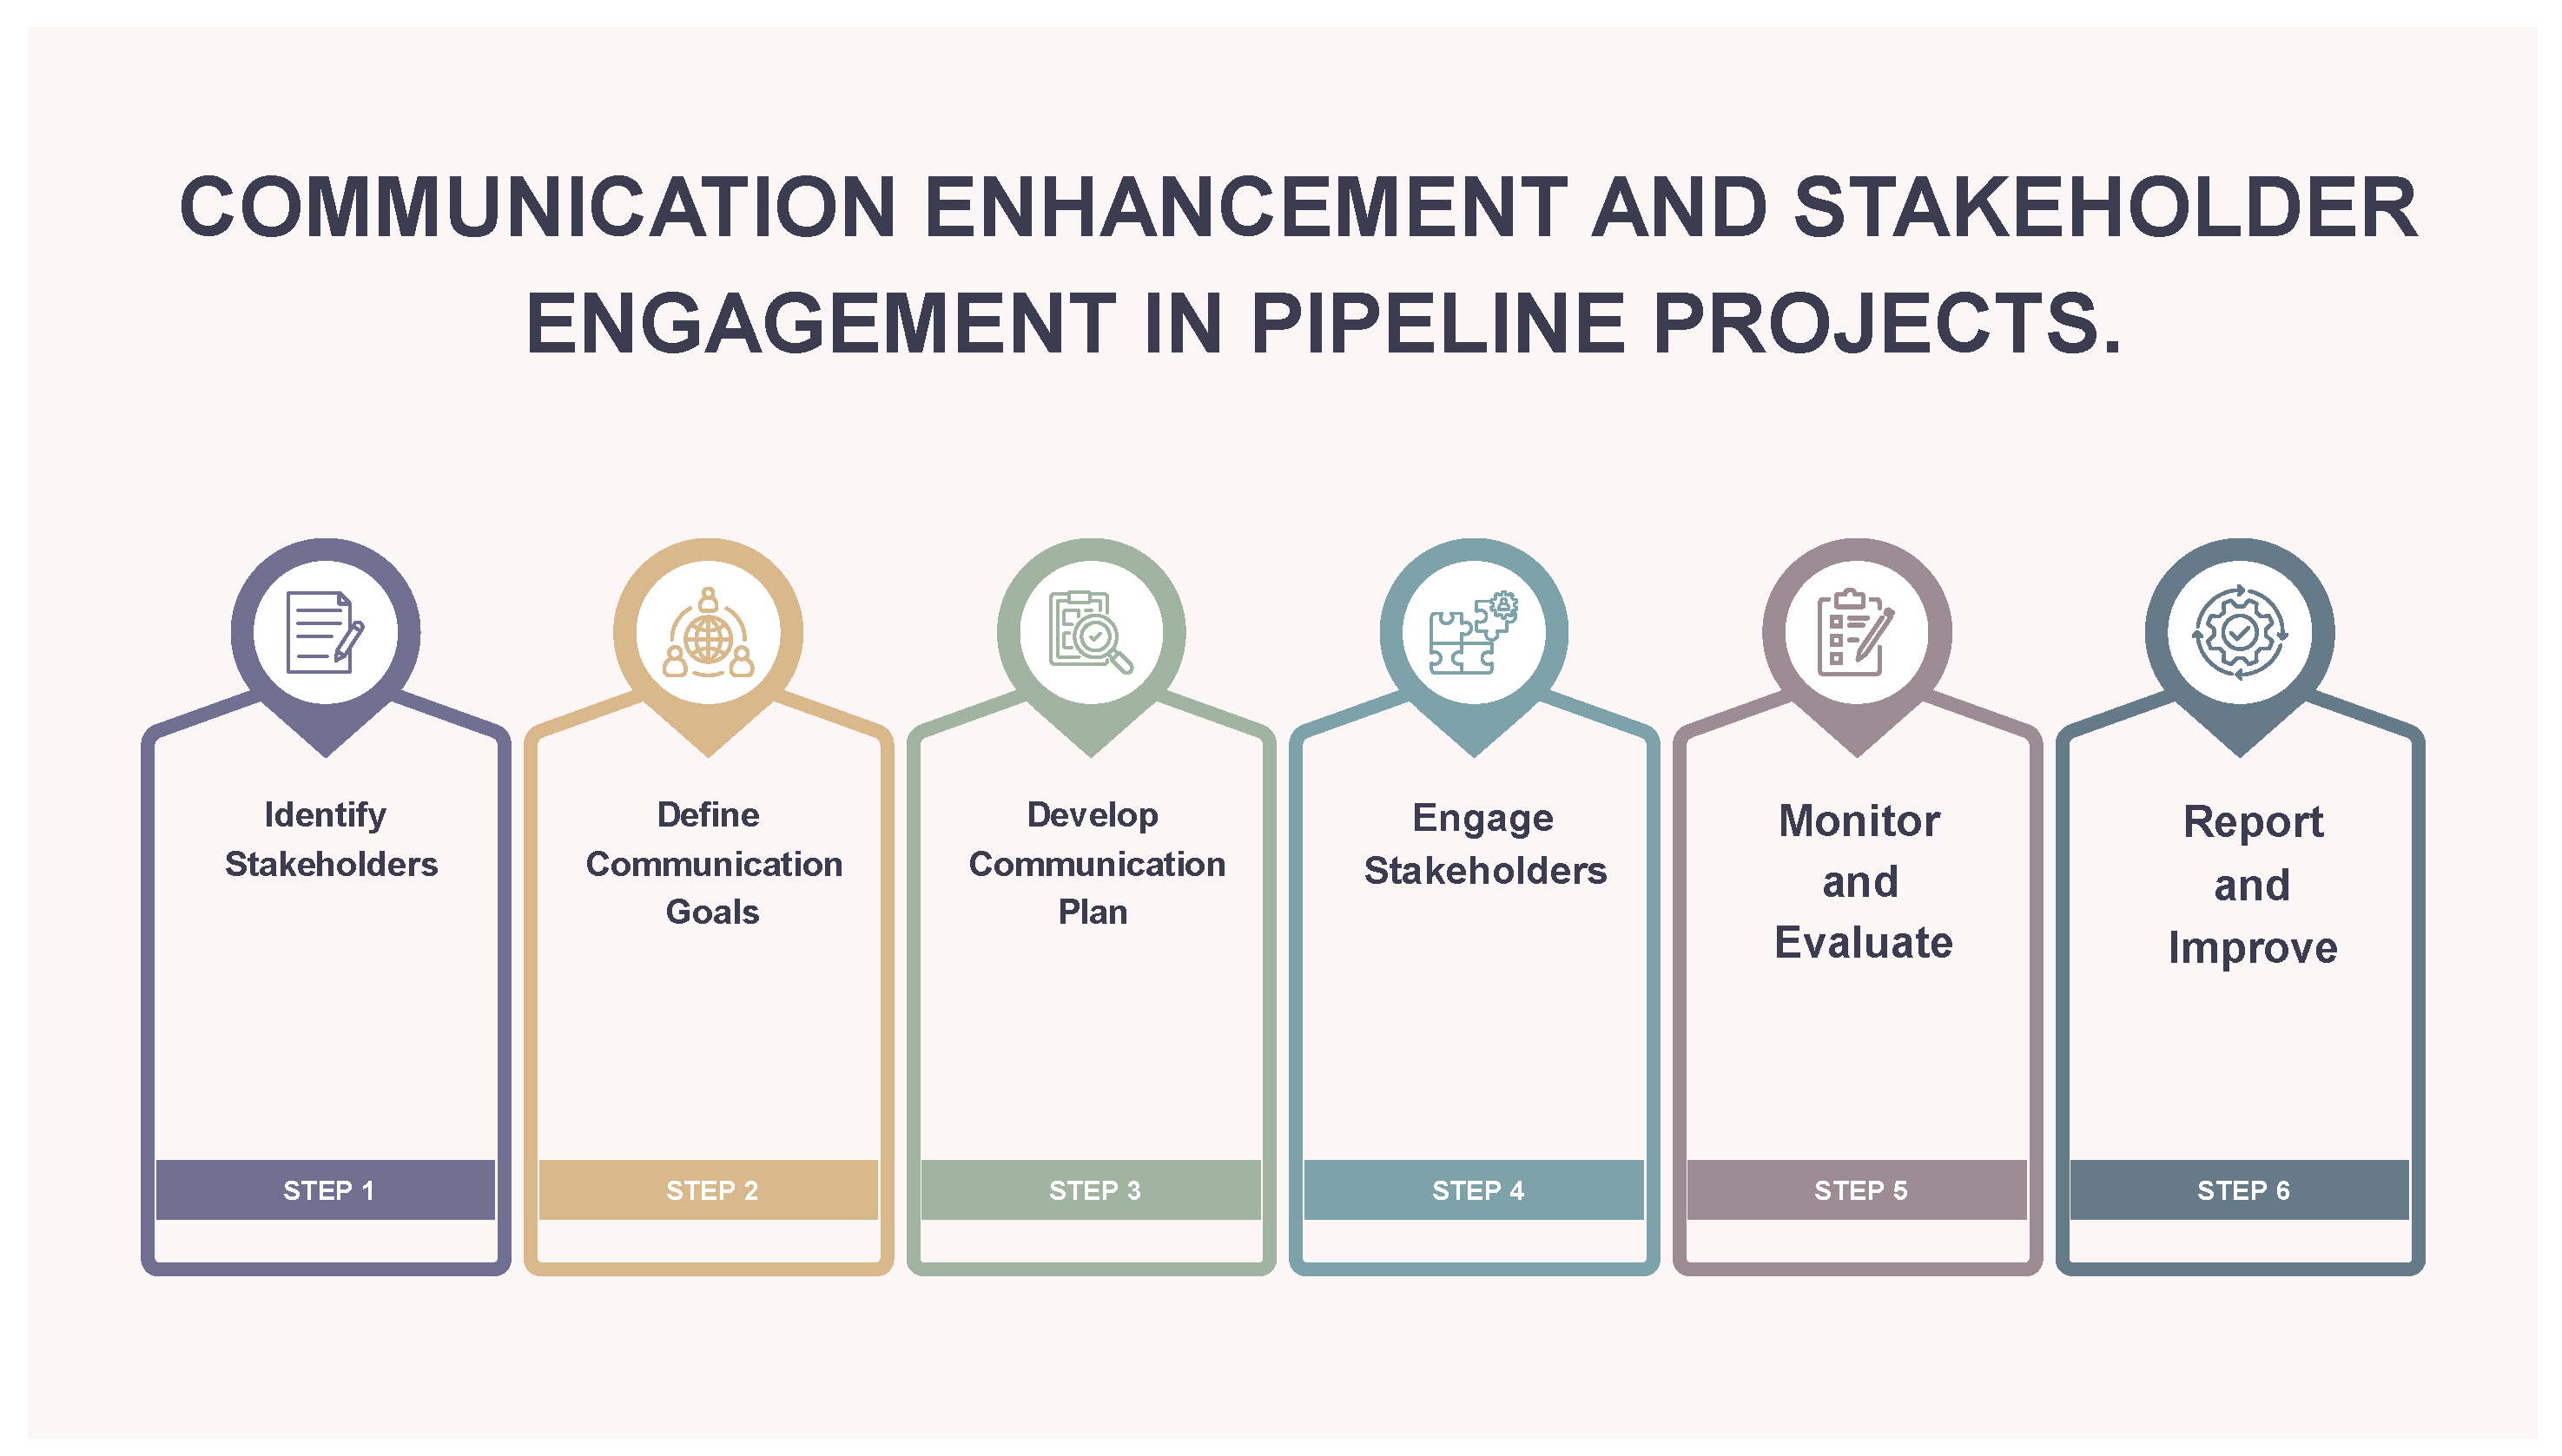
Practical steps to Enhance Communication and Stakeholder Engagement in Pipeline Projects
-
Identify Stakeholders
- ➢
- Listing all stakeholders (e.g., government, local communities, contractors, environmental groups, investors).
- ➢
- Also, Categorizing them by influence and interest.
-
Define Communication Goals
- ➢
- Establishing clear objectives for engagement (e.g., transparency, trust-building, conflict resolution).
- ➢
- Align goals with project milestones.
-
Develop Communication Plan
- ➢
- Choose communication channels (e.g., meetings, social media, newsletters, public hearings).
- ➢
- Tailor messages for different stakeholder groups.
- ➢
- Set a timeline for regular updates.
-
Engage Stakeholders
- ➢
- Conduct consultations, workshops, and surveys.
- ➢
- Address concerns and feedback proactively.
- ➢
- Build relationships through consistent and open dialogue.
-
Monitor and Evaluate
- ➢
- Track stakeholder satisfaction and feedback.
- ➢
- Measure the effectiveness of communication strategies.
- ➢
- Adjust the plan based on outcomes.
-
Report and Improve
- ➢
- Share progress and outcomes with stakeholders.
- ➢
- Continuously refine communication and engagement processes.
- ➢
- Foster long-term relationships for future projects.
Figure 2.
Six steps to enhance communication and stakeholder engagement in Pipeline projects.
2.4.1. The Role of Communication in Pipeline Projects
Communication is the backbone of any successful pipeline project due to the multidisciplinary nature of such undertakings and the number of parties involved [5]. Pipeline construction typically involves engineers, environmental experts, financial managers, and contractors, each with distinct roles and responsibilities that must be coordinated to avoid delays and cost overruns [18]. Moreover, communication within these projects is often complicated by external factors, including environmental regulations, public opposition, and safety concerns [13].
2.4.2. Impact of Pipeline Project Communication on Communities
- a)
- Transparency and Public Trust: Clear and consistent communication fosters trust between project developers and local communities. Providing timely updates on project progress, safety measures, and environmental considerations helps alleviate public concerns and prevents misinformation from spreading [15].
- b)
- c)
- Community Safety and Risk Mitigation: Residents living near pipeline routes need to be informed about potential risks, emergency response plans, and safety precautions. Proper communication reduces panic in the event of incidents and enables prompt, coordinated action [1].
- d)
- Land Use and Compensation Clarity: Landowners and affected communities must be engaged early regarding land acquisition, compensation, and potential disruptions. Transparent discussions help prevent conflicts and legal disputes while ensuring fair treatment for affected individuals [20].
- e)
- Health and Environmental Monitoring Reports: Providing communities with accessible reports on air and water quality, noise levels, and other environmental indicators ensures accountability and reassures residents about the project’s compliance with regulatory standards [12].
- f)
- Conflict Resolution and Community Engagement: Open communication channels allow residents to voice concerns, report grievances, and provide feedback. Establishing local advisory boards or community liaisons helps facilitate productive dialogue and conflict resolution [13].
- g)
- Sustainability and Corporate Social Responsibility (CSR) Initiatives: Companies can use communication strategies to showcase their investment in community development projects, such as education programs, healthcare support, and environmental restoration efforts [18].
2.4.3. Standardized Reporting with EVM
One of the key benefits of EVM is its ability to standardize reporting, which is particularly valuable in large, complex projects like pipeline construction where consistency in data presentation is critical for effective communication [21]. EVM provides a set of well-defined metrics, such as Planned Value (PV), Earned Value (EV), Actual Cost (AC), Cost Performance Index (CPI), and Schedule Performance Index (SPI). These metrics offer a comprehensive view of the project’s financial health, schedule adherence, and progress toward completion [13,14,15,16,17].
Standardized reporting reduces the ambiguity that often accompanies project updates, particularly in complex engineering projects where information can be overwhelming and technical [6]. For example, instead of presenting multiple multifaceted data points, project managers can use EVM’s CPI and SPI metrics to convey whether the project is on budget and on schedule [17].
Furthermore, EVM’s standardized reporting format enhances accountability by clearly delineating project performance against the baseline plan. With EVM, deviations from the baseline are explicitly quantified, allowing project managers to demonstrate whether issues stem from unforeseen challenges or internal inefficiencies [10]. Standardized EVM reports also streamline the reporting process itself, reducing the time and effort spent on gathering and presenting data [12,13,14,15,16,17,18,19,20,21,22,23,24,25,26,27,28,29,30,31,32,33]. This efficiency allows project teams to focus more on executing corrective actions, while stakeholders receive timely, accurate information that enables them to make informed decisions [33].
2.4.4. Engaging Stakeholders Through EVM Data
Engaging stakeholders is a fundamental component of project management, as stakeholders often influence or are directly affected by project outcomes [28]. Stakeholders may include regulatory agencies, local communities, investors, environmental groups, and project partners [27]. Each of these groups has unique concerns, expectations, and levels of understanding regarding the project, making engagement both a complex and essential task [11]. EVM, with its clear and quantifiable data, provides a powerful tool for fostering stakeholder engagement by creating a transparent, evidence-based communication channel [15].
One of the primary ways EVM facilitates stakeholder engagement is through its objective reporting. Unlike traditional reporting methods that may rely on subjective assessments, EVM provides quantitative metrics that reflect actual project performance [33]. Moreover, EVM data empowers stakeholders to engage more meaningfully by giving them access to information that allows them to understand the project’s progress and challenges [21]. For instance, a local community concerned about the environmental impact of a pipeline project can use EVM data to see if the project is on schedule, potentially reducing prolonged disruption in their area [15]. If an SPI metric shows a schedule delay, community representatives can engage with project managers to understand the cause of the delay and inquire about mitigation efforts [28,29,30,31,32]. This involvement fosters a collaborative approach to problem-solving, where stakeholders feel included in the decision-making process rather than merely receiving project updates [5,6,7,8,9].
In addition to enhancing engagement with external stakeholders, EVM also supports better internal communication within the project team [5,6,7,8,9,10,11,12]. By providing a unified set of metrics, EVM ensures that all team members have access to the same data, reducing miscommunication and fostering alignment across departments [23]. Finally, EVM’s emphasis on data-driven decision-making reinforces a culture of accountability and transparency within the project. By grounding stakeholder communication in quantifiable metrics [15].
3. Discussion
3.1. Successful Case Studies
3.1.1. Case Study 1: TransCanada’s (now TC Energy) Keystone XL Pipeline Project
Location: Alberta, Canada to Nebraska, United States
Method of Adoption: Integrated EVM with Real-Time Data Analytics and Digital Reporting
Project Overview
- ➢
- Location: Alberta, Canada, to Nebraska, United States
- ➢
- Length: Approximately 1,200 miles (1,930 kilometers)
- ➢
- Capacity: 830,000 barrels of crude oil per day
- ➢
- Estimated Cost: 8 billon dollars (initial estimate, later revised to 8billion (initial estimate, later revised to 9billion dollars due to delays and regulatory challenges)
- ➢
- Timeline: Initially planned for completion by 2025 (project canceled in 2021 due to political and environmental opposition)
Key Metrics and Targets
-
Cost Performance Index (CPI):
- ➢
- Target: Maintain CPI ≥ 1.0 (indicating the project is on or under budget)
- ➢
- Actual: CPI fluctuated due to delays and regulatory hurdles, often falling below 1.0 during periods of high uncertainty.
- ➢
- Example: During the initial phase, CPI was 0.92, indicating cost overruns due to unexpected environmental compliance costs.
-
Schedule Performance Index (SPI):
- ➢
- Target: Maintain SPI ≥ 1.0 (indicating the project is on or ahead of schedule)
- ➢
- Actual: SPI was consistently below 1.0 due to delays in regulatory approvals and legal challenges.
- ➢
- Example: In 2019, SPI was 0.85, reflecting significant delays caused by court injunctions and environmental reviews.
-
Earned Value (EV):
- ➢
- Target: Achieve 100% of planned value (PV) by key milestones.
- ➢
- Actual: EV behind PV due to delays in construction and permitting.
- ➢
- Example: By Q3 2020, EV was 4.2billion against a PV of 4.2billion against a PV of 5.1 billion, indicating a 17% shortfall in progress.
-
Actual Cost (AC):
- ➢
- Target: Keep AC within 10% of the budgeted cost.
- ➢
- Actual: AC exceeded the budget due to increased labor costs, legal fees, and environmental mitigation measures.
- ➢
- Example: By 2020, AC was 6.8billion against a budgeted cost of 6.8billion against a budgeted cost of 6.2billion, representing a 9.7% overrun.
-
Planned Value (PV):
- ➢
- Target: Achieve PV milestones on schedule.
- ➢
- Actual: PV milestones were frequently missed due to delays in regulatory approvals and legal challenges.
- ➢
- Example: In 2018, PV was 3.5billion, but only 3.5billion, but only 2.9billion worth of work was completed.
Data Analytics and Digital Reporting
- ▪
- Data Collection: Sensors and IoT devices were deployed along the pipeline route to monitor construction progress, environmental conditions, and equipment performance in real time.
- ▪
- Reporting Frequency: Daily and weekly reports were generated to track progress, costs, and risks.
-
Key Metrics Tracked:
- ○
- Construction progress (% completion)
- ○
- Environmental compliance (e.g., emissions, water usage)
- ○
- Safety incidents (e.g., OSHA recordable incidents)
- ○
- Equipment utilization rates
- Example: Data showed that equipment utilization rates were at 78%, below the target of 85%, prompting managers to reallocate resources to improve efficiency.
Corrective Actions Taken
-
Resource Redistribution:
- ○
- Additional crews and equipment were deployed to critical sections of the pipeline to accelerate progress.
- ○
- Example: In 2019, 200 additional workers were hired to focus on high-priority segments in South Dakota.
-
Process Optimization:
- ○
- Advanced construction techniques, such as horizontal directional drilling (HDD), were used to reduce environmental impact and speed up progress.
- ○
- Example: HDD was employed in environmentally sensitive areas, reducing construction time by 15%.
-
Stakeholder Engagement:
- ○
- Regular updates were provided to regulators, investors, and local communities to address concerns and maintain transparency.
- ○
- Example: Monthly stakeholder meetings were held to discuss progress and address environmental and safety concerns.
-
Risk Mitigation:
- ○
- Contingency plans were developed to address potential delays and cost overruns.
- ○
- Example: A $500 million contingency fund was allocated to cover unexpected regulatory and legal costs.
Challenges and Outcomes
-
Challenges:
- ○
- Regulatory delays: Multiple legal challenges and environmental reviews delayed the project by several years.
- ○
- Environmental opposition: Protests and lawsuits from environmental groups increased costs and slowed progress.
- ○
- Political uncertainty: Changes in U.S. administration led to the revocation of the project’s permit in 2021.
-
Outcome:
- ○
- Despite the use of EVM and real-time data analytics, the project was ultimately canceled in 2021 due to political and environmental opposition.
- ○
- However, the project demonstrated the effectiveness of EVM in identifying cost and schedule variances, enabling timely corrective actions.
Lessons Learned
- Importance of Stakeholder Engagement: Early and continuous engagement with regulators, communities, and environmental groups is critical to gaining support and avoiding delays.
- Flexibility in Planning: Projects of this scale require contingency plans to address unforeseen challenges, such as regulatory changes and legal disputes.
- Real-Time Monitoring: Real-time data analytics can provide valuable insights into project performance, enabling proactive decision-making and risk mitigation.
This case study demonstrates how TransCanada’s EVM adoption through digital integration and real-time monitoring allowed the team to navigate the complexities of an international project [35]. EVM’s standardized metrics provided a structured communication framework that ensured transparency with regulatory agencies and investors, fostering trust and enabling proactive project management [36].
3.1.2. Case Study 2: Saudi Aramco’s East-West Crude Oil Pipeline Expansion
Location: Yanbu to Dhahran, Saudi Arabia
Method of Adoption: Comprehensive EVM Training Program with Frequent KPI Reviews
Saudi Aramco, one of the world’s largest oil companies, implemented EVM in the expansion of the East-West Crude Oil Pipeline [36]. This project, crucial for connecting oil facilities in Yanbu to Dhahran, required meticulous planning due to the vast geographic area covered and the challenging desert environment [36]. Saudi Aramco’s EVM approach was unique because it incorporated an extensive training program to ensure all project stakeholders, including engineers, financial managers, and contractors, understood and could apply EVM metrics [37].
Saudi Aramco began by establishing a detailed baseline schedule and cost estimate, defining Planned Value (PV) based on a realistic assessment of resources and timelines [36]. The company also provided EVM training workshops to familiarize project teams with key performance indicators like CPI and SPI, which would be used to track the project’s cost and schedule efficiency. By standardizing the interpretation of these metrics across teams, Saudi Aramco ensured a unified understanding of project performance [15].
The pipeline project utilized frequent KPI reviews to detect and address variances promptly. For example, the EVM data showed a potential delay in the project’s early stages due to logistical delays in material transport [20]. By monitoring the SPI, the team identified the need for a logistics review and coordinated with suppliers to accelerate material delivery. This intervention restored the project to its planned timeline, demonstrating how SPI can act as an early-warning system for potential schedule risks [15].
Through Saudi Aramco’s commitment to EVM training and regular KPI assessments, the company improved its capacity to manage schedule and cost risks, achieving significant project control despite the pipeline’s challenging operating environment [37].
3.2. Lessons Learned from EVM Application
The application of EVM in the Keystone XL and East-West Crude Oil Pipeline projects provides valuable insights into maximizing EVM’s potential benefits in pipeline management.
- Importance of a Strong Baseline
Both TransCanada and Saudi Aramco highlighted the need to establish a comprehensive and realistic baseline before EVM implementation [36]. This baseline, which includes PV, EV, and AC metrics, serves as the foundation against which performance is measured. Establishing an accurate baseline ensures that CPI and SPI metrics are meaningful and reflect real progress [15]. A well-defined baseline also allows for more reliable comparisons between planned and actual outcomes, enabling teams to identify deviations promptly.
- b.
- Real-Time Monitoring and Digital Integration
The Keystone XL pipeline project demonstrated the advantages of digital integration and real-time data analytics in EVM application [37]. Real-time monitoring allowed TransCanada’s project managers to access up-to-date information, empowering them to respond swiftly to cost or schedule variances. This lesson emphasizes that integrating digital tools with EVM metrics can greatly enhance responsiveness, making it easier to identify and correct project issues as they arise [20].
- c.
- Comprehensive Training and Team Alignment
Saudi Aramco’s approach highlights the importance of EVM training across all project roles. Ensuring that all team members, including those on-site, understand EVM metrics and their implications helps build alignment around project goals [37]. This comprehensive understanding allows teams to act on EVM insights effectively. Training also fosters a proactive approach to project management, where team members are aware of performance metrics and can interpret them independently [20].
- d.
- Frequent KPI Review Sessions
Conducting frequent KPI review sessions, as seen in Saudi Aramco’s implementation, allows teams to catch and address variances early [19]. Regular assessments of CPI and SPI provide ongoing insights into project health, supporting timely corrective actions [4]. These reviews create a culture of continuous monitoring and adaptation, which is essential for managing high-risk pipeline projects where unexpected issues frequently arise [28].
- e.
- Transparent Communication and Stakeholder Trust
EVM metrics, such as CPI and SPI, offer objective and quantifiable insights that can improve stakeholder communication [12]. Both case studies show how EVM contributes to transparent reporting, building trust among stakeholders by providing them with regular, data-driven updates [19]. The structured nature of EVM data helps project managers clearly communicate project status and justify any corrective measures needed to maintain schedule and budget targets. This transparency is particularly crucial for large pipeline projects involving numerous external stakeholders [13].
- f.
- Adaptability in Response to Field Challenges
Pipeline projects often face unique challenges, such as environmental factors or logistical constraints [22]. EVM metrics provide early indications of these issues, but the project team must remain flexible in its responses. Both TransCanada and Saudi Aramco needed to adapt their strategies in response to on-the-ground realities that were not fully accounted for in the original plans [10]. Thus, while EVM provides valuable guidance, successful project teams recognize the need to balance structured EVM approaches with adaptive decision-making [13].
Therefore, these two case studies and lessons learned demonstrate that EVM, when implemented thoughtfully and supported by digital tools, training, and regular reviews, can provide a solid foundation for managing pipeline project performance [29].
3.3. The Future of EVM in Pipeline Project Management
The future of Earned Value Management (EVM) in pipeline project management is set to be shaped by technological advancements such as artificial intelligence (AI)-driven predictive analytics, Internet of Things (IoT)-enabled sensor tracking, blockchain for secure data management, cloud-based project management platforms, and advanced automation tools like machine learning algorithms for real-time performance forecasting [21]. These innovations will enhance the accuracy of project monitoring, improve decision-making, and streamline cost and schedule control in multifaceted pipeline projects. In the coming years, EVM is expected to evolve beyond its traditional role, expanding to support enhanced predictive capabilities and providing greater insights into project health and performance [30].
One of the most promising future developments is the integration of EVM with artificial intelligence (AI) and machine learning (ML) tools. These technologies have the potential to elevate EVM from a tracking tool to a more dynamic, predictive system [12]. AI algorithms, for example, could use historical data from past projects to forecast trends and potential issues in real-time, improving the accuracy of projections for key performance indicators like the Cost Performance Index (CPI) and Schedule Performance Index (SPI) [28]. By applying machine learning to EVM data, project managers could receive automated insights about risks, enabling faster response times and more informed decision-making [20].
Moreover, as digital tools become more sophisticated, EVM is likely to be combined with Building Information Modeling (BIM) and Geographic Information Systems (GIS) to create a comprehensive view of pipeline projects [14]. BIM, for instance, provides detailed 3D models of the physical pipeline infrastructure, which, when integrated with EVM metrics, can give project managers an enhanced perspective on physical progress and potential design changes [18]. GIS, on the other hand, allows for real-time geographic tracking of the pipeline, which is invaluable for monitoring progress in remote areas and tracking environmental and logistical impacts. The integration of these tools with EVM would allow project managers to monitor pipeline projects not only from a financial and scheduling perspective but also from an environmental and geographic standpoint [13].
The future of EVM also promises more accessible, standardized data reporting. With the development of standardized EVM dashboards, project managers and stakeholders can have immediate access to project performance metrics in an understandable format, regardless of their technical background [5]. Power BI, along with other advanced tools such as Tableau, Primavera P6, and Microsoft Project, provides interactive dashboards that display up-to-date EVM metrics like PV, EV, and AC. These platforms enable project teams and stakeholders to visualize real-time performance trends, identify variances, and make quicker, data-driven decisions [15]. With their ability to integrate multiple data sources, automate reporting, and generate predictive analytics, these tools enhance project transparency and facilitate proactive decision-making, ensuring that pipeline projects remain on schedule and within budget [31].
The integration of EVM with cloud-based platforms is another area likely to see growth. Cloud technology enables EVM data to be stored, accessed, and updated in real-time from any location, making it easier for geographically dispersed teams to collaborate [16]. For pipeline projects that span vast distances, this capability allows for seamless coordination across different project sites. Cloud-based EVM systems can support better data security, reduce redundancy, and improve data consistency across teams, enhancing the overall efficiency of EVM in managing pipeline projects [12].
4. Conclusion
Earned Value Management has proven to be a powerful tool for project success in the pipeline sector, providing a structured approach to monitoring both costs and schedules. Through metrics like CPI and SPI, EVM delivers objective insights that help project teams track their progress against the baseline, identify variances, and respond proactively to potential issues. The case studies discussed have illustrated how EVM fosters improved communication, boosts transparency, and creates a shared understanding among stakeholders all of which are critical factors in managing high-stakes pipeline projects.
EVM’s primary impact on project success stems from its ability to reduce the uncertainty that often accompanies large infrastructure projects. By continuously monitoring key performance indicators, EVM equips project managers with real-time data, allowing them to make timely, informed adjustments. EVM’s structured approach helps mitigate these risks by providing a consistent, quantifiable measure of progress that managers can rely on to keep projects on track.
Looking forward, as EVM continues to evolve with the incorporation of AI, data analytics, and cloud technology, its impact on pipeline project management will only grow. These advancements promise to make EVM even more adaptable, precise, and accessible, ensuring that it remains relevant in a rapidly changing industry. With these innovations, EVM can transition from a reactive tool to a proactive system, allowing project managers to not only track progress but also anticipate and avoid issues before they affect project outcomes.
Therefore, EVM’s structured methodology has had a profound impact on pipeline project management by improving transparency, enabling effective resource management, and reducing risks associated with scheduling and budgeting. As the industry continues to face new challenges, from environmental regulations to multifaceted supply chains, EVM’s role in ensuring project success will remain vital. By providing a standardized, objective framework, EVM helps align stakeholders, streamline project execution, and improve accountability. The future of EVM in pipeline project management is bright, as it adapts to meet the evolving demands of an industry that is increasingly focused on efficiency, sustainability, and resilience.
Funding
This research received no external funding.
Conflicts of Interest
There is conflict of interest.
References
- Sovacool, B. K., Baum, C. M., & Low, S. (2022). Climate protection or privilege? A whole systems justice milieu of twenty negative emissions and solar geoengineering technologies. Political Geography, 97, 102702. [CrossRef]
- Akbari, S., Sheikhkhoshkar, M., Rahimian, F. P., El Haouzi, H. B., Najafi, M., & Talebi, S. (2024). Sustainability and building information modelling: Integration, research gaps, and future directions. Automation in Construction, 163, 105420. [CrossRef]
- Lin, S. S., Shen, S. L., Zhou, A., & Chen, X. S. (2024). Smart Techniques Promoting Sustainability in Construction Engineering and Management. Engineering. [CrossRef]
- Zhang, C., Shao, Y., Shen, W., Li, H., Nan, Z., Dong, M., ... & Cao, X. (2023). Key technologies of pure hydrogen and hydrogen-mixed natural gas pipeline transportation. Acs Omega, 8(22), 19212-19222. [CrossRef]
- Beermann, K., & Chen Austin, M. (2021). An inspection of the life cycle of sustainable construction projects: Towards a biomimicry-based road map integrating circular economy. Biomimetics, 6(4), 67. [CrossRef]
- Shekargoftar, A., Taghaddos, H., Azodi, A., Nekouvaght Tak, A., & Ghorab, K. (2022). An integrated framework for operation and maintenance of gas utility pipeline using BIM, GIS, and AR. Journal of Performance of Constructed Facilities, 36(3), 04022023. [CrossRef]
- Azevedo, F. B., Solano, R. F., Ayres Neto, A., Hansen, A., da Cunha, B. R., dos Santos, C. M., ... & Rego, V. (2024). Rigid Offshore Pipelines. In Handbook of Pipeline Engineering (pp. 581-648). Cham: Springer International Publishing.
- https://versoriaonline.com/what-is-earned-value-management/.
- Ayeni, O. Advanced Multi-Phase Project Management Frameworks: Optimizing AI-Driven Decision-Making, Risk Control, and Efficiency.
- Aramali, V., Gibson Jr, G. E., El Asmar, M., & Cho, N. (2021). Earned value management system state of practice: Identifying critical subprocesses, challenges, and environment factors of a high-performing EVMS. Journal of Management in Engineering, 37(4), 04021031. [CrossRef]
- Jupally, S. P., Yalamati, S., & Jupally, A. (2024). DRIVING EFFICIENCY AND SUCCESS: THE ROLE OF RELEASE MANAGEMENT IN PROJECT TIMELINES, COST BUDGETING, AND RISK ASSESSMENT. Technology (IJCET), 15(4), 1-11. [CrossRef]
- https://community.atlassian.com/forums/App-Central-articles/Earned-Value-Management-EVM-Metrics-Your-Project-s-Financial-GPS/ba-p/2714330.
- Rao, A. S., Radanovic, M., Liu, Y., Hu, S., Fang, Y., Khoshelham, K., ... & Ngo, T. (2022). Real-time monitoring of construction sites: Sensors, methods, and applications. Automation in Construction, 136, 104099. [CrossRef]
- Singh, J., Cheng, J. C., & Anumba, C. J. (2021). BIM-based approach for automatic pipe systems installation coordination and schedule optimization. Journal of Construction Engineering and Management, 147(11), 04021143. [CrossRef]
- Rane, N. (2023). Integrating building information modelling (BIM) and artificial intelligence (AI) for smart construction schedule, cost, quality, and safety management: challenges and opportunities. Cost, Quality, and Safety Management: Challenges and Opportunities (September 16, 2023).
- Davies, A., Lenfle, S., Loch, C. H., & Midler, C. (2023). Introduction: Building bridges between innovation and project management research. In Handbook on innovation and project management (pp. 1-34). Edward Elgar Publishing.
- Tran, C. N., Pham, P. T., Tran, T. T., Tam, V. W., & Illankoon, I. C. S. (2024). A practical approach to promoting sustainable development in the construction industry through the use of the LOTUS-Vietnamese green-building assessment tool. International Journal of Construction Management, 1-12.
- Titu, R. H., & Uddin, S. M. K. (2024). Evaluating public funded construction project performance through earned value management.
- Andreas, A., Tinumbia, N., & Anggraini, E. (2023). CONSTRUCTION PROJECT CONTROL ANALYSIS USING EARNED VALUE MANAGEMENT, EARNED SCHEDULE MANAGEMENT, EARNED DURATION MANAGEMENT. Jurnal Infrastruktur, 9(2), 87-98. [CrossRef]
- Proaño-Narváez, M., Flores-Vázquez, C., Vásquez Quiroz, P., & Avila-Calle, M. (2022). Earned value method (EVM) for construction projects: Current application and future projections. Buildings, 12(3), 301. [CrossRef]
- Barrientos-Orellana, A., Ballesteros-Pérez, P., Mora-Melia, D., González-Cruz, M. C., & Vanhoucke, M. (2022). Stability and accuracy of deterministic project duration forecasting methods in earned value management. Engineering, Construction and Architectural Management, 29(3), 1449-1469. [CrossRef]
- Ali, Y. S. (2021). Impact of performance drivers on schedule and cost indices of infrastructure projects (Doctoral dissertation, Queensland University of Technology).
- Nelson, S. E. (2022). Nord Stream 2: The Gas Curtain of Europe (Master’s thesis, Old Dominion University).
- Hess, D. J. (2023). Pipeline conflicts, coalitions, and strategic action: A review of the literature. The Extractive Industries and Society, 16, 101339. [CrossRef]
- Hoberg, G. (2021). The resistance dilemma: Place-based movements and the climate crisis. MIT Press.
- Youvan, D. C. (2024). The Geopolitical Implications of Assad’s Fall: Revisiting the Feasibility of the Qatar-Turkey Pipeline.
- Kinaci, M. (2022). Russia, Europe and Central Asia Energy Security and Pipeline Politics (Doctoral dissertation, Old Dominion University).
- Hasan, R., Chowdhury, S. A., & Akter, J. (2021). Construction project monitoring: The cost and schedule control by Earned Value Method (EVM). Journal of Technology Management and Business, 8(1), 1-9. [CrossRef]
- Merino, D. M. D. (2024). A Deep Learning Approach for Forecasting Cost Estimate at Completion (EAC) in Construction Projects.
- Shiferaw, A. (2022). Assessment of the Practices and Challenges of Implementing Earned Value Management System in Selected Ethiopian Megaprojects (Doctoral dissertation, ST. MARY’S UNIVERSITY).
- Titu, R. H., & Uddin, S. M. K. (2024). Evaluating public funded construction project performance through earned value management.
- Saffirio, A. (2023). Advancing Project Schedule Control Beyond Traditional EVM: A Literature Review (Doctoral dissertation, Politecnico di Torino).
- Santos, J. I., Pereda, M., Ahedo, V., & Galán, J. M. (2023). Explainable machine learning for project management control. Computers & Industrial Engineering, 180, 109261. [CrossRef]
- Makholm, J. D. (2023). The Tie that Binds: The Trials of US–Canada Energy Infrastructure. Climate and Energy, 39(10), 21-27. [CrossRef]
- Belanzaran, E., Hanna, K., & Reimer, K. A scan of the long-distance oil pipeline research literature: A focus on Canada.
- Indeo, F. (2024). East-West Asian energy relations: geopolitical implications of a strategic cooperation. In East-West Asia Relations in the 21st Century (pp. 143-155). Routledge.
- Zweiri, M., Al Qawasmi, F., & James, T. B. (2023). Energy Security and Diplomacy: A Double-Edged Sword. The Case Study of Saudi Arabia and Iran. In GCC Hydrocarbon Economies and COVID: Old Trends, New Realities (pp. 225-248). Singapore: Springer Nature Singapore.
Disclaimer/Publisher’s Note: The statements, opinions and data contained in all publications are solely those of the individual author(s) and contributor(s) and not of MDPI and/or the editor(s). MDPI and/or the editor(s) disclaim responsibility for any injury to people or property resulting from any ideas, methods, instructions or products referred to in the content. |
© 2025 by the authors. Licensee MDPI, Basel, Switzerland. This article is an open access article distributed under the terms and conditions of the Creative Commons Attribution (CC BY) license (http://creativecommons.org/licenses/by/4.0/).
Copyright: This open access article is published under a Creative Commons CC BY 4.0 license, which permit the free download, distribution, and reuse, provided that the author and preprint are cited in any reuse.


