
Submitted:
11 September 2025
Posted:
12 September 2025
You are already at the latest version
Abstract
Research in the biomedical field often faces challenges due to the scarcity and high cost of data, which significantly limit the development and application of machine learning models. This paper introduces a data-centric AI framework for EEG-based emotion recognition that emphasizes improving data quality rather than model complexity. Instead of proposing a deep architecture, we demonstrate how participant-guided noise filtering combined with systematic data augmentation can substantially enhance system performance across multiple classification settings: binary (high vs. low arousal), four-quadrant emotions, and seven discrete emotions. Using the SEED-VII dataset, we show that these strategies consistently improve accuracy and F1 scores, in some cases surpassing the results of more sophisticated published models. The findings highlight a practical and reproducible pathway for advancing biomedical AI systems, showing that prioritizing data quality over architectural novelty yields robust and generalizable improvements in emotion recognition.
Keywords:
artificial intelligence
; data-centric AI
; emotion prediction
; medical signal
1. Introduction
Data Centric Artificial Intelligence (DCAI) has emerged as a crucial approach in improving the performance of AI systems. Unlike the traditional emphasis on designing increasingly complex AI models, DCAI focuses on optimizing the quality of the data used to train these models. Recent studies and implementations have shown that cleaner, more consistent and less noisy datasets can yield performance improvements equivalent to, or even surpass, those achieved by doubling or tripling the size of the dataset [1]. This paradigm shift underscores the transition from a "big data" mindset to a "good data" philosophy.
The foundation of DCAI lies in the enhancement of various aspects of data preparation and management. Ensuring consistent labeling across output data is one crucial factor. For instance, labeling inconsistencies can introduce noise and degrade model performance, even when sophisticated models are employed. Moreover, addressing important edge cases in the input data ensures that the model learns robustly across a broader spectrum of scenarios. This can significantly reduce biases and blind spots in predictions, particularly in domains like healthcare and finance, where edge cases often carry high stakes.
Appropriately sizing datasets is another key tenet of DCAI. Instead of arbitrarily increasing dataset size, the focus is on selecting data that is representative of the problem space while avoiding redundant or irrelevant information. Tools such as active learning, which identify the most informative data points for labeling, have proven effective in achieving this balance [2]. Furthermore, DCAI emphasizes the importance of monitoring and addressing data drift, a phenomenon where the statistical properties of input data change over time, potentially leading to model degradation. Techniques such as continuous monitoring and data versioning play a critical role in combating data drift [3].
Data augmentation is a cornerstone technique in data-centric AI, often employed to address system performance issues or data scarcity. In cases where a system underperforms on certain inputs or where data availability is limited, particularly in high-stakes fields like medicine, data augmentation becomes an essential strategy for improvement. For instance, [4] provides a comprehensive survey on the use of data-centric foundation models in health, exploring their applications across various domains. Similarly, a review in [5] focuses on data-centric AI in healthcare, highlighting topics such as virtual and augmented reality applications in medicine, as well as advancements in AI, machine learning, deep learning, digital twins, and big data. The work in [6] further demonstrates the utility of a data-centric approach by enhancing healthcare fraud classification performance using Medicare data. Meanwhile, [7] offers a detailed review of datasets utilized in machine learning models for head and neck cancer, and [8] dissects the concept of the digital twin in healthcare, providing valuable insight into its growing significance.
Expanding on AI’s importance in healthcare, many studies have explored its role in clinical decision-making. For example, [9] investigates two case studies: maternal-fetal clinical decisions supported by IoT monitoring and deep learning, and COVID-19 predictions leveraging long short-term memory (LSTM) networks. The integration of AI, machine learning, and natural language processing in medical affairs is discussed in [10], while [11] addresses challenges faced by healthcare systems during the COVID-19 pandemic and proposes the use of blockchain and AI as solutions.
In addition to these high-level applications, wearable devices have emerged as transformative tools for real-time physiological data collection, fueling advancements in emotion prediction and healthcare monitoring. For instance, [12] combines heart rate and speech data to predict participants’ emotions through multimodal data fusion. Similarly, [13] explores the early detection of potential infections using both real and synthetic datasets comprising steps, heart rate, and sleep metrics. In intensive care units, [14] applies novel deep learning methods to predict heart rate (HR), systolic blood pressure (SBP), and diastolic blood pressure (DBP), showcasing the potential of data-centric approaches in critical care. Meanwhile, [15] gathers heart rate data from wearable devices and user-reported emotions via a mobile app, utilizing convolutional neural networks (CNNs) and LSTMs to predict emotional states.
The SEED dataset is a collection of EEG datasets corresponding to specific emotions. It has several versions. Many studies have been conducted on the older versions of the dataset (SEED [16], SEED-IV [17], SEED-V [18]). In [19], emotion recognition is performed using a model based on Long Short-Term Memory neural networks. The model can distinguish non-linear relationships among EEG signals from different electrodes and aims to narrow the distribution gap between training and test sets. On the other hand, [20] proposed a graph-based multi-task self-supervised learning model for emotion recognition. The work is divided into spatial and frequency jigsaw tasks, in addition to contrastive learning tasks, to learn more general representations. The two emotion recognition models, deep canonical correlation analysis and bimodal deep autoencoder, are compared in [18]. The former demonstrated superior performance across different datasets and showed robustness to noise. In [21], a regularized graph neural network is developed for EEG-based emotion recognition. The inter-channel relationships in EEG signals are modeled using adjacency matrices, and two regularizers are proposed to address cross-subject EEG variations.
To address the scarcity problem in the EEG data used for emotion recognition, some studies have focused on data augmentation. They demonstrate its effectiveness in improving prediction accuracy. Some use older versions of the SEED dataset [22,23], while others rely on different EEG datasets [24,25]. In [22], a dual encoder variational autoencoder-generative adversarial network with spatiotemporal features is used to generate synthetic data. The average accuracy across all subjects increased by compared to the original dataset. In [23], the two deep generative models, variational autoencoder and generative adversarial network, are used as well, where full and partial augmentation strategies are applied. They observed that the number of synthetic data points needs to be 10 times less than that of the original data to achieve the best performance. During experiments, the EEG cap can slightly shift for the same person, or the electrodes can be in different positions for different participants due to their different head shapes. Therefore, rotational distortions around the y-axis and z-axis are performed to generate new synthetic data in [24]. Artificial EEG trials are generated to reduce brain-computer interface calibration time in [25]. Different combinations and distortions are applied to the original EEG dataset to generate augmented samples. This is done in the time, frequency, or time-frequency domains.
SEED-VII [26], the dataset used in this study, is a recent addition to the SEED family. Few studies have utilized it to date. In [27], Fourier-inspired techniques are introduced to separate periodic and aperiodic components of EEG signals for improved feature extraction. In [28], a ChannelMix-based transformer and convolutional multi-view feature fusion network is proposed to enhance cross-subject emotion recognition by capturing richer spatiotemporal representations.
Despite these advancements, none of the existing studies have addressed the importance of cleaning EEG datasets of noisy data or investigated the impact of such preprocessing on system performance. In parallel, [29] have investigated performance enhancement strategies for medical data by applying feature engineering methods tailored to neural networks. Their study demonstrates how handcrafted features can improve model performance, especially in data-scarce clinical environments. However, unlike our work, their approach focuses on modifying input features rather than improving data label quality or addressing label noise that is the key elements emphasized in the Data-Centric AI methodology adopted in this work. In [26], electroencephalogram (EEG) signals were collected from 20 participants as they watched videos designed to elicit various emotions. The study employed the Multimodal Adaptive Emotion Transformer (MAET) model [30] to predict emotions using EEG and eye movement data. In our work, we build upon the dataset collected in [26] by focusing exclusively on EEG data as input. Using a deep learning model, we aim to predict the arousal levels of subjects as well as the four quadrants of emotions based on EEG data. Then, we predict each emotion separately. Furthermore, we demonstrate that employing data cleaning can significantly enhance system performance, making it a critical component of our approach. Then, we show the further improvements in performance that can occur due to data augmentation.
Given this background, the proposed emotion prediction framework has strong potential for real-world deployment in various domains, such as mental health monitoring, adaptive learning environments, user-centered design, and immersive technologies. By incorporating data-centric techniques that emphasize label quality and noise reduction, the system becomes more reliable and better suited for applications where emotional state tracking is critical. These include clinical diagnostics, emotion-aware interfaces, and personalized neurofeedback therapy.
Unlike prior work that applied data augmentation in isolation [22,23], this study uniquely combines participant-driven noise filtering with augmentation. By leveraging subjects’ self-reported emotion scores to systematically exclude ambiguous samples, we demonstrate a data-centric strategy that improves reliability while preserving robustness.
The paper is organized as follows: Section 2 introduces the dataset used in this study and explains the emotion categorization framework. Section 3 discusses the architecture and layers of the deep learning model employed. The experimental results are presented and analyzed in Section 4 Lastly, Section 5 concludes the paper, summarizing key findings and outlining future research directions.
2. Dataset and Emotion Categorization Framework
2.1. Dataset
The dataset utilized in this study, as described in [26], was designed to facilitate the prediction of emotions based on physiological signals, specifically EEG data. It captures participants’ emotional responses to video stimuli, providing a well-structured and systematic dataset for emotion prediction tasks. The dataset includes annotations for six distinct emotions: happy, sad, disgust, fear, surprise, and anger, along with a neutral state. This section outlines the structure of the dataset, the experimental procedure, and the features derived from EEG signals.
The dataset comprises 12 video clips for each of the six emotions, while the neutral state is represented by eight clips. Each video clip lasts between two to five minutes, providing sufficient duration to evoke and measure emotional responses. Participants viewed these clips in five separate sessions, with each session spaced at least 24 hours apart to minimize fatigue and ensure the validity of emotional responses. During each session, 20 video clips corresponding to one of the six emotions were displayed. After viewing each clip, participants provided feedback by rating the intensity of the emotion elicited by the clip. The ratings ranged from 0 to 1, where 0 indicated no emotional response and 1 represented a strong emotional response. A total of 20 participants contributed to this study, ensuring a robust and diverse dataset.
The EEG data used in this study underwent preprocessing to enhance its utility for emotion prediction. Differential entropy was applied to the EEG signals, transforming them into features that capture the statistical characteristics of the brain’s electrical activity. Since the duration of the video clips varies, the resulting EEG recordings differ in the number of time samples. To ensure a consistent input size for the model, each sample was averaged over time. The EEG data comprises five frequency bands: delta, theta, alpha, beta, and gamma, each associated with distinct brainwave activity. Each frequency band includes signals from 62 EEG channels, yielding a total of 310 features (5 bands × 62 channels) per emotion instance. These features are used as the input to the deep learning model, providing a comprehensive representation of the participants’ neurological responses to emotional stimuli.
This carefully designed and processed dataset forms the foundation of our study, enabling the application of advanced deep learning techniques to predict emotional states with high accuracy.
2.2. Emotion Categorization
To classify emotions based on their intensity and valence, we adopt the Russell 2D model [31], a widely recognized framework for emotion representation. In this model, emotions are mapped within a two-dimensional space defined by Valence (positive vs. negative) and Arousal (high vs. low).
Building on this model, we first simplify the classification into two main categories based on arousal level: High Arousal, (HA) and Low Arousal, (LA). Specifically, the emotions happy, disgust, fear, surprise, and anger are categorized as HA emotions, while sad and neutral are classified as LA emotions. In the Russell 2D model, arousal is defined as the level of physiological activation. We group neutral and sad as low arousal (LA) since both typically elicit low physiological activation and subdued EEG patterns. While neutral could also be interpreted as neither high nor low arousal, prior studies [16,19] have categorized it as LA for practical classification. This binary classification provides a focused approach to predicting emotional arousal levels, aiding the development of a more efficient emotion prediction system. Figure 1 illustrates this classification, visually distinguishing between high arousal and low arousal emotions.
Expanding beyond binary classification, we also investigate the effect of predicting four-quadrant emotion categories:
- High Arousal High Valence (HAHV): Happy, surprise.
- High Arousal Low Valence (HALV): Disgust, anger, fear.
- Low Arousal Low Valence (LALV): Sad.
- Low Arousal High Valence (LAHV): Neutral.
By predicting four distinct emotional states instead of two, the model’s task becomes more complex, as it must differentiate between subtle variations in valence alongside arousal levels. This finer classification leads to less available data per category, which can impact performance, a challenge we address in the following sections. Figure 1 illustrates this expanded categorization, mapping emotions across the four quadrants of the Russell 2D model.
The dataset’s emotion distribution across quadrants is uneven:
- 45% of data falls within the HALV quadrant,
- 30% in HAHV,
- 15% in LALV, and
- 10% in LAHV.
Notably, neutral emotion (LAHV) has only 8 video clips, whereas each of the other emotions is represented by 12 clips. This imbalance introduces additional challenges in training the model effectively across all quadrants. The impact of this categorization on model performance is discussed in Section IV.
Lastly, all the EEG data corresponding to the different emotions are separated and each emotion is predicted separately from the other emotions.
3. Deep Learning Model
Our proposed deep learning model processes EEG-derived features to predict emotional states. The architecture consists of a 1D convolutional layer, pooling, dropout layers for regularization, and dense layers for classification.
- Convolutional Layer (Conv1D): The first layer applies 64 filters with a kernel size of 3 and the ReLU activation function to extract temporal patterns from the input features.
- Pooling Layer: A MaxPooling1D layer with a pool size of 2 reduces dimensionality and emphasizes the most salient features.
- Dropout: To mitigate overfitting, dropout layers with rates between 0.25 and 0.5 were used at different stages of the network, depending on the architecture variant.
- Flatten and Dense Layers: After feature extraction, the output is flattened and passed to fully connected dense layers. The final output layer uses a sigmoid activation for binary classification (two halves) and softmax for multi-class settings (four quadrants and seven emotions).
The models were trained for 50 epochs with a learning rate of 0.0001 using the Adam optimizer.
3.1. Performance Metrics
Model performance was evaluated using two metrics: accuracy and F1 score. Accuracy measures the proportion of correctly classified samples, while the F1 score balances precision and recall, providing a more reliable assessment under class imbalance.
The following terms are used to calculate the F1 score:
- True positive (TP): The model correctly predicts an emotion.
- False negative (FN): The model fails to predict an emotion when it is the correct output.
- False Positive (FP): The model predicts an emotion incorrectly.
Using these metrics, precision and recall are defined as:
The F1 score is then calculated as
The F1 score is particularly valuable for unbalanced datasets, where some classes may have significantly fewer samples than others.
3.2. Ablation studies
To identify the best-performing model, we conducted ablation studies across multiple architectures. Evaluation was performed using five-fold cross-validation, with performance reported as the mean across folds. The goals of the ablation studies were: (1) to determine the most effective model architecture, and (2) to evaluate the impact of data augmentation techniques on accuracy and robustness.
Table 1 summarizes the performance of different deep learning models tested with varying parameters across the three emotion categorizations: two halves, four quadrants, and seven emotions.
Each model was evaluated based on its accuracy and F1 score. Among the models tested, Model 1 achieved the highest accuracy and F1 score for the two-half case, while Model 2 performance surpasses the other two models in the case of four quadrants and seven emotions. These results demonstrate that as the number of predicted classes increase, given the same total number of data points, more layers are needed, and the accurate prediction of the classes decreases.
With the best model identified for each emotion categorization, we proceeded to investigate the effect of data cleaning and augmentation on system performance as detailed in the next section.
4. System Performance
To evaluate the effectiveness of Data Centric AI (DCAI) strategies, we tested the impact of data augmentation and noise reduction on model performance. First, all the original data is being shuffled and divided into K-folds, where the training set is assigned of these folds, while the kth fold is used for testing.
Using the training set, as illustrated in Figure 2, the data corresponding to each emotion are extracted for the purpose of generating new augmented samples. The augmentation process involves creating synthetic data by averaging two or more existing data entries corresponding to the same emotion. These augmented data points are then added to the training set as new synthetic data. Before training, the dataset is cleaned by removing noisy data entries with emotion scores below a certain threshold. Figure 2 illustrates this process applied to the training set, where both data augmentation and noise reduction are performed. Meanwhile, only noise reduction is applied to the test set. The test set is excluded from the augmentation process to prevent any information leakage into the training data, thus enhancing the generalizability of the results.
4.1. Data Augmentation and Noise Reduction
Table 2, Table 3, and Table 4, show the impact of data cleaning and data augmentation on model performance. The first column of each table indicates the maximum score threshold for removing data points from the dataset. Specifically, data points with this score or lower for an emotion are excluded from the training, and testing sets. For instance, a threshold of 0.2 means all data points with a score of 0.2 or less are removed. If "None" is specified, no data points are excluded, and the full dataset of 1,600 entries is used.
The accuracy and F1 score of the original dataset, without any data augmentation, were calculated as a baseline. As noisy data points are progressively removed (i.e., as the threshold score increases), both the accuracy and F1 score improve. This improvement reflects the data-centric approach of prioritizing data quality, even at the expense of reducing dataset size. For example, when all data points with a score of 0.9 or lower are removed, the dataset size shrinks dramatically from 1,600 to only 200 entries, yet the cleaner dataset enhances model performance.
Noise reduction in this context relies on participant feedback ratings collected during data acquisition. Without such feedback, it would be difficult to identify and filter out unreliable data points. This highlights a critical aspect of dataset construction: beyond labeling data, it is equally important to evaluate the reliability of those labels. Doing so enhances the overall quality of the dataset and improves the generalization of emotion recognition systems.
To address the trade-off between data cleanliness and dataset size, three data augmentation techniques were applied:
- Augmentation 1: This technique involves averaging two consecutive data entries for each emotion to create new synthetic entries.
- Augmentation 2: This approach generates even more synthetic data by averaging three, four, and five consecutive entries corresponding to the same emotion.
- Gaussian: Synthetic data is generated by adding Gaussian noise to the original dataset[35].
Next, we will study performance of the system, when noise reduction and data augmentation are used, in case of two-halves, four-quadrants, and seven-emotion classifications.
4.2. Impact of Predicting Two-Halves Emotions
Table 2 illustrates the effect of data cleaning and augmentation on predicting the two-halves emotion categories, high-arousal and low-arousal. The baseline case is the top-left entry of the table, which corresponds to using the original dataset without any data cleaning. As more data is cleaned from the original dataset, the system’s performance improves. At the threshold of , the accuracy increased by , rising from to , while the F1 score improved by , from to .
The augmentation techniques slightly improved the model performance at each threshold compared to using only noise reduction on the original dataset. At lower thresholds (), the performance gains from the augmentation techniques are marginal, with improvements typically under , and thus less impactful. However, at the threshold, Augmentation 2 yields the highest overall performance, with substantial gains of in accuracy and in F1 score compared to the baseline.
These findings show that sufficient data size for each predicted half makes data augmentation have only a small effect on the performance. While it highlights the importance of data cleanliness on the performance of the system. This exemplifies the DCAI philosophy of enhancing model performance through high-quality data.
4.3. Impact of Predicting Four-Quadrant Emotions
To further analyze the impact of DCAI, we extend our study to predicting four-quadrant emotions based on the Russell 2D model. Unlike binary classification (HA vs. LA), this experiment introduces four distinct emotion categories (HAHV, HALV, LALV, and LAHV), requiring the model to distinguish both arousal and valence levels.
Table 3 presents the accuracy and F1 score results for four-quadrant classification using the Original, Augmentation 1, Augmentation 2, and Gaussian datasets. The key findings are: the accuracy and F1 scores for the four-quadrant classification are lower than those reported in Table 2 for the binary classification task. This is expected since splitting data into four classes reduces the number of samples per category, making training more challenging. The F1 score is lower than accuracy in all cases. This is due to class imbalance, where LALV (Sad) and LAHV (Neutral) have significantly fewer data points compared to HALV and HAHV. This also means that the scheme achieving the best F1 score may differ from the one achieving the best accuracy at certain threshold values.
According to Table 3, noise reduction has a clear impact on classification accuracy, as demonstrated by the results on the original dataset compared with the augmentation methods. Accuracy improved by up to 13.83%, while F1 score increased by only 2.07% at the threshold. Augmentation 1 and Augmentation 2 achieve the highest accuracies when the threshold is below , though the improvements over noise reduction alone are modest. Augmentation 2 consistently yields the highest F1 scores when the threshold is below , suggesting that as the number of augmented samples increases, the model becomes more effective at handling class imbalances. At thresholds of and higher, the Gaussian scheme demonstrates the strongest overall performance. Compared to the baseline, the Gaussian method at a threshold of achieves the highest accuracy with a increase of , while Augmentation 2 at a threshold of yields the highest F1 score with an improvement of . These results indicate that for unbalanced datasets, noise reduction is highly effective in boosting accuracy, whereas data augmentation plays a more significant role in improving the F1 score.
4.4. Impact of Predicting Seven Emotions
To facilitate comparison with prior work, we evaluate system performance by estimating each emotion in the dataset individually. This classification strategy substantially reduces the amount of data available per emotion class, leading to lower accuracy and F1 scores compared to the two-halves and four-quadrant classification approaches.
Table 4 presents the accuracy and F1 scores for the seven-emotion classification task under five different schemes: Original, Augmentation 1, Augmentation 2, Gaussian, and MAET. MAET, introduced in [26], stands for Multimodal Adaptive Emotion Transformer. For this experiment, the learning rate was set to , the weight decay to , and the embedding dimensionality to 64. The results show that noise reduction alone, with a threshold of , improves prediction accuracy by , while the F1 score increases by . Augmentation 2 yields the highest accuracy and F1 scores when the threshold is less than or equal to , with accuracy gains ranging from to . At thresholds of or higher, MAET demonstrates the best overall performance. These findings highlight the complementary benefits of combining data cleaning with advanced deep learning models. Notably, the superior performance of the MAET model is primarily due to its sophisticated architecture rather than data-centric strategies, emphasizing the importance of model complexity in addition to data quality. The highest performance is observed at a threshold of or above, with an accuracy increase of and an F1 score improvement of over the baseline.
Unlike the four-quadrant classification, the seven-emotion dataset is more balanced, with only the neutral class being underrepresented. This balance contributes to consistent improvements in both accuracy and F1 scores across most thresholds when data augmentation is applied.
Figure 3, Figure 4, and Figure 5 present heatmap visualizations of the F1 scores under different data preprocessing schemes. These heatmaps provide a visual summary that complements the table based analysis by highlighting the best-performing augmentation methods across classification settings. These figures illustrate the impact of our proposed data augmentation strategies: Augmentation 1, Augmentation 2, and Gaussian noise injection across three emotion classification settings: Two Halves, Four Quadrants, and Seven Emotions. The heatmaps reveal how each method performs across a range of noise thresholds, providing a detailed view of the effectiveness of augmentation in improving model performance, particularly in handling class imbalances. These augmentation methods are evaluated alongside three baseline approaches found in the literature: (1) the Original training setup without any cleaning or augmentation, (2) the Gaussian noise augmentation applied to the full dataset without cleaning, and (3) the MAET model [26], which is included only in the Seven Emotions scenario.
It is important to note that while Gaussian augmentation has been previously explored, applying noise cleaning whether to the Original, Gaussian, or MAET setups, constitutes a novel contribution of this work. Therefore, only the top-row entries (i.e., with "None" in the first column) in Table 2, Table 3, and Table 4 represent methods from the existing literature. All subsequent rows, which incorporate threshold-based data filtering, are part of our proposed DCAI strategy.
Among the proposed augmentation strategies, Augmentation 2 yields the best performance in the Seven Emotions setting. It raises the F1 score from 27.95% (Original, unfiltered) to 35.94% (at threshold 0.7), marking a relative improvement of approximately 28.6%. However, the highest overall F1 score of 39.89% is achieved by the MAET model at a threshold of 0.9, highlighting the potential of combining advanced model architectures with noise-reduced training data.
Similarly, in the Two Halves configuration (Figure 3), Augmentation 2 achieves the best F1 score of 90.22% at a threshold of 0.99, improving upon the Original setup’s 84.33% by approximately 7.0%
In the Four Quadrant configuration (Figure 4), Augmentation 2 achieves the highest F1 score of 44.24% (at a 0.2 threshold), improving over the baseline 35.46% by approximately 24.7%.
These results demonstrate that the augmentation pipeline significantly enhances emotion classification performance across a range of model variants and label structures, outperforming both standard training and previously published methods such as MAET.
Table 5 summarizes the best performing F1 scores achieved in different emotion classification setups (Two Halves, Four Quadrants, and Seven Emotions), along with the corresponding data cleaning thresholds. The results show that the proposed augmentation strategies significantly enhance performance.
Specifically, Augmentation 2 achieves F1 score improvements of 7.0% in the two-halves task (at a threshold of 0.99), and 24.7% in the four-quadrant task (at a threshold of 0.2), relative to their respective baselines. In the seven-emotions setting, the best overall F1 score of 39.89% is achieved by the MAET model at a threshold of 0.9, representing a 42.7% improvement over the original baseline. For comparison, the best F1 score from our augmentation strategies in this setting is 35.94% using Augmentation 2 at a threshold of 0.7, yielding a 28.6% gain.
These findings indicate that DCAI-driven techniques, done by data cleaning and augmentation, play a crucial role in improving performance, particularly for fine-grained emotion classification tasks. The increase in data points through augmentation helps address class imbalance, which is essential for predicting emotions with higher granularity.
5. Conclusion
This work presents a data-centric framework for EEG-based emotion recognition, addressing challenges of limited and noisy datasets. The study demonstrates that significant gains in accuracy and F1 score can be achieved by combining participant-driven noise filtering with strategic data augmentation.
Across binary, four-quadrant, and seven-emotion classifications, data cleaning consistently improved performance, with augmentation yielding the largest gains in the seven-emotion setting. The four-quadrant and seven-emotion tasks proved more challenging due to class imbalance, highlighting the importance of targeted augmentation in handling data scarcity and imbalance.
While the MAET model achieved the highest performance in the seven-emotion task, this advantage stemmed from its architectural sophistication rather than data-centric steps, underscoring the complementary role of our approach. The novelty of this work lies not in proposing new architectures, but in showing that systematic noise filtering guided by participant scores, coupled with augmentations, produces consistent, replicable improvements across multiple classification levels.
By demonstrating that high-quality data can rival or even surpass the benefits of architectural complexity, this study offers a practical and reproducible framework for advancing emotion recognition in healthcare applications such as mental health monitoring, adaptive learning, and emotion-aware interfaces. Future work will extend these strategies to multimodal signals and investigate their impact in real-world clinical environments.
References
- A. Ng, “The age of data-centric AI,” 2021. [Online]. Available: https://www.deeplearning.ai/the-batch/what-is-data-centric-ai/.
- B. Settles, “Active learning literature survey,” University of Wisconsin-Madison, Tech. Rep. 1648, 2009. [Online]. Available: http://burrsettles.com/pub/settles.activelearning.pdf.
- G. Widmer and M. Kubat, “Learning in the presence of concept drift and hidden contexts,” Machine Learning, vol. 23, no. 1, pp. 69–101, 1996.
- Y. Zhang, J. Gao, Z. Tan, L. Zhou, K. Ding, M. Zhou, S. Zhang, and D. Wang, “Data-centric foundation models in computational healthcare: A survey,”, 2024. arXiv:2401.02458.
- A. Zahid, J. K. Poulsen, R. Sharma, and S. C. Wingreen, “A systematic review of emerging information technologies for sustainable data-centric health-care,” International Journal of Medical Informatics, vol. 149, p. 104420, 2021.
- J. M. Johnson and T. M. Khoshgoftaar, “Data-centric AI for healthcare fraud detection,” SN Computer Science, vol. 4, no. 4, p. 389, 2023.
- J. Adeoye, L. Hui, and Y.-X. Su, “Data-centric artificial intelligence in oncology: A systematic review assessing data quality in machine learning models for head and neck cancer,” Journal of Big Data, vol. 10, no. 1, p. 28, 2023.
- F. Emmert-Streib and O. Yli-Harja, “What is a digital twin? Experimental design for a data-centric machine learning perspective in health,” International Journal of Molecular Sciences, vol. 23, no. 21, p. 13149, 2022.
- J. A. L. Marques, F. N. B. Gois, J. A. N. da Silveira, T. Li, and S. J. Fong, “AI and deep learning for processing the huge amount of patient-centric data that assist in clinical decisions,” in Cognitive and Soft Computing Techniques for the Analysis of Healthcare Data, Elsevier, 2022, pp. 101–121.
- A. Bedenkov, C. Moreno, L. Agustin, N. Jain, A. Newman, L. Feng, and G. Kostello, “Customer centricity in medical affairs needs human-centric artificial intelligence,” Pharmaceutical Medicine, vol. 35, no. 1, pp. 21–29, 2021.
- M. Y. Jabarulla and H.-N. Lee, “A blockchain and artificial intelligence-based, patient-centric healthcare system for combating the COVID-19 pandemic: Opportunities and applications,” in Healthcare, vol. 9, no. 8, p. 1019, 2021.
- E. Moon, A. S. M. S. Sagar, and H. S. Kim, “Multimodal daily-life emotional recognition using heart rate and speech data from wearables,” IEEE Access, 2024.
- M. Kamruzzaman, J. Salinas, H. Kolla, K. Sale, U. Balakrishnan, and K. Poorey, “GenAI-based digital twins-aided data augmentation increases accuracy in real-time cokurtosis-based anomaly detection of wearable data,” 2024.
- P. Chang, H. Li, S. F. Quan, S. Lu, S.-F. Wung, J. Roveda, and A. Li, “A transformer-based diffusion probabilistic model for heart rate and blood pressure forecasting in Intensive Care Unit,” Computer Methods and Programs in Biomedicine, vol. 246, p. 108060, 2024.
- L. Santamaria-Granados, J. F. Mendoza-Moreno, A. Chantre-Astaiza, M. Munoz-Organero, and G. Ramirez-Gonzalez, “Tourist experiences recommender system based on emotion recognition with wearable data,” Sensors, vol. 21, no. 23, p. 7854, 2021.
- W.-L. Zheng and B.-L. Lu, “Investigating critical frequency bands and channels for EEG-based emotion recognition with deep neural networks,” IEEE Transactions on Autonomous Mental Development, vol. 7, no. 3, pp. 162–175, 2015.
- W.-L. Zheng, W. Liu, Y. Lu, B.-L. Lu, and A. Cichocki, “Emotionmeter: A multimodal framework for recognizing human emotions,” IEEE Transactions on Cybernetics, vol. 49, no. 3, pp. 1110–1122, 2018.
- W. Liu, J.-L. Qiu, W.-L. Zheng, and B.-L. Lu, “Comparing recognition performance and robustness of multimodal deep learning models for multimodal emotion recognition,” IEEE Transactions on Cognitive and Developmental Systems, vol. 14, no. 2, pp. 715–729, 2021.
- X. Du, C. Ma, G. Zhang, J. Li, Y.-K. Lai, G. Zhao, X. Deng, Y.-J. Liu, and H. Wang, “An efficient LSTM network for emotion recognition from multichannel EEG signals,” IEEE Transactions on Affective Computing, vol. 13, no. 3, pp. 1528–1540, 2020.
- Y. Li, J. Chen, F. Li, B. Fu, H. Wu, Y. Ji, Y. Zhou, Y. Niu, G. Shi, and W. Zheng, “GMSS: Graph-based multi-task self-supervised learning for EEG emotion recognition,” IEEE Transactions on Affective Computing, vol. 14, no. 3, pp. 2512–2525, 2022.
- P. Zhong, D. Wang, and C. Miao, “EEG-based emotion recognition using regularized graph neural networks,” IEEE Transactions on Affective Computing, vol. 13, no. 3, pp. 1290–1301, 2020.
- C. Tian, Y. Ma, J. Cammon, F. Fang, Y. Zhang, and M. Meng, “Dual-encoder VAE-GAN with spatiotemporal features for emotional EEG data augmentation,” IEEE Transactions on Neural Systems and Rehabilitation Engineering, vol. 31, pp. 2018–2027, 2023.
- Y. Luo, L.-Z. Zhu, Z.-Y. Wan, and B.-L. Lu, “Data augmentation for enhancing EEG-based emotion recognition with deep generative models,” Journal of Neural Engineering, vol. 17, no. 5, p. 056021, 2020.
- M. M. Krell and S. K. Kim, “Rotational data augmentation for electroencephalographic data,” in Proc. 39th Annu. Int. Conf. IEEE Eng. Med. Biol. Soc. (EMBC), 2017, pp. 471–474.
- F. Lotte, “Signal processing approaches to minimize or suppress calibration time in oscillatory activity-based brain–computer interfaces,” Proceedings of the IEEE, vol. 103, no. 6, pp. 871–890, 2015.
- W.-B. Jiang, X.-H. Liu, W.-L. Zheng, and B.-L. Lu, “SEED-VII: A multimodal dataset of six basic emotions with continuous labels for emotion recognition,” IEEE Transactions on Affective Computing, 2024.
- J. Wang, Y. Huang, S. Song, B. Wang, J. Su, and J. Ding, “A novel Fourier Adjacency Transformer for advanced EEG emotion recognition,” arXiv preprint arXiv:2503.13465, 2025.
- Sun, X. Wang, and L. Chen, “ChannelMix-based transformer and convolutional multi-view feature fusion network for unsupervised domain adaptation in EEG emotion recognition,” Expert Systems with Applications, vol. 280, p. 127456, 2025.
- N. Moghadam, V. Honary, and S. Khoubrouy, “Enhancing neural network performance for medical data analysis through feature engineering,” in Proc. 17th Int. Conf. Signal Process. Commun. Syst. (ICSPCS), 2024, pp. 1–5.
- W. B. Jiang, X. H. Liu, W. L. Zheng, and B. L. Lu, “Multimodal adaptive emotion transformer with flexible modality inputs on a novel dataset with continuous labels,” in Proceedings of the 31st ACM International Conference on Multimedia, Ottawa, Canada, 2023, pp. 5975–5984.
- J. A. Russell, “A circumplex model of affect,” Journal of Personality and Social Psychology, vol. 39, no. 6, p. 1161, 1980.
- S. Kiranyaz, T. T. Ince, O. Abdeljaber, S. Hammoud, N. E. Ince, and M. Gabbouj, “1D convolutional neural networks and applications: A survey,” Mechanical Systems and Signal Processing, vol. 151, p. 107398, 2021.
- N. Srivastava, G. Hinton, A. Krizhevsky, I. Sutskever, and R. Salakhutdinov, “Dropout: A simple way to prevent neural networks from overfitting,” Journal of Machine Learning Research, vol. 15, pp. 1929–1958, 2014.
- R. Kohavi, “A study of cross-validation and bootstrap for accuracy estimation and model selection,” in Proc. Int. Joint Conf. Artif. Intell. (IJCAI), 1995.
- F. Wang, S.-h. Zhong, J. Peng, J. Jiang, and Y. Liu, “Data augmentation for EEG-based emotion recognition with deep convolutional neural networks,” in Proc. 24th Int. Conf. MultiMedia Modeling (MMM), Bangkok, Thailand, Feb. 5–7, 2018, Part II, pp. 82–93. Springer, 2018.
Figure 1.
Visualization of emotion classification: (a) High Arousal (HA) and Low Arousal (LA) emotions. (b) Mapping emotions across the four quadrants.
Figure 1.
Visualization of emotion classification: (a) High Arousal (HA) and Low Arousal (LA) emotions. (b) Mapping emotions across the four quadrants.
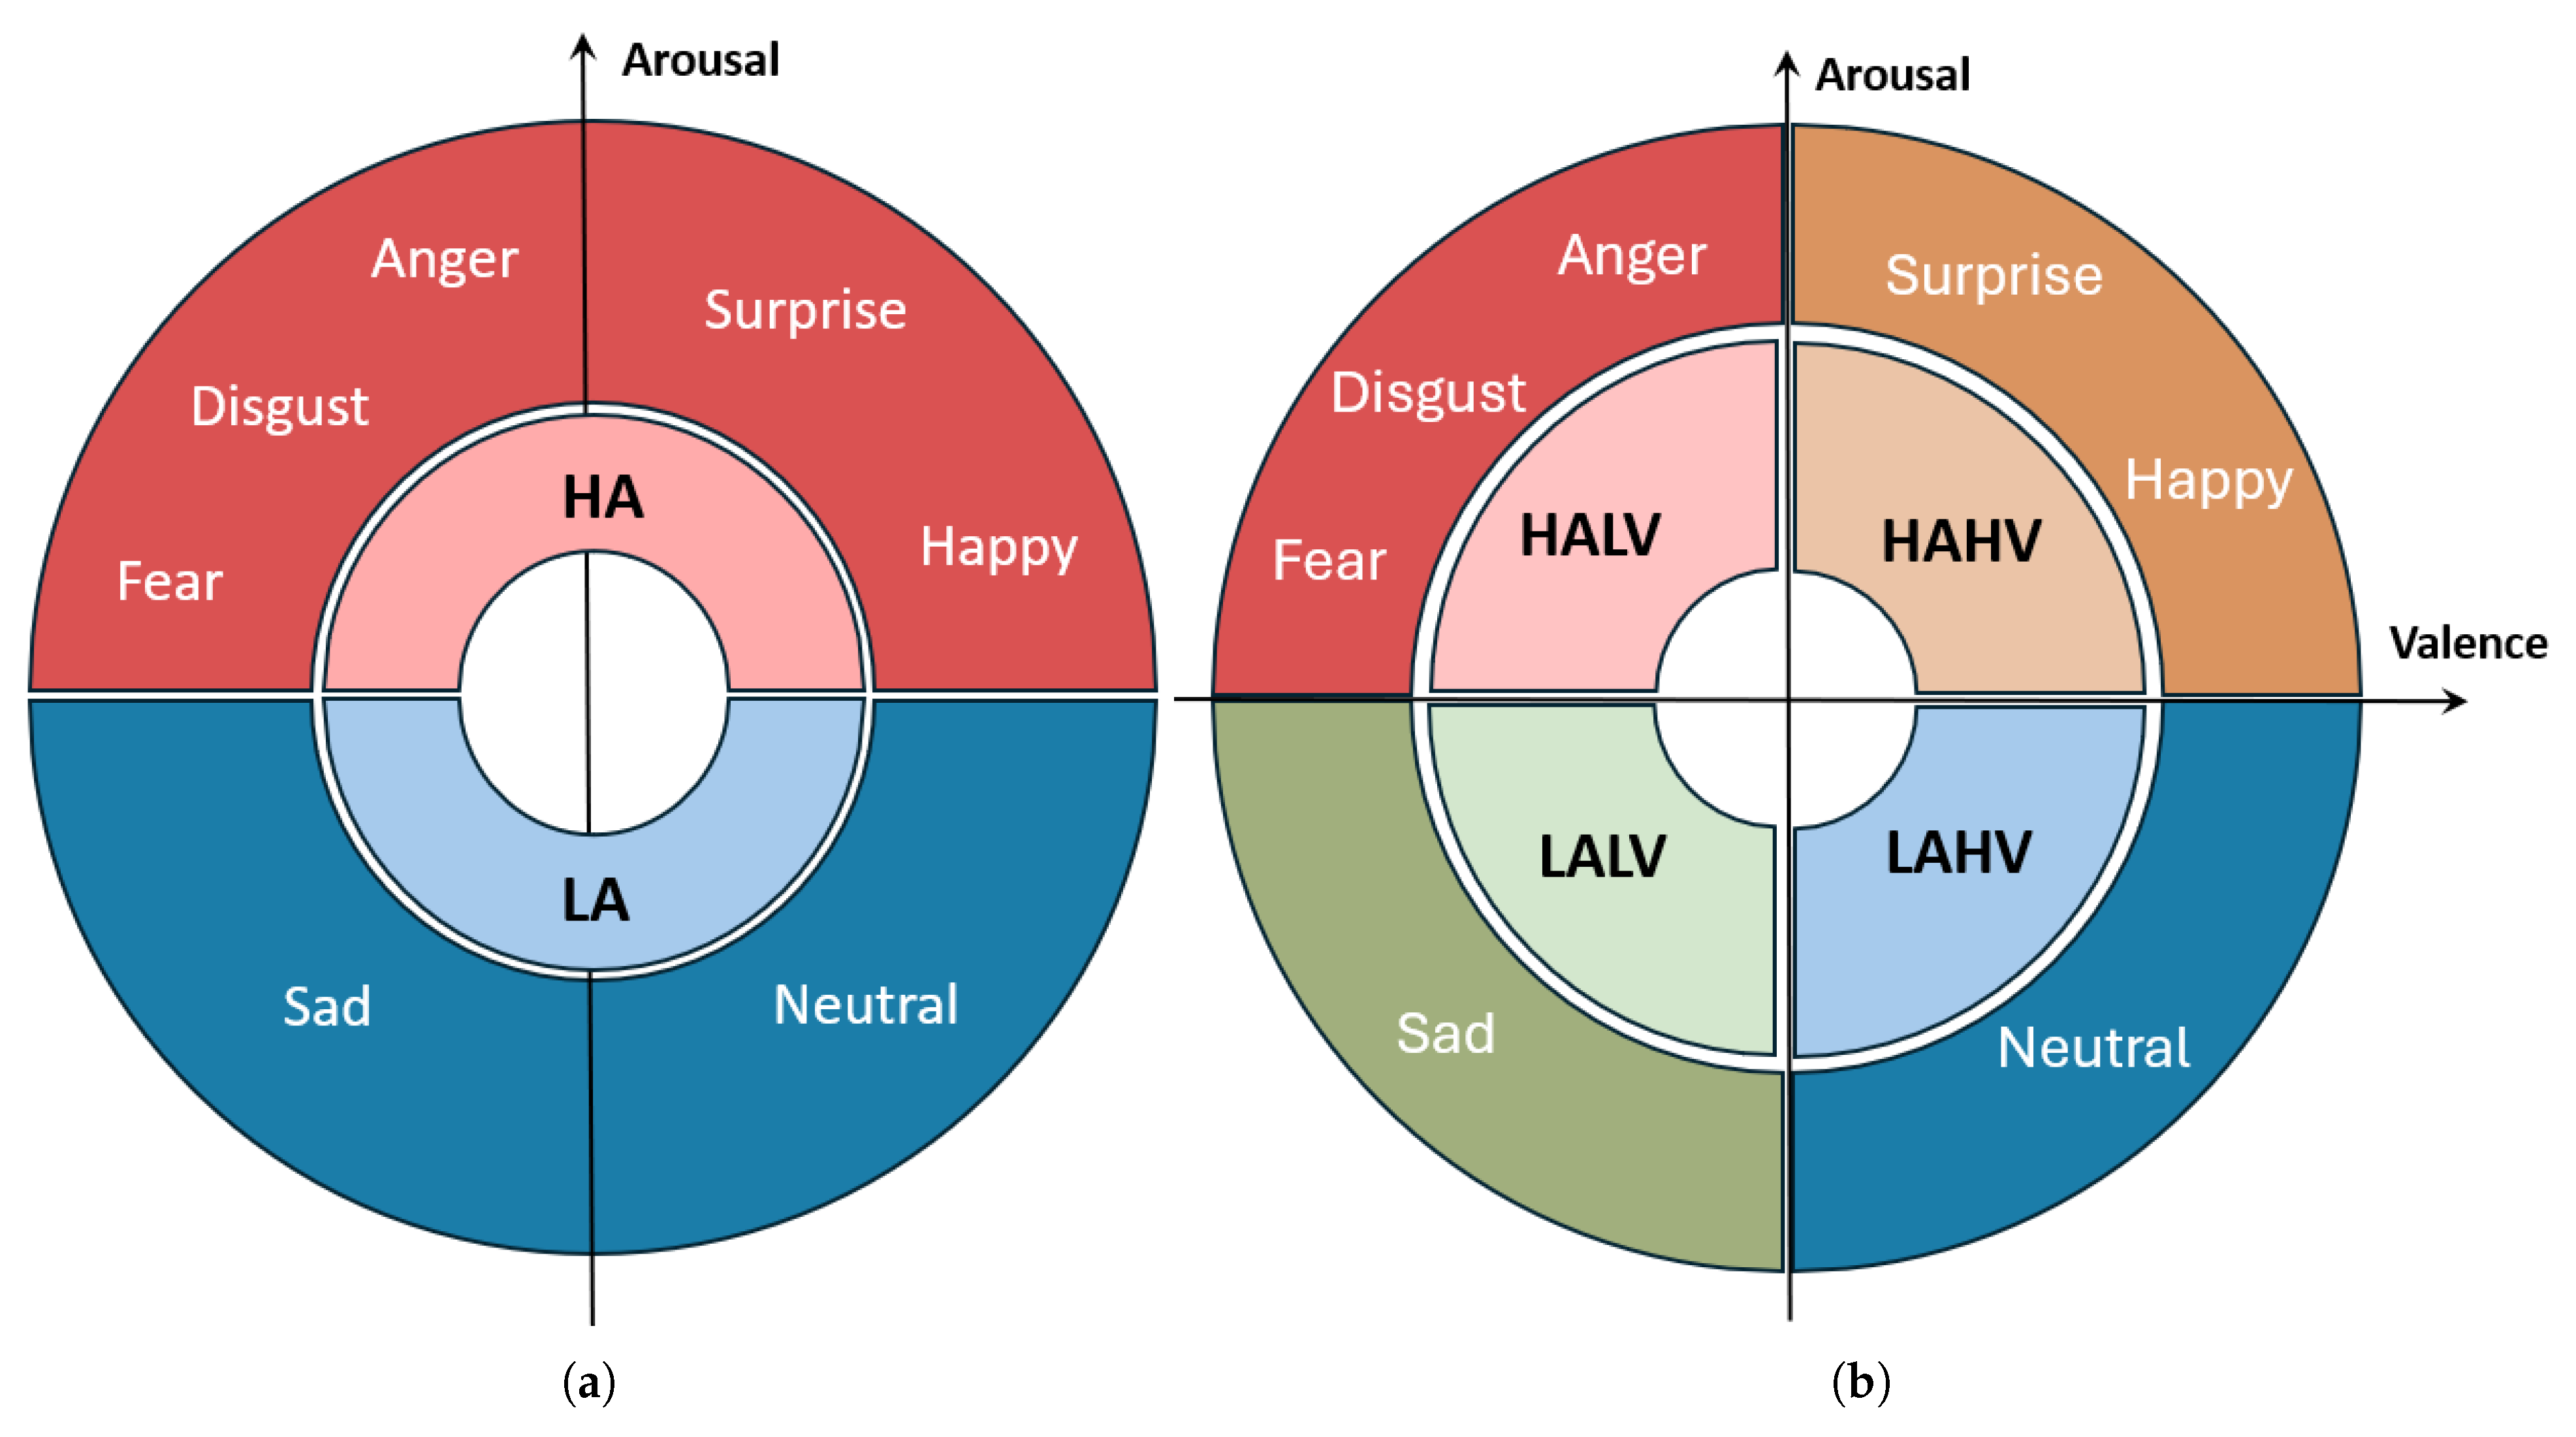
Figure 2.
Illustration of the proposed Data-Centric AI pipeline.
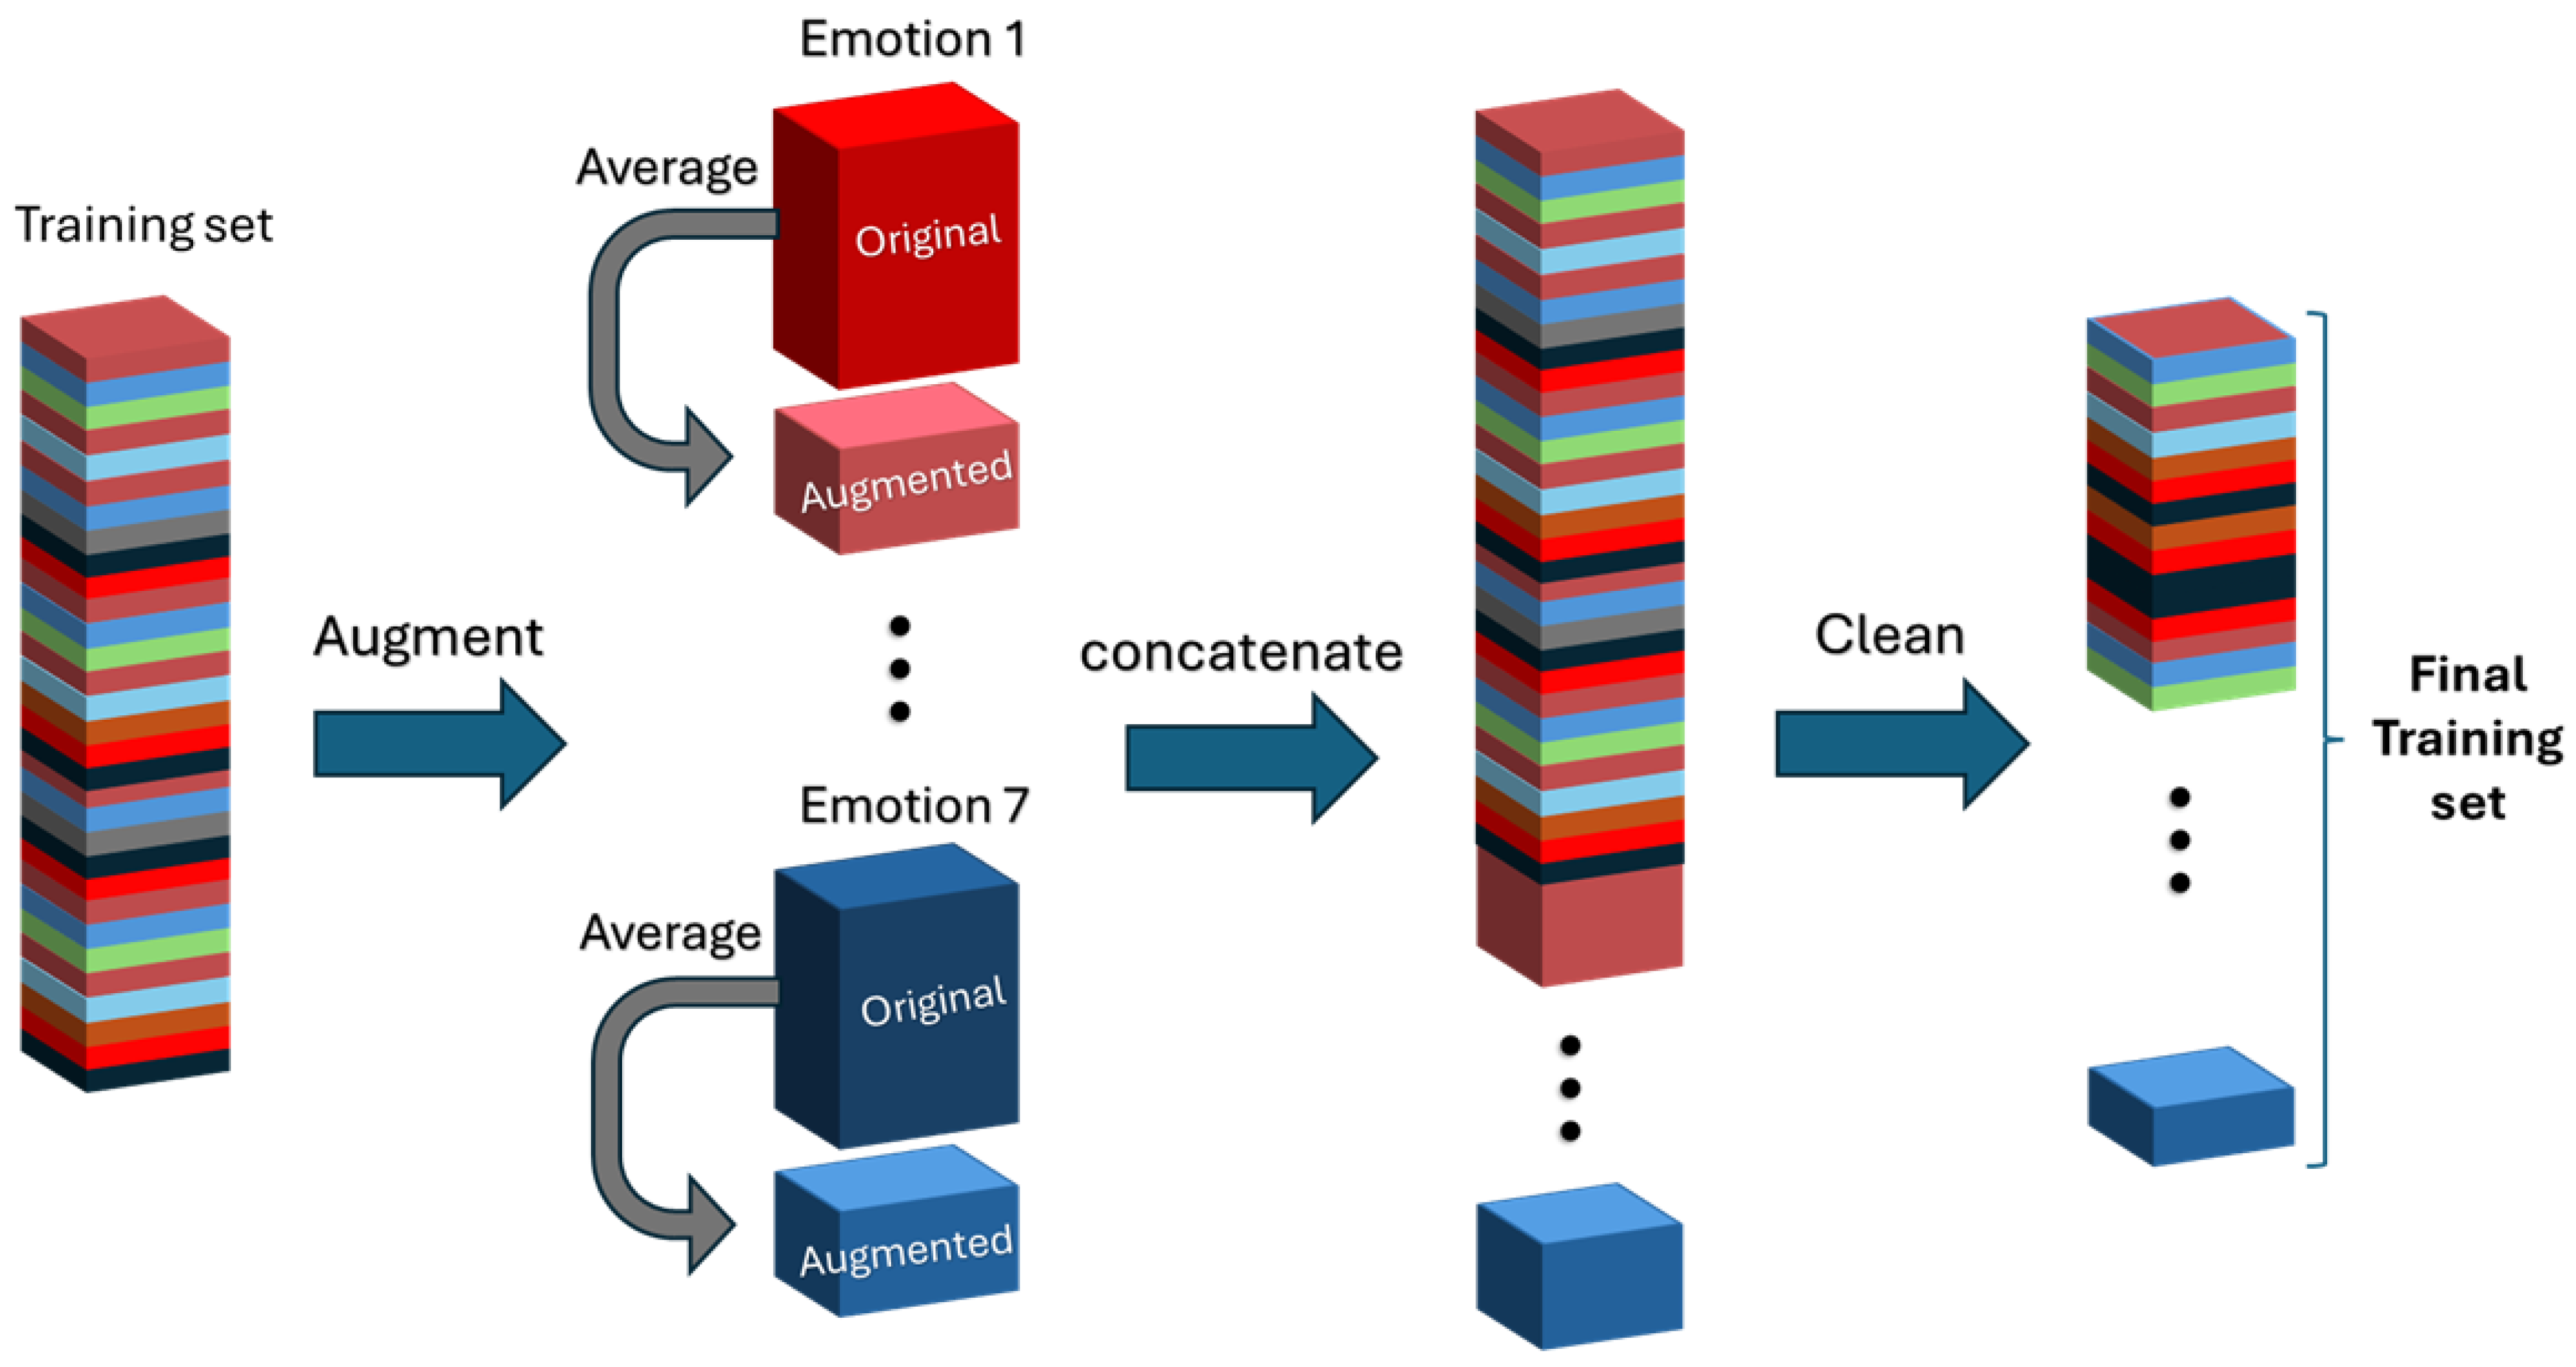
Figure 3.
F1 Score heatmap for Two Halves Emotion under various data cleaning and augmentation.
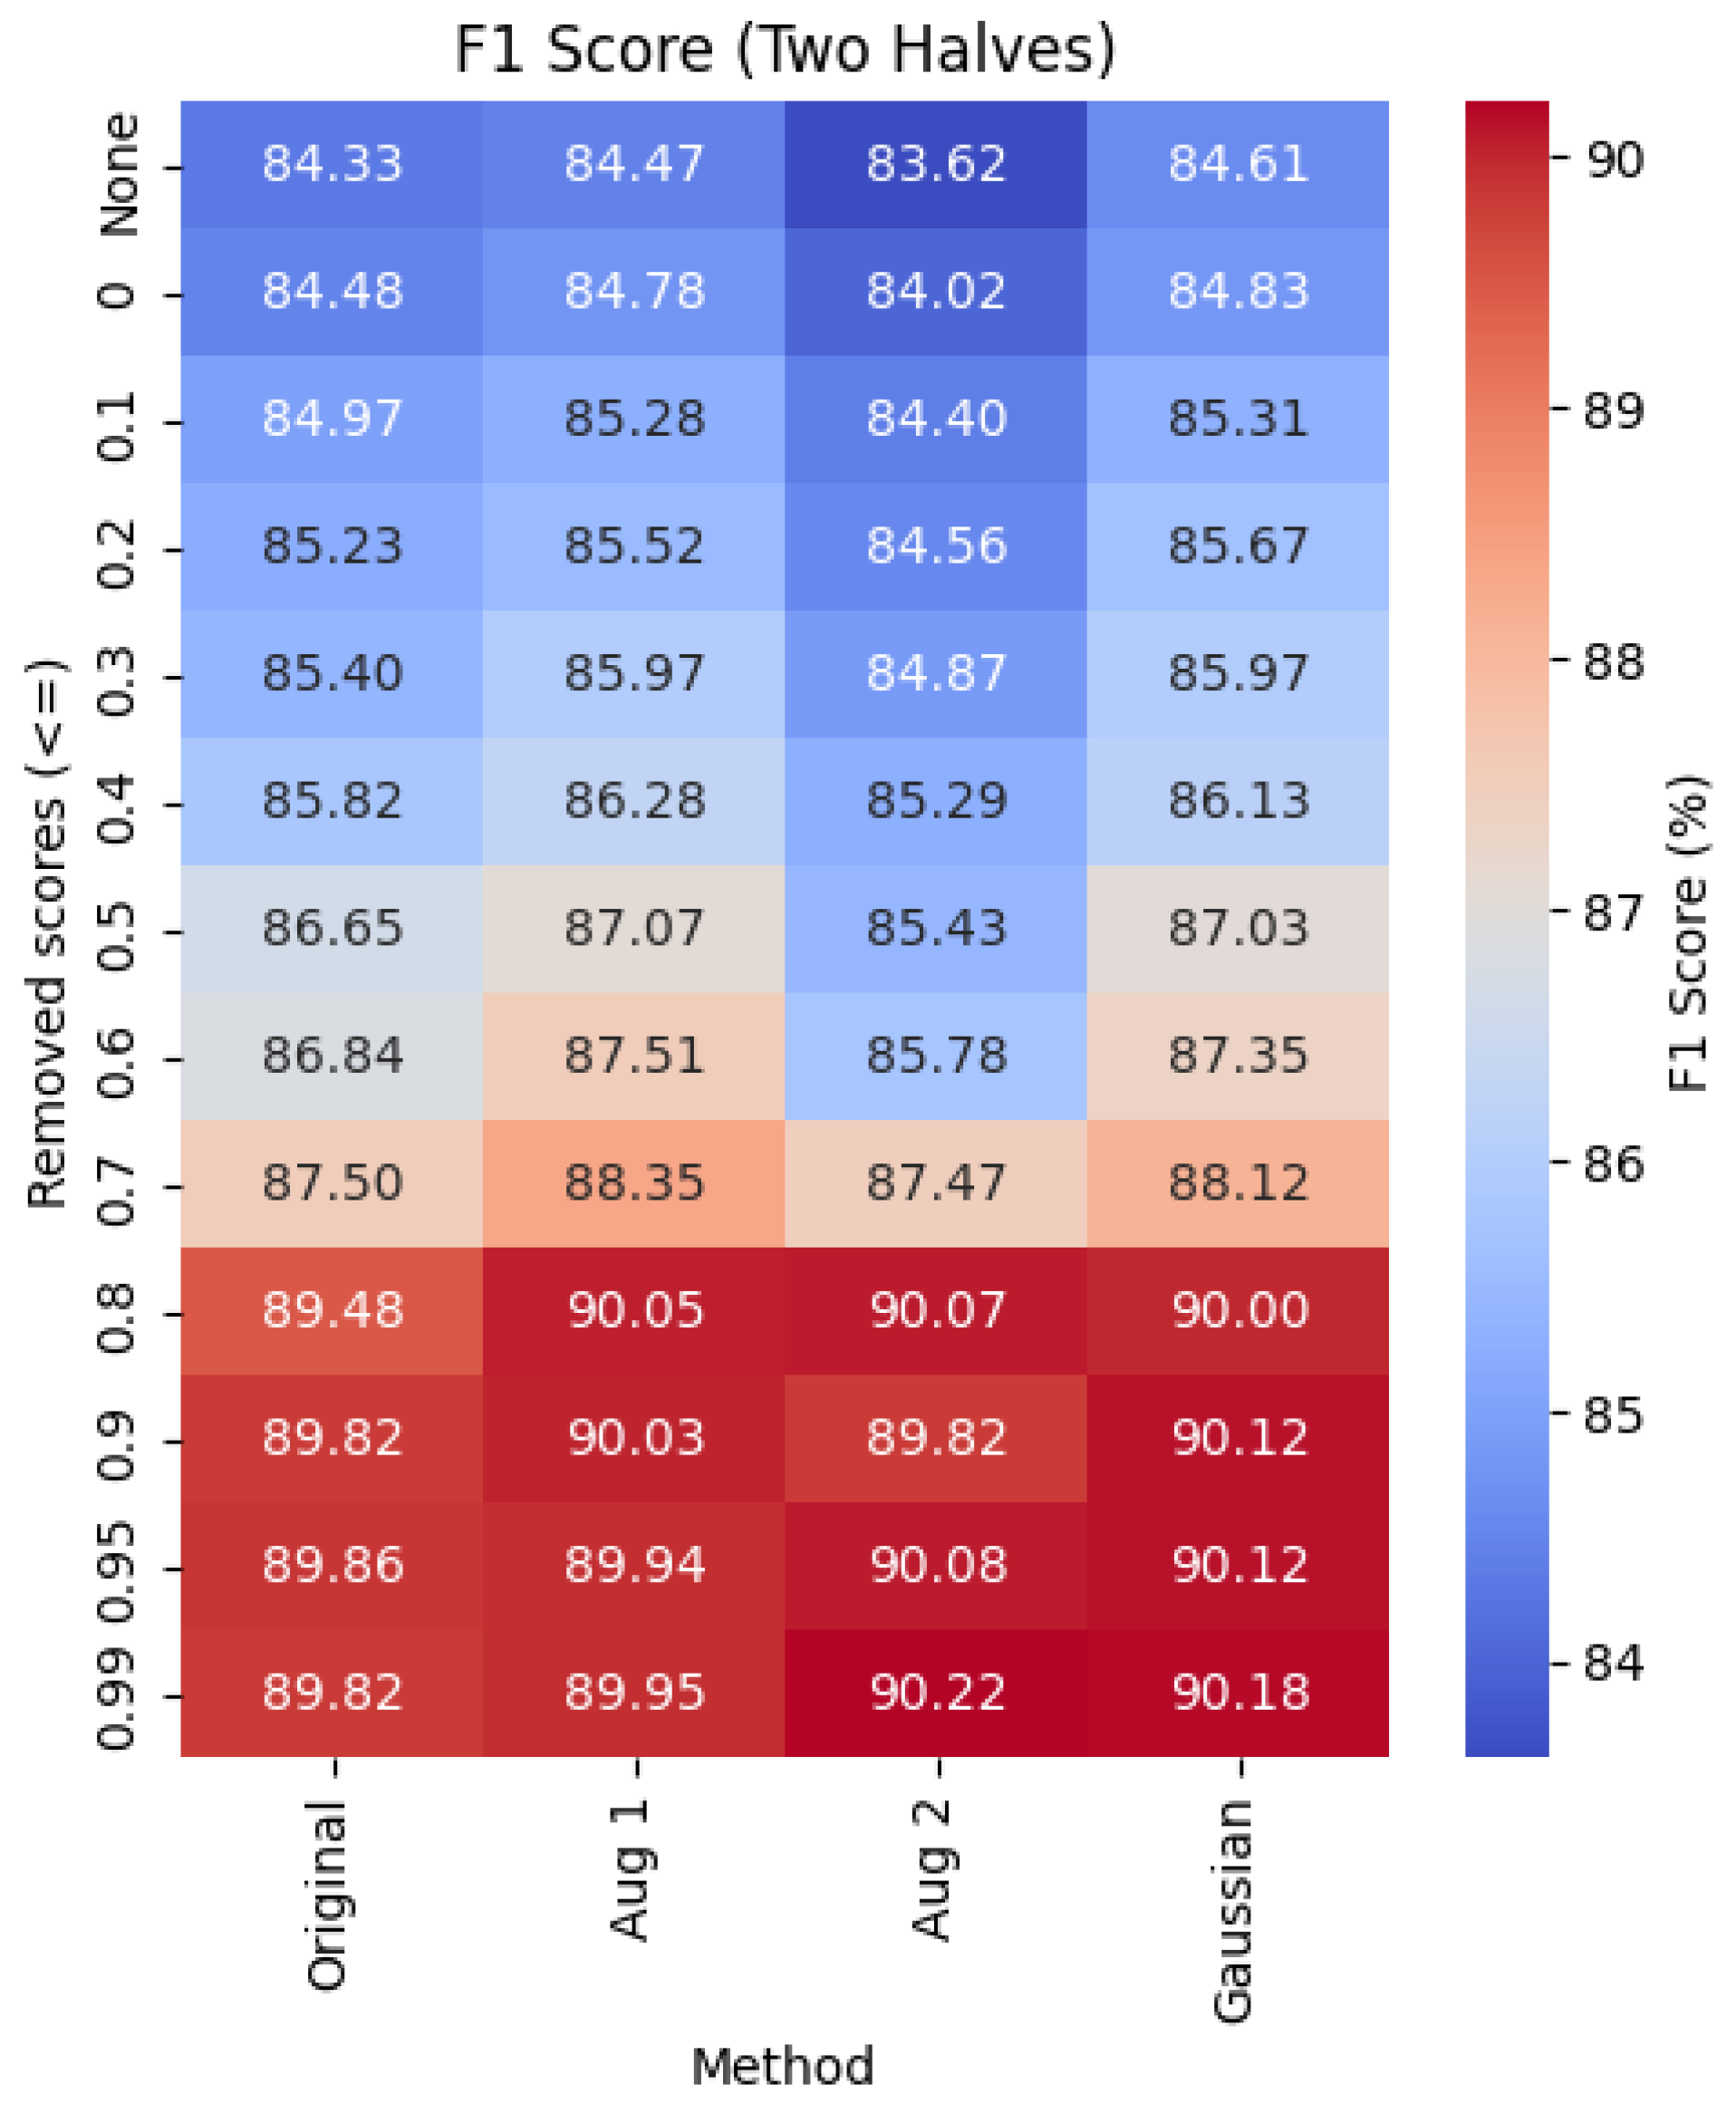
Figure 4.
F1 Score heatmap for Four Quadrant Emotion classification using different preprocessing strategies.
Figure 4.
F1 Score heatmap for Four Quadrant Emotion classification using different preprocessing strategies.
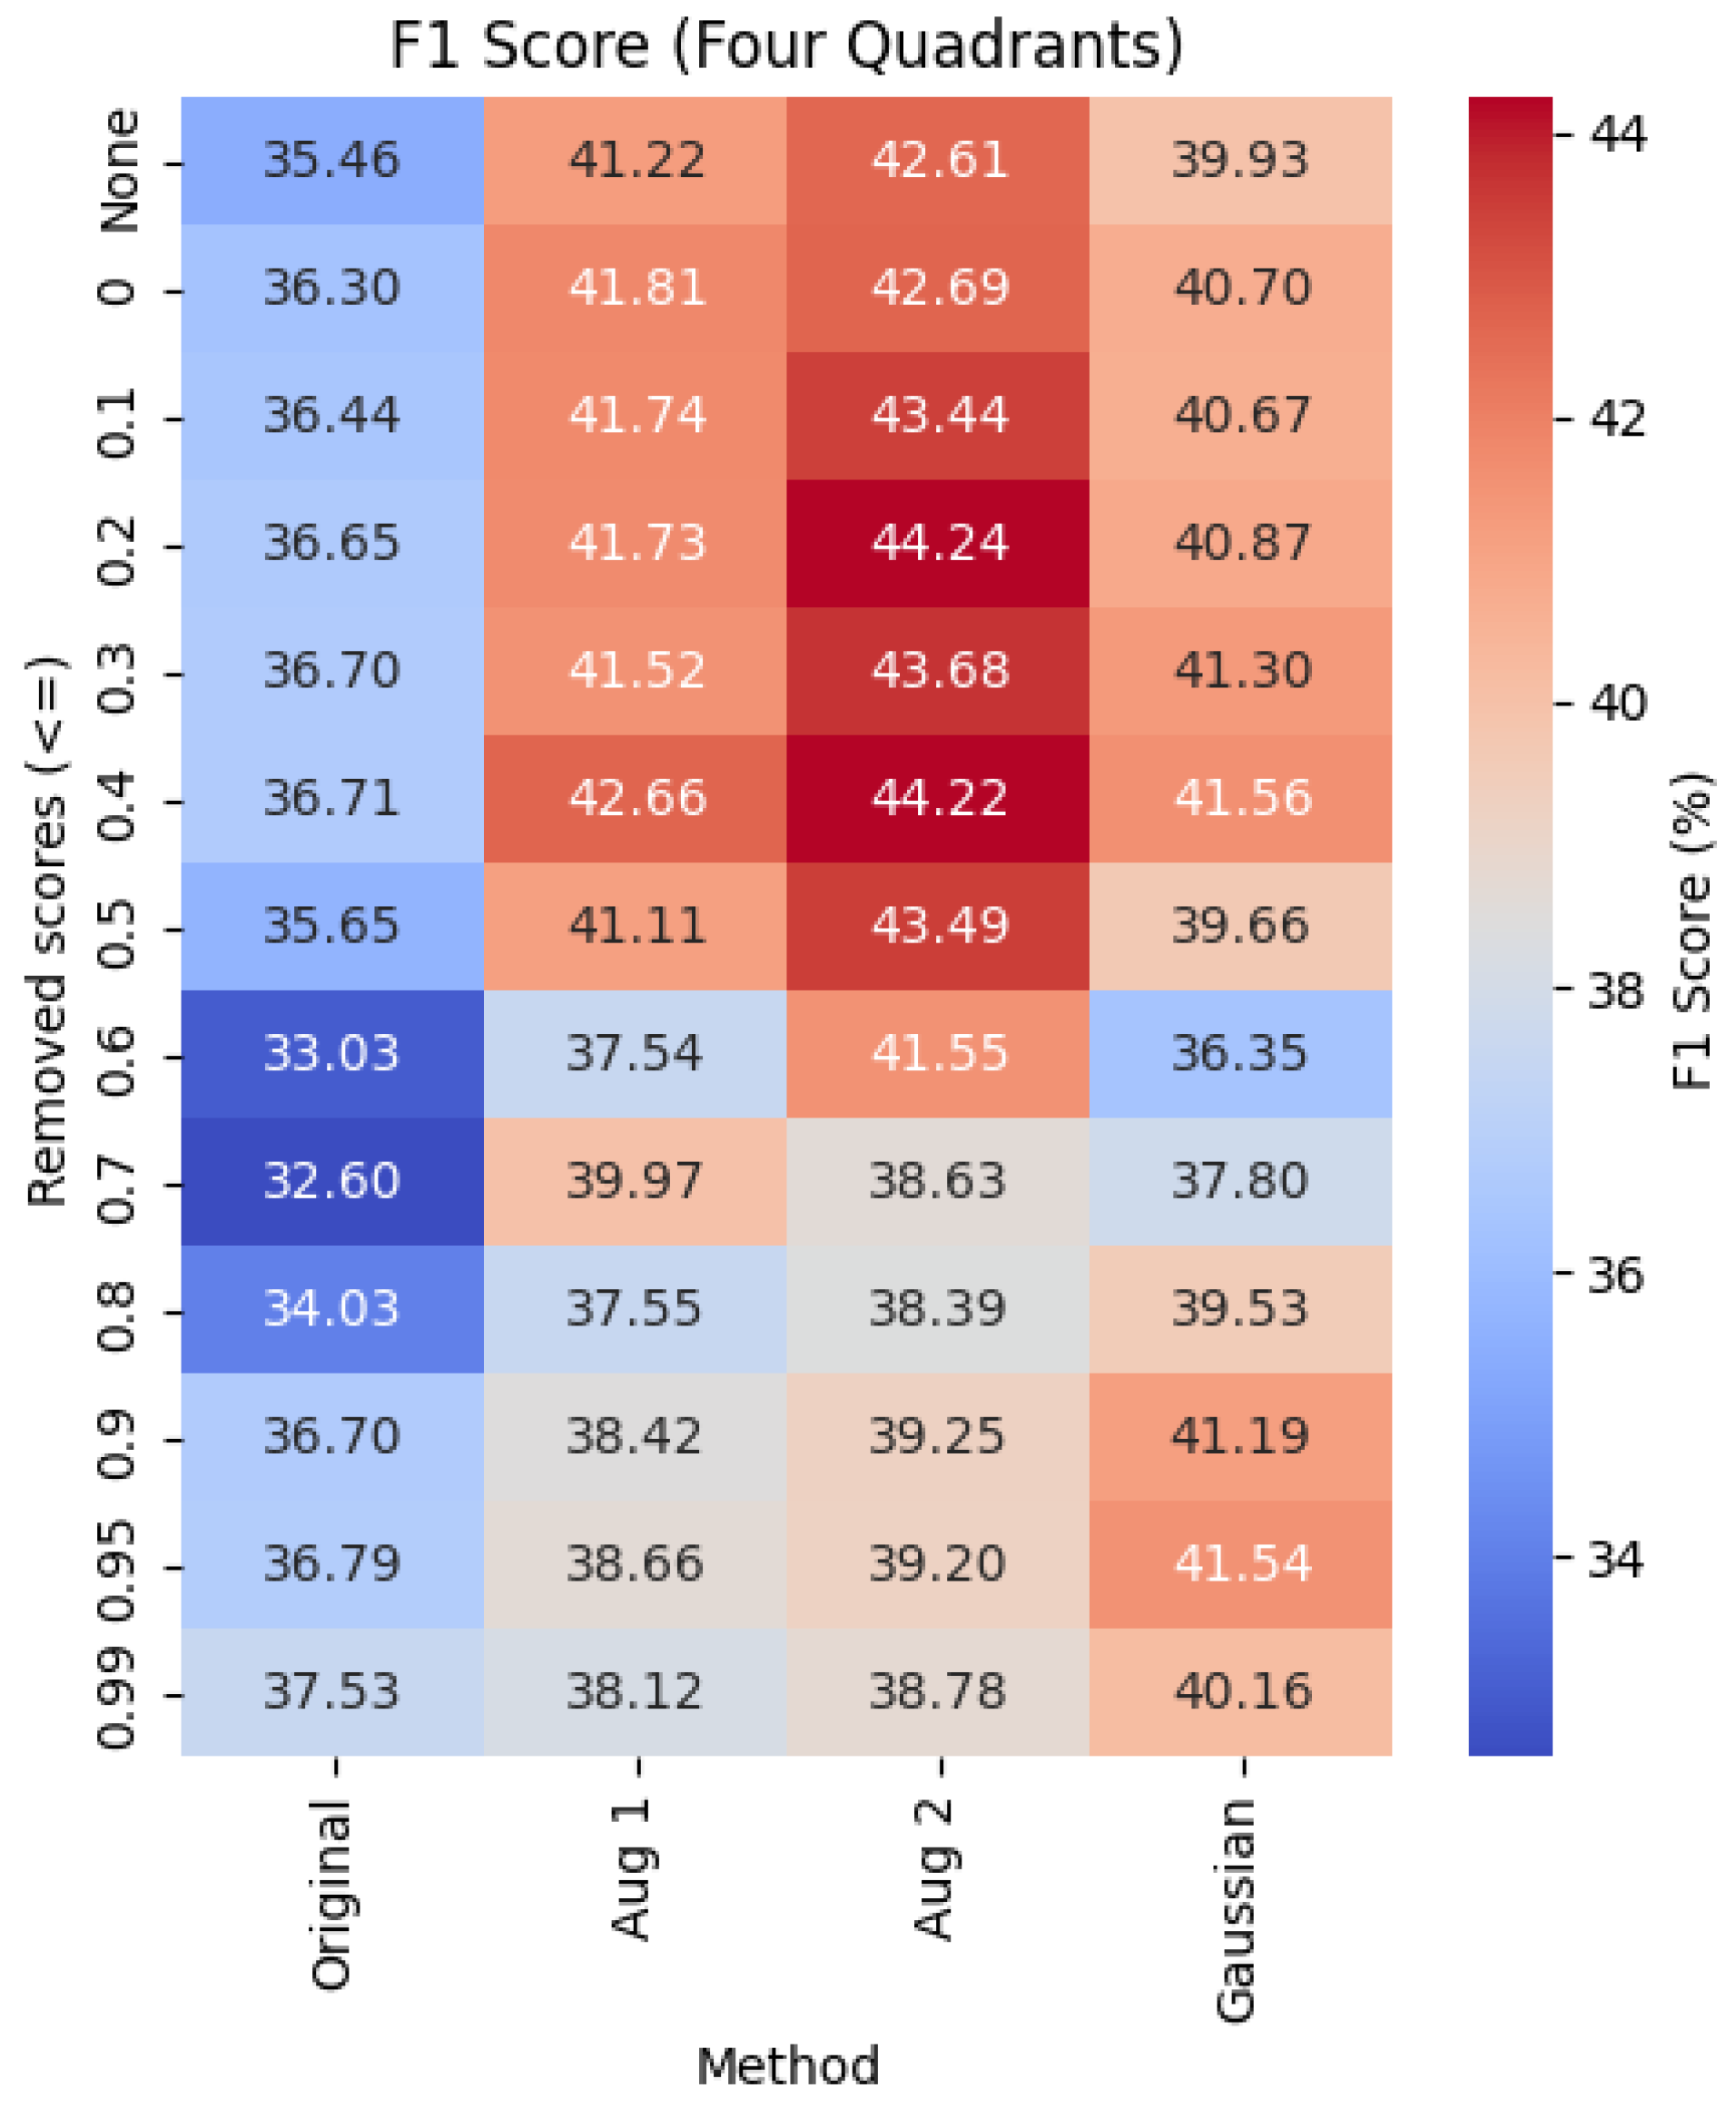
Figure 5.
F1 Score heatmap for Seven Emotions task including baseline and proposed augmentation methods.
Figure 5.
F1 Score heatmap for Seven Emotions task including baseline and proposed augmentation methods.
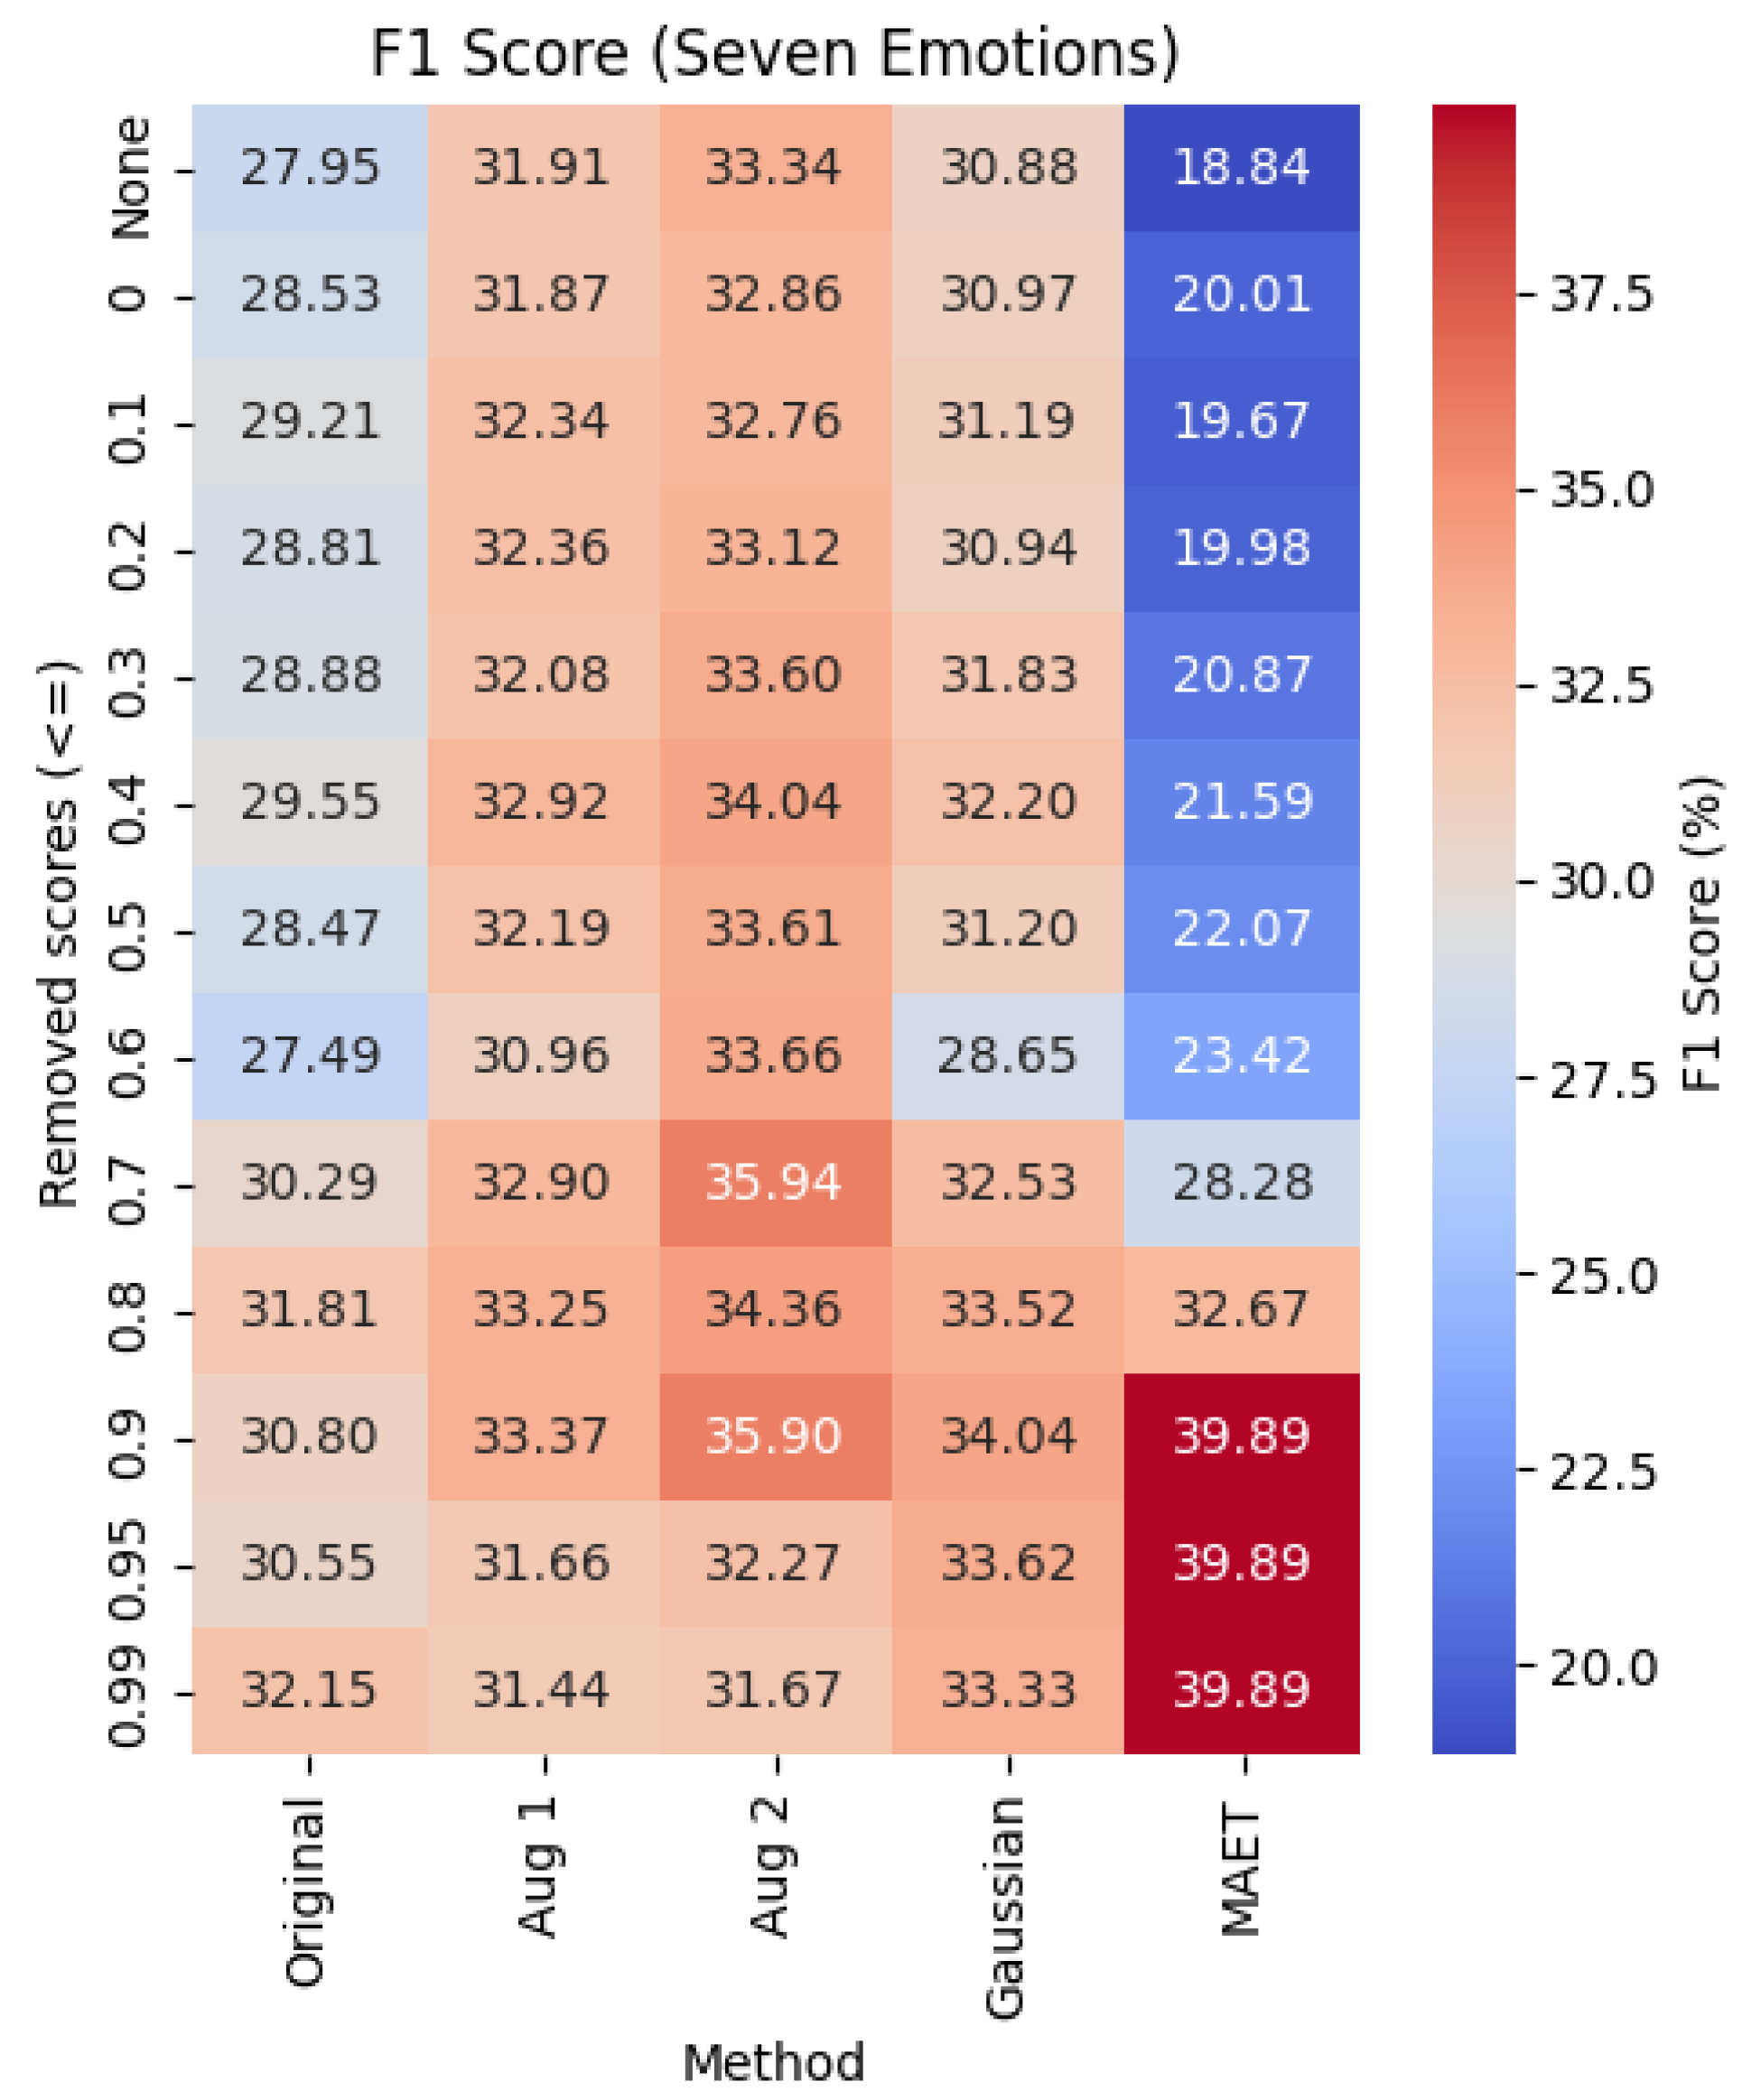

Table 1.
Comparison of Model Architectures and Performance Metrics
| 2 Halves | 4 Quadrants | 7 Emotions | |||||
| No. | Model Architecture | Accuracy % | F1 Score % | Accuracy % | F1 Score % | Accuracy % | F1 Score % |
| 1 | Conv1D MaxPooling1D Dropout(0.5) Flatten Dense |
||||||
| 2 | Conv1D Dropout(0.25) MaxPooling1D Flatten Dense(128, relu) Dropout(0.25) Dense |
84 | |||||
| 3 | Conv1D Dropout(0.5) MaxPooling1D Flatten Dense(128, relu) Dropout(0.5) Dense |
||||||
Table 2.
Effect of Data Cleaning and Augmentation on Two Halves Emotion Classification
| Original | Augmentation 1 | Augmentation 2 | Gaussian | |||||
|---|---|---|---|---|---|---|---|---|
| Removed scores () | Accuracy % | F1 Score % | Accuracy % | F1 Score % | Accuracy % | F1 Score % | Accuracy % | F1 Score % |
| None | ||||||||
| 0 | ||||||||
| 0.1 | ||||||||
| 0.2 | ||||||||
| 0.3 | ||||||||
| 0.4 | ||||||||
| 0.5 | ||||||||
| 0.6 | 78 | |||||||
| 0.7 | ||||||||
| 0.8 | 90 | |||||||
| 0.9 | ||||||||
| 0.95 | ||||||||
| 0.99 | ||||||||
Table 3.
Effect of Data Cleaning and Augmentation on Four quadrant Emotion Classification
| Original | Augmentation 1 | Augmentation 2 | Gaussian | |||||
|---|---|---|---|---|---|---|---|---|
| Removed scores () | Accuracy % | F1 Score % | Accuracy % | F1 Score % | Accuracy % | F1 Score % | Accuracy % | F1 Score % |
| None | ||||||||
| 0 | ||||||||
| 0.1 | ||||||||
| 0.2 | ||||||||
| 0.3 | ||||||||
| 0.4 | ||||||||
| 0.5 | ||||||||
| 0.6 | ||||||||
| 0.7 | ||||||||
| 0.8 | ||||||||
| 0.9 | ||||||||
| 0.95 | 63 | |||||||
| 0.99 | ||||||||
Table 4.
Effect of Data Cleaning and Augmentation on the Seven Emotion Classification
| Original | Augmentation 1 | Augmentation 2 | Gaussian | MAET | ||||||
|---|---|---|---|---|---|---|---|---|---|---|
|
Removed scores () |
Accuracy % | F1 Score % | Accuracy % | F1 Score % | Accuracy % | F1 Score % | Accuracy % | F1 Score % | Accuracy % | F1 Score % |
| None | ||||||||||
| 0 | ||||||||||
| 0.1 | ||||||||||
| 0.2 | ||||||||||
| 0.3 | ||||||||||
| 0.4 | ||||||||||
| 0.5 | ||||||||||
| 0.6 | ||||||||||
| 0.7 | ||||||||||
| 0.8 | ||||||||||
| 0.9 | ||||||||||
| 0.95 | ||||||||||
| 0.99 | ||||||||||
Table 5.
Summary of Best F1 Scores Across Emotion Classification Setups
| Setup | Method | Threshold | Best F1 | Original F1 | Improvement (%) |
|---|---|---|---|---|---|
| Two Halves | Augmentation 2 | 0.99 | 90.22 | 84.33 | +7.0% |
| Four Quadrants | Augmentation 2 | 0.2 | 44.24 | 35.46 | +24.7% |
| Seven Emotions | MAET | 0.9 | 39.89 | 27.95 | +42.7% |
0.95 Note: Threshold refers to the minimum emotion score retained during noise cleaning; data points with scores below this value were excluded from training.
Disclaimer/Publisher’s Note: The statements, opinions and data contained in all publications are solely those of the individual author(s) and contributor(s) and not of MDPI and/or the editor(s). MDPI and/or the editor(s) disclaim responsibility for any injury to people or property resulting from any ideas, methods, instructions or products referred to in the content. |
© 2025 by the authors. Licensee MDPI, Basel, Switzerland. This article is an open access article distributed under the terms and conditions of the Creative Commons Attribution (CC BY) license (http://creativecommons.org/licenses/by/4.0/).
Copyright: This open access article is published under a Creative Commons CC BY 4.0 license, which permit the free download, distribution, and reuse, provided that the author and preprint are cited in any reuse.


