Submitted:
10 September 2025
Posted:
11 September 2025
You are already at the latest version
Abstract
Surgical treatment is the only option for cholesteatoma; however, the recurrence rate is high, and the incidence of residual cholesteatoma recurrence largely depends on the surgeon's skill. Training deep neural network (DNN) models typically requires large datasets, but the prevalence of cholesteatoma is low (1 in 25,000 people). However, cholesteatoma remains difficult to treat. Developing analytical methods to improve ac-curacy with limited datasets remains a significant challenge in medical artificial intelli-gence (AI) research.
This study introduces an AI-based system for detecting residual cholesteatoma in surgical field videos. A retrospective analysis was conducted on 144 cases from 88 patients who underwent surgery. The training dataset comprised videos of cholesteatoma lesions recorded during surgery and intact middle ear mucosa after lesion removal. These videos were captured using both endoscope and microscope for AI model development. The diagnostic accuracy was approximately 80% for both endoscopic and microscopic images. Although the diagnostic accuracy for microscopic images was slightly lower, focusing on the lesion center improved the accuracy to a level comparable to that of endoscopic images.
This study demonstrates the diagnostic feasibility of AI-based cholesteatoma detection despite a limited sample size highlighting the value of proof-of-concept studies in clar-ifying technical requirements for future clinical systems and is the first AI study to use videos from both modalities.
Keywords:
cholesteatoma
; artificial intelligence
; endoscope
; microscope
1. Introduction
Surgical intervention is the primary treatment for cholesteatoma; however, the recurrence rate is high, and the incidence of residual cholesteatoma recurrence largely depends on the surgeon's skill. Complete removal of the lesion during the procedure is essential to prevent recurrence. The removal of cholesteatoma requires meticulous dissection from the middle ear mucosa while preserving the cholesteatoma matrix, a task that is often challenging due to the difficulty in precisely identifying its boundaries.
Artificial intelligence (AI) has been increasingly applied in otorhinolaryngology, encompassing image-based diagnostics, surgical skill assessment, and intraoperative guidance [1]. In particular, the application of AI to surgical video analysis has attracted global attention, with studies demonstrating its feasibility for workflow recognition, skill evaluation, and even real-time assistance [2]. In rhinology, real-time augmentation of nasal endoscopic video has already been shown to be clinically feasible [3], underscoring the potential of video-based AI systems to support intraoperative decision-making. In contrast, most previous studies in otology have primarily investigated static images, such as otoscopic photographs and CT scans [4]. For instance, high diagnostic accuracy has been demonstrated for differentiating cholesteatoma using otoscopic images; however, to our knowledge, only one study has evaluated intraoperative images, which involved a small dataset and reported limited sensitivity and specificity [5,6]. While these approaches have demonstrated promising diagnostic performance, there is little evidence regarding the detection of anatomical structures and pathological findings during dynamic surgical procedures. Moreover, AI models trained on small datasets often exhibit restricted performance when applied to external populations, underscoring persistent concerns about their generalizability [7].
The development of clinically applicable AI systems requires large and diverse datasets, as well as robust single models that can achieve high performance. However, even when the dataset size is limited, such as in rare diseases like cholesteatoma (estimated prevalence of approximately 1 in 25,000 individuals), proof-of-concept studies remain valuable for elucidating the technical requirements of future clinical systems.
Therefore, the aim of this study was to evaluate the performance of deep learning models trained on a limited dataset of postoperative surgical videos and to identify design requirements necessary for reliable lesion discrimination. The novelty of this study does not lie in the backbone architecture itself, but rather in integrating dual-modality surgical videos and adopting systematic strategies to enhance diagnostic stability under constrained data conditions. Through this approach, this study provides proof-of-concept insights that may inform future efforts toward developing AI-based intraoperative support systems for cholesteatoma surgery.
2. Materials and Methods
2.1. Patient Data and Video Processing
A total of 144 surgical videos from 88 patients (60 males, 28 females; age range: 4–76 years, median: 38 years, mean ± SD: 35.5 ± 17.4 years) diagnosed with cholesteatomatous otitis media were retrospectively analyzed. These surgeries were performed between 2020 and 2023 at the Department of Otolaryngology, Jikei University School of Medicine, and affiliated hospitals. All cases were surgically confirmed to involve cholesteatoma, with a mean follow-up period of 33 months. The diagnosis of cholesteatoma was made based on the presence of intraoperative keratinized squamous epithelium and middle ear debris and/or histopathological examination of the excised tissue.
Surgical videos captured using both a microscope and an endoscope were categorized into four groups based on imaging modality and the presence or absence of cholesteatoma: cholesteatoma-endoscope (Cholesteatoma ES), cholesteatoma-microscope (Cholesteatoma MS), non-cholesteatoma-endoscope (Non-cholesteatoma ES), and non-cholesteatoma-microscope (Non-cholesteatoma MS) (Table 1; see Supplementary Tables S1 and S2 online). Representative intraoperative images used for AI training are shown in Figure 1. These videos were used to train an AI model, referred to as the "Before Model". Additionally, a second AI model, referred to as the "After Model", was trained on videos that were trimmed to exclude visible skin and surgical instruments (Figure 2). However, most endoscopic videos required little to no editing.
Both AI models were then used to determine the presence of cholesteatoma.
The study protocol was approved by the Human Ethics Review Committee of Jikei University School of Medicine, Tokyo, Japan (approval number: 32-036 [10111]), which waived the requirement for informed consent because of the retrospective nature of the study. All methods were performed in accordance with the Declaration of Helsinki and relevant institutional guidelines.
The gender distribution was evaluated using the chi-square test, and no significant bias was observed (p = 0.637).
The distribution of video counts was also evaluated using the chi-square test, and no significant bias was found (p = 0.248).
2.2. Video Acquisition Systems
Surgical videos were captured using two endoscopic systems (Olympus and Storz) at native resolutions of 1920×1080 and 960×540 pixels, both recorded at 59.94 frames per second. Microscopic footage was acquired with a ZEISS surgical microscope at 1920×1080 pixels and 29.25 frames per second.
2.3. Video Length and Frame Count for Each Case
The videos used in this study had varying frame rates and durations for each case.
Figure 3A presents the distribution of cases across groups categorized by video duration before editing.
Figure 3B presents the distribution of cases across groups categorized by video duration after editing.
Figure 4A presents the distribution of cases across groups categorized by total frame count before editing.
Figure 4B presents the distribution of cases across groups categorized by total frame count after editing.
The entire list of 144 cases can be found as Supplementary Table S3 online.
Dataset for Training and Validation
For cross-validation, the cases were divided into six groups. When dividing the cases into groups, the total number of video frames and cases in each group was balanced as evenly as possible.
Table 2A presents the number of cases and the total video frames in each group before editing.
Table 2B presents the number of cases and the total video frames in each group after editing.
Table 3A presents the number of cases and the total images in each cross-validation set before editing.
Table 3B presents the number of cases and the total images in each cross-validation set after editing.
2.4. Neural Network
In this study, we adopted the MobileNetV2 architecture, which is a relatively compact architecture with 88 layers, a fixed input size of 224 × 224, and 3,538,984 trainable parameters. We selected MobileNetV2 because its compact structure (approximately 3.5 million parameters) helps reduce overfitting under limited data conditions. In addition, this architecture has already been widely applied in medical image analysis, demonstrating versatility and robustness across clinical imaging tasks [8].
2.5. Training
The training images were augmented 1,440-fold relative to the total number of original images to ensure an even distribution of images across cases. Augmentation included common random transformations such as rotation, inversion, resizing, and adjustments to color, brightness, and/or contrast, followed by resizing to 224 × 224 for training.
Each DNN model was trained on a dataset containing 10 times the original number of images, ensuring balance across cases by randomly selecting from the augmented dataset. Each model was trained for 10 epochs using a randomly selected 1/10 subset of the augmented dataset.
Since the DNN models were trained on a large number of augmented images derived from a limited number of cases, the trained models may exhibit significant variability across different training runs. Therefore, 24 training sets were created to evaluate model accuracy variability.
Consequently, a total of 288 models (6 cross-validation sets × 24 × 2 (before/after) = 288) were generated.
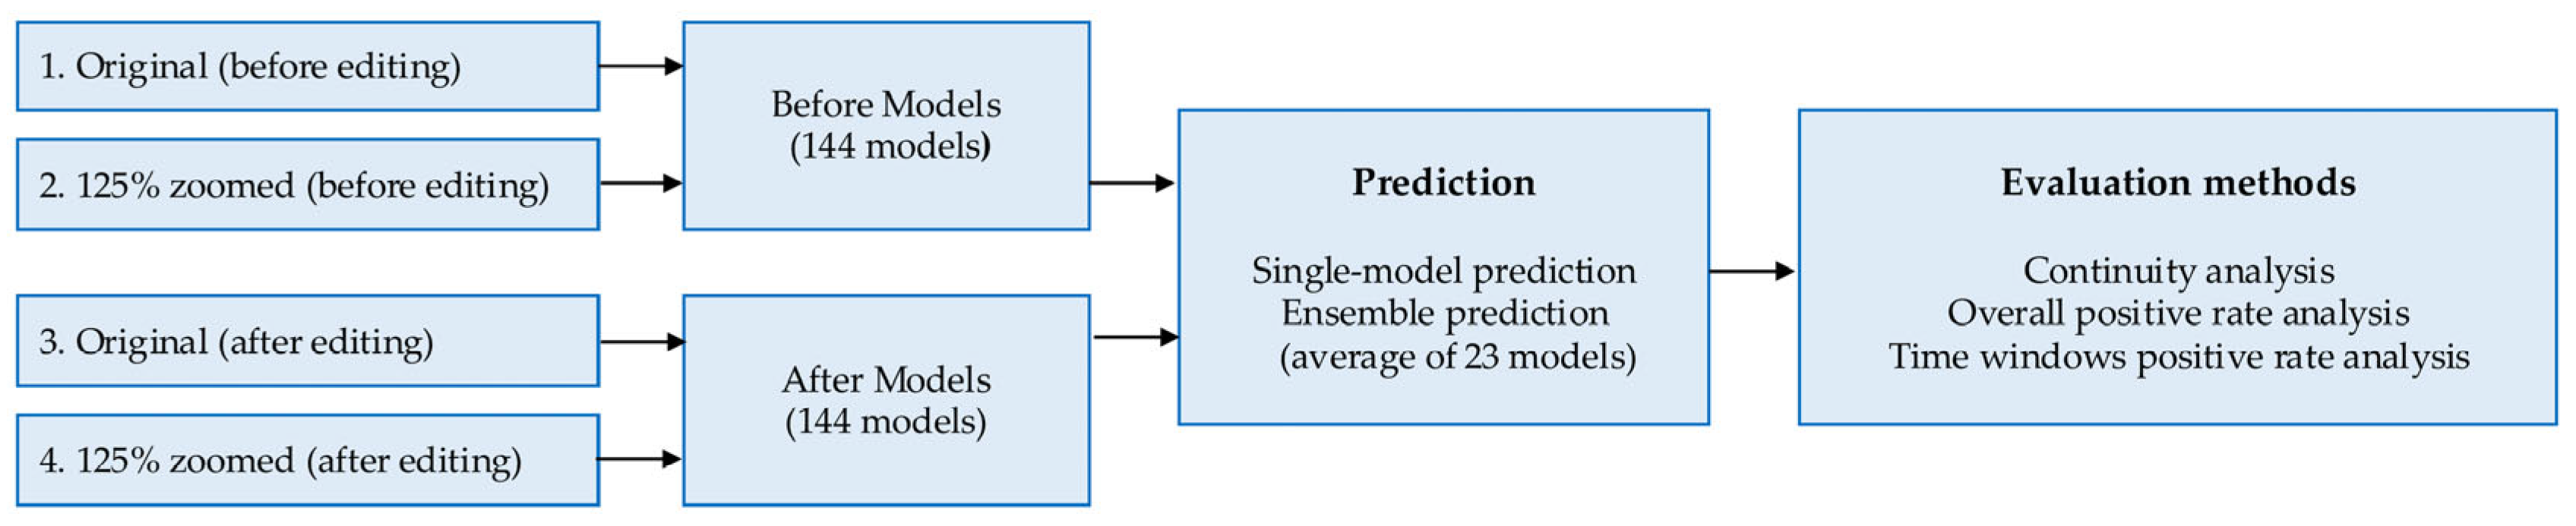
The workflow of the AI model development and evaluation process is shown in Figure 5.
2.6. Evaluation
Two types of images, "Original" and "125% Zoomed," were used for evaluation. "Original" images were cropped to a central square based on the shorter edge of the original image and resized to 224 × 224. "125% Zoomed" images were cropped to a central square covering 80% of the shorter edge and resized to 224 × 224 (Figure 6).
The six models trained in each cross-validation set were combined into a single evaluation set, resulting in 24 evaluation sets. Predictions were conducted using both single-image-unit and case-unit approaches.
Single-image-unit prediction was performed on each image individually using both single-model and ensemble prediction methods. In single-model prediction, each image was classified using a single DNN model. In ensemble prediction, each image was classified by averaging the scores from 23 models selected from the 24 available models.
Case-unit evaluation was conducted using the following three calculation methods.
The evaluation flow is shown in Figure 7.
To assess variability across training runs, we calculated the mean accuracy of all models and the range between the lowest and highest values. Detailed results are provided in the Supplementary Materials (Figures S1–S4).
2.7. Continuity Analysis
This method determines whether a video was recorded before or after cholesteatoma removal based on the number of consecutive frames predicted as positive, indicating the presence of residual cholesteatoma.
2.8. Overall Positive Rate Analysis
This method determines whether a video was recorded before or after cholesteatoma removal based on the proportion of frames predicted as positive (cholesteatoma remaining) among all frames in the video.
2.9. Time Windows Positive Rate Analysis
In this method, the segment of consecutive frames within an evaluation time window (ranging from 1 to 30 seconds) with the highest positive rate is used as the representative portion of the video. The video is then classified as recorded before or after cholesteatoma removal. Videos shorter than the evaluation time window were excluded from the analysis.
Figure 6.
Image preparation for evaluation. Original images (before and after editing) and 125% zoomed images were generated by cropping the central 80% of the original frame and resizing to 224 × 224 pixels.
Figure 6.
Image preparation for evaluation. Original images (before and after editing) and 125% zoomed images were generated by cropping the central 80% of the original frame and resizing to 224 × 224 pixels.
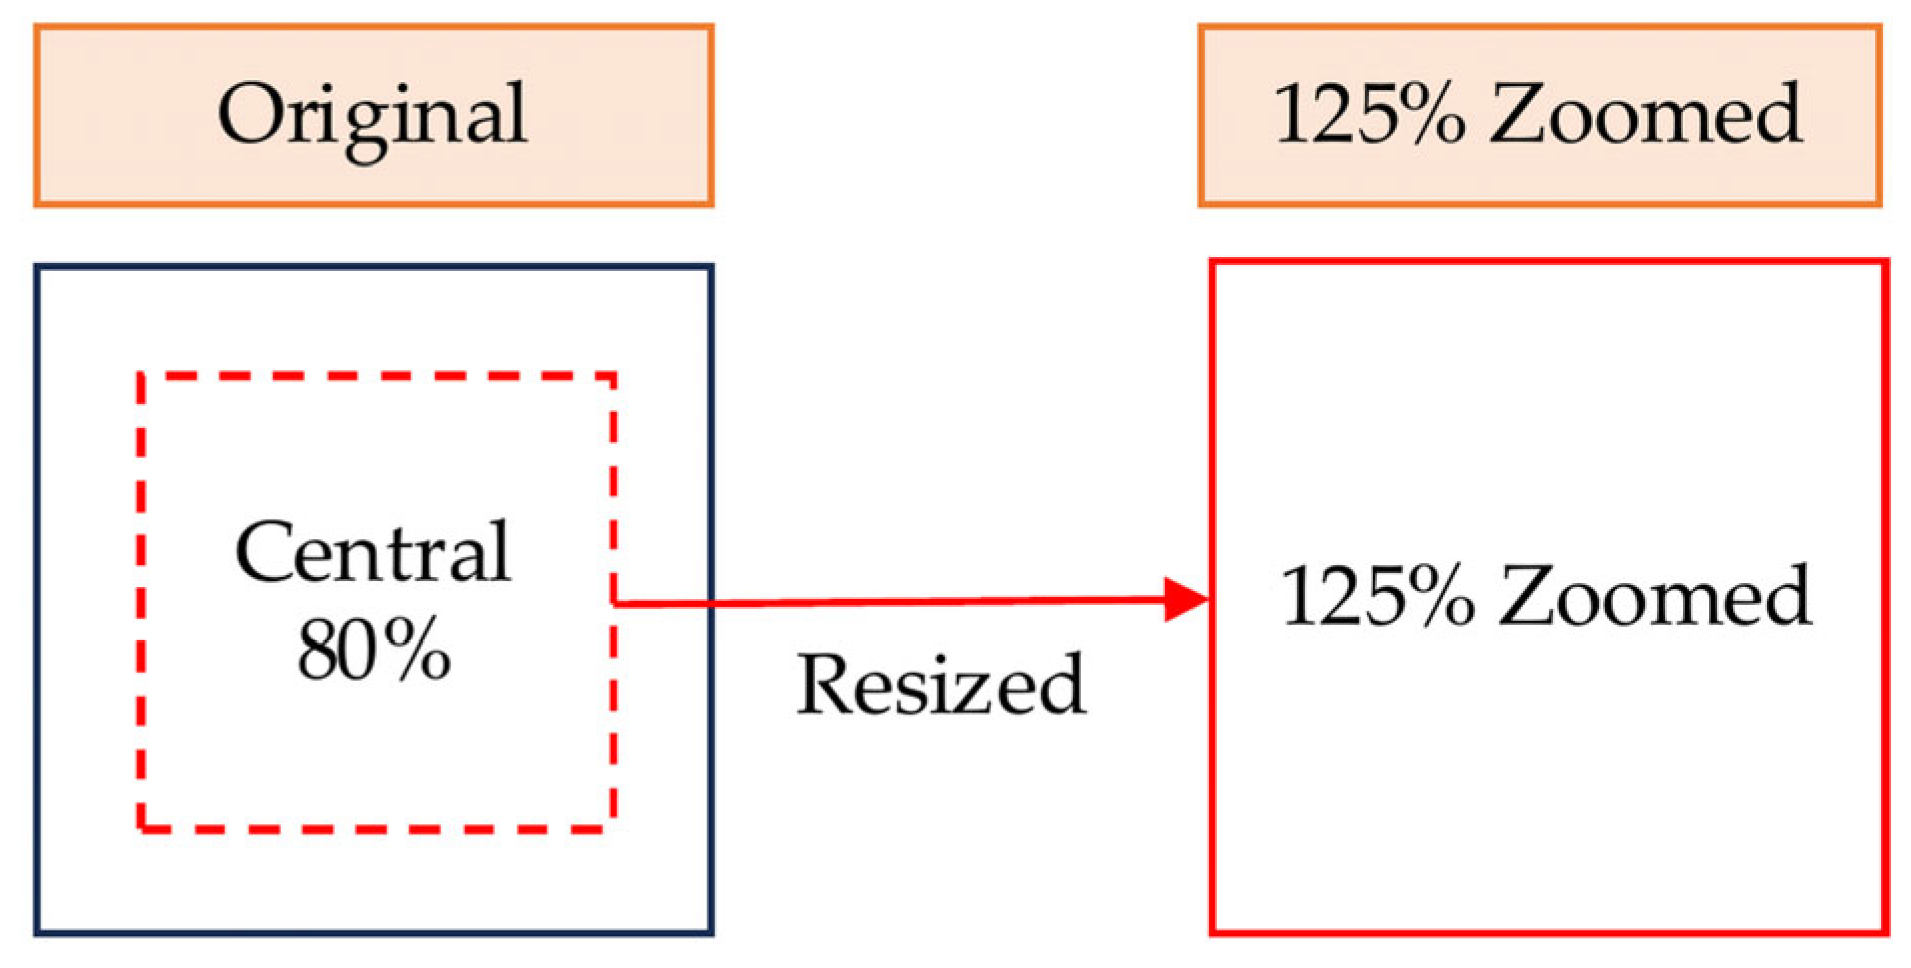
Figure 7.
Evaluation method using original and 125% zoomed images, with both single-model and ensemble predictions.
Figure 7.
Evaluation method using original and 125% zoomed images, with both single-model and ensemble predictions.
3. Results
3.1. Single-Image-Unit-Based Prediction
Table 4A presents the results of single-image-unit-based prediction on videos before editing.
For endoscopic videos, ensemble prediction with original-size images achieved the highest accuracy of 73.99%.
For microscopic videos, ensemble prediction with 125% zoomed images achieved the highest accuracy of 64.41%.
Table 4B presents the results of single-image-unit-based prediction on videos after editing.
For endoscopic videos, ensemble prediction with original-size images achieved the highest average sensitivity and specificity of 75.51%.
For microscopic videos, ensemble prediction with 125% zoomed images achieved the highest average sensitivity and specificity of 85.06%.
Table 4C presents the difference in average sensitivity and specificity between predictions before and after video editing.
For endoscopic videos, the difference was negligible.
For microscopic videos, ensemble prediction with both original-size and 125% zoomed images showed significant improvements after video editing.
3.2. Continuity Analysis
Table 5A presents the results of case-unit-based prediction using continuity analysis with the videos before editing.
For endoscopic videos, ensemble prediction using original-size images achieved the highest average sensitivity and specificity of 72.27%.
For microscopic videos, ensemble prediction using 125% zoomed images achieved the highest average sensitivity and specificity of 76.61%.
Table 5B presents the results of case-unit-based prediction using continuity analysis with the videos after editing.
For endoscopic videos, ensemble prediction using original-size images achieved the highest average sensitivity and specificity of 72.67%.
For microscopic videos, ensemble prediction using original-size images achieved the highest average sensitivity and specificity of 83.36%.
Table 5C presents the difference in the average sensitivity and specificity between predictions before and after video editing.
For endoscopic videos, the difference was minimal.
For microscopic videos, all predictions showed an improvement of more than 5% after video editing.
3.3. Overall Positive Rate Analysis
Table 6A presents the results of case-unit-based prediction using overall positive rate analysis with the videos before editing.
For endoscopic videos, ensemble prediction using original-size images achieved the highest average sensitivity and specificity of 81.02%.
For microscopic videos, ensemble prediction using 125% zoomed images achieved the highest average sensitivity and specificity of 81.80%.
Table 6B presents the results of case-unit-based prediction using overall positive rate analysis with the videos after editing.
For endoscopic videos, ensemble prediction using original-size images achieved the highest average sensitivity and specificity of 84.21%.
For microscopic videos, ensemble prediction using 125% zoomed images achieved the highest average sensitivity and specificity of 86.86%.
Table 6C presents the difference in the average sensitivity and specificity between predictions before and after video editing.
For endoscopic videos, all predictions showed an improvement of more than 3% after video editing.
For microscopic videos, all predictions showed an improvement of more than 5% after video editing.
3.4. Time Windows Positive Rate Analysis
Table 7A presents the results of case-unit-based prediction using time window positive rate analysis with the videos before editing.
For endoscopic videos, ensemble prediction using original-size images achieved the highest average sensitivity and specificity of 79.47% at a 30-second time window.
For microscopic videos, ensemble prediction using 125% zoomed images achieved the highest average sensitivity and specificity of 82.32% at 25- and 30-second time windows.
Table 7B presents the results of case-unit-based prediction using time window positive rate analysis with the videos after editing.
For endoscopic videos, ensemble prediction using original-size images achieved the highest average sensitivity and specificity of 84.68% at a 25-second time window.
For microscopic videos, ensemble prediction using original-size images achieved the highest average sensitivity and specificity of 85.70% at a 30-second time window.
Table 7C presents the difference in the average sensitivity and specificity between predictions before and after video editing.
For endoscopic videos, predictions at shorter time windows showed minimal improvement, whereas predictions at longer time windows improved significantly.
For microscopic videos, all predictions showed greater improvements.
Figure 8 presents the average sensitivity and specificity of ensemble predictions using original-size images, comparing results before and after video editing.
Figure 9 presents the average sensitivity and specificity of ensemble predictions using 125% zoomed images, comparing results before and after video editing. This section may be divided by subheadings. It should provide a concise and precise description of the experimental results, their interpretation, as well as the experimental conclusions that can be drawn.
4. Discussion
With the advent of artificial intelligence (AI), its applications in various medical fields are increasingly being explored. From assisting in endoscopic image diagnosis to aiding in the identification of pulmonary nodules and COVID-19 pneumonia on imaging, significant advancements have been made, particularly in the development of AI-powered medical devices for image-based diagnostics, such as endoscopy and CT scans. In particular, the field of gastrointestinal endoscopy, which has a high volume of cases, has made substantial progress in real-time AI-assisted diagnostic support during examinations [8].
Our previous AI research has demonstrated the feasibility of distinguishing inverted papilloma on endoscopic images and predicting the extent of middle ear cholesteatoma, achieving high diagnostic accuracy even with small sample sizes. The potential for AI to provide high-precision diagnostic support for rare cases holds promise for significantly transforming future clinical practices.
The primary treatment for cholesteatoma is surgery, but reports indicate a residual cholesteatoma rate of 11% and a recurrence rate of 8% within five years postoperatively [9], with long-term recurrence rates reaching approximately 20–30% [10]. Achieving prevention of recurrence during surgery remains critical. While complete removal along the cholesteatoma matrix can theoretically prevent residual lesions, inflammatory findings in infected cases often make this task challenging. Additionally, complete removal of all soft tissues, including the mastoid air cells, might prevent residual lesions but would impair postoperative re-aeration of the mastoid cavity [11].
If AI-based diagnostic support could be implemented during surgery, it might contribute to reducing recurrence rates while enabling the formation of well-aerated mastoid air cells, thus improving surgical outcomes.
In this study, the diagnostic accuracy for cholesteatoma (based on overall positive rate analysis) was approximately 80% for both endoscopic and microscopic images, indicating room for further improvement. Compared to endoscopic views, microscopic images often included non-lesion elements, such as bone or skin. To address this, the videos were edited and magnified to exclude non-lesion areas and to center the lesion within the image for training. In contrast, most endoscopic videos already focused on the lesion, requiring minimal to no editing.
As a result, while the diagnostic accuracy improved for both modalities, the improvement was more significant for microscopic images. This can be attributed to the fact that lesions in microscopic images were often located in distal regions within the frame, and magnification allowed the AI model to learn from images that focused solely on the lesion, leading to enhanced accuracy. This is consistent with the results observed when comparing Figure 3 and Figure 4, where the improvement in the average sensitivity and specificity of unedited microscopic videos became more pronounced with longer unit times. The limited improvement in edited microscopic videos may be due to excessive magnification, which could have made it difficult to distinguish the lesion’s contours and its relationship with the surrounding structures. The improvement in endoscopic diagnostic accuracy, despite minimal modifications to the original images, may be explained by the AI model being trained on both endoscopic and microscopic data. The inclusion of edited microscopic images in the training dataset likely contributed to the improvement in endoscopic performance as well.
When performing lesion detection with AI, trimming and centering the lesion in the training data may enhance diagnostic accuracy. Previous studies have reported that AI models tend to perform poorly in detecting distal lesions within an image [12] or may focus on non-target areas during training [13], highlighting the need for ingenuity in training datasets. Furthermore, some studies have shown that AI can accurately recognize lesions even in the presence of surgical instruments [14,15]. Although we minimized the inclusion of surgical instruments in our videos for this study, their presence might have had minimal impact on the results.
We re-examined the cases with diagnostic accuracy below 10% in this study (see Supplementary Tables S4–S7). In false-negative cases, some involved surgical fields with significant bleeding that obscured the margins, whereas others reflected very thin residual epithelium; importantly, no obvious volumetric cholesteatoma lesions were overlooked. In false-positive cases, some also involved bleeding fields, while others appeared to show no apparent lesion; however, it was difficult to confidently exclude the absence of disease based on limited frames. The exclusion of lesions in these cases was supported by the absence of recurrence during a follow-up period of more than two years, yet it remains challenging to rule out disease with certainty from restricted video information alone. As surgeons, we do not rely on a single frame; instead, we incorporate tactile feedback and the overall intraoperative progression to determine whether residual cholesteatoma is present, thereby achieving greater diagnostic accuracy. By contrast, AI depends solely on visual information from the video, and thus cases that are visually ambiguous to clinicians may also be difficult for AI to classify correctly. These findings suggest that incorporating temporal continuity and multimodal intraoperative information may further improve diagnostic performance in future model development.
Time windows positive rate analysis showed that diagnostic accuracy improved with longer video durations. This is likely because longer videos provide the AI with more opportunities to analyze the cholesteatoma from various angles, enabling more accurate diagnosis. Since the videos were originally recorded for surgical purposes rather than for lesion diagnosis, the lesion's position within the frame varied across videos. In gastrointestinal endoscopy, where AI-assisted diagnosis has been more widely implemented, the accuracy and reliability of diagnosis have been shown to improve when the operator adjusts the focus and angle to better observe the lesion, a process that depends on the operator’s skill [16].
When using AI for intraoperative diagnosis, it may be possible to enhance diagnostic accuracy by using magnification to observe the lesion with a microscope or by utilizing an endoscope for deep or angled regions. Interestingly, in the development of the AI model for this study, we found that diagnostic accuracy was higher when both endoscopic and microscopic data were used for training and diagnosis, compared to when each modality was trained and tested separately. While it was initially assumed that separating endoscopic and microscopic data would facilitate better AI training by simplifying the learning process [17], the opposite result was observed, highlighting an interesting finding.
Previous studies have reported AI applications for cholesteatoma mucosal lesions using static endoscopic images [6], but this study is the first to focus on surgical videos and to integrate both endoscopic and microscopic perspectives, and to evaluate performance without manual annotation. As the era of robotic surgery advances, the incorporation of AI during surgery is inevitable. Research on AI systems that enhance the safety and precision of surgical procedures is crucial.
This study has several limitations. First, the sample size was relatively small. However, given the rarity of cholesteatoma compared to the large case volumes in gastrointestinal endoscopy, the AI model used in this study may be particularly valuable for similarly rare diseases. Second, instead of static images, the model was trained using segmented surgical videos, which frequently included bleeding scenes. Although the videos did not exclusively focus on cholesteatoma, this likely provided a closer approximation to real intraoperative conditions, since middle ear surgeries almost always involve some degree of bleeding. Third, this study should be regarded as a proof-of-concept investigation. It should also be noted that the present results are not directly comparable with those of previous studies, as differences in datasets, methodologies, and evaluation criteria make straightforward comparisons difficult. Instead, our findings should be interpreted as exploratory, proof-of-concept evidence that clarifies technical requirements for future clinical systems. It does not directly establish a real-time intraoperative system; rather, it demonstrates under controlled conditions that pretrained convolutional models can distinguish cholesteatoma from normal mucosa, thereby providing foundational evidence that may contribute to the future development of real-time intraoperative support. Fourth, although this study did not include a direct comparison between the model’s performance and the diagnostic accuracy of experienced surgeons, we recognize that such analyses would be useful for validating the clinical relevance of the system and represent an important direction for future research. At the same time, the present findings suggest that AI support may help reduce the risk of overlooked lesions and serve as a valuable aid for a wide range of surgeons. Therefore, future studies should focus on verifying the generalizability of these findings through multi-institutional collaborations, with direct comparisons to established diagnostic benchmarks and clinical expertise considered within future validation efforts.
In addition, the present study employed a large ensemble of models as an experimental strategy to stabilize performance under limited data conditions. Such an approach is not clinically feasible, and future work will require the development of robust single models trained on larger multi-institutional datasets. Furthermore, real-time processing capability and seamless integration into the surgical workflow represent essential technical hurdles that must be overcome before this system can be applied intraoperatively.
Taken together, we believe this proof-of-concept study offers insights into the potential of AI-equipped video systems to support intraoperative detection of residual cholesteatoma and lays the groundwork for their future clinical application.
5. Conclusions
We developed an AI model to diagnose cholesteatoma from intraoperative videos, achieving a certain level of diagnostic accuracy with both endoscopic and microscopic images. This proof-of-concept study provides preliminary evidence that AI-assisted detection of residual cholesteatoma during surgery is feasible and may inform future clinical applications.
Supplementary Materials
The following supporting information can be downloaded at the website of this paper posted on Preprints.org: Table S1: title; Summary of Patient Data; Table S2: Age and Gender Distribution (Extended); Table S3: Video Duration and Frame Count (Before and After Editing); Table S4: MobileNetV2 Network Structure Figure S1: Image-level Accuracy (Before and After Editing) Figure S2: Continuity-based Accuracy (Before and After Editing) Figure S3: Overall Positive Rate Accuracy (Before and After Editing) Figure S4: 30-second Window Positive Rate Accuracy (Before and After Editing) Table S5: Model Performance by Cholesteatoma ES; Table S6: Model Performance by Non-Cholesteatoma ES; Table S7: Model Performance by Cholesteatoma MS; Table S8: Model Performance by Non-Cholesteatoma MS.
Author Contributions
Conceptualization: Miyazawa, Takahashi, Noda; Methodology: Miyazawa, Takahashi, Noda; Formal analysis: Miyazawa, Noda; Data curation: Miyazawa, Noda; Writing—original draft: Miyazawa, Noda; Writing—review & editing: All authors; Supervision: Kojima.
Funding
This study was supported by the Japan Society for the Promotion of Science (JSPS) KAKENHI (grant number 22K16936).
Institutional Review Board Statement
The study protocol was approved by the Human Ethics Review Committee of Jikei University School of Medicine, Tokyo, Japan (approval number: 32-036 [10111]), and all methods were performed in accordance with the Declaration of Helsinki and relevant institutional guidelines.
Informed Consent Statement
The requirement for informed consent was waived by the ethics committee owing to the retrospective nature of the study.
Data Availability Statement
The de-identified demographic data (age and sex distributions), summarized case assignments, video duration/frame-count distributions, and AI model performance metrics are provided in the Supplementary Materials. The raw surgical video files and detailed preprocessing/analysis protocols are not publicly available owing to patient privacy and proprietary considerations. Additional de-identified data beyond those included in the Supplementary Materials are available from the corresponding author (takahashima@jikei.ac.jp) upon reasonable request and subject to appropriate data-sharing agreements. Data will be accessible upon publication.
Acknowledgments
During the preparation of this manuscript, the authors used ChatGPT (OpenAI GPT-4, March 14 2025 version) for English language editing. The authors have reviewed and edited the output and take full responsibility for the content of this publication.
Conflicts of Interest
The authors declare no conflicts of interest directly relevant to the content of this article.
References
- Ghosh Moulic, A.; Gaurkar, S.S.; Deshmukh, P.T. Artificial Intelligence in Otology, Rhinology, and Laryngology: A Narrative Review of Its Current and Evolving Picture. Cureus 2024, 16, e66036. [Google Scholar] [CrossRef] [PubMed]
- King, A.; Fowler, G.E.; Macefield, R.C.; Walker, H.; Thomas, C.; Markar, S.; Higgins, E.; Blazeby, J.M.; Blencowe, N.S. Use of Artificial Intelligence in the Analysis of Digital Videos of Invasive Surgical Procedures: Scoping Review. BJS Open 2025, 9, zraf073. [Google Scholar] [CrossRef] [PubMed]
- Bidwell, J.; Gyawali, D.; Morse, J.; Ganeshan, V.; Nguyen, T.; McCoul, E.D. Real-Time Augmentation of Diagnostic Nasal Endoscopy Video Using AI-Enabled Edge Computing. Int. Forum Allergy Rhinol. 2025, 15, 191–194. [Google Scholar] [CrossRef] [PubMed]
- Koyama, H.; Kashio, A.; Yamasoba, T. Application of Artificial Intelligence in Otology: Past, Present, and Future. J. Clin. Med. 2024, 13, 7577. [Google Scholar] [CrossRef] [PubMed]
- Tseng, C.C.; Lim, V.; Jyung, R.W. Use of Artificial Intelligence for the Diagnosis of Cholesteatoma. Laryngoscope Investig. Otolaryngol. 2023, 8, 201–211. [Google Scholar] [CrossRef] [PubMed]
- Miwa, T.; Minoda, R.; Yamaguchi, T.; Kita, S.-I.; Osaka, K.; Takeda, H.; Kanemaru, S.-I.; Omori, K. Application of Artificial Intelligence Using a Convolutional Neural Network for Detecting Cholesteatoma in Endoscopic Enhanced Images. Auris. Nasus. Larynx 2022, 49, 11–17. [Google Scholar] [CrossRef] [PubMed]
- Habib, A.-R.; Xu, Y.; Bock, K.; Mohanty, S.; Sederholm, T.; Weeks, W.B.; Dodhia, R.; Ferres, J.L.; Perry, C.; Sacks, R.; et al. Evaluating the Generalizability of Deep Learning Image Classification Algorithms to Detect Middle Ear Disease Using Otoscopy. Sci. Rep. 2023, 13, 5368. [Google Scholar] [CrossRef] [PubMed]
- Takahashi, Y.; Sone, K.; Noda, K.; Yoshida, K.; Toyohara, Y.; Kato, K.; Inoue, F.; Kukita, A.; Taguchi, A.; Nishida, H.; et al. Automated System for Diagnosing Endometrial Cancer by Adopting Deep-Learning Technology in Hysteroscopy. PLOS ONE 2021, 16, e0248526. [Google Scholar] [CrossRef] [PubMed]
- Messmann, H.; Bisschops, R.; Antonelli, G.; Libânio, D.; Sinonquel, P.; Abdelrahim, M.; Ahmad, O.F.; Areia, M.; Bergman, J.J.G.H.M.; Bhandari, P.; et al. Expected Value of Artificial Intelligence in Gastrointestinal Endoscopy: European Society of Gastrointestinal Endoscopy (ESGE) Position Statement. Endoscopy 2022, 54, 1211–1231. [Google Scholar] [CrossRef] [PubMed]
- James, A.L.; Tono, T.; Cohen, M.S.; Iyer, A.; Cooke, L.; Morita, Y.; Matsuda, K.; Yamamoto, Y.; Sakagami, M.; Yung, M. International Collaborative Assessment of the Validity of the EAONO-JOS Cholesteatoma Staging System. Otol. Neurotol. Off. Publ. Am. Otol. Soc. Am. Neurotol. Soc. Eur. Acad. Otol. Neurotol. 2019, 40, 630–637. [Google Scholar] [CrossRef] [PubMed]
- Hashimoto-Ikehara, M.; Mishiro, Y.; Kitahara, T.; Sakagami, M. The 10-Year Disease-Free Rate of Attic Cholesteatoma Based on a New Staging System. J. Int. Adv. Otol. 2011, 7, 289–292. [Google Scholar]
- Kwon, O.J.; Sung, J.M.; Jung, H.K.; Kim, C.W. Postoperative Mastoid Aeration Following Canal Wall Up Mastoidectomy According to Preoperative Middle Ear Disease: Analysis of Temporal Bone Computed Tomography Scans. J. Audiol. Otol. 2017, 21, 140–145. [Google Scholar] [CrossRef] [PubMed]
- Yamada, M.; Saito, Y.; Imaoka, H.; Saiko, M.; Yamada, S.; Kondo, H.; Takamaru, H.; Sakamoto, T.; Sese, J.; Kuchiba, A.; et al. Development of a Real-Time Endoscopic Image Diagnosis Support System Using Deep Learning Technology in Colonoscopy. Sci. Rep. 2019, 9, 14465. [Google Scholar] [CrossRef] [PubMed]
- Chen, P.-H.C.; Liu, Y.; Peng, L. How to Develop Machine Learning Models for Healthcare. Nat. Mater. 2019, 18, 410–414. [Google Scholar] [CrossRef] [PubMed]
- Wang, B.; Zheng, J.; Yu, J.-F.; Lin, S.-Y.; Yan, S.-Y.; Zhang, L.-Y.; Wang, S.-S.; Cai, S.-J.; Abdelhamid Ahmed, A.H.; Lin, L.-Q.; et al. Development of Artificial Intelligence for Parathyroid Recognition During Endoscopic Thyroid Surgery. The Laryngoscope 2022, 132, 2516–2523. [Google Scholar] [CrossRef] [PubMed]
- Kitaguchi, D.; Harai, Y.; Kosugi, N.; Hayashi, K.; Kojima, S.; Ishikawa, Y.; Yamada, A.; Hasegawa, H.; Takeshita, N.; Ito, M. Artificial Intelligence for the Recognition of Key Anatomical Structures in Laparoscopic Colorectal Surgery. Br. J. Surg. 2023, 110, 1355–1358. [Google Scholar] [CrossRef] [PubMed]
- Byrne, M.F.; Chapados, N.; Soudan, F.; Oertel, C.; Linares Pérez, M.; Kelly, R.; Iqbal, N.; Chandelier, F.; Rex, D.K. Real-Time Differentiation of Adenomatous and Hyperplastic Diminutive Colorectal Polyps during Analysis of Unaltered Videos of Standard Colonoscopy Using a Deep Learning Model. Gut 2019, 68, 94–100. [Google Scholar] [CrossRef] [PubMed]
- Miotto, R.; Wang, F.; Wang, S.; Jiang, X.; Dudley, J.T. Deep Learning for Healthcare: Review, Opportunities and Challenges. Brief. Bioinform. 2018, 19, 1236–1246. [Google Scholar] [CrossRef] [PubMed]
Figure 1.
Representative intraoperative images used for AI training. Endoscopic (ES) and microscopic (MS) views of cholesteatoma and non-cholesteatoma cases are shown.
Figure 1.
Representative intraoperative images used for AI training. Endoscopic (ES) and microscopic (MS) views of cholesteatoma and non-cholesteatoma cases are shown.
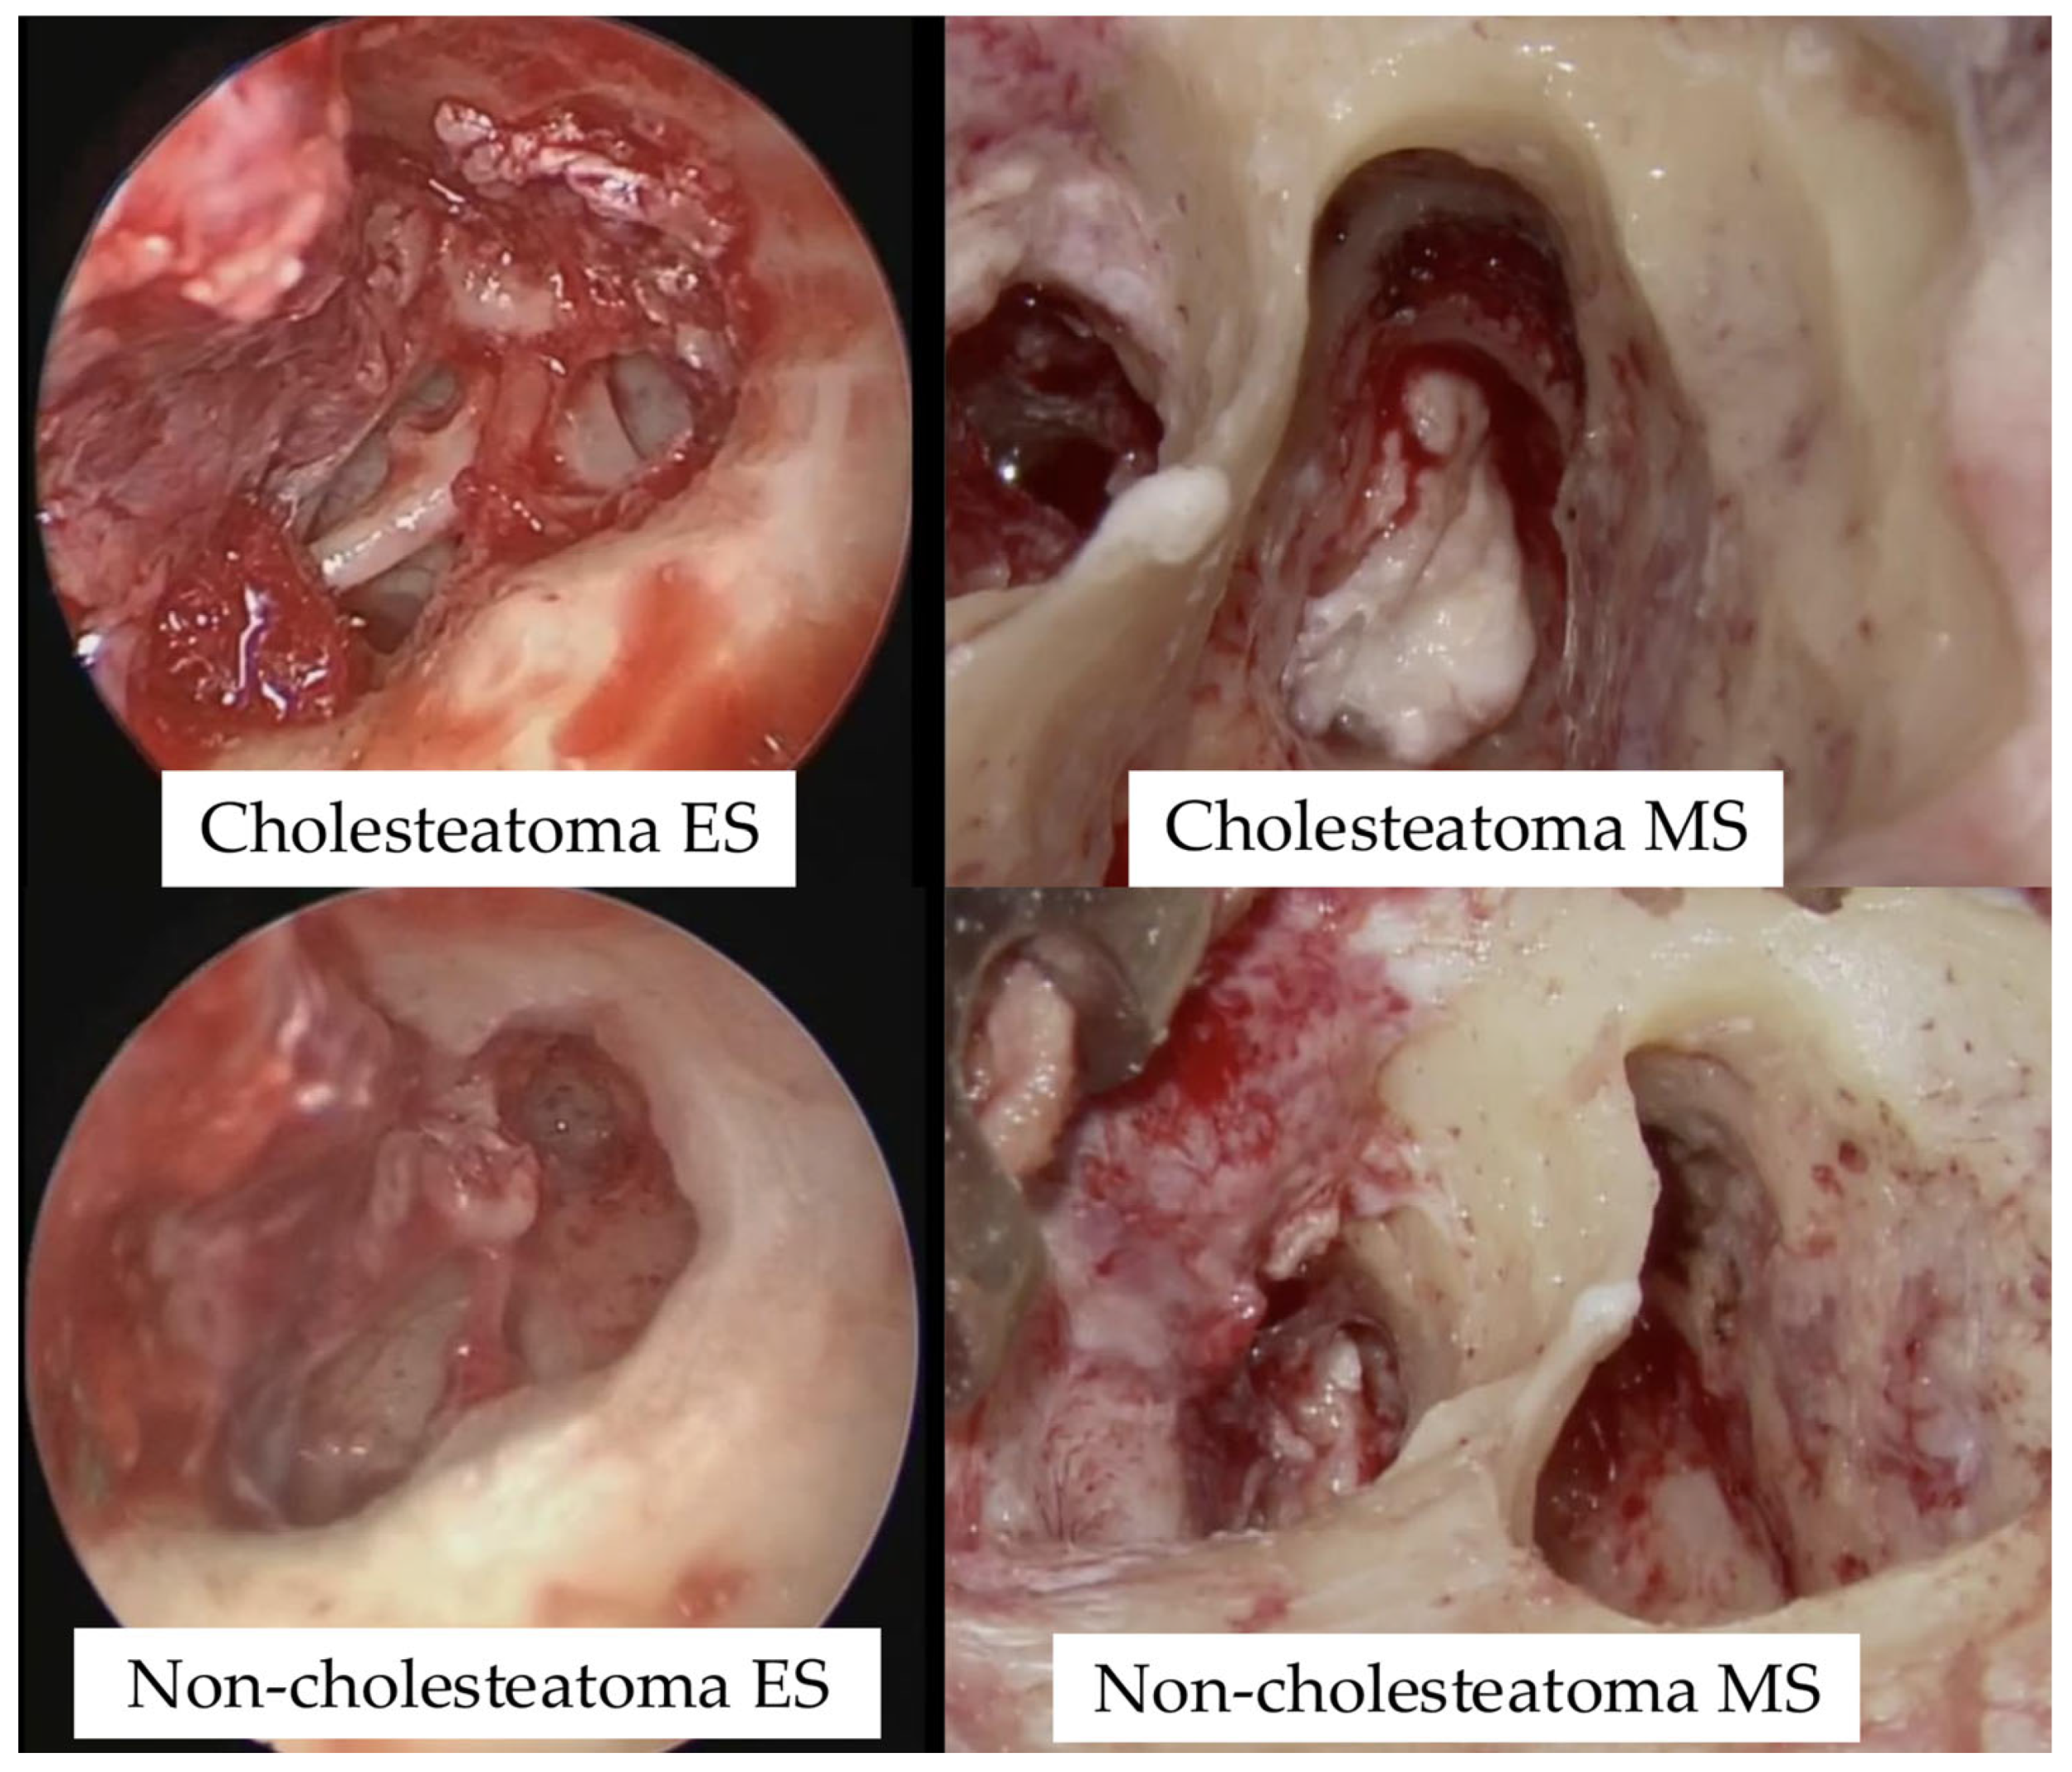
Figure 2.
Representative example of image editing for AI training. Original intraoperative images before editing (left) and after editing (right). In the After Model, non-lesion areas such as skin and surgical instruments were trimmed to focus on the lesion.
Figure 2.
Representative example of image editing for AI training. Original intraoperative images before editing (left) and after editing (right). In the After Model, non-lesion areas such as skin and surgical instruments were trimmed to focus on the lesion.
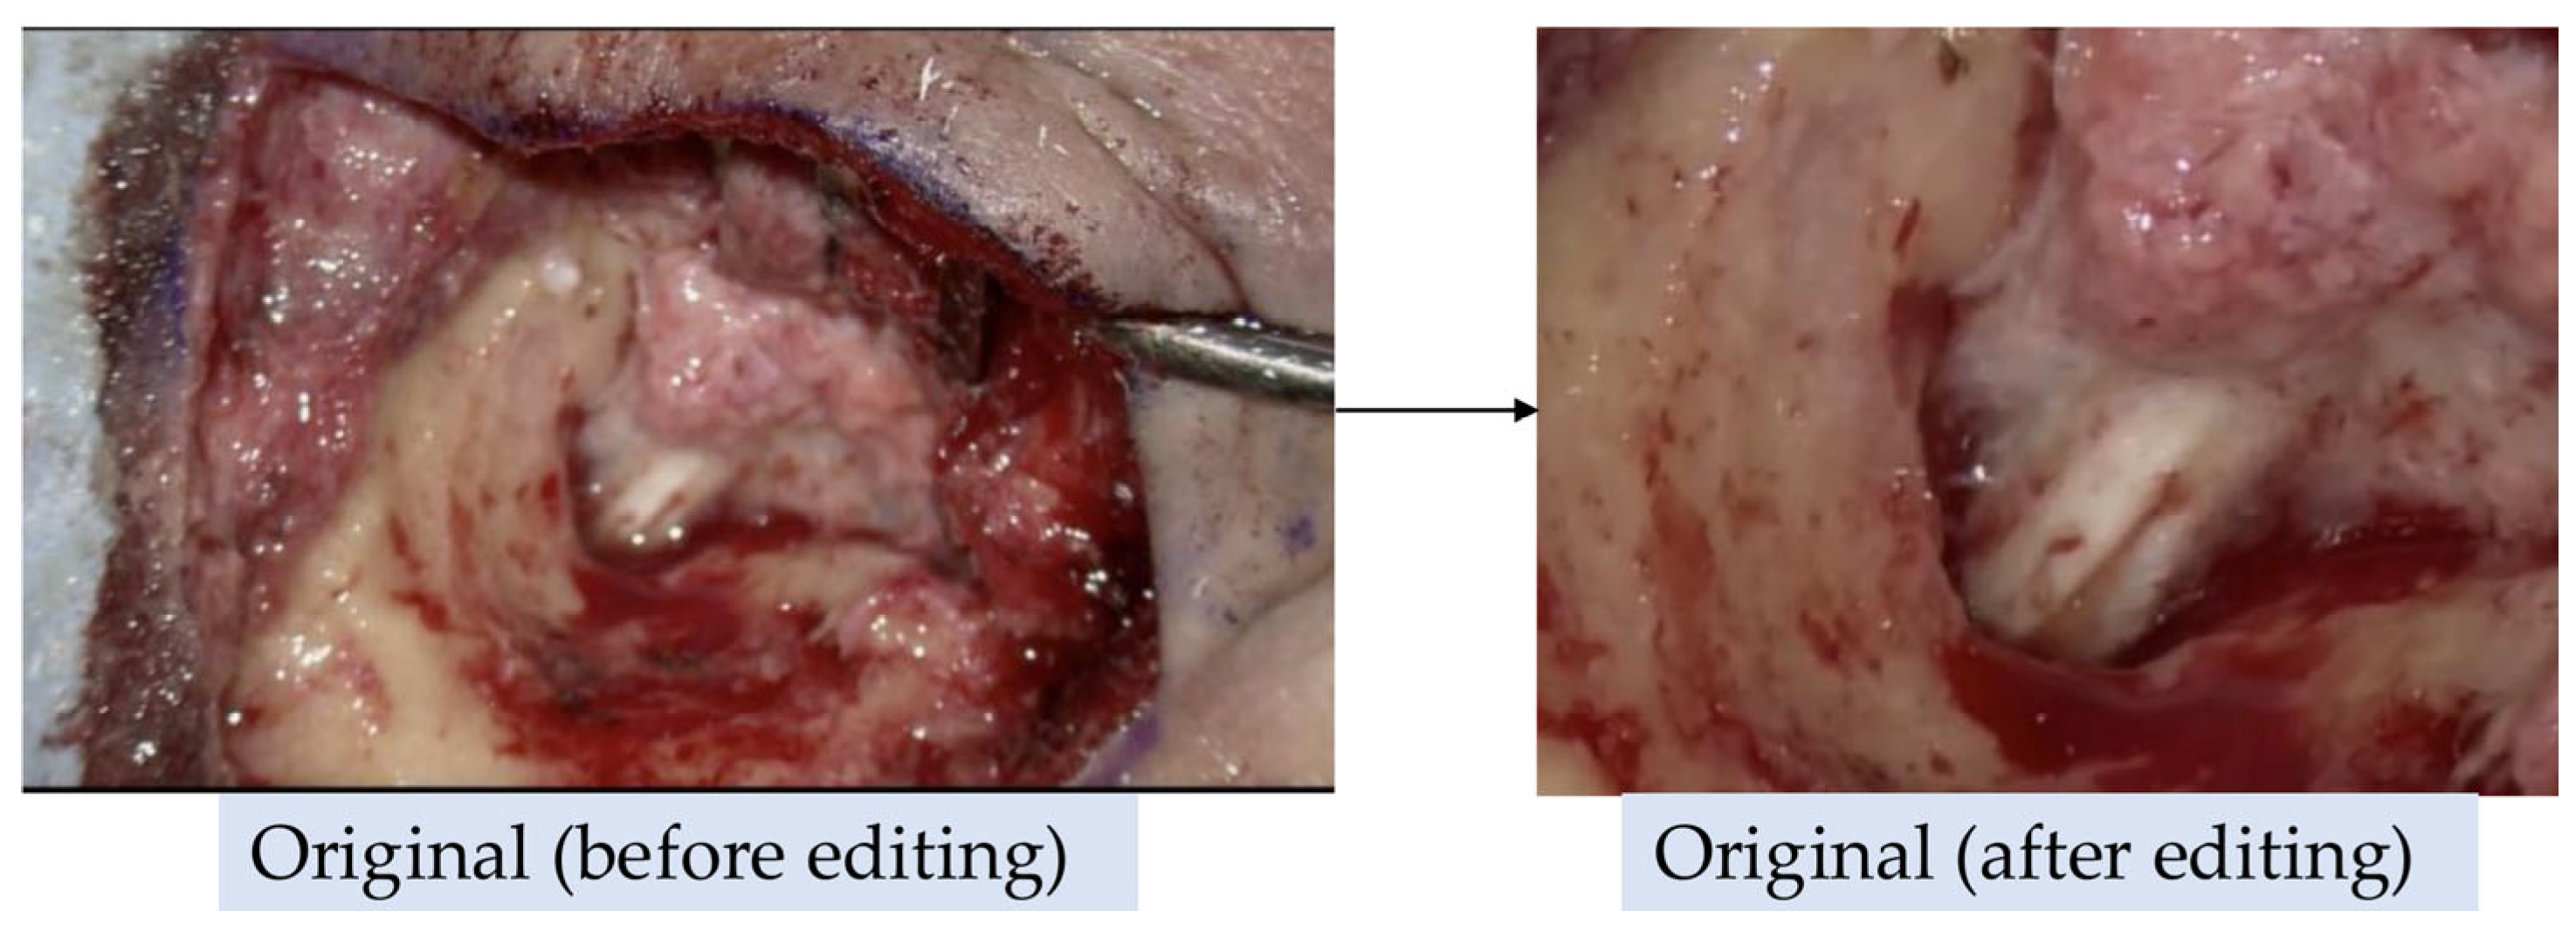
Figure 3.
A. The distribution of cases across groups categorized by video duration before editing.
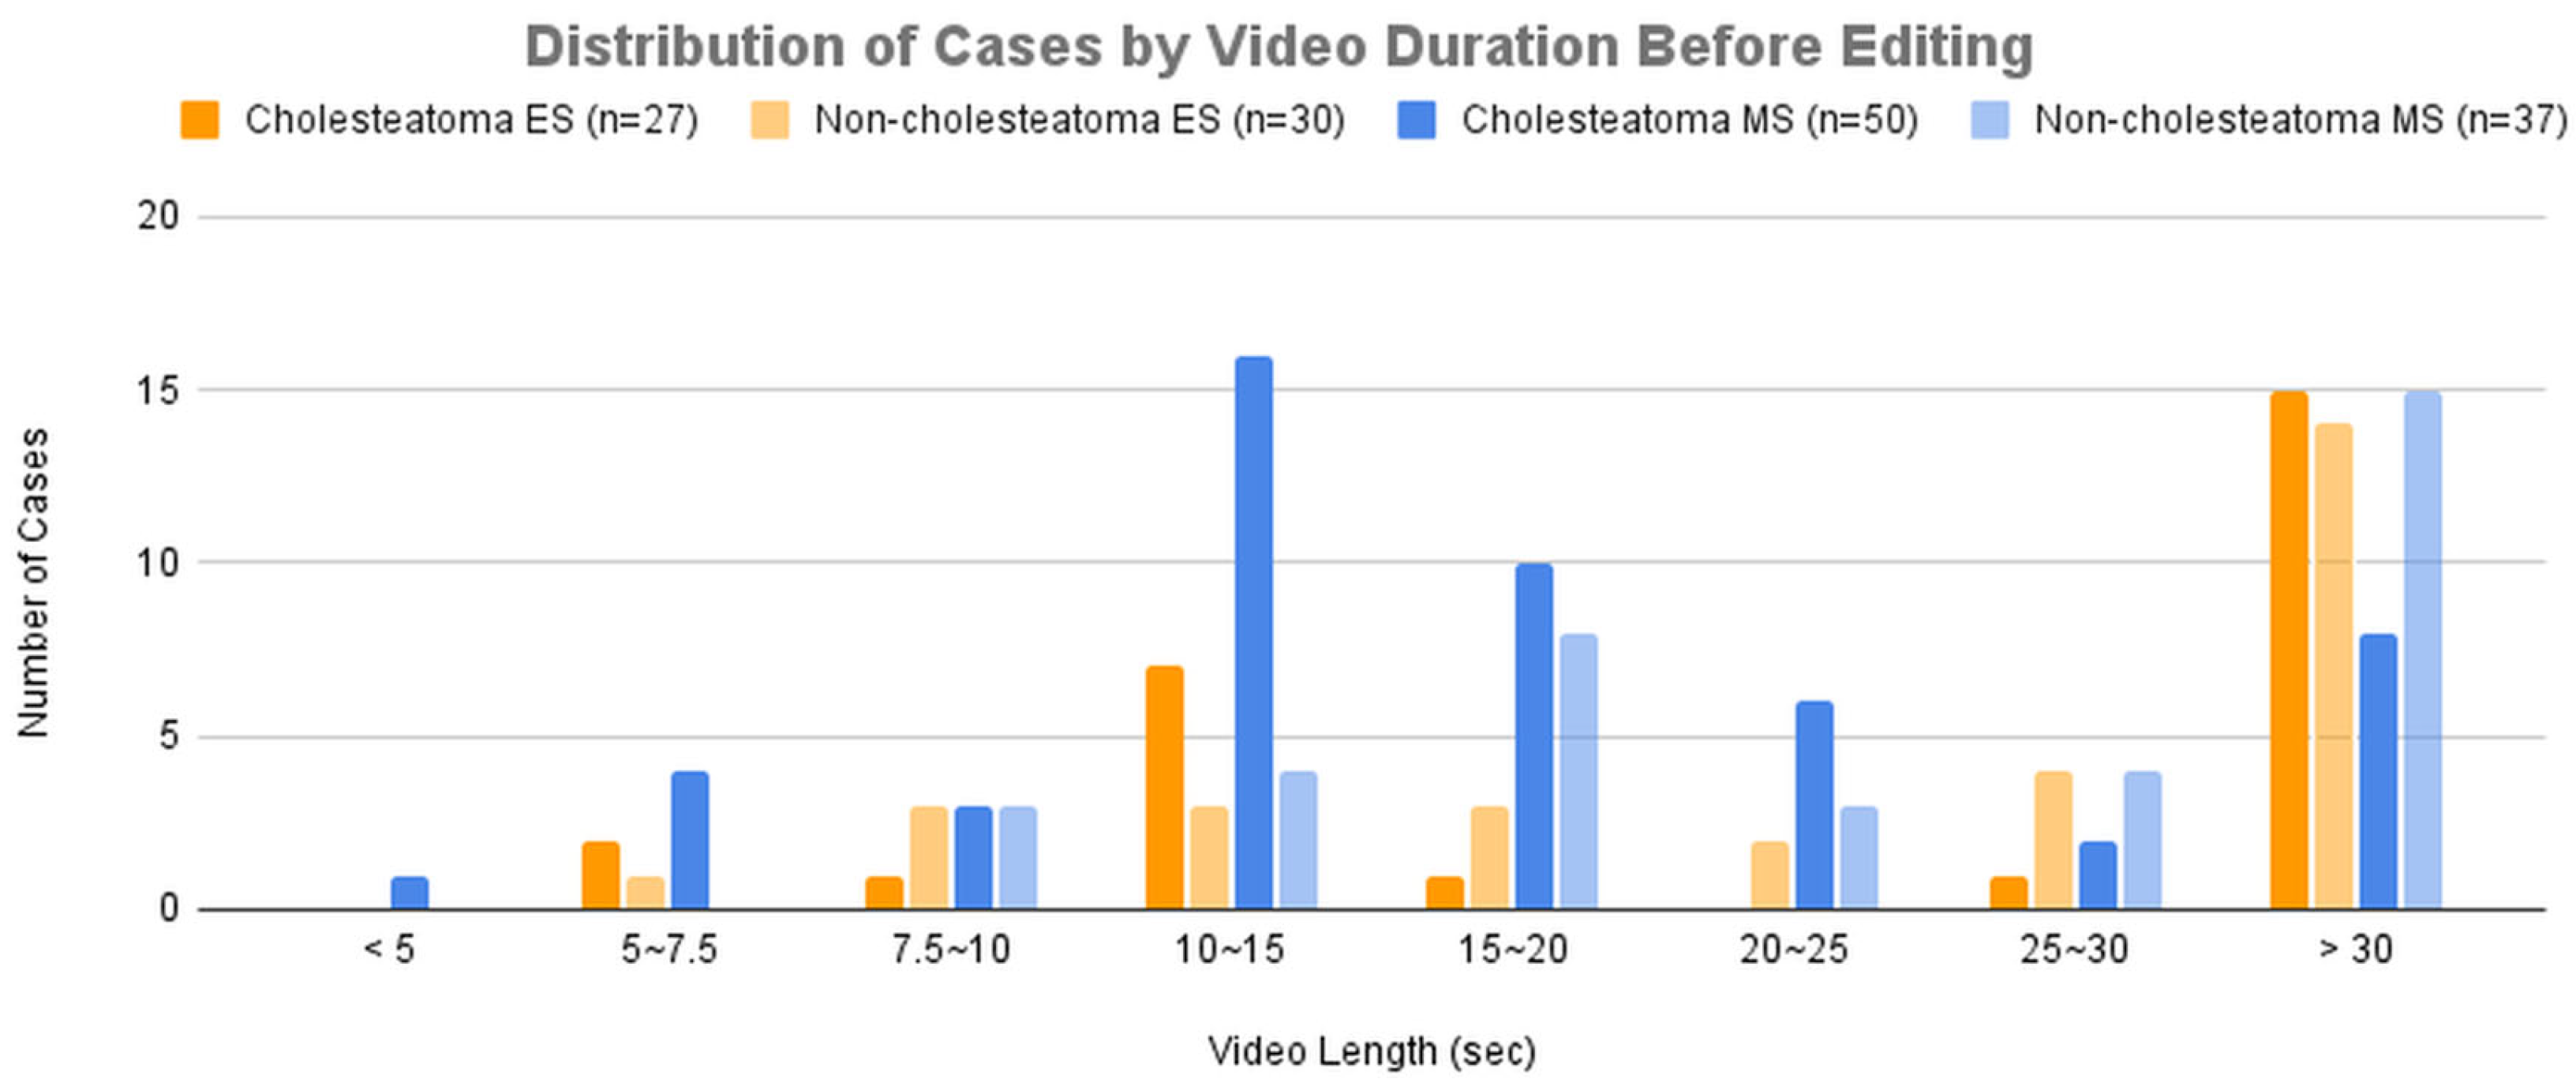
Figure 3.
B. The distribution of cases across groups categorized by video duration after editing.
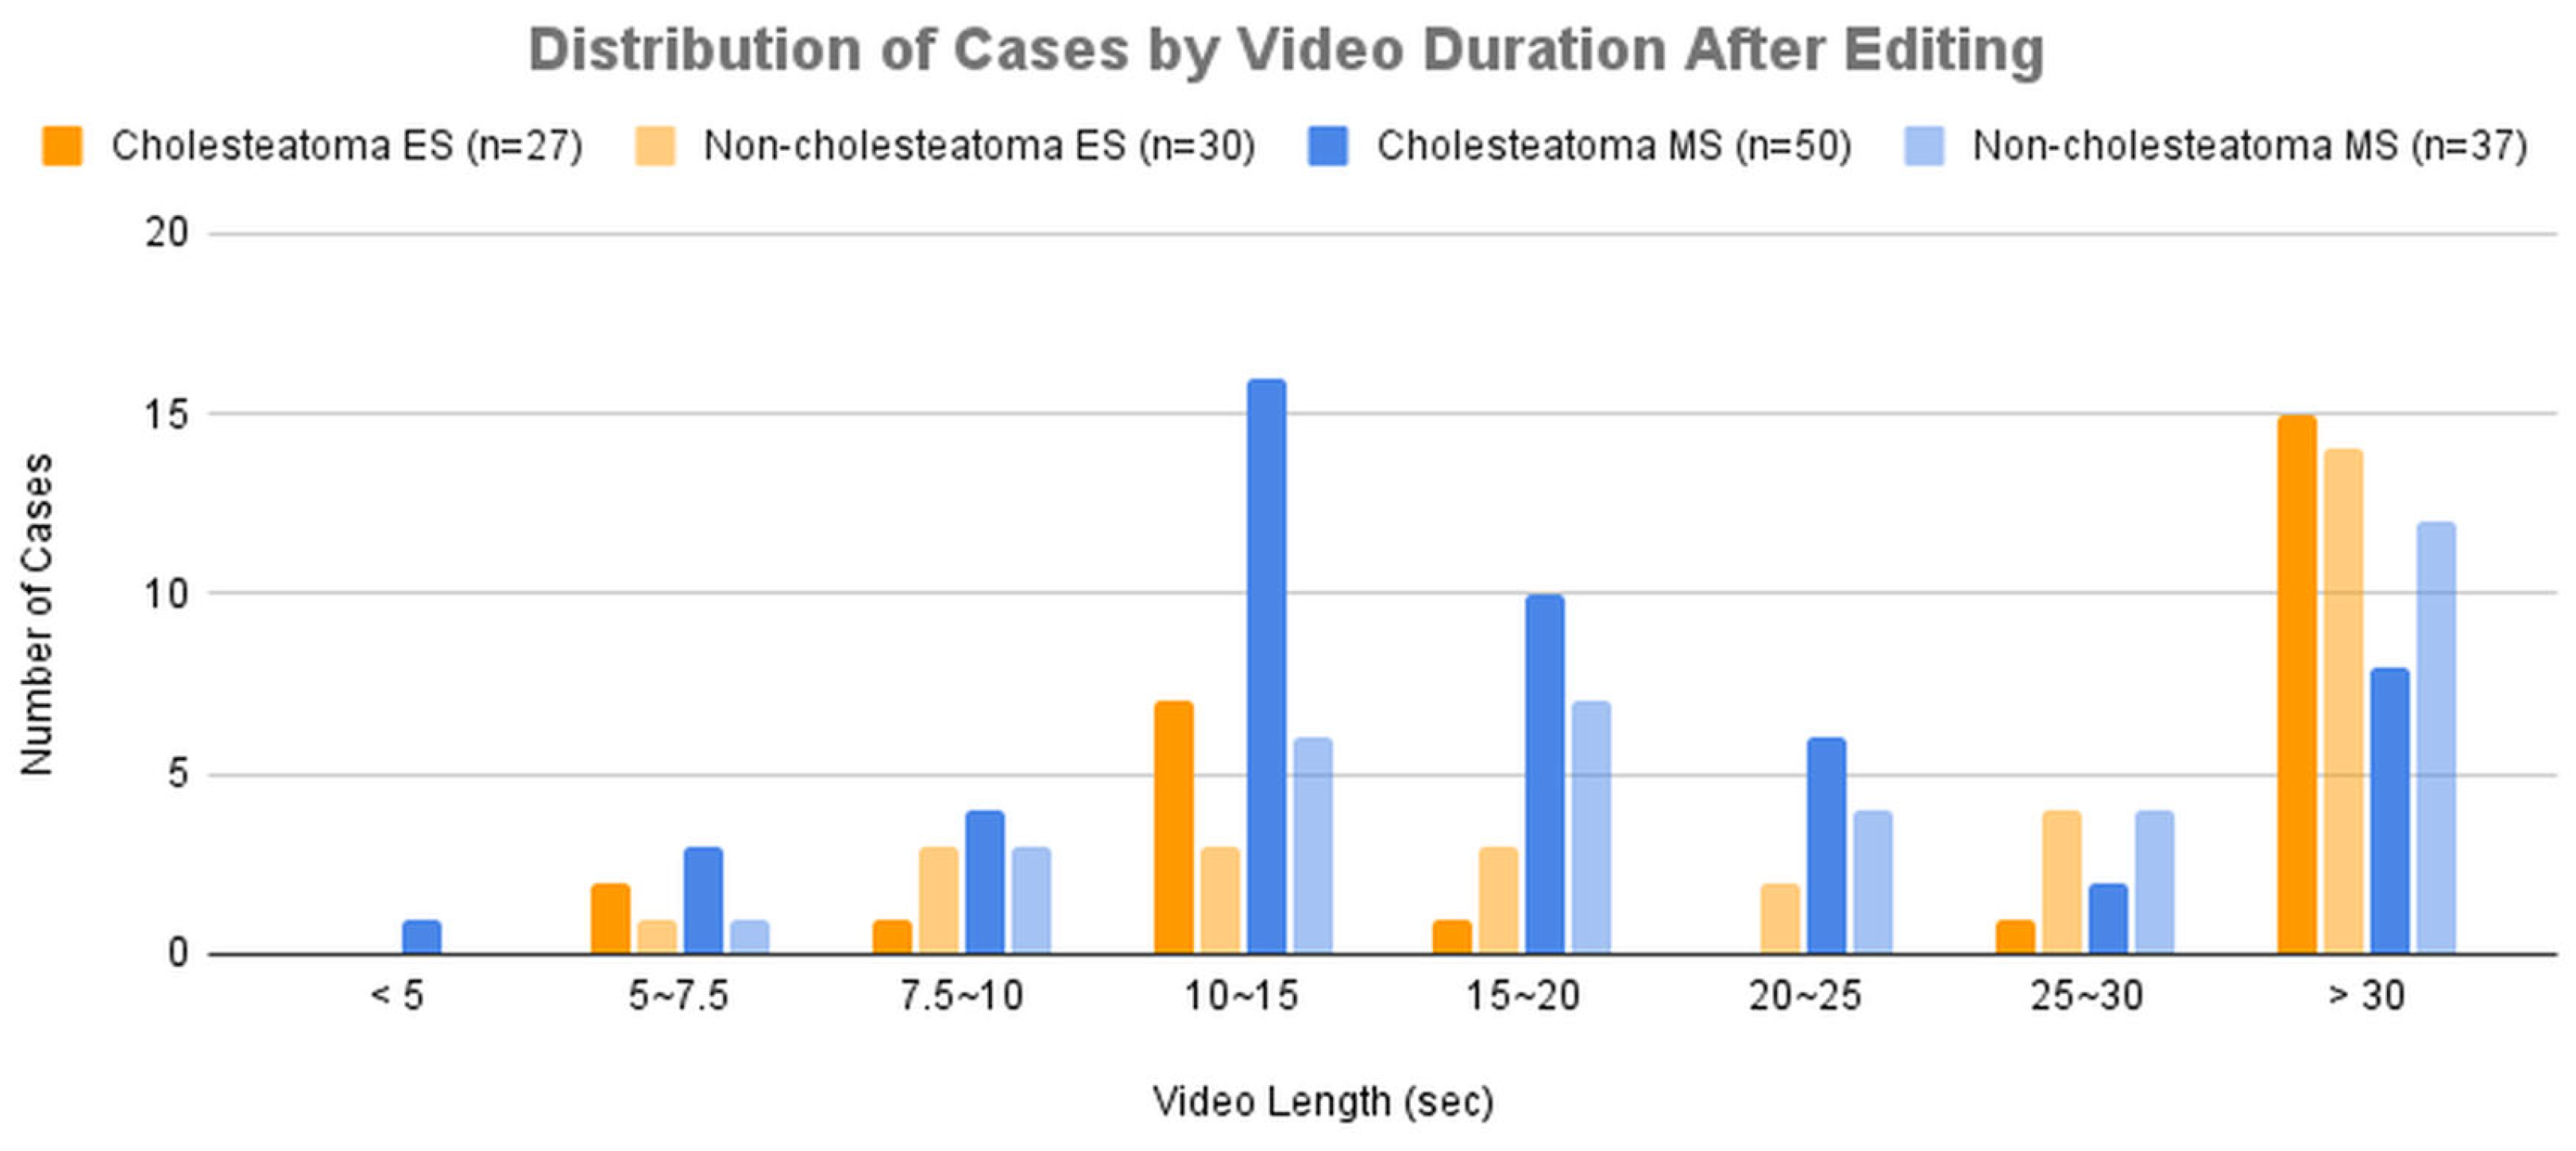
Figure 4.
A. The distribution of cases across groups categorized by total frame count before editing.
Figure 4.
A. The distribution of cases across groups categorized by total frame count before editing.
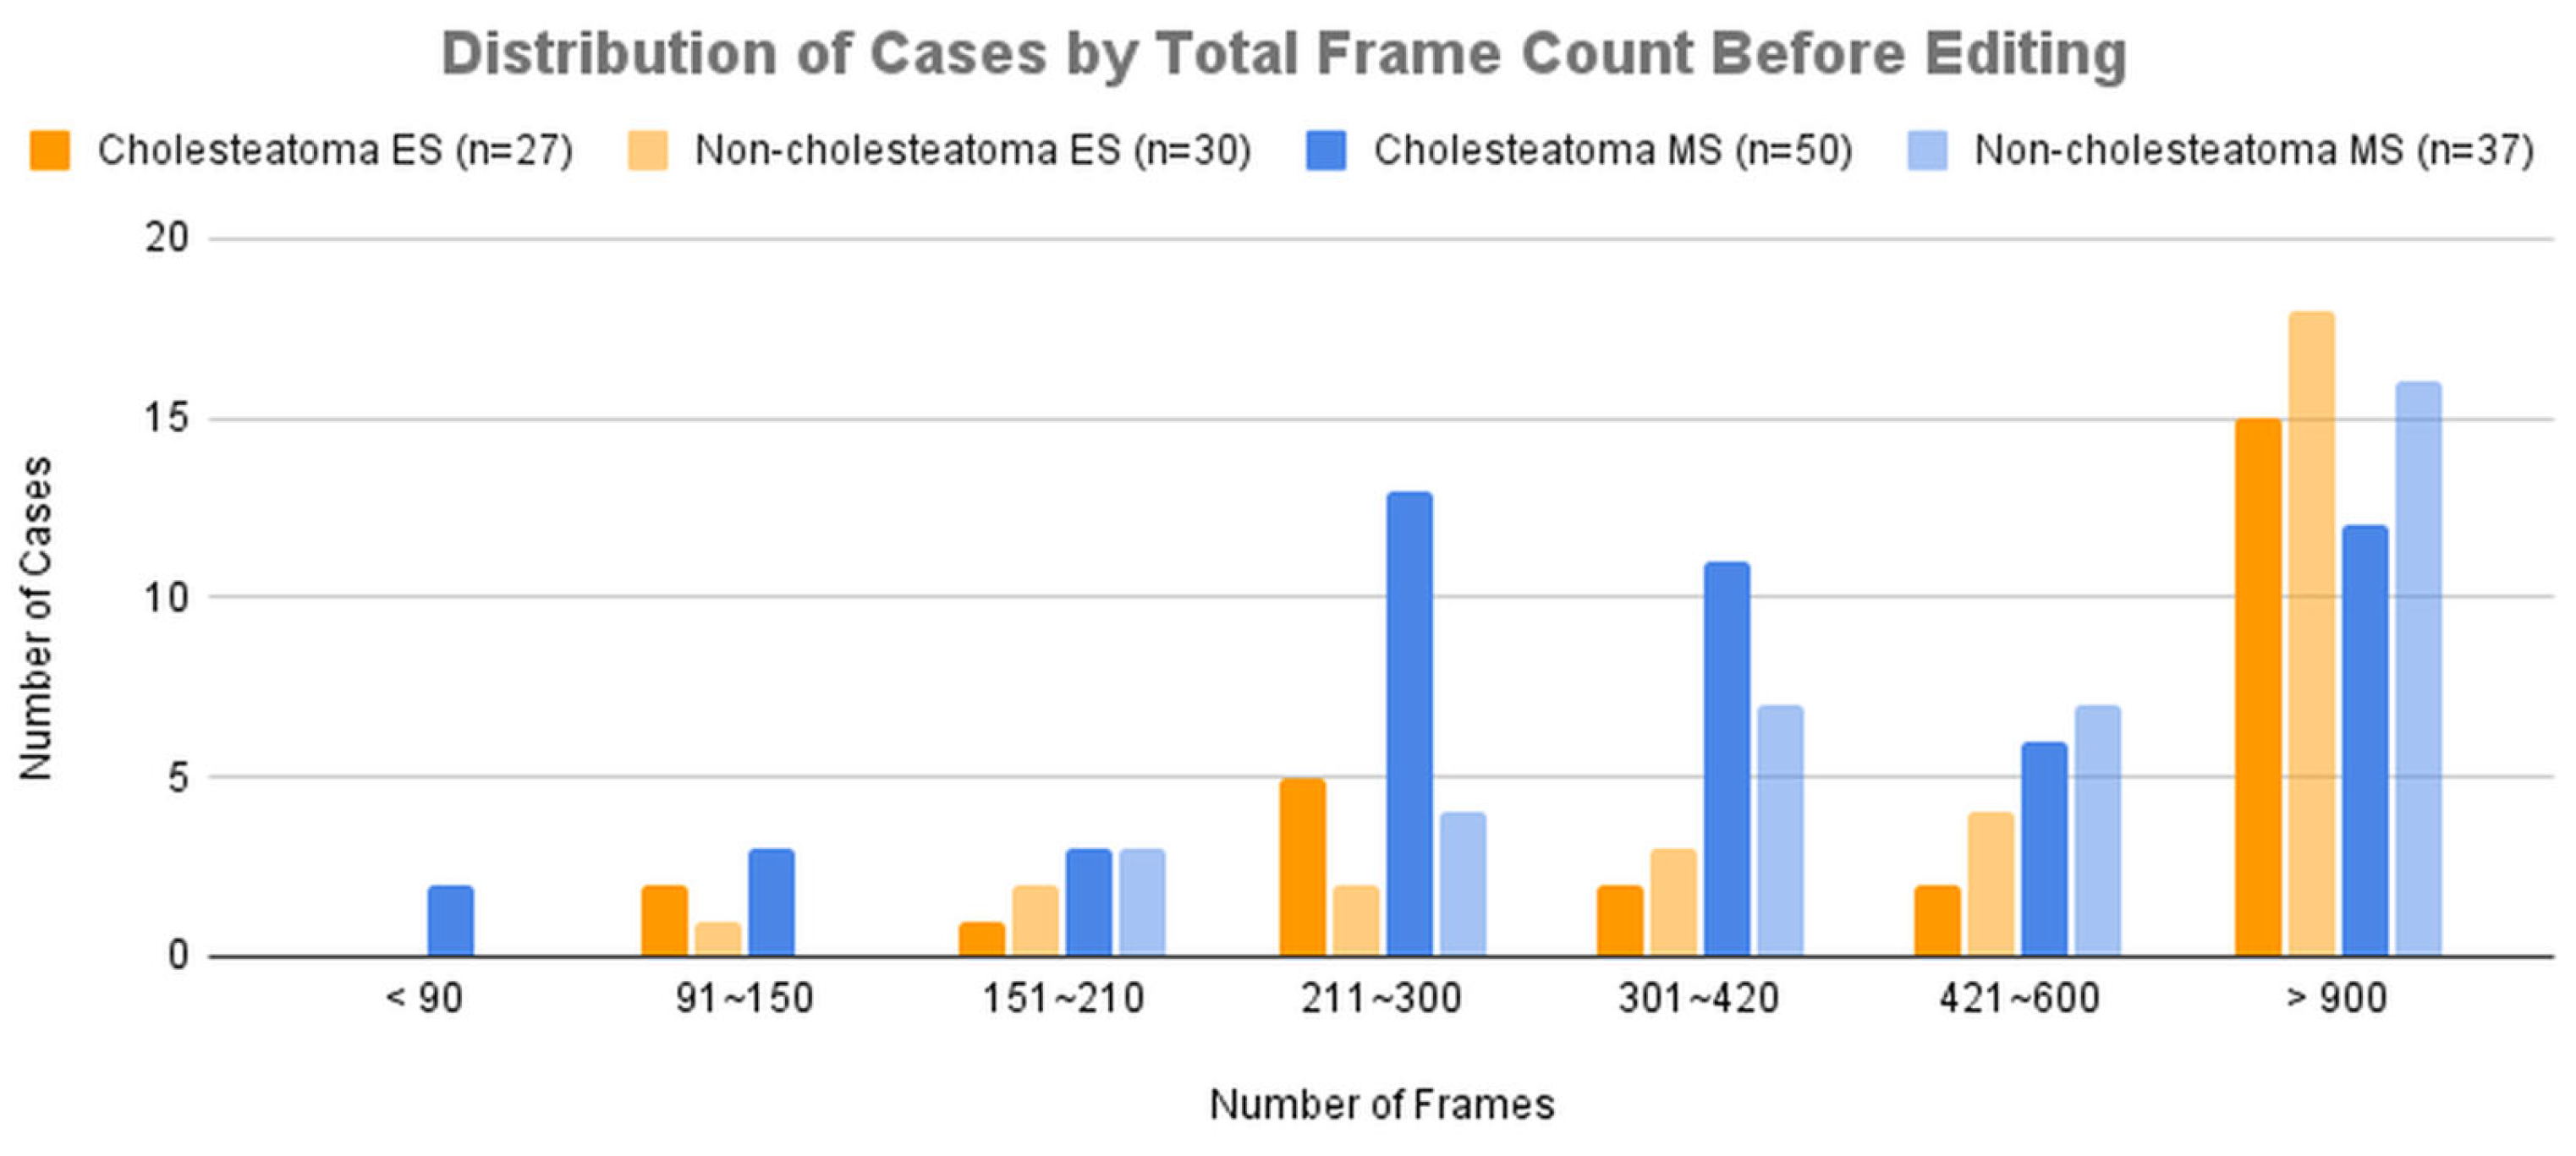
Figure 4.
B. The distribution of cases across groups categorized by total frame count after editing.
Figure 4.
B. The distribution of cases across groups categorized by total frame count after editing.
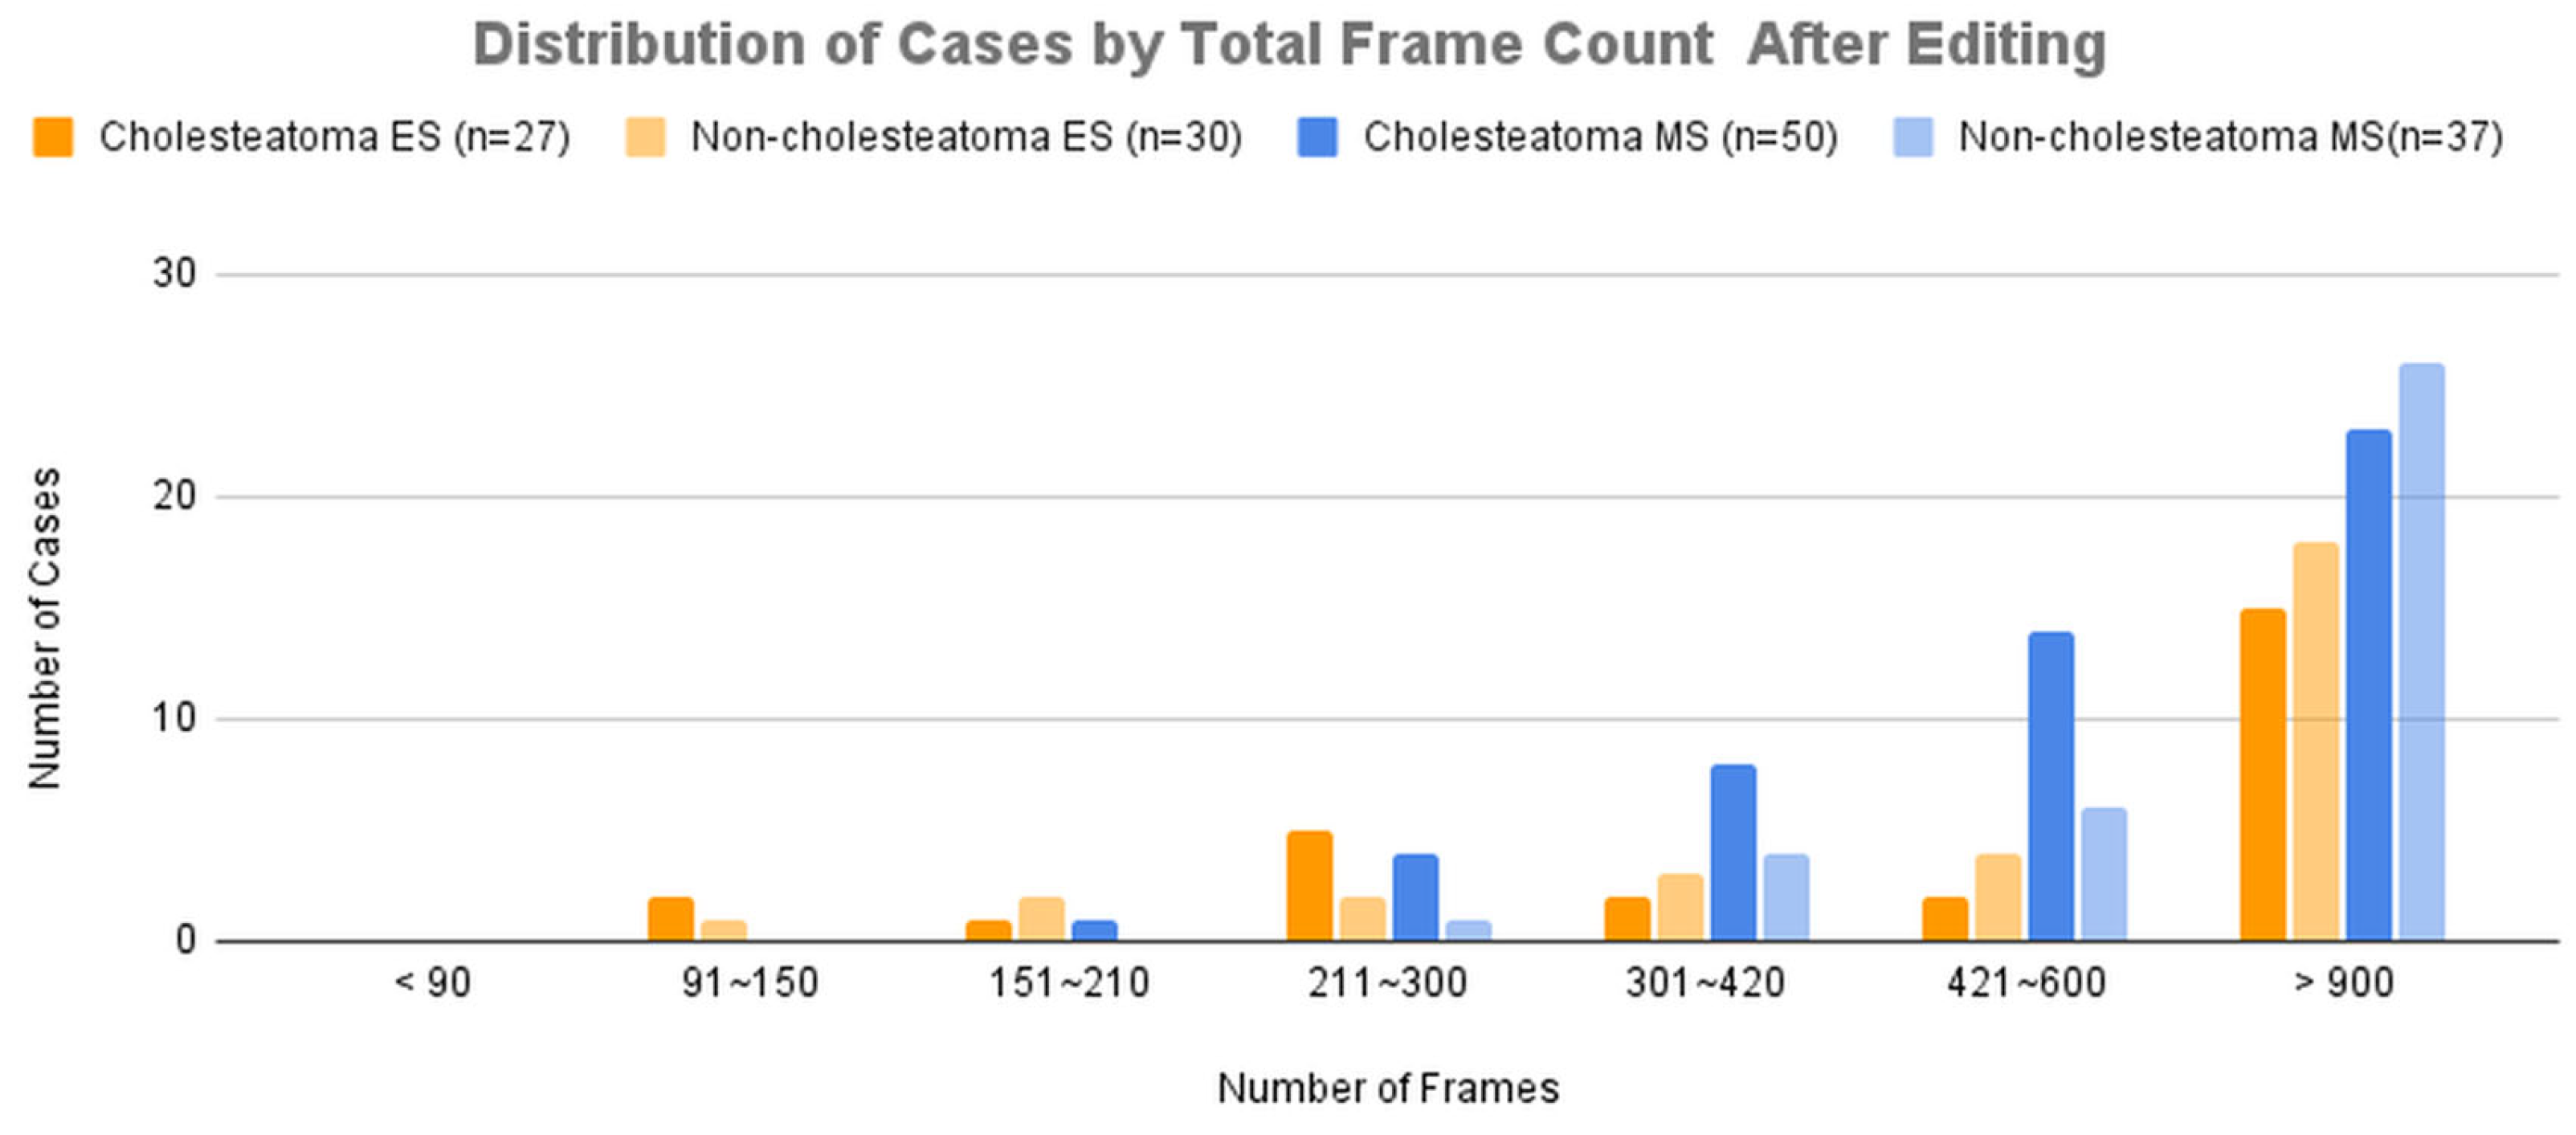
Figure 5.
Workflow of the proposed AI model development and evaluation process.
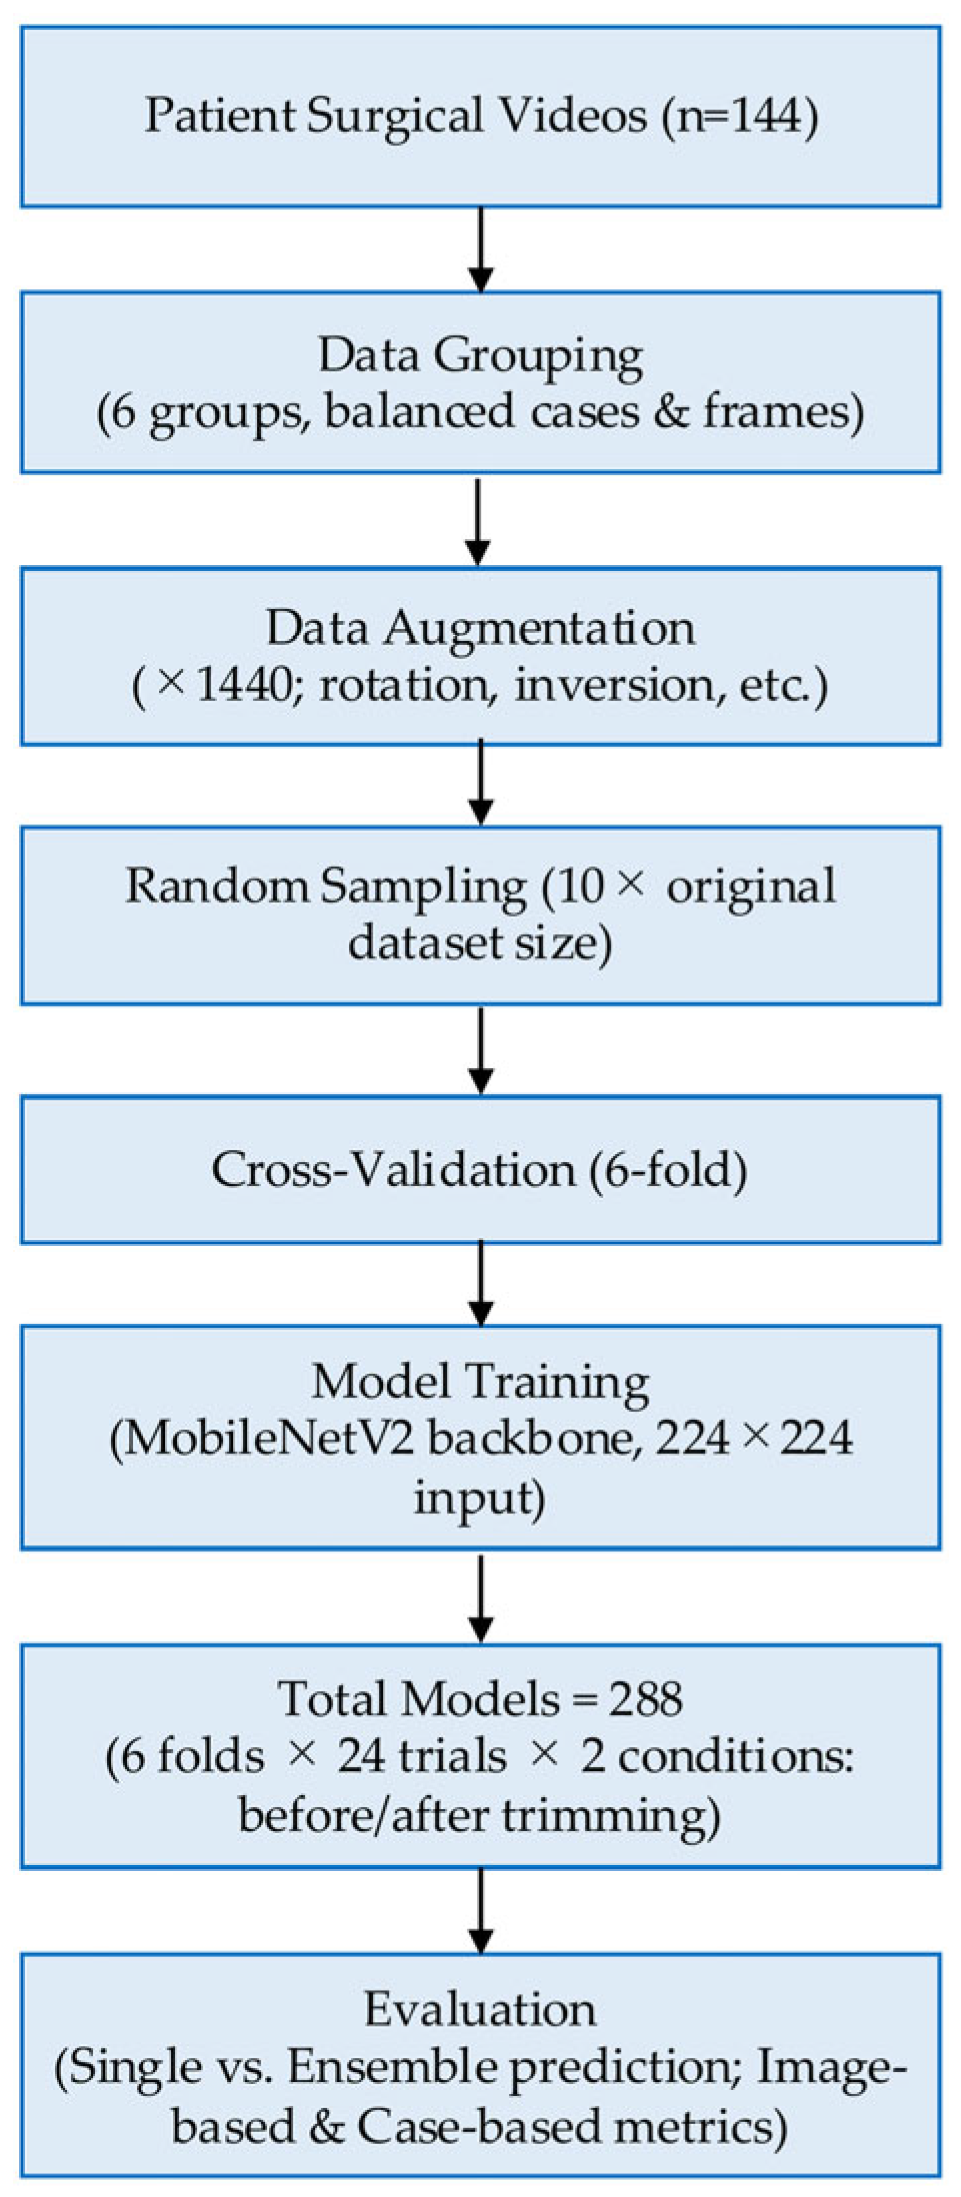
Figure 8.
The average sensitivity and specificity of ensemble predictions using original-size images, comparing results before and after video editing.
Figure 8.
The average sensitivity and specificity of ensemble predictions using original-size images, comparing results before and after video editing.
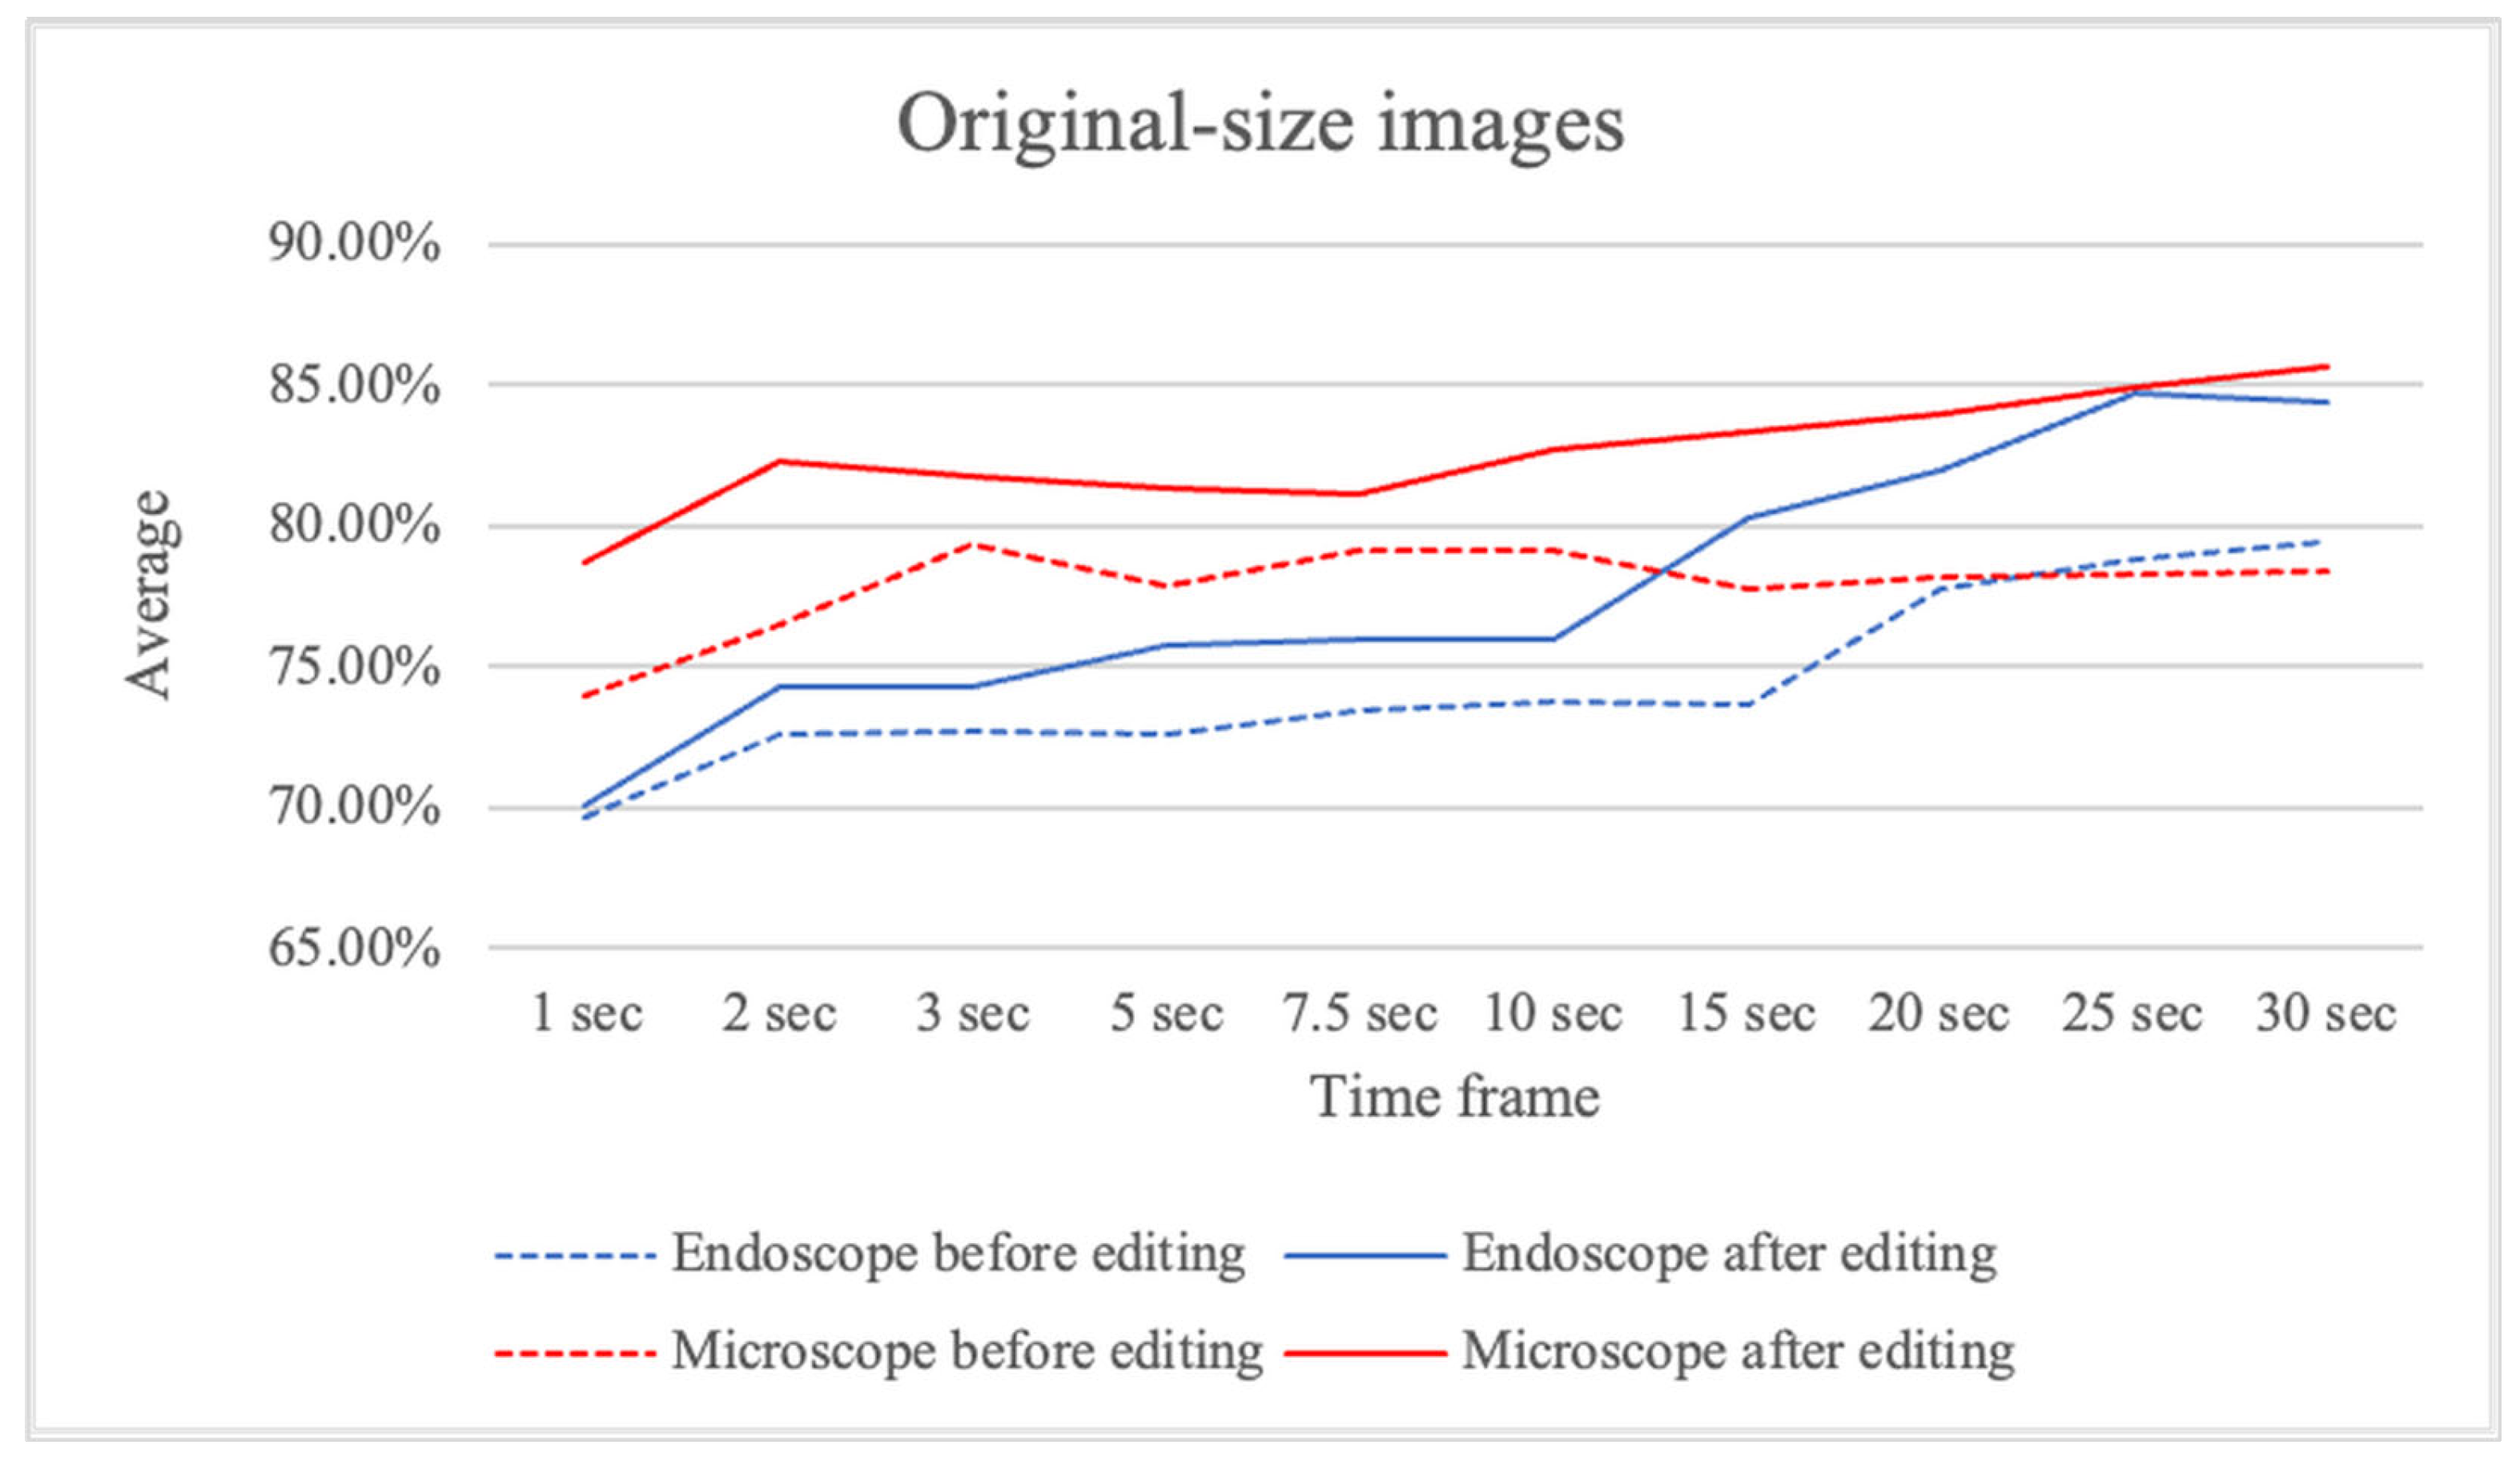
Figure 9.
The average sensitivity and specificity of ensemble predictions using 125% zoomed images, comparing results before and after video editing.
Figure 9.
The average sensitivity and specificity of ensemble predictions using 125% zoomed images, comparing results before and after video editing.
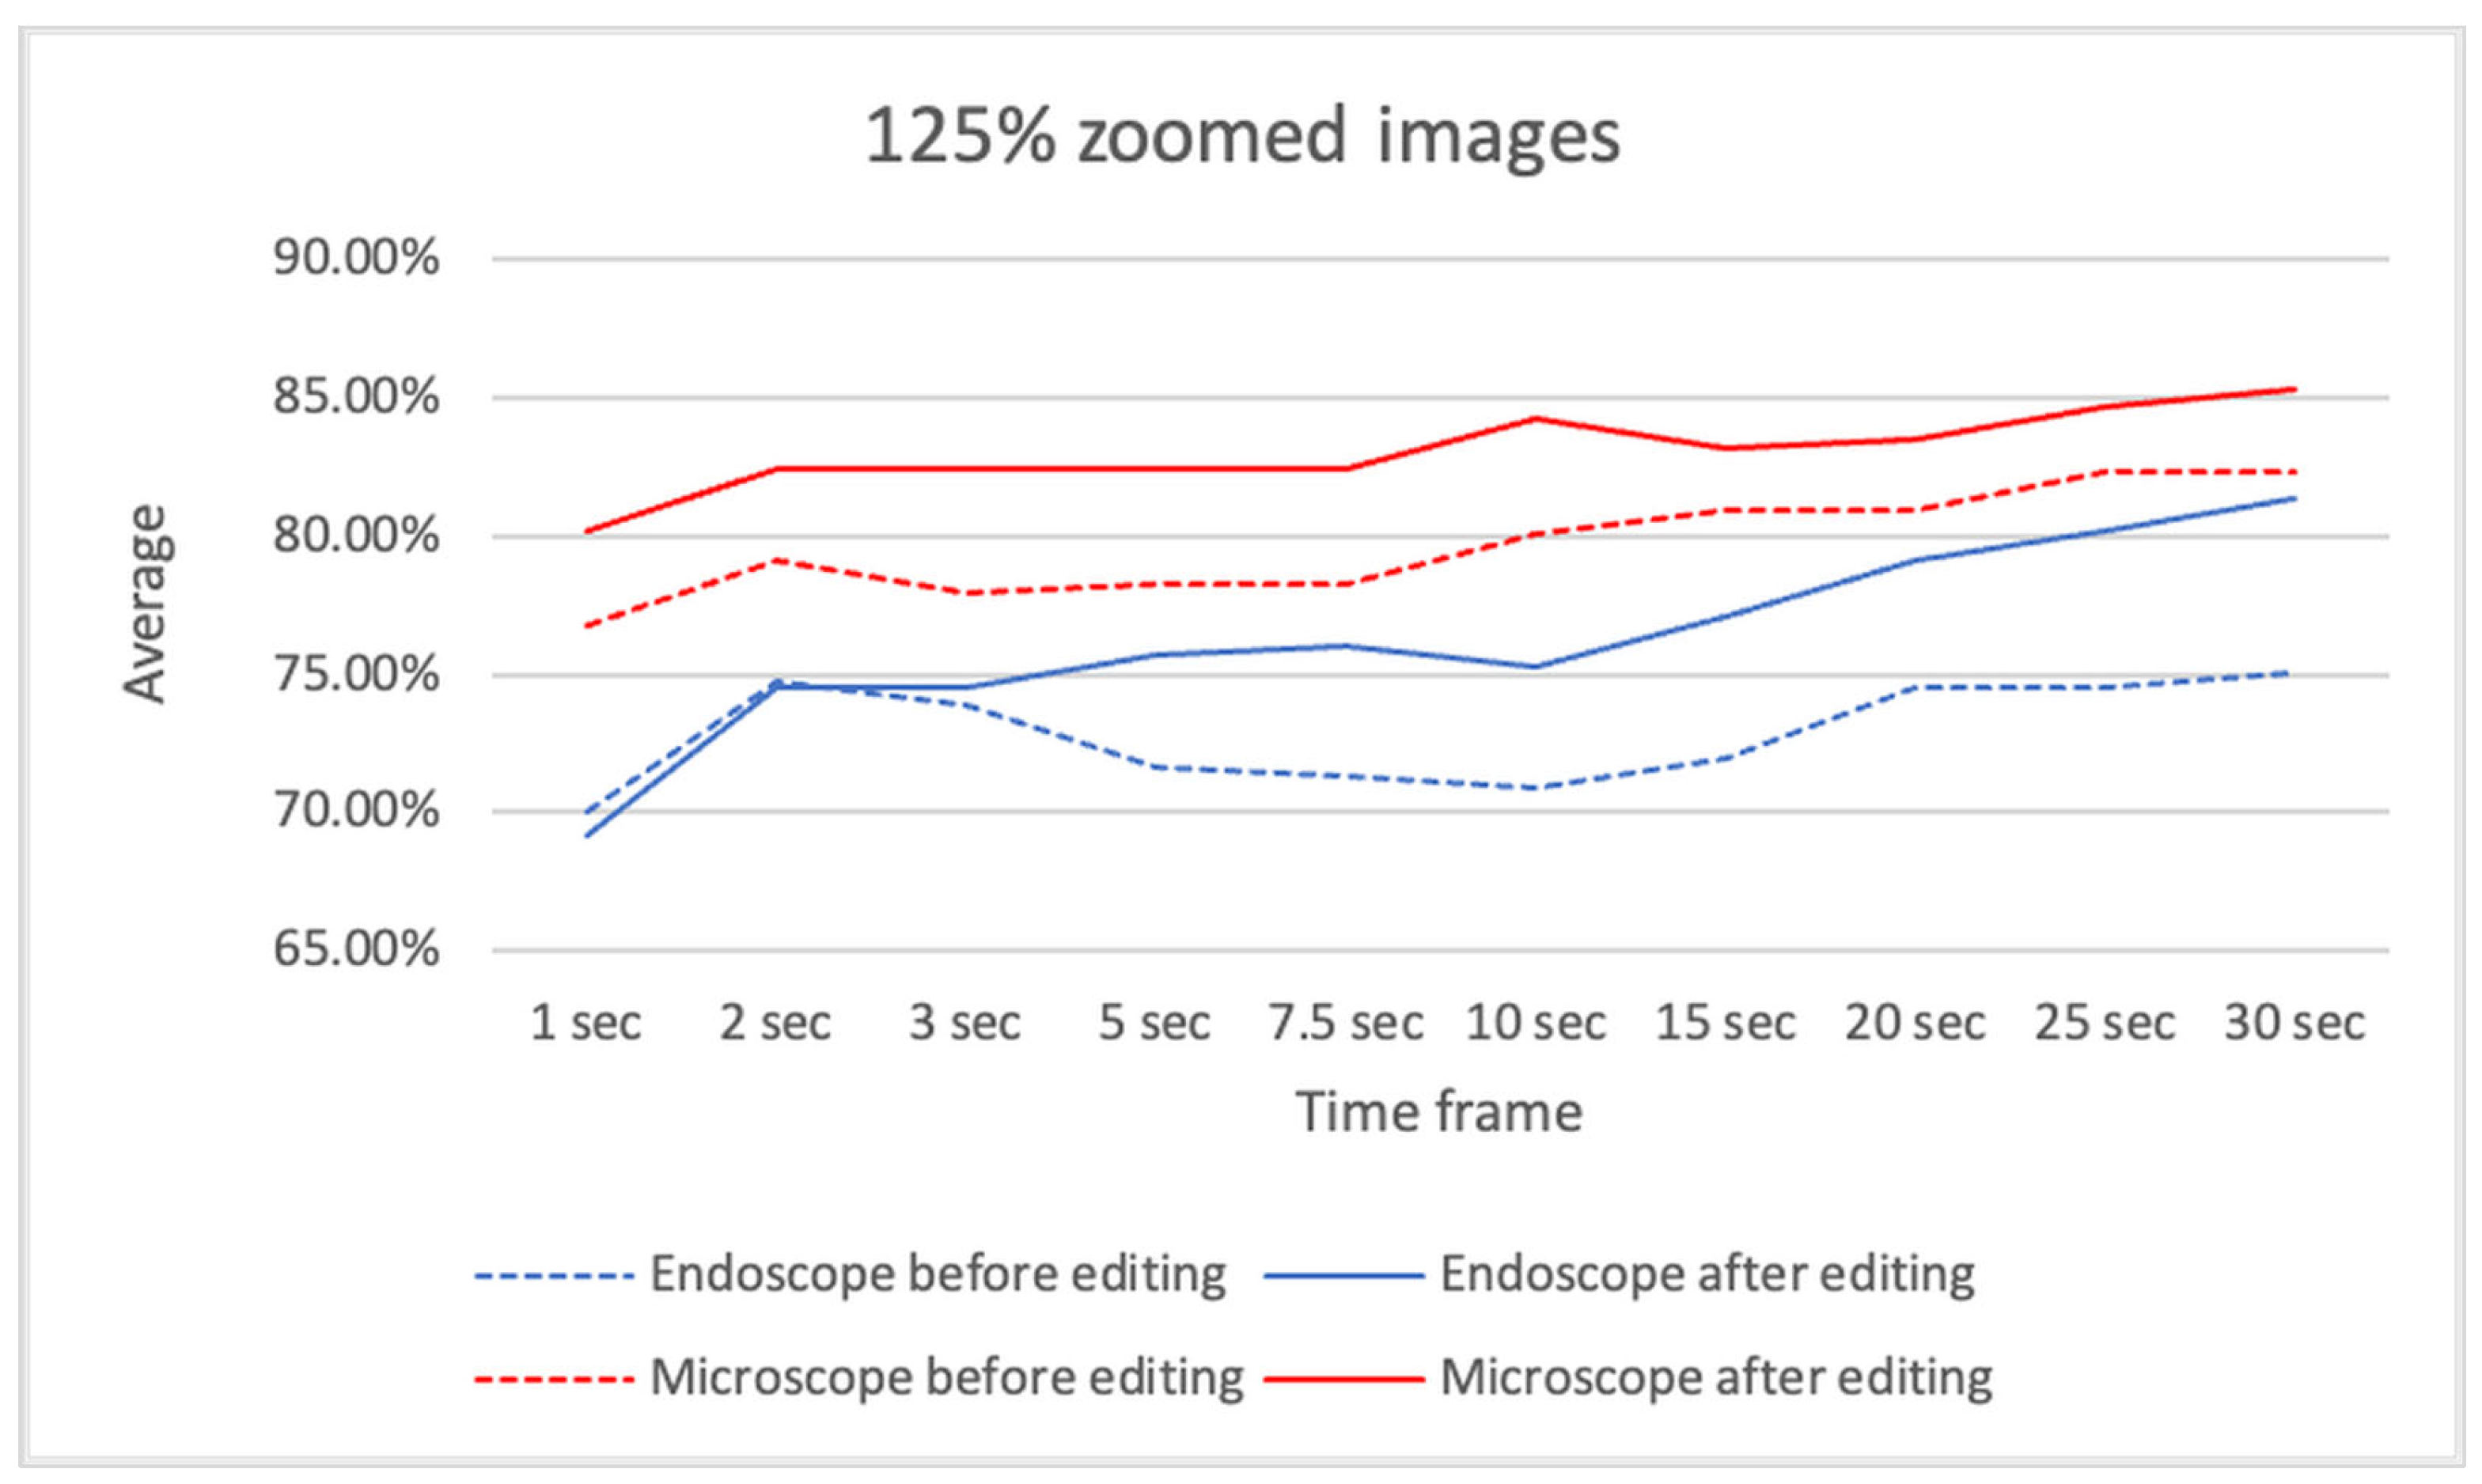

Table 1.
Overview of age and gender distribution by case type.
| Cases | Median | MAX(year) | MIN(year) | Male | Female | |
| Cholesteatoma ES | 27 | 39 | 55 | 4 | 17 | 10 |
| Cholesteatoma MS | 50 | 38.5 | 76 | 8 | 37 | 13 |
| Non-cholesteatoma ES | 30 | 38.5 | 57 | 4 | 20 | 10 |
| Non-cholesteatoma MS | 37 | 39 | 76 | 8 | 23 | 14 |
ES=endoscope, MS=microscope. Cholesteatoma = Cases with confirmed cholesteatoma lesions. Non-cholesteatoma = Cases without cholesteatoma lesions (e.g., normal mucosa or inflammatory tissue).
Table 2.
A. The number of cases and the total video frames in each group before editing.
| Group | Cholesteatoma ES |
Non-cholesteatoma ES | Cholesteatoma MS | Non-cholesteatoma MS | Total | |||||
| Patient | Images | Patient | Images | Patient | Images | Patient | Images | Patient | Images | |
| A | 5 | 17,351 | 5 | 16,044 | 8 | 13,354 | 6 | 17,498 | 24 | 64,247 |
| B | 5 | 17,256 | 5 | 15,563 | 8 | 9,911 | 6 | 9,509 | 24 | 52,239 |
| C | 4 | 19,920 | 5 | 12,544 | 8 | 7,035 | 6 | 9,533 | 23 | 49,032 |
| D | 4 | 17,861 | 5 | 11,291 | 9 | 6,277 | 6 | 8,695 | 24 | 44,124 |
| E | 4 | 18,835 | 5 | 11,443 | 8 | 6,188 | 6 | 7,992 | 23 | 44,458 |
| F | 5 | 17,330 | 5 | 11,220 | 9 | 6,283 | 7 | 7,596 | 26 | 42,429 |
| Total | 27 | 108,553 | 30 | 78,105 | 50 | 49,048 | 37 | 60,823 | 144 | 296,529 |
Table 2.
B. The number of cases and the total video frames in each group after editing.
| Group | Cholesteatoma ES |
Non-cholesteatoma ES | Cholesteatoma MS | Non-cholesteatoma MS | Total | |||||
| Patient | Images | Patient | Images | Patient | Images | Patient | Images | Patient | Images | |
| A | 5 | 17,351 | 5 | 16,044 | 8 | 11,745 | 6 | 16,044 | 24 | 61,184 |
| B | 5 | 17,256 | 5 | 15,563 | 8 | 10,609 | 6 | 15,755 | 24 | 59,183 |
| C | 4 | 19,920 | 5 | 12,544 | 8 | 9,873 | 6 | 14,805 | 23 | 57,142 |
| D | 4 | 17,861 | 5 | 11,291 | 9 | 10,035 | 6 | 12,129 | 24 | 51,316 |
| E | 4 | 18,835 | 5 | 11,443 | 9 | 9,987 | 6 | 11,354 | 24 | 51,619 |
| F | 5 | 17,330 | 5 | 11,220 | 8 | 9,751 | 7 | 9,848 | 25 | 48,149 |
| Total | 27 | 108,553 | 30 | 78,105 | 50 | 62,000 | 37 | 79,935 | 144 | 328,593 |
Table 3.
A. The number of cases and the total images in each cross-validation set before editing.
| Training | Validation | |||||
| CV Set | Groups | Patient | Images | Group | Patient | Images |
| CV Set-1 | ABCDE | 118 | 254,100 | F | 26 | 42,429 |
| CV Set-2 | BCDEF | 120 | 232,282 | A | 24 | 64,247 |
| CV Set-3 | CDEFA | 120 | 244,290 | B | 24 | 52,239 |
| CV Set-4 | DEFAB | 121 | 247,497 | C | 23 | 49,032 |
| CV Set-5 | EFABC | 120 | 252,405 | D | 24 | 44,124 |
| CV Set-6 | FABCD | 121 | 252,071 | E | 23 | 44,458 |
Table 3.
B. The number of cases and the total images in each cross-validation set after editing.
| Training | Validation | |||||
| CV Set | Groups | Patient | Images | Group | Patient | Images |
| CV Set-1 | ABCDE | 119 | 280,444 | F | 25 | 48,149 |
| CV Set-2 | BCDEF | 120 | 267,409 | A | 24 | 61,184 |
| CV Set-3 | CDEFA | 120 | 269,410 | B | 24 | 59,183 |
| CV Set-4 | DEFAB | 121 | 271,451 | C | 23 | 57,142 |
| CV Set-5 | EFABC | 120 | 277,277 | D | 24 | 51,316 |
| CV Set-6 | FABCD | 120 | 276,974 | E | 24 | 51,619 |
Table 4.
A. The results of single-image-unit-based prediction on videos before editing.
| Media | Endoscope | Microscope | ||||||
| Validation data | Original size | 125% zoomed | Original size | 125% zoomed | ||||
| Ensemble | Ensemble | Single | Ensemble | Single | Ensemble | Single | Ensemble | Single |
| Sensitivity | 73.08% | 68.25% | 68.63% | 65.76% | 55.65% | 42.05% | 60.68% | 46.90% |
| Specificity | 74.89% | 74.06% | 75.33% | 72.19% | 69.48% | 80.45% | 68.14% | 81.46% |
| Average | 73.99% | 71.15% | 71.98% | 68.97% | 62.57% | 61.25% | 64.41% | 64.18% |
Table 4.
B. The results of single-image-unit-based prediction on videos after editing.
| Media | Endoscope | Microscope | ||||||
| Validation data | Original size | 125% zoomed | Original size | 125% zoomed | ||||
| Ensemble | Ensemble | Single | Ensemble | Single | Ensemble | Single | Ensemble | Single |
| Sensitivity | 74.01% | 70.47% | 71.87% | 68.98% | 80.26% | 74.71% | 87.29% | 78.05% |
| Specificity | 77.01% | 74.67% | 76.82% | 73.36% | 85.65% | 77.21% | 82.83% | 80.24% |
| Average | 75.51% | 72.57% | 74.35% | 71.17% | 82.96% | 75.96% | 85.06% | 79.15% |
Table 4.
C. The difference in average sensitivity and specificity between predictions before and after video editing.
Table 4.
C. The difference in average sensitivity and specificity between predictions before and after video editing.
| Media | Endoscope | Microscope | ||||||
| Validation data | Original size | 125% zoomed | Original size | 125% zoomed | ||||
| Ensemble | Ensemble | Single | Ensemble | Single | Ensemble | Single | Ensemble | Single |
| Before editing | 73.99% | 71.15% | 71.98% | 68.97% | 62.57% | 61.25% | 64.41% | 64.18% |
| After editing | 75.51% | 72.57% | 74.35% | 71.17% | 82.96% | 75.96% | 85.06% | 79.15% |
| Difference | 1.52% | 1.42% | 2.37% | 2.20% | 20.39% | 14.71% | 20.65% | 14.97% |
Table 5.
A. The results of case-unit-based prediction using continuity analysis with the videos before editing.
Table 5.
A. The results of case-unit-based prediction using continuity analysis with the videos before editing.
| Media | Endoscope | Microscope | ||||||
| Validation data | Original size | 125% zoomed | Original size | 125% zoomed | ||||
| Ensemble | Ensemble | Single | Ensemble | Single | Ensemble | Single | Ensemble | Single |
| Sensitivity | 48.15% | 59.88% | 50.31% | 54.48% | 76.00% | 67.42% | 83.17% | 74.58% |
| Specificity | 96.39% | 82.92% | 91.39% | 86.11% | 76.91% | 77.03% | 70.05% | 75.56% |
| Average | 72.27% | 71.40% | 70.85% | 70.29% | 76.46% | 72.22% | 76.61% | 75.07% |
Table 5.
B. the results of case-unit-based prediction using continuity analysis with the videos after editing.
Table 5.
B. the results of case-unit-based prediction using continuity analysis with the videos after editing.
| Media | Endoscope | Microscope | ||||||
| Validation data | Original size | 125% zoomed | Original size | 125% zoomed | ||||
| Ensemble | Ensemble | Single | Ensemble | Single | Ensemble | Single | Ensemble | Single |
| Sensitivity | 53.40% | 66.36% | 48.15% | 57.41% | 83.83% | 79.42% | 91.08% | 85.92% |
| Specificity | 91.94% | 76.94% | 93.47% | 84.17% | 82.88% | 76.80% | 73.31% | 75.56% |
| Average | 72.67% | 71.65% | 70.81% | 70.79% | 83.36% | 78.11% | 82.20% | 80.74% |
Table 5.
C. The difference in the average sensitivity and specificity between predictions before and after video editing.
Table 5.
C. The difference in the average sensitivity and specificity between predictions before and after video editing.
| Media | Endoscope | Microscope | ||||||
| Validation data | Original size | 125% zoomed | Original size | 125% zoomed | ||||
| Ensemble | Ensemble | Single | Ensemble | Single | Ensemble | Single | Ensemble | Single |
| Before editing | 72.27% | 71.40% | 70.85% | 70.29% | 76.46% | 72.22% | 76.61% | 75.07% |
| After editing | 72.67% | 71.65% | 70.81% | 70.79% | 83.36% | 78.11% | 82.20% | 80.74% |
| Difference | 0.40% | 0.25% | -0.04% | 0.50% | 6.90% | 5.89% | 5.59% | 5.67% |
Table 6.
A. The results of case-unit-based prediction using overall positive rate analysis with the videos before editing.
Table 6.
A. The results of case-unit-based prediction using overall positive rate analysis with the videos before editing.
| Media | Endoscope | Microscope | ||||||
| Validation data | Original size | 125% zoomed | Original size | 125% zoomed | ||||
| Ensemble | Ensemble | Single | Ensemble | Single | Ensemble | Single | Ensemble | Single |
| Sensitivity | 77.31% | 77.62% | 74.54% | 74.85% | 79.08% | 69.17% | 87.92% | 74.92% |
| Specificity | 84.72% | 80.56% | 79.86% | 77.36% | 78.15% | 79.95% | 75.68% | 79.39% |
| Average | 81.02% | 79.09% | 77.20% | 76.10% | 78.62% | 74.56% | 81.80% | 77.15% |
Table 6.
B. The results of case-unit-based prediction using overall positive rate analysis with the videos after editing.
Table 6.
B. The results of case-unit-based prediction using overall positive rate analysis with the videos after editing.
| Media | Endoscope | Microscope | ||||||
| Validation data | Original size | 125% zoomed | Original size | 125% zoomed | ||||
| Ensemble | Ensemble | Single | Ensemble | Single | Ensemble | Single | Ensemble | Single |
| Sensitivity | 81.48% | 80.09% | 77.93% | 76.23% | 79.00% | 79.58% | 94.00% | 83.83% |
| Specificity | 86.94% | 86.25% | 89.72% | 84.31% | 90.88% | 81.64% | 79.73% | 83.00% |
| Average | 84.21% | 83.17% | 83.83% | 80.27% | 84.94% | 80.61% | 86.86% | 83.41% |
Table 6.
C. The difference in the average sensitivity and specificity between predictions before and after video editing.
Table 6.
C. The difference in the average sensitivity and specificity between predictions before and after video editing.
| Media | Endoscope | Microscope | ||||||
| Validation data | Original size | 125% zoomed | Original size | 125% zoomed | ||||
| Ensemble | Ensemble | Single | Ensemble | Single | Ensemble | Single | Ensemble | Single |
| Before editing | 81.02% | 79.09% | 77.20% | 76.10% | 78.62% | 74.56% | 81.80% | 77.15% |
| After editing | 84.21% | 83.17% | 83.83% | 80.27% | 84.94% | 80.61% | 86.86% | 83.41% |
| Difference | 3.19% | 4.08% | 6.63% | 4.17% | 6.32% | 6.05% | 5.06% | 6.26% |
Table 7.
A. The results of case-unit-based prediction using time window positive rate analysis with the videos before editing.
Table 7.
A. The results of case-unit-based prediction using time window positive rate analysis with the videos before editing.
| Endoscope | Microscope | |||||||
| Original size | 125% zoomed | Original size | 125% zoomed | |||||
| Time frame | Ensemble | Single | Ensemble | Single | Ensemble | Single | Ensemble | Single |
| 1 sec | 69.63% | 66.88% | 70.04% | 67.41% | 73.95% | 72.40% | 76.76% | 74.36% |
| 2 sec | 72.65% | 71.04% | 74.74% | 69.41% | 76.51% | 73.00% | 79.14% | 75.07% |
| 3 sec | 72.66% | 71.34% | 73.93% | 70.37% | 79.34% | 73.35% | 77.90% | 75.40% |
| 5 sec | 72.64% | 71.71% | 71.67% | 69.93% | 77.92% | 73.63% | 78.24% | 75.52% |
| 7.5 sec | 73.43% | 72.94% | 71.37% | 69.37% | 79.19% | 73.63% | 78.30% | 76.03% |
| 10 sec | 73.73% | 73.36% | 70.93% | 70.41% | 79.09% | 73.68% | 80.08% | 76.24% |
| 15 sec | 73.70% | 74.78% | 71.93% | 71.37% | 77.75% | 74.21% | 80.97% | 76.64% |
| 20 sec | 77.79% | 77.33% | 74.48% | 74.33% | 78.17% | 74.43% | 80.97% | 77.15% |
| 25 sec | 78.77% | 78.12% | 74.52% | 74.96% | 78.26% | 74.45% | 82.32% | 77.33% |
| 30 sec | 79.47% | 78.91% | 75.11% | 74.70% | 78.41% | 74.77% | 82.32% | 77.27% |
Table 7.
B. The results of case-unit-based prediction using time window positive rate analysis with the videos after editing.
Table 7.
B. The results of case-unit-based prediction using time window positive rate analysis with the videos after editing.
| Endoscope | Microscope | |||||||
| Original size | 125% zoomed | Original size | 125% zoomed | |||||
| Time frame | Ensemble | Single | Ensemble | Single | Ensemble | Single | Ensemble | Single |
| 1 sec | 70.04% | 68.10% | 69.19% | 67.82% | 78.69% | 74.83% | 80.15% | 78.20% |
| 2 sec | 74.27% | 72.58% | 74.48% | 71.81% | 82.26% | 77.02% | 82.40% | 79.98% |
| 3 sec | 74.26% | 73.64% | 74.51% | 72.34% | 81.73% | 76.83% | 82.42% | 80.23% |
| 5 sec | 75.72% | 73.95% | 75.74% | 72.92% | 81.36% | 77.13% | 82.49% | 80.24% |
| 7.5 sec | 75.95% | 74.40% | 76.06% | 73.21% | 81.13% | 77.56% | 82.47% | 79.89% |
| 10 sec | 75.93% | 75.17% | 75.28% | 73.40% | 82.77% | 78.35% | 84.23% | 80.20% |
| 15 sec | 80.30% | 77.58% | 77.09% | 75.10% | 83.37% | 78.97% | 83.20% | 80.65% |
| 20 sec | 81.95% | 80.56% | 79.12% | 77.00% | 83.97% | 78.88% | 83.47% | 81.19% |
| 25 sec | 84.68% | 81.50% | 80.23% | 77.72% | 84.93% | 79.15% | 84.64% | 81.65% |
| 30 sec | 84.38% | 82.15% | 81.34% | 78.51% | 85.70% | 79.55% | 85.31% | 82.12% |
Table 7.
C. The difference in the average sensitivity and specificity between predictions before and after video editing.
Table 7.
C. The difference in the average sensitivity and specificity between predictions before and after video editing.
| Endoscope | Microscope | |||||||
| Original size | 125% zoomed | Original size | 125% zoomed | |||||
| Time frame | Ensemble | Single | Ensemble | Single | Ensemble | Single | Ensemble | Single |
| 1 sec | 0.41% | 1.22% | -0.85% | 0.41% | 4.74% | 2.43% | 3.39% | 3.84% |
| 2 sec | 1.62% | 1.54% | -0.26% | 2.40% | 5.75% | 4.02% | 3.26% | 4.91% |
| 3 sec | 1.60% | 2.30% | 0.58% | 1.97% | 2.39% | 3.48% | 4.52% | 4.83% |
| 5 sec | 3.08% | 2.24% | 4.07% | 2.99% | 3.44% | 3.50% | 4.25% | 4.72% |
| 7.5 sec | 2.52% | 1.46% | 4.69% | 3.84% | 1.94% | 3.93% | 4.17% | 3.86% |
| 10 sec | 2.20% | 1.81% | 4.35% | 2.99% | 3.68% | 4.67% | 4.15% | 3.96% |
| 15 sec | 6.60% | 2.80% | 5.16% | 3.73% | 5.62% | 4.76% | 2.23% | 4.01% |
| 20 sec | 4.16% | 3.23% | 4.64% | 2.67% | 5.80% | 4.45% | 2.50% | 4.04% |
| 25 sec | 5.91% | 3.38% | 5.71% | 2.76% | 6.67% | 4.70% | 2.32% | 4.32% |
| 30 sec | 4.91% | 3.24% | 6.23% | 3.81% | 7.29% | 4.78% | 2.99% | 4.85% |
Disclaimer/Publisher’s Note: The statements, opinions and data contained in all publications are solely those of the individual author(s) and contributor(s) and not of MDPI and/or the editor(s). MDPI and/or the editor(s) disclaim responsibility for any injury to people or property resulting from any ideas, methods, instructions or products referred to in the content. |
© 2025 by the authors. Licensee MDPI, Basel, Switzerland. This article is an open access article distributed under the terms and conditions of the Creative Commons Attribution (CC BY) license (http://creativecommons.org/licenses/by/4.0/).
Copyright: This open access article is published under a Creative Commons CC BY 4.0 license, which permit the free download, distribution, and reuse, provided that the author and preprint are cited in any reuse.


