
Submitted:
10 September 2025
Posted:
11 September 2025
You are already at the latest version
Abstract
Random walks with stochastic resetting, where walkers periodically return to a designated node, have emerged as an important framework for understanding transport processes in complex networks. While resetting is known to optimize search times, its effects on extreme events - defined as exceedances of walker flux above a critical threshold - remain unexplored. Such events model critical network phenomena including traffic congestion, server overloads, and infrastructure failures. In this work, we systematically investigate how stochastic resetting influences both the probability and magnitude of extreme events in complex networks. Through analytical derivation of the stationary occupation probabilities and comprehensive numerical simulations, we demonstrate that resetting significantly reduces extreme event occurrence while concentrating event-size fluctuations. Our results reveal a universal suppression effect: increasing the resetting rate γ monotonically decreases extreme event probabilities across all nodes, with complete elimination at γ=1. Notably, this suppression is most pronounced for vulnerable low-degree nodes, which experience the largest reduction in both event probability and fluctuation magnitude. These findings provide theoretical foundations for using resetting as a control mechanism to mitigate extreme events in networked systems.
Keywords:
extreme events
; random walks
; stochastic resetting
1. Introduction
Extreme events (EE) are typically witnessed in many geophyscial phenomena such as the earthquakes, cyclones, drought and so on [1,2,3]. These represent extreme events recorded in univariate time series, and a large amount of theoretical and practical results have been obtained regarding the statistical and dynamic analysis of these extreme events [4,5]. However, as early as a century ago, extreme events in univariate time series arised in the research of classical extreme value theory, the extreme events in complex networks have only attracted attention in recent years [6,7,8]. Extreme events take place on complex networks is a fairly common place experience, such as traffic jam in roads and other transportation networks, web servers not responding due to the heavy load of http requests, floods in the network of rivers, power black outs due to tripping of power grids, etc [9,10]. Though such events typically have low probability of occurrence, they are regarded as significant owing to the social and financial losses suffered on account of most of these extreme events. Generally, these physical phenomena can be summed up as an emergent phenomena arising due to flux on networks and could be regarded as extreme events arising primarily because of the limited handling capacity of the node [11,12]. However, extreme event, defined as exceedences above the threshold, is not only affected by the capacity of the node, but also is attributable to natural fluctuations passing through a node. When the fluctuation in the flux passing through a node exceeds a prescribed threshold, extreme events will occur accordingly [6,13,14].
The analysis model we introduce in this research is the random walk on complex networks [15]. Random walks are ubiquitous in nature and have applications in a broad range of fields [16,17,18]. Recent research has shown that complex network exploration using random walks can be defined in terms of moving to nearest-neighbor nodes or as long-range hops between distant nodes [31,32]. Random walks are also interesting as a mechanism of transport and search within networks [19,30]. Recently, stochastic resetting has emerged as a significant concept in understanding a variety of random walk processes on complex networks [20,21,22,23,37,38]. This mechanism, which involves reinitializing a random walk to a particular node, has been explored to control and optimize diffusion-based search dynamical processes [24,33]. In addition to these developments, a broad theoretical foundation for stochastic resetting has been established in recent years. In particular, Pal and collaborators have made significant contributions to the understanding of resetting dynamics, first-passage under resetting, and optimal resetting strategies [34,35,36]. The effect of stochastic resetting on network-based processes, especially random walks, has implications for a range of applications, from search algorithms to biological transport phenomena [27,28]. Recent contributions relating to optimal reset protocols further emphasize the importance of tuning the reset conditions to achieve specific goals, such as minimizing the search time or optimizing resource allocation on the network [25,26]. By optimizing the reset protocol, the efficiency of random walks on complex networks can be expedited.
In this work, we model the transport process as resetting random walks on networks and delve into the study of the probability for EE and event size fluctuations. Relating to how the connectivity of the network affects the probability for the extreme event occurrence, by modeling the transport as the standard random walk, the V. Kishore has displayed in Ref [6] that the the probability for the occurrence of EE which depends only on the stationary distribution of a node arising due to inherent fluctuations. In this research, the threshold was choosen to be proportional to typical fluctuation size on i-th node and the extreme events are identified after taking care of the natural variability of the flux passing through the given node. Furthermore, it was shown that the probability for EE is higher for small degree nodes than for hubs or large degree nodes. This hints that the large flux does not translate into extreme events and even though hubs or large degree nodes draw large flux they are less liable to extreme events on a connected network. By leveraging the stochastic resetting, there is a surprising result that the stochastic resetting can reduce the probability of EE occuring and event size fluctuations in our research. And our work can be generalized to study the impact of stochastic resetting on complex networks. Specifically, we investigate the impact of stochastic resetting on the probability for EE and event size fluctuations within the Barabási-Albert network [29], which exhibits scale-free characteristics.
The remainder of this paper is organized as follows. Section 2 introduces random walks on networks with stochastic resetting. Section 3 describes the probability for extreme events with stochastic resetting. Section 4 elaborates fluctuations in event size with stochastic resetting. Section 5 summarizes the conclusions derived from this research.
2. Random Walk on Networks with Stochastic Resetting
A connected, undirected network with N nodes and E edges is considered. Its connectivity structure is determined by an adjacency matrix A whose element if nodes i and j are connected by an edge, and is 0 otherwise.
On this network structure, diffusion of W independent walkers is considered who perform random walks in the sense explained below. We consider a random walker starts from node i at in discrete time.
The random walker performs at in two types of steps: a hop to one of the neighbors of the node presently occupied with probability or a resetting to a given node r with probability .
Without resetting (), the probability of the random walker hops from i to j is which is the element of the transition matrix B, depicting the random walk without resetting and possessing the characteristic of normalization (each row of B adds up to 1). Thus, the time evolution of probability is given by the master equation [20,21]:
where denotes the probability of the random walker starting from node i and reaching node j at time t given the resetting node r and the resetting rate . The first term of the equation represents the walker hoping to the nearest nodes from current position, and the second term indicates resetting to the given node r(Where is the Kronecker delta). Let define as the transition matrix with elements . Thus, the master equation can be rewritten as
The form of Equation (2) satisfies the property of a Markov chain, which means Like W, the matrix is also a stochastic matrix: knowing its eigenvalues and eigenvectors expedites us to calculate the occupation probability at any time, even including the stationary distribution.
Owing to the fact that the matrix is related to B, we can obtain the relationship between the two stochastic matrices. Let us denote the eigenvalues of the matrix B as , and its left and right eigenvectors are denoted as and respectively, for .
Similarly, the eigenvalues of are denoted as and its eigenvectors are denoted as and . Based on the master equation, we import the identity
where the elements of the matrix are , so the matrix has entries 1 in the -column and null entries everywhere else. Then the can be described as [20]
Furthermore, the left and right eigenvectors of are described as
where for . Similarly, the right eigenvectors are given by
for , and . is defined as the vector whose elements equal to 0 except the r-th one, which equals to 1. With the left and right eigenvectors at hand, the matrix can be characterized by the spectral representation
Within the discrete step, the master equation of the occupation probability can be rewritten as
Using the spectral representation, this can be restated as
where the stationary distribution, which we define as , is equal to the first term of Equation (9). Utilizing the expression of the left and right eigenvectors of , the stationary distribution is given by
where is the stationary distribution of the random walk without resetting. The second term of Equation (10) is the consequence of the resetting dynamical process, which disrupts the equilibrium of the general distribution.
3. Probability for Extreme Events with Stochastic Resetting
In this section, we focus the research emphasis on the probability for EE with stochastic resetting. First of all, we consider the distribution of the number of random walkers at a given node. We assume the dynamical process that there are a total of W random walkers wandering in the network with stochastic resetting. We define the probability of finding w random walkers at node i (the flux passing through a node) where the resetting node is r and the resetting rate is as . It is obvious that the walkers are relatively independent when performing the random walk process which leads to the variable w follows the binomial distribution. Thus, the probability is obtained by
We can also derive the mean and standard deviation of finding w walkers at a given node is
We can observe that the relationship between the mean and standard deviation can be approximately expressed as owing to the value of is much smaller than 1. This relation can be thought of as a generalization of a similar relation for the standard random walks reported in Ref. [14]. Moreover, the expression of Equations (11) and (12) depend only on the stationary distribution which portrays a node, and are independent of the network topology, making them applicable to different types of networks, such as scale-free networks, random networks, or fractal networks. Figure 1 plots the binomial distribution of random walkers on the non-resetting node (k=4) and the resetting node (k=47) which is the central node (the node with the highest degree) in the network. Different colors represent different resetting rates. These theoretical analysis are based on the BA scale-free network with 200 nodes, 780 edges, and 1560 random walkers.
As is vividly depicted in Figure 1a,b, we can identify that the resetting strategy has distinct impacts on the central node and low-degree node. Figure 1a shows that resetting can reduce the probability of a large number of random walkers appearing at the low-degree node (k=4) to a certain extent, while it can significantly increase the probability of finding a large amount of random walkers at the central node on the contrary. This research result has laid a certain foundation for our better understanding of the probability for EE with stochastic resetting and the fluctuations in event size with stochastic resetting in the subsequent research.
We determine that the the probabilities for the occurrence of EE are very small, which are reflected at the tails of the binomial distribution. We apply this principle to each node in the BA scale-free network with the resetting node r and the resetting rate . As is mentioned above, at any given time, the number of random walkers w passing through a node in the network follows the binomial distribution given by Equation (11), an extreme event is considered to occur at a node if more than q random walkers pass through it, i.e., . Therefore, the probability of an extreme event can be expressed as
First, let examine the scenario where the threshold is constant. If we set , then according to Equation (13), the probability equals to 1 for all nodes, meaning that every node would experience extreme events all the time. Conversely, if we set , the probability , which approaches to zero since , implying that extreme events would virtually never occur. Both of these extreme cases are not physically meaningful. Similarly, setting a fixed threshold like (where is a constant) would result in some nodes experiencing extreme events almost all the time, while others rarely. Such a result is not what we intend to investigate. These considerations suggest that a more meaningful and realistic approach is to define the threshold based on the natural variability of the flux passing through a node. Therefore, we define the threshold for extreme events as [14]
We consider , and the standard deviation and the mean are given by Equation (12). Based on Equation (13), we can intuitively analyze that the probability of EE () is directly determined by the stationary distribution . Figure 2 vividly presents the impact of different values of on the probability of EE occurring. Both Figure 2a,b show that the the nodes with large values of are less likely to experience extreme events and resetting can reduce occurring to a certain extent by comparing Figure 2a,b. Meanwhile, the extreme events with large values of parameter m are less likely to occur analyzed from the Figure 2. By substituting Equation (14) into Equation (13), we find that the probability of EE mainly depends on the resetting rate , the parameter m and the total number of random walkers W. However, once given , the extreme events are a direct consequence of the shape of the binomial distribution independently of the walker evolution. Furthermore, in particular in the limit of large W, the central limit theorem holds and the binomial distribution of w converge to the Gaussian distribution that fully determines the value of the probability of EE [39], independently of which can be confirmed from Figure 1. Thus the probability of EE can be expressed as an integral as . Figure 3 presents for different resetting nodes as the resetting rate . Figure 3a–c are based on simulations conducted on the BA scale-free network consisting of 200 nodes, 780 edges, and 1560 random walkers. The simulation results show excellent agreement with the analytical distribution obtained from Equation (13). The simulation results shown in Figure 3 are obtained by averaging over 50 independent runs.
By examining Figure 3a, we can intuitively obtain that the probability of EE on the low-degree resetting node in the BA network decreases significantly as the resetting rate increases. When the resetting rate reaches 1, the probability drops to zero, indicating that this resetting nodes no longer experience any extreme events. At the same time, as the parameter m increases, the threshold also increases, leading to a lower probability of EE for the node . This is consistent with the analytical results derived from Equation (13). The same conclusion applies to Figure 3b,c as well. Moreover, even if a large amount of random walkers passing through the central node (), the probability for the occurrence of extreme events is lower than that in nodes with a lower degree than it by comparing Figure 3a–c. Without loss of generality, we draw a conclusion that the probabilities of EE across all nodes in the BA scale-free network decrease as the resetting rate increases. Furthermore, when , no extreme events occur in the network at all, as all random walkers are attracted by the resetting node.
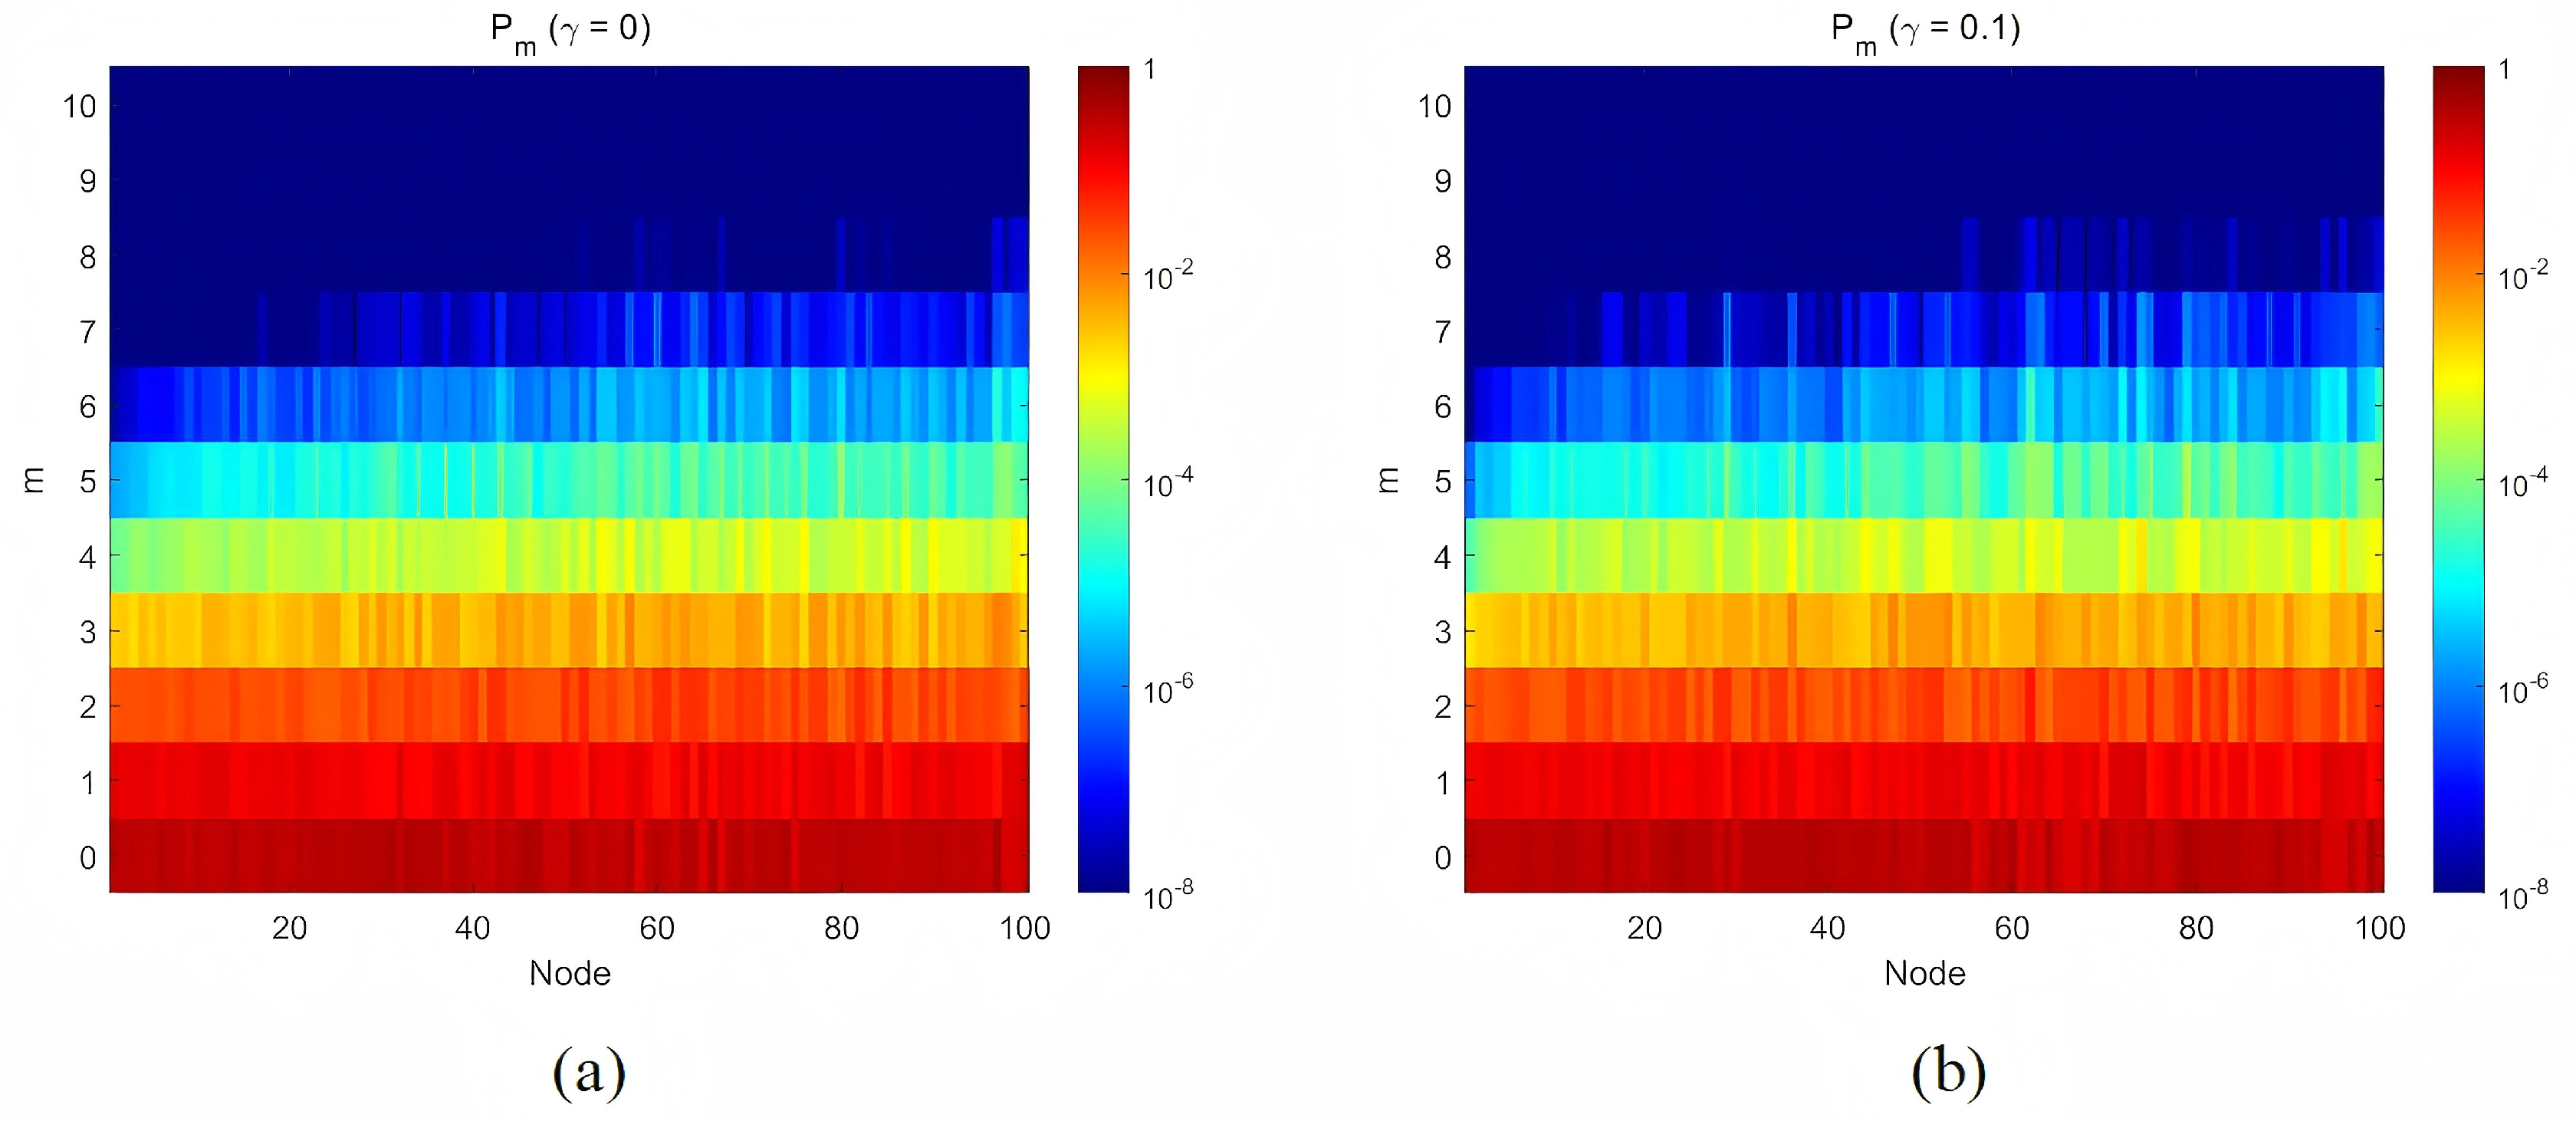
To further validate the conclusions drawn from Figure 3 and to investigate the effect of stochastic resetting on extreme events, we compared the probability of EE under standard random walks and random walks with resetting. Figure 4 presents the probability of EE across all nodes in the BA scale-free network consisting of 100 nodes, 562 edges, and the results are performed by 1124 random walkers. The left panel corresponds to the case without resetting node, while the right panel shows the case where the central node serves as the resetting node with a resetting rate of . The color change of the energy bar represents the change of the probability for the occurrence of EE: warmer colors indicate a higher probability of extreme events occurring at a node, while cooler colors indicate a lower probability. It is clearly observed that in the presence of a resetting mechanism, the probability of extreme events is significantly reduced across the entire BA network. This observation is in strong agreement with the conclusion drawn from the Figure 3. Actually, we can clearly derive that the stochastic resetting obviously reduce the average occupation across all the nodes in the BA network by comparing the two panels in Figure 5 which corroborates with the results in Figure 4. Besides, we can also intuitively analyze that the probability of EE occurring in low degree nodes is higher than that in central nodes and nodes adjacent to the center. Further, notice that Equation (13) does not depend on the large scale structure of the topology, and therefore it is conducive to delve into other complex networks through theoretical and simulation analysis.
4. Fluctuations in Event Size with Stochastic Resetting
In this section, we focus on the event size fluctuations in the flux passing through a node with stochastic resetting. To explore how event size fluctuations depend on node connectivity in the presence of stochastic resetting, we analyze the distribution of event sizes with nodes arranged in descending order of their degrees and nodes with the same degree in ascending order of their distance to the resetting node. The visualization of event-size distributions in this order highlights how highly connected nodes (hubs) respond to fluctuations in walker flux compared to peripheral nodes.
Figure 6 shows the distribution of event size m, measured in units of the standard deviation , as a function of node degree and their distance to the resetting node. This theoretical analysis is based on the BA scale-free network used in Figure 4. The color map displays the probability of an event of size m occurring on nodes with different degrees or same degrees with different distances to the resetting node. In our research, an event of size m is defined by the condition , where w is the number of walkers discovered on the node. Then, the probability for the occurrence of an event of size m can be described as
To visualize this theoretical result, we plot the distribution of event sizes as the node degrees and their distances to the resetting node with different resetting rate . In Figure 6a, we observe a pronounced asymmetry in the fluctuation landscape:the nodes on the left exhibit a narrow range of event sizes, typically within , and the probabilities for larger event sizes rapidly decay below . This reflects the fact that hubs receive a relatively stable and high average flux of walkers, making large deviations statistically rare which leads to the probability for the occurrence of events of large sizes are relatively small .This is consistent with the results shown in Figure 1. the node in the middle begin to show moderate broadening in event size distribution. Occasional events up to are observed, with probabilities , indicating increased flux volatility compared to the hubs. the nodes on the right display the most dramatic fluctuations. Some of these nodes experience extreme events as large as or more, with non-negligible probabilities (e.g., for certain nodes). This suggests that, although these nodes are rarely visited in the dynamical process performed by random walkers, the few walker arrivals they do receive are sufficient to produce disproportionately large statistical deviations which implies that even occasional visits by a few random walkers contribute to extremely events of large sizes.
Compared to Figure 6a,b demonstrates that event size fluctuations under resetting random walks become more concentrated. Notably, the probability of unit event size increases significantly, indicating that stochastic resetting effectively reduces size variability. Furthermore, we observe a marked decrease in extreme events , consistent with the trends shown in Figure 3. These results collectively demonstrate that resetting suppresses both overall fluctuations and extreme event probabilities.
Interestingly, these effects exhibit degree and distance dependence: while small-degree and peripheral nodes show clear changes in their event size distributions, hubs display less pronounced variations. This suggests that stochastic resetting differentially affects nodes based on their connectivity in BA scale-free networks. Our findings confirm earlier analytical predictions that those nodes with small degrees and far from the resetting node are particularly vulnerable to extreme fluctuations. Furthermore, as for which factor has a greater impact on the event size fluctuations-the size of the degree and the distance to the resetting node, the research of another sorting method:sorting in ascending order of the distance to the resetting node, with nodes at the same distance sorted in the descending order of their degrees is considered. We found that the result of this sorting method are not significantly different from the former case, meaning that the two factors have little difference in their impact on the event size fluctuations.
The resetting mechanism produces two key effects. First, it diminishes the dominance of central nodes. Second, it makes fluctuations in peripheral regions more discernible while simultaneously mitigating traffic variations network-wide. The specific order visualization in our research reveals these dynamics more clearly, showing a rightward shift in the probability distribution of large events. This spatial redistribution indicates that extreme fluctuations become increasingly concentrated in the network’s periphery, highlighting the systemic vulnerability of low-degree and peripheral nodes under stochastic perturbations.
This analytical approach serves dual purposes: it not only validates previous theoretical predictions but also offers a powerful diagnostic tool for pinpointing fluctuation hotspots and evaluating network resilience in heterogeneous systems.
5. Conclusions
This work investigates extreme events occurring on network nodes under the mechanism of stochastic resetting in random walks. We explore how resetting to a central node affects both the probability of extreme events and the fluctuations in event sizes across the network.
Our key finding is that stochastic resetting serves as an effective control mechanism for extreme events in complex networks. The resetting process significantly reduces the probability of EE across all nodes, with complete suppression occurring when the resetting rate . This reduction is particularly pronounced for low-degree nodes and nodes distant from the resetting node, which are naturally more vulnerable to extreme fluctuations in standard random walks.
We have demonstrated that resetting not only lowers extreme event probabilities but also concentrates the distribution of event sizes. The fluctuations become more tightly distributed around the mean, with a marked decrease in extreme deviations. This effect arises because resetting redistributes walkers across the network, preventing the accumulation of large fluctuations at any single node.
An important insight from our work is the differential impact of resetting based on both node degree and distance to the resetting node. While all nodes benefit from reduced extreme events, the effect is more substantial for peripheral nodes—those with low degree and located far from the resetting node—compared to hubs or nearby nodes. This suggests that resetting could be particularly valuable for protecting vulnerable nodes in infrastructure networks, where extreme events (such as traffic congestion or overloads) are most likely to occur at poorly connected or remote nodes.
Our analytical framework, validated by numerical simulations, provides a foundation for designing optimal resetting strategies in real-world networks. The results suggest that by carefully tuning the resetting rate , network operators can achieve a desired balance between search efficiency (often improved by resetting) and extreme event mitigation. This could have practical applications in designing robust communication networks, transportation systems, and power grids where extreme fluctuations need to be controlled.
Author Contributions
Conceptualization, X.S. and A.L.; methodology, X.S. and A.L.; software, X.S.; validation, X.S.; formal analysis, A.L.; investigation, X.S.; writing—original draft preparation, X.S., S.Z. and A.L.; writing—review and editing, X.S.; visualization, X.S. and S.Z.; supervision, X.S. and S.Z.; project administration, X.S. and S.Z.; funding acquisition, X.S. All authors have read and agreed to the published version of the manuscript.
Funding
This work was supported by the National Innovation Training Program (Grant 202510299079Z).
Institutional Review Board Statement
Not applicable.
Data Availability Statement
No new data were created or analyzed in this study. Data sharing is not applicable to this article.
Conflicts of Interest
The authors declare no conflicts of interest.
Abbreviations
The following abbreviations are used in this manuscript:
| BA network | Barabási-Albert network |
| EE | extreme events |
References
- Pisarenko, VF; Sornette, D. Characterization of the frequency of extreme earthquake events by the generalized Pareto distribution. Pure and Applied Geophysics, 2003, 160(12), 2343–2364.
- Walsh, John E; Ballinger, Thomas J; Euskirchen, Eugénie S; Hanna, Edward; Mård, Johanna; Overland, James E; Tangen, Helge; Vihma, Timo. Extreme weather and climate events in northern areas: A review. Earth-Science Reviews, 2020, 209, 103324. [CrossRef]
- Shiau, JT. Fitting drought duration and severity with two-dimensional copulas. Water Resources Management, 2006, 20, 795–815.
- Coles, Stuart; Bawa, Joanna; Trenner, Lesley; Dorazio, Pat. An introduction to statistical modeling of extreme values. Springer, 2001, Vol. 208.
- Katz, Richard W; Parlange, Marc B; Naveau, Philippe. Statistics of extremes in hydrology. Advances in Water Resources, 2002, 25(8-12), 1287–1304. [CrossRef]
- Kishore, Vimal; Santhanam, MS; Amritkar, RE. Extreme events on complex networks. Physical Review Letters, 2011, 106(18), 188701. [CrossRef]
- Ray, Arnob; Bröhl, Timo; Mishra, Arindam; Ghosh, Subrata; Ghosh, Dibakar; Kapitaniak, Tomasz; Dana, Syamal K; Hens, Chittaranjan. Extreme events in a complex network: Interplay between degree distribution and repulsive interaction. Chaos: An Interdisciplinary Journal of Nonlinear Science, 2022, 32(12).
- Chen, Yu-Zhong; Huang, Zi-Gang; Lai, Ying-Cheng. Controlling extreme events on complex networks. Scientific Reports, 2014, 4(1), 6121.
- Dobson, Ian; Carreras, Benjamin A; Lynch, Vickie E; Newman, David E. Complex systems analysis of series of blackouts: Cascading failure, critical points, and self-organization. Chaos: An Interdisciplinary Journal of Nonlinear Science, 2007, 17(2).
- Crucitti, Paolo; Latora, Vito; Marchiori, Massimo. Model for cascading failures in complex networks. Physical Review E, 2004, 69(4), 045104. [CrossRef]
- Kanagaraj, Sathiyadevi; Durairaj, Premraj; Karthikeyan, Anitha; Rajagopal, Karthikeyan. Unraveling the dynamics of a flux coupled Chialvo neurons and the existence of extreme events. Cognitive Neurodynamics, 2024, 1–10. [CrossRef]
- Gandhi, Govind; Santhanam, MS. Biased random walkers and extreme events on the edges of complex networks. Physical Review E, 2022, 105(1), 014315. [CrossRef]
- Chowdhury, Sayantan Nag; Ray, Arnob; Dana, Syamal K; Ghosh, Dibakar. Extreme events in dynamical systems and random walkers: A review. Physics Reports, 2022, 966, 1–52. [CrossRef]
- Kishore, Vimal; Santhanam, MS; Amritkar, RE. Extreme events and event size fluctuations in biased random walks on networks. Physical Review E, 2012, 85(5), 056120. [CrossRef]
- Noh, Jae Dong; Rieger, Heiko. Random walks on complex networks. Physical Review Letters, 2004, 92(11), 118701. [CrossRef]
- Sarkar, Purnamrita; Moore, Andrew W. Random walks in social networks and their applications: a survey. Social Network Data Analytics, 2011, 43–77. [CrossRef]
- Peng, Wei; Wang, Jianxin; Zhang, Zhen; Wu, Fang-Xiang. Applications of random walk model on biological networks. Current Bioinformatics, 2016, 11(2), 211–220.
- Takács, Lajos. Random walk processes and their applications in order statistics. The Annals of Applied Probability, 1992, 435–459.
- Candia, Julián; Parris, Paul E; Kenkre, VM. Transport properties of random walks on scale-free/regular-lattice hybrid networks. Journal of Statistical Physics, 2007, 129, 323–333. [CrossRef]
- Riascos, Alejandro P; Boyer, Denis; Herringer, Paul; Mateos, José L. Random walks on networks with stochastic resetting. Physical Review E, 2020, 101(6), 062147. [CrossRef]
- Li, Anlin; Sun, Xiaohan. Biased random walks on networks with stochastic resetting. Physical Review E, 2025, 111(5), 054309. [CrossRef]
- Michelitsch, Thomas M; D’onofrio, Giuseppe; Polito, Federico; Riascos, Alejandro P. Random walks with stochastic resetting in complex networks: A discrete-time approach. Chaos: An Interdisciplinary Journal of Nonlinear Science, 2025, 35(1).
- Huang, Feng; Chen, Hanshuang. Random walks on complex networks with first-passage resetting. Physical Review E, 2021, 103(6), 062132. [CrossRef]
- Chen, Yongjin; Yuan, Zhenhua; Gao, Long; Peng, Junhao. Optimizing search processes with stochastic resetting on the pseudofractal scale-free web. Physical Review E, 2023, 108(6), 064109.
- Li, Anlin; Sun, Xiaohan; Zhu, Shaoxiang; Zhu, Feng. Random walks on scale-free flowers with stochastic resetting. Chaos: An Interdisciplinary Journal of Nonlinear Science, 2025, 35(1).
- Sun, Xiaohan; Li, Anlin; Zhu, Shaoxiang; Zhu, Feng. Random Walk on T-Fractal with Stochastic Resetting. Entropy, 2024, 26(12), 1034. [CrossRef]
- Chowdhury, Debashish; Schadschneider, Andreas; Nishinari, Katsuhiro. Physics of transport and traffic phenomena in biology: from molecular motors and cells to organisms. Physics of Life Reviews, 2005, 2(4), 318–352.
- Li, Bai-Lian; Loehle, Craig; Malon, David. Microbial transport through heterogeneous porous media: random walk, fractal, and percolation approaches. Ecological Modelling, 1996, 85(2-3), 285–302.
- Barabási, Albert-László; Bonabeau, Eric. Scale-free networks. Scientific American, 2003, 288(5), 50–59.
- Perra, Nicola; Baronchelli, Andrea; Mocanu, Delia; Gonçalves, Bruno; Pastor-Satorras, Romualdo; Vespignani, Alessandro. Random walks and search in time-varying networks. Physical Review Letters, 2012, 109(23), 238701.
- Riascos, Alejandro P; Mateos, José L. Long-range navigation on complex networks using Lévy random walks. Physical Review E, 2012, 86(5), 056110.
- Riascos, Alejandro Pérez; Michelitsch, TM; Collet, BA; Nowakowski, AF; Nicolleau, FCGA. Random walks with long-range steps generated by functions of Laplacian matrices. Journal of Statistical Mechanics: Theory and Experiment, 2018, 2018(4), 043404.
- Pang, Bao; Song, Yong; Zhang, Chengjin; Yang, Runtao. Effect of random walk methods on searching efficiency in swarm robots for area exploration. Applied Intelligence, 2021, 51(7), 5189–5199.
- Bonomo, Ofek Lauber; Pal, Arnab. First passage under restart for discrete space and time: Application to one-dimensional confined lattice random walks. Physical Review E, 2021, 103(5), 052129.
- Singh, Prashant; Pal, Arnab. Extremal statistics for stochastic resetting systems. Physical Review E, 2021, 103(5), 052119.
- Pal, Arnab; Kostinski, Sarah; Reuveni, Shlomi. The inspection paradox in stochastic resetting. Journal of Physics A: Mathematical and Theoretical, 2022, 55(2), 021001.
- Zelenkovski, Kiril; Sandev, Trifce; Metzler, Ralf; Kocarev, Ljupco; Basnarkov, Lasko. Random walks on networks with centrality-based stochastic resetting. Entropy, 2023, 25(2), 293.
- Flaquer-Galmés, Rosa; Campos, Daniel; Méndez, Vicenç. Intermittent random walks under stochastic resetting. Physical Review E, 2024, 109(3), 034103. [CrossRef]
- Touchette H. The large deviation approach to statistical mechanics. Physics Reports, 2009, 478(1-3): 1–69.
- González, Fernanda Hernández. Random walks on networks with stochastic reset to multiple nodes. arXiv preprint arXiv:2204.10885, 2022.
- Wang, Shuang; Chen, Hanshuang; Huang, Feng. Random walks on complex networks with multiple resetting nodes: A renewal approach. Chaos: An Interdisciplinary Journal of Nonlinear Science, 2021, 31(9).
Figure 1.
The distribution of random walkers on the non-resetting node (k=4) and the resetting node (k=47) under different conditions of and . These distributions belong to the binomial distribution derived from the stationary probability given in Equation (11).
Figure 1.
The distribution of random walkers on the non-resetting node (k=4) and the resetting node (k=47) under different conditions of and . These distributions belong to the binomial distribution derived from the stationary probability given in Equation (11).
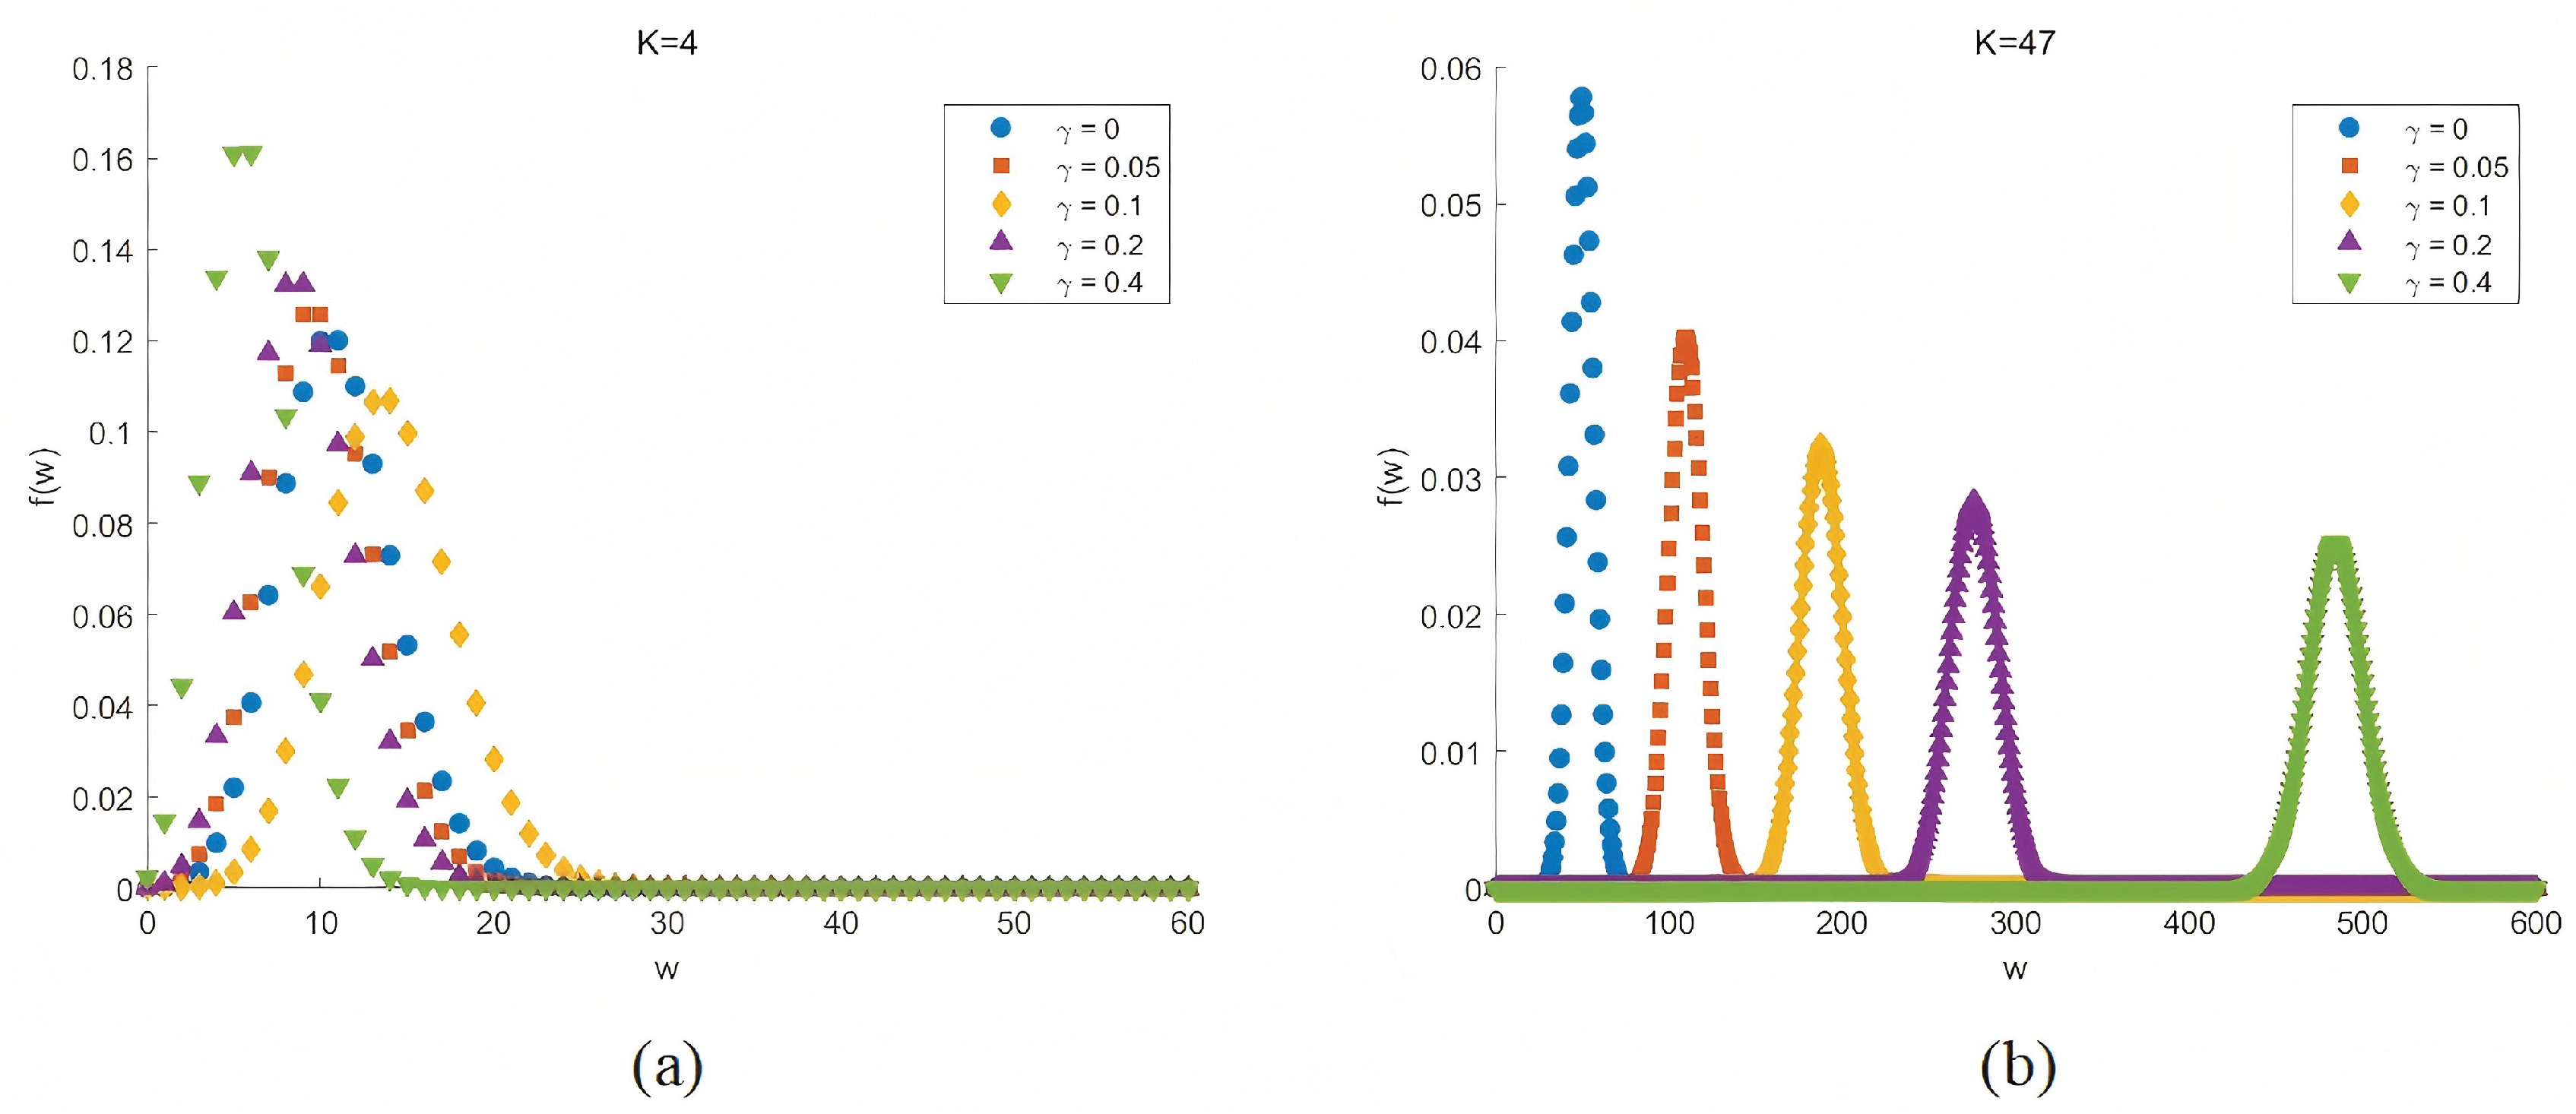
Figure 2.
The probability of EE () as a function of stationary distribution for different values of m when and in log-log plot.
Figure 2.
The probability of EE () as a function of stationary distribution for different values of m when and in log-log plot.
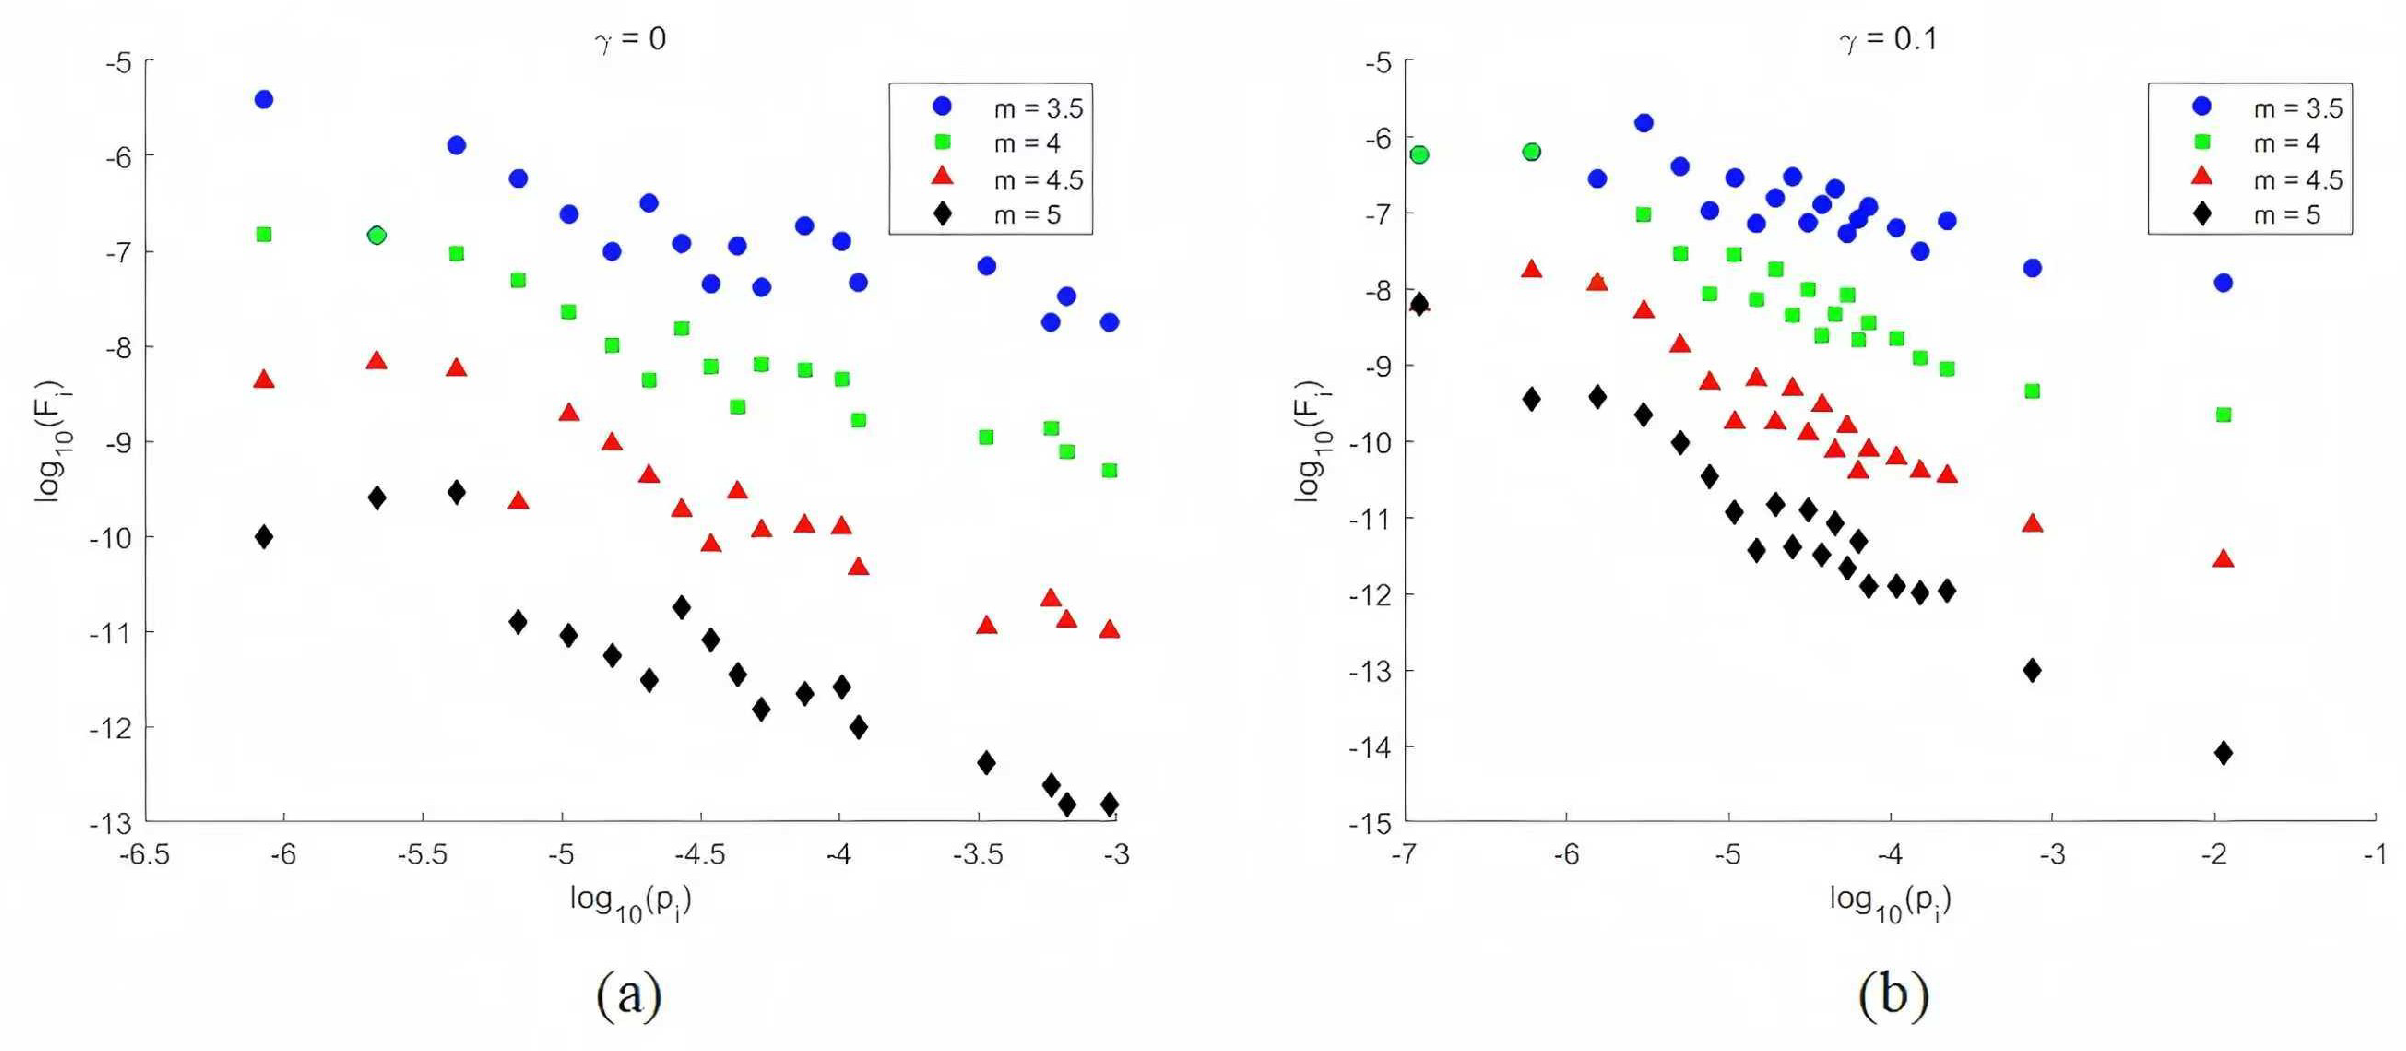
Figure 3.
The probability of EE () for nodes of different degrees as the resetting nodes, with m taking values of 3.0, 3.5, and 4.0. The circular markers represent simulation results on the BA scale-free network, while the curves represent the theoretical analysis obtained from Equation (13).
Figure 3.
The probability of EE () for nodes of different degrees as the resetting nodes, with m taking values of 3.0, 3.5, and 4.0. The circular markers represent simulation results on the BA scale-free network, while the curves represent the theoretical analysis obtained from Equation (13).
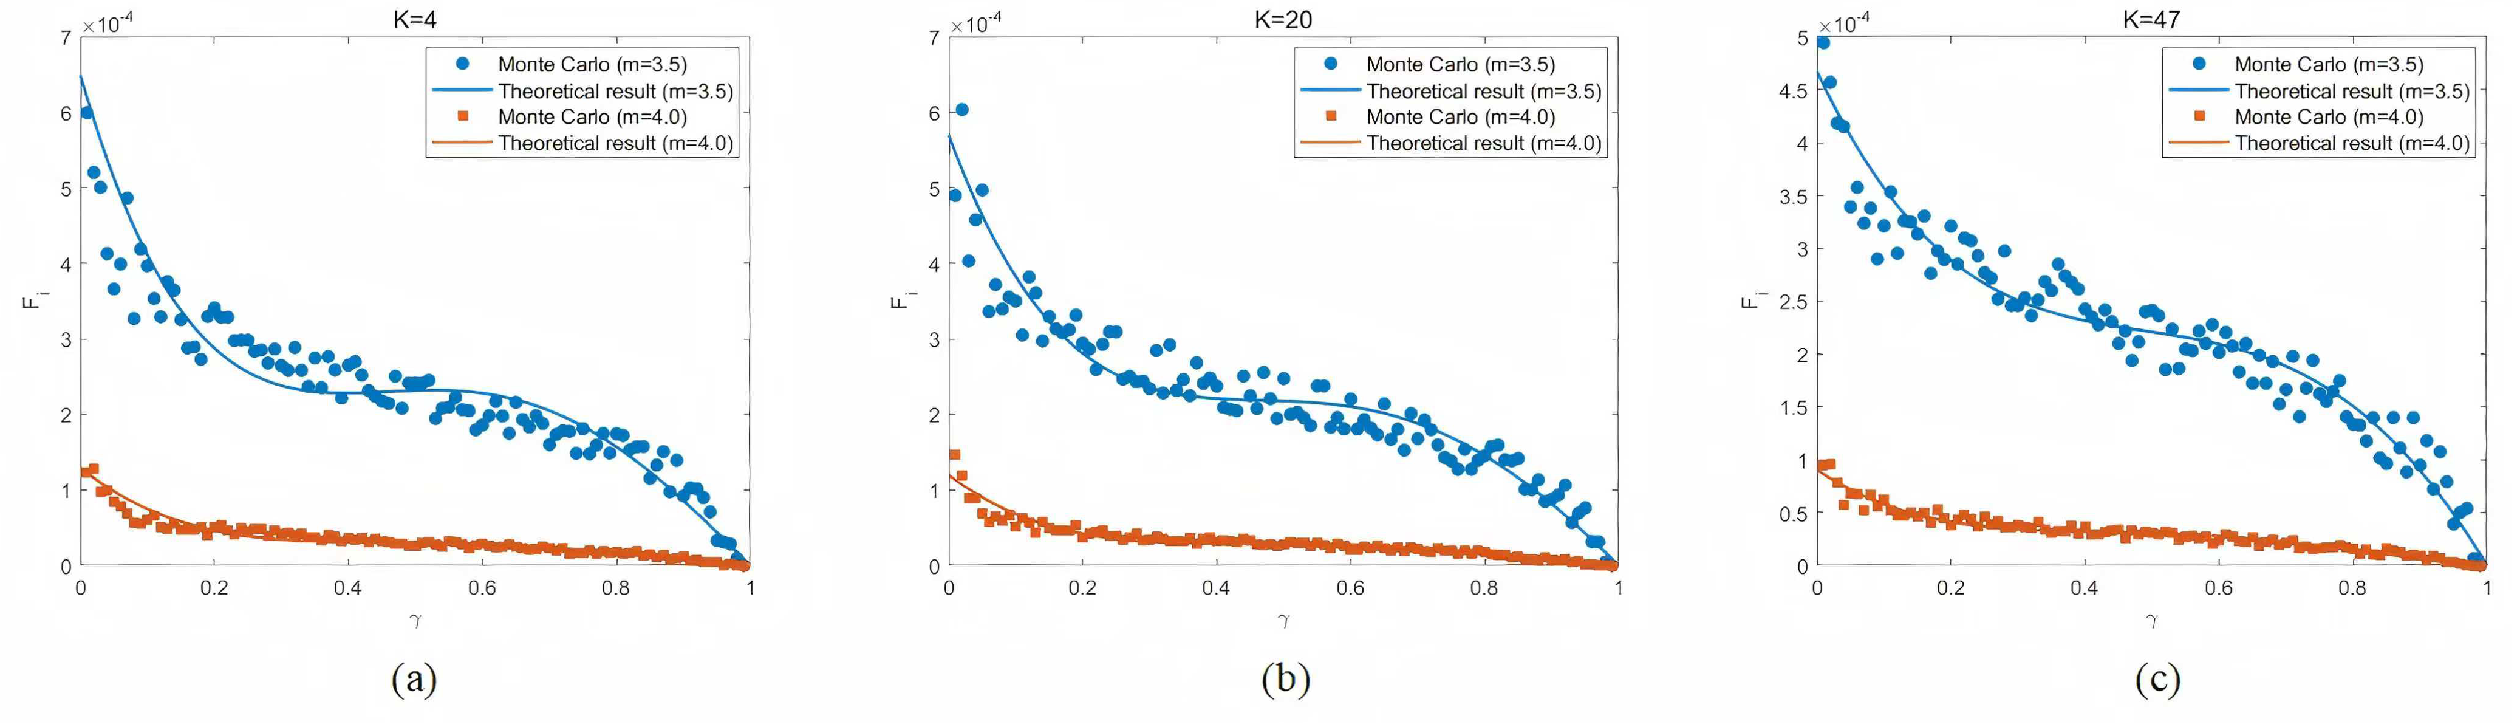
Figure 4.
The probability distribution of EE in the BA scale-free network without resetting compared to the BA scale-free network with resetting (where the central node is the resetting node and the resetting rate ).
Figure 4.
The probability distribution of EE in the BA scale-free network without resetting compared to the BA scale-free network with resetting (where the central node is the resetting node and the resetting rate ).
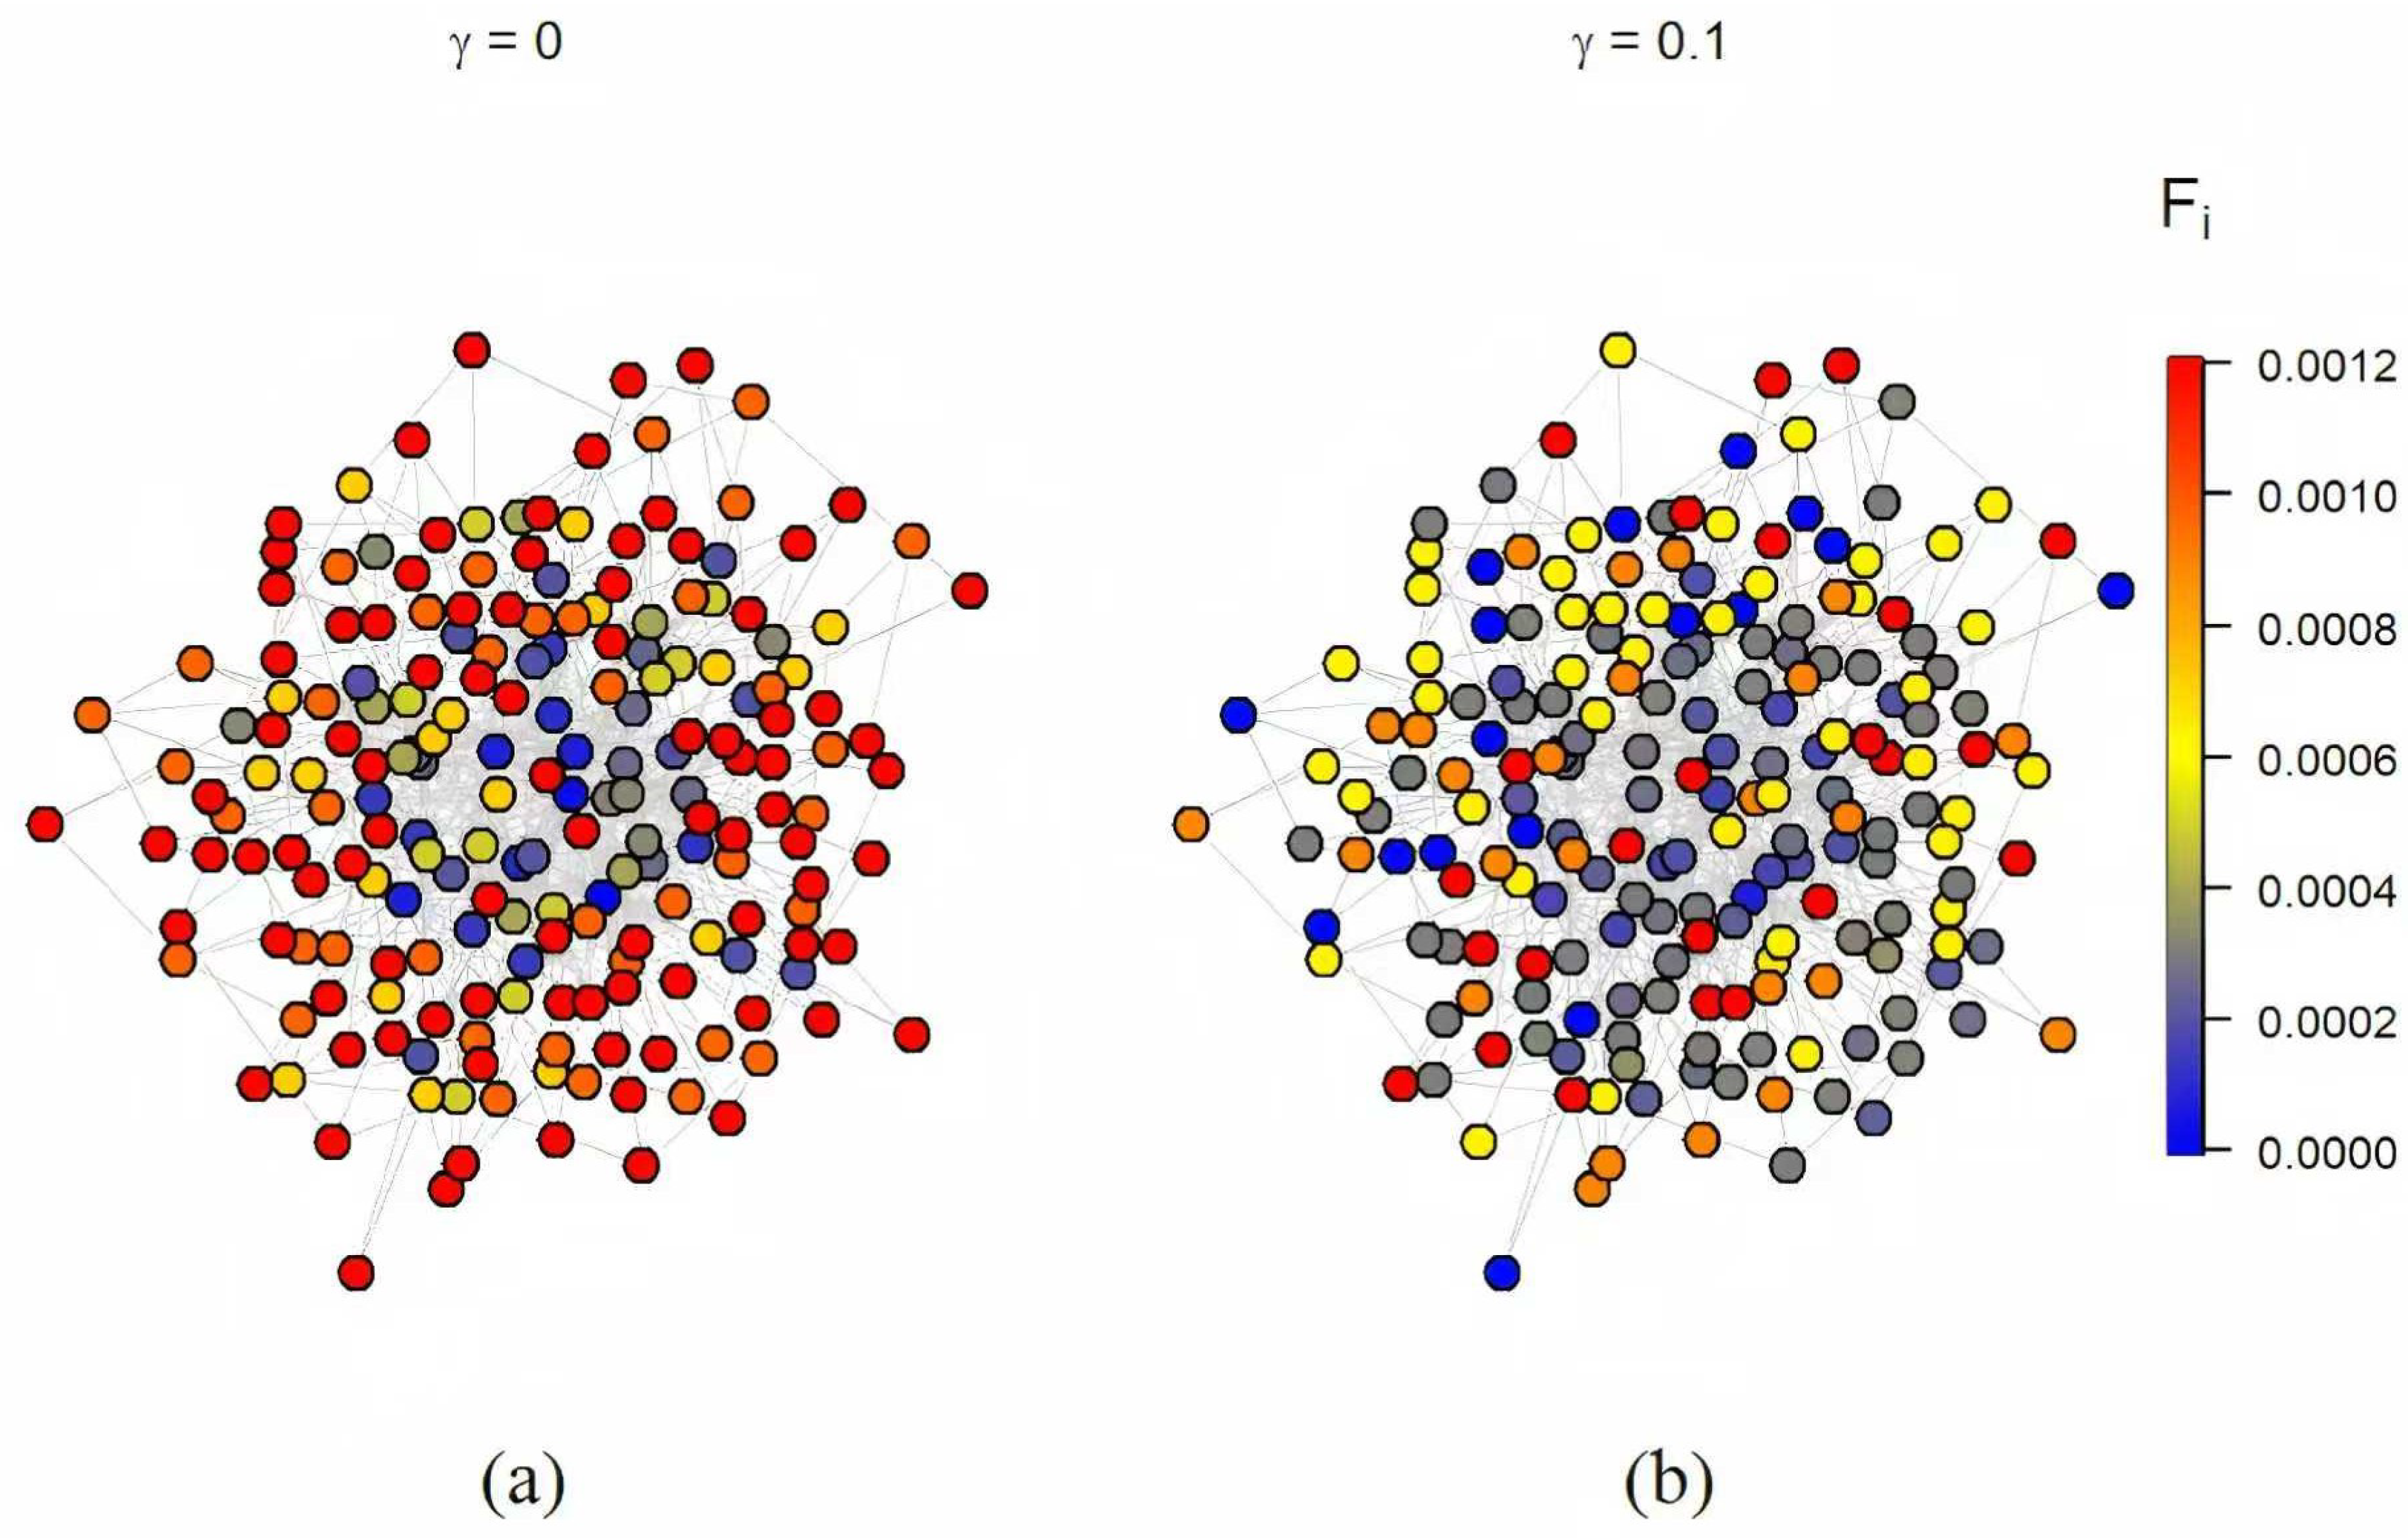
Figure 5.
The distribution of average occupation in the BA scale-free network with resetting rates and .
Figure 5.
The distribution of average occupation in the BA scale-free network with resetting rates and .
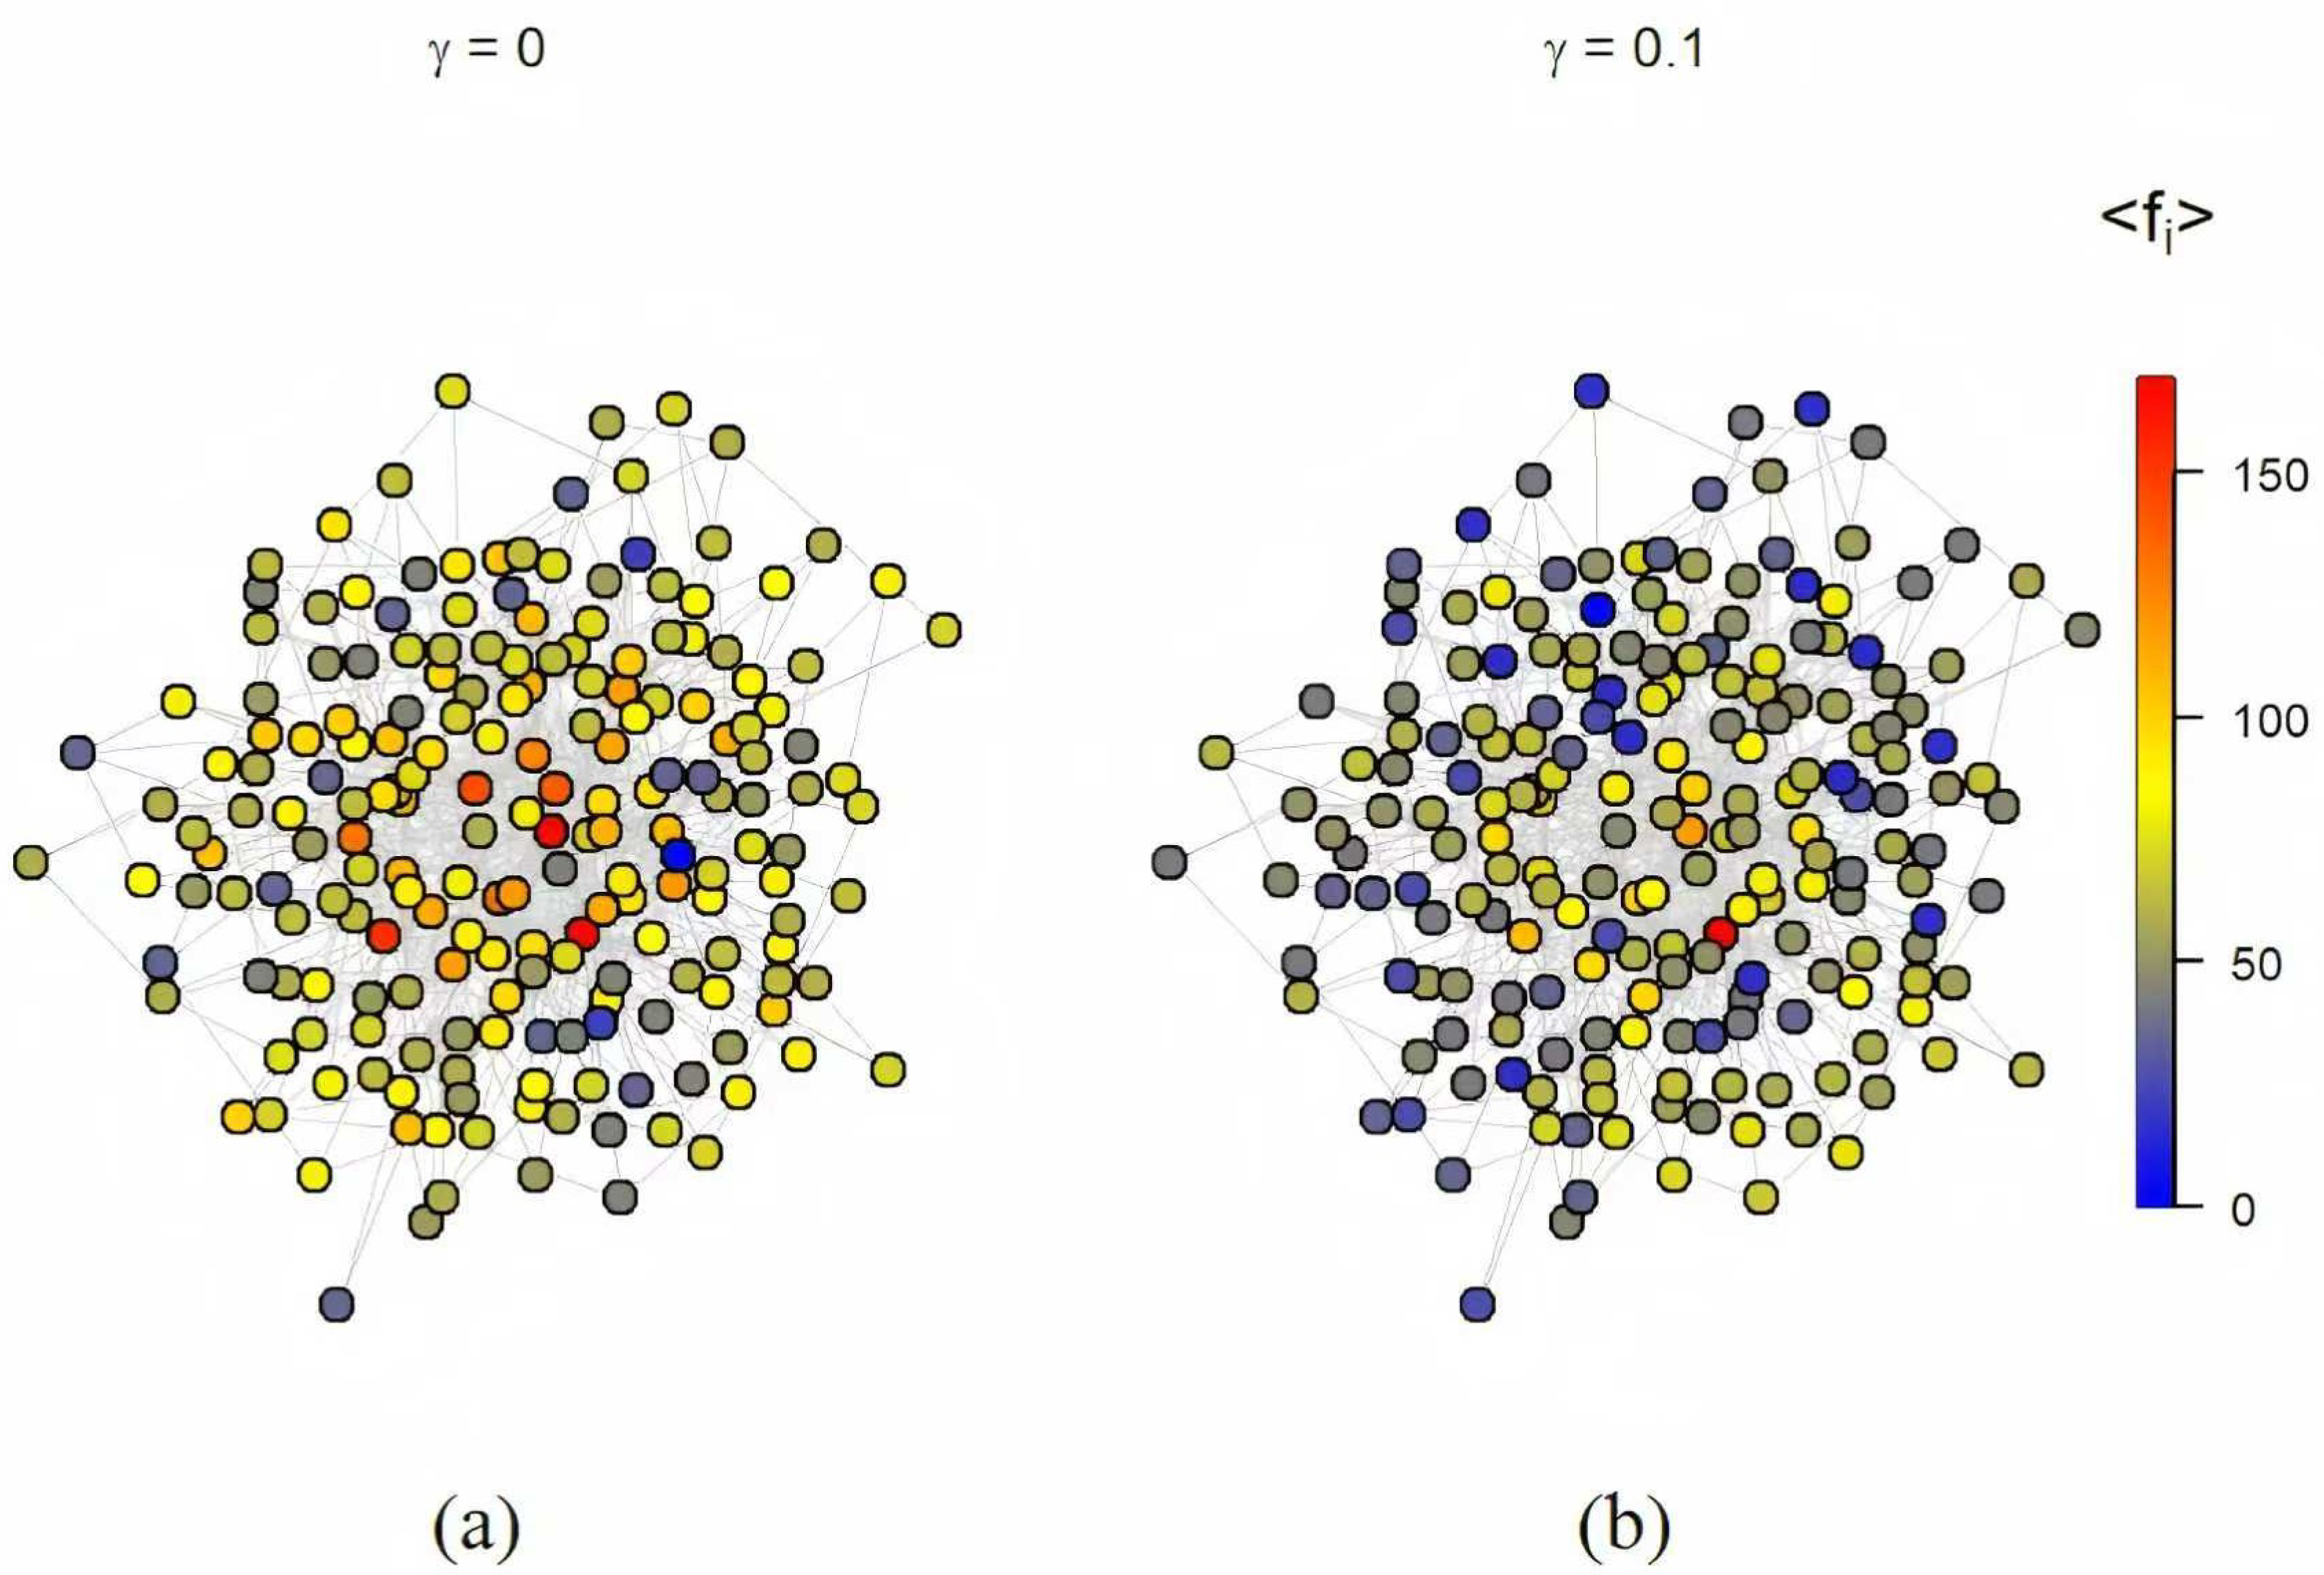
Figure 6.
The distribution of event sizes on the BA scale-free network under different resetting rates, with the x-axis representing node number, (a),(b). Nodes are sorted in descending order of degree, and nodes with the same degree are sorted in ascending order of their distance to the resetting node, and the probability is indicated using a color map.
Disclaimer/Publisher’s Note: The statements, opinions and data contained in all publications are solely those of the individual author(s) and contributor(s) and not of MDPI and/or the editor(s). MDPI and/or the editor(s) disclaim responsibility for any injury to people or property resulting from any ideas, methods, instructions or products referred to in the content. |
© 2025 by the authors. Licensee MDPI, Basel, Switzerland. This article is an open access article distributed under the terms and conditions of the Creative Commons Attribution (CC BY) license (http://creativecommons.org/licenses/by/4.0/).
Copyright: This open access article is published under a Creative Commons CC BY 4.0 license, which permit the free download, distribution, and reuse, provided that the author and preprint are cited in any reuse.


