
Submitted:
10 September 2025
Posted:
10 September 2025
You are already at the latest version
Abstract
Multiferroic composites of xNi0.8Zn0.2Fe2O4/(1-x)BaTiO3 (x = 0, 0.1, 0.3, 0.5, labeled NZFO/BTO) with ~100 nm particle size were synthesized via high-energy ball milling and thermal annealing. The X-ray diffraction shows a co-existence of the ferromagnetic phase of NZFO and the ferroelectric phase of BTO. Our observations indicate that saturation, remanence, and coercivity progressively increase with increasing NFO content, specifi-cally from x = 0 to x = 0.5. At x = 0.1, the maximum electric polarization, remanent electric polarization, coercivity and electric power loss density reach their maximum values of ~ 0.057, 0.018, 3.25 and 0.222, respectively, for an applied electric field less than 10 kV/cm. These multiferroic composites demonstrate excellent electromagnetic wave absorption capabilities from 2 to 18 GHz. With a sample thickness of 2.5-3.5 mm, a minimum reflec-tion loss of -41.51, -37, -28.72 dB corresponding to frequencies of 12.52 GHz, 11 GHz and 9.32 GHz. The effective absorption bandwidth for this sample is 11.5-16 GHz, indicating optimal impedance and attenuation matching and effective absorption of electromagnetic waves throughout the Ku bands. These outcomes reveal the capability for wideband ab-sorption uses in radar invisibility technology and electromagnetic insulation.
Keywords:
multiferroic
; electromagnetic
; ferroelectric
; ferromagnetic
; microwave absorption
1. Introduction
Nowadays, microwaves power wireless communication and biomedical applications due to their rapid transmission, wide frequency range, and strong anti-interference capabilities, enabling efficient data transfer in devices like mobile phones, wireless networks, satellites, and radar, thus driving societal and technological progress. However, their widespread use causes electromagnetic pollution, which disrupts electronic devices and poses health risks, including cancer and neurological issues [1,2,3,4,5]. To address this, microwave-absorbing materials have been developed to convert electromagnetic energy into heat, reducing radiation and protecting both the environment and human health [3,4,5,6,7,8]. These materials, categorized into ceramics, magnetic metals, and carbon-based types, effectively absorb EM waves, particularly in the X and Ku bands (8–18 GHz), through dielectric and magnetic losses [9,10,11,12,13,14]. Among them, multiferroic composites, combining ferroelectric and ferromagnetic properties, outperform single-phase materials due to their robust magnetoelectric coupling, high stability, and efficiency at room temperature [15,16,17]. This makes them ideal for applications beyond EM wave absorption, including radar stealth, electromagnetic compatibility, data storage, sensors, and energy harvesting, fostering interdisciplinary innovation [11,16,17]. Multiferroic composites typically consist of two phases: a ferroelectric phase, such as BaTiO3 (BTO), and a ferromagnetic phase, often MFe2O4 ferrites (where M is Ni, Zn, Co, etc.). In EM wave absorption applications, BTO and MFe2O4 are key components, each contributing distinct properties to enhance the composite’s absorption efficiency [10,12,18,19]. BTO, a leading ferroelectric material, is characterized by a high piezoelectric coefficient and significant dielectric loss, serving as the dielectric component. Its tetragonal crystal structure features 90° domain walls that oscillate under microwave frequencies, generating elastic shear waves and dissipating energy through Debye-like relaxation, a primary mechanism for microwave absorption. Oxygen vacancies in BTO’s lattice slow domain wall movement, enhancing dielectric loss and improving absorption efficiency [20]. With a high dielectric constant and tunable loss in the GHz range, BTO efficiently converts EM energy into heat. Absorption performance is highly dependent on particle size: BTO nanoparticles (50–100 nm) exhibit superior absorption due to their high surface-to-volume ratio, increased domain wall density, and optimized oxygen vacancy effects, achieving reflection losses as low as -26 dB, ideal for Ku-band applications. In contrast, larger microscale particles (>1 µm) are less effective due to reduced domain wall mobility. Optimizing particle size and oxygen vacancy concentration further enhances performance [18,20]. Therefore, to absorb electromagnetic waves in the Ku band, the development of BTO materials with a sufficient quantity and a particle size of approximately 100 nm is considered to play a crucial role.
MFe2O4 ferrites complement BTO in composites by providing magnetic loss, particularly in the Ku band, through mechanisms such as magnetic domain resonance and eddy current losses. Ferrites like Ni-Zn or Mn-Zn enhance composite performance due to their high magnetic permeability, which improves impedance matching with free space, allowing more EM energy to penetrate the material rather than being reflected [19]. The synergy between BTO’s dielectric loss and MFe2O4’s magnetic loss creates a dual-loss mechanism, broadening the absorption bandwidth and increasing overall efficiency [15]. BTO’s high dielectric constant is balanced by the magnetic properties of ferrites, optimizing permittivity and permeability for effective absorption. The magnetic properties of ferrites (e.g., saturation magnetization, coercivity) and BTO’s dielectric properties (e.g., dielectric constant, loss tangent) can be tuned by adjusting composition, particle size, or ferrite loading (typically 10–50% by weight). Excessive ferrite loading may reduce BTO’s dielectric loss, making an optimal balance critical. Nanoscale ferrite beads, due to their high surface area, integrate effectively with BTO nanoparticles ( about 100 nm), aligning resonance frequencies with the Ku band to enhance absorption [20].
Beside, numerous studies on the electromagnetic wave absorption capabilities of multiferroic materials composed of MFe2O4/BTO have reported impressive results for absorption in the Ku and X band; however, the absorption bandwidth remains relatively narrow (approximately 2–3 GHz) [21,22]. Among MFe2O4 ferrites, Ni1−xZnxFe2O 4, a soft magnetic material with an inverse spinel structure, offers excellent thermal stability and high electrical resistivity [19,23,24]. The incorporation of Zn2+ ions into NiFe2O4 enhances magnetization by reconfiguring cation distribution, with Zn2+ ions preferentially occupying tetrahedral sites [19,23]. Currently, the NZFO material has attracted significant research interest regarding its synthesis methods and properties due to its typical soft magnetic characteristics, which offer numerous practical applications [25,26,27,28,29]. Additionally, when combined with ferroelectric materials, it can play a role in tuning the dielectric constant and altering the loss characteristics across the frequency range of 1–18 GHz. With the presence of NZFO, at these frequencies, the primary mechanism contributing to the dielectric constant is dipole polarization. In the dipole polarization model, the orientation process of dipoles may not be fast enough to induce changes in the external field; consequently, as the frequency increases, the real part of the electrical permittivity decreases. The real and imaginary magnetic permeabilities indicate that this behavior is typical for ferrimagnetic materials. This suggests that the primary losses in NZFO-based composites can be attributed to electrical losses (dipole polarization) [30]. Recently, Moitra D and colleagues demonstrated that Ni0.8Zn0.2Fe2O4 (NZFO) is an effective magnetic loss component, dissipating EM energy through natural resonance and eddy current losses due to its high saturation magnetization and resistivity [31]. When combined with reduced graphene oxide (RGO), the NZFO-RGO composite achieves a minimum reflection loss of approximately 99% in the X-band (10.22–12.4 GHz), benefiting from RGO’s lightweight nature, which addresses issues such as high density and narrow absorption bands in other ferrites [32]. However, studies on the EM wave absorption capabilities of multiferroic composites formed by combining the ferromagnetic phase Ni0.8Zn0.2Fe2O4 with the ferroelectric phase BTO have not been previously reported. In this study, the material xNi0.8Zn0.2Fe2O4/(1-x)BaTiO3 will be synthesized and investigated for its electrical and magnetic properties as a function of the NZFO ferromagnetic phase content using high-energy mechanical milling combined with heat treatment. Based on these findings, the material with optimal electrical and magnetic properties will be selected to evaluate its EM wave absorption performance in the 2–18 GHz frequency range. Ongoing research into NZFO/BTO composites marks a significant advancement in the field of multiferroic materials, expanding their potential for high-frequency EM wave absorption and shielding applications in the X or Ku bands for military purposes.
2. Materials and Methods
High-purity (≥ 99.9%) NiO, ZnO, Fe₂O₃, BaCO₃, and TiO₂ powders were weighed in stoichiometric ratios and dried to eliminate moisture. NZFO and BTO powders were separately milled for 1 hour in a SPEX SamplePrep 8000D Mixer/Mill at 875 rpm, pressed into pellets at 7000 kg/cm², and sintered above 1000°C for 5 hours. The resulting NZFO and BTO were ground into fine powders, weighed to form composites with x = 0, 0.1, 0.3, and 0.5, co-milled for 1 hour, pressed into pellets at 7000 kg/cm², and annealed at 700°C for 5 hours with a 5°C/min heating rate. Post-sintering, the samples underwent high-energy ball milling for 1 hour in air, yielding fine powders. The samples were analyzed as follows: (i) Structural and Morphological Analysis: X-ray diffraction (XRD) using a Thermo Scientific Equinox 5000 determined crystal structure; SEM images from a Hitachi Fe-SEM S4800 assessed particle size and morphology; EDX with an Oxford Instruments Aztec system evaluated elemental composition. (ii) Electrical and Magnetic Properties: P(E) hysteresis loops were measured with a Precision LC II Model 609 under a 1.25 kV/cm field; M(H) hysteresis loops were characterized using a vibrating sample magnetometer. (iii) Microwave Absorption Properties: NZFO/BTO powders were mixed with paraffin (4:6 ratio), shaped into toroidal samples, and tested for S-parameters using a Keysight PNA-X VNA (2-18 GHz). Complex permittivity and permeability were derived via the Nicolson-Ross-Weir method, and microwave absorption was calculated using transmission line theory.
3. Results and Discussion
This section may be divided by subheadings. It should provide a concise and precise description of the experimental results, their interpretation, as well as the experimental conclusions that can be drawn.
X-ray diffraction (XRD) patterns for all samples at room temperature are presented in Figure 1a. The x = 0 sample exhibits a pure BTO phase with a tetragonal structure, denoted by Miller indices (hkl) like (100), (110), (111), (002), (210), (211), and (220). Other samples show NFO phase peaks (cubic structure, marked with asterisks *), alongside BTO peaks. No peak shifts or unusual peaks were detected, indicating stable BTO and NZFO phase coexistence without new phases forming during heat treatment. Raman spectroscopy is regarded as an effective method for detecting minor structural deformations and symmetry characteristics in perovskite materials. The Raman spectra of the xNZFO/(1-x)BTO composite are presented in Figure 1(b). The xNZFO/(1-x)BTO composite is characterized by a fundamental BaTiO3 (BTO) matrix possessing a perovskite structure, and thus, the same Raman modes as those observed in pure BTO are exhibited. The assignment of spectral bands was conducted based on reference data for pure BTO. The resonance frequencies corresponding to [E(LO), A1(LO), E(TO)], [E(TO), A1(TO)], and [E(LO), A1(LO)] were found to be positioned at 535.77 cm⁻¹ and 731.45 cm⁻¹, respectively, across all samples, indicating that a tetragonal phase is maintained by the material. As the NZFO concentration is increased, the intensity of the spectral peaks associated with wavenumbers 529.77 cm⁻¹ and 709.84 cm⁻¹ is significantly reduced, accompanied by a gradual broadening trend. With a progressive increase in NZFO content, the spectral peaks linked to wavenumbers 172.07 cm⁻¹, 535.77 cm⁻¹, and 731.45 cm⁻¹ are slightly shifted to peaks corresponding to wavenumbers 176.07 cm⁻¹, 519.77 cm⁻¹, and 731.45 cm⁻¹. These shifts are attributed to variations within the perovskite structure of the composite. Although both the ferroelectric BTO phase and the ferromagnetic NFO phase coexist within the composite, no chemical interactions are observed. Nonetheless, electromagnetic interactions are still manifested at the interface between the two phases, resulting in a minor impact on the material’s structure.
Scanning electron microscopy (SEM) images (Figure 2 a-c) of BTO, BTNF1, BTNF3, and BTNF5 reveal uneven grains, ranging from tens to hundreds of nanometers, with smaller particles adhering to larger ones. Grain orientation seems random due to diverse interactions. Average grain size (~100 nm) was determined using grain size analysis software with a Hitachi S4800 FE-SEM. Low electrical conductivity led to indistinct grain boundaries, causing particle clustering. Particle size remained uniform across compositions and NZFO content. EDX spectra confirmed the presence and distribution of Ba, Ti, O in BTO, and Ni, Zn, Fe, O in composite samples, with element ratios closely matching nominal values and no foreign elements detected, as shown in Figure 2 (d-f).
Figure 3 shows M(H) hysteresis loops for all samples at room temperature. Most samples display ferromagnetic behavior, except the BTO sample, which is clearly paramagnetic with low magnetization. In NZFO/BTO composites, magnetization rises significantly with increasing NZFO content, with saturation magnetization (Ms) increasing from 10.11 to 29.48 emu/g and remanent magnetization (Mr) growing from 0.64 to 1.65 emu/g as the NZFO fraction (x) ranges from 0.1 to 0.5, aligning with previous studies. Coercivity (Hc) drops from 57.31 Oe at x = 0.1 to 23.62 Oe at x = 0.3, then slightly rises toward x = 0.5, a pattern noted in some research [32,33], though the link between ferrite content and coercivity can be complex. In multiferroic composites, higher magnetic phase content typically boosts both Ms and Mr.
This trend is consistent with our findings for xNi0.7Zn0.3Fe2O4/(1−x)BaTiO3 composites, where the saturation magnetization increased with a greater magnetic phase content [33]. Our results are further supported by studies on similar multiferroic materials, such as the (1−x)Ba0.85Ca0.15Ti0.9Zr0.1O3/xCo0.6Zn0.4Fe1.7Mn0.3O4 (BCZT/CZFMO) composites, in which Ms values varied from 6.32 to 41.08 emu/g as the ferrite concentration was increased [34]. The NZFO ferromagnetic phase significantly enhances the magnetic properties of the composite material. Unlike saturation magnetization, the coercive field (Hc) in multiferroic composites exhibits complex behavior. Studies suggest Hc often increases with higher magnetic phase content compared to pure components, rather than simply decreasing. In xNi0.7Zn0.3Fe2O4/(1−x)BaTiO3 (NZF/BT) composites [33], Hc decreased with higher ferroelectric phase content, implying that greater magnetic phase concentration raises Hc. Notably, Hc values for NZF/BT composites exceeded that of the pure xNi0.7Zn0.3Fe2O4/(1−x)BaTiO3 sample (0.018 Oe) [33], indicating that adding a magnetic phase boosts the coercive field. Similar trends were observed in BCZT/CZFMO composites, where Hc surged with increasing ferrite content [34], due to ferromagnetic CZFMO pinning ferroelectric domains, impeding domain wall movement and requiring a stronger magnetic field to reverse magnetization [34]. These results confirm the ferromagnetic phase’s critical role in modifying Hc in multiferroic composites. However, the non-monotonic behavior of Hc (decreasing then slightly increasing at high concentrations) lacks direct explanation in the sources, likely influenced by complex factors like microstructural changes, grain size, and interface effects [12,16].
Figure 4 illustrates the ferroelectric hysteresis loops P(E) for NZFO/BTO composites, measured at room temperature with a peak voltage of 10 kV and a 50 Hz frequency. These loops clearly exhibit ferroelectric behavior. As NZFO content increases from x = 0 to x = 0.5, the loops widen, and electric polarization rises significantly. The rounded, non-saturated P(E) loops result from leakage currents due to the less resistive ferrite phase compared to the ferroelectric phase. The remanent polarization (Pr) exhibits significant variation with increasing x, driven by space charge effects at the ferroelectric-ferrite interface, resulting from differences in electrical conductivity and permittivity. Pr serves as an indirect indicator of magnetoelectric coupling strength in multiferroic materials. A higher Pr enhances strain generation under an electric field, which transfers to the magnetostrictive phase, thereby modifying its magnetic properties. A larger polarization change (ΔP, from +Pr to −Pr or vice versa) maximizes strain transfer, thereby enhancing the magnetoelectric response. The piezoelectric coefficient, closely tied to Pr, reflects robust ferroelectric domain alignment, amplifying strain and facilitating effective strain-mediated magnetoelectric coupling. These findings are consistent with previous studies on NZF/BT composites [33], where ferroelectric properties weakened as the nickel zinc ferrite content increased. This highly conductive phase led to atypical P-E hysteresis loop shapes. Specifically, Pr in NZF/BT composites increased from 0.19 µC/cm² at 10% NZF to 0.44 µC/cm² at 70% NZF, then decreased to 0.14 µC/cm² at 90% NZF, demonstrating non-monotonic behavior [33]. Furthermore, when the NZFO content reaches x = 0.1, both the remanent polarization (Pr) and coercive field (Ec) increase sharply. This can be attributed to: (i) pinning of ferroelectric domains by the ferromagnetic phase, which impedes domain wall motion and necessitates a higher electric field for polarization reversal [11]; (ii) charge leakage from the conductive ferrite phase, which shorts polarized charges, reducing polarization and complicating P-E hysteresis loops [14,15]; and (iii) factors such as sample thickness, defects, mechanical stress, preparation conditions, and thermal treatment, all of which influence Ec [20]. Defects, such as oxygen vacancies, can act as pinning centers, hindering domain wall motion, leading to ferroelectric hardening and an increase in Ec [18,32]. However, as the ferromagnetic phase content continues to rise to higher values (x ≤ 0.5), both the coercive field (Ec) and energy loss increase significantly.

Table 1.
The magnetic characteristics (remanent magnetization (Mr), saturation magnetization (Ms), and coercive force (Hc)) and ferroelectric characteristics (coercive field (Ec), maximum electrical polarization (Pm), and residual polarization (Pr)) were determined for the NZFO/BTO composites.
Table 1.
The magnetic characteristics (remanent magnetization (Mr), saturation magnetization (Ms), and coercive force (Hc)) and ferroelectric characteristics (coercive field (Ec), maximum electrical polarization (Pm), and residual polarization (Pr)) were determined for the NZFO/BTO composites.
| Sample/ Method | x | Ms (emu/g) | Mr(emu/g) | Hc (Oe) | Pm(µC/cm2) | Pr(µC/cm2) | Ec(kV/cm) | Refs. |
|
xNZFO/(1-x)(BTO)/High energy ball milling |
0.0 | 0.549 | 0.09 | 57.31 | 0.061 | 0.0067 | 0.98 | This work |
| 0.1 | 10.11 | 0.64 | 28.68 | 0.057 | 0.018 | 3.25 | ||
| 0.3 | 19.36 | 1.16 | 23.62 | 0.055 | 0.012 | 2.1 | ||
| 0.5 | 29.48 | 1.65 | 29.45 | 0.048 | 0.011 | 2.05 | ||
|
xNi0.7Zn0.3Fe2O4/ (1-x)BaTiO3/ Solid-state reaction. |
0.1 | 4.1 | 0.48 | 48.67 | 0.21 | 0.14 | 7.6 | [33] |
| 0.3 | 20.8 | 3.43 | 54.47 | 0.44 | 0.55 | 7.6 | ||
| 0.5 | 37.6 | 7.21 | 68.03 | 0.3 | 0.52 | 5.1 | ||
| 0.7 | 55.5 | 5.04 | 39.17 | 0.75 | 0.25 | 4 | ||
| (1-x)BaTiO3/xCoFe1.8 Zn0.2O4/ Solid-state reaction | 0.1 | 8.9 | 0.44 | - | 3.18 | 0.66 | 4.48 | [35] |
| 0.2 | 14.9 | 0.49 | - | 4.72 | 0.87 | 3.14 | ||
| 0.3 | 21.5 | 1.76 | - | 5.25 | 0.91 | 2.86 | ||
| 0.4 | 28.6 | 1.95 | - | 7.15 | 2.07 | 5.92 | ||
|
xNiFe2O4/(1-x)BaTiO3 Solid-state reaction |
0 | - | - | - | 18 | 7.7 | 4.5 | [36] |
| 0.1 | 5 | 0.18 | 22 | 7 | 2.0 | 7.2 | ||
| 0.2 | 9.5 | 0.26 | 22 | 9 | 6.6 | 18.1 | ||
| 0.3 | 15 | 0.75 | 27 | 52 | 50 | 34.4 | ||
|
xNiFe2O4/(1-x)BaTiO3/ High energy ball milling |
0 | - | - | - | 0.038 | 0.004 | 0.4 | [38] |
| 0.1 | 4.4 | 1.8 | 372.0 | 0.045 | 0.011 | 0.7 | ||
| 0.2 | 8.2 | 3.1 | 485.0 | 0.048 | 0.015 | 0.8 | ||
| 0.3 | 11.7 | 4.9 | 507.6 | 0.056 | 0.024 | 1.3 | ||
| 0.4 | 15.2 | 6 | 519.3 | 0.069 | 5.78 | 2.0 |
This is illustrated in the inset at the bottom right corner of Figure 4. The phenomenon is explained by the following factors: the excessive presence of the NZFO ferromagnetic phase pins the ferroelectric BTO domain walls. NZFO magnetic particles act as obstacles, impeding or pinning the motion of ferroelectric domain walls, making it more challenging to reorient ferroelectric polarization. Consequently, a higher external electric field is required to achieve polarization reversal. Additionally, defects such as oxygen vacancies or complexes involving Fe and Ti can serve as pinning centers, further complicating polarization and increasing Ec [29]. These effects impact the material’s energy storage capacity and contribute to changes in energy loss density. To choose materials with high attenuation properties that can efficiently absorb and block electromagnetic waves, this research [38,39,40,41,42] evaluated and examined their dissipation and energy retention abilities. Later sections will explore related discussions in detail. The retrievable energy storage density and effectiveness can be calculated using the given formulas [38]:
In the provided formulas, Eapplied is the external electric field, Pinduced is the resulting polarization, and ηP−E indicates energy storage efficiency. WUE and WLE denote recoverable and dissipated energy density, respectively. The inset in the top left of Figure 4 displays P(E) curves and the relationship between WUE, WLE, and ηP−E with NZFO content in samples, measured at 10 kV. The research results on the energy storage and loss capabilities of NZFO/BTO materials are specifically presented in the inset figure located at the top left corner of Figure 4. The values of stored energy density and energy loss vary significantly with the NZFO ferromagnetic phase content. As the ferromagnetic phase content increases, the energy loss density values achieved are 0.04, 0.222, 0.16, and 0.15, respectively, while the storage efficiency changes correspondingly to 88.36, 43.08, 68.06, and 51.96%. This indicates that at an NZFO ferromagnetic phase content of x = 0.1, the energy loss density reaches its highest value. Figure 5 displays how frequency affects the dielectric constant and permeability of NZFO, BTO, and BTBF1 samples, highlighting impacts on their real and imaginary components and dielectric/magnetic losses.
The energy storage and loss properties of a material are influenced by the frequency-dependent behavior of its dielectric constant and magnetic permeability. The real part of the dielectric constant (Ɛ’), which reflects the material’s electrical energy storage capacity, is typically reduced as frequency increases. This is illustrated in Figure 5(a-b), where ϵ’ for BTO peaks at approximately 2.88, 12.87, and 16.2 GHz, and for NZFO at 8.16, 13.2, and 16.1 GHz, while BTNF1 shows peaks at 7.84 and 16.08 GHz. The material’s energy dissipation ability is tied to the imaginary part of the dielectric constant (Ɛ’’). Within the 2–18 GHz range, multiple Ɛ’’ peaks are observed. For BTO, Ɛ’’ peaks at 4.8, 6.8, and 8.56 GHz, with decreasing magnitudes. For NZFO, peaks occur at 4, 10.1, and 11.92 GHz, and for BTNF5, the highest Ɛ’’ values are recorded at 10.32 and 12.08 GHz, aligning with peak shifts in NZFO and BTO. Notably, in the 11.5–13.3 GHz range, BTNF1’s Ɛ’’ significantly surpasses that of NZFO and BTO, as highlighted in the circled graph region, indicating a substantial enhancement of Ɛ’’ by the NZFO phase in the multiferroic material. This increase is attributed to: (i) delayed charge movement and accumulation in the 11.5–13.3 GHz AC frequency range, causing energy dissipation due to conductivity differences from the ferroelectric NZFO phase [11]; and (ii) lattice defects from fabrication, creating charge carrier traps that lead to energy loss through interactions with the lattice [37]. Additionally, the material’s permeability is significantly altered by frequency, as shown in Figure 5(c-d). The real part of the permeability (μ’) is gradually reduced with increasing frequency across the 2–18 GHz range, with BTNF1 and NZFO showing peaks at similar frequencies, underscoring the strong influence of the ferromagnetic NZFO phase on μ’ in the multiferroic material.
The imaginary part of the permeability (μ’’) varies significantly among BTO, NZFO, and BTNF1 materials. The frequency-dependent μ’’ curves for NZFO and BTNF1 display similar shapes but differ in peak positions, with NZFO peaking at 11.12 GHz and BTNF5 at 12.32 GHz, while peak intensity remains nearly constant. This indicates that the ferromagnetic NZFO phase primarily drives the μ’’ behavior in BTNF1. The magnetic loss peak results from delayed domain wall motion, influenced by the applied magnetic field and lattice defects. Across all samples, in the 8–16 GHz range, the imaginary parts of the dielectric constant and permeability exhibit a decreasing trend with increasing frequency, reflecting significant dielectric and magnetic losses due to the NZFO phase. This is evident in Figure 6, showing (a) magnetic loss tangent and (b) dielectric loss tangent as functions of frequency for NZFO, BTO, and BTNF1, marked by purple circles. The loss frequency range aligns with trends in the imaginary parts of the dielectric constant and permeability. Additionally, the ferromagnetic phase enhances electric and magnetic field energy loss in the 3–6 GHz range, highlighted by another purple circle in Figure 6. These findings confirm the substantial role of the NZFO phase (x = 0.1) in boosting the material’s electromagnetic wave absorption, consistent with prior studies [14,22,32].
The energy dissipation mechanism is further explored using Cole-Cole diagrams. Figure 7 shows the Ɛ′ versus Ɛ′′ interrelationship curves for pure NZFO, BTO, and BTNF1 composites across the 2–18 GHz range. The Cole-Cole semicircles from these plots indicate the Debye relaxation process, confirming polarization relaxation characteristics. This aligns with classical Debye theory, which describes the relationship between Ɛ′ and Ɛ′′ [43].
Cole-Cole plots are used to investigate the absorption mechanism, with the x-axis showing the real part and the y-axis the imaginary part of the complex dielectric constant. Here, ϵs represents the static dielectric constant, and Ɛ∞ denotes the dielectric constant at infinite frequency. A single semicircle in a Cole-Cole plot typically signifies a single Debye polarization relaxation process. The presence of semicircles in the Cole-Cole plots for BTO, BTNF5, and paraffin samples confirms Debye relaxation [43]. An increased number of Debye semicircles correlates with enhanced polarization capability and dielectric loss within the material. Figure 7 demonstrate these semicircles in all three samples, implying that in the 3–6 GHz, the polarization relaxation occurs in each during wave absorption. As microwaves interact with material imperfections, polarization centers form, leading to the creation of these Debye semicircles.
To evaluate the electromagnetic (EM) wave shielding and absorption properties of multiferroic composites with the composition xNZFO/(1-x)BTO, these were blended as fillers at 40% in paraffin, forming NZFO-Paraffin, BTO-Paraffin, and BTNF1-Paraffin composites. Their EM properties were measured in the 2–18 GHz range using a vector network analyzer, and Reflection Loss (RL) values were calculated using Formula (1), with results shown below.
Figure 8 depicts the Reflection Loss (RL) characteristics of NZFO-Paraffin, BTO-Paraffin, and BTNF5-Paraffin composites, each at a 40wt% mass ratio in paraffin. The figure includes 2D curves (a-c), 3D plots (d-f), and RL contour diagrams (g-i), where the x-axis represents frequency and the y-axis shows RL values. RL, the key indicator of electromagnetic wave (EMW) absorption, is determined using equations based on transmission line theory [44].
The normalized input impedance of the absorbing material is represented by Zin, with Z0 indicating the free space impedance. Material properties are defined by Ɛr (complex permittivity) and μr (complex permeability), with f denoting frequency, c the speed of light in free space, and d the absorber’s thickness. Previous studies [40] establish that an RL (Reflection Loss) value below -10 dB indicates effective absorption, reflecting over 90% electromagnetic wave (EMW) absorption. Analysis of RL(f) curves for all samples reveals absorption peaks at specific frequencies, varying with thickness.
For NZFO Sample: Absorption peaks were consistently observed across most thicknesses, except 1.5 and 2 mm, with minimum Reflection Loss (RLmin) values typically below -30 dB. At 2.5 mm thickness, the lowest RL reached -38.74 dB at 13.85 GHz, with an effective absorption bandwidth (EAB) surpassing 9.36 GHz. For thicknesses of 2.5–3.5 mm, RLmin ranged from -32.63 dB to -38.74 dB, corresponding to 10.26–13.85 GHz, with an EAB of approximately 10 GHz. At 4.0 mm and 4.5 mm, RLmin values hit -44.71 dB (16.41 GHz) and -49.48 dB (15.32 GHz), yielding EABs exceeding 11.84 GHz and 12.24 GHz, respectively.
For BTO Sample: As frequency rose from 1.5 to 3.5 GHz, thicker samples exhibited lower resonance peak frequencies. The RLmin reached -52.62 dB at 16.6 GHz, with an effective absorption bandwidth (EAB) of 6.64 GHz. For thicknesses of 2.5–3.5 mm, RLmin values in the 10–12 GHz range varied from -38.5 to -27.66 dB, corresponding to an EAB of 8.48–10.1 GHz, indicating a promising thickness range for electromagnetic wave absorption applications.
For BTNF1 Sample: The combined influence of the ferroelectric BTO and ferromagnetic NZFO phases results in the material’s electromagnetic wave absorption displaying characteristics of both phases, with notable distinctions. For samples with thicknesses of 2.5 mm, 3 mm, and 3.5 mm, RLmin values reached -41.51 dB, -37 dB, and -28.72 dB, respectively, at resonance frequencies (and effective absorption bandwidths, EAB) of 12.52 GHz (9.12 GHz), 11 GHz (10.32 GHz), and 9.32 GHz (11.2 GHz). Thicker samples exhibited higher resonance frequencies.
This research demonstrates the potential for applying NFO, BTO, and BTNF1 materials in electromagnetic wave absorption within the 11.5-16 GHz frequency range, corresponding to the Ku-band used in military applications, with thicknesses ranging from 2.5 to 3.5 mm. This thickness proves practical for future applications of EMW absorbing materials. For the BTNF1 material, increasing thickness leads to significant changes in RLmin and a migration of absorption peaks to lower frequencies, consistent with prior research. This fluctuation in RLmin and absorption capability at different thicknesses is attributed to the sample’s impedance matching during measurement. Our results are noteworthy compared to earlier studies on multiferroic materials integrating NiFe2O4 [35,36,37,38] or BaTiO3-family [13,21,22,37,49] compounds and other ferromagnetic substances, as detailed in Table 2.
The performance of these parameters depends on both the intrinsic properties of the composite material and the thickness of its absorptive layers. Among the materials studied, the BTNF1-paraffin composite demonstrates superior electromagnetic wave (EMW) absorption, making it an ideal candidate for high-performance applications. It exhibits exceptional Reflection Loss (RL) across practical thicknesses, achieving an RLmin of -41.52 dB at 12.52 GHz with a 2.5 mm thickness and -28.72 dB at 9.23 GHz with a 3.5 mm thickness, alongside an effective absorption bandwidth (EAB) exceeding 11.2 GHz (at RL = -10 dB), comparable to prior research. The BTNF1 composite’s tunable absorption profile is notable, with thicker layers consistently shifting absorption peaks to lower frequencies, as explained by the quarter-wavelength theory. This is illustrated in Figure 8(a)-(i), where increased thickness moves the effective absorption band to lower frequencies, with RL peaks shifting accordingly. As frequency rises and thickness decreases, RL values approach 0 dB, indicating reduced absorption efficiency. Although the full width of the maximum RL was not fully captured due to measurement limitations, the trends suggest significant applicability at higher frequencies. The attenuation coefficient (α), a key factor in reflection loss and material attenuation, is calculated using a formula derived from transmission line theory and the EMW propagation constant [50].
Figure 9 shows that the absorption coefficient (α) of BTO-paraffin samples exceeds that of NZFO and BTNF1 across the 2–18 GHz range. However, in the 11.5–14.5 GHz band, BTNF1 displays a significantly higher α than BTO and NZFO, highlighting NZFO’s influence. To quantitatively assess the impedance matching performance of 2.5 mm thick NZFO, BTO, and BTNF1 samples across frequencies, we plotted all impedance matching ratio values in the 2–18 GHz range. When Z = 1, the reflection coefficient is 0, indicating that electromagnetic waves incident perpendicularly from free space to the surface of the microwave-absorbing material achieve zero reflection, meaning perfect impedance matching at this point. The impedance matching ratio is considered optimal for samples when Z falls within the range of 0.8–1.2. Among all investigated samples, the BTNF1 sample exhibited high impedance matching performance in the wide frequency range of 11.5–16 GHz (purple circled region) and near 8 GHz. This is specifically illustrated in Figure 10. It can be observed that the NZFO ferromagnetic phase plays a crucial role in enhancing impedance matching in the Ku band within the 11.5–16 GHz frequency range. The BTNF1 composite, a uniform blend of piezoelectric BaTiO3 (BTO) particles and soft ferromagnetic Ni0.8Zn0.2Fe2O4 (NZFO) particles, exhibits the following absorption mechanisms in the 2–18 GHz range: (i) Dielectric loss in BaTiO3: BaTiO3 particles, characterized by piezoelectric properties and electric polarization vectors, oscillate under the influence of an alternating electric field from EMWs, generating internal friction and converting electric field energy into heat dissipated to the surrounding environment. (ii) Magnetic loss in NZFO: NZFO particles, with high permeability and characterized by magnetic moment vectors, undergo rotation and precession under an alternating magnetic field, leading to losses through magnetic hysteresis and resonance. This converts magnetic field energy into heat. (iii) Interfacial loss and leakage current: At an NZFO content of x = 0.1, the resistivity difference between NZFO (lower) and BaTiO3 generates leakage currents at their interfaces, significantly increasing EMW energy loss, coercive force, and remnant polarization, thereby enhancing the piezoelectric coefficient. The combined effects of dielectric loss, magnetic loss, and amplified interfacial loss due to leakage currents from the NZFO phase (x = 0.1) significantly improve the EMW absorption capability of the BTNF1 multiferroic composite.
4. Conclusions
The study successfully produced xNi0.8Zn0.2Fe2O4/(1-x)BaTiO3 composites (x = 0, 0.1, 0.3, 0.5) using a combination of high-energy mechanical milling and heat treatment. The addition of the NZFO ferromagnetic phase significantly enhanced both ferroelectric and ferromagnetic properties, resulting in increased saturation magnetization and magnetic remanence proportional to the NZFO content. The composition with x = 0.1 (BTNF1) was found optimal, delivering maximum remnant electric polarization and dielectric loss density, making it the top candidate for superior electromagnetic wave (EMW) absorption. At this composition, BTNF5 demonstrated exceptional absorption, achieving minimum reflection loss values of -41.51 dB at 12.52 GHz, -37 dB at 11 GHz, and -28.72 dB at 9.32 GHz for thicknesses of 2.5–3.5 mm. This wide effective absorption bandwidth (EAB) highlights the material’s ability to attenuate EMWs across a broad frequency range. In summary, the xNZFO/(1-x)BTO composites, particularly BTNF1, show great potential for Ku-band EMW absorption, making them ideal for applications like radar absorption and electromagnetic interference shielding.
Author Contributions
Conceptualization, Pham Xuan Thao, Dao Son Lam and Ngo Thu Huong; validation, Nguyen Thi Sa, Luu Thi Nhan; formal analysis, Tran Quang Dat, Luu Thi Nhan, Nguyen Thi Sa; investigation, Tran Quang Dat, Luu Thi Nhan; writing—original draft preparation, Pham Xuan Thao, Ngo Thu Huong; writing—review and editing, Dao Son Lam, Ngo Thu Huong; visualization, Dao Son Lam; project administration, Pham Xuan Thao. All authors have read and agreed to the published version of the manuscript.”
Funding
This research was funded by Hanoi University of Industry under Project No. 27-2025-RD/HD-ĐHCN.
Data Availability Statement
The data supporting this study’s findings are presented in the article.
Acknowledgments
This research is supported by Hanoi University of Industry under Project No. 27-2025-RD/HD-ĐHCN.
Conflicts of Interest
The authors declare no conflicts of interest.
References
- Sahil Sharma, Saidi Reddy Parne, Saran Srihari Sripada Panda, Suman Gandi. Progress in microwave absorbing materials: A critical review. Advances in Colloid and Interface Science 2024, 327, 103143. [CrossRef]
- Disha Sunil Aherrao, Charanjeet Singh, A. K. Srivastava. Review of ferrite-based microwave-absorbing materials: Origin, synthesis, morphological effects, dielectric/magnetic properties, composites, absorption mechanisms, and optimization. Journal of Applied Physics 2022, 132, 240701. [CrossRef]
- Y. E. Gunanto, M. P. Izaak, H. Sitompul, Y. Taryana, A. Mulyawan, J. Setiawan, Y. Yunasfi, W. A. Adi, A. Taufiq, R. Ramlan. Improvement of microwave absorbing capability on the soft magnetic/hard magnetic/perovskite composites. Physica Scripta 2024, 99, 125940. [CrossRef]
- Preechaphonkul W, Rattanadecho P. The effects of dielectric & thermal property functions on the thermal response during the focused microwave ablation treatment in the liver cancer model: Numerical investigation. Engineering Science 2023, 21, 788.
- He R, Nantung T, Olek J, Lu N. Use of dielectric constant for determination of water-to-cement ratio (W/C) in plastic concrete: Part 2: Comparison determined W/C values by ground penetrating radar (GPR) and microwave oven drying measurements. ES Materials & Manufacturing 2023, 22, 874.
- Kuzhir P, Paddubskaya A, Bychanok D, Liubimau A, Ortona A, Fierro V, Celzard A. 3D-printed, carbon-based, lossy photonic crystals: Is high electrical conductivity the must? Carbon 2021, 171, 484–492. [CrossRef]
- Gupta S, Tai N-H. Carbon materials and their composites for electromagnetic interference shielding effectiveness in X-band. Carbon 2019, 152, 159–187. [CrossRef]
- Chung DDL. Materials for electromagnetic interference shielding. Materials Chemistry and Physics 2020, 255, 123587. [CrossRef]
- Zhenhuan Lv, Wenqiang Yang, Li Yao, Xiang Chen, Junyang Zhou, Ruoyu Li, Hui Mei, Laifei Cheng, Litong Zhang. Electromagnetic response mechanism of BaTiO3-based metamaterials: Transition between microwave absorption and shielding capacity. Additive Manufacturing 2024, 95, 104558. [CrossRef]
- Fathi Elmahaishi M, Azis R S, Ismail I, Muhammad F D. A review on electromagnetic microwave absorption properties: Their materials and performance. Journal of Materials Research and Technology 2022, 20, 2188–2220. [CrossRef]
- Jun Xiang, Zhirui Hou, Xueke Zhang, Lei Gong, Zhipeng Wu, Jianli Mi. Facile synthesis and enhanced microwave absorption properties of multiferroic Ni0.4Co0.2Zn0.4Fe2O4/BaTiO3 composite fibers. Journal of Alloys and Compounds 2018, 737, 412–420.
- Hou T, Wang B, Jia Z, Wu H, Lan D, Huang Z, Feng A, Ma M, Wu G. A review of metal oxide related microwave absorbing materials from the dimension and morphology perspective. Journal of Materials Science: Materials in Electronics 2019, 30, 10961–10984. [CrossRef]
- Xiaodong Chen, Guiqin Wang, Yuping Duan, Shunhua Liu. Electromagnetic characteristics of barium titanate/epoxide resin composites in X and Ku bands. Journal of Alloys and Compounds 2008, 453, 433–436. [CrossRef]
- Kaur H, Marwaha A, Singh C, Narang S B, Jotania R, Jacobo S, Sombra A S B, Trukhanov S V, Trukhanov A V, Dhruv P. Investigation of structural, hysteresis and electromagnetic parameters for microwave absorption application in doped Ba-Sr hexagonal ferrites at X-band. Journal of Alloys and Compounds 2019, 806, 1220–1229. [CrossRef]
- Zhi Ma, Chentao Cao, Jing Yuan, Qingfang Liu, Jianbo Wang. Enhanced microwave absorption of BaTiO3-based ferroelectric/ferromagnetic nanocomposite. Applied Surface Science 2012, 258, 7556–7561. [CrossRef]
- Gao R L, Zhang Q M, Xu Z Y, et al. A comparative study on the structural, dielectric and multiferroic properties of Co0.6Cu0.3Zn0.1Fe2O4/Ba0.9Sr0.1Zr0.1Ti0.9O3 composite ceramics. Composites Part B: Engineering 2019, 166, 204–212.
- Wu D D, Gong W H, Deng H J, et al. Magnetoelectric composite ceramics of nickel ferrite and lead zirconate titanate via in situ processing. Journal of Physics D: Applied Physics 2007, 40, 5002–5005.
- Lihong Tian, Xiaodong Yan, Jilian Xu, Petra Wallenmeyer, James Murowchick, Lei Liu, Xiaobo Chen. Effect of hydrogenation on the microwave absorption properties of BaTiO3 nanoparticles. Journal of Materials Chemistry A 2015, 3, 12550–12556. [CrossRef]
- Anas Houbia, Zharmenov A Aldashevich, Yomen Atassi, Z Bagasharova Telmanovna, Mirzalieva Saule, Kadyrakunov Kubanych. Microwave absorbing properties of ferrites and their composites: A review. Journal of Magnetism and Magnetic Materials 2021, 529, 167839. [CrossRef]
- Kyungnae Baek, SeungYong Lee, SangGil Doh, Miyoung Kim, Jerome K Hyun. Axial oxygen vacancy-regulated microwave absorption in micron-sized tetragonal BaTiO3 particles. Journal of Materials Chemistry C 2018, 6, 9749–9755.
- Huang Y, Ji J, Chen Y, Li X, He J, Cheng X, He S, Liu Y, Liu J. Broadband microwave absorption of Fe3O4–BaTiO3 composites enhanced by interfacial polarization and impedance matching. Composites Part B: Engineering 2019, 163, 598–605. [CrossRef]
- Zainal Y B, Dedi, Manaf A. Microstructure and microwave absorption characteristics of BaTiO3-CoFe2O4 composites. Key Engineering Materials 2016, 855, 322–329.
- Zeng Z, Wu H, Zhou C, Qin X, He J, Ji C, Deng X, Gao R, Fu C, Cai W, Chen G, Wang Z, Lei X. Effect of sintering temperature on magnetoelectric properties of PbTiO3/NiFe2O4 composite ceramics. Journal of Asian Ceramic Societies 2020, 8, 4.
- Maqsood A, Khan K. Structural and microwave absorption properties of Ni(1-x)Co(x)Fe2O4 (0.0 ≤ x ≤ 0.5) nanoferrites synthesized via co-precipitation route. Journal of Alloys and Compounds 2011, 509, 3393–3397. [CrossRef]
- S. Raghuvanshi, R. Verma, P. Tiwari, F. Mazaleyrat, S. N. Kane. Green Synthesis And Characterization of Ni0.8Zn0.2Fe2O4. AIP Conference Proceedings 2019, 2142, 160002.
- Xianfeng Meng, Tong Liu, Le Yu, Kai Jin, Song Xu. Nanocrystalline Ni0.8Zn0.2Fe2O4/SrFe12O19 composite fibers with enhanced exchange coupling behavior. RSC Advances 2015, 5, 48005–48011. [CrossRef]
- Sk. Sameena, P. Naveen, G. Chanti, C. Shiva Shankar, Y. Vasudeva Reddy, Ch. Swapna, N. Pavan Kumar. Study of Structural, Optical and Magnetic Properties of Ni0.8Zn0.2Fe2O4 Ferrites Calcined at Different Temperatures. Proceedings of the International Conference on Emerging Multifunctional Materials and Devices for Sustainable Technologies 2024, Springer, Singapore.
- R. V. Mangalaraja, S. Ananthakumar, P. Manohar, F. D. Gnanam. Magnetic, electrical and dielectric behaviour of Ni0.8Zn0.2Fe2O4 prepared through flash combustion technique. Journal of Magnetism and Magnetic Materials 2002, 253, 56–64. [CrossRef]
- Yong Li, Longlong Shu, Wenbin Huang, Xiaoning Jiang, Hong Wang. Giant flexoelectricity in Ba0.6Sr0.4TiO3/Ni0.8Zn0.2Fe2O4 composite. Applied Physics Letters 2014, 105, 162906. [CrossRef]
- Norah A. Algarou, Yassine Slimani, Munirah A. Almessiere, Ali Sadaqat, Alex V. Trukhanov, Mohammad A. Gondal, Abbas S. Hakeem, Sergei V. Trukhanov, Maksim G. Vakhitov, Denis S. Klygach, Ayyar Manikandan, Abdulhadi Baykal. Functional Sr0.5Ba0.5Sm0.02Fe11.98O4/x(Ni0.8Zn0.2Fe2O4) Hard–Soft Ferrite Nanocomposites: Structure, Magnetic and Microwave Properties. Nanomaterials 2020, 10, 2134.
- Moitra D, Ghosh B K, Chandel M, Jani R K, Patra M K, Vadera S R, Ghosh N N. Synthesis of Ni0.8Zn0.2Fe2O4-RGO nanocomposite: An excellent magnetically separable catalyst for dye degradation and microwave absorber. RSC Advances 2016, 6, 14090–14096. [CrossRef]
- Wu H, Xu R, Qin X, Gao R, Wang Z, Fu C, Cai W, Chen G, Deng X. Effect of volume fraction on magnetoelectric coupling effect of Co0.1Cu0.9Fe2O4/Ba0.8Sr0.2TiO3 composite liquid. Applied Physics A 2020, 126, 94. [CrossRef]
- Dzunuzovic A S, Vijatovic Petrovic M M, Bobic J D, Ilic N I, Ivanov M, Grigalaitis R, Stojanovic B D. Magneto-electric properties of xNi0.7Zn0.3Fe2O 4/(1−x)BaTiO3 multiferroic composites. Ceramics International 2018, 44, 683–694. [CrossRef]
- Singh M, Singh J, Kumar M, Kumar S. Investigations on multiferroic properties of lead free (1-x)BCZT-xCZFMO based particulate ceramic composites. Solid State Sciences 2020, 108, 106380. [CrossRef]
- Sharma R, Pahuja P, Tandon R P. Structural, dielectric, ferromagnetic, ferroelectric and ac conductivity studies of the BaTiO3-CoFe1.8Zn0.2O4 multiferroic particulate composites. Ceramics International 2014, 40, 9027–9036. [CrossRef]
- Sarkar B, Dalal B, Ashok V D, Chakrabarti K, De S K. Magnetic properties of mixed spinel BaTiO3-NiFe2O4 composites. Journal of Applied Physics 2014, 115, 123908. [CrossRef]
- Lam D S, Tung N N, Dung D D, Khuyen B X, Lam V D, Thanh T D. Electrical, magnetic and microwave absorption properties of multiferroic NiFe2O4-BaTiO3 nanocomposites. Materials Research Express 2022, 9, 075004. [CrossRef]
- Bao H, Zhou C, Xue D, Gao J, Ren X. A modified lead free piezoelectric BZT–xBCT system with higher Tc. Journal of Physics D: Applied Physics 2010, 43, 465401.
- Dai Z, Jinglong X, Weiguo L, Xi W, Lin Z, Zhijian Z, Jinglei L, Ren X. An effective strategy to achieve excellent energy storage properties in lead-free BaTiO3 based bulk ceramics. ACS Applied Materials & Interfaces 2020, 12, 27.
- Letao Y, Xi K, Fei L, Hua H, Zhenxiang C, Hanxing L, JingFeng L, Shujun Z. Perovskite lead-free dielectrics for energy storage applications. Progress in Materials Science 2016, 102, 72–108.
- Veerapandiyan V, Benes F, Gindel T, Deluca M. Strategies to improve the energy storage properties of perovskite lead-free relaxor ferroelectrics: A review. Materials 2020, 13, 5742. [CrossRef]
- Shen Z, Wang X, Luo B, Li L. BaTiO3–BiYbO3 perovskite materials for energy storage applications. Journal of Materials Chemistry A 2015, 3, 18146–18153.
- Mane S M, Pawar S A, Patil D S, Kulkarni S B, Tayade N T, Shin J C. Magnetoelectric, magnetodielectric effect properties of and dielectric, magnetic microwave-sintered x(Co0.9Ni0.1Fe2O4)–(1−x)[0.5(Ba0.7Ca0.3TiO3)–0.5(BaZr0.2Ti0.8O3)] particulate multiferroic composite. Ceramics International 2020, 46, 3311–3323. [CrossRef]
- Binek C, Doudin B. Magnetoelectronics with magnetoelectrics. Journal of Physics: Condensed Matter 2005, 17, 39–44. [CrossRef]
- Zhao D-L, Lv Q, Shen Z-M. Fabrication and microwave absorbing properties of Ni-Zn spinel ferrites. Journal of Alloys and Compounds 2009, 480, 634–638.
- Wang M, Ji G, Zhang B, Tang D, Yang Y, Du Y. Controlled synthesis and microwave absorption properties of Ni0.6Zn0.4Fe2O4/PANI composite via an in-situ polymerization process. Journal of Magnetism and Magnetic Materials 2015, 377, 52–58. [CrossRef]
- Liu P, Huang Y, Zhang X. Cubic NiFe2O4 particles on graphene–polyaniline and their enhanced microwave absorption properties. Composites Science and Technology 2015, 107, 54–60.
- Mustaffa M S, Azis R S, Abdullah N H, Ismail I, Ibrahim I R. An investigation of microstructural, magnetic and microwave absorption properties of multi-walled carbon nanotubes/Ni0.5Zn0.5Fe2O4. Scientific Reports 2019, 9, 3–9.
- Wang X, Li Q, Su Z, Gong W, Gong R, Chen Y, Harris V G. Enhanced microwave absorption of multiferroic Co2Z hexaferrite–BaTiO3 composites with tunable impedance matching. Journal of Alloys and Compounds 2015, 643, 111–115. [CrossRef]
- Huifang Pang, Yuping Duan, Lingxi Huang, Lulu Song, Jia Liu, Tuo Zhang, Xuan Yang, Jiangyong Liu, Xinran Ma, Jingru Di, Xiaoji Liu. Research advances in composition, structure and mechanisms of microwave absorbing materials. Composites Part B: Engineering 2021, 224, 109173. [CrossRef]
Figure 1.
(a) XRD patterns and (b) Raman spectra of the powdered composites of xNZFO/(1-x)BTO samples.
Figure 1.
(a) XRD patterns and (b) Raman spectra of the powdered composites of xNZFO/(1-x)BTO samples.
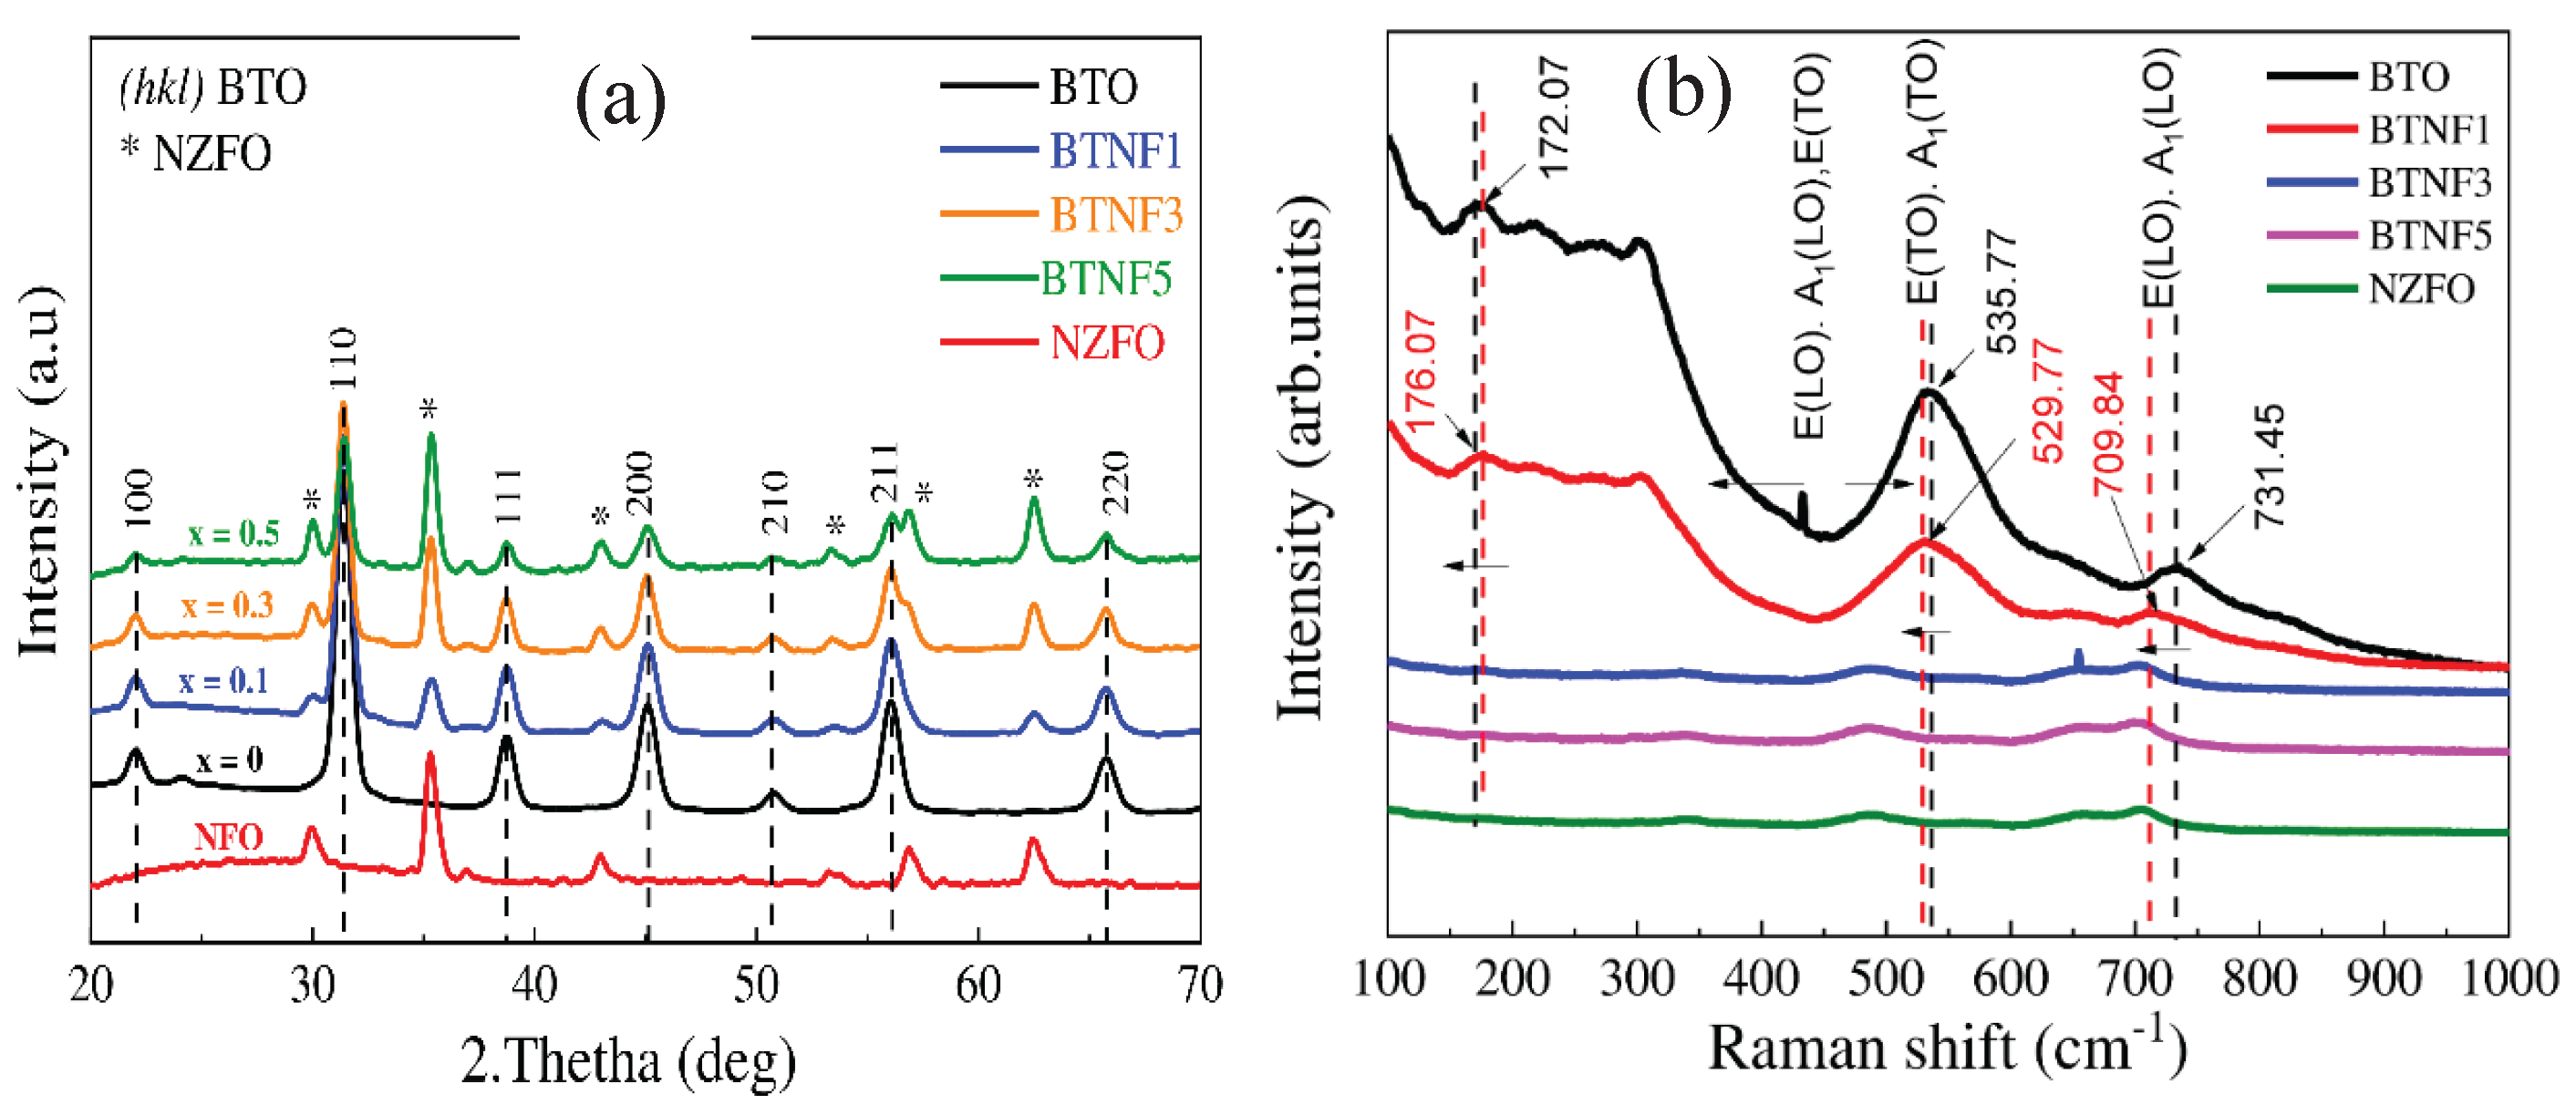
Figure 2.
(a-c) SEM images and (d-f) EDX spectra of xNZFO/(1-x)BTO with x = 0, 0.3, and 0.5, respectively.
Figure 2.
(a-c) SEM images and (d-f) EDX spectra of xNZFO/(1-x)BTO with x = 0, 0.3, and 0.5, respectively.
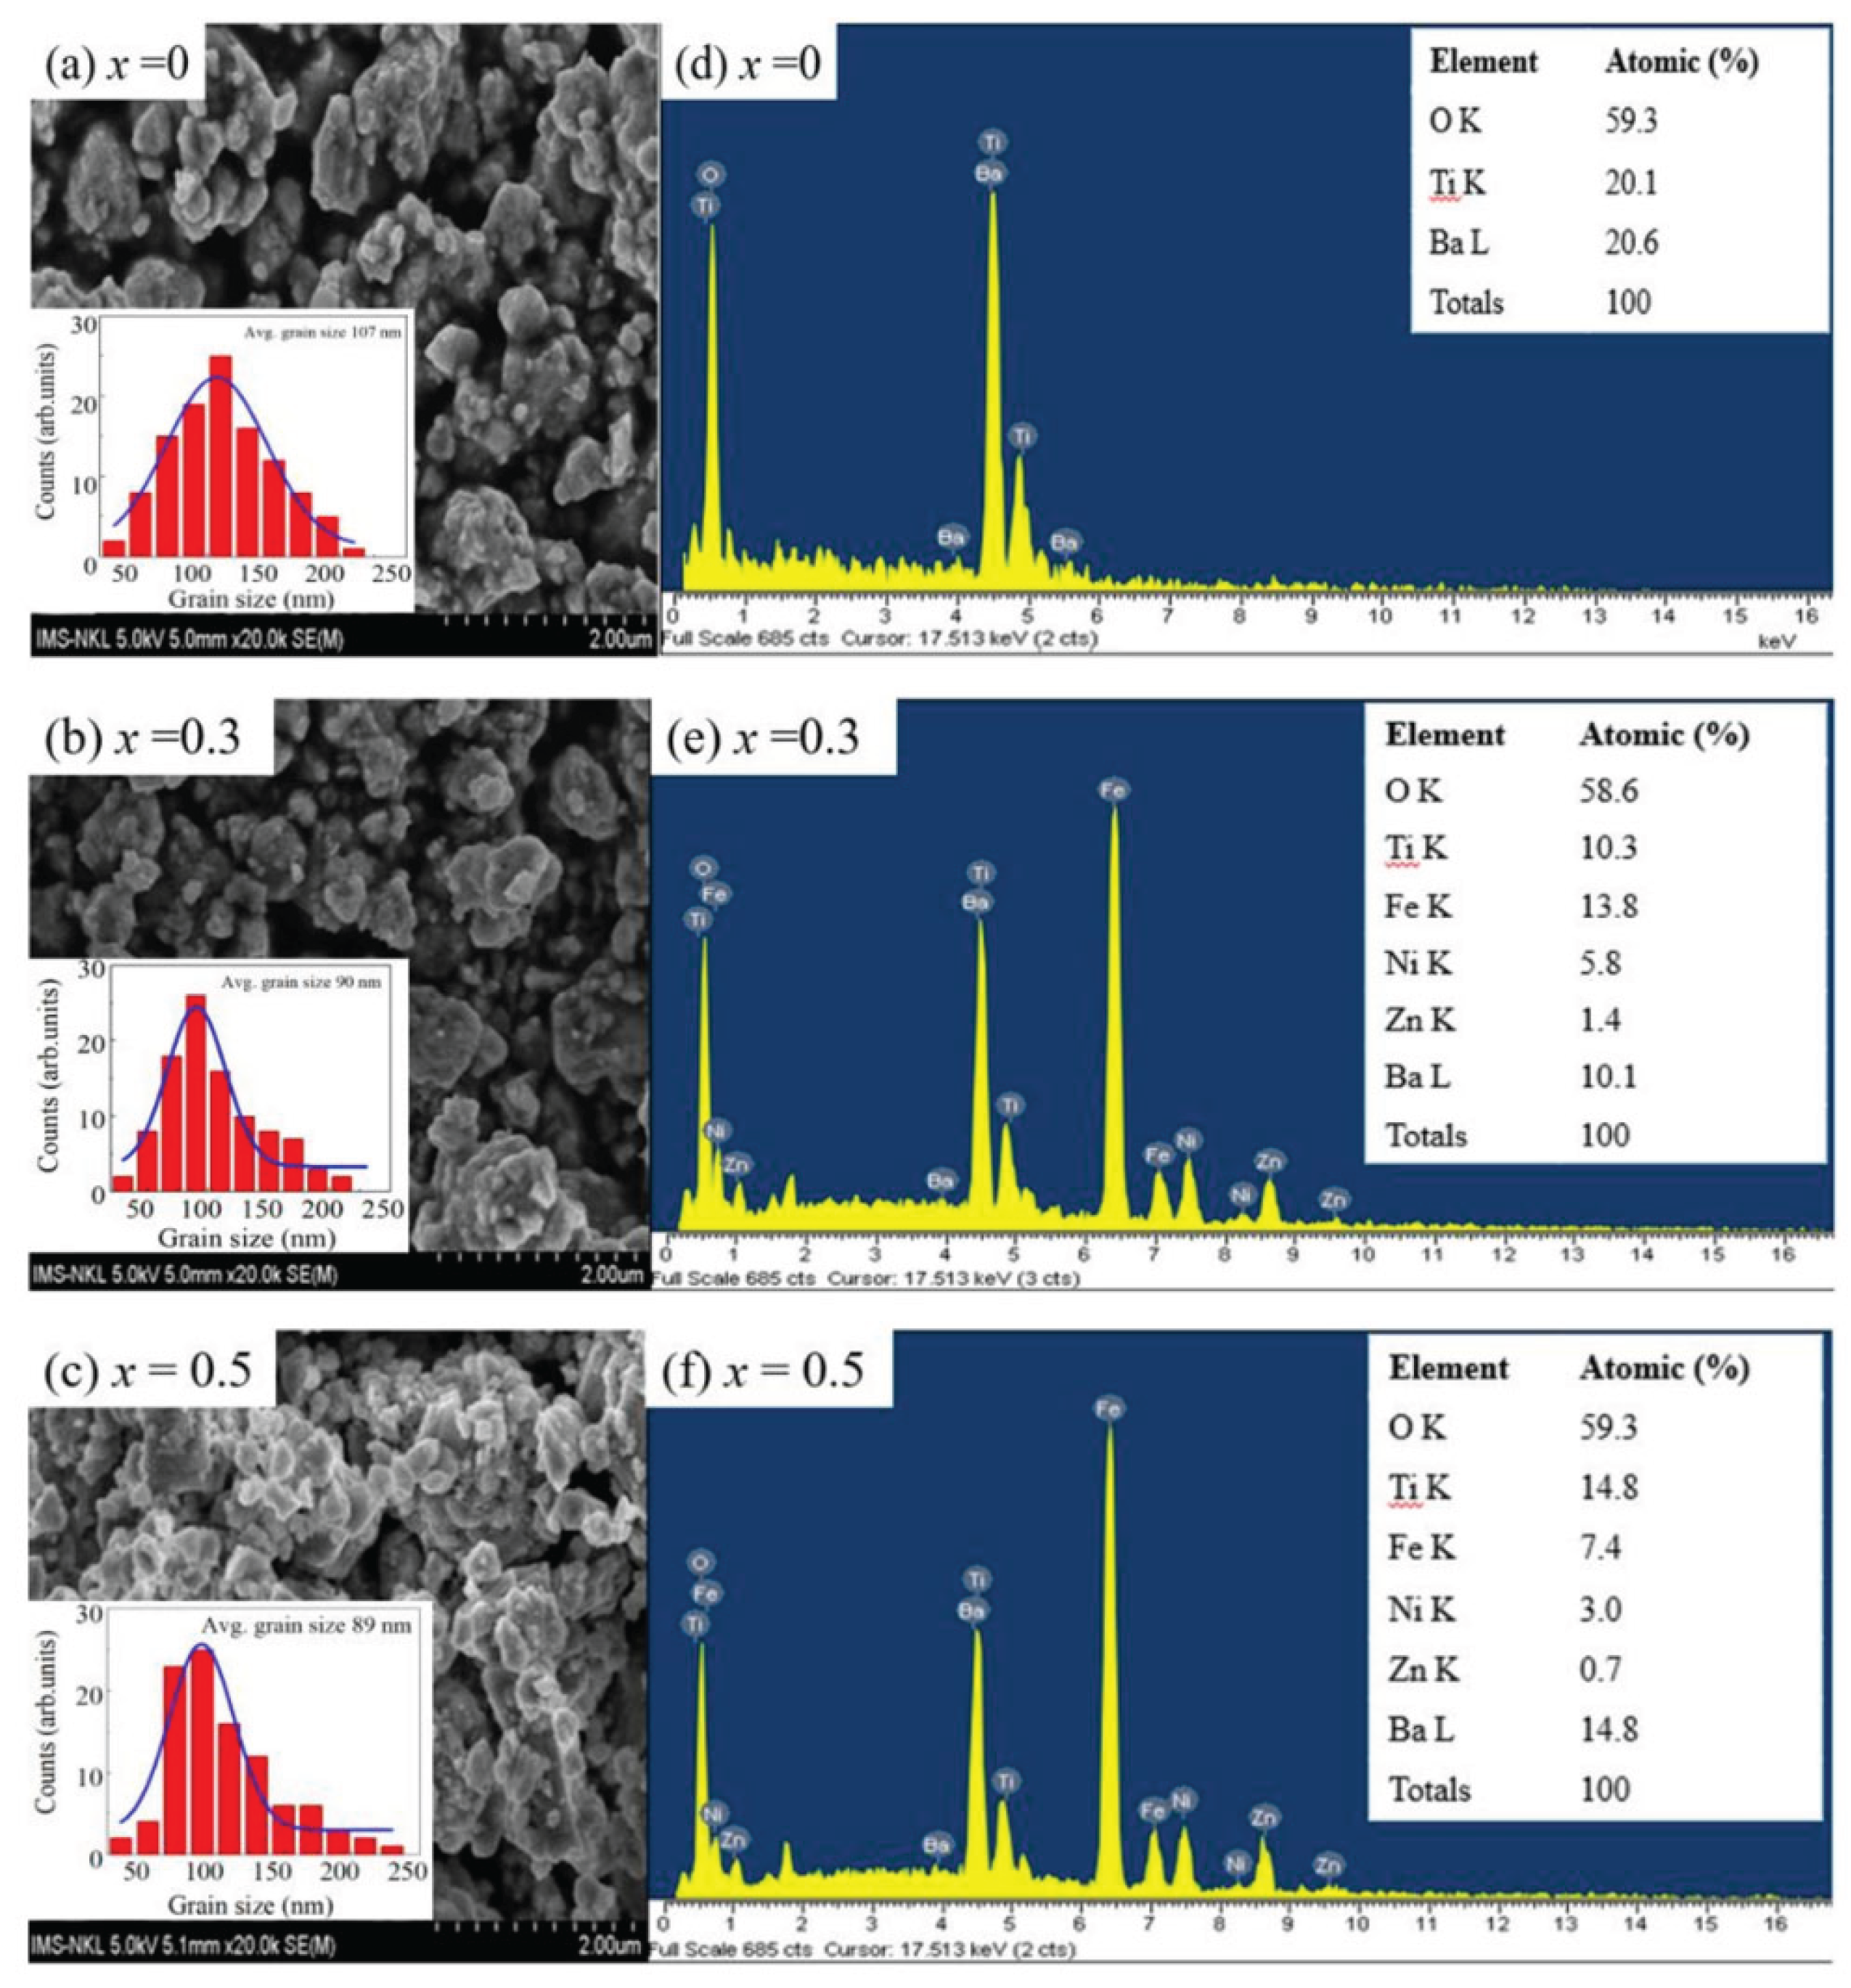
Figure 3.
M(H) loops measured at room temperature of NZFO/BTO multiferroic.
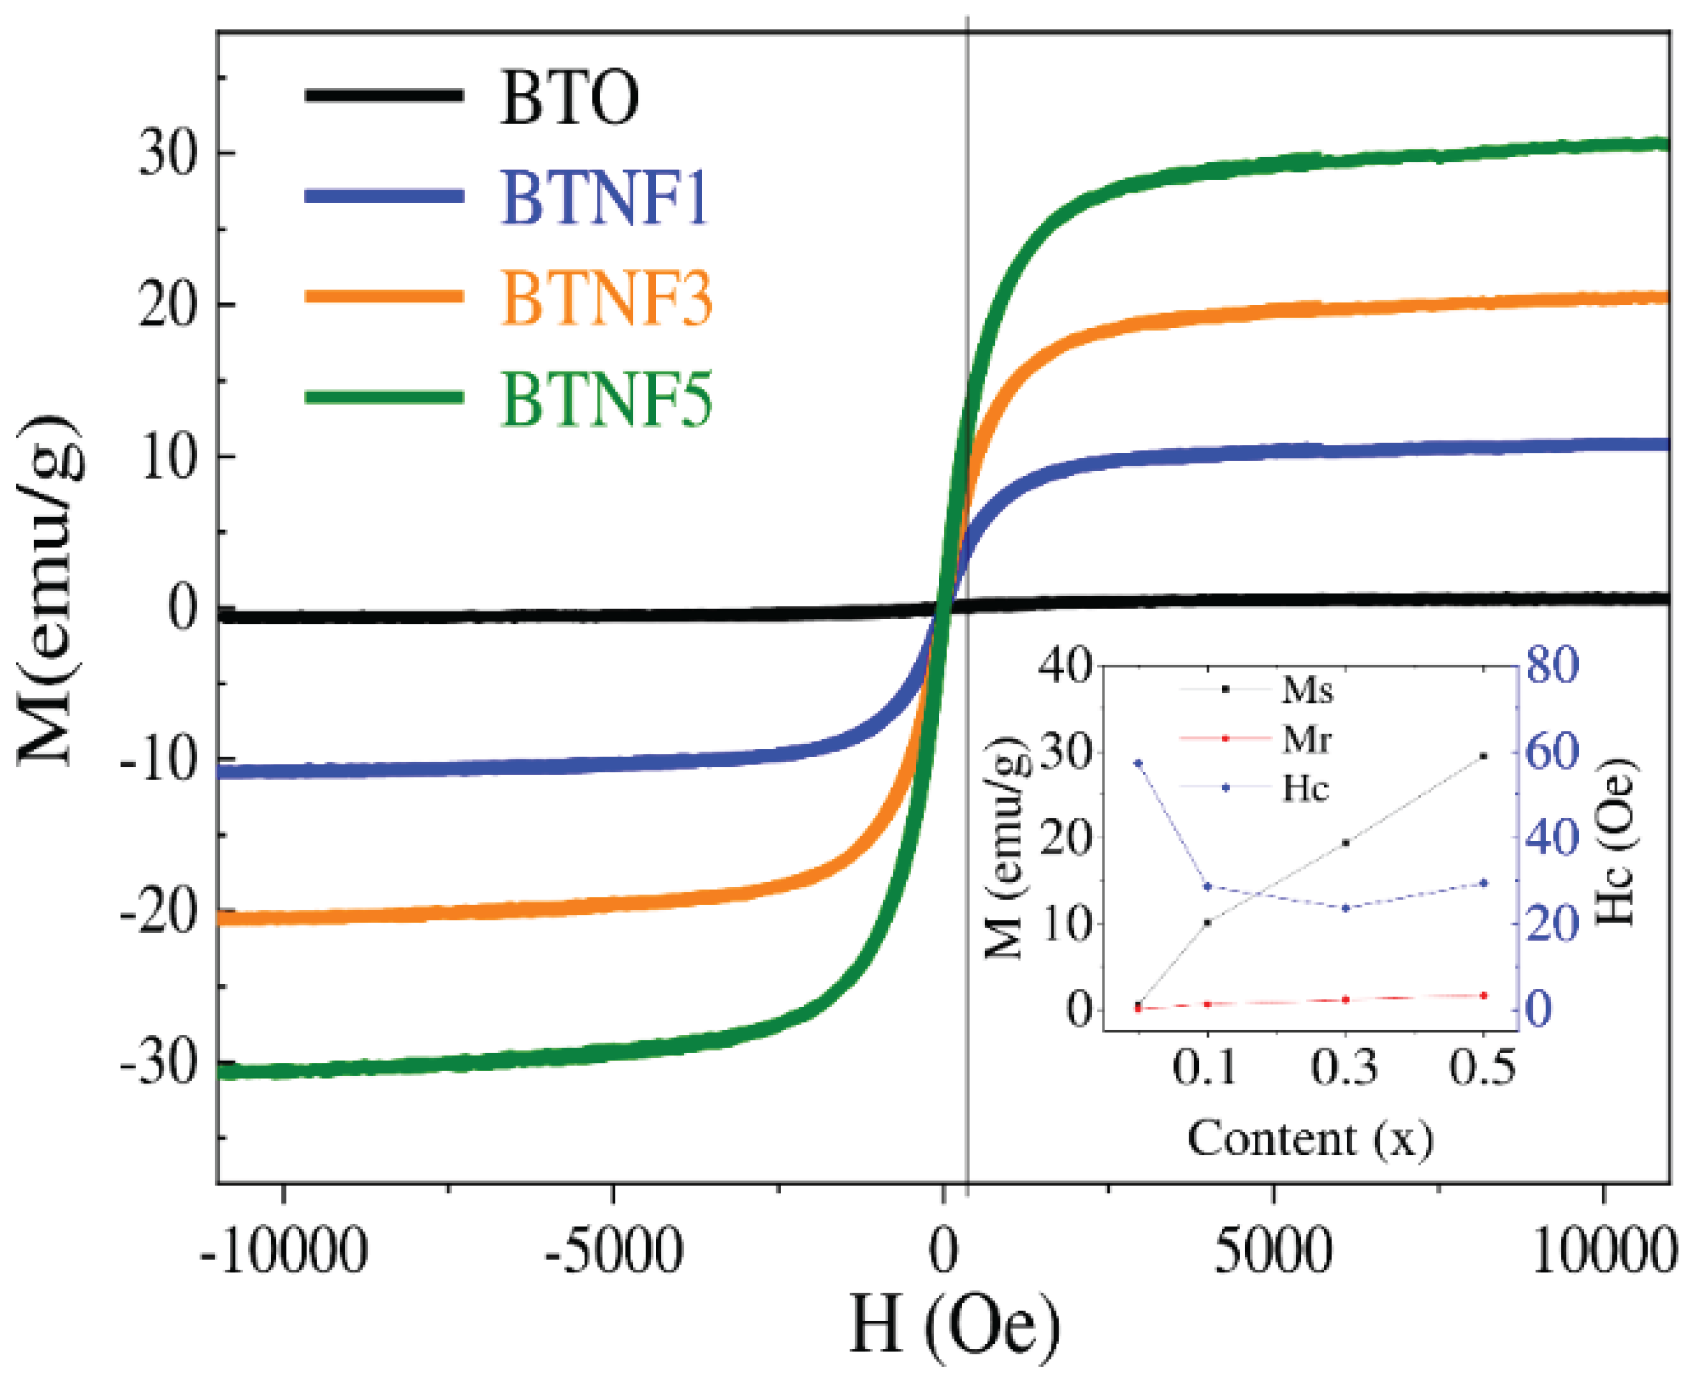
Figure 4.
P(E) curves for NZFO/BTO composites. The inset in the upper left corner shows the dependences of WUE, WLE, and ηP-E on NZFO content; the inset in the lower right corner shows the change of Pr, Pm, and Ec on NZFO content.
Figure 4.
P(E) curves for NZFO/BTO composites. The inset in the upper left corner shows the dependences of WUE, WLE, and ηP-E on NZFO content; the inset in the lower right corner shows the change of Pr, Pm, and Ec on NZFO content.
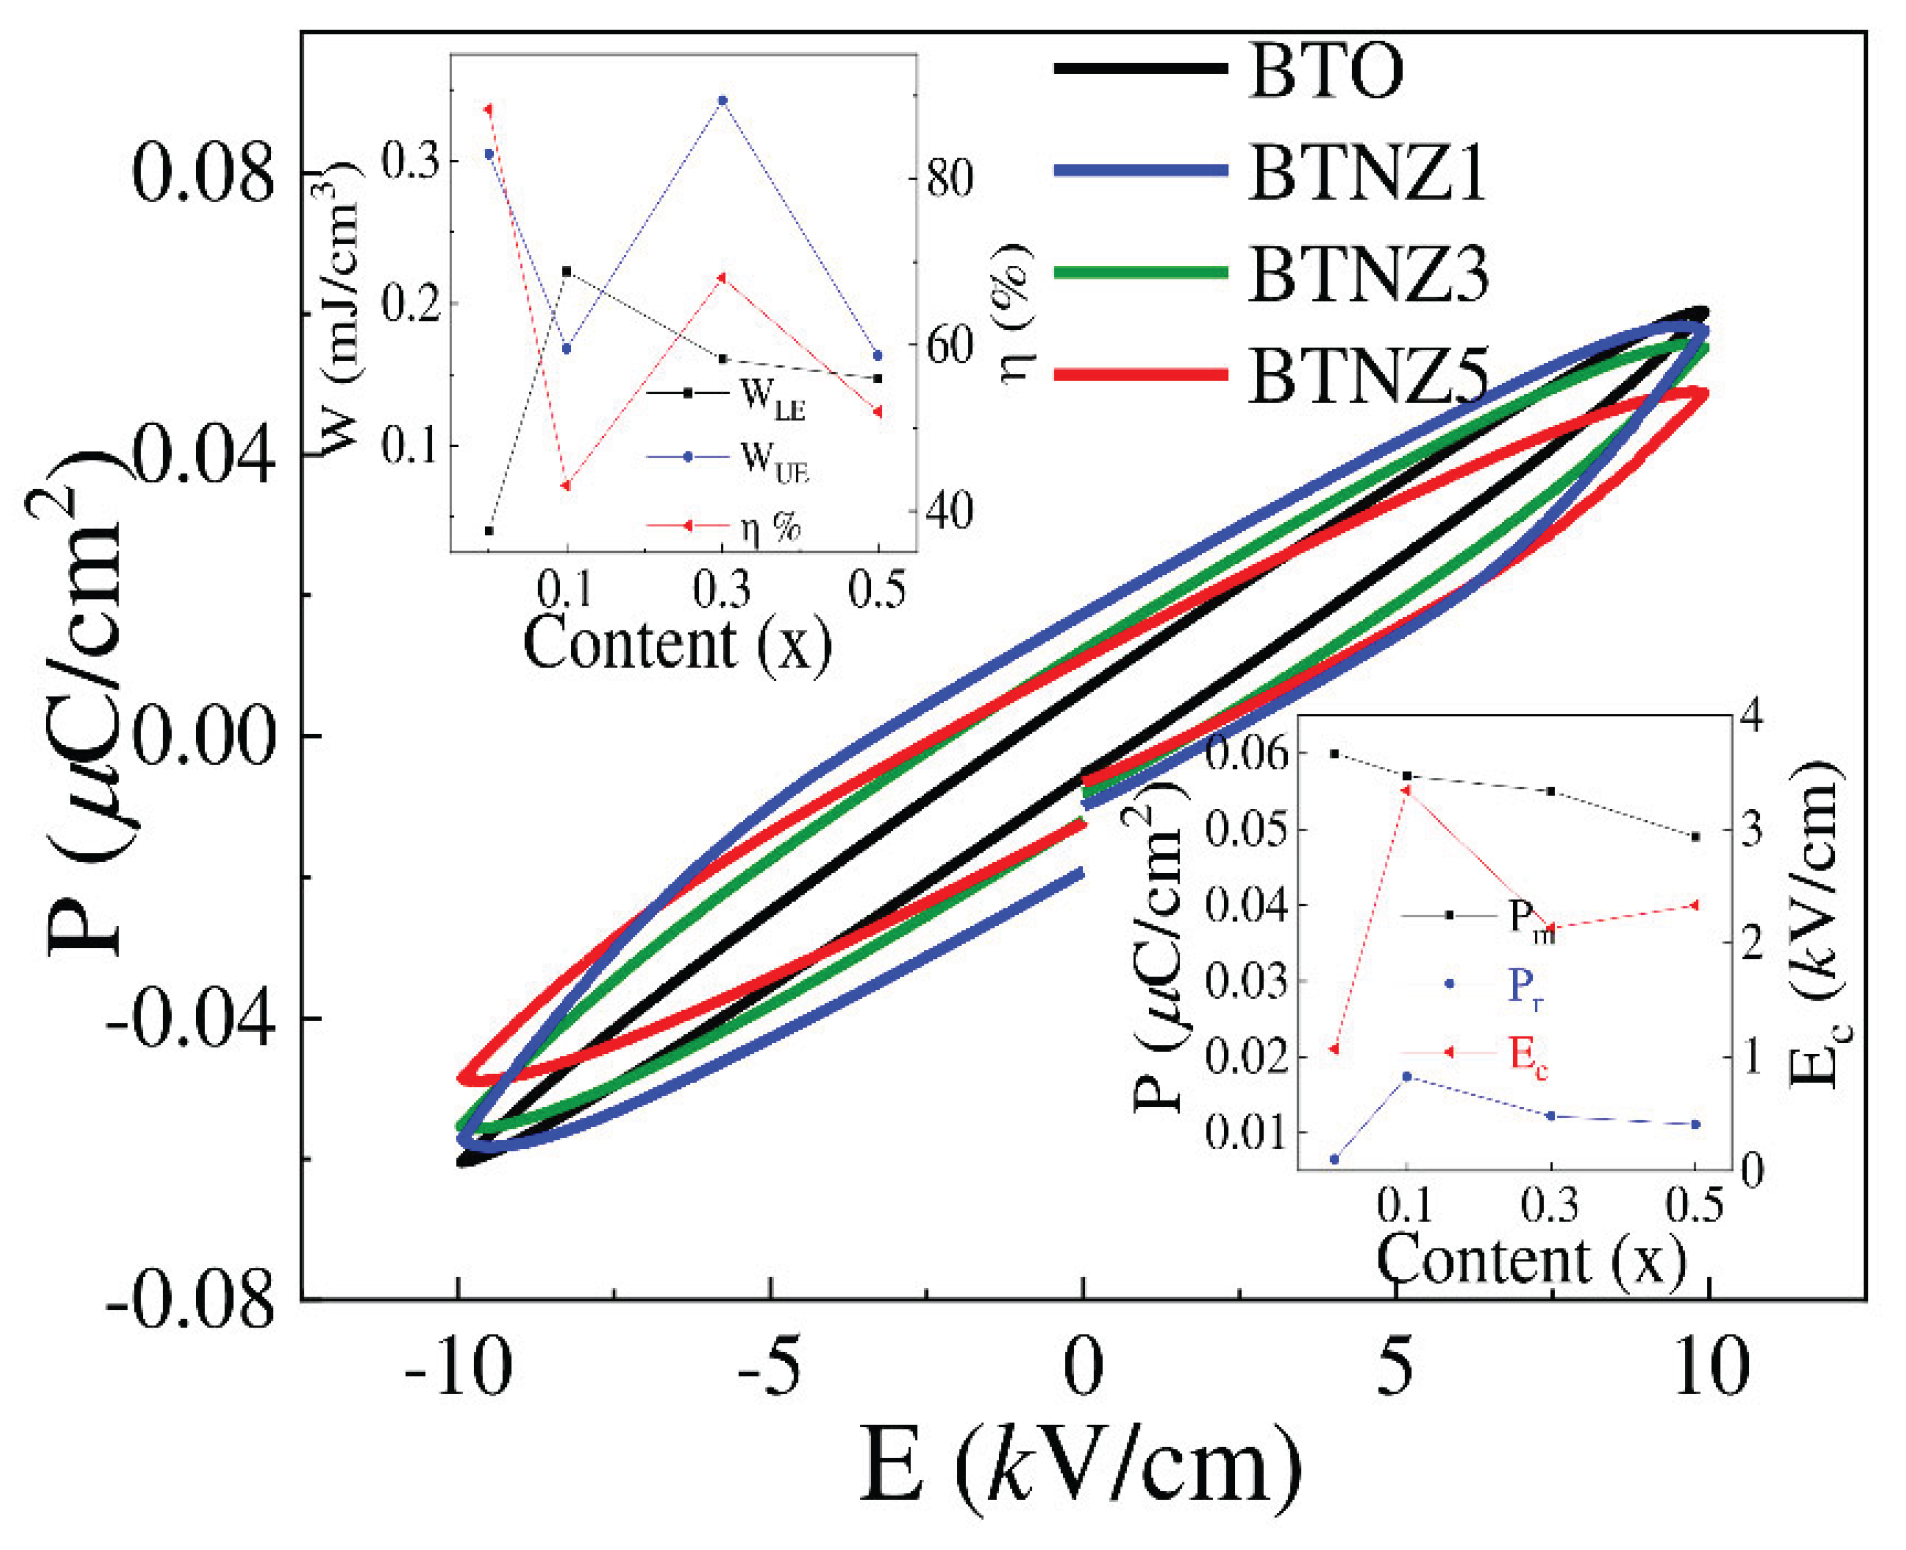
Figure 5.
The frequency dependence of (a, c) real permittivity and (b, d) complex permeability is presented for the NZFO, BTO, and BTNF1 samples.
Figure 5.
The frequency dependence of (a, c) real permittivity and (b, d) complex permeability is presented for the NZFO, BTO, and BTNF1 samples.
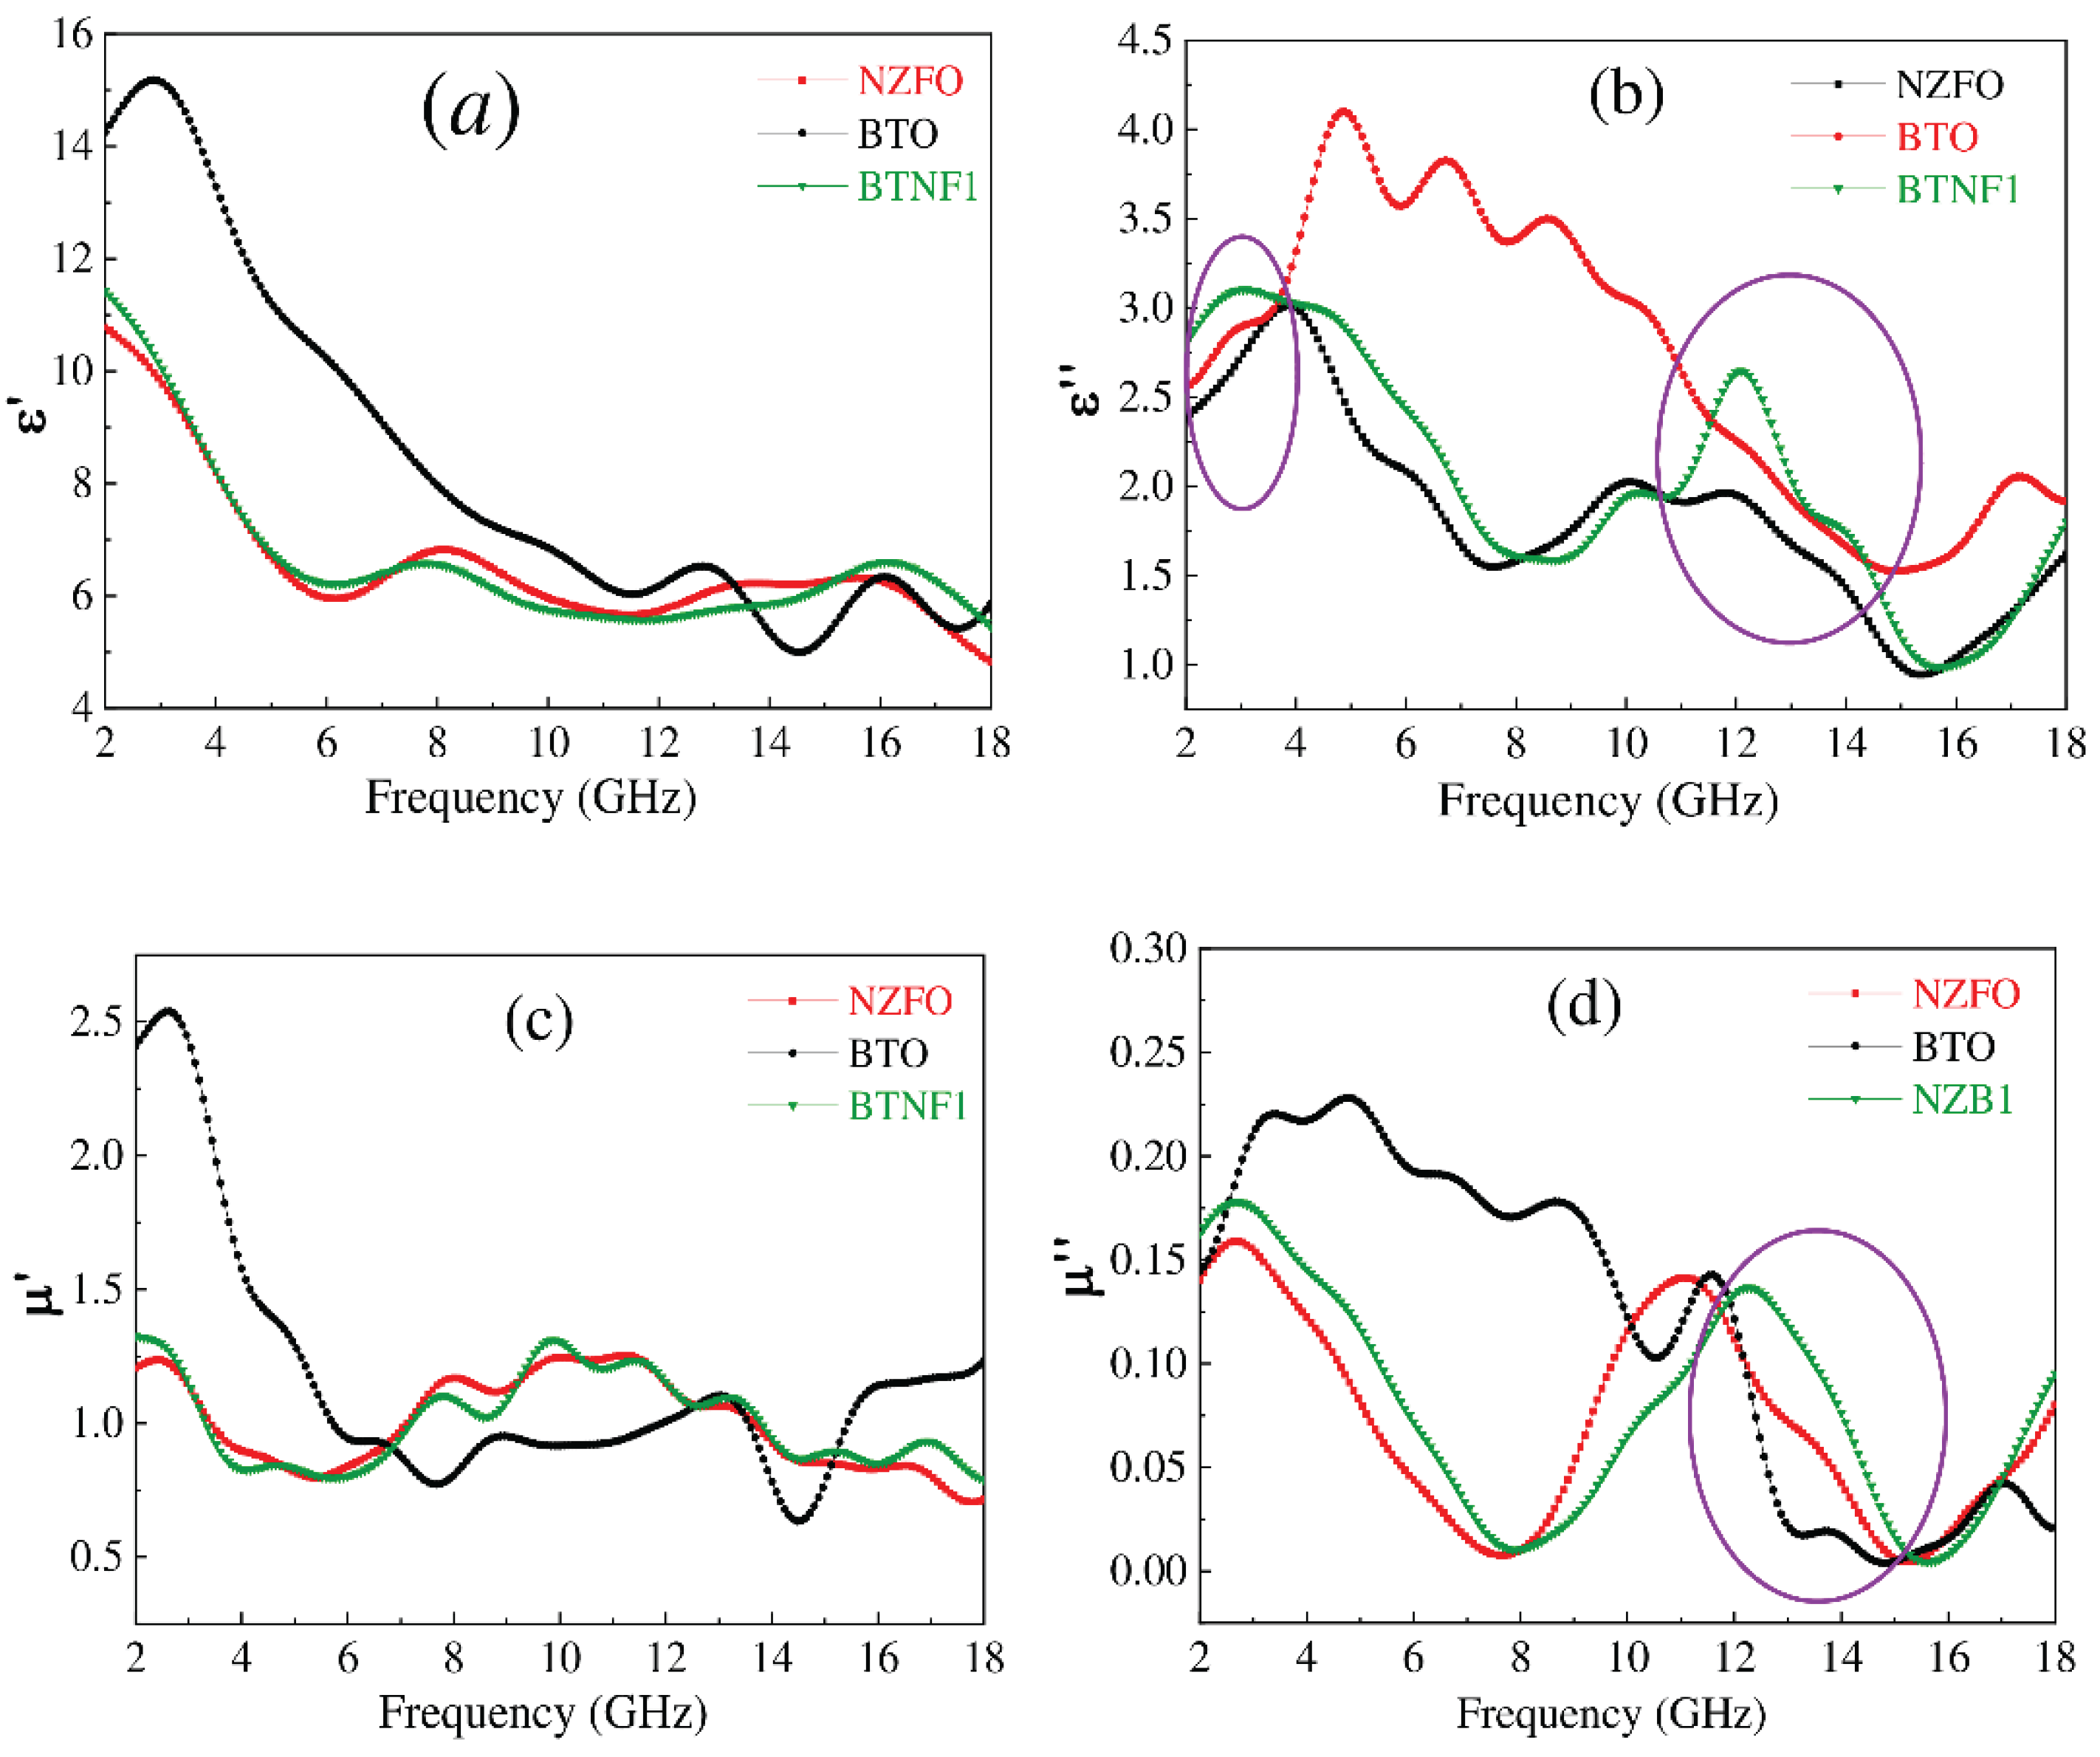
Figure 6.
The frequency dependence of (a) magnetic loss and (b) dielectric loss tangents is presented for the NZFO, BTO, and BTNF1 samples.
Figure 6.
The frequency dependence of (a) magnetic loss and (b) dielectric loss tangents is presented for the NZFO, BTO, and BTNF1 samples.
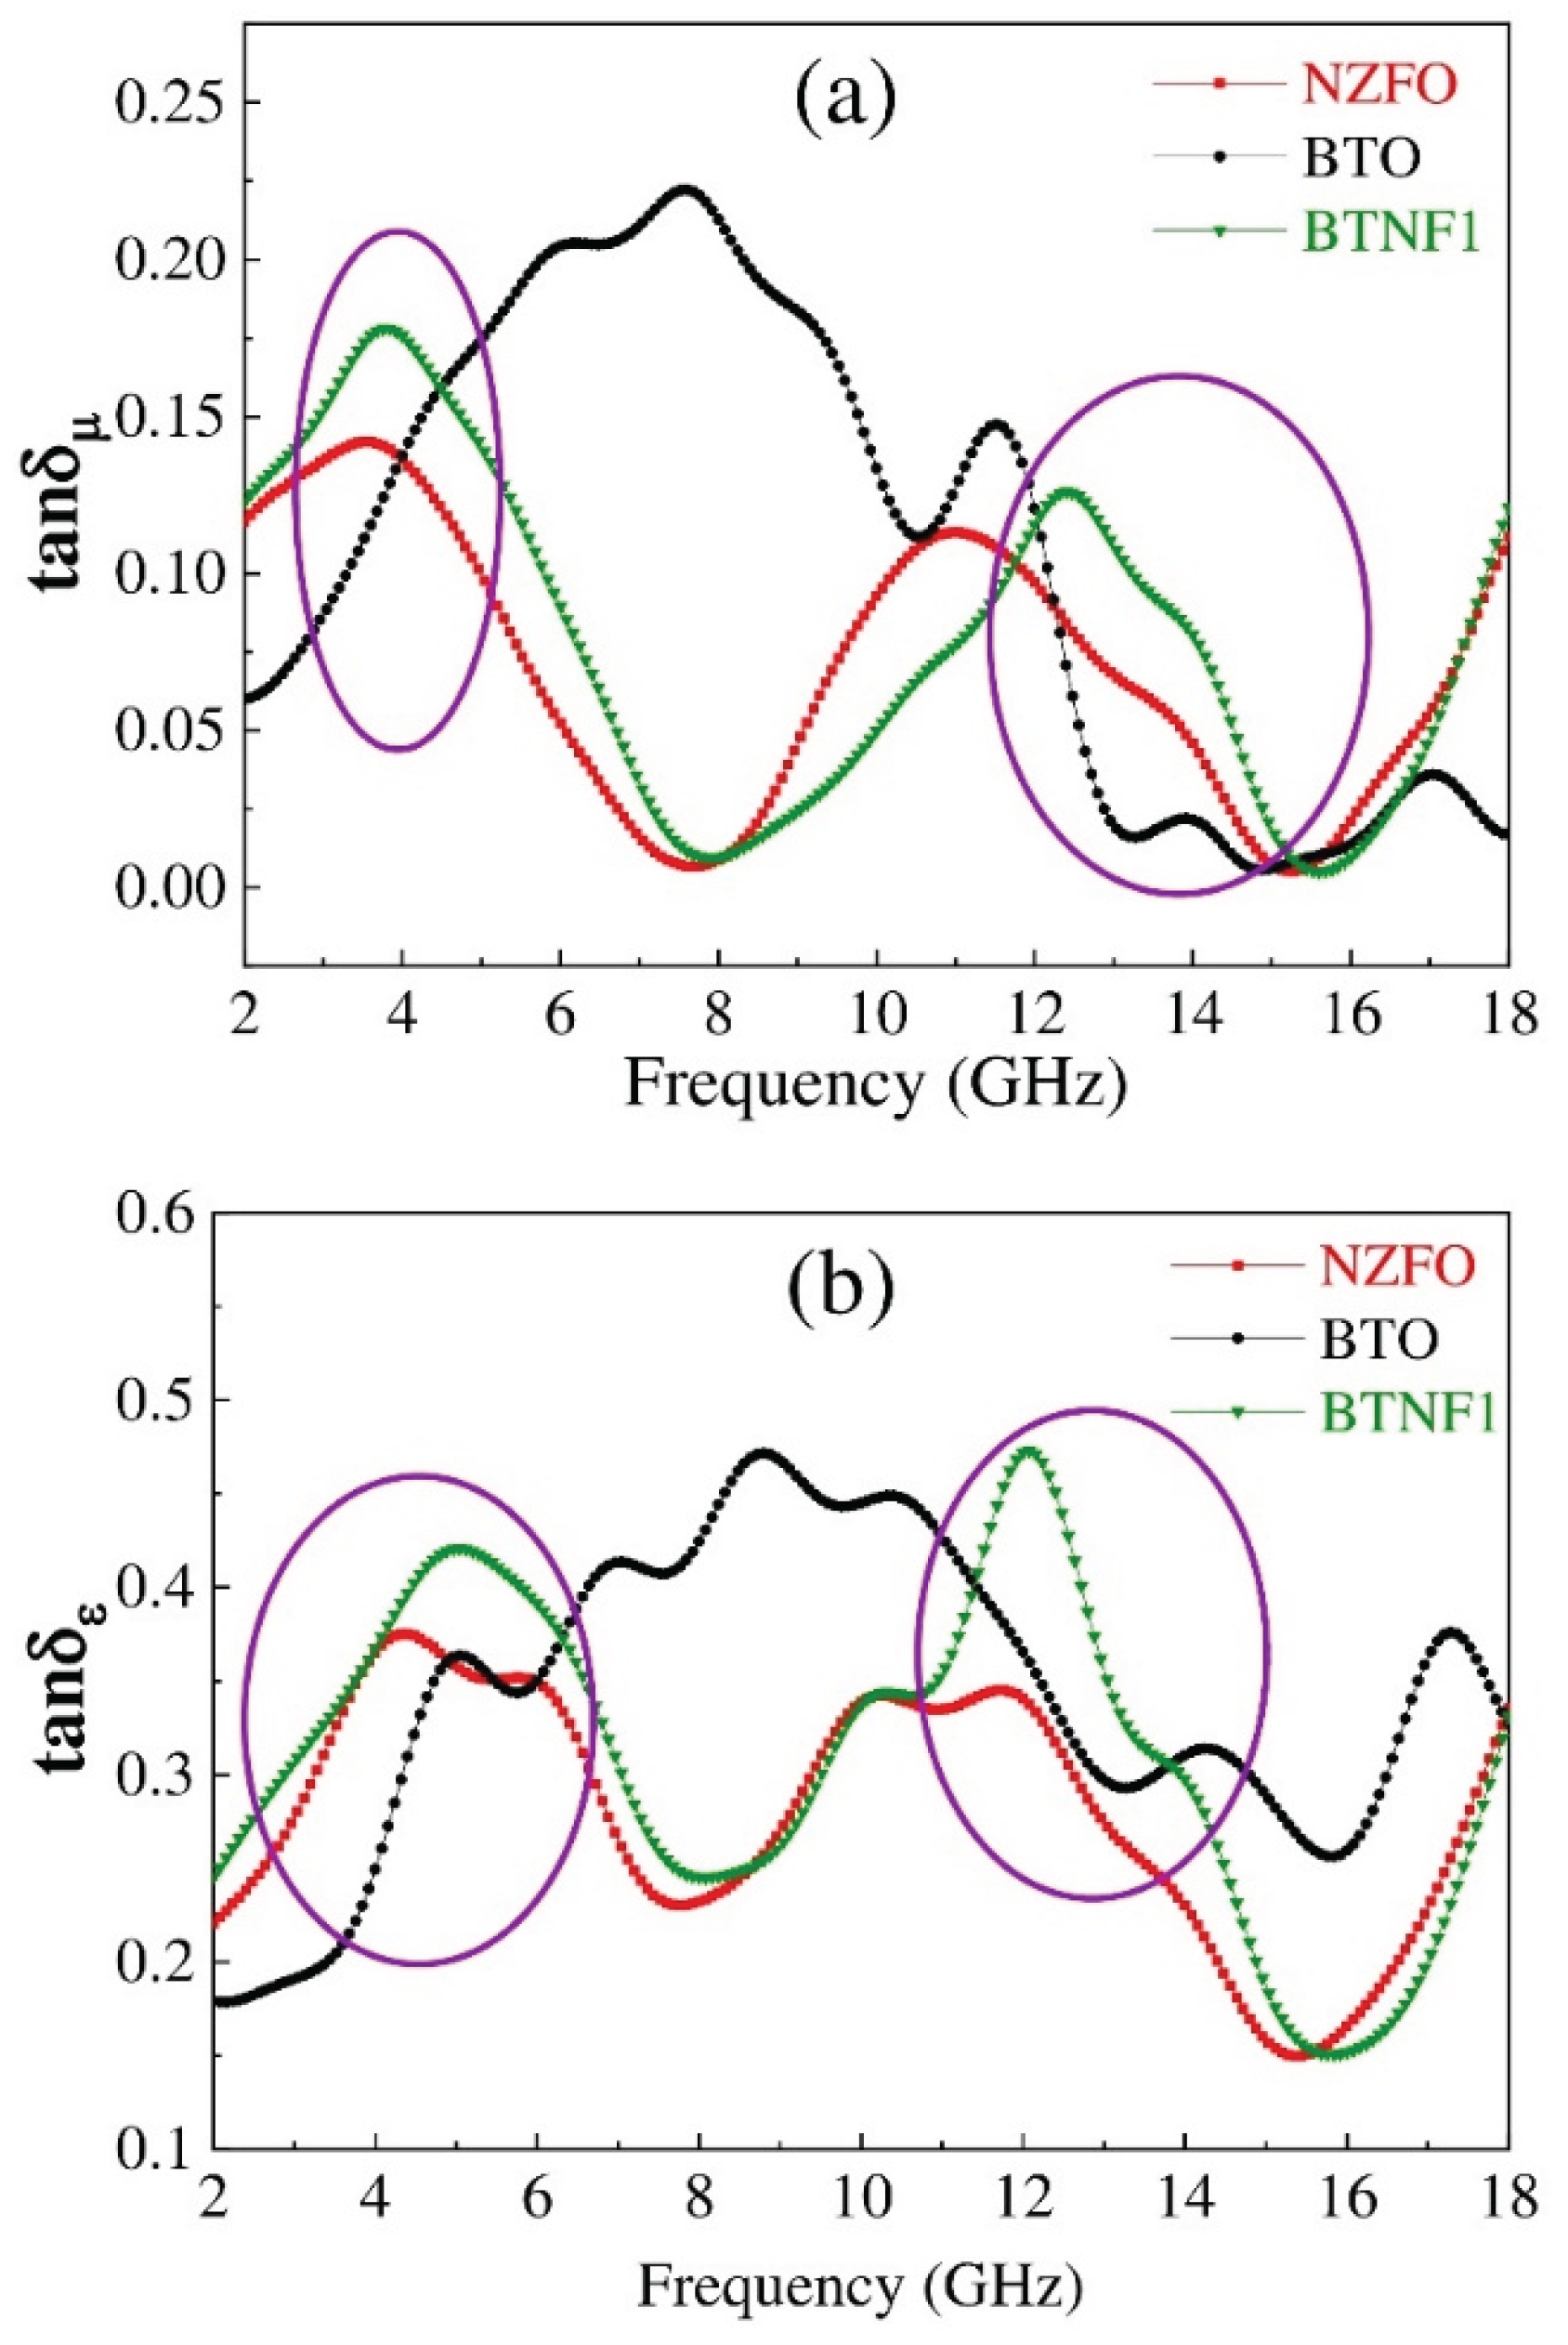
Figure 7.
Cole-Cole plots illustrating the connection between the real (Ɛ’) and imaginary (Ɛ’’) components of the complex permittivity for (a) NZFO-paraffin, (b) BTO-paraffin, and (c) BTNF1-paraffin composites.
Figure 7.
Cole-Cole plots illustrating the connection between the real (Ɛ’) and imaginary (Ɛ’’) components of the complex permittivity for (a) NZFO-paraffin, (b) BTO-paraffin, and (c) BTNF1-paraffin composites.
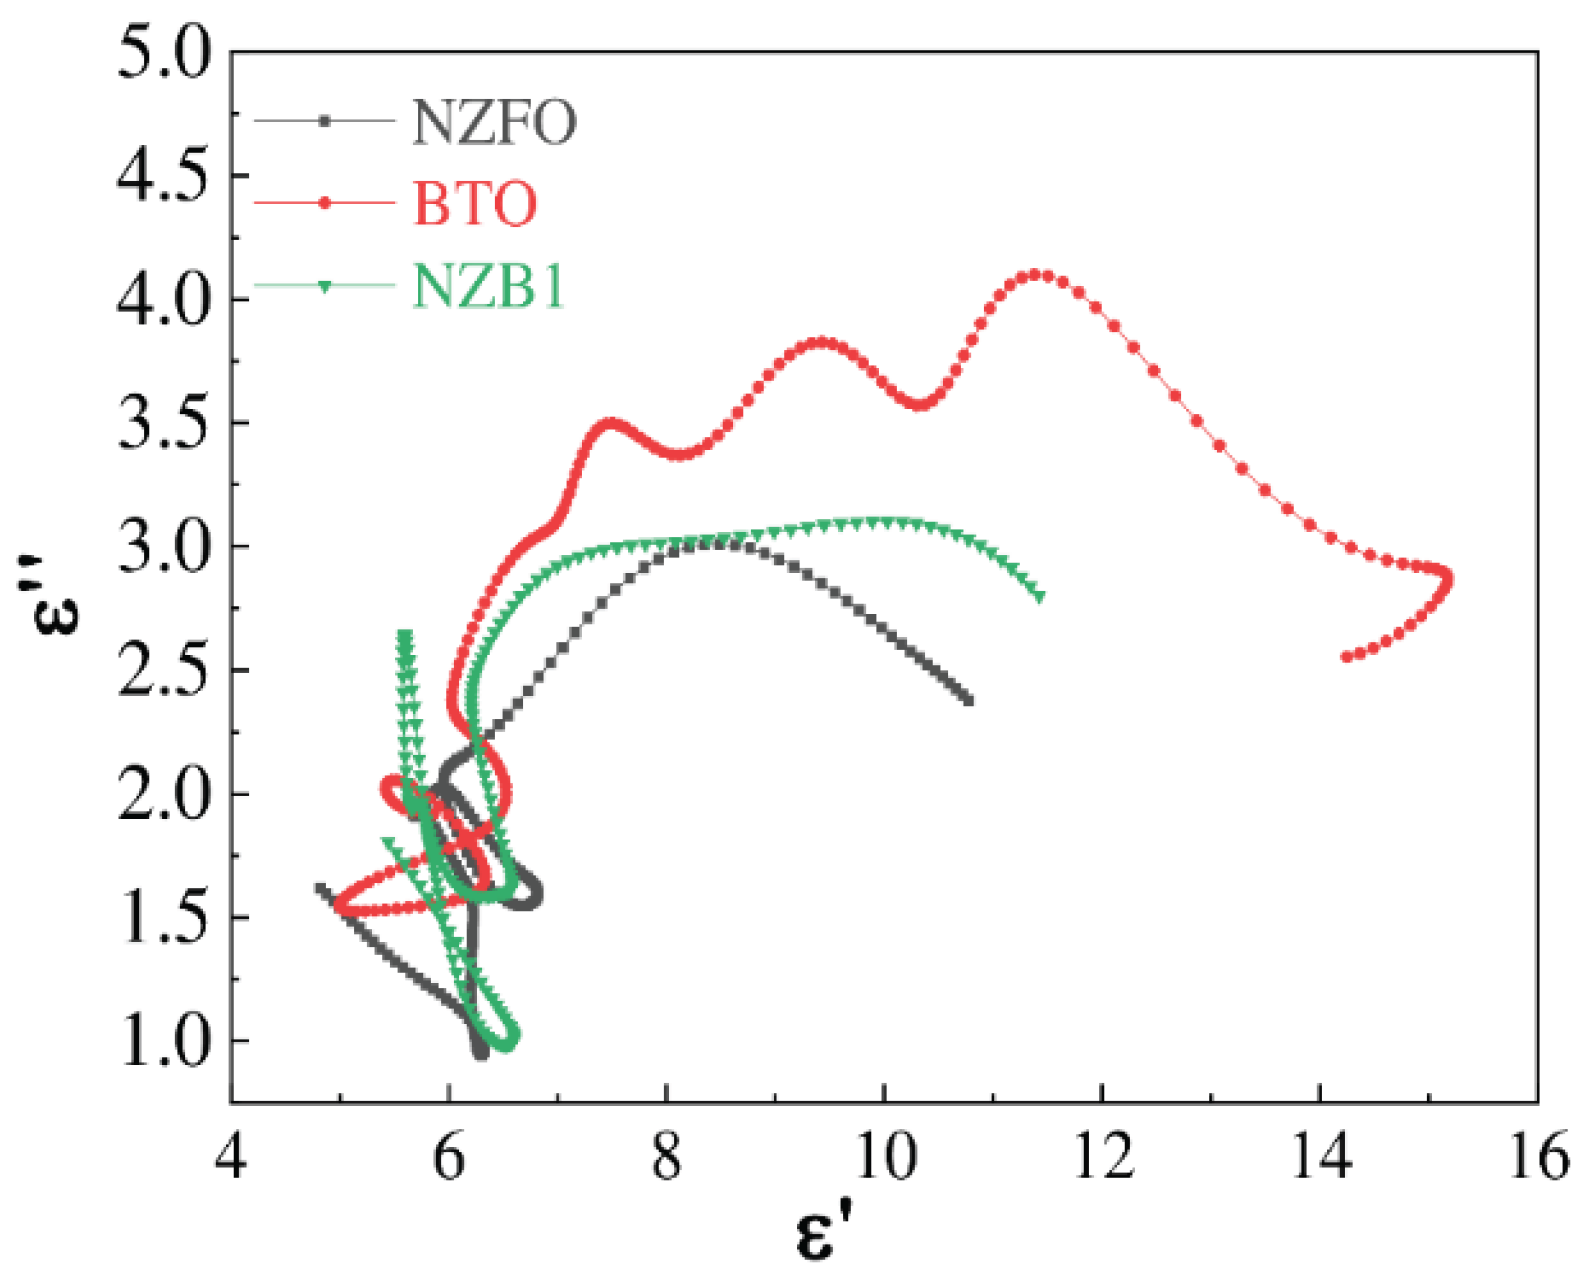
Figure 8.
Visualizations of reflection loss (RL) are provided: (a-c) are two-dimensional RL curves for NZFO-paraffin, BTO-paraffin, and BTNF1-paraffin; (d-f) show three-dimensional RL curves for these composites; and (g-k) represent RL contour plots for NZFO-paraffin, BTO-paraffin, and BTNF5-paraffin.
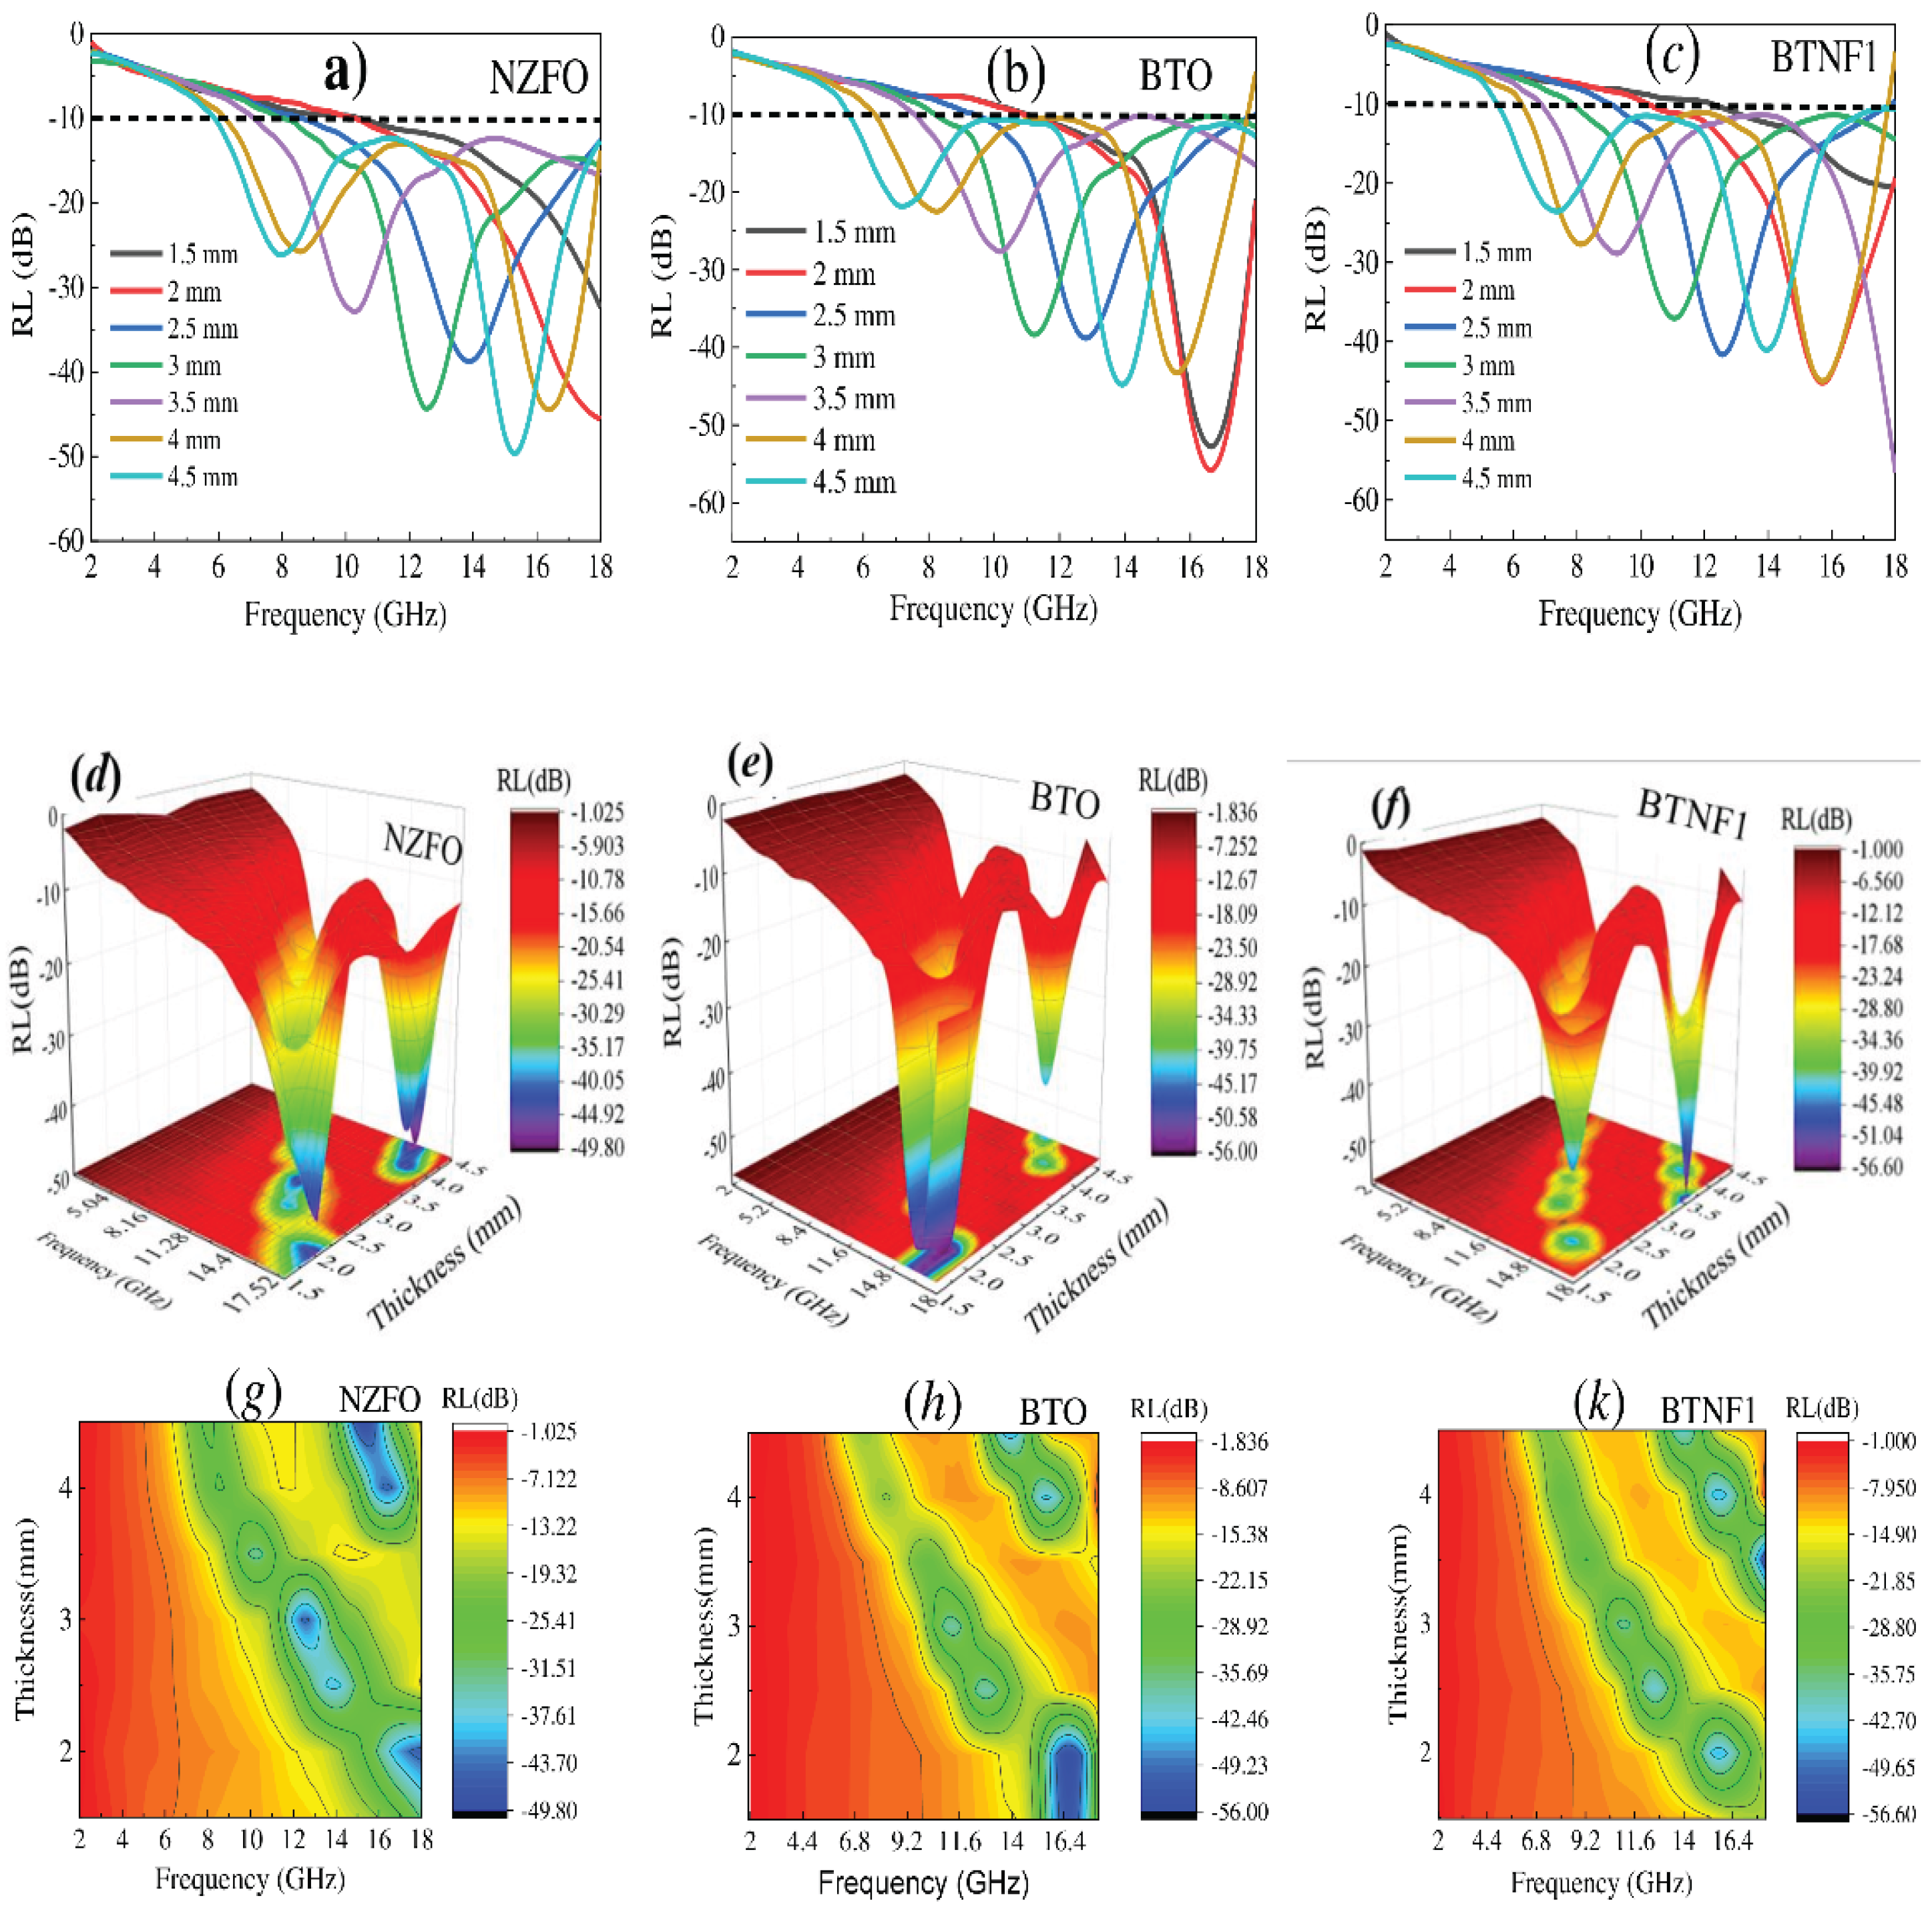
Figure 9.
Graphs illustrating the variation of the absorption coefficient (α) with frequency for all samples.
Figure 9.
Graphs illustrating the variation of the absorption coefficient (α) with frequency for all samples.
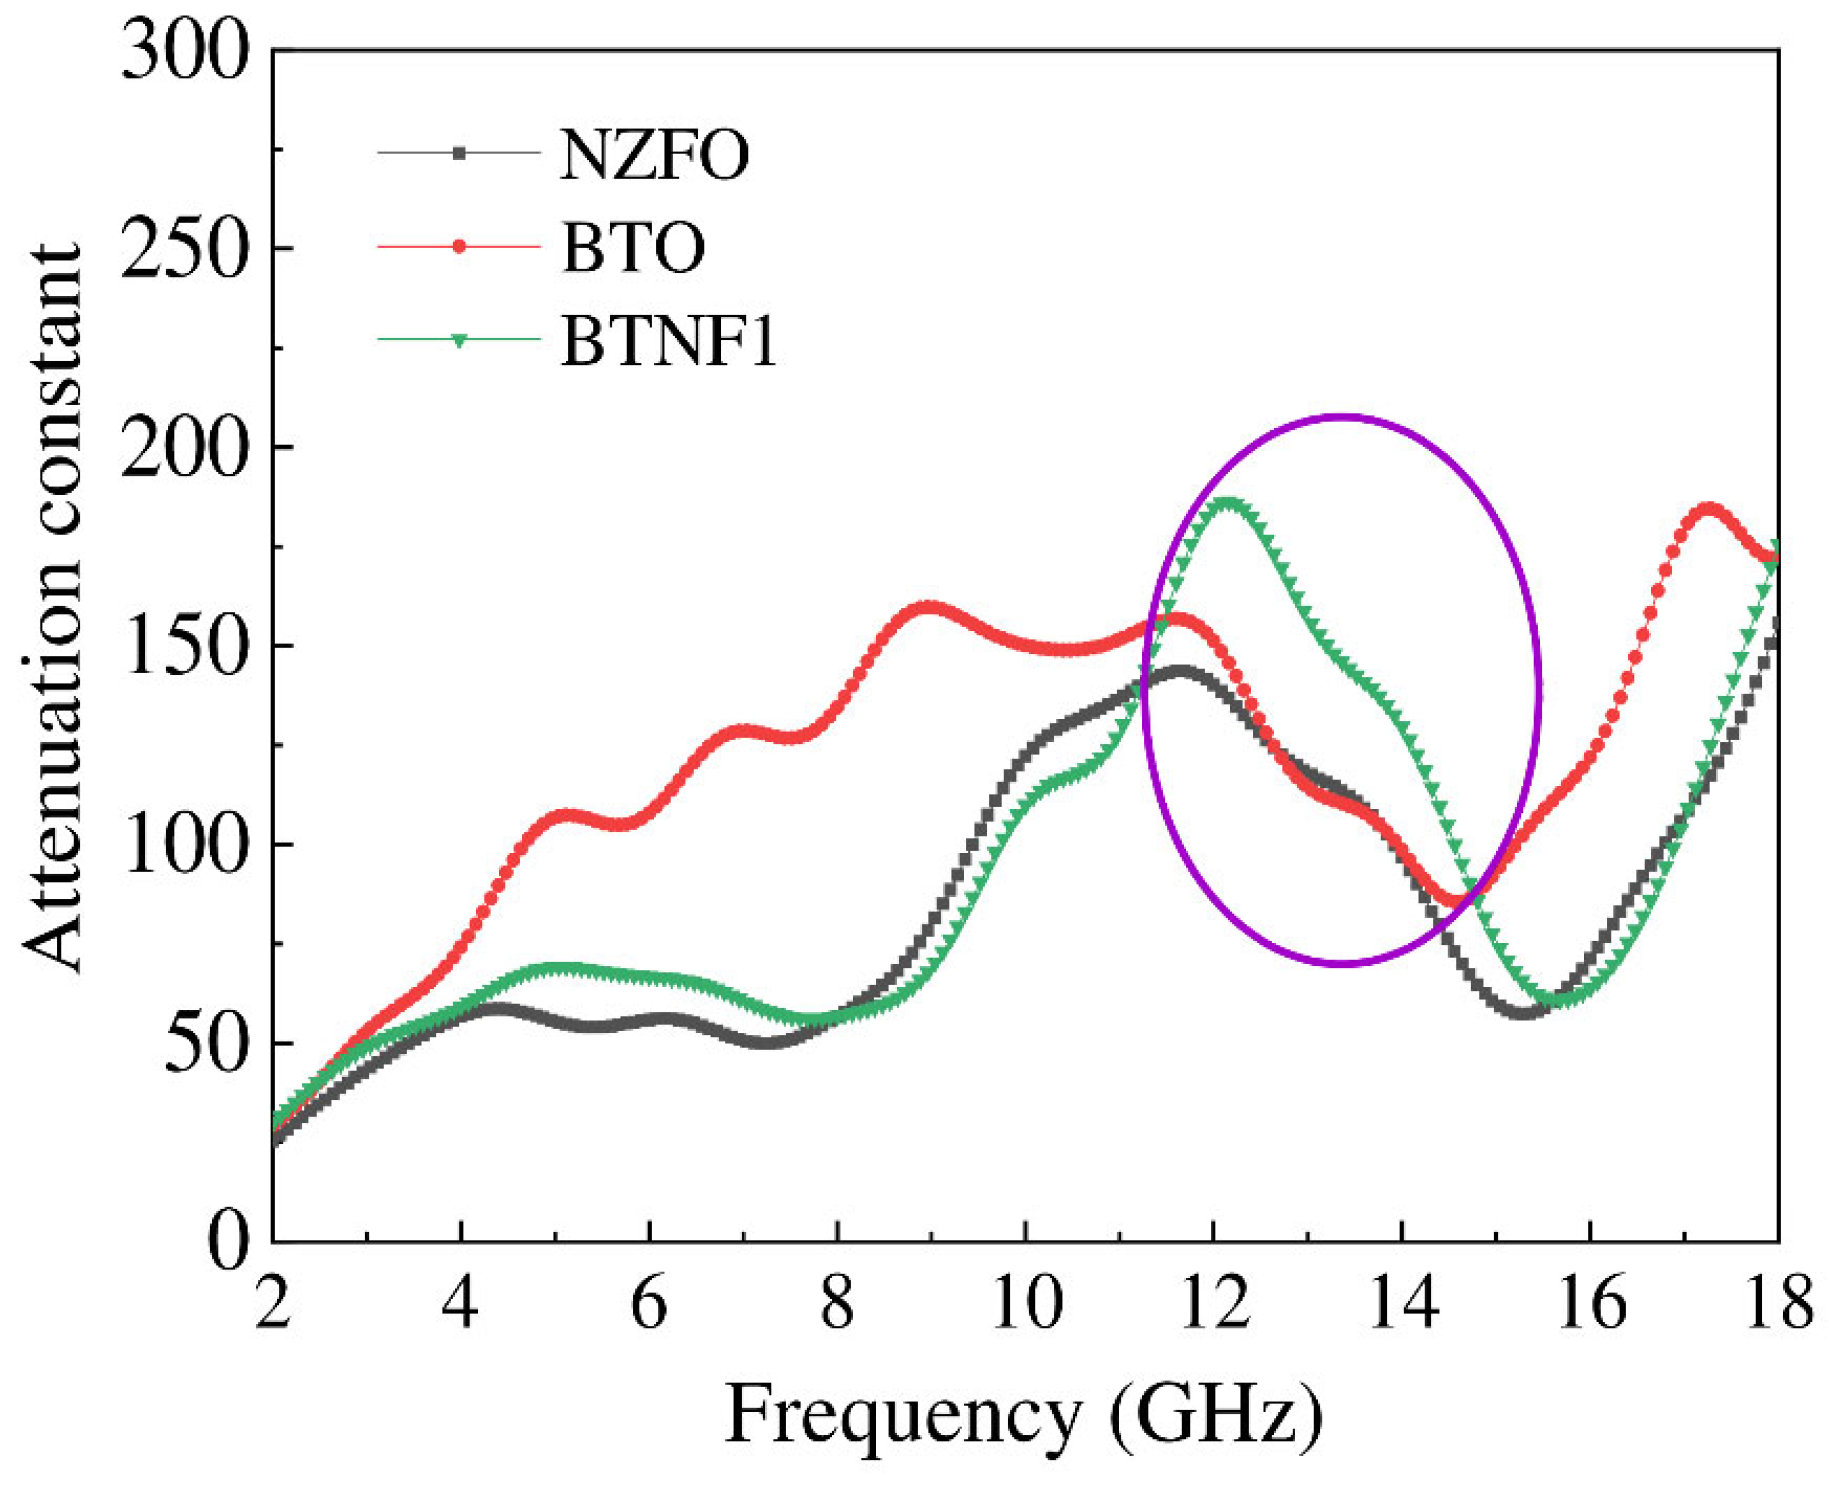
Figure 10.
Frequency dependence of impedance matching ratio of all as prepared samples.

Table 2.
The microwave absorption characteristics of NZFO/BTO composites at varying thicknesses were evaluated by examining their minimum reflection loss (RLmin), resonant frequency (f), and effective absorption bandwidth (EAB) (at RL ≤ -10 dB). These findings were then compared with other similar composites.
| Sample | x | Filler loading (wt%) | Thickness (mm) |
RLmin (dB) |
f(GHz) | EAB (GHz) | Ref. |
|---|---|---|---|---|---|---|---|
| NZFO | 1 | 40 | 1.5 | - | - | - | This work |
| 2.0 | - | - | - | ||||
| 2.5 | -38.74 | 13.85 | 9.36 | ||||
| 3.0 | -44.12 | 12.51 | 9.84 | ||||
| 3.5 | -32.63 | 10.26 | 10.96 | ||||
| 4.0 | -44.71 | 16.41 | 11.84 | ||||
| 4.5 | -49.48 | 15.31 | 12.24 | ||||
| BTO | 0 | 1.5 | -52.62 | 16.6 | 6.64 | ||
| 2.0 | -55.80 | 16.64 | 6.65 | ||||
| 2.5 | -38.51 | 12.5 | 8.48 | ||||
| 3.0 | -38.15 | 11.74 | 9.68 | ||||
| 3.5 | -27.66 | 10.1 | 10.48 | ||||
| 4.0 | -43.24 | 15.5 | 11.6 | ||||
| 4.5 | -44.04 | 13.9 | 12.4 | ||||
| BTNF1 | 0.1 | 1.5 | 0 | 0 | 5.68 | ||
| 2.0 | -44.65 | 15.65 | 7.84 | ||||
| 2.5 | -41.51 | 12.52 | 9.12 | ||||
| 3.0 | -37 | 11 | 10.32 | ||||
| 3.5 | -28.72 | 9.23 | 11.2 | ||||
| 4.0 | -44.9 | 15.7 | 11.84 | ||||
| 4.5 | -41.05 | 13.92 | 12.56 | ||||
| Ni0.5Zn0.5Fe2O4/Ba0.6Sr0.4Fe9.5Al0.5MnTiO19/FeTiO3/epoxy | 5:3:2 | 50 | [3] | ||||
| (Ni0.4Co0.2Zn0.4)Fe2O4 | - | 85 | 3 | -17.1 | 6.1 | 7.6 | [45] |
| (Ni0.5Zn0.5)Fe2O4 /(Ni0.4Co0.2Zn0.4)Fe2O4 | - | 3 | -49.1 | 11.8 | 9.4 | ||
| Ni0.6Zn0.4Fe2O4/PANI | - | 75 | 2.6 | -41 | 12.8 | 5 | [46] |
| NiFe2O4/grapheme/ polyaniline | - | - | 2.5 | -50.5 | 12.5 | 5.3 | [47] |
| (1-x)MWCNT/xNi0.5Zn0.5 Fe2O4 | 0.4 | - | 3.0 | -19.34 | 8.46 | 1.24 | [48] |
| xFe3O4/(1-x)BaTiO3-paraffin | 0.25 | 75 | 1.9 | -29.5 | 12.1 | 2.4 | [21] |
| 0.75 | 2.3 | -42.5 | 10.2 | 2.6 | |||
| 0.8 | 2.2 | -47.4 | 12.26 | 5.5 |
Disclaimer/Publisher’s Note: The statements, opinions and data contained in all publications are solely those of the individual author(s) and contributor(s) and not of MDPI and/or the editor(s). MDPI and/or the editor(s) disclaim responsibility for any injury to people or property resulting from any ideas, methods, instructions or products referred to in the content. |
© 2025 by the authors. Licensee MDPI, Basel, Switzerland. This article is an open access article distributed under the terms and conditions of the Creative Commons Attribution (CC BY) license (http://creativecommons.org/licenses/by/4.0/).
Copyright: This open access article is published under a Creative Commons CC BY 4.0 license, which permit the free download, distribution, and reuse, provided that the author and preprint are cited in any reuse.


