Preprint
Article

This version is not peer-reviewed.

An Analysis of Primary Health Care Antibiotic Prescription Rates within Castile and Leon (Spain): 2013 - 2023

A peer-reviewed article of this preprint also exists.

Submitted:

09 September 2025

Posted:

10 September 2025

You are already at the latest version

Abstract

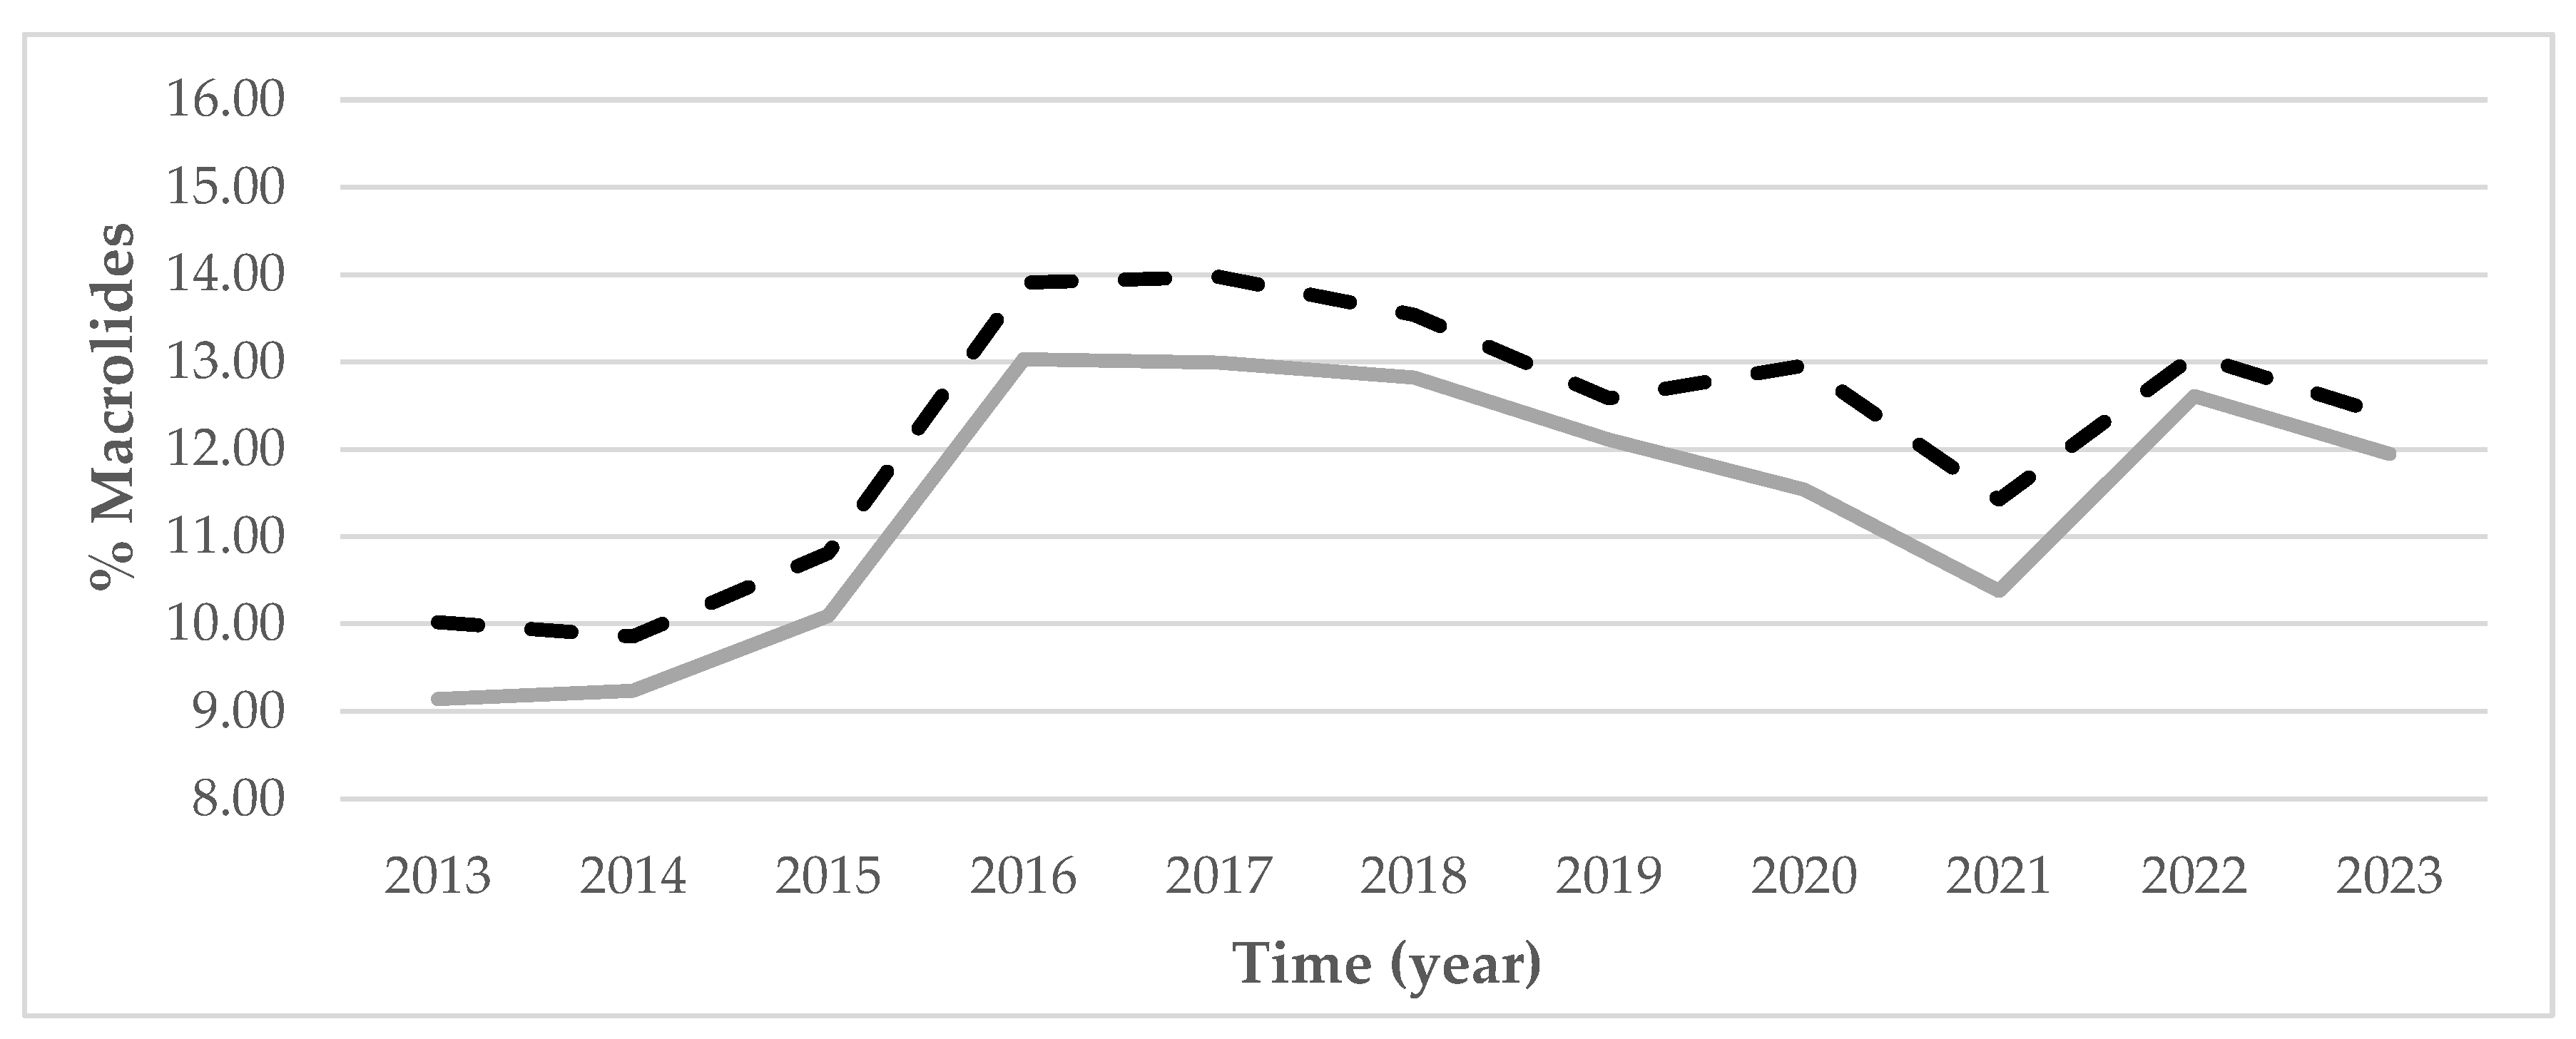
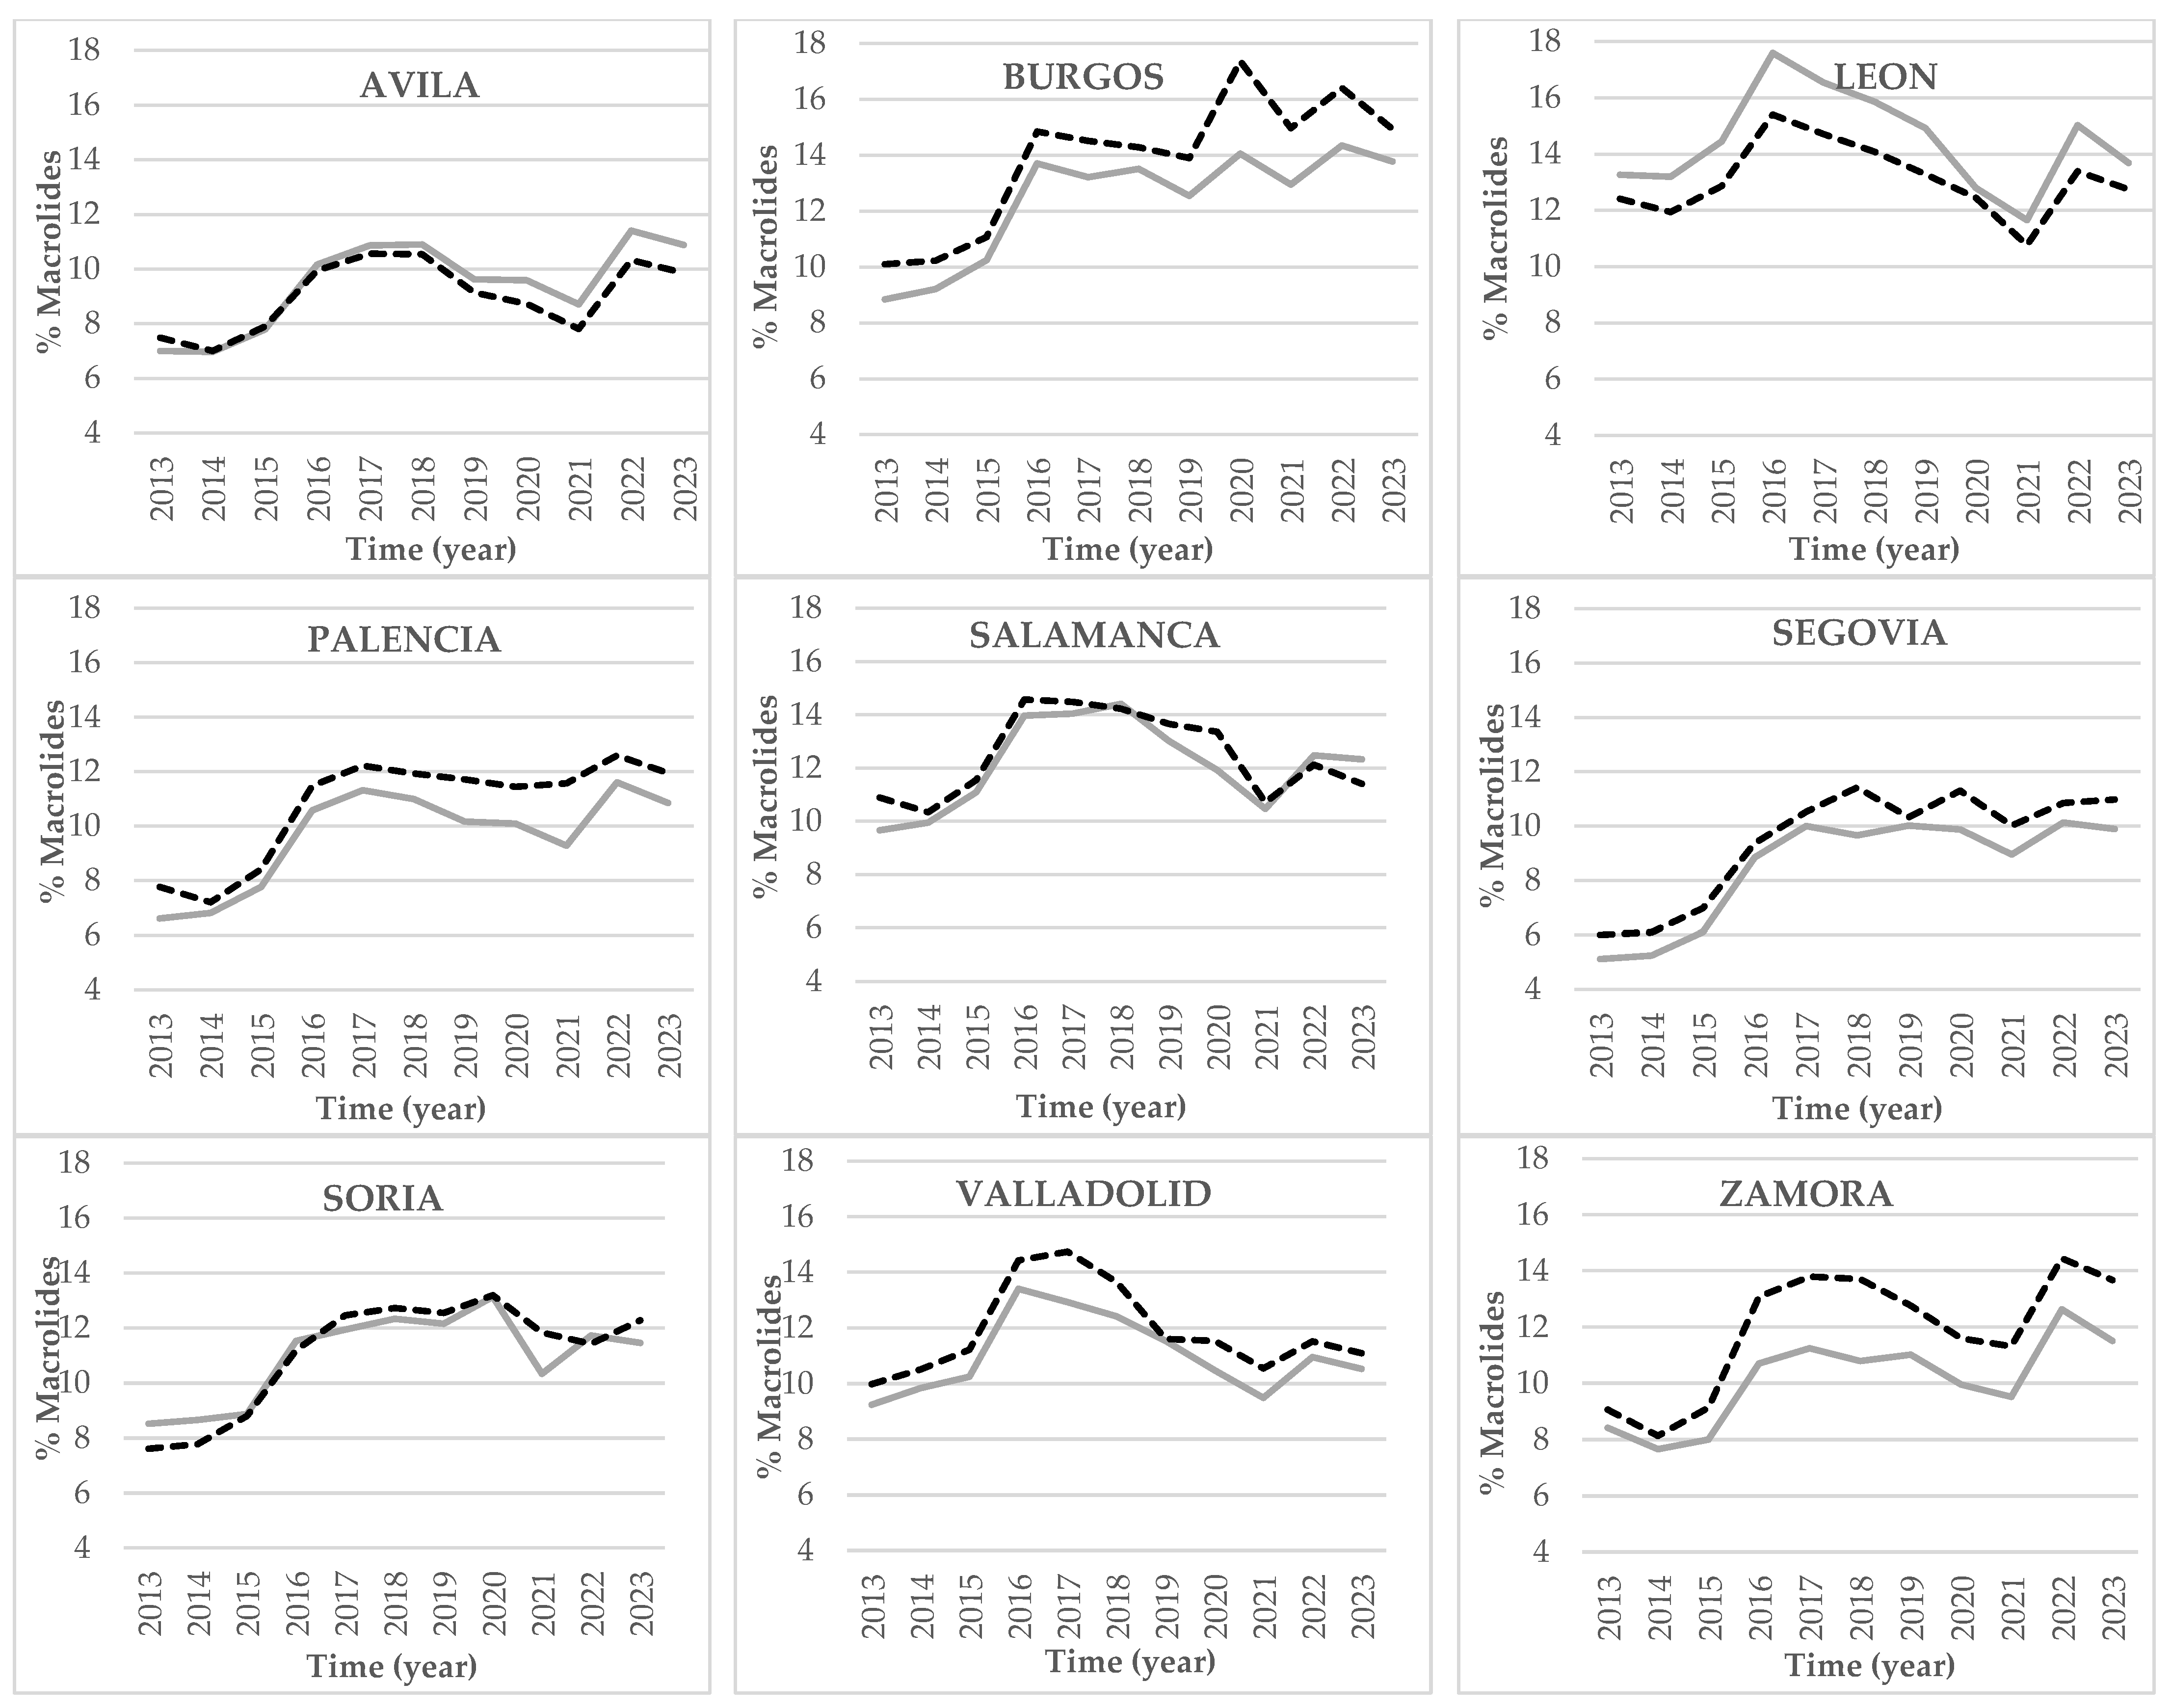
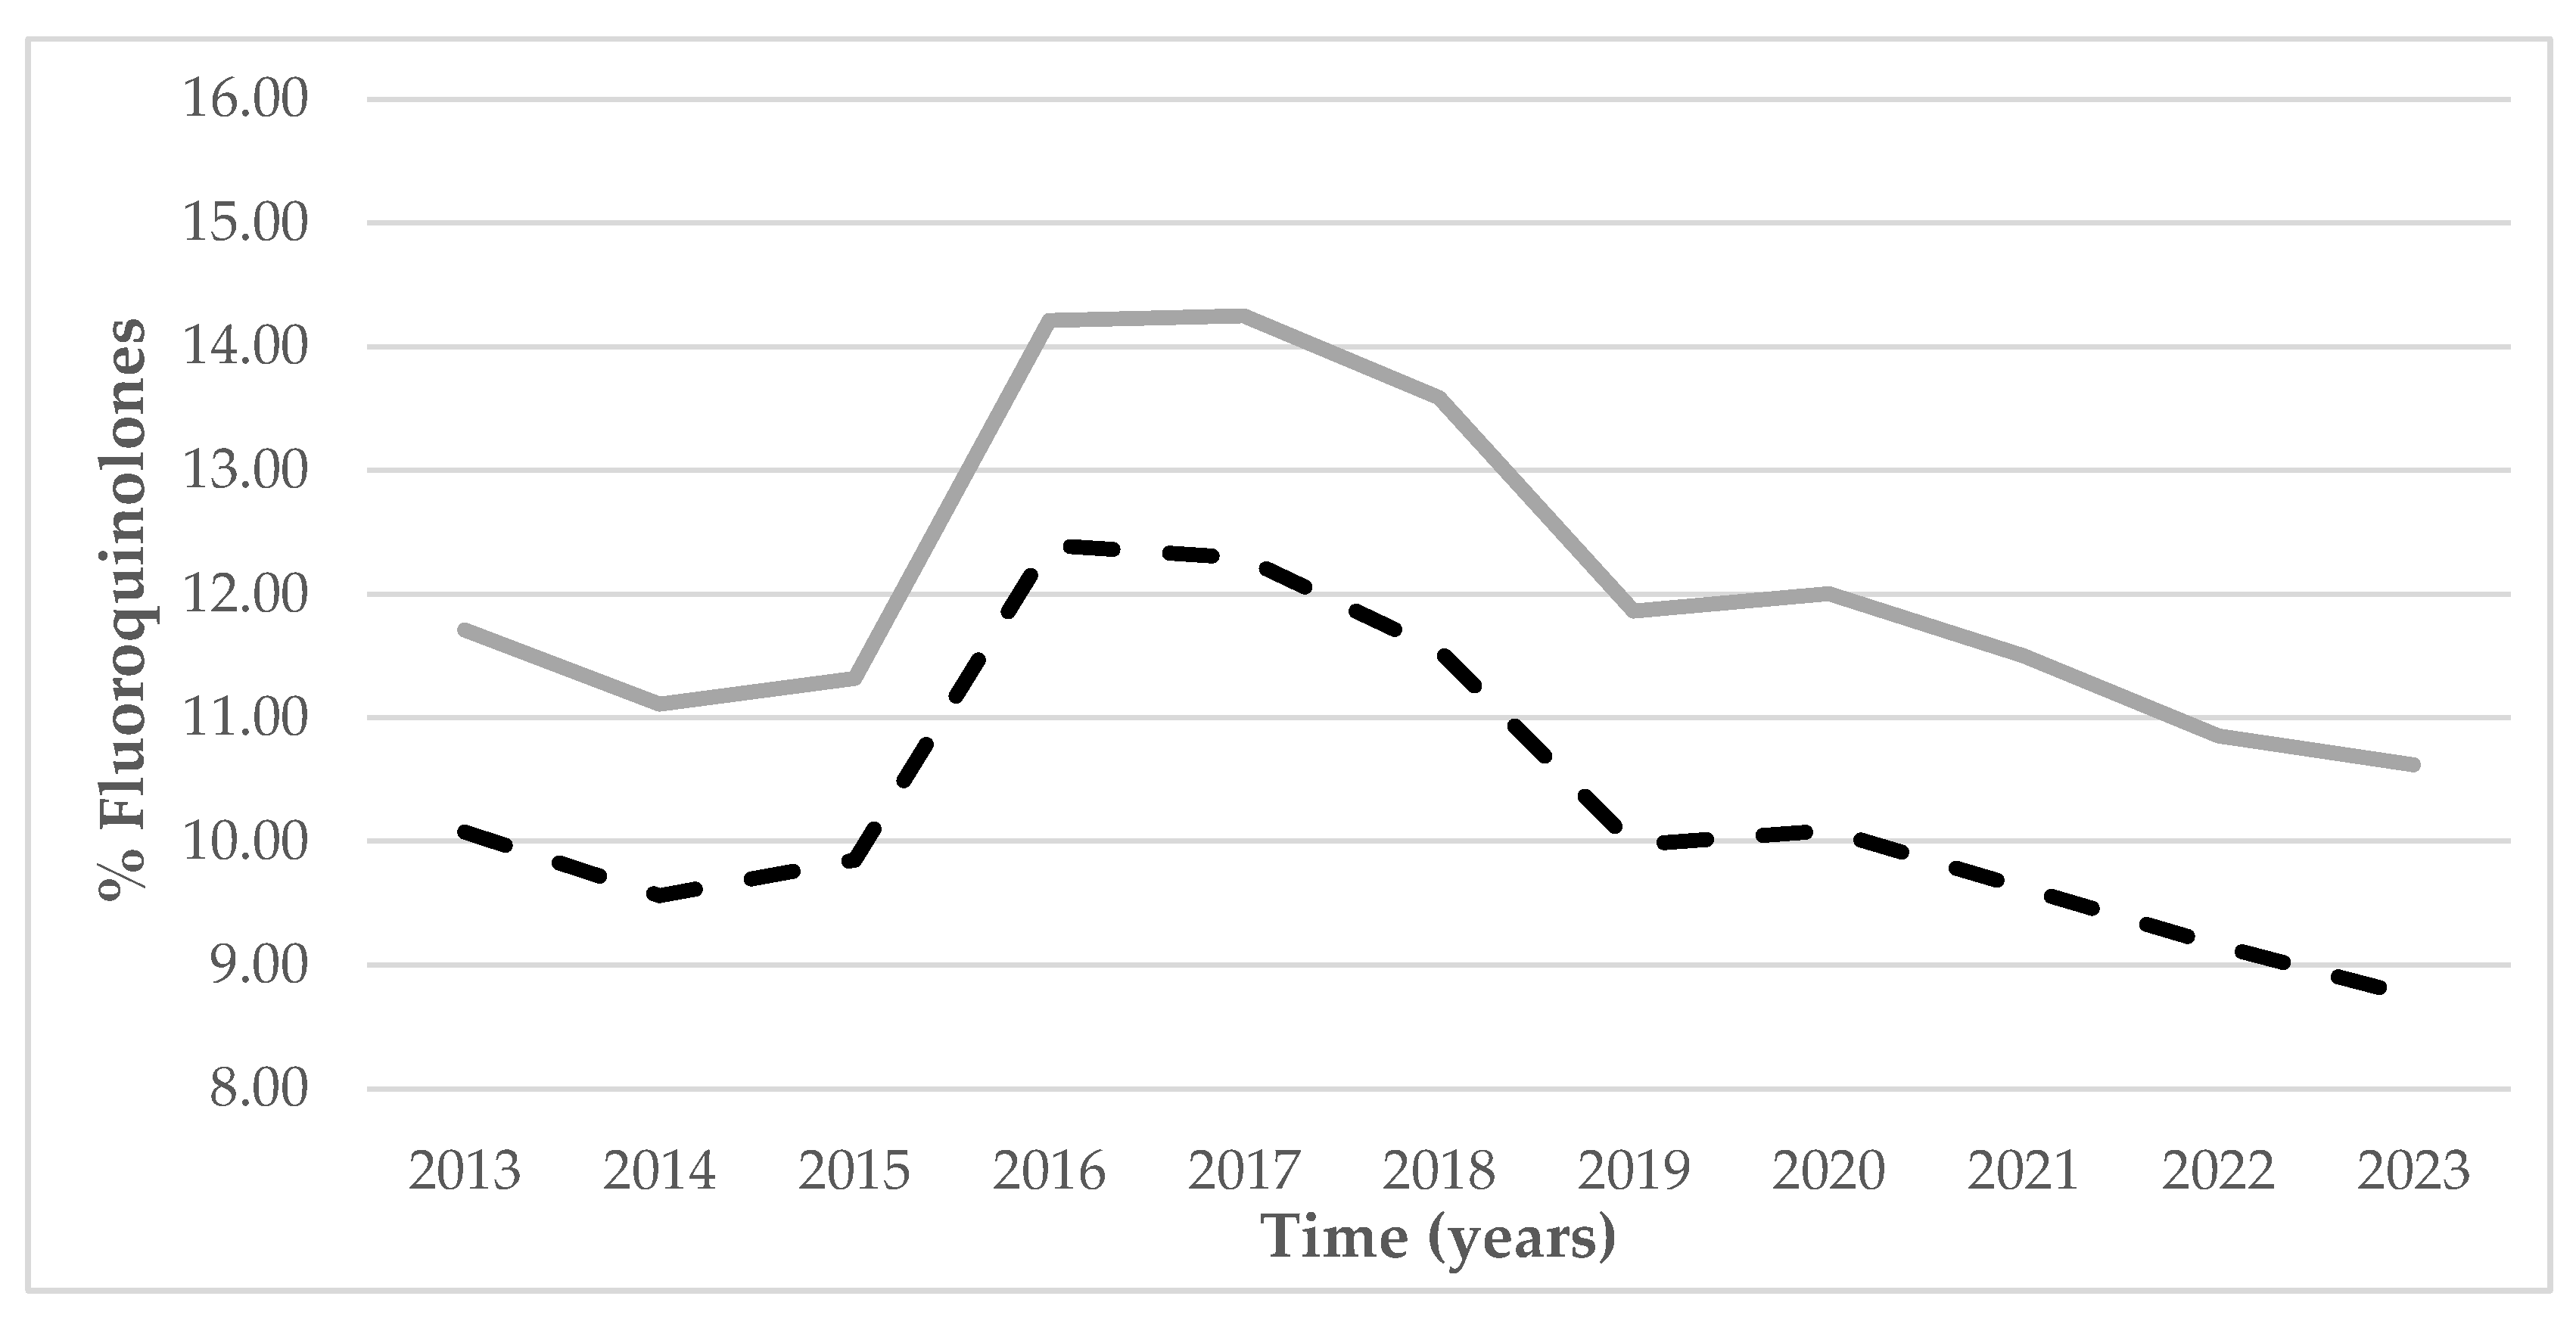
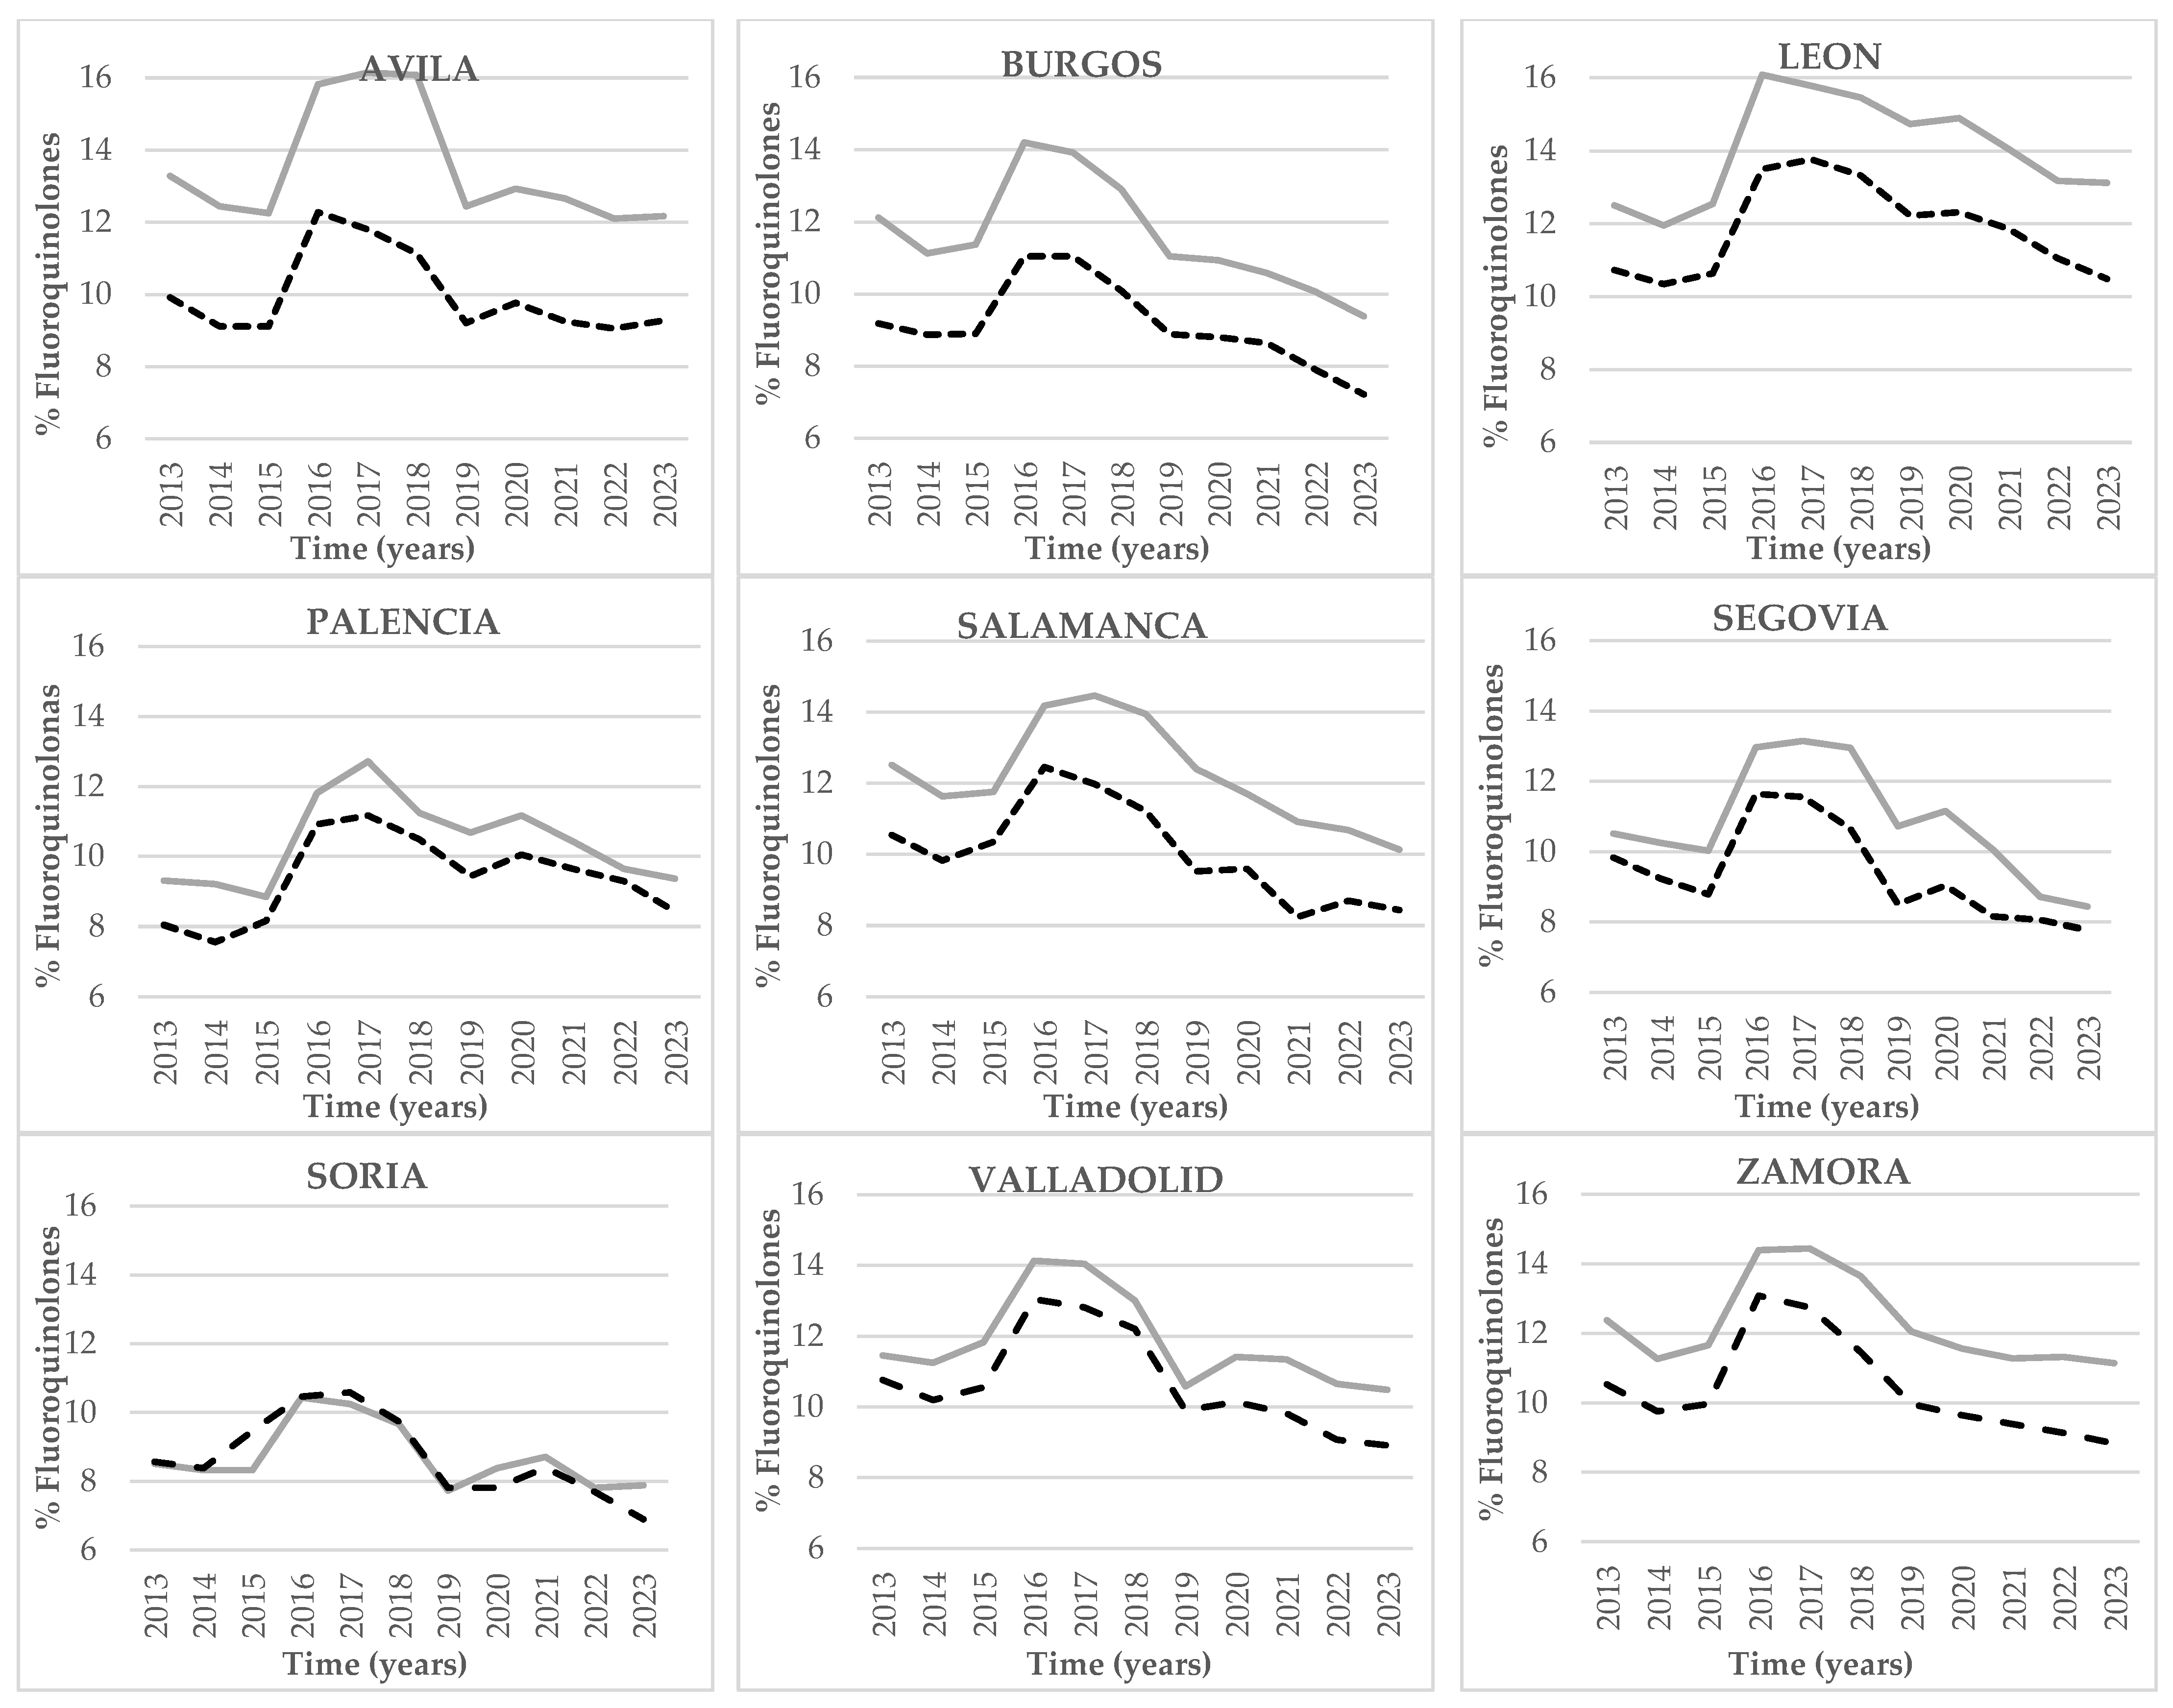
Background/Objectives: According to the World Health Organization, bacterial resistance is one of the main threats to public health and could within a short time become the principal cause of death. This study proposes to study antibiotic prescription rates at Basic Health Centres (BHC) within Castile and Leon over the period 2013-2023, and to determine which sociodemographic variables might influence the prescription of antibiotics. Methods: A descriptive, observational, ecological study was conducted on the basis of data provided by Concylia (Pharmaceutical information system-Castile & Leon Health Service). Comparable variables (time of prescription and type of Health Centre) and variables of results (Defined Daily Dose per 1000 health-center card-holders per day and qualitative antibiotic selection variables) were analyzed. Results: During the first years under analysis, prescriptions increased, followed by a reduction at the start of 2015 that continued up until 2021, after which a new increase was recorded and they once again reached values in 2023 that were comparable to those observed in 2019. Throughout all of Castile and Leon, there were more prescriptions within urban areas; but when analyzed by provinces, prescriptions were mainly higher in rural areas within most provinces. The percentage of macrolides was higher in urban areas, whereas the percentage of fluoroquinolones was higher in rural areas. Conclusions: The variation was repeated throughout the period under study in a similar way in all the provinces of Castile and Leon and at a national level. Differences were observed in prescriptions between the provinces of the autonomous region. Higher prescriptions rates were observed in the rural areas of most provinces.

Keywords: 
;  ;  ;  ;  ;  

1. Introduction

Inappropriate intake of antibiotics is one of the main factors contributing to the development of bacterial resistance. Infections caused by multi-resistant pathogens, one of the main challenges for public health services in the 21st C, are fast turning into a global health emergency [1,2,3,4].
Infections due to resistant pathogens are more difficult to treat, which implies lengthier hospital admissions, and both higher mortality rates and health-care costs. The World Health Organization (WHO) warned that Anti-Microbial Resistance (AMR) is one of the main global threats; it is estimated that 1.27 million deaths every year may be attributable to AMR [4]
Spain has historically been ranked among the European countries with the highest antibiotic prescription rates, despite initiatives for the optimization of anti-microbial treatments, such as the Plan Nacional frente a la Resistencia a los Antibióticos (PRAN) [National Plan to combat Antibiotic Resistance]. In 2023, Spain had the fourth highest antibiotic prescription rates among all European countries within the European Community [5], so rational use of this sort of treatment assumes a priority focus.
Up until 2023, there had been a global reduction of antibiotic prescriptions related to human health of 13.5% in Spain, since the launch of the PRAN in 2014. The highest prescription rate in 2015 amounted to 28.06 Defined Daily Doses (DDD) per 1000 Inhabitants per Day). Nevertheless, significant variations persist between Autonomous Regions within Spain (15.56 – 27.06 DDD per 1000 Inhabitants per Day) [5], suggesting that regional and sociodemographic factors may influence the use of antibiotics. A recent study shows a 20.2% increase in the Defined Daily Doses (DDD) per 1000 Inhabitants per Day) of antimicrobials from 2017 to 2023, with higher consumption of antibacterials in women, people over 65 years of age, pensioners, and residents of municipalities with fewer than 10,000 inhabitants [6].
Castilla y León is a Spanish autonomous community characterized by a wide geographical dispersion, a high aging index (regional index 223.89 vs national index 142.35y in 2024) [7] and a large proportion of rural areas. These geographical attributes could affect the antibiotic prescription profile in primary healthcare. Previous studies have suggested that prescriptions may be higher in areas with aging populations or in predominantly rural areas [8], and evidence has been presented of a degree of intra-regional variability with prescription rates fluctuating between 13 and 22 DDD per 1000 inhabitants per day [8].
Around 90% of antibiotic consumption for human health takes place in the context of primary healthcare and approximately two thirds of all patients treated for infectious illnesses receive antibiotic therapy, principally for common respiratory, urinary, and dermatological infections [9,10,11]. These data suggest that between 25% and 30% of the population receive at least one antibiotic treatment every year [12]. Among the antibacterials for systemic use, the most widely used classes within Spain are penicillins (especially in combination with beta-lactamase inhibitors), macrolides, and quinolones. In particular, azithromycin (a broad-spectrum macrolide) has consolidated itself among the most widely dispensed active principles within the region, which makes it a relevant indicator of likelihood of use [13]. In addition to high rates of prescription and dispensation, excessive or inappropriate administration of these medicines, often in treatments against self-limiting diseases or of viral origin, is causing concern [14]. This situation reinforces the need to consolidate and to intensify programs that are directed at optimizing the use of antimicrobials in the field of Primary Health Care, which is considered a priority area for intervention by the health authorities [10,12,14].
In this context, Primary Health Care antibiotic prescription rates within Castile and Leon over the period 2013-2023 are examined in the present study. They are analyzed by therapeutic subgroups and active principles of interest, considering both temporal and territorial variations. Regional and national prescription patterns are compared, analyzing the possible impact of the PRAN strategies and local demographic factors (especially the aging population). It is to be expected that the results will provide evidence to guide interventions and policies, so as to improve the use of antibiotics that are adapted to local realities, contributing both to slowing the progress of bacterial resistance and to a One Health perspective, that integrates the dimensions of human, animal, and environmental health.

2. Results

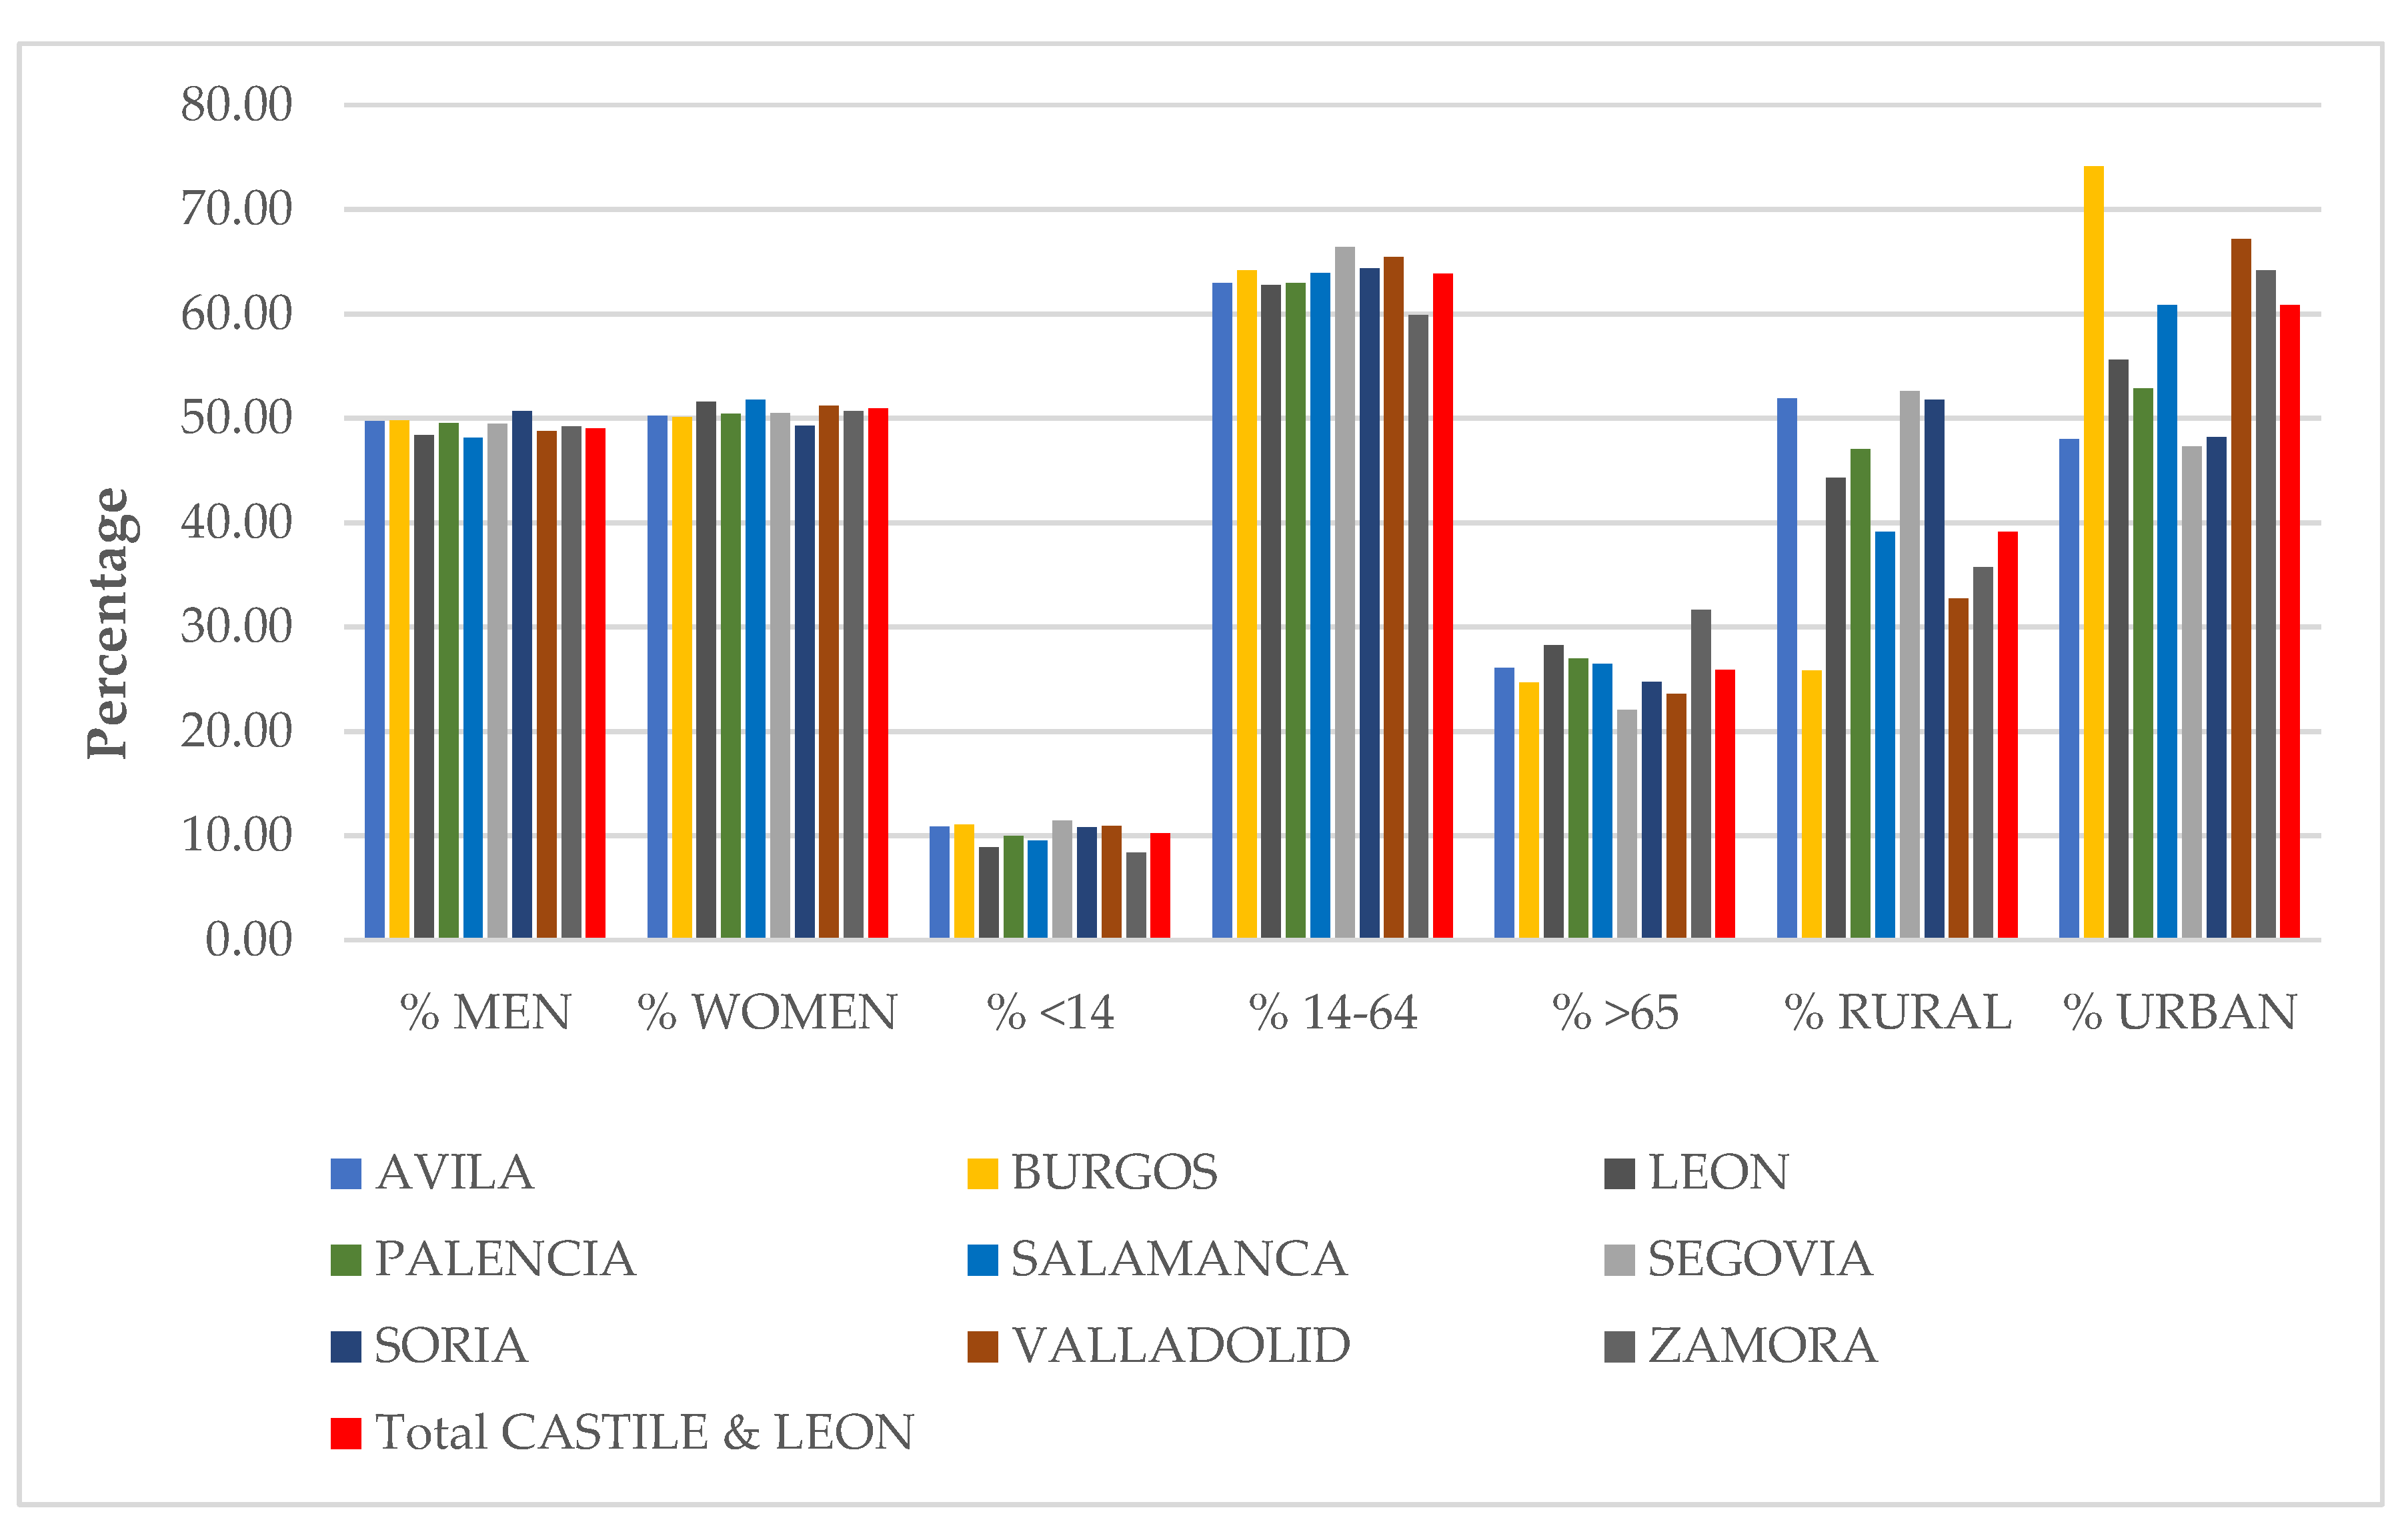
2.1. Descriptive Analysis of the Population Holding a Health-Care Card in Castile and Leon (Figure 1)

The percentage of women with a Health-Care Card (HCC) was slightly higher than the percentage of men in all the provinces with the exception of Soria. With regard to the distribution by age, an aging population is evident throughout the community, with slight differences between provinces. The province with the highest number of people over 65 years old was Zamora (31.66%), followed by Leon (28.26%), and Palencia (27.01%). The province with the highest numbers of a population younger than 14 years old was Segovia (11.45%), followed by Burgos (11.11%), Valladolid (10.94%), Avila (10.93%), and Soria (10,85%). With regard to the population between 14 and 65 years old, the province with the highest number of people within that age range was Segovia (66.46%), followed by Valladolid (65.46%), Soria (64.36%), Burgos (64.17%), and Salamanca (63.93%).
With regard to the rural and urban distribution of the population, the province with the highest percentage of its population registered at a rural BHC was Segovia (52.64%), followed by Avila (51.94%), and Soria (51.80%), all of which with rural populations over 50%. In contrast, the province with the highest percentage of its population registered at an urban BHC was Burgos (74.16%), followed by Valladolid (67.23%), Zamora (64.22%), and Salamanca (60.88%), all of which with over 60% of the population registered at an urban BHC.

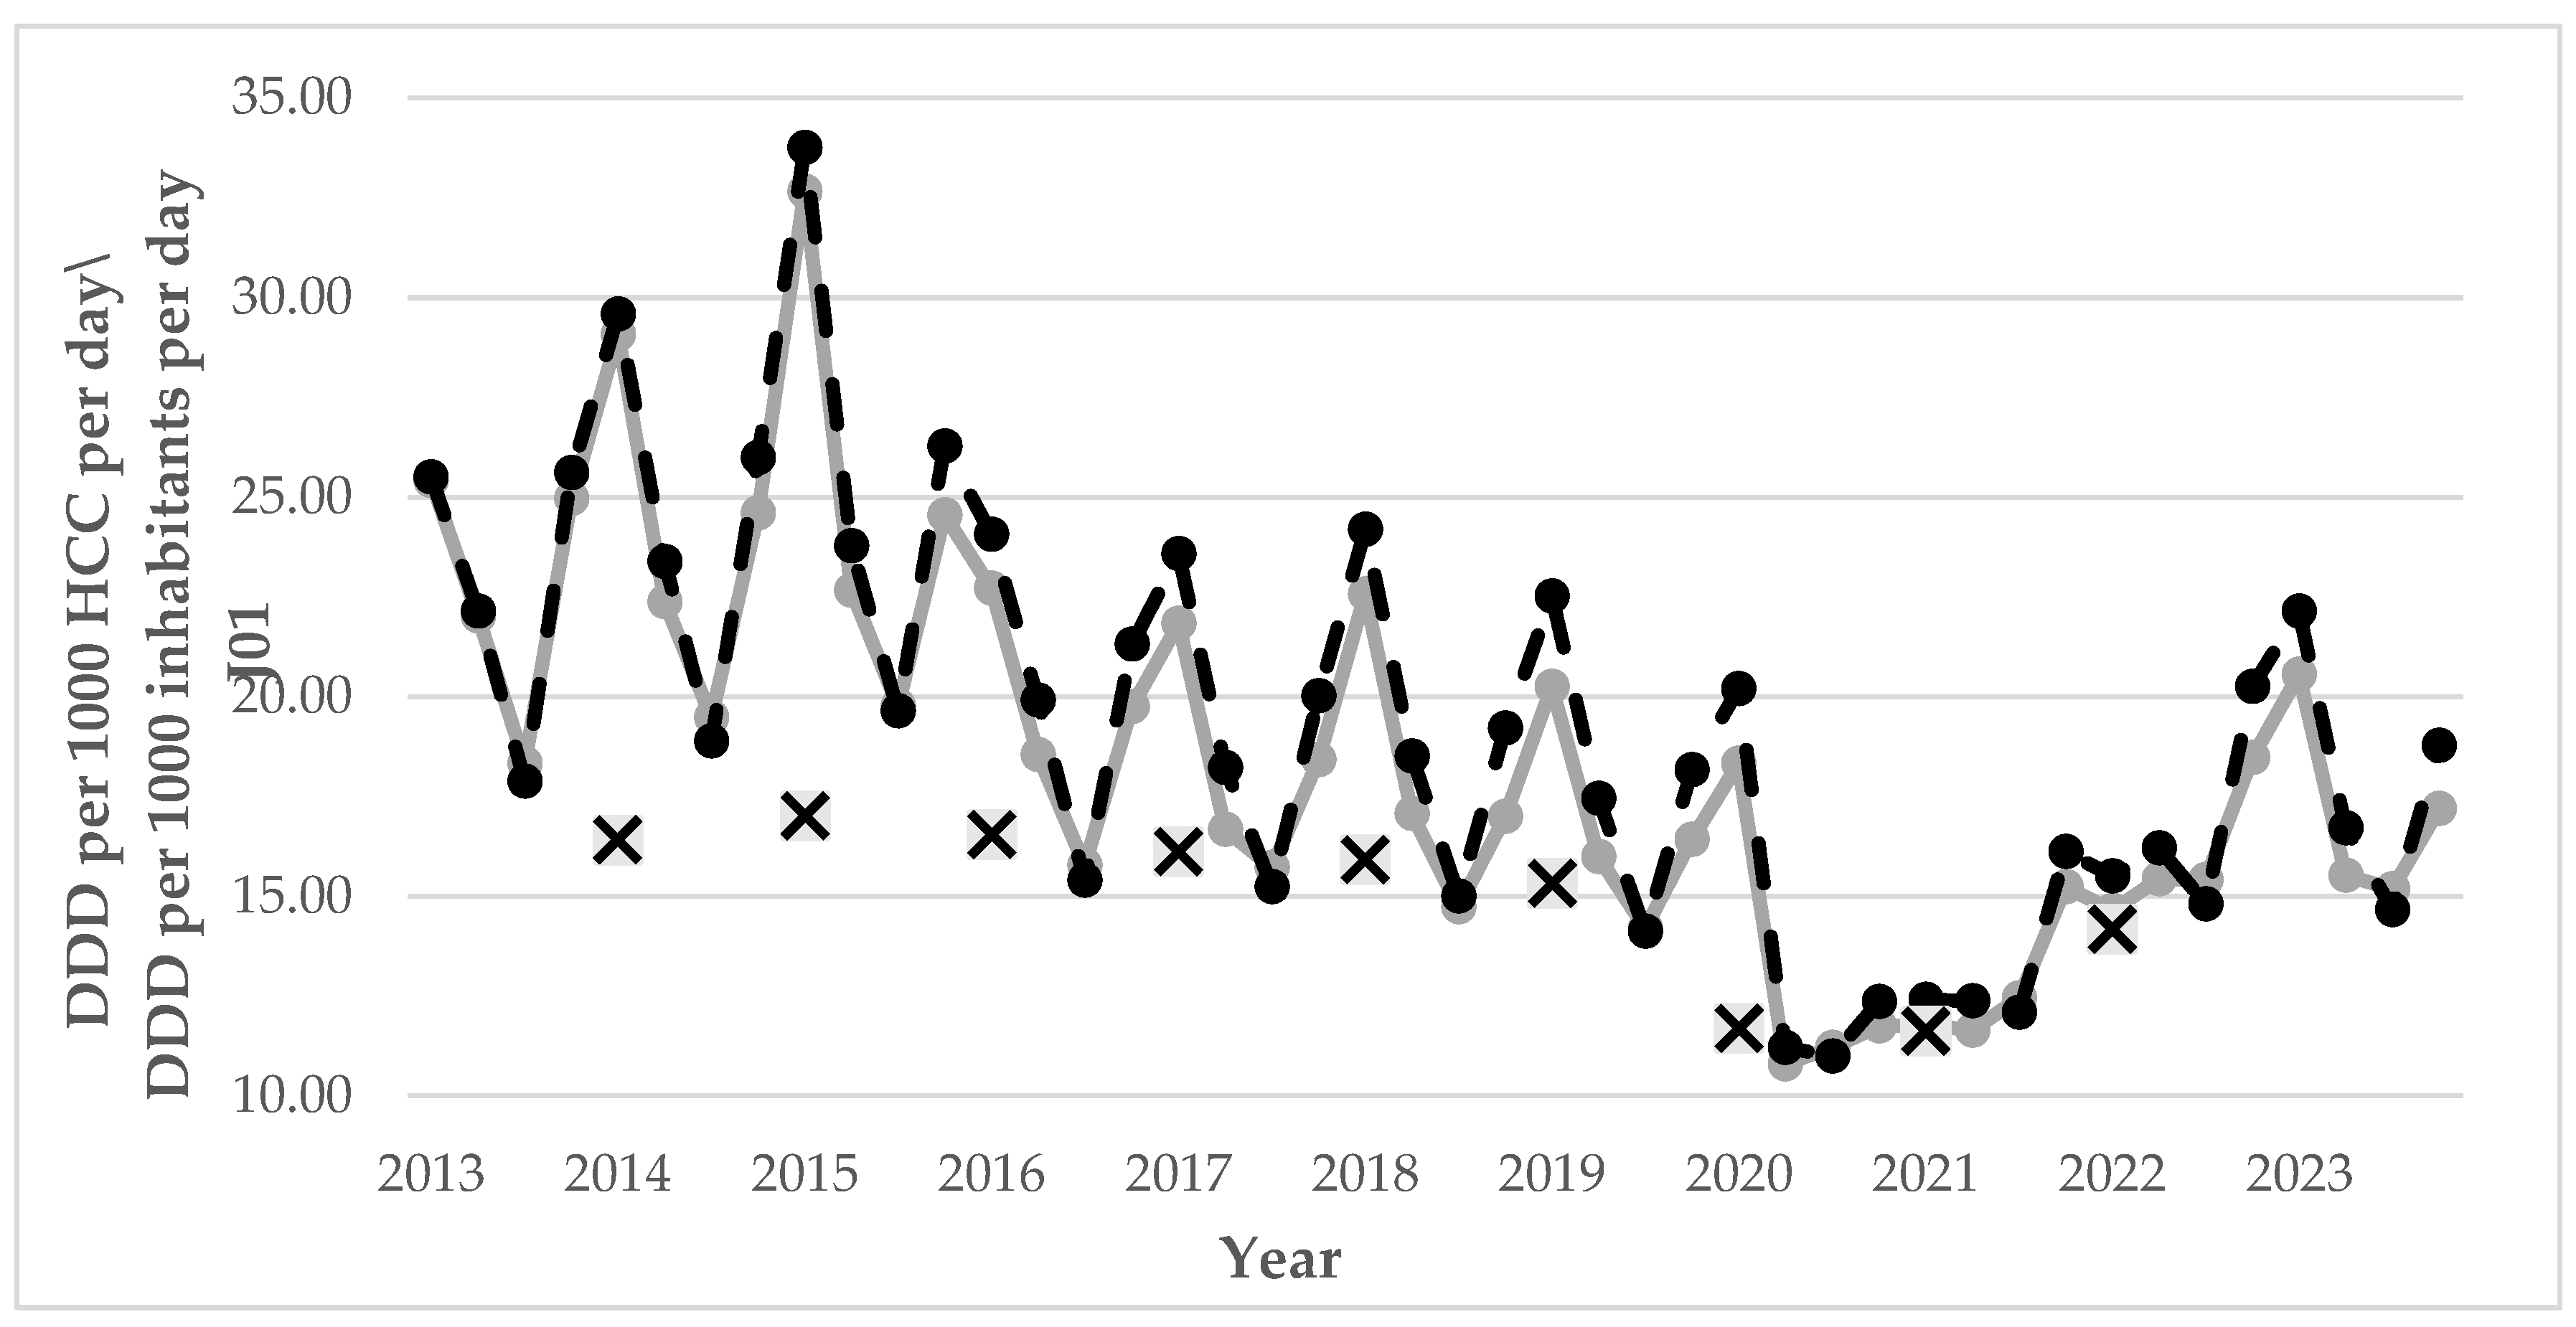
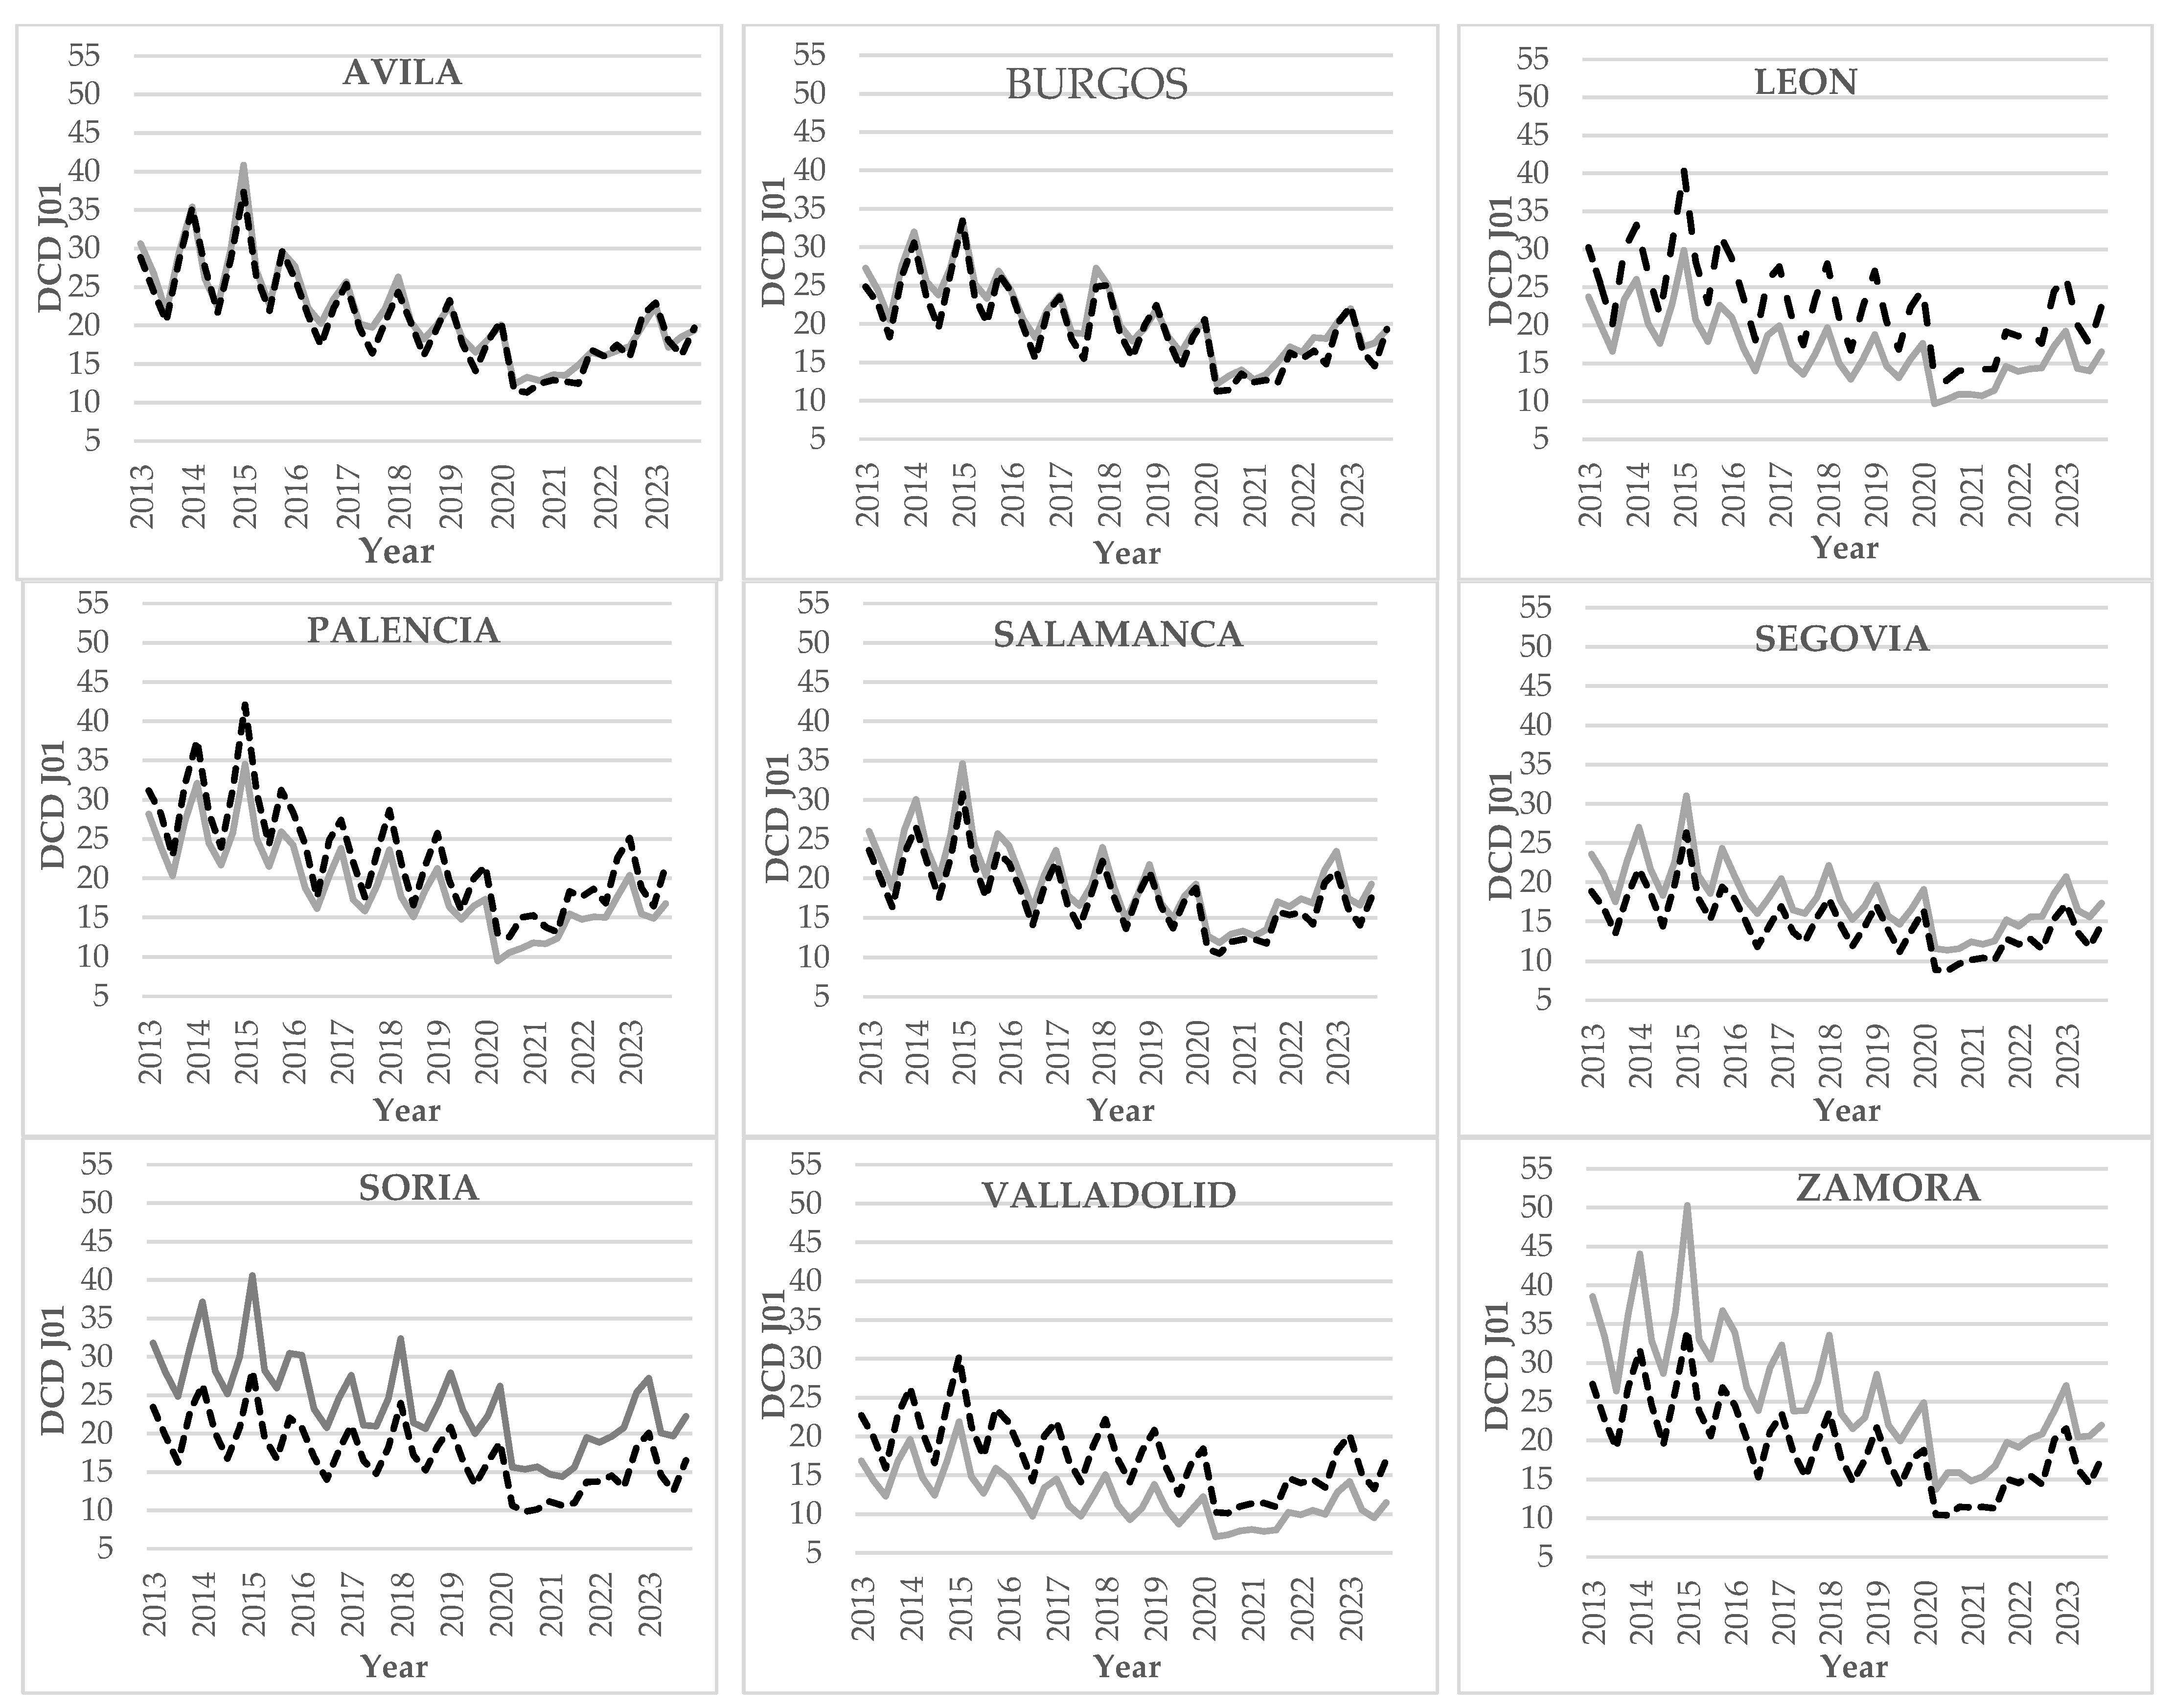
2.2. Prescriptions of Anti-Microbials for Systemic Use (J01).

There was considerable variation in the prescriptions of anti-microbials for systemic use (J01) at the basic health centers of Castile and Leon according to the quarter of the year, their prescription rates being higher in the first and last quarters (coinciding with the colder months) and lower in the third quarter (coinciding with the summer months).
Throughout the years under study, antibiotic prescriptions visibly fluctuated (Figure 2). Antibiotic prescriptions between 2013 and 2015 increased, reaching a peak in the first quarter of 2015 (32.66 DCD1 in rural areas and 33.75 DCD in urban areas of Castile and Leon). Over the period 2016 to 2020, there was a slow descent, with the fewest prescriptions in the second quarter of 2020 (10.80 DCD in rural areas and 11.20 DCD in urban areas of Castile and Leon). Subsequently, prescriptions slowly began to rise again until they reached slightly higher figures than in 2019 in the first quarter of 2023 (20.56 DCD in rural areas and 22.14 DCD in urban areas of Castile and Leon).
When analyzing the difference in prescriptions between rural and urban areas (Figure 2), it may be seen that prescriptions were very similar in the first years of the study (2013-2015), but were slightly higher at urban basic health centers as from 2016, with an average percentile difference over the years under study of 4.35% more prescriptions at the urban basic health centers.
The quarterly prescription trends observed in Castile and Leon (Figure 2) were evident in all the provinces. In Figure 3, prescriptions of medication within the J01 subgroup are shown for both the rural and the urban health centers of each province of Castile and Leon. Prescriptions were higher in the urban basic health centres of the provinces of Leon, Palencia and Valladolid, while prescriptions at the rural basic health centers were higher in the other provinces.

2.3. Prescription Rates of Pharmacological Therapeutic subgroups

Table 1 shows a summary of average prescription rates of medicines over the period 2013-2023 by pharmacological therapeutic subgroup and urban and rural basic health centers of Castile and Leon and their percentile differences.
Prescriptions of medicine in the J01A subgroup were higher in all provinces at the urban basic health centers. Prescriptions of medicine in the J01C subgroup varied to a greater extent and were higher at the rural basic health centers of the provinces of Burgos, Salamanca, Segovia, Soria, and Zamora, whereas their prescriptions were higher at the urban basic health centers of all the other provinces. Prescriptions of medicines in all the other subgroups within the provinces of Avila, Burgos, Segovia, Soria, and Zamora were higher in rural areas (with the exception of J01F in Burgos and J01G in Zamora). In contrast, there were higher prescription rates of all the other subgroups within urban areas of the provinces of Leon, Palencia, and Valladolid (except for J01G in Valladolid). In Salamanca, prescriptions were even more uneven, with higher prescriptions of medicine in the J01E and J01X subgroups within urban areas, and higher prescription rates within rural areas of medicines within all the other subgroups.

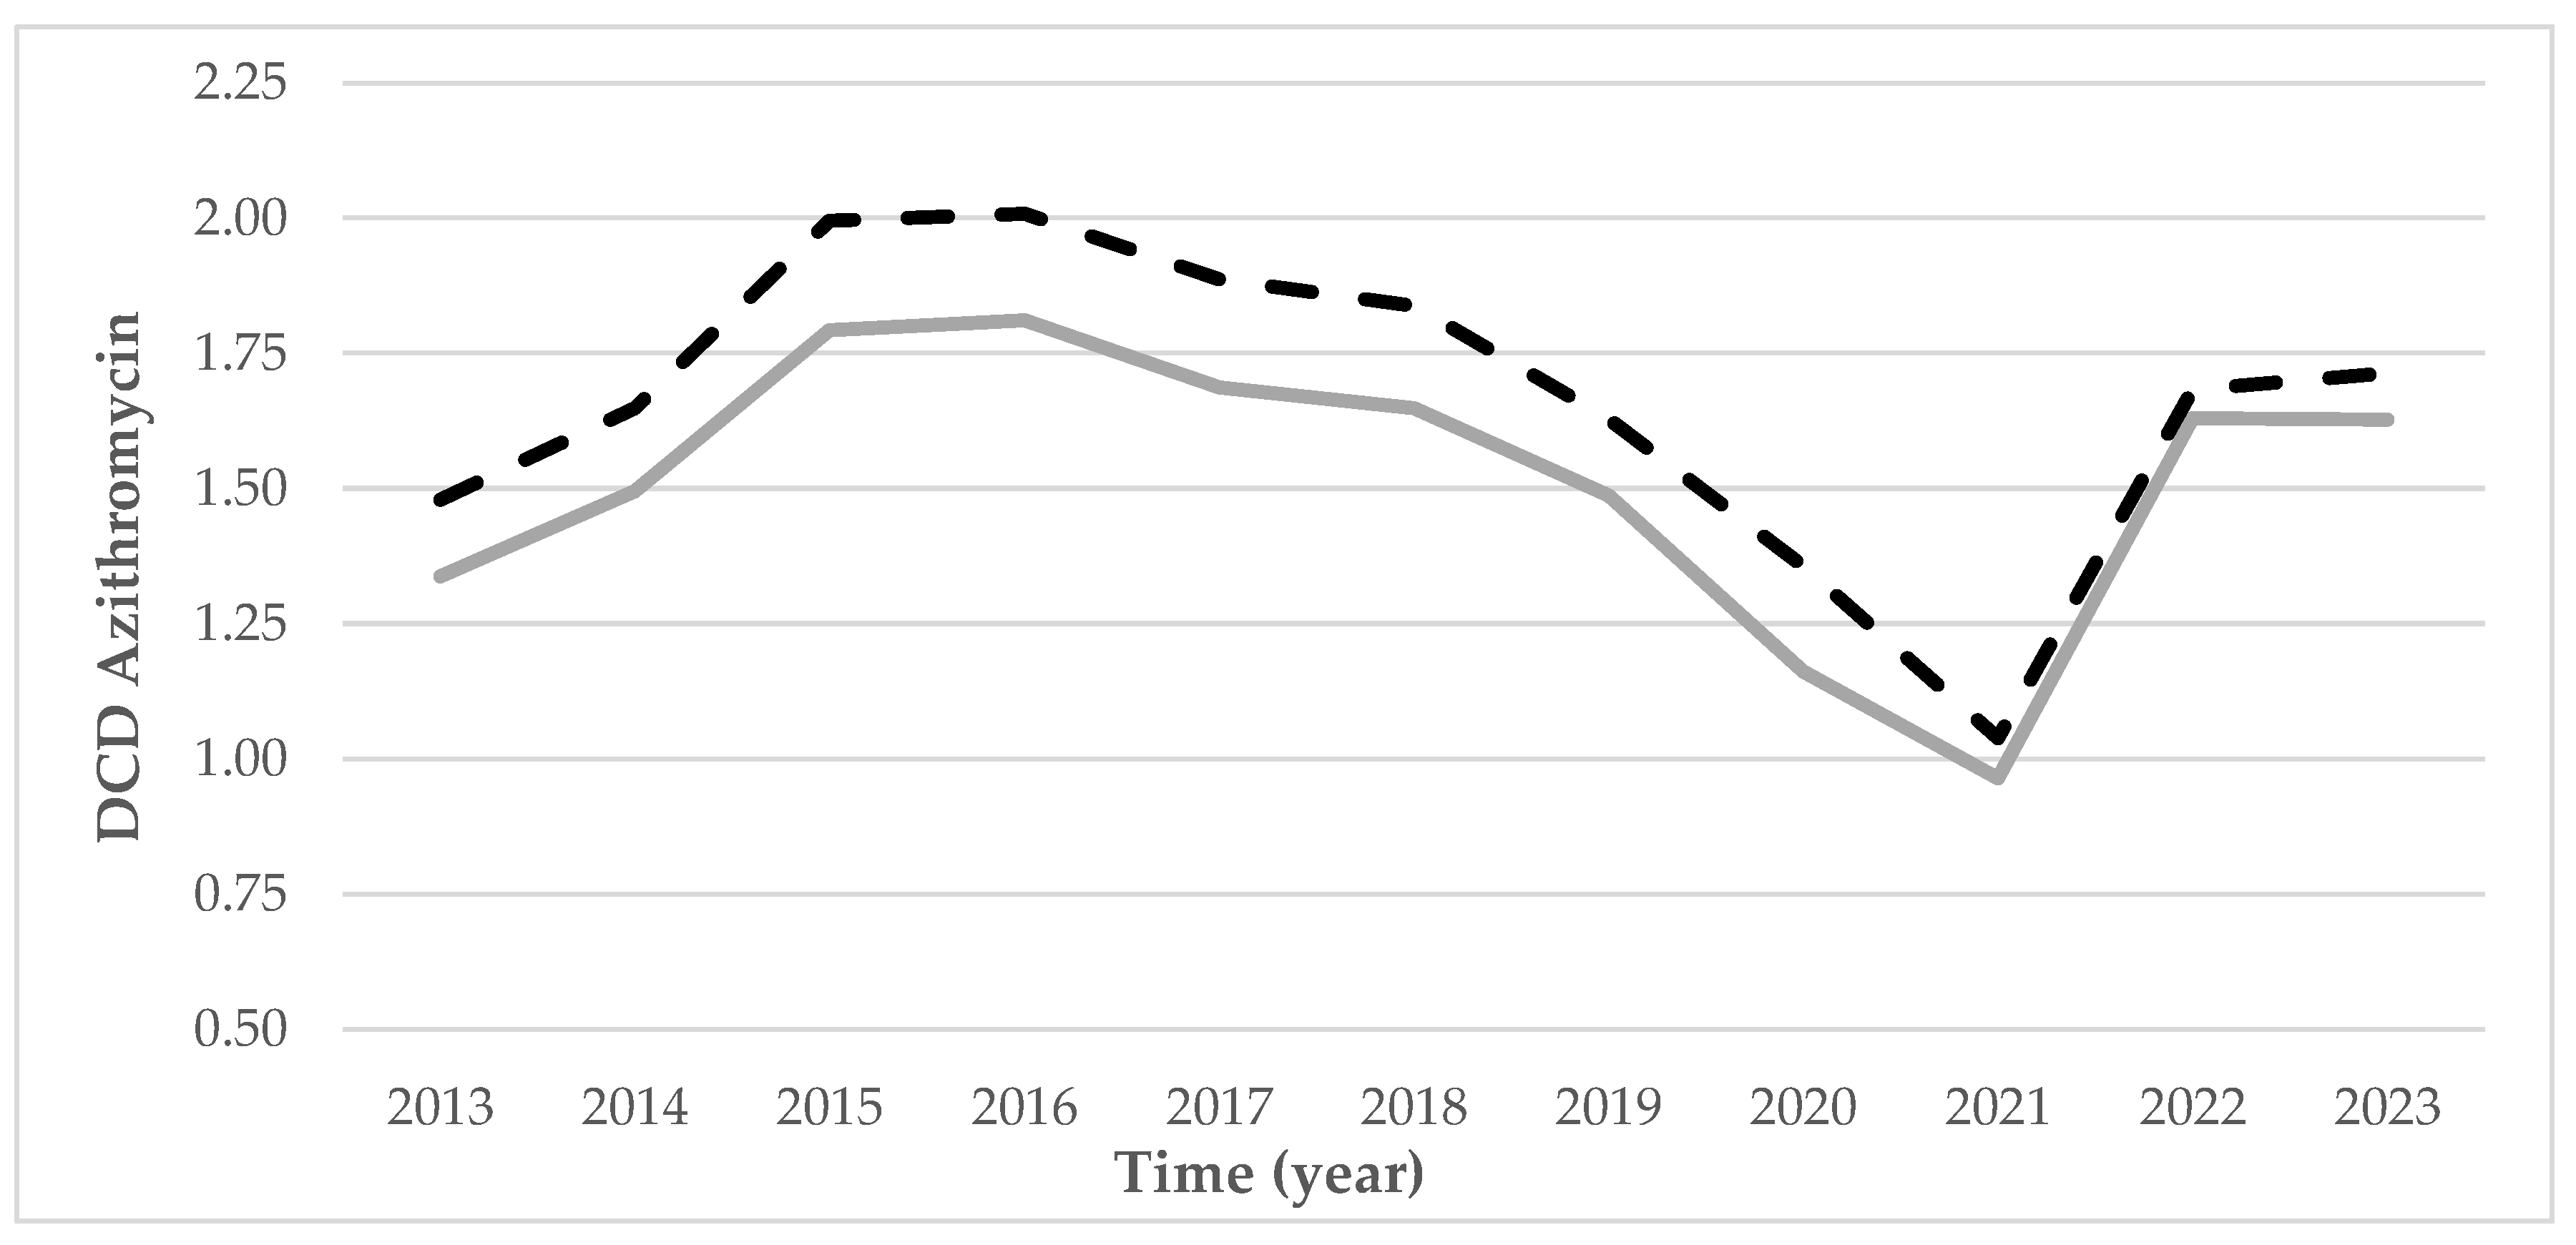
2.4. Prescription Rates of Azithromycin

The prescription rates of azithromycin (J01FA10) in Castile and Leon over the period 2013-2023 (Figure 4, Table 2) were very similar to subgroup J01F (Table 1), in which azithromycin is found, and to the J01 group (Figure 2). An increased number of prescriptions may be seen up until 2015, which then fell until 2021 and rose again over the last few years under study to equal the rates in 2018. The increase in the prescription of this antibiotic over the past few years was higher than in earlier cases, calculating a percentile difference in prescription rates for 2022 with respect to 2021 of 69.05% in rural and 62.06% in urban areas (data not shown).
The prescription of azithromycin throughout all of Castile and Leon was greater in urban areas, as it was also in the provinces of Burgos, Leon, Palencia, and Valladolid. Prescription rates were observably higher in rural areas within all the other provinces.

2.5. Qualitative Indicators (Choice of Antibiotic)

With regard to the analysis of the qualitative indicators, the percentages of both macrolides and fluoroquinolones presented different prescription rates.
In the case of the macrolides, their prescription rates throughout all of the autonomous region (Figure 5) increased up until 2016, presenting a percentile difference in 2016 with regard to 2015 of around 29%, both in rural and in urban areas (data not shown). As from 2016, they presented a slight fall up until 2021, after which they increased once again with a percentile difference between 2022 and 2021 of 21.47% in rural areas and 14.44% in urban areas (data not shown). In 2023, there was once again a fall in prescription rates.
In the province of Burgos (Figure 6), the prescription rates were unlike those of Castile and Leon as a whole. Within both rural and urban areas, the trends were basically rising throughout the period under study, with slight falls in some years, but always maintaining higher figures than those of the autonomous region of Castile and Leon, especially as from 2019. It is also worth highlighting that the percentage of macrolide prescriptions within rural areas of the province of Leon were higher than figures for all the other provinces up until 2019 when Burgos came to occupy first place.
The comparison between macrolide prescriptions within both rural and urban areas of each province (Figure 6) revealed that Avila and Leon were the only provinces in which prescriptions in rural areas were higher than in urban areas. The percentage prescription rates of macrolides were always higher in urban areas in both all the other provinces (Figure 6) and the autonomous region (Figure 5).
Prescriptions of fluoroquinolones in Castile and Leon (Figure 7) followed a very different pattern to prescriptions of macrolides (Figure 5). A rise was observable up until 2016 that presented a percentile difference with regard to 2015 of approximately 25%, in both rural and urban areas of Castile and Leon (data not shown). Subsequently, prescription rates slowly descended over the other years up until 2023. The trend was very similar in all the provinces of the autonomous region (Figure 8), with higher figures in the province of Leon (maximum of 16.09% in 2016 in rural areas) and slightly lower in the province of Soria (with minimums of 6.89% in 2023 in urban areas).
Comparing the percentage prescription rates of fluoroquinolones within rural and urban areas throughout the autonomous region (Figure 7) and in each province (Figure 8), it may be seen that fluoroquinolone prescriptions were higher in rural areas throughout all the provinces and all of Castile and Leon.

3. Discussion

This work involved a descriptive and observational analysis of antibiotic prescription rates at primary healthcare centers within the autonomous region of Castile and Leon between 2013 and 2023. The prescriptions of therapeutic group J01 were analyzed, together with its therapeutic subgroups and the active principle azithromycin throughout the autonomous region and within each province, comparing both rural and urban areas. As qualitative indicators (choice of antibiotic), temporal patterns and rural-urban comparisons between the percentage prescriptions of both macrolides and fluroquinolones were analyzed.
Overall prescription rates of antibiotics (J01) showed an increase during the first years of the study and fell as from 2015 in the autonomous region and in all the provinces. This reduction could be linked to the launch of the PRAN and its first strategic and action plan developed between 2014-2018 [16]. The fall continued up until 2020, a year in which prescription rates abruptly fell. A fall that could be linked to the COVID-19 pandemic and the isolation and protection measures that were taken over the years 2020 and 2021 [5,6,9,17]. The fall in prescription rates at a regional level, however, did not happen in the context of hospitals according to various authors [9,14,18]. As from 2021, an increase in prescriptions up to similar figures to those of 2019 was observed [5,9,19].
The differences between the provinces of the autonomous region in relation to the prescription of antimicrobials for systemic use are noteworthy (J01). The provinces of Segovia and Soria, whose populations are concentrated in rural zones more than in other provinces, presented higher prescription rates of DCD. On the contrary, the province of Avila, with the second highest percentage of its population rural areas, presented very similar J01 antibiotic prescription rates in both rural and urban areas. In sharp contrast, Burgos with its population more heavily concentrated in urban areas presented very similar prescription rates of DCD per day between rural and urban areas, and in some years even higher in rural areas. Likewise, prescription rates were higher in rural areas of the provinces of Salamanca and Zamora, whose populations are mainly urban, with a more pronounced difference in the case of Zamora. However, the prescription rates of DCD per day were higher in urban areas in the provinces of Leon, Palencia, and Valladolid, bearing no relation with the percentage of the population in those areas.
When comparing the data on J01 annual prescription rates within the different provinces and throughout all of Castile and Leon with the data on national prescription rates provided by the Spanish Agency of Medicines and Health Products in Spain [13], it may be seen that prescriptions at a national level were lower than prescriptions within the region and the provinces (Table 3). The temporal patterns of antibiotic prescriptions for both Spain and Castile and Leon were similar. An increase was recorded between 2014 and 2015, followed by a slow fall over the following years until reaching minimums with the onset of the pandemic and then another increase in prescription rates up until 2023. However, the variation at a national level was less striking, as maximums of 17.01 DCD per day were recorded in 2015 and minimums of 11.61 DCD per day in 2021. Nevertheless, the maximum was 25.36 DCD per day in the region of Castile and Leon, and the minimum was 13.04 DCD per day in 2021. Similar patterns were observed when comparing the data on prescriptions within Castile and Leon recorded by both Concylia and PRAN. The trends were similar but the variation was lower in those published by PRAN, because the maximum values were 19.99 DCD per day in 2015 and the minimums were 13.36 DCD in 2021.
Qualitative variables (choice of antibiotic) [20,21,22] were used to evaluate whether the appropriate antibiotic was prescribed. In this study, two indicators were analyzed, the percentage of macrolide and the percentage of fluoroquinolone prescriptions with regard to total prescriptions. Both indicators are related with broad-spectrum antibiotics, whose use is not part of the first line of attention in primary healthcare [20,21].
The percentage of macrolides (J01FA) included the active principles azithromycin, clarithromycin, erythromycin, spiramycin, and miocamycin [20,21,22,23]. Their use must be limited to treating allergies to Beta-lactam, respiratory infections due to atypical germs, and infection by B. pertussis. Due to the high levels of resistance of some microorganisms such as S. pneumoniae to this subgroup of antibiotics, their use must never be in the first line of primary healthcare [20,21]. With regard to their prescription, different prescription patterns were observed between the provinces. The percentage prescription rates were higher at an urban level in almost all the provinces of Castile and Leon, with the exception of Avila, which differed on one point with respect to urban prescription rates over the years of the study. Likewise, Leon had a more pronounced difference over all the years with very much more disparate prescription rates within rural areas. If the percentile differences between macrolide prescriptions at a regional level are compared, a difference is obtained that is constant at approximately one percentile point throughout the whole period under study; prescriptions being higher at an urban level.
The fluoroquinolone subgroup (J01MA) brings together the active principles ciprofloxacin, levofloxacin, moxifloxacin, norfloxacin, and ofloxacin [20,21,22,23]. They can be used to combat respiratory and urinary infections, due to their wide spectrum of action. However, they are not part of the first line of primary healthcare treatment, due to the high levels of resistance of some microorganisms, among which E. coli [20,21]. Their use is, in addition, associated with higher risks of infection by C. difficile [20,21]. With regard to their prescription, higher figures in the rural areas of all provinces of Castile and Leon were observed. At a regional level, the data on prescriptions were 2 percentile points higher in the rural health centres throughout the period under study.
The results of this study have, in a general way, shown slightly higher prescription rates of antibiotics for systemic use (J01) at rural health-care centers within most of the provinces of the autonomous region. Those conclusions are similar to the ones set out by other authors who have conducted research throughout Spain [6], in Avila [24] Segovia [25], Valladolid [26], and in Castile and Leon [8,27]. In the study of Álvarez and others on the consumption of antibiotics within Castile and Leon [8], it was found that the areas with older populations presented higher global prescription rates of antibiotics and of practically all the therapeutic subgroups. An observation that might explain the difference rates of prescription between the region of Castile and Leon and the data on prescriptions at a national level (Figure 2, Table 3), as the index of aging in Castile and Leon is very much higher than in Spain as a whole (Table 4) [7]. It is highlighted in many studies that the major consumers of antibiotics are children and people over 65 years old [8,9,25,26,28,29,30,31,32].
The highest consumption of macrolides in urban areas could also be related with greater use of the emergency services in those areas rather than in rural areas. That fact has no bearing on worse health in urban zones, but rather on excessive utilization of healthcare services in those zones [18,27,33], something which could also contribute to the development of bacterial resistance.
There is therefore great qualitative and quantitative variability in the use of antibiotics at primary healthcare centres within Castile and Leon, with an increase in the prescription of antibiotics for systemic use in rural rather than urban areas within most provinces. That same pattern is repeated in other autonomous regions of Spain [17,34].
Improving the use of antibiotics in the population is a complex task that requires multiple approaches. One of the most important objectives is the education of patients, in order to raise the people’s awareness of such an important problem. So, health campaigns designed to reach the general public are one key point, which in our opinion and in the opinions of other authors [8,25,26,28,29,30,31,32] should mainly focus on children and old people as the principal consumers of antibiotics. Other key points to progress in the fight against antibiotic resistances would be the creation of trusting relations between health professionals and patients, proper communication of information between them, and continuous training of health professionals [26,30,31,35].
Among health professionals, the role of the nurse becomes fundamental in the education of patients, as is reflected in the inclusion of the Organización General de Enfermería [General Organization of Nursing] in the PRAN [19,36]. Nursing professionals are better placed to approach both individual and group organization on the correct use of antibiotics, avoiding their overuse or improper use, and raising awareness of preventive measures against infections, such as for example washing hands. According to the results covered both in this study and in those of other authors [8,25,26,28,29,30,31,32], this sort of education should be prioritized in rural areas, as well as among children and older people, as those profiles are the highest consumers of antibiotics. It will all contribute to the fight against antibiotic resistance, leading to the achievement of the Agenda for Sustainable Development of the United Nations, with special emphasis on SDG 3 (Health and Wellbeing), SDG 4 (Quality Education), and SDG 10 (Reduction of Inequality). It will also facilitate the launch of a universal response to action aimed at ending poverty, protecting the planet, and improving the lives and perspectives of people throughout the world.

3.1. Limitations of the Study and Future Lines of Work

This study has some limitations that must be taken into account when analyzing and interpreting its conclusions. In the first place, the data on prescription rates of antibiotics provided by Concylia solely refer to primary healthcare centers within the various provinces of Castile and Leon. The data on prescriptions within hospitals, private healthcare and in any other area outside of the National Health System are excluded. On the other hand, as the data on prescriptions are taken from electronic prescriptions, it was not possible to determine whether the results are related to the real data on consumption, as correct therapeutic compliance could not be fully validated.
It must also be taken into account that the veracity of the data provided by Concylia is acceptable, although bias in the processing and grouping of the data may be assumed to exist. Also worth noting is that the provinces are divided into rural, semi-urban, and urban in the Concylia data; but in this work each BHZ was grouped into rural and urban, joining in one single group semi-urban and urban areas.
Another possible limitation is that the data analyzed in this study refer to the DDD per 1000 HCC per day. On the contrary, the PRAN data on consumption at a national level refers to DDD per 1000 inhabitants per day. It is assumed that the data are equivalent, because 100 per cent of the legally resident population in Spain is covered by the Spanish National Health System [37].
The source of the information has meant that the data on prescription rates were not linked to sociodemographic data, for which reason the data could not link the sex or the age of each patient with the antibiotic prescription. Likewise, no information was found on the disease treated with each antibiotic, for which reason the appropriateness of the prescription could not be determined.
Despite all those limitations, the results obtained in this study present an entry point for related research in the future. The idea of continuing to research the influence of sociodemographic variables on the consumption of antibiotics appears to be especially interesting. Further research could delve deeper into the study of the causes behind the differences recorded for prescription rates within rural and urban areas, and between the provinces, analyzing which variables might be the most influential. On the other hand, it has been suggested that strategies could be launched to reduce consumption among children and older people. In addition, it might be interesting to enlarge this study to the area of hospitals and private healthcare for a broader overview of the situation.

4. Materials and Methods

A retrospective observational study of antibiotic prescriptions dispensed to the population of Health-Care Card-Holders (HCC) within all the Basic Health Zones (BHZ) of all the provinces of Castile and Leon was conducted between 2013 and 2023. The data were obtained through the “Concylia Pharmacy Information System. Regional Health Care Management of Castile and Leon” in keeping with the “Protocol on the release of pharmaceutical dispensation data”. The data record the Defined Daily Doses (DDDs), a standard unit of measurement recommended by the WHO for studies on the administration of medicine, which is defined as the assumed average maintenance dose per day for a medicine that is principally indicated for adults and that has a specific route of administration [38].
The WHO Anatomic, Therapeutic, Chemical (ATC) Classification System was used to label the antibiotics [23]. Within this classification, the Antibacterials for systemic use come under group J01, which is divided into various subgroups of antibiotics: J01A Tetracyclines; J01B Amphenicols; J01C Beta-lactam anti-bacterials, Penicillins; J01D Other Beta-lactam antibacterials; J01E Sulfonamides and Trimethoprim; J01F Macrolides, Lincosamides and Streptogramins; J01G Antibacterial aminoglucosides; J01M Antibacterial quinolones; J01R Antibiotic combos; J01X Other antibacterials.
The “Antibiotic Prescription Indicators of the Health System of Castile and Leon (Sacyl)” were taken as a reference for dispensation indicators (Sacyl) [20]. Data on the Health Card posted on the Health Care transparency website by Sacyl [15] were used to determine both the rural and the urban HCC populations.
Antibiotic prescriptions in terms of DDDs per 1000 inhabitants per day was defined in this study as the DDDs per 1000 HCC per day (DCD). The same metric has been employed in at least one other study [39]. It is an adaptation of the DDDs per 1000 inhabitants per day, as the data on HCC solely correspond to public health centres, thereby excluding the area of private healthcare, whose users might not hold health-care cards. In addition, prescriptions of the active principle azithromycin were analyzed, because their use was recommended against infection by Covid-1 [40,41].
All the subgroups (J01A, J01C, J01D, J01E, J01F, J01G, J01M, J01R, and J01X) were used for the calculation of the DCD of the J01 group and the following formula was used for azithromycin:
D C D = n u m . D D D s 1000 n u m . H C C ( 1 ) d a y s ( 2 )
(1) The average number of HCC in each province (by rural and urban) was calculated over 2013-2023.
(2) The total was divided by 366 days for the calculations referring to the leap years. 91 days were used for the calculations referring to the first quarter of each leap year.
The data on average prescription rates together with the standard deviation of each subgroup throughout the period under study were calculated for each province and for all of Castile and Leon.
Qualitative variables (choice of antibiotic): these variables are useful to establish the appropriateness of the antibiotic prescriptions in relation to the clinical diagnosis and the situation of each patient [20,21]:
-
Percentage DDDs of macrolides (J01FA): the use of a macrolide must be linked to very concrete cases. It must not be used as a frontline antibiotic treatment in Primary Health Care [20,21]. The following formula was used for its calculation:
% D D D s   o f   m a c r o l i d e s = n u m . D D D s   o f   m a c r o l i d e s   ( J 01 F A ) 100 n u m . D D D s   o f   a l l   a n t i b i o t i c s   ( J 01 )
-
Percentage DDDs of fluoroquinolones (J01MA). Fluoroquinolones are used to treat respiratory and urinary infections, although they are not included in front line antibiotic treatment in Primary Health Care. In view of the failure of frontline antibiotics, their use must be reduced to very specific cases, due to the high levels of antibiotic resistance [20,21]. The following formula was used for its calculation:
% D D D s   o f   f l u o r o q u i n o l o n e s = n u m . D D D s   o f   f l u o r o q u i n o l o n e s   ( J 01 M A ) 100 n u m . D D D s   o f   a l l   a n t i b i o t i c s   ( J 01 )
As comparative variables, the time of the prescription (in yearly quarters for the group J01 and in years for the subgroups) and the type of Health Centre (a binary value: either rural or urban) were analyzed. The instructions in Decree 32/1988 of 18 February, which establishes the territorial boundaries of the BHZ within the Regional Community of Castile and Leon [42], subdivides them into semiurban and urban within the same (urban) group to facilitate data analysis.
The Microsoft® Excel® programme in Microsoft 365 MSO (version 2507) was used for all the calculations.
The Bioethics Committee of the University of Burgos issued a favorable report (IO 14/2004) for this project. The data on antibiotic prescriptions provided through Concylia were requested through its “Data Release Protocol”, which contains a “Confidentiality Commitment” and an undertaking to uphold Organic Law 3/2018, of 5 December, on the Protection of Personal Data and the guarantee of digital rights.

5. Conclusions

In this study, a comprehensive analysis of antibiotic prescription rates and therefore in all likelihood consumption of antibiotics within Castile and Leon has been presented over the period 2013-2023. It has shown that the general trend was similar to what was registered at a national level. An increase was observed in prescription rates up until 2015, with a fall as from that year until a minimum was reached in 2023, after which prescriptions once again climbed to similar figures to those of 2019.
It is also noteworthy that the consumption of antibiotics for systemic use (J01) and its subgroups in Primary Health Care centres within Castile and Leon varies both qualitatively and quantitatively in a notable way between the different provinces. And the qualitative indicators under analysis reflected that the percentage of macrolides was higher in urban areas whereas the percentage of fluoroquinolones was greater in the rural areas. However, prescriptions were higher in rural rather than urban areas in most provinces, even though they were higher in the urban areas of the Autonomous Region of Castile and Leon as a whole.

Author Contributions

Conceptualization R.S.M. and D.S.G.; methodology R.S.M. and D.S.G; investigation, R.S.M.; data curation, R.S.M. and D.S.G.; writing—original draft preparation, R.S.M., D.S.G., B.R.V, MA.M.M.; writing—review and editing, R.S.M., D.S.G., MJ.S.M.; ME.S.G., N.G.A., B.R.V and MA.M.M.;.; supervision, D.S.G., B.R.V and MA.M.M.; project administration, D.S.G. All authors have read and agreed to the published version of the manuscript.”

Funding

This research received no external funding.

Institutional Review Board Statement

The study was conducted in accordance with the Declaration of Helsinki, and approved by the Bioethics Committee of the University of Burgos (IO 14/2004).

Informed Consent Statement

Not applicable

Data Availability Statement

The data on antibiotic prescriptions provided through Concylia were requested through its “Data Release Protocol”, which contains a “Confidentiality Commitment” and an undertaking to uphold Organic Law 3/2018, of 5 December, on the Protection of Personal Data and the guarantee of digital rights.

Acknowledgments

We thank the staff in charge of Concylia of the Health Portal of Castilla y León for their help and willingness to provide us with the data.

Conflicts of Interest

The authors declare no conflicts of interest.

Abbreviations

The following abbreviations are used in this manuscript:
AMR Anti-Microbial Resistance
ATC Anatomic, Therapeutic, Chemical
BHC Basic Health Centres
DCD DDDs per 1000 HCC per day
DDDs Defined Daily Doses
HCC Health-Care Card
J01 Anti-microbials for systemic use
PRAN Plan Nacional frente a la Resistencia a los Antibióticos [National Plan to combat Antibiotic Resistance].
WHO World Health Organization

Note

1
DCD: DDDs per 1000 HCC per day.

References

  1. Werner, G.; Abu Sin, M. ‘Antimicrobial Resistance Is Invisible. I Am Not.’ Eurosurveillance 2024, 29. [Google Scholar] [CrossRef]
  2. Camacho Silvas LA Resistencia Bacteriana, Una Crisis Actual. Rev Esp Salud Publica 2023, 97, 1–10.
  3. Aslam, B.; Khurshid, M.; Arshad, M.I.; Muzammil, S.; Rasool, M.; Yasmeen, N.; Shah, T.; Chaudhry, T.H.; Rasool, M.H.; Shahid, A.; et al. Antibiotic Resistance: One Health One World Outlook. Front Cell Infect Microbiol 2021, 11. [Google Scholar] [CrossRef] [PubMed]
  4. Naghavi, M.; Vollset, S.E.; Ikuta, K.S.; Swetschinski, L.R.; Gray, A.P.; Wool, E.E.; Robles Aguilar, G.; Mestrovic, T.; Smith, G.; Han, C.; et al. Global Burden of Bacterial Antimicrobial Resistance 1990–2021: A Systematic Analysis with Forecasts to 2050. The Lancet 2024, 404, 1199–1226. [Google Scholar] [CrossRef]
  5. Agencia Española de Medicamentos y Productos Sanitarios Plan Estratégico 2022-2024 Del Plan Nacional Frente a La Resistencia a Los Antibióticos (PRAN); 2022.
  6. Sánchez-Herrero, H.; Solaz-García, Á.; Pinilla-González, A.; Martínez-Sánchez, E.V.; Santágueda-Balader, P.; Cernada-Badía, M. Características Epidemiológicas Del Uso de Antimicrobianos En Atención Primaria En España: Un Estudio a Nivel Nacional. Rev Esp Quimioter 2025, 38, 115–125. [Google Scholar] [CrossRef]
  7. Instituto Nacional de Estadística Índice de Envejecimiento. INE . Available online: https://ine.es/jaxiT3/Tabla.htm?t=1418 (accessed on 14 July 2025).
  8. Álvarez, M.; Eiros, J.M.; Pastor, E.; Sierra, E. Consumo de Antibióticos de Uso Sistémico En La Comunidad de Castilla y León. Medicina de Familia. SEMERGEN 2011, 37, 534–539. [Google Scholar] [CrossRef]
  9. Marcilla Vázquez, C.; Ríos Laorden, J.; Lloret Callejo, Á.; Tejada Cifuentes, F.; Tirado Peláez, M.J.; Párraga-Martínez, I. Evolución de Prescripción Antibiótica En Atención Primaria Según Indicadores Del PRAN (Plan Nacional Frente a La Resistencia a Los Antibióticos). An Pediatr (Engl Ed) 2025, 102, 503840. [Google Scholar] [CrossRef]
  10. Ministerio de Sanidad Consumo y Bienestar Social Plan Nacional Frente a Las Resistencias Antibióticos (PRAN). Programas de Optimización de Uso de Antibióticos (PROA); 2017;
  11. Llor, C. Uso Prudente de Antibióticos y Propuestas de Mejora Desde La Atención Primaria. Enferm Infecc Microbiol Clin 2010, 28, 17–22. [Google Scholar] [CrossRef]
  12. Fernández-Urrusuno, R.; Flores-Dorado, M.; Vilches-Arenas, A.; Serrano-Martino, C.; Corral-Baena, S.; Montero-Balosa, M.C. Adecuación de La Prescripción de Antibióticos En Un Área de Atención Primaria: Estudio Descriptivo Transversal. Enferm Infecc Microbiol Clin 2014, 32, 285–292. [Google Scholar] [CrossRef]
  13. Agencia Española de Medicamentos y Productos Sanitarios Consumos Antibióticos Sector Comunitario Por Comunidades Autónomas | PRAN. Available online: https://www.resistenciaantibioticos.es/es/lineas-de-accion/vigilancia/mapas-de-consumo/consumo-antibioticos-humana/consumos-antibioticos-extrahospitalarios-por-comunidades (accessed on 24 July 2025).
  14. Gonzalez-Zorn, B. Antibiotic Use in the COVID-19 Crisis in Spain. Clinical Microbiology and Infection 2021, 27, 646–647. [Google Scholar] [CrossRef]
  15. Base de datos de usuarios y tarjeta sanitaria de Sacyl Población de Tarjeta Sanitaria. Available online: https://www.saludcastillayleon.es/transparencia/es/transparencia/sanidad-cifras/informes-estadisticos/ordenacion-alfabetica/poblacion-tarjeta-sanitaria (accessed on 16 July 2025).
  16. Agencia Española de Medicamentos y Productos Sanitarios (AEMPS) Plan Estratégico y de Acción Para Reducir El Riesgo de Selección y Diseminación de La Resistencia a Los Antibióticos; 2014.
  17. Nicieza García, M.L.; Pérez Solís, P.; Gómez de Oña, C.; Suárez Gil, P.; Rolle Sóñora, V.; Suárez Mier, B. Consumo de Antibióticos En Atención Primaria En Población Adulta de Asturias Durante El Periodo 2014-2020. Aten Primaria 2022, 54, 102261. [Google Scholar] [CrossRef]
  18. Díaz, A.; Ochoa, C.; Brezmes, M.F.; López-Urrutia, L.; Rivas, N. Correlación Entre La Prescripción de Antibióticos y El Descenso de Las Resistencias a Antimicrobianos En El Área de Salud de Zamora. Enferm Infecc Microbiol Clin 2009, 27, 153–159. [Google Scholar] [CrossRef]
  19. Agencia Española de Medicamentos y Productos Sanitarios Plan Nacional Frente a La Resistencia a Los Antibióticos (PRAN) 2025-2027. Available online: https://resistenciaantibioticos.es/es/publicaciones/plan-nacional-frente-la-resistencia-los-antibioticos-pran-2025-2027 (accessed on 15 July 2025).
  20. Dirección Técnica de Asistencia Farmacéutica Gerencia Regional de Salud Indicadores de Prescripción de Antibióticos; 2018.
  21. Rosa Albañil, J.C.J.M. a C.R.F.U.C. de la F.A.G.I.G.J.M.I.R.M. Indicadores de Uso de Antibióticos En Atención Primaria, 2017. [Google Scholar]
  22. García Ortiz, A. Prescripción de Antibióticos En Atención Primaria. Available online: https://www.saludcastillayleon.es/portalmedicamento/en/terapeutica/ojo-markov/prescripcion-antibioticos-atencion-primaria (accessed on 16 July 2025).
  23. World Heath Organization Anatomical Therapeutic Chemical (ATC) Classification Available online:. Available online: https://www.who.int/tools/atc-ddd-toolkit/atc-classification (accessed on 11 August 2025).
  24. Ripoll Lozano, M.Á.; Jiménez Arce, J.I.; Pedraza Dueñas, A. Variabilidad En La Prescripción de Antibióticos En La Provincia de Ávila. Revista Española de Quimioterapia 2007, 20, 44–50. [Google Scholar]
  25. Miguélez Ferreiro, S.; Moreno Sánchez, E.; Gutiérrez de Antonio, M.; Hernando Real, S. Antibiotic Prescribing and Changes in Antimicrobial Resistances in the Health Area of Segovia (Spain) during the Period between 2007 and 2011. Revista Española de Quimioterapia, ISSN-e 0214-3429, Vol. 27, No. 1, 2014 2014, 27, 28–35. [Google Scholar]
  26. García, E.P.; Eiros Bouza, J.M.; Mayo Iscar, A. Análisis de La Variabilidad Geográfica Del Consumo de Antibióticos de Uso Sistémico En La Provincia de Valladolid. Medicina General 2002, 45, 473–480. [Google Scholar]
  27. Vázquez Fernández, M.E.; Bachiller Luque, M.R.; Vázquez Fernández, M.J.; Pastor García, E.; Eiros Bouza, J.M. Variability in Antibiotic Prescription in the Pediatric Population of Castile and Leon (Spain) from 2001 to 2005 in Relation to Urban or Rural Setting. An Pediatr (Engl Ed) 2007, 67, 139–144. [Google Scholar] [CrossRef]
  28. Calle-Miguel, L.; Riaño, G.M.; Carbajo, A.I.I.; Álvarez, M.A.A.; Martínez, C.V.; Sánchez, G.S. Variabilidad Entre Áreas Sanitarias En El Consumo Extrahospitalario de Antibióticos de Uso Sistémico En La Población Pediátrica Del Principado de Asturias, España (2005-2018). Revista Española de Quimioterapia 2021, 34, 107. [Google Scholar] [CrossRef]
  29. Catalina Serna, M.; Ribes, E.; Real, J.; Galván, L.; Gascó, E.; Godoy, P. Alta Exposición a Antibióticos En La Población y Sus Diferencias Por Género y Edad. Aten Primaria 2011, 43, 236–244. [Google Scholar] [CrossRef] [PubMed]
  30. Malo, S.; José Rabanaque, M.; Feja, C.; Jesús Lallana, M.; Aguilar, I.; Bjerrum, L. High Antibiotic Consumption: A Characterization of Heavy Users in Spain. Basic Clin Pharmacol Toxicol 2014, 115, 231–236. [Google Scholar] [CrossRef] [PubMed]
  31. Serna, M.C.; Real, J.; Ribes, E.; Marsal, J.R.; Godoy, P.; Galván, L. Factors Determining Antibiotic Prescription in Primary Care. Enferm Infecc Microbiol Clin 2011, 29, 193–200. [Google Scholar] [CrossRef]
  32. Lallana-Alvarez, M.J.; Feja-Solana, C.; Armesto-Gómez, J.; Bjerrum, L.; Rabanaque-Hernández, M.J. Outpatient Antibiotic Prescription in Aragón and the Differences by Gender and Age. Enferm Infecc Microbiol Clin 2012, 30, 591–596. [Google Scholar] [CrossRef] [PubMed]
  33. Sarría-Santamera, A.; Prado-Galbarro, J.; Ramallo-Farina, Y.; Quintana-Díaz, M.; Martínez-Virto, A.; Serrano-Aguilar, P. Utilización de Los Servicios de Urgencias En Zonas Rurales y Urbanas. Medicina de Familia. SEMERGEN 2015, 41, 63–69. [Google Scholar] [CrossRef]
  34. Calle-Miguel, L.; Iglesias Carbajo, A.I.; Modroño Riaño, G.; Pérez Méndez, C.; García García, E.; Rodríguez Nebreda, S.; Solís Sánchez, G. Evolution of Antibiotic Consumption in Pediatric Outpatients of Asturias, Spain (2005–2018). An Pediatr (Engl Ed) 2021, 95, 438–447. [Google Scholar] [CrossRef]
  35. Vazquez-Cancela, O.; Souto-Lopez, L.; Vazquez-Lago, J.M.; Lopez, A.; Figueiras, A. Factors Determining Antibiotic Use in the General Population: A Qualitative Study in Spain. PLoS One 2021, 16, e0246506. [Google Scholar] [CrossRef]
  36. Nova, I.P. Enfermería Se Incorpora al Plan Nacional de Resistencia a Antibióticos. Redacción Médica, 2020. [Google Scholar]
  37. Ministerio de Sanidad, S.S. e I. Los Sistemas Sanitarios En Los Países de La Unión Europea. Características e Indicadores de Salud 2019; 2019. [Google Scholar]
  38. WHO Collaborating Centre for Drug Statistics Methodology ATC Classification Index with DDDs: Structure and Principles. Available online: https://www.whocc.no/atc/ structure_and_principles/ (accessed on 12 August 2025).
  39. Marcilla Vázquez, C.; Ríos Laorden, J.; Lloret Callejo, Á.; Tejada Cifuentes, F.; Tirado Peláez, M.J.; Párraga-Martínez, I. Evolución de Prescripción Antibiótica En Atención Primaria Según Indicadores Del PRAN (Plan Nacional Frente a La Resistencia a Los Antibióticos). An Pediatr (Engl Ed) 2025, 102, 503840. [Google Scholar] [CrossRef]
  40. García Lobato, E.; Caro-Patón Carmona, T. Evidencia Disponible de Los Fármacos Utilizados En Pacientes Con COVID-19 (II): Hidroxicloroquina y Azitromicina Available online:. Available online: https://www.saludcastillayleon.es/portalmedicamento/es/terapeutica/ojo-markov/evidencia-disponible-farmacos-utilizados-pacientes-c-15a028 (accessed on 15 July 2025).
  41. Echeverría-Esnal, D.; Martin-Ontiyuelo, C.; Navarrete-Rouco, M.E.; De-Antonio Cuscó, M.; Ferrández, O.; Horcajada, J.P.; Grau, S. Azithromycin in the Treatment of COVID-19: A Review. Expert Rev Anti Infect Ther 2021, 19, 147–163. [Google Scholar] [CrossRef]
  42. Consejeria de Cultura y Bienestar Social Decreto 32/1988 de 18 de febrero, por el que se establece la delimitación territorial de las Zonas básicas de salud en el territorio de la Comunidad Autónoma de Castilla y León; España, 1988;
Figure 1. Population distribution by sex, age and rural or urban BHC of all HCC within the provinces of Castile and Leon. Authors’ own work based on [15]. BHC: Basic Health Centre; HCC: Health-Care Card-holder.
Preprints 175964 g001
Figure 2. Quarterly prescription rates of anti-microbials for systemic use (J01) (DCD: DDDs per 1000 HCC per day) at both urban (black dashed line) and rural (grey continuous line) primary healthcare centres within Castile and Leon between 2018 and 2023. Annual prescriptions within Spain according to the PRAN presented as DDD per 1000 inhabitants per day are shown as a reference benchmark (squares with crosses), data on which are only available for 2014 to 2022. DDDs: Defined Daily Doses; HCC: Health-care Card-holders. PRAN: Plan Nacional frente a la Resistencia a los Antibióticos [National Plan to combat Antibiotic Resistance].
Preprints 175964 g002
Figure 3. Graphs showing quarterly J01 antibiotic prescription rates (anti-microbials for systemic use) at both urban (black dashed line) and rural (grey continuous line) primary healthcare centers within the province of Castile and Leon (DCD: DDDs per 1000 HCC per day) between 2013 and 2023. DDDs: Daily Defined Doses; HCC: Health-Care Card-Holder.
Preprints 175964 g003
Figure 4. Prescription rates of azithromycin through the primary healthcare centers of Castile and Leon (DDD per 1000 HCC per day) by urban (black dashed line) and rural (grey continuous line) areas between 2013 and 2023. DCD: DDDs per 1000 HCC per day; DDDS: Defined Daily Doses; HCC: Health-care Card-holders.
Preprints 175964 g004
Figure 5. Percentage prescription rates of macrolides (DCD: DDDs per 1000 HCC per day) at the primary healthcare centers within Castile and Leon by urban (black dashed line) and rural (grey continuous line) areas between 2013 and 2023. DDDs: Defined Daily Doses; HCC: Health-care Card-holders.
Preprints 175964 g005
Figure 6. Percentage prescription rates of macrolides (DCD: DDD per 1000 HCC per day) at the primary healthcare centers of each province of Castile and Leon by urban (black dashed line) and rural (grey continuous line) areas between 2013 and 2023.
Preprints 175964 g006
Figure 7. Percentage prescription rates of fluoroquinolones (DCD: DDDs per 1000 HCC per day) at the primary healthcare centers within Castile and Leon by urban (grey dashed line) and rural (black continuous line) areas between 2013 and 2023.
Preprints 175964 g007
Figure 8. Comparisons of percentage prescription rates of fluoroquinolones (DDD per 1000 HCC per day) at primary healthcare centers within each province of Castile and Leon, by urban (grey dashed line) and rural (black continuous line) areas between 2013 and 2023.
Preprints 175964 g008
Table 1. Average prescription rates of medicine by therapeutic subgroup at the primary healthcare centers of Castile and Leon, by province and by rural and urban areas over the period of study (2013-2023). The data are shown as averages (± standard deviation). % DIF R-U: Percentile rural-urban difference = (rural dispensations-urban dispensations / urban dispensations) ∗ 100.
J01A J01C J01D J01E J01F J01G J01M J01X
AVILA R 0.71 (±0.07) 12.60 (±4.10) 2.07 (±0.27) 0.61 (±0.07) 2.05 (±0.38) 0.017 (±0.003) 2.91 (±0.78) 0,49 (±0,05)
U 0.95 (±0.09) 12.80 (±4.10) 1.86 (±0.31) 0.51 (±0.04) 1.91 (±0.40) 0.014 (±0.008) 2.06 (±0.53) 0,48 (±0,02)
% DIF R-U -25,76 -1.57 11.10 20.26 7.17 28.13 41.03 3.42
BURGOS R 0.53(±0.05) 11.84 (±3.80) 2.24 (±0.31) 0.40 (±0.09) 2.55 (±0.32) 0.004 (±0.003) 2.41 (±0.63) 0,59 (±0,06)
U 0.73(±0.05) 11.21 (±3.60) 2.08 (±0.24) 0.36 (±0.06) 2.67 (±0.28) 0.002 (±0.001) 1.78 (±0.45) 0,53 (±0,03)
% DIF R-U -27,24 5.57 7.52 11.69 -4.56 82.15 35.00 12.81
LEON R 0.58 (±0.02) 8.72 (±2.84) 1.80 (±0.32) 0.46 (±0.04) 2.50 (±0.58) 0.004 (±0.003) 2.34 (±0.41) 0,45 (±0,33)
U 0.79 (±0.06) 12.40 (±3.86) 2.47 (±0.49) 0.52 (±0.06) 3.05 (±0.68) 0.004 (±0.002) 2.65 (±0.51) 0,62 (±0,05)
% DIF R-U -38,95 -29.59 -26.90 -10.50 -18.18 -9.52 -12.04 -26.57
PALENCIA R 0.68 (±0.06) 12.11 (±4.48) 1.49 (±0.32) 0.33 (±0.03) 1.86 (±0.32) 0.003 (±0.001) 1.95 (±0.44) 0,54 (±0,06)
U 0.85 (±0.07) 14.31 (±5.10) 1.77 (±0.33) 0.40 (±0.06) 2.53 (±0.37) 0.005 (±0.002) 2.09 (±0.42) 0,64 (±0,07)
% DIF R-U -19,29 -15.39 -15.64 -16.93 -26.29 -36.29 -6.51 -16.09
SALAMANCA R 0.48 (±0.05) 10.73 (±3.38) 2.47 (±0.46) 0.51 (±0.10) 2.39 (±0.44) 0.007 (±0.001) 2.40 (±0.56) 0,52 (±0,09)
U 0.59 (±0.07) 9.73 (±2.92) 2.27 (±0.33) 0.61 (±0.09) 2.26 (±0.41) 0.006 (±0.002) 1.81 (±0.47) 0,59 (±0,06)
% DIF R-U -17,94 10.25 9.14 -15.75 6.06 18.59 32.46 -11.76
SEGOVIA R 0.77 (±0.05) 10.95 (±3.15) 1.90 (±0.16) 0.34 (±0.06) 1.57 (±0.26) 0.004 (±0.002) 1.94 (±0.45) 0,42 (±0,05)
U 0.78 (±0.10) 8.90 (±2.49) 1.56 (±0.12) 0.28 (±0.06) 1.42 (±0.22) 0.002 (±0.002) 1.39 (±0.34) 0,36 (±0,03)
% DIF R-U -1,03 23.04 21.69 21.92 10.97 94.96 39.81 15.53
SORIA R 0.62 (±0.06) 13.24 (±4.07) 4.14 (±0.48) 0.40 (±0.08) 2.62 (±0.35) 0.018 (±0.004) 2.14 (±0.51) 0,72 (±0,03)
U 0.69 (±0.05) 8.87 (±2.66) 3.14 (±0.53) 0.36 (±0.07) 1.88 (±0.30) 0.015 (±0.003) 1.54 (±0.44) 0,55 (±0,05)
% DIF R-U -10,22 49.24 31.94 11.50 39.60 21.34 39.05 31.06
VALLADOLID R 0.49 (±0.08) 7.06 (±2.26) 1.05 (±0.19) 0.26 (±0.04) 1.41 (±0.29) 0.003 (±0.001) 1.44 (±0.36) 0,36 (±0,05)
U 1.02 (±0.08) 9.73 (±2.96) 1.59 (±0.29) 0.41 (±0.06) 2.21 (±0.49) 0.003 (±0.001) 1.87 (±0.49) 0,52 (±0,05)
% DIF R-U -52,08 -27.40 -33.94 -37.76 -36.40 11.27 -23.28 -30.61
ZAMORA R 0.70 (±0.07) 14.86 (±5.72) 3.31 (±0.43) 0.70 (±0.17) 2.67 (±0.49) 0.008 (±0.004) 3.24 (±0.94) 0,59 (±0,05)
U 0.74 (±0.07) 10.81 (±3.92) 2.18 (±0.23) 0.47 (±0.07) 2.28 (±0.42) 0.010 (±0.007) 2.01 (±0.59) 0,48 (±0,02)
% DIF R-U -5,81 37.46 51.68 47.10 16.85 -22.28 61.13 22.60
CASTILE & LEON R 0.57 (±0.03) 10.41 (±3.40) 2.02 (±0.26) 0.43 (±0.05) 2.14 (±0.37) 0.006 (±0.001) 2.22 (±0.51) 0,49 (±0,04)
U 0.81 (±0.05) 10.90 (±3.44) 2.04 (±0.28) 0.45 (±0.06) 2.41 (±0.40) 0.005 (±0.002) 1.98 (±0.48) 0,54 (±0,03)
% DIF R-U -29,87 -4.45 -0.96 -4.23 -11.24 27.69 11.99 -9.99
Table 2. Average prescription rates of azithromycin through the primary healthcare centers of the provinces of Castile and Leon and throughout the autonomous region over the period 2013 and 2023. (DCD: DDDs per 1000 HCC per day). The data are shown as average values (± standard deviation). % DIF R-U: Percentile rural-urban difference = (rural dispensations−urban dispensations / urban dispensations) ∗ 100. DDDs: Defined Daily Doses HCC: Health-care Card-holders.
DCD RURAL DCD URBAN % DIF R-U
ÁVILA 1.419 (± 0.295) 1.194 (± 0.280) 18.768
BURGOS 1.934 (± 0.263) 1.961 (±0.251) -1.371
LEÓN 1.942 (± 0.425) 2.354 (± 0.499) -17.502
PALENCIA 1.149 (± 0.239) 1.432 (± 0.268) -19.782
SALAMANCA 1.757 (± 0.342) 1.508 (± 0.294) 16.485
SEGOVIA 0.879 (± 0.176) 0.714 (± 0.141) 23.135
SORIA 1.801 (± 0.275) 1.235 (± 0.222) 45.823
VALLADOLID 0.909 (± 0.181) 1.439 (± 0.320) -36.823
ZAMORA 1.830 (± 0.334) 1.618 (± 0.359) 13.040
CASTILE & LEON 1.513 (± 0.264) 1.661 (±0.289) -8.937
Table 3. Comparison of annual prescriptions of J01 (antimicrobials for systemic use) at primary healthcare centres within each province of Castile and Leon (DCD: DDD per 1000 HCC per day), and in the autonomous region and the data published by PRAN for Castile and Leon and Spain (DDD per 1000 inhabitants per day). AV: Avila; BU: Burgos; LE: Leon; PA: Palencia; SA: Salamanca; SE: Segovia; SO: Soria; VA: Valladolid; ZA: Zamora; C&L: Castile and Leon; ES: Spain; PRAN: Plan Nacional frente a la Resistencia a los Antibióticos (National Plan for combating Antibiotic Resistance); n.a.: not available.
Year AV BU LE PA SA SE SO VA ZA CYL C&L PRAN ES
2013 26.28 23.43 23.91 26.73 21.68 19.09 24.87 18.55 27.31 22.66
2014 28.24 25.47 25.12 28.16 23.11 20.50 25.60 19.80 29.00 24.13 18.94 16.42
2015 29.31 26.13 27.18 29.43 24.38 21.72 26.49 20.80 30.23 25.36 19.99 17.01
2016 22.53 20.39 21.14 21.85 19.00 16.58 21.10 16.57 23.16 19.71 19.86 16.54
2017 21.16 19.60 19.60 20.80 18.17 16.22 20.62 15.89 21.86 18.75 19.18 16.10
2018 20.63 19.90 19.21 20.44 18.12 16.35 21.62 15.75 20.80 18.59 19.11 15.91
2019 18.53 18.30 18.88 18.75 17.28 15.36 20.05 14.54 19.58 17.45 18.08 15.31
2020 14.27 14.32 14.27 13.87 13.47 12.18 15.31 11.13 14.40 13.36 13.80 11.68
2021 14.18 13.71 13.86 14.02 13.45 12.03 13.89 10.88 13.82 13.04 13.36 11.61
2022 17.60 17.11 17.69 17.34 16.84 14.55 18.08 13.61 17.84 16.39 16.70 14.17
2023 19.24 18.24 19.07 18.70 17.90 15.94 19.13 14.71 19.21 17.62 n.a. 15.26
Table 4. Comparison of aging index1 in Spain and in Castile and Leon over the period 2013 and 2023 [7].
2013 2014 2015 2016 2017 2018 2019 2020 2021 2022 2023
Spain 109,89 112,63 114,69 116,33 118,36 120,56 123 125,82 129,16 133,64 137,33
Castile & Leon 179,36 182,94 185,38 188 191,2 194,49 198,29 202,26 205,66 212,89 217,18
1. Aging index: percentage of the population over 65 years old in relation to the population under 16 years of age on January 1 of any one year.
Disclaimer/Publisher’s Note: The statements, opinions and data contained in all publications are solely those of the individual author(s) and contributor(s) and not of MDPI and/or the editor(s). MDPI and/or the editor(s) disclaim responsibility for any injury to people or property resulting from any ideas, methods, instructions or products referred to in the content.
Copyright: This open access article is published under a Creative Commons CC BY 4.0 license, which permit the free download, distribution, and reuse, provided that the author and preprint are cited in any reuse.
Prerpints.org logo

Preprints.org is a free preprint server supported by MDPI in Basel, Switzerland.

Subscribe

Disclaimer

Terms of Use

Privacy Policy

Privacy Settings

© 2025 MDPI (Basel, Switzerland) unless otherwise stated