
Submitted:
02 September 2025
Posted:
09 September 2025
You are already at the latest version
Preprints on COVID-19 and SARS-CoV-2
Abstract
Characterizing the transition of a pandemic to an endemic phase is a complex undertaking, defined by profound shifts in viral transmissibility and population-level immunity. The effective reproduction number (Rt) serves as an indispensable metric for monitoring this process. This study presents a detailed retrospective analysis of the COVID-19 reproduction number in Iran across 2022 and 2023, a critical period dominated by the Omicron variant and its sublineages. Our objective is to quantitatively delineate the transmission dynamics that accompanied the conclusion of the pandemic’s emergency phase within the region. Drawing upon daily smoothed case data from the Our World in Data repository for the period of January 1, 2022, to December 31, 2023, we employed a multi-method framework to estimate Rt, encompassing Exponential Growth (EG), Maximum Likelihood (ML), Sequential Bayesian (SB), and Time-Dependent (TD) models. A literature-derived gamma distribution was utilized to model the generation time for the Omicron variant. This primary analysis was fortified by a sensitivity analysis of the generation time, a comparative assessment of R during distinct Omicron subvariant waves, and a regional comparison with neighboring countries. Our findings reveal that despite a marked reduction in disease severity, the reproduction number in Iran consistently remained above the critical threshold of 1.0 throughout the 2022–2023 period, with estimates from all four methods converging in the range of 1.27 to 1.47. Although transient periods of control (Rt<1) were observed, rolling averages never sustained a sub-unity level, indicating persistent community transmission. Variant-specific analysis elucidated a high R-value for Omicron BA.1 (1.35), which slightly attenuated for BA.4/BA.5 (1.32). Regional analysis further substantiated that while Iran achieved momentary control early in 2022, this state was not maintained.
Keywords:
COVID-19
; reproduction number
; Rt
; Iran
; endemic transition
; Omicron
; epidemiological modeling
; retrospective analysis
colorlinks=true, linkcolor=blue, filecolor=magenta, urlcolor=cyan,
1. Introduction
The emergence of SARS-CoV-2 in late 2019 heralded a global public health crisis of historic proportions, leading to the COVID-19 pandemic. In response, nations worldwide implemented extensive non-pharmaceutical interventions (NPIs) while the scientific community spurred the most accelerated vaccine development effort in history [1,2]. Iran, being one of the first countries outside of East Asia to report a major outbreak, was compelled to navigate successive waves of infection, each driven by a new Variant of Concern—from the ancestral strain through Alpha, Delta, and ultimately, Omicron [3,4].
Building on prior research in Iran that furnished valuable insights into the transmissibility of earlier variants, this study extends that analytical work into the Omicron era. A notable precedent is the work of Sheikhi et al., which, by employing a multi-method approach, established that the Delta variant was considerably more transmissible than Alpha, highlighting the pivotal role of viral evolution in shaping the pandemic’s trajectory [5]. Our investigation proceeds from this understanding into a period defined by a profoundly different set of immunological and virological parameters.
Central to modern epidemiology is the reproduction number, a metric for quantifying viral transmissibility. Whereas the basic reproduction number, , defines a pathogen’s potential in a naive population, it is the time-varying effective reproduction number, , that offers the more pertinent metric during an ongoing pandemic [6,7]. This value dynamically incorporates real-world conditions such as population immunity and public health interventions [8]. An value sustained above 1 signifies epidemic expansion; conversely, a value below this threshold indicates that an epidemic is contracting [9].
Marking a pivotal moment in the pandemic, the Omicron variant (B.1.1.529) achieved global dominance in early 2022. Its unique combination of characteristics—heightened transmissibility and significant immune evasion, counterbalanced by a lower intrinsic severity than Delta—fundamentally reconfigured the relationship between case incidence and severe clinical outcomes [10,11]. This shift necessitated a global strategic reassessment, initiating a transition from an emergency response posture to a long-term management phase, often termed endemicity [12].
Now that the pandemic’s acute phase has concluded, retrospective analyses are essential to quantitatively grasp the dynamics of this transition. This study provides a comprehensive analysis of the effective reproduction number in Iran across 2022 and 2023. Our primary aim is to characterize the transmission dynamics during this Omicron-dominated period to address a central question: Did Iran’s transition to endemicity align with a sustained control of transmission (), or did it instead signify a societal adaptation to persistent, high-level viral circulation?
To address this question robustly, our inquiry is structured around four analytical pillars: (1) a multi-method estimation of to ensure our findings are not model-dependent artifacts; (2) a sensitivity analysis to validate key parameter selections; (3) a variant-specific analysis to dissect the relative transmissibility of Omicron sublineages; and (4) a regional comparison to situate Iran’s experience within its geographical context. Ultimately, this work seeks to contribute a vital, data-driven historical account of the pandemic’s endgame, offering durable lessons for managing COVID-19 and preparing for future public health challenges.
2. Related Works
The estimation of the reproduction number formed a central pillar of the global scientific response to the COVID-19 pandemic, delivering critical, real-time insights for policymakers.
2.1. Global Efforts in Estimating
From the initial outbreak in Wuhan, researchers mobilized to quantify the transmissibility of SARS-CoV-2, establishing the first estimates of that provided the world with a baseline for the virus’s pandemic potential [13,14]. As the virus disseminated globally, these analytical efforts were mirrored in Europe [15], the United States [16,17], and a multitude of other regions, effectively creating a global map of epidemic dynamics [18,19,20]. These studies consistently demonstrated the utility of as an indispensable tool for monitoring epidemic trajectories and gauging the efficacy of public health measures.
2.2. Impact of Viral Evolution on Transmissibility
A formidable challenge throughout the pandemic was the continual emergence of new Variants of Concern. A consistent body of research demonstrated that each major variant possessed distinct transmissibility characteristics. Studies indicated that the Alpha variant was more transmissible than the ancestral strain [21], and the Delta variant was, in turn, substantially more transmissible than Alpha [5,22]. The Omicron variant constituted another step-change; its enhanced immune evasion and intrinsic transmissibility fueled unprecedented waves of infection globally, even within highly vaccinated populations [10,23]. Consequently, tracking was essential for quantifying the real-time impact of this ongoing viral evolution.
2.3. Evaluating the Impact of Interventions
The effective reproduction number proved to be an invaluable metric for appraising the impact of public health interventions. Seminal modeling studies leveraged shifts in to estimate the effect of large-scale NPIs, such as lockdowns, thereby demonstrating their substantial role in curtailing transmission [2,15]. Other lines of inquiry focused on the impact of specific measures like mask mandates [24] and mass vaccination campaigns, revealing a clear correlation between vaccine uptake and reductions in both and the overall disease burden [3,17].
3. Data and Methods
3.1. Data Source and Analysis Period
The data for this study were sourced from the Our World in Data (OWID) COVID-19 repository, a globally recognized database that aggregates statistics from official national sources [25]. We utilized the dataset’s new_cases_smoothed variable as the primary input for our incidence time-series to mitigate artifacts arising from reporting delays. The core analysis period was defined as January 1, 2022, to December 31, 2023. This timeframe fully encapsulates the era of Omicron’s dominance and the subsequent transitional phase, as depicted in Figure 1. For the regional comparative analysis, data were also extracted for neighboring countries where available: Iraq, Turkey, Armenia, Azerbaijan, Afghanistan, and Pakistan.
3.2. Reproduction Number () Estimation
The accurate estimation of is fundamental to our research objective. To ensure the robustness of our findings and mitigate biases inherent in any single methodological approach, we adopted a multi-method framework. This strategy involved applying four distinct and widely accepted models, all of which depend on two key inputs: (1) the daily time-series of incident cases and (2) an estimate of the generation time (GT) distribution.
3.2.1. Generation Time Distribution
The generation time (GT)—defined as the interval between the onset of symptoms in an infector and an infectee—constitutes a critical parameter for the precise estimation of [26]. To avoid the circularity of deriving the GT from the incidence curve itself, we adopted a literature-based approach. Informed by numerous studies on the Omicron variant, we modeled the GT using a gamma distribution [27], which is well-suited for modeling such waiting periods. It was parameterized with a mean of 3.0 days and a standard deviation of 1.5 days, reflecting the shorter incubation period and accelerated transmission characteristic of Omicron relative to earlier variants.
3.2.2. Estimation Models
To bolster the validity of our conclusions, was estimated using four distinct methodological approaches. The convergence of results from models with differing underlying assumptions lends greater confidence to the final findings.
- Exponential Growth (EG): This method posits that during the early phase of an outbreak, the number of new cases, , increases exponentially () [28]. By fitting a log-linear model to estimate the growth rate r, one can derive R via the Lotka-Euler equation. For a gamma-distributed GT, this relationship is expressed as , where k and represent the shape and scale parameters, respectively.
- Maximum Likelihood (ML): This statistical approach seeks to identify the single most probable value of R that could have produced the observed case series [28]. It assumes that new cases follow a Poisson distribution, the mean of which is determined by R and the cumulative infectiousness of previously infected individuals. The ML estimate, , is the value that maximizes the log-likelihood function for the entire series, rendering it robust against daily reporting noise.
- Sequential Bayesian (SB): This method conceptualizes R estimation as a problem of sequential learning [28]. It initiates with a prior probability distribution for R and iteratively updates this belief using Bayes’ theorem as each new day of data becomes available. This process yields a running, updated estimate of transmissibility. We report the mean of the final posterior distribution.
- Time-Dependent (TD): In contrast to methods that compute a single R value for an entire period, the TD method estimates an instantaneous for individuals infected at time t [28,29]. It quantifies the expected number of secondary infections generated by a person infected at time t. We report the mean of the resulting time-series as the overall period estimate.
3.3. Supplementary Analyses
To provide additional depth, three supplementary analyses were conducted.
- Sensitivity Analysis: To gauge our model’s dependence on the selected GT, the ML-based was re-estimated using both a "shorter" (mean=2.5 days) and a "longer" (mean=3.5 days) GT.
- Variant-Specific Analysis: To probe the impact of viral evolution, we calculated the average ML-based during periods when specific Omicron subvariants (BA.1 and BA.4/BA.5) were predominant.
- Regional Comparison: For broader context, we analyzed the pre-calculated reproduction_rate variable within the OWID dataset for Iran and its neighbors. We identified the first date in 2022 on which each nation achieved a transient period of (defined as 7 consecutive days) and compared this with their respective vaccination coverage.
3.4. Computational Tools and Implementation
All data processing and statistical analyses were performed using the R programming language (version 4.1.2), principally leveraging the R0 and tidyverse packages. All visualizations were generated with ggplot2.
3.5. Data Limitations
It is crucial to acknowledge that this analysis relies upon officially reported case counts. Fluctuations in testing policies, the increasing prevalence of at-home testing, and the underreporting of mild cases can collectively lead to an underestimation of the true disease incidence. Consequently, the calculated should be interpreted as a reliable indicator of the transmission trend rather than an exact measure of its absolute magnitude.
4. Results
Our analysis of the COVID-19 epidemic in Iran throughout 2022–2023 yielded several key findings concerning the persistence of transmission during the shift to endemicity.
4.1. Overall Reproduction Number in Iran
Perhaps our most central finding is that the effective reproduction number in Iran remained consistently above the epidemic threshold of 1.0 for the entire two-year study period. Table 1 presents the average estimates derived from our four distinct models. A strong convergence among the models is evident, with all methods producing an average between 1.27 and 1.47. The narrow 95% confidence intervals associated with the EG and ML methods further underscore the high precision of these estimations. While our examination of rolling R-values revealed brief dips below the threshold, at no point did the 7-day average sustain a value below 1.0 for any meaningful duration, furnishing strong evidence of persistent, uncontained community transmission.
4.2. Sensitivity and Variant-Specific Analysis
The robustness of our central finding is corroborated by the sensitivity analysis. As demonstrated in Table 2, varying the mean generation time between 2.5 and 3.5 days yielded ML-based estimates that ranged from 1.29 to 1.43. Although the choice of GT influences the precise value, the estimate consistently remains significantly above 1.0.
The variant-specific analysis provides insights into the drivers of this sustained transmission. The initial Omicron BA.1 wave in early 2022 displayed the highest transmissibility observed in our analysis, with an average of 1.35. The subsequent BA.4/BA.5 wave exhibited a slightly lower of 1.31, a comparison visualized in Figure 2. It is noteworthy that our attempts to derive a reliable for inter-wave periods (e.g., the BA.2 wave) were unsuccessful due to data inconsistencies. This is likely attributable to low and fluctuating case counts during these intervals, which can destabilize estimation models—a finding that itself highlights the challenges of surveillance during periods of low transmission.
4.3. Regional Comparison
Situating these findings in a broader context, our regional analysis sheds light on Iran’s epidemiological landscape relative to its neighbors. A straightforward analysis of the raw daily reproduction_rate data from OWID revealed that Iran was the first country in its region to experience a transient period of in 2022, starting on January 1st (Table 3). At that juncture, its full vaccination rate stood at 58%. In the subsequent weeks, most neighboring countries achieved a similar temporary dip, a trend that often correlated with their vaccination progress (Figure 3). For instance, Turkey, with 60% vaccination coverage, saw its first dip on February 11th, whereas Afghanistan, with only 10% coverage, did not achieve this until February 16th. It is important to stress that these transient dips stand in contrast to our principal finding that sustained, period-long control was not achieved.
5. Discussion
This retrospective analysis offers a nuanced, data-driven narrative of the final phase of the COVID-19 emergency in Iran. Our findings challenge any simplistic notion that the transition to endemicity would be characterized by the successful suppression of viral transmission.
5.1. The Persistence of Transmission: Interpreting a Sustained
Perhaps our most significant finding is the persistence of an effective reproduction number substantially and consistently above 1.0 throughout 2022 and 2023. This indicates that even with high levels of population immunity accrued from both vaccination and repeated natural infections, SARS-CoV-2 retained the capacity for efficient, epidemic-level growth. This observation yields a crucial insight: the conclusion of the "emergency" phase in Iran was more a societal and political declaration, predicated on the decoupling of case numbers from severe outcomes [11], than an epidemiological one grounded in transmission control. It appears that COVID-19 in Iran settled into an endemic state of high, persistent transmission, aligning with a definition of endemicity that implies a stable, predictable pattern rather than necessarily a low level of disease [30].
5.2. The Role of Viral Evolution and Population Immunity
The variant-specific analysis provides a compelling narrative for these dynamics. The Omicron BA.1 wave established a remarkably high baseline of transmissibility (), confirming its reputation as a highly infectious variant [10]. It is noteworthy that a slightly lower was observed during the later BA.4/BA.5 wave (1.31). While this could be attributable to minor differences in the variants’ intrinsic properties, it more likely reflects the maturing immune landscape of the Iranian population. By mid-2022, a greater proportion of individuals had likely acquired hybrid immunity (from both vaccination and infection), a factor that probably blunted the effective transmission rate even when faced with a new subvariant [4].
5.3. Regional Context and the Nuances of Control
The regional comparison underscores the complexity of defining "control." While our robust, period-long calculations for Iran indicate a persistent average , the raw daily OWID data reveal that all countries in the region experienced temporary intervals where dipped below unity. This apparent discrepancy is important; the daily value is highly sensitive to short-term artifacts like reporting lags, whereas our multi-method analysis uncovers the underlying, persistent trend of insufficient control. Nonetheless, the regional data still suggest a correlation between higher vaccination coverage (e.g., Iran, Turkey) and an earlier achievement of even transient control, reinforcing the continued importance of vaccination [3].
5.4. Limitations and Future Directions
This study is necessarily constrained by the limitations of its underlying data. A reliance on officially reported cases means our analysis almost certainly underestimates the true scale of infection, particularly as public testing waned. Future research could construct a more complete picture by integrating heterogeneous data streams, such as hospital admission data or wastewater surveillance, which may offer a more stable signal of viral activity in the post-emergency era [31]. Furthermore, developing compartmental models that formally incorporate parameters for waning immunity and the impact of booster doses could provide an even more granular understanding of transmission dynamics [32].
6. Conclusions
The transition of COVID-19 from a pandemic emergency to an endemic disease in Iran was not, as our analysis shows, defined by the suppression of SARS-CoV-2. On the contrary, it becomes clear that the virus maintained a capacity for robust, epidemic-level growth, with its effective reproduction number consistently remaining above the critical threshold of 1.0 throughout 2022 and 2023. The end of the emergency phase thus represented an adaptation to a new reality: a highly transmissible pathogen circulating within a population that, due to widespread immunity, experienced markedly less severe outcomes. This study provides a vital quantitative record of this pivotal transition, offering a critical lesson for public health: endemicity is not synonymous with benignancy or the cessation of transmission. It demands a permanent strategic shift toward long-term surveillance, the mitigation of severe disease, and robust preparedness for the inevitable, ongoing evolution of the virus.
Author Contributions
Conceptualization, D.M.A. and P.Z.; methodology, D.M.A.; software, D.M.A.; validation, D.M.A. and P.Z.; formal analysis, D.M.A.; investigation, D.M.A.; resources, P.Z.; data curation, D.M.A.; writing—original draft preparation, D.M.A.; writing—review and editing, P.Z.; visualization, D.M.A.; supervision, P.Z.; project administration, P.Z. All authors have read and agreed to the published version of the manuscript.
Funding
This research received no external funding.
Institutional Review Board Statement
Not applicable for this study.
Informed Consent Statement
Not applicable for this study.
Data Availability Statement
All data used in this study are publicly available from the Our World in Data (OWID) COVID-19 data repository, accessible at https://github.com/owid/covid-19-data/tree/master/public/data.
Acknowledgments
The authors would like to sincerely thank Dr. Farnaz Sheikhi for her valuable suggestions, constructive feedback, and guidance throughout this research journey. Her expertise and support have been instrumental in shaping this work.
Conflicts of Interest
The authors declare no conflict of interest.
References
- Ferguson, N.M.; Laydon, D.; Nedjati-Gilani, G.; Imai, N.; Ainslie, K.; Baguelin, M.; van Elsland, S.; Hoze, E.; Thompson, H.; Walters, C.; et al. Report 9: Impact of non-pharmaceutical interventions (NPIs) to reduce COVID-19 mortality and healthcare demand 2020.
- Ferguson, N.M.; Laydon, D.; Nedjati-Gilani, G.; Imai, N.; Ainslie, K.; Baguelin, M.; van Elsland, S.; Hoze, E.; Thompson, H.; Walters, C.; et al. Report 9: Impact of non-pharmaceutical interventions (NPIs) to reduce COVID-19 mortality and healthcare demand 2020.
- Sheikhi, F.; Zohari, P.; Aleagha, D.M. A Comparative Analysis of COVID-19 Transmissibility for Alpha and Delta Variants in Iran. medRxiv 2022. [Google Scholar] [CrossRef]
- Callaway, E. Heavily mutated Omicron variant puts scientists on alert. Nature 2021, 600, 21. [Google Scholar] [CrossRef]
- Sheikhi, F.; Zohari, P.; Aleagha, D.M. A Comparative Analysis of COVID-19 Transmissibility for Alpha and Delta Variants in Iran. medRxiv 2022. [Google Scholar] [CrossRef]
- Anderson, R.M.; Heesterbeek, H.; Klinkenberg, D.; Hollingsworth, T.D. How will country-based mitigation measures influence the course of the COVID-19 epidemic? The Lancet 2020, 395, 931–934. [Google Scholar] [CrossRef]
- Anderson, R.M.; Heesterbeek, H.; Klinkenberg, D.; Hollingsworth, T.D. How will country-based mitigation measures influence the course of the COVID-19 epidemic? The Lancet 2020, 395, 931–934. [Google Scholar] [CrossRef]
- Cori, A.; Ferguson, N.M.; Fraser, C.; Cauchemez, S. A new framework and software to estimate time-varying reproduction numbers during epidemics. American Journal of Epidemiology 2013, 178, 1505–1512. [Google Scholar] [CrossRef]
- Fraser, C.; Donnelly, C.A.; Cauchemez, S.; Hanage, W.P.; Van Kerkhove, M.D.; Hollingsworth, T.D.; Griffin, J.; Baggaley, R.F.; Jenkins, H.E.; Lyons, E.J.; et al. Pandemic Potential of a Novel Strain of Influenza A (H1N1): Early Findings. Science 2009, 324, 1557–1561. [Google Scholar] [CrossRef] [PubMed]
- Viana, R.; Moyo, S.; Amoako, D.G.; Tegally, H.; Scheepers, C.; Althaus, C.L.; Anyaneji, U.J.; Bester, P.A.; Boni, M.F.; Chand, M.; et al. Rapid epidemic expansion of the SARS-CoV-2 Omicron variant in southern Africa. Nature 2022, 603, 679–686. [Google Scholar] [CrossRef]
- UK Health Security Agency. SARS-CoV-2 variants of concern and variants under investigation in England: Technical briefing 33. Technical Report 33, UK Health Security Agency, London, UK, 2021.
- Lavine, J.S.; Bjornstad, O.N.; Antia, R. Immunological characteristics govern the transition of COVID-19 to endemicity. Science 2021, 371, 741–745. [Google Scholar] [CrossRef]
- Li, Q.; Guan, X.; Wu, P.; Wang, X.; Zhou, L.; Tong, Y.; Ren, R.; Leung, K.S.; Lau, E.H.; Wong, J.Y.; et al. Early transmission dynamics in Wuhan, China, of novel coronavirus–infected pneumonia. New England Journal of Medicine 2020. [Google Scholar] [CrossRef] [PubMed]
- Zhang, S.; Diao, M.; Yu, W.; Pei, L.; Lin, Z.; Chen, D. Estimation of the reproductive number of novel coronavirus (COVID-19) and the probable outbreak size on the Diamond Princess cruise ship: A data-driven analysis. International Journal of Infectious Diseases 2020, 93, 201–204. [Google Scholar] [CrossRef]
- Flaxman, S.; Mishra, S.; Gandy, A.; Unwin, H.J.T.; Mellan, T.A.; Coupland, H.; Whittaker, C.; Zhu, H.; Berah, T.; Eaton, J.B.; et al. Estimating the effects of non-pharmaceutical interventions on COVID-19 in Europe. Nature 2020, 584, 257–261. [Google Scholar] [CrossRef]
- Kissler, S.M.; Tedijanto, C.; Goldstein, E.; Grad, Y.H.; Lipsitch, M. Projecting the transmission dynamics of SARS-CoV-2 through the postpandemic period. Science 2020, 368, 860–868. [Google Scholar] [CrossRef]
- Kissler, S.M.; Tedijanto, C.; Goldstein, E.; Grad, Y.H.; Lipsitch, M. Projecting the transmission dynamics of SARS-CoV-2 through the postpandemic period. Science 2020, 368, 860–868. [Google Scholar] [CrossRef]
- Sinha, P.; Kumar, G.; Singh, N.; Ghosal, A. Estimation of reproduction number for COVID-19 in India. arXiv preprint arXiv:2004.05152, arXiv:2004.05152 2020.
- de Mello-Neto, J.M.; de Castro, C.P.; Mello, C.S.; Reis, I.G.; Paixão, E.S.; de Castro, M.C. Reproduction number of COVID-19 in Brazil’s Center-West region: The role of interstate and international travel. The American Journal of Tropical Medicine and Hygiene 2021, 104, 522. [Google Scholar]
- Tsinda, A.; Mutesa, L.; Rujeni, N.; Rutayisire, E.; Ndishimye, P.; Musanabaganwa, C.; Gisa, S.; Nyamwasa, D.; Umuringa, Y.; Butera, Y.; et al. Estimation of the effective reproduction number of SARS-CoV-2 in Rwanda. BMC Infectious Diseases 2021, 21, 1–8. [Google Scholar]
- Davies, N.G.; Abbott, S.; Barnard, R.C.; Jarvis, C.I.; Kucharski, A.J.; Munday, J.D.; Pearson, C.A.; Russell, T.W.; Tully, D.C.; Washburne, A.D.; et al. Estimated transmissibility and impact of SARS-CoV-2 lineage B. 1.1. 7 in England. Science 2021, 372, eabg3055. [Google Scholar] [CrossRef] [PubMed]
- Liu, Y.; Rocklöv, J. The effective reproductive number of the COVID-19 Delta variant. Pathogens 2022, 11, 229. [Google Scholar]
- Pouwels, K.B.; Pritchard, E.; Matthews, P.C.; Stoesser, N.; Eyre, D.W.; Vihta, K.D.; House, T.; Hay, J.; Bell, I.; Newton, J.N.; et al. Effect of vaccination on transmission of SARS-CoV-2. New England Journal of Medicine 2022, 385, 1718–1720. [Google Scholar]
- Chu, D.K.; Akl, E.A.; Duda, S.; Solo, K.; Yaacoub, S.; Schünemann, H.J.; El-Harakeh, A.; Bognanni, A.; Lotfi, T.; Loeb, M.; et al. Physical distancing, face masks, and eye protection to prevent person-to-person transmission of SARS-CoV-2 and COVID-19: a systematic review and meta-analysis. The Lancet 2020, 395, 1973–1987. [Google Scholar] [CrossRef] [PubMed]
- Mathieu, E.; Ritchie, H.; Ortiz-Ospina, E.; Roser, M.; Hasell, J.; Appel, C.; Giattino, C.; Rodés-Guirao, L. A global database of COVID-19 vaccinations. Nature Human Behaviour 2021, 5, 947–953. [Google Scholar] [CrossRef]
- Svensson, Å. A note on generation times in epidemic models. Mathematical Biosciences 2007, 208, 300–311. [Google Scholar] [CrossRef]
- Song, J.S.; Lee, J.Y.; Kim, M.; Lee, J. Serial interval and transmission dynamics during the SARS-CoV-2 Omicron variant epidemic in South Korea. Journal of Korean Medical Science 2022, 37. [Google Scholar]
- Obadia, T.; Hane, F.; Boëlle, P.Y. The R0 package: a toolbox to estimate reproduction numbers for epidemic outbreaks. BMC Medical Informatics and Decision Making 2012, 12, 1–8. [Google Scholar] [CrossRef] [PubMed]
- Wallinga, J.; Lipsitch, M. How generation intervals shape the relationship between growth rates and reproductive numbers. Proceedings of the Royal Society B: Biological Sciences 2007, 274, 599–604. [Google Scholar] [CrossRef] [PubMed]
- The Seasonality of Respiratory Viral Infections; Academic Press, 2022. Tellier, R. (Ed.).
- Medema, G.; Heijnen, L.; Elsinga, G.; Italiaander, R.; Brouwer, A. Presence of SARS-Coronavirus-2 in sewage. medRxiv 2020. [Google Scholar] [CrossRef]
- Prem, K.; Liu, Y.; Russell, T.W.; Kucharski, A.J.; Eggo, R.M.; Davies, N.; Flasche, S.; Clifford, S.; Pearson, C.A.; Munday, J.D.; et al. The effect of control strategies to reduce social mixing on outcomes of the COVID-19 epidemic in Wuhan, China: a modelling study. The Lancet Public Health 2020, 5, e261–e270. [Google Scholar] [CrossRef]
Figure 1.
COVID-19 Daily Cases in Iran (2022-2023). The 7-day smoothed average of new daily cases illustrates the multiple waves of infection during the Omicron-dominated era.
Figure 1.
COVID-19 Daily Cases in Iran (2022-2023). The 7-day smoothed average of new daily cases illustrates the multiple waves of infection during the Omicron-dominated era.
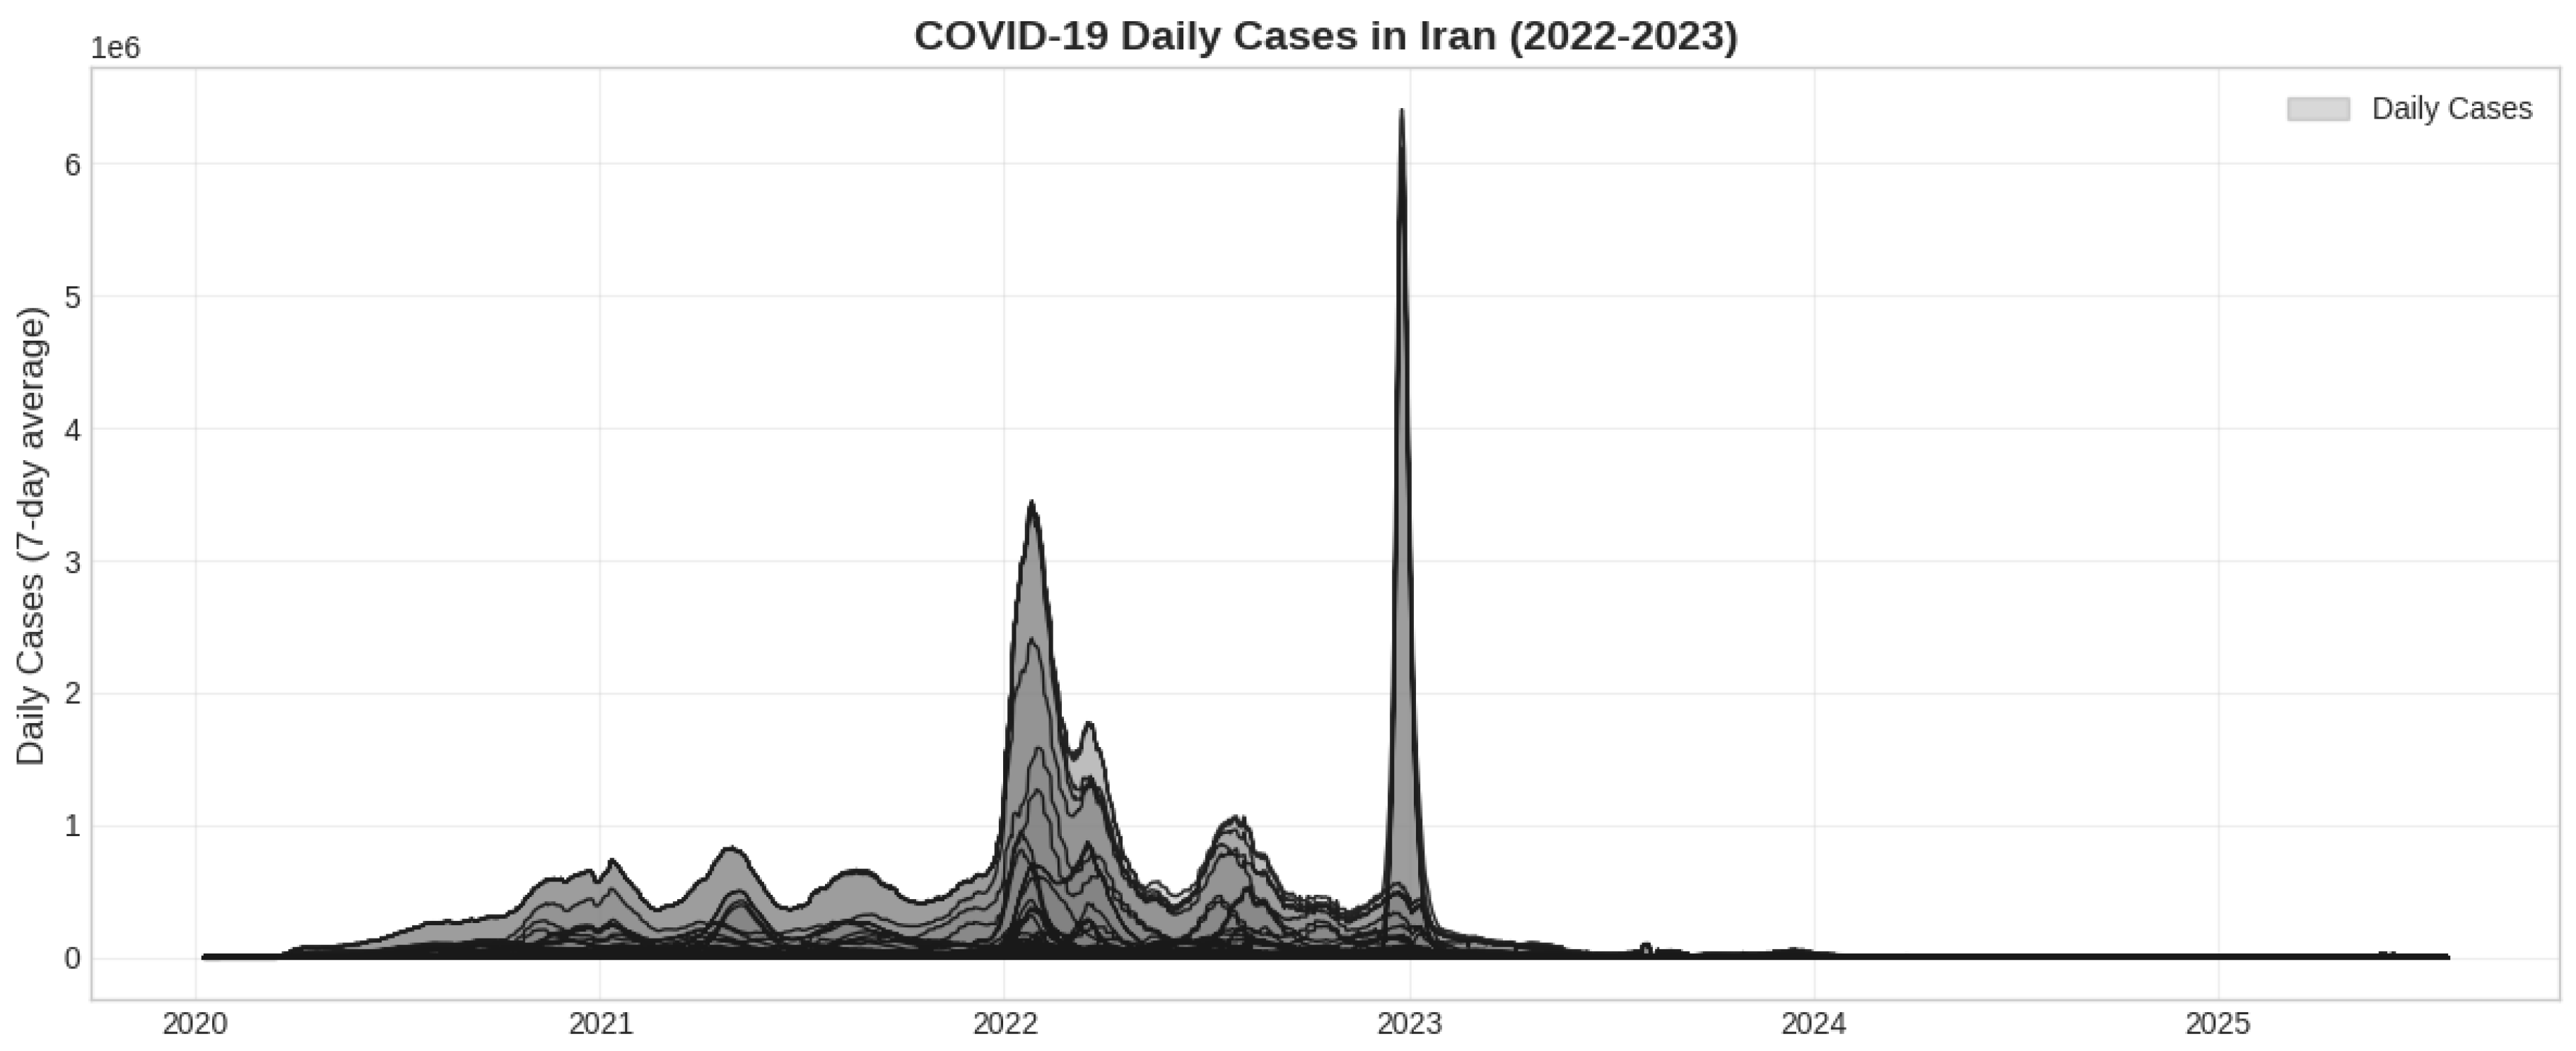
Figure 2.
Variant-Specific Transmissibility of Omicron Subvariants. Comparison of the estimated effective reproduction number () using the Maximum Likelihood method for the BA.1 and BA.4/BA.5 waves in Iran. Both variants show transmissibility well above the epidemic threshold of 1.0 (red dashed line).
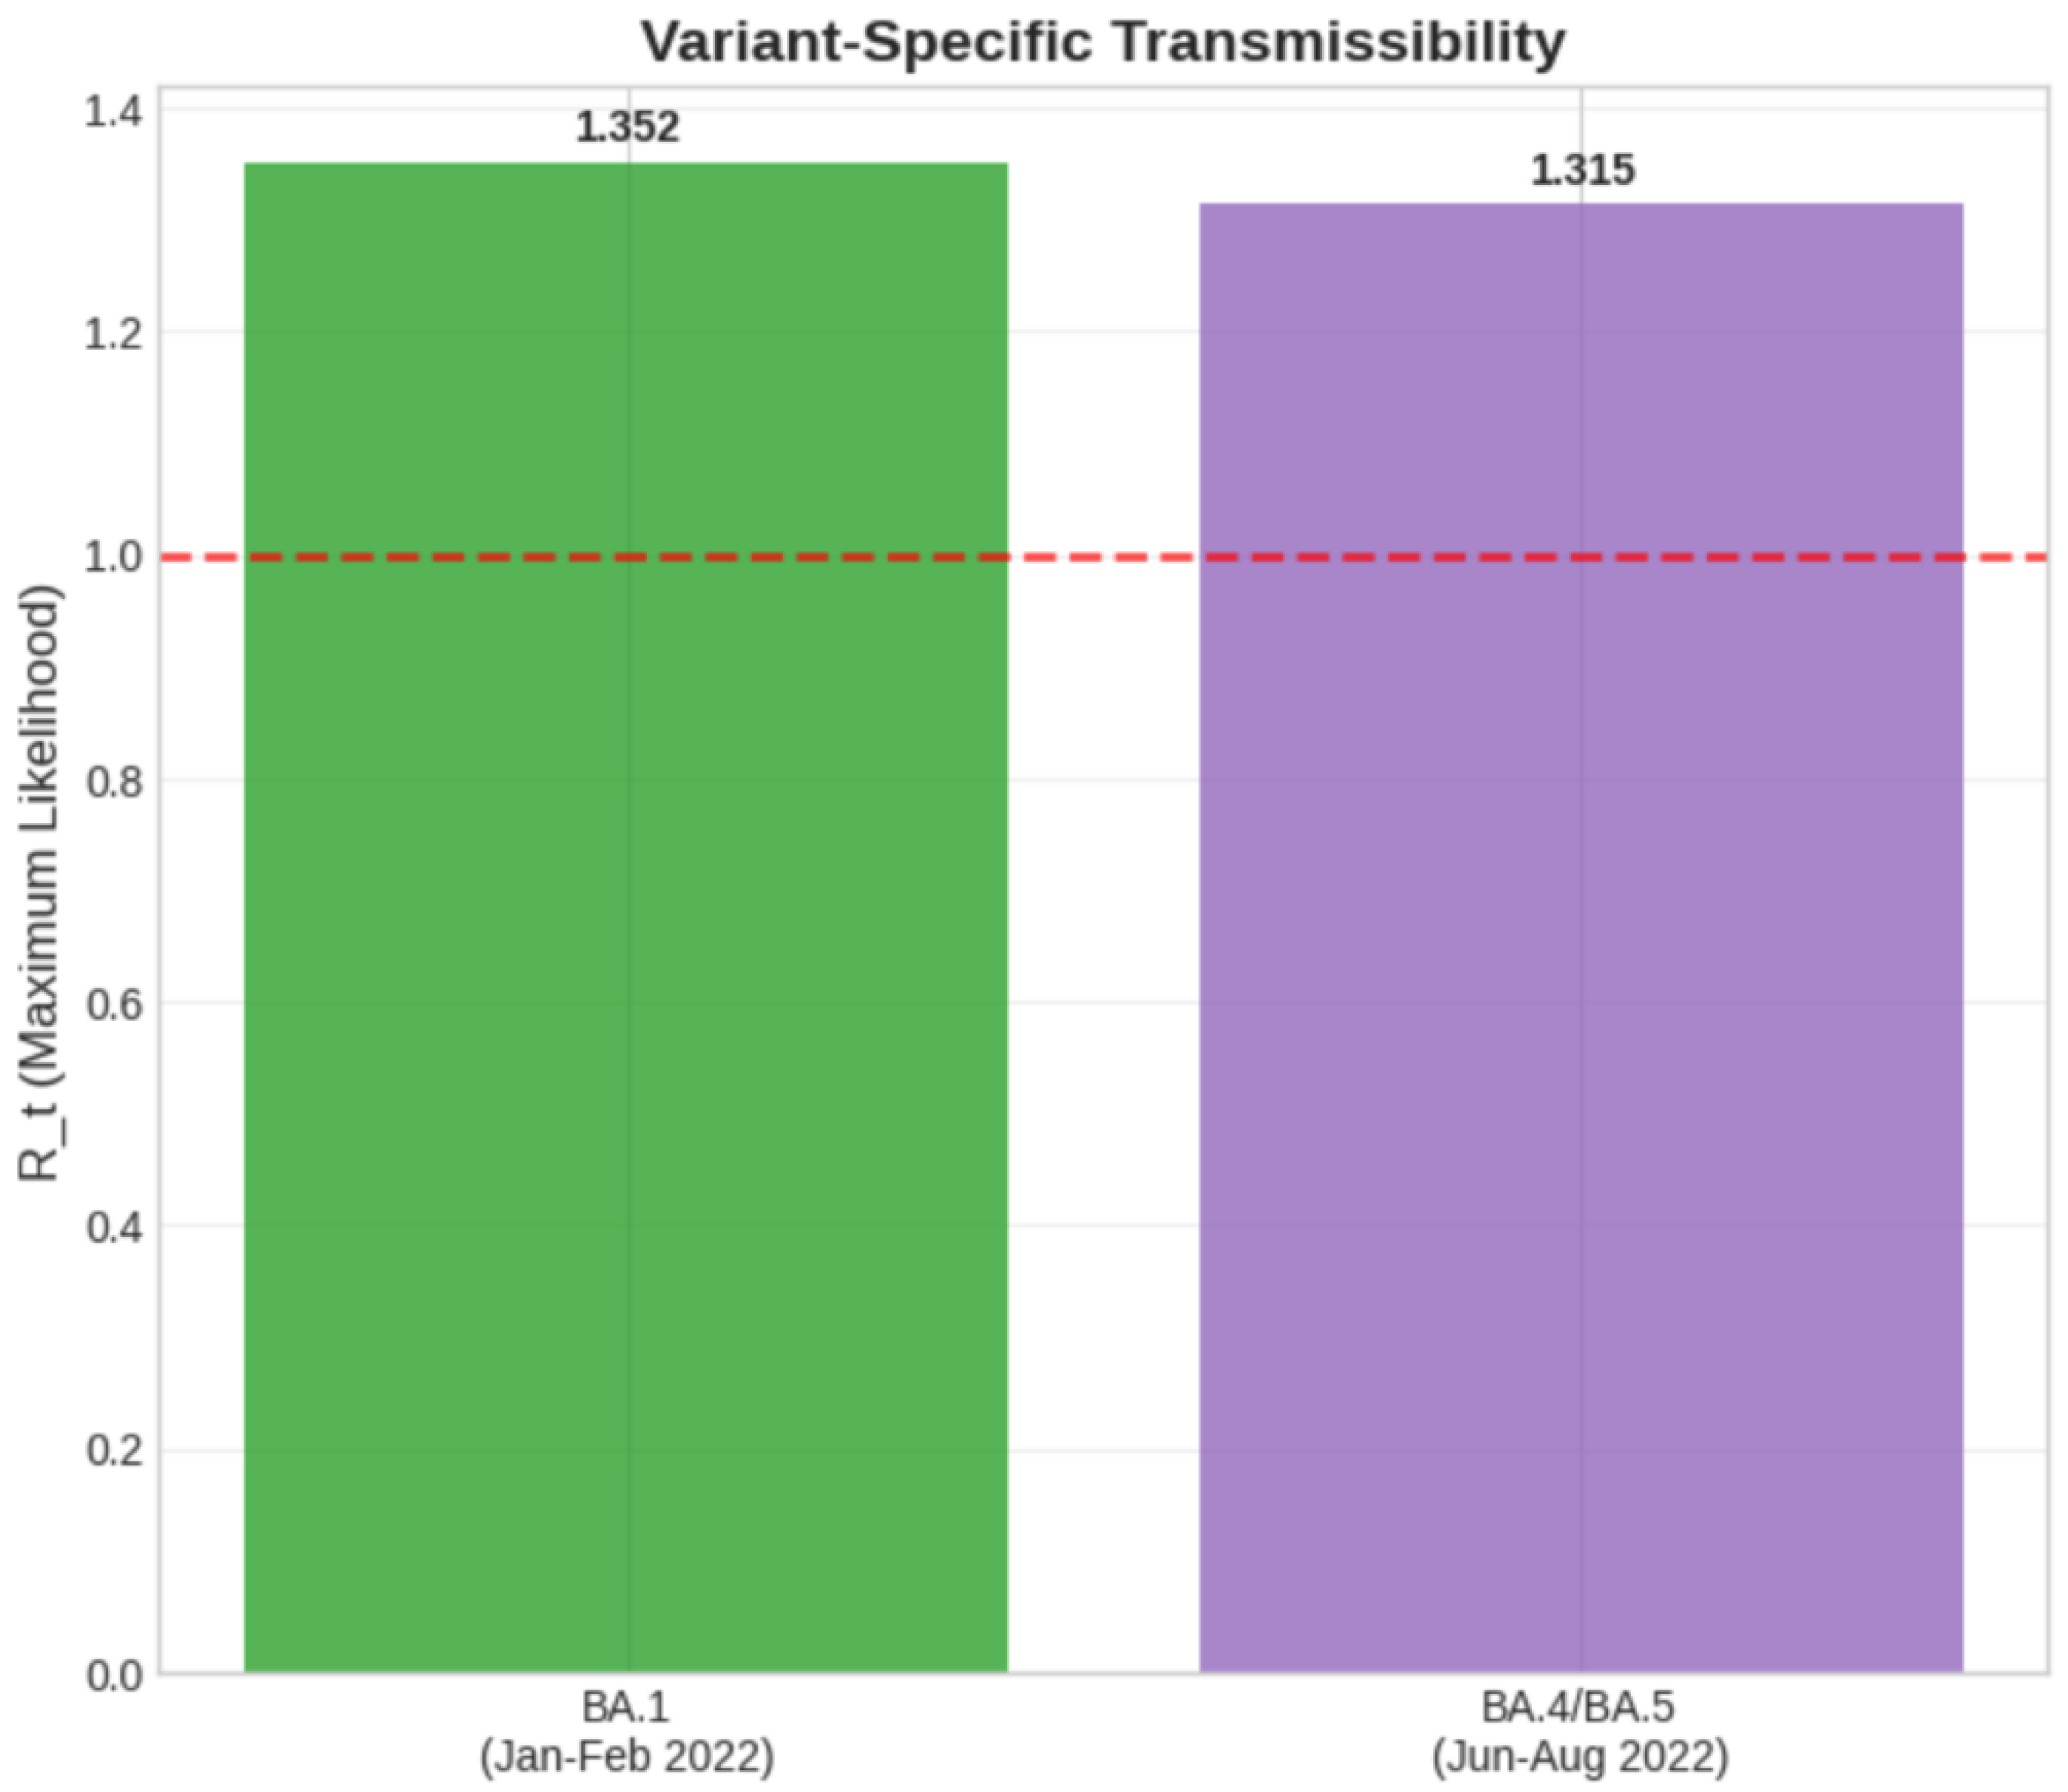
Figure 3.
Regional Vaccination Coverage. Full vaccination rate (%) in Iran and neighboring countries at the time each first achieved a sustained period of in early 2022.
Figure 3.
Regional Vaccination Coverage. Full vaccination rate (%) in Iran and neighboring countries at the time each first achieved a sustained period of in early 2022.
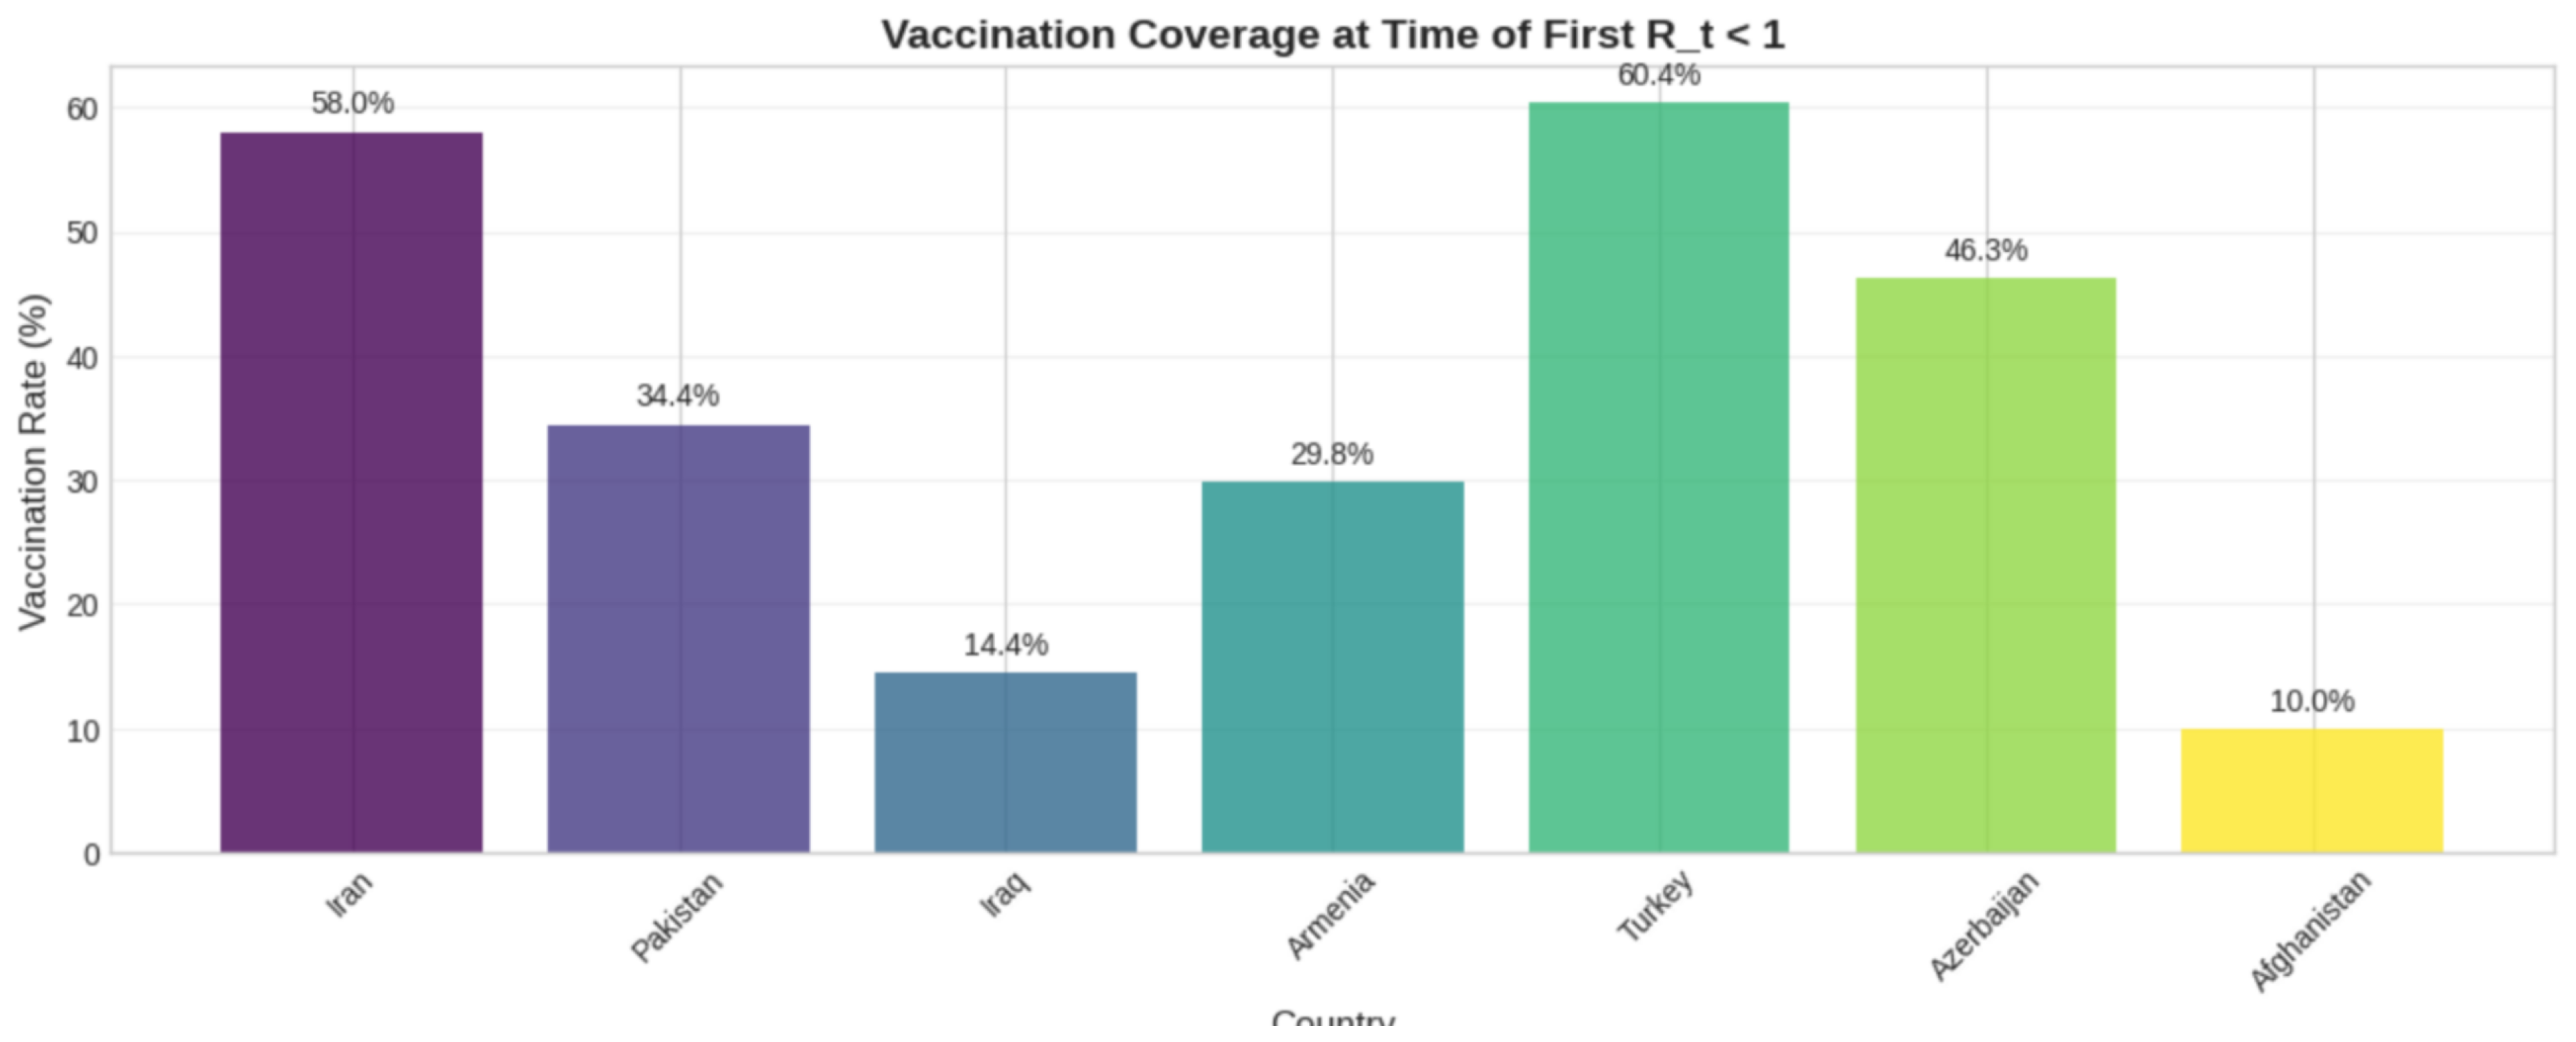

Table 1.
Estimated Reproduction Number () for Iran (Jan 2022 – Dec 2023) using four methods.
| Estimation Method | Estimate | 95% CI Lower | 95% CI Upper |
|---|---|---|---|
| Exponential Growth (EG) | 1.4660 | 1.464080 | 1.467865 |
| Maximum Likelihood (ML) | 1.3521 | 1.346136 | 1.358066 |
| Sequential Bayesian (SB) | 1.2700 | — | — |
| Time-Dependent (TD) | 1.3045 | — | — |
Table 2.
Sensitivity Analysis and Variant-Specific Estimates.
| Analysis Type | Parameter / Period | Estimated (ML) |
|---|---|---|
| Sensitivity Analysis | ||
| Shorter GT | 2.5 days | 1.2864 |
| Primary GT | 3.0 days | 1.3521 |
| Longer GT | 3.5 days | 1.4316 |
| Variant-Specific Analysis | ||
| Omicron BA.1 (Jan-Feb 2022) | GT = 3.0 | 1.3521 |
| Omicron BA.4/BA.5 (Jun-Aug 2022) | GT = 3.0 | 1.3145 |
| Other Omicron periods | GT = 3.0 | NA |
Table 3.
Regional Comparison: First Date of Sustained in 2022 (based on raw OWID data).
| Country | Date Sustained < 1 | Vaccination Rate (%) |
|---|---|---|
| Iran | 2022-01-01 | 58.0163 |
| Pakistan | 2022-02-03 | 34.4465 |
| Iraq | 2022-02-04 | 14.4445 |
| Armenia | 2022-02-09 | 29.8172 |
| Turkey | 2022-02-11 | 60.4267 |
| Azerbaijan | 2022-02-14 | 46.2774 |
| Afghanistan | 2022-02-16 | 9.9648 |
Disclaimer/Publisher’s Note: The statements, opinions and data contained in all publications are solely those of the individual author(s) and contributor(s) and not of MDPI and/or the editor(s). MDPI and/or the editor(s) disclaim responsibility for any injury to people or property resulting from any ideas, methods, instructions or products referred to in the content. |
© 2025 by the authors. Licensee MDPI, Basel, Switzerland. This article is an open access article distributed under the terms and conditions of the Creative Commons Attribution (CC BY) license (http://creativecommons.org/licenses/by/4.0/).
Copyright: This open access article is published under a Creative Commons CC BY 4.0 license, which permit the free download, distribution, and reuse, provided that the author and preprint are cited in any reuse.


