
Submitted:
20 December 2024
Posted:
20 December 2024
You are already at the latest version
Preprints on COVID-19 and SARS-CoV-2
Abstract
This study investigates the relationship between SARS-CoV-2 RT-PCR cycle threshold (Ct) values and key COVID-19 transmission and outcome metrics across five years of the pandemic in Jalisco, Mexico. Utilizing a comprehensive time-series analysis, we evaluated weekly median Ct values as proxies for viral load and their temporal associations with positivity rates, reproduction numbers (Rt), hospitalizations, and mortality. Cross-correlation and lagged regression analyses revealed significant lead-lag relationships, with declining Ct values consistently preceding surges in positivity rates and hospitalizations, particularly during the early pandemic phases. Granger causality tests and vector autoregressive modeling confirmed the predictive value of Ct values, highlighting their potential as early warning indicators. Demographic stratification showed lower Ct values in older adults and males, indicative of higher viral loads in these subgroups. The study further observed a weakening association in later pandemic stages, likely due to vaccination campaigns, natural immunity, and diagnostic shifts. These findings underscore the utility of Ct values as scalable tools for public health surveillance, offering actionable insights for resource allocation and outbreak mitigation. Integrating Ct monitoring into surveillance systems could enhance preparedness for respiratory viral pandemics and improve epidemiological modeling frameworks.
Keywords:
SARS-CoV-2 cycle threshold (Ct)
; COVID-19 transmission dynamics
; Time series analysis
; Respiratory viral trends
; Epidemiological predictors
; Cycle threshold (Ct) predictive value
1. Introduction
The global coronavirus disease 2019 (COVID-19) pandemic has underscored the critical role of diagnostic tools, particularly real-time reverse-transcription polymerase chain reaction (RT‒PCR) tests, in both individual patient management and epidemiological surveillance [1,2,3,4,5]. Cycle threshold (Ct) values, which inversely correlate with viral load, have been linked to increased infectivity, disease severity, and a higher probability of culturable virus, emphasizing their importance in evaluating transmission risks and epidemic trends [6,7,8,9]. As semiquantitative markers of viral load, Ct values provide valuable insights into individual infectiousness and population-level dynamics, serving as a valuable tool for monitoring viral transmission, predicting outbreaks, and guiding public health interventions [10].
From an epidemiological perspective, Ct values serve as a proxy for viral transmissibility, with population-wide declines often signaling increased community-level transmission before it is reflected in rising case numbers, positivity rates, hospitalizations, or deaths [10,11,12]. Temporal trends in Ct values have demonstrated predictive capabilities, as decreases in median Ct values have been shown to precede surges in confirmed cases by one to three weeks but also correlate with increased hospitalization rates following a lag of several days to weeks [10,13,14]. These findings highlight the utility of Ct values in forecasting outbreaks and guiding timely public health responses during pandemics [8,13].
In specific cases, such as South Korea, declining Ct values accurately predicted surges in COVID-19 cases [10]. Similarly, in the United States, low Ct values were strongly correlated with higher hospitalization rates, whereas in Spain, temporal series analysis revealed that fluctuations in mean Ct values were associated with increases in COVID-19 cases and hospital admissions, with a lag of several days [8,15]. These findings underscore the utility of Ct-based monitoring for informing timely public health decisions, particularly in resource-limited settings where cost-effective surveillance tools are critical [8,9,12,16,17]. The growing recognition of Ct values as critical epidemiological tools highlights their transformative potential for pandemic preparedness, enhancing the precision of outbreak prediction models and resource allocation strategies [10,17].
The objective of this study was to evaluate the relationships between population-level Ct values from SARS-CoV-2 RT‒PCR tests over five years of the pandemic and key COVID‒19 transmission and outcome metrics. By employing time series analysis, we aimed to identify temporal associations and lead‒lag relationships between Ct values and subsequent trends in case increases, positivity rates, effective reproduction numbers (Rt), hospitalization rates, and mortality. This approach provides evidence for the predictive utility of Ct values in public health decision-making while also assessing their behavior over the course of the pandemic and their role in early warning systems and resource optimization strategies.
2. Materials and Methods
2.1. Ethics
This study was conducted in accordance with the principles of the Declaration of Helsinki of 1964 and its later amendments, applicable national legislation, and institutional guidelines. The study was evaluated and approved by the Research Committee of the Ministry of Health of Jalisco, and it has been registered in the State Research Registry under the identifier 73/LESP/JAL/2024. Due to the retrospective nature of the study and the exclusive use of de-identified data, informed consent was waived, as approved by the Comité de Ética en Investigación de la Secretaría de Salud de Jalisco (approval number SSJ/DGEICS/DIS/CEI/12/24) and the Comité de Investigación de la Secretaría de Salud de Jalisco (approval number SSJ/DGEICS/DIS/CI/13/24).
2.2. Setting
Jalisco, located in western Mexico, covers an area of approximately 78,595 km² and is the third most populous state in the country, with more than 8.8 million inhabitants as estimated in 2024 [18,19]. The state is supported by a healthcare network comprising 88 public hospitals, 5 of which are highly specialized, and 582 health centers across its 125 municipalities. Epidemiological surveillance is organized into 13 health regions covering all municipalities. The State Public Health Laboratory of Jalisco (SPHLJ) serves as a key reference center for diagnostics and surveillance, primarily supporting the uninsured population [20].
2.3. Population and Eligibility Criteria
We retrospectively reviewed the registry of the SPHLJ, which included symptomatic patients with influenza-like illness (ILI) who were tested for respiratory viruses from March 2020 to June 2024. A suspected case of ILI was defined as the sudden onset of symptoms accompanied by at least one of the following systemic symptoms: fever or feverishness, cough, or headache, and at least one of the following localized symptoms: dyspnea, myalgias, arthralgias, odynophagia, chills, chest pain, rhinorrhea, tachypnea, anosmia, dysgeusia, or conjunctivitis [21]. Demographic information, comorbidities, clinical characteristics, and outcomes were systematically extracted from the records. Patients with more than 10% missing data in sociodemographic or clinical fields were excluded from the analysis.
2.4. Viral Testing
Nasopharyngeal swabs were collected in viral transport media and transported to the SPHLJ under cold chain conditions. Upon arrival, laboratory procedures included viral inactivation, nucleic acid extraction, and viral gene amplification using RT‒PCR. Briefly, viral genetic material was extracted via automated platforms that employed magnetic bead-based technology to selectively bind viral RNA, followed by subsequent washing steps for isolation. Two different extraction kits and systems were utilized: the ExiPrep™ Plus Viral DNA/RNA Kit (96 reactions) on the ExiPrep™ 96 platform (Bioneer®, Daejeon, South Korea) and the MagNA Pure 96 Small Volume Kit on the MagNA Pure 96 System (Roche®, Basel, Switzerland). Viral detection was performed using Health Mexico-approved single and multiplex RT‒PCR assays, which target key SARS-CoV-2 genes such as E, N, RdRP, and ORF1ab. The platforms and assays utilized included the COBAS 6800 System (Roche®), Logix Smart RT‒PCR Kit (Co-Diagnostics®), Flu-COVID Vitro Kit (Master Diagnóstica®), and the BioFire FilmArray Respiratory Panel (BioFire Diagnostics®) for the detection of SARS‒CoV-2 and other respiratory viruses.
2.5. Data Metrics for Time Series Analysis
To compare population-level Ct values with COVID-19 and acute respiratory illness metrics, the weekly median Ct value was calculated from positive RT‒PCR results obtained from the SPHLJ. The primary comparison metrics included the weekly number of positive tests and the positivity rate reported by the SPHLJ. To extend the analysis to state-level transmission and outcome metrics, open-access datasets from the State Ministry of Health and the National Ministry of Health were utilized [22,23]. From these datasets, we extracted the number of positive RT‒PCR tests statewide, the number of confirmed COVID‒19 cases statewide (including those with positive antigen and RT‒PCR tests from public and private institutions), the number of hospitalizations due to acute respiratory illness (including both confirmed and nonconfirmed COVID‒19 cases), the number of hospitalizations related to COVID‒19, the number of deaths due to acute respiratory illness, the number of deaths attributed to COVID‒19, and the effective reproduction number (Rt), which was calculated on the basis of the number of confirmed COVID‒19 cases at the state level. All the metrics were aggregated weekly to facilitate comparisons.
2.6. Statistical Analysis
Demographic data were summarized as simple relative frequencies. The percentage of positive test results was calculated by dividing the number of positive tests by the total number of tests conducted within a specified period and expressed as a percentage. The Shapiro–Wilk test was used to evaluate the normality of the data distribution. Proportions were compared using Pearson’s chi-square test or Fisher’s exact test, as appropriate. For quantitative variables, Student’s t test and ANOVA were applied to normally distributed data, whereas the Wilcoxon–Mann–Whitney and Kruskal‒Wallis tests were used for nonnormally distributed data.
The effective reproduction number (Rt) was estimated for confirmed COVID-19 cases at the state level to understand the temporal changes in the transmissibility of the virus. To calculate Rt, the incidence at a specific time (I(t)) was divided by the sum of all prior incidences weighted by the probability distribution of the serial interval (w_s), which represents the time between symptom onset in a primary case and a secondary case. The formula used was as follows:
Rt = I(t)/(Σ w_s * I(t-s))
The serial interval was modeled with an average of 5 days and a standard deviation of 2 days, reflecting typical SARS-CoV-2 transmission characteristics. These parameters were chosen to account for the impact of different variants of SARS-CoV-2, including Alpha, Delta, and Omicron, which were prevalent during different periods of the pandemic. The median Rt was derived for each week to provide a robust estimate of the transmission dynamics over the study period.
To evaluate the temporal relationships between SARS-CoV-2 Ct values and key epidemiological metrics of transmission and outcomes, we employed a series of complementary analytical methods, including cross-correlation functions (CCFs), regression analysis, and vector autoregressive (VAR) modeling. The analysis was segmented into four distinct time periods to account for evolving pandemic dynamics: June 2020–May 2021, June 2021–May 2022, June 2022–May 2023, and June 2023–May 2024. This segmentation allowed for a granular assessment of changing relationships across different phases of the pandemic, characterized by the emergence of new variants, shifts in public health interventions, and evolving immunity levels.
First, cross-correlation functions (CCFs) were performed to assess the strength and direction of associations between the independent variable (weekly median Ct values) and dependent outcomes, including weekly acute respiratory illness and SARS-CoV-2 metrics such as positivity rates, hospitalizations, and mortality. Lags ranging from 0 to 12 weeks were examined, guided by biological plausibility and previous research [24]. This step identified the optimal time lags where changes in Ct values were most significantly associated with subsequent fluctuations in the dependent variables. The CCF analysis provided critical insights into the lead‒lag dynamics of the viral load and epidemiological trends across each pandemic phase.
Following the identification of optimal lags through CCFs, we conducted regression analyses to quantify the temporal associations between Ct values and outcome variables. For each metric, the independent variable (Ct value) was lagged according to the CCF findings, ensuring alignment with biologically plausible intervals of viral kinetics and disease progression [24]. Linear regression models were built for each time period, adjusting for covariates such as age, sex, and the presence of comorbidities. These models allowed us to generate effect estimates, providing a detailed understanding of how fluctuations in Ct values influenced key epidemiological outcomes over time.
To further examine temporal causality, we applied Granger causality tests to statistically evaluate whether changes in Ct values could predict subsequent variations in dependent variables, such as hospitalization and mortality rates. This method established the predictive value of Ct values in forecasting key outcomes, identifying periods where they were significant predictors of changes in epidemiological metrics.
Finally, we implemented vector autoregressive (VAR) modeling to explore the interdependencies between Ct values and multiple dependent metrics over time. VAR models, particularly those suited for multivariate time series analysis, allow us to model each variable as a function of its past values and those of other variables in the system. These models were applied across the same segmented timeframes to evaluate how these relationships evolved as pandemic conditions changed. By incorporating age, sex, and comorbidities as covariates, we were able to assess both unadjusted and adjusted dynamics within the system, offering a comprehensive understanding of the complex interactions between Ct values and epidemiological outcomes.
The statistical analyses were performed using R (version 4.2.1) and Python (version 3.10.4). For R, the primary packages used included vars (version 1.5--7) for VAR models and Granger causality testing and ggplot2 (version 3.3.6) for generating cross-correlation plots. Python analyses were conducted in pandas (version 1.4.3) for data manipulation, statsmodels (version 0.13.2) for regression analyses, and VAR models and sklearn (scikit-learn version 1.1.1) for preprocessing and standardization.
3. Results
From the RT‒PCR test records of the SPHLJ, a total of 127,160 individuals were tested, of whom 50,367 were positive for SARS-CoV-2 and 42,769 had Ct values available for analysis. Similarly, 659,704 patients were documented in the state’s official records, with 303,020 classified as confirmed COVID-19 cases for analysis, as shown in Figure 1.
Among the 127,160 individuals tested for SARS-CoV-2 at the SPHLJ, the median age was 38 years (IQR 27–52), and 54.25% were women (n = 68,983). Of the 50,367 individuals who tested positive, 52.89% were women (n = 26,624), with a median age of 42 years (IQR 30–57). The distribution of positive cases across the thirteen health regions of the state is depicted in Figure 2.
Among individuals with positive tests reported at the SPHL, men had a slightly older median age than women did (44 [31,32,33,34,35,36,37,38,39,40,41,42,43,44,45,46,47,48,49,50,51,52,53,54,55,56,57,58,59] vs. 41 [29,30,31,32,33,34,35,36,37,38,39,40,41,42,43,44,45,46,47,48,49,50,51,52,53,54,55], p < 0.001). Over the five-year period (2020–2024), significant demographic shifts were observed in the number of COVID-19 cases. Women increasingly accounted for a greater proportion of cases, peaking at 62.64% in 2023 (p < 0.001). The age distribution revealed a marked decline in cases among individuals aged 18–65 years, decreasing from 82.18% in 2020 to 44.61% in 2024, whereas significant increases were observed in pediatric patients aged 0–2 years and individuals > 65 years, particularly in 2024 (17.65% and 25.98%, respectively; p < 0.001). The number of RT‒PCR tests performed decreased over the years, from 55,806 in 2020 to 2025 in 2024. The remaining age and sex distributions of SARS-CoV-2-positive individuals across years are depicted in Table 1.
The median time from symptom onset to testing was 3 days (IQR 2–4). Comorbidities were reported in 40.60% of individuals with positive tests (n = 20,454), with hypertension (16.42%), diabetes (13.26%), and obesity (11.36%) being the most prevalent conditions. Asthma and smoking were also documented in 3.10% and 6.16% of the patients, respectively. In terms of clinical outcomes, 7,430 patients (14.75%) required hospitalization, and pneumonia was diagnosed in 14.67% (n = 7,389) of the patients. Furthermore, 7.01% of patients required invasive mechanical ventilation, while COVID-19-related deaths occurred in 1.62% of patients. Further details on demographic characteristics, comorbidities, and clinical outcomes are provided in Table 2.
Table 3 summarizes the official state metrics related to acute respiratory disease and COVID-19. A total of 659,704 cases of acute respiratory disease were reported, of which 89,410 (13.55%) required hospitalization due to respiratory complications, and 27,303 (4.14%) resulted in deaths associated with acute respiratory disease. Among the total cases, 303,020 (45.93%) were confirmed as COVID-19 cases, with 44,443 (14.66%) requiring hospitalization and 20,325 (6.71%) resulting in COVID-19-related deaths. A significant disparity was observed when stratified by sex, with males exhibiting greater percentages of hospitalizations (36.35% vs. 11.33%, p < 0.001) and deaths (9.01% vs. 4.75%, p < 0.001) associated with acute respiratory disease. Similarly, hospitalizations and deaths specifically attributed to COVID-19 were significantly greater among males than females (p < 0.001). The distribution of COVID-19 cases by sex and age across years is detailed in Table S1 of the supplementary material.
Among the 42,769 positive SARS-CoV-2 RT‒PCR tests analyzed, the median Ct value was 27 (IQR 22–32). The Ct values significantly decreased from 2020 to 2023, indicating increasing viral loads over time, with the lowest median values observed in 2023. By 2024, the Ct values slightly increased across all the groups. This pattern was consistent across sexes, with women showing a median Ct of 28 (IQR 24–33) in 2020, dropping to 22 (IQR 19–28) in 2023, and slightly increasing to 23 (IQR 18.48–30.00) in 2024 (p < 0.001). A similar trend was observed among men, whose median Ct decreased from 28 (IQR 23–32) in 2020 to 23 (IQR 19–30) in 2023, with a slight rebound to 23.94 (IQR 19.92–31.25) in 2024 (p < 0.001). When stratified by age, younger children (0–2 years) consistently presented higher Ct values than older children did, with medians declining from 29 (IQR 25–34) in 2020 to 26 (IQR 19–35) in 2023 and stabilizing at 25.09 (IQR 20–30.75) in 2024 (p = 0.001). In contrast, individuals aged 18–65 years and >65 years had the lowest Ct values in 2023, reflecting the highest viral loads, with medians of 22 (IQR 19–28) and 22 (IQR 18–26.25), respectively (p < 0.001 for both groups). The median Ct values of SARS-CoV-2 RT‒PCR-positive tests by year, sex, and age group are presented in Table 4.
Figure 3.
Annual trends in cycle threshold (Ct) values by sex and age group: combined density plots and boxplots for SARS-CoV-2 cases (2020–2024).
Figure 3.
Annual trends in cycle threshold (Ct) values by sex and age group: combined density plots and boxplots for SARS-CoV-2 cases (2020–2024).
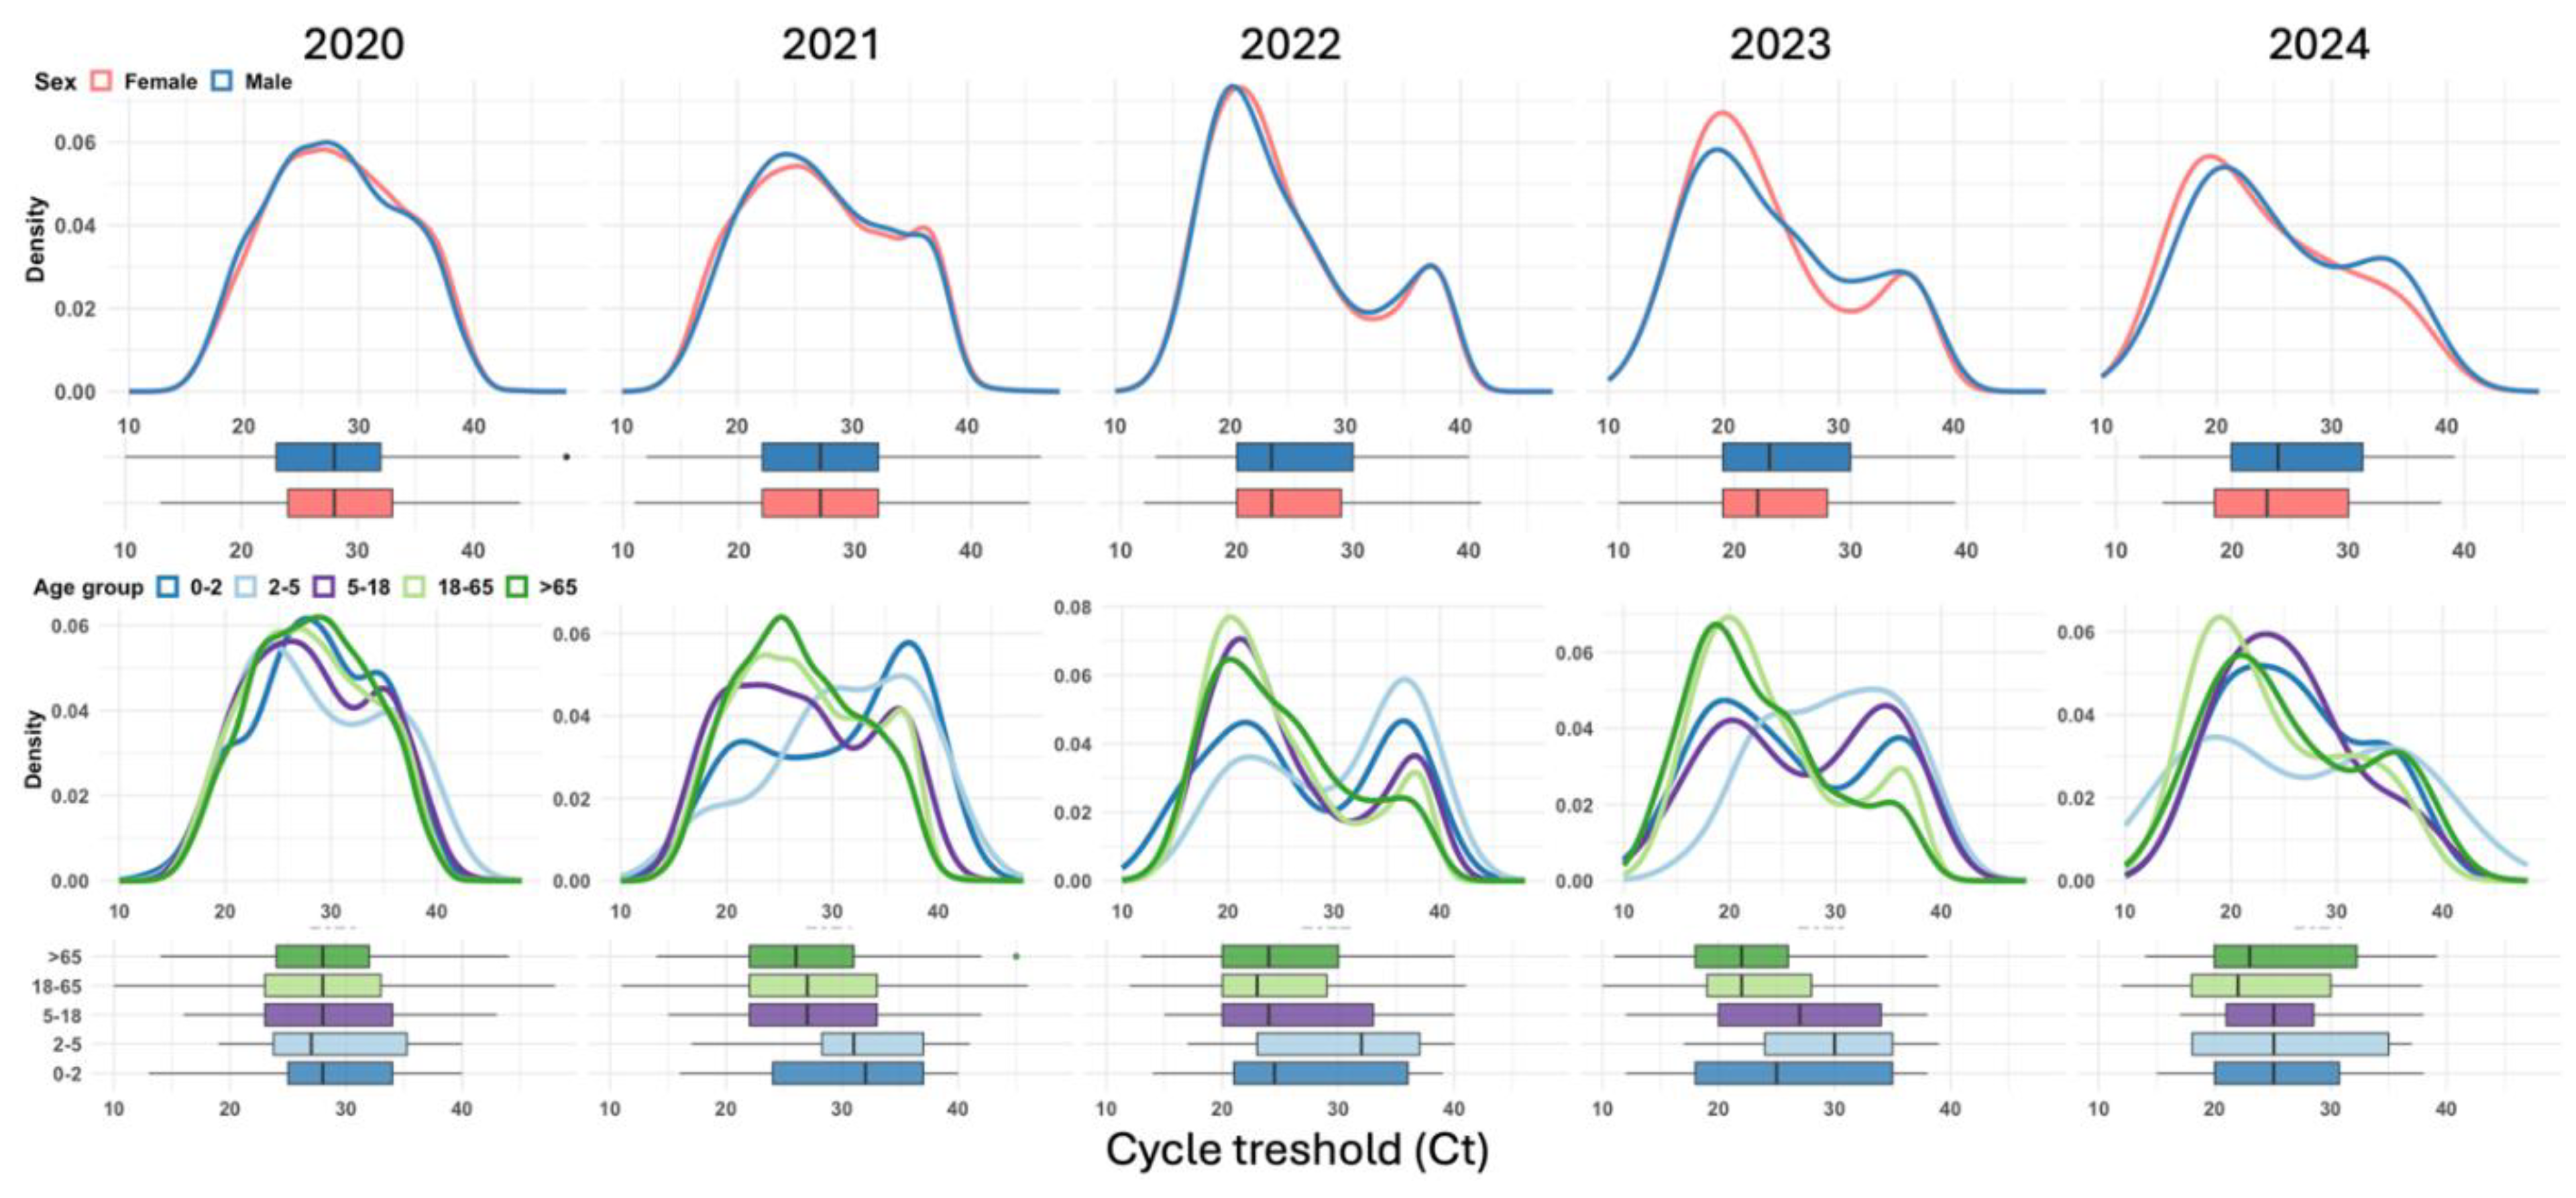
Figure 3 shows the annual distribution of SARS-CoV-2 cycle threshold (Ct) values by sex (top row) and age group (bottom row) from 2020–2024. Across all years, the distributions of Ct values for males and females exhibited similar trends, with slight shifts in density. The age-specific density plots revealed that younger age groups (0–2 years and 2–5 years) consistently presented higher Ct values (lower viral loads) across all years, as indicated by density peaks skewed to the right. Conversely, older age groups (18–65 years and > 65 years) display lower Ct values (higher viral loads), with their density curves peaking to the left. This trend is most prominent in 2023. Boxplots further confirmed that older adults (> 65 years) had the lowest median Ct values in 2023, reflecting the highest viral loads.
The relationships between Ct values and key epidemiological metrics for acute respiratory disease and COVID-19 are illustrated in Figure 4a, Figure 4b, and Figure 4c. From 2020–2021, sharp declines in median Ct values coincided with subsequent increases in confirmed COVID-19 cases, RT‒PCR-positive tests, and hospitalizations, particularly during the mid–2020 and early 2021 peaks. A notable drop in Ct values was again observed during the Delta wave (mid-2021) and the Omicron surge (early 2022), corresponding to sharp increases in cases and positive tests. The lowest Ct values were recorded during the Omicron surge, reflecting the high transmissibility and elevated viral loads of this variant. Although hospitalizations and deaths increased following these declines, the magnitude of severe outcomes was reduced, likely due to population immunity and vaccination efforts. From 2023 onward, the Ct values stabilized, showing a slight upward trend, which coincided with smaller peaks in cases, positivity rates, and hospitalizations. With respect to positivity rates, strong correlations with declining Ct values were observed from 2020–2022, indicating higher viral loads during transmission peaks. From 2023 onward, the positivity rates exhibited smaller peaks and general stabilization. In relation to the effective reproduction number (Rt), early pandemic surges closely align with reductions in Ct values, highlighting the role of elevated viral loads in driving transmission. However, from 2023–2024, the relationship weakened.
On the basis of cross-correlation function (CCF) analysis, we identified significant time-lagged relationships between weekly median Ct values and key epidemiological indicators, which varied across the study period from June 2020 to May 2024. Among the most relevant findings, the strongest correlations for the positivity rate of SARS-CoV-2 tests in the SPHLJ were observed at lag -1 during the 2020–2021 period (r = -0.48) and at lag -2 in the 2021–2022 period (r = -0.59), indicating that changes in Ct values preceded fluctuations in positivity rates by one to two weeks. Similarly, the positivity rate for all positive RT‒PCR tests reported statewide exhibited the strongest correlation at lag -2 from 2021–2022 (r = -0.58), suggesting a two-week delay. Notably, the basic reproduction number (Rt) exhibited the strongest correlation at lag -6 from 2021–2022 (r = -0.44), highlighting a longer lag period indicative of a delayed but significant association between Ct dynamics and viral transmissibility. For COVID-19-related hospitalizations, the correlation was most pronounced at lag -4 from 2023–2024 (r = -0.42), whereas for COVID-19-related mortality, the strongest correlation occurred at lag -5 during the same period (r = -0.35). The cross-correlations between Ct values and transmission metrics, as well as clinical outcomes for COVID-19 and acute viral respiratory illness, are presented in Figure 5 and Table S1 of the supplementary material.
The lagged regression analysis demonstrated a pattern of significant negative associations between Ct values and various epidemiological metrics across distinct pandemic periods. For instance, concerning the SPHLJ SARS-CoV-2 RT‒PCR positivity rate, a strong inverse relationship emerged from 2020–2021 at lag -1 (estimate: -3.23; 95% CI: -4.72 to -1.73; p < 0.001), suggesting that decreases in Ct values anticipated increases in positivity rates roughly one week later. Similarly, a more attenuated effect persisted into 2023–2024 at lag -6 (estimate: -0.45; 95% CI: -0.78 to -0.12; p = 0.009), indicating that the predictive lead time varied over the course of the pandemic. This trend was also evident for confirmed COVID-19 cases, with a strong negative association observed in 2020–2021 at lag -1 (estimate: -256.80; 95% CI: -414.51 to -99.10; p = 0.002) and a continued, albeit weaker, significant effect in 2022–2023 (estimate: -65.53; 95% CI: -127.95 to -3.11; p = 0.040). In addition, the statewide RT‒PCR positivity rate showed a marked inverse correlation from 2021–2022 at lag -2 (estimate: -1.28; 95% CI: -1.99 to -0.57; p < 0.001), underscoring the consistently predictive nature of Ct values for key testing metrics. Notably, the effective reproduction number (Rt) also demonstrated a significant inverse association at lag -6 from 2021–2022 (estimate: -0.041; 95% CI: -0.07 to -0.012; p = 0.007). Moreover, clinical outcomes were similarly affected. For COVID-19-related hospitalizations, a significant negative association was identified from 2020–2021 at lag -1 (estimate: -62.05; 95% CI: -117.18 – -6.92; p = 0.028). Similarly, COVID-19-related deaths were negatively associated from 2020–2021 at lag -1 (estimate: -36.63; 95% CI: -66.34 to -6.91; p = 0.017) and persisted into 2023–2024 at lag -5 (estimate: -0.145; 95% CI: -0.265 to -0.025; p = 0.019). The complete set of regression results, segmented by year, is provided in Figure 6 and Table S2 of the supplementary materials.
The analysis combining Granger causality and vector autoregression (VAR) models revealed significant relationships between Ct values and key epidemiological metrics during specific periods. For the number of positive RT‒PCR tests conducted at the SPHLJ, from June 2020 to May 2021, Granger causality demonstrated a highly significant association (p = 0.0008), indicating that Ct values effectively predicted changes in this metric. This was further supported by the VAR model, which showed a substantial negative coefficient (-47.62; p = 0.0011) and a high adjusted R² of 0.93, suggesting a strong and consistent temporal association. For the positivity rate of tests conducted at the SPHLJ, significant relationships were identified across two distinct periods. From June 2020 to May 2021, Granger causality (p = 0.026) and VAR analysis (coefficient: -2.03; p = 0.0083) demonstrated a predictive value, with an adjusted R² of 0.85. Similarly, from June 2021 to May 2022, Granger causality remained significant (p = 0.0051), and the VAR coefficient (-0.71; p = 0.047) confirmed the association, although with a smaller effect size than that in the earlier period. For the effective reproduction number (Rt), the period from June 2021 to May 2022 was significantly associated with both Granger causality (p = 0.039) and VAR analysis (coefficient: -0.012; p = 0.025). The adjusted R² of 0.98 underscored the model's exceptional fit, indicating a robust temporal relationship between Ct values and viral transmissibility. The summary results of the Granger causality tests and VAR analysis are presented in Table 5, whereas an extended version covering all the metrics throughout the analyzed years is provided in Table S3 of the supplementary materials.
4. Discussion
Our study provides a comprehensive analysis of the relationships between population-level SARS-CoV-2 Ct values and key epidemiological metrics, including positivity rates, reproduction numbers (Rt), hospitalizations, and mortality. Notably, we identified significant temporal associations between declining Ct values and subsequent increases in these metrics, particularly during the early years of the pandemic, underscoring their predictive utility in similar future scenarios.
The temporal lead‒lag relationships observed in our study highlight the potential of population-level Ct monitoring as an early warning system for impending outbreaks. This finding aligns with previous reports demonstrating that declining Ct values are temporally associated with increases in COVID-19 case numbers and hospitalization rates [10,13,15]. By integrating Ct value trends into routine surveillance systems, health authorities could enhance resource allocation and optimize the timing of interventions [25]. For instance, a decline in median Ct values could serve as a preemptive trigger for scaling up testing capacity, reinforcing public health messaging, or implementing targeted mitigation strategies.
Our cross-correlation analyses suggest that changes in the median weekly Ct value from RT‒PCR-positive tests preceded fluctuations in positivity rates by one to two weeks and shifts in the effective reproduction number (Rt) by up to six weeks, depending on the analyzed time period. The cross-correlation functions revealed stronger negative correlations, indicating greater inverse associations, during the early pandemic years, particularly in 2020–2021 and 2021–2022. Notably, the optimal lags occurred earlier in these initial periods and progressively shifted to later time points in subsequent years. These findings suggest that the predictive strength of decreasing Ct values for increases in epidemiological metrics was more pronounced in the early stages of the pandemic and weakened over time.
Lagged regression analyses, adjusted for covariates such as age, sex, and the presence of comorbidities, further reinforced these observations. The size and statistical significance of the effects of Ct values on epidemiological metrics were consistently greater during the 2020–2021 and 2021–2022 periods than during the later stages of the pandemic, indicating a progressive reduction in these associations over time. Similarly, vector autoregressive modeling, also adjusted for relevant covariates, revealed that the median weekly Ct value significantly influenced the behavior of weekly dependent epidemiological metrics during the early pandemic years but not in subsequent periods. These findings were corroborated by Granger causality tests, which confirmed the temporal directionality of these associations.
The weakening of these associations during the later stages of the pandemic can be attributed to multiple factors, including widespread vaccination campaigns, increased population-level immunity from prior infections, and the emergence of new viral variants with differing transmissibility and virulence [27,28,29,30,31]. Additionally, the transition to rapid antigen tests (RATs) during the Omicron surge was necessitated by the high transmissibility of the variant and logistical challenges in maintaining RT‒PCR testing capacity [31,32]. While RATs are less sensitive than RT‒PCR is, they offer quick results and ease of use, enabling timely isolation measures and reducing the burden on healthcare systems; however, this reduced sensitivity of RATs, particularly in cases with low viral loads, may lead to underreporting of cases, thereby affecting the accuracy of case counts and transmission metrics [33].
Behavioral adaptations, including changes in testing strategies and the relaxation of non-pharmaceutical interventions, likely contributed to these shifts [31,34,35]. These adaptations not only limit the availability of Ct value data but also affect the accuracy of key epidemiological metrics such as the time-varying effective reproductive number (Rt) [34]. When shifts from RT‒PCR to RATs occur and underreporting is present, the fraction of detected and reported cases becomes inconsistent over time, potentially biasing estimates of Rt [34]. The emergence of Omicron has also influenced population immunity dynamics. In the United States, for example, there was a significant increase in protection against Omicron infection and severe disease from December 2021 to November 2022, driven by both natural infections and vaccination efforts [36]. This increased immunity has contributed to a lower case fatality rate associated with Omicron than with earlier variants [37]. As a result, these transitions may have reduced the utility of Ct values as proxies for understanding viral dynamics and epidemiological trends and underscores the importance of contextualizing Ct value analyses within specific epidemiological and temporal frameworks to accurately interpret their implications for public health strategies.
Our analysis also revealed significant variation in Ct values across demographic groups, with notable differences according to age and sex. Lower Ct values—reflecting higher viral loads—were consistently observed in older age groups and male patients, which aligns with the increased severity of disease and worse outcomes reported in these populations [3,8,38,39,40]. However, although older patients were reported to have significantly higher viral loads compared to younger individuals during the early stages of the pandemic, this difference diminished over time, likely influenced by public health measures and evolving viral transmission dynamics. [41].
The strengths of this study lie in the extensive dataset utilized and the robust analytical approach applied. By employing cross-correlation functions, lagged regression models, and vector autoregressive analyses, we captured complex temporal relationships and provided statistically rigorous estimates of the predictive value of Ct metrics. Additionally, the segmentation of data into distinct time periods allowed us to account for evolving pandemic dynamics and the emergence of new SARS-CoV-2 variants. Unlike prior studies that focused primarily on the initial associations between Ct values from RT‒PCR-positive tests and epidemiological metrics during the early stages of the pandemic, our study is, to our knowledge, the first to comprehensively describe both the early associations and the effects observed in the postpeak phase of the pandemic in a middle-income Latin American country [5,12,15,17,25,42,43,44,45,46,47,48,49,50,51,52].
However, certain limitations must be acknowledged. The retrospective nature of the study introduces potential biases related to data completeness and accuracy. While Ct values hold promise as epidemiological tools, several methodological considerations must be addressed. Variability in Ct values can arise from differences in sampling techniques, the timing of specimen collection relative to symptom onset, assay protocols, target gene selection, and laboratory platforms [2,53] Standardization of testing protocols and normalization of Ct values across platforms are critical to ensure their reliability and comparability [54].
The implications of our findings extend beyond the immediate context of SARS-CoV-2. Ct values, as scalable and readily available metrics, have the potential to transform public health responses to other respiratory viruses. By integrating Ct-based monitoring into global surveillance frameworks, we can increase preparedness for future pandemics. For instance, combining Ct trends with genomic sequencing data could provide a more comprehensive understanding of viral evolution and transmissibility.
Our results also underscore the need for interdisciplinary collaboration to maximize the utility of Ct metrics. Partnerships between epidemiologists, data scientists, and public health practitioners can facilitate the development of advanced predictive models, incorporating machine learning and artificial intelligence to improve outbreak forecasting and resource allocation. To build on the findings of this study, future research should explore the integration of Ct values with other epidemiological and clinical data. For example, combining Ct trends with vaccination coverage rates or genomic surveillance data could provide deeper insights into the factors driving transmission dynamics. Additionally, further studies are needed to validate the utility of Ct-based monitoring in different settings and populations, particularly in low- and middle-income countries.
5. Conclusions
In conclusion, our study highlights the predictive value of population-level SARS-CoV-2 Ct values in monitoring COVID-19 transmission dynamics and clinical outcomes. Our findings reveal that declining median Ct values, which are indicative of increased viral loads, precede significant surges in positivity rates, effective reproduction numbers, hospitalizations, and mortality, particularly during the early pandemic phases. Temporal shifts in these associations, observed over distinct phases of the pandemic, underscore the evolving interplay between viral transmission, immunity, and public health interventions. While the utility of Ct values diminished in later stages, likely owing to increased immunity and diagnostic transitions, their integration into surveillance systems during early outbreak phases remains a critical strategy for early warning and resource allocation. Future studies combining Ct trends with genomic and vaccination data can further enhance predictive models, informing robust responses to respiratory viral pandemics.
Supplementary Materials
The following supporting information can be downloaded at: www.mdpi.com/xxx/s1, Figure S1: Cross-correlations between the weekly median Ct values from RT-PCR tests and epidemiological metrics related to transmission and outcomes. Table S2. Lagged regression analysis of Ct values and COVID-19 transmission and outcome metrics. Table S3. Summary of Granger Causality and Vector Autoregression (VAR) Analysis Results by Year: Associations Between Ct Values and Epidemiological Metrics.
Author Contributions
Conceptualization: J.C.D.A.-J., P.M.-A., J.B.-R., G.R.-C.; Methodology: J.C.D.A.-J., E.Q.-S., R.L.-R., P.N.V.-B., P.M.-A., J.B.-R.; Software: J.C.D.A.-J., O.F.F.-D., J.B.-R.; Validation: J.C.D.A.-J., P.M.-A., O.F.F.-D., J.B.-R.; Formal analysis: J.C.D.A.-J., J.B.-R.; Investigation: J.C.D.A.-J., E.Q.-S., M.R.R.-B., R.R.-M., R.L.-R., P.N.V.-B., A.M.L.-Y.; Resources: J.C.D.A.-J., R.M.D.-N., O.F.F.-D.; Data curation: G.R.-C., R.M.D.-N., R.R.-M., A.M.L.-Y., M.R.R.-B.; Writing—original draft preparation: J.C.D.A.-J., E.Q.-S., P.M.-A., R.R.-M., G.R.-C., M.R.R.-B., P.N.V.-B., A.M.L.-Y.; Writing—review and editing: J.C.D.A.-J., R.M.D.-N., P.M.-A., O.F.F.-D., R.L.-R., J.B.-R.; Visualization: R.R.-M., J.C.D.A.-J., J.B.-R.; Supervision: J.C.D.A.-J., J.B.-R.; Project administration: J.C.D.A.-J., J.B.-R.
Funding
This research received no external funding.
Institutional Review Board Statement
This study was conducted in accordance with the principles of the Declaration of Helsinki of 1964 and its later amendments, applicable national legislation, and institutional guidelines. The study was evaluated and approved by the Research Committee of the Ministry of Health of Jalisco, and it has been registered in the State Research Registry under the identifier 73/LESP/JAL/2024.
Informed Consent Statement
Due to the retrospective nature of the study and the exclusive use of de-identified data, informed consent was waived, as approved by the Comité de Ética en Investigación de la Secretaría de Salud de Jalisco (approval number SSJ/DGEICS/DIS/CEI/12/24) and the Comité de Investigación de la Secretaría de Salud de Jalisco (approval number SSJ/DGEICS/DIS/CI/13/24).
Data Availability Statement
The raw data supporting the conclusions of this article will be made available by the authors on request.
Conflicts of Interest
The authors declare no conflicts of interest.
Abbreviations
CCFs. Cross-correlation functions
COVID-19. Coronavirus disease 2019
Ct. Cycle threshold
ILI. Influenza-like illness
RATs. Rapid antigen tests.
Rt. Effective reproduction number
RT‒PCR. Real-time reverse-transcription polymerase chain reaction
SARS-CoV-2. Severe acute respiratory syndrome coronavirus 2
SPHLJ. State Public Health Laboratory of Jalisco
VAR. Vector autoregressive modeling
References
- Christensen BB, Azar MM, Turbett SE. Laboratory Diagnosis for SARS-CoV-2 Infection. Infect Dis Clin North Am. 2022 Jun;36(2):327-347. [CrossRef]
- Salvatore PP, Dawson P, Wadhwa A, et al. Epidemiological Correlates of Polymerase Chain Reaction Cycle Threshold Values in the Detection of Severe Acute Respiratory Syndrome Coronavirus 2 (SARS-CoV-2). Clin Infect Dis. 2021 Jun 1;72(11):e761-e767. [CrossRef]
- Ade C, Pum J, Abele I, Raggub L, Bockmühl D, Zöllner B. Analysis of cycle threshold values in SARS-CoV-2-PCR in a long-term study. J Clin Virol. 2021 May;138:104791. Epub 2021 Mar 10. [CrossRef]
- Shah VP, Farah WH, Hill JC, et al. Association Between SARS-CoV-2 Cycle Threshold Values and Clinical Outcomes in Patients With COVID-19: A Systematic Review and Meta-analysis. Open Forum Infect Dis. 2021 Aug 31;8(9):ofab453. [CrossRef]
- Walker AS, Pritchard E, House T, et al. Ct threshold values, a proxy for viral load in community SARS-CoV-2 cases, demonstrate wide variation across populations and over time. Elife. 2021 Jul 12;10:e64683. [CrossRef]
- Rao SN, Manissero D, Steele VR, Pareja J. A Systematic Review of the Clinical Utility of Cycle Threshold Values in the Context of COVID-19. Infect Dis Ther. 2020 Sep;9(3):573-586. Epub 2020 Jul 28. Erratum in: Infect Dis Ther. 2020 Sep;9(3):587. [CrossRef]
- Choudhuri J, Carter J, Nelson R, Skalina K, Osterbur-Badhey M, Johnston A, Goldstein D, Paroder M, Szymanski J. SARS-CoV-2 PCR cycle threshold at hospital admission associated with patient mortality. PLoS One. 2020 Dec 31;15(12):e0244777. [CrossRef]
- Rabaan AA, Tirupathi R, Sule AA, et al. Viral Dynamics and Real-Time RT-PCR Ct Values Correlation with Disease Severity in COVID-19. Diagnostics (Basel). 2021 Jun 15;11(6):1091. [CrossRef]
- Shoaib N, Iqbal A, Shah FA, et al. Population-level median cycle threshold (Ct) values for asymptomatic COVID-19 cases can predict the trajectory of future cases. PLoS One. 2023 Mar 9;18(3):e0281899. [CrossRef]
- Park J, Cho SI, Kang SG, Kim JW, Jung S, Lee SH, Han KS, Hwang SS. Long-term trends in cycle threshold values: a comprehensive analysis of COVID-19 dynamics, viral load, and reproduction number in South Korea. Front Public Health. 2024 Aug 12;12:1394565. [CrossRef]
- Dehesh P, Baradaran HR, Eshrati B, Motevalian SA, Salehi M, Donyavi T. The Relationship Between Population-Level SARS-CoV-2 Cycle Threshold Values and Trend of COVID-19 Infection: Longitudinal Study. JMIR Public Health Surveill. 2022 Nov 8;8(11):e36424. [CrossRef]
- Yin N, Dellicour S, Daubie V, Franco N, Wautier M, Faes C, Van Cauteren D, Nymark L, Hens N, Gilbert M, Hallin M, Vandenberg O. Leveraging of SARS-CoV-2 PCR Cycle Thresholds Values to Forecast COVID-19 Trends. Front Med (Lausanne). 2021 Nov 1;8:743988. [CrossRef]
- Cava F, San Román J, Barreiro P, et al. Temporal Series Analysis of Population Cycle Threshold Counts as a Predictor of Surge in Cases and Hospitalizations during the SARS-CoV-2 Pandemic. Viruses. 2023 Feb 2;15(2):421. [CrossRef]
- Musalkova D, Piherova L, Kwasny O, et al. Trends in SARS-CoV-2 cycle threshold values in the Czech Republic from April 2020 to April 2022. Sci Rep. 2023 Apr 15;13(1):6156. [CrossRef]
- Phillips MC, Quintero D, Wald-Dickler N, Holtom P, Butler-Wu SM. SARS-CoV-2 cycle threshold (Ct) values predict future COVID-19 cases. J Clin Virol. 2022 Jun;150-151:105153. Epub 2022 Apr 8. [CrossRef]
- Crits-Christoph A, Kantor RS, Olm MR, et al. Genome Sequencing of Sewage Detects Regionally Prevalent SARS-CoV-2 Variants. mBio. 2021 Jan 19;12(1):e02703-20. [CrossRef]
- Hay JA, Kennedy-Shaffer L, Kanjilal S, et al. Estimating epidemiologic dynamics from cross-sectional viral load distributions. Science. 2021 Jul 16;373(6552):eabh0635. Epub 2021 Jun 3. [CrossRef]
- Instituto de Información Estadística y Geográfica de Jalisco. Estructura Demográfica de la Población Jalisco, 2024-2030 [Internet]. Jalisco: Instituto de Información Estadística y Geográfica de Jalisco; 2024 [citado 2024 Dic 16]. Disponible en: https://iieg.gob.mx/ns/wp-content/uploads/2024/08/EstructuraDemogr%C3%A1ficaPoblaci%C3%B3n2024.pdf.
- Gobierno del Estado de Jalisco. Listado de unidades de salud en el estado de Jalisco, año 2024 [Internet]. Guadalajara: Gobierno del Estado de Jalisco; 2024 [citado el 17 dic 2024]. Disponible en: https://datos.jalisco.gob.mx/dataset/listado-de-unidades-de-salud-en-el-estado-de-jalisco-ano-2024/resource/1b15379b-4d65-4ad9.
- Servicios de Salud Jalisco. Programa Anual de Trabajo 2023 [Internet]. Jalisco: OPD Servicios de Salud Jalisco; 2023 [citado 2024 Dic 16]. Disponible en: https://transparenciasitgej.jalisco.gob.mx/api/api/banco_archivos/76178/downloadWeb.
- Dirección General de Epidemiología. Lineamiento estandarizado para la vigilancia epidemiológica y por laboratorio de la enfermedad respiratoria viral [Internet]. Ciudad de México: Secretaría de Salud; [fecha desconocida] [citado 2024 Dic 14]. Disponible en: https://epidemiologia.salud.gob.mx/gobmx/salud/documentos/manuales/12_Manual_VE_Influenza.pdf.
- Gobierno del Estado de Jalisco. Databases—COVID-19 [Internet]. Jalisco: Gobierno del Estado de Jalisco; 2024 [citado 2024 Nov 18]. Disponible en: https://datos.jalisco.gob.mx/dataset/casos-registrados-covid-19-radar-jalisco-enero-diciembre-2024.
- Secretaría de Salud de México. Open Data: Historical Databases—General Directorate of Epidemiology [Internet]. Ciudad de México: Secretaría de Salud de México; 2024 [citado 2024 Dic 17]. Disponible en: https://www.gob.mx/salud/documentos/datos-abiertos-152127.
- Sala E, Shah IS, Manissero D, Juanola-Falgarona M, Quirke AM, Rao SN. Systematic Review on the Correlation Between SARS-CoV-2 Real-Time PCR Cycle Threshold Values and Epidemiological Trends. Infect Dis Ther. 2023 Mar;12(3):749-775. Epub 2023 Feb 22. [CrossRef]
- Lin Y, Yang B, Cobey S, et al. Incorporating temporal distribution of population-level viral load enables real-time estimation of COVID-19 transmission. Nat Commun. 2022 Mar 3;13(1):1155. [CrossRef]
- Modes ME, Directo MP, Melgar M, et al. Clinical Characteristics and Outcomes Among Adults Hospitalized with Laboratory-Confirmed SARS-CoV-2 Infection During Periods of B.1.617.2 (Delta) and B.1.1.529 (Omicron) Variant Predominance - One Hospital, California, July 15-September 23, 2021, and December 21, 2021-January 27, 2022. MMWR Morb Mortal Wkly Rep. 2022 Feb 11;71(6):217-223. [CrossRef]
- Iuliano AD, Brunkard JM, Boehmer TK, et al. Trends in Disease Severity and Health Care Utilization During the Early Omicron Variant Period Compared with Previous SARS-CoV-2 High Transmission Periods — United States, December 2020–January 2022. MMWR Morb Mortal Wkly Rep 2022;71:146–152. [CrossRef]
- Moghadas SM, Vilches TN, Zhang K, Wells CR, Shoukat A, Singer BH, Meyers LA, Neuzil KM, Langley JM, Fitzpatrick MC, Galvani AP. The Impact of Vaccination on Coronavirus Disease 2019 (COVID-19) Outbreaks in the United States. Clin Infect Dis. 2021 Dec 16;73(12):2257-2264. [CrossRef]
- Scobie HM, Johnson AG, Suthar AB, et al. Monitoring Incidence of COVID-19 Cases, Hospitalizations, and Deaths, by Vaccination Status - 13 U.S. Jurisdictions, April 4-July 17, 2021. MMWR Morb Mortal Wkly Rep. 2021 Sep 17;70(37):1284-1290. [CrossRef]
- Kodera S, Ueta H, Unemi T, Nakata T, Hirata A. Population-Level Immunity for Transient Suppression of COVID-19 Waves in Japan from April 2021 to September 2022. Vaccines (Basel). 2023 Sep 4;11(9):1457. [CrossRef]
- Chi H, Chiu NC, Chen CC, et al. To PCR or not? The impact of shifting policy from PCR to rapid antigen tests to diagnose COVID-19 during the omicron epidemic: a nationwide surveillance study. Front Public Health. 2023 Jul 20;11:1148637. [CrossRef] [PubMed] [PubMed Central]
- Woodbridge Y, Goldberg Y, Amit S, Kopelman NM, Mandel M, Huppert A. Public health-focused use of COVID-19 rapid antigen and PCR tests. Sci Rep. 2024 Jan 16;14(1):1430. [CrossRef]
- Mohammadie ZE, Akhlaghi S, Samaeinasab S, Shaterzadeh-Bojd S, Jamialahmadi T, Sahebkar A. Clinical performance of rapid antigen tests in comparison to RT-PCR for SARS-COV-2 diagnosis in Omicron variant: A systematic review and meta-analysis. Rev Med Virol. 2023 Mar;33(2):e2428. Epub 2023 Feb 15. [CrossRef]
- Pitzer VE, Chitwood M, Havumaki J, Menzies NA, Perniciaro S, Warren JL, Weinberger DM, Cohen T. The Impact of Changes in Diagnostic Testing Practices on Estimates of COVID-19 Transmission in the United States. Am J Epidemiol. 2021 Sep 1;190(9):1908-1917. [CrossRef]
- Van Gordon MM, McCarthy KA, Proctor JL, Hagedorn BL. Evaluating COVID-19 reporting data in the context of testing strategies across 31 low- and middle-income countries. Int J Infect Dis. 2021 Sep;110:341-352. Epub 2021 Jul 23. [CrossRef]
- Klaassen F, Chitwood MH, Cohen T, et al. Changes in Population Immunity Against Infection and Severe Disease From Severe Acute Respiratory Syndrome Coronavirus 2 Omicron Variants in the United States Between December 2021 and November 2022. Clin Infect Dis. 2023 Aug 14;77(3):355-361. [CrossRef]
- Liu LT, Chiou SS, Chen PC, et al. Epidemiology and analysis of SARS-CoV-2 Omicron subvariants BA.1 and 2 in Taiwan. Sci Rep. 2023 Oct 3;13(1):16583. Erratum in: Sci Rep. 2024 Nov 7;14(1):27148. [CrossRef]
- Makov-Assif M, Krispin S, Ben-Shlomo Y, Holander T, Dagan N, Balicer R, Barda N. The association between real-time reverse transcriptase polymerase chain reaction cycle threshold values, symptoms and disease severity among COVID-19 patients in the community: a retrospective cohort study. Infect Dis (Lond). 2022 Mar;54(3):205-212. Epub 2021 Nov 7. [CrossRef]
- Wright J, Achana F, Diwakar L, et al. Cycle threshold values are inversely associated with poorer outcomes in hospitalized patients with COVID-19: a prospective, observational cohort study conducted at a UK tertiary hospital. Int J Infect Dis. 2021 Oct;111:333-335. Epub 2021 Aug 14. [CrossRef]
- Euser S, Aronson S, Manders I, et al. SARS-CoV-2 viral-load distribution reveals that viral loads increase with age: a retrospective cross-sectional cohort study. Int J Epidemiol. 2022 Jan 6;50(6):1795-1803. Epub 2021 Sep 8. [CrossRef] [PubMed] [PubMed Central]
- Sangineto M, Arena F, De Nittis R, Villani R, Gallo C, Serviddio G. Temporal profile of SARS-CoV-2 viral load in posterior nasopharyngeal samples: Analysis of 944 patients in Apulia, Italy. Int J Infect Dis. 2021 Mar;104:696-700. Epub 2021 Feb 2. [CrossRef]
- Abdulrahman A, Mallah SI, Alawadhi A, Perna S, Janahi EM, AlQahtani MM. Association between RT-PCR Ct values and COVID-19 new daily cases: a multicenter cross-sectional study. Infez Med. 2021 Sep 10;29(3):416-426. [CrossRef]
- Alizon S, Selinger C, Sofonea MT, et al. Epidemiological and clinical insights from SARS-CoV-2 RT-PCR crossing threshold values, France, January to November 2020. Euro Surveill. 2022 Feb;27(6):2100406. 20 November. [CrossRef]
- Andriamandimby SF, Brook CE, Razanajatovo N, et al. Cross-sectional cycle threshold values reflect epidemic dynamics of COVID-19 in Madagascar. Epidemics. 2022 Mar;38:100533. Epub 2021 Nov 29. [CrossRef]
- Avadhanula V, Nicholson EG, Ferlic-Stark L, et al. Viral Load of Severe Acute Respiratory Syndrome Coronavirus 2 in Adults During the First and Second Wave of Coronavirus Disease 2019 Pandemic in Houston, Texas: The Potential of the Superspreader. J Infect Dis. 2021 May 20;223(9):1528-1537. [CrossRef]
- Calistri P, Danzetta ML, Amato L, et al. Epidemiological Significance of SARS-CoV-2 RNA Dynamic in Naso-Pharyngeal Swabs. Microorganisms. 2021 Jun 10;9(6):1264. [CrossRef]
- Khalil A, Al Handawi K, Mohsen Z, Abdel Nour A, Feghali R, Chamseddine I, Kokkolaras M. Weekly Nowcasting of New COVID-19 Cases Using Past Viral Load Measurements. Viruses. 2022 Jun 28;14(7):1414. [CrossRef]
- Mishra B, Ranjan J, Purushotham P, et al. High proportion of low cycle threshold value as an early indicator of COVID-19 surge. J Med Virol. 2022 Jan;94(1):240-245. Epub 2021 Sep 15. [CrossRef]
- El Zein S, Chehab O, Kanj A, et al. SARS-CoV-2 infection: Initial viral load (iVL) predicts severity of illness/outcome, and declining trend of iVL in hospitalized patients corresponds with slowing of the pandemic. PLoS One. 2021 Sep 16;16(9):e0255981. [CrossRef]
- Penney JA, Jung AW, Koethe BC, Doron SI. Utility of the cycle threshold in anticipating the next phase of the coronavirus disease 2019 (COVID-19) pandemic. Infect Control Hosp Epidemiol. 2022 Jun;43(6):800-801. Epub 2022 Feb 22. [CrossRef]
- Stevens R, Pratama R, Naing Z, Condylios A. Analysis of SARS-CoV-2 real-time PCR test CT values across a population may afford useful information to assist public health efforts and add refinement to epidemiological models. Pathology. 2022 Oct;54(6):800-802. Epub 2022 Aug 6. [CrossRef]
- Tso CF, Garikipati A, Green-Saxena A, Mao Q, Das R. Correlation of Population SARS-CoV-2 Cycle Threshold Values to Local Disease Dynamics: Exploratory Observational Study. JMIR Public Health Surveill. 2021 Jun 3;7(6):e28265. [CrossRef]
- Fan G, Jin Y, Wang Q, Yue Y. Assessing the comparability of cycle threshold values derived from five external quality assessment rounds for omicron nucleic acid testing. Virol J. 2023 Jun 8;20(1):119. [CrossRef]
- Gavina K, Franco LC, Robinson CM, et al. Standardization of SARS-CoV-2 Cycle Threshold Values: Multisite Investigation Evaluating Viral Quantitation across Multiple Commercial COVID-19 Detection Platforms. Microbiol Spectr. 2023 Feb 14;11(1):e0447022. Epub 2023 Jan 18. [CrossRef]
Figure 1.
Flowchart of cases and tests selection.
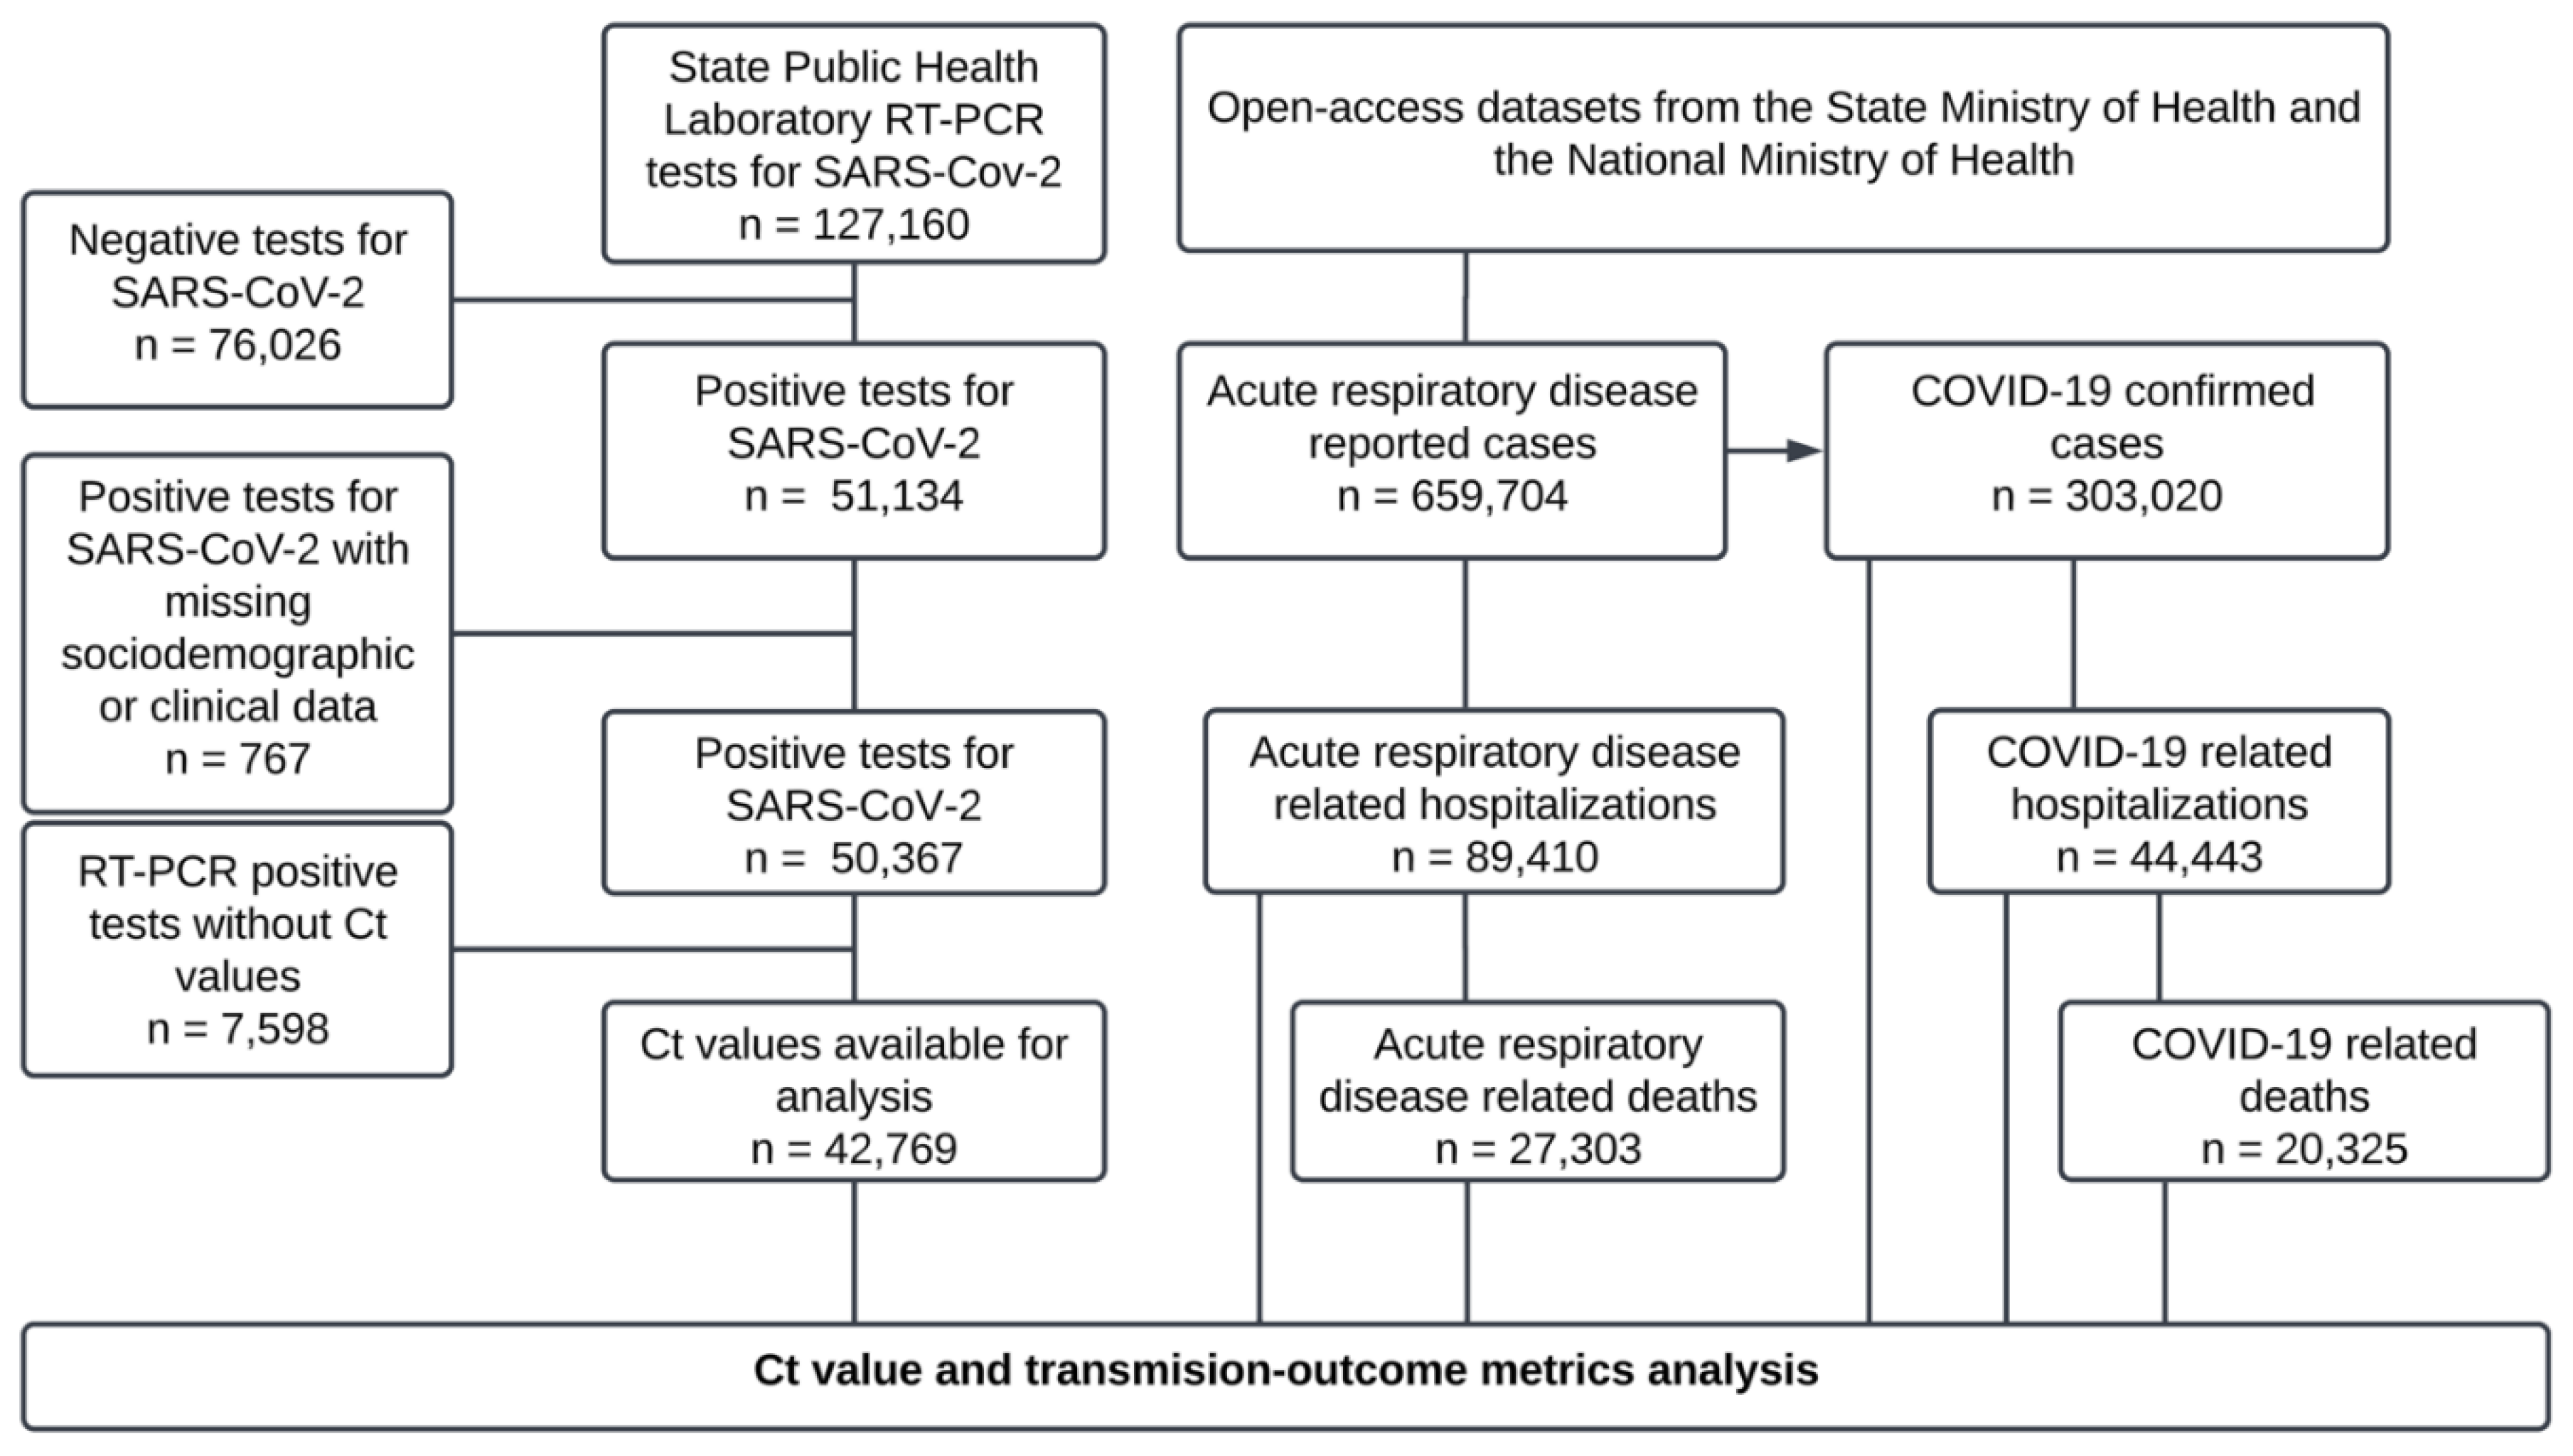
Figure 2.
Geographic distribution of SARS-CoV-2-positive tests across the 13 health regions of Jalisco, Mexico.
Figure 2.
Geographic distribution of SARS-CoV-2-positive tests across the 13 health regions of Jalisco, Mexico.
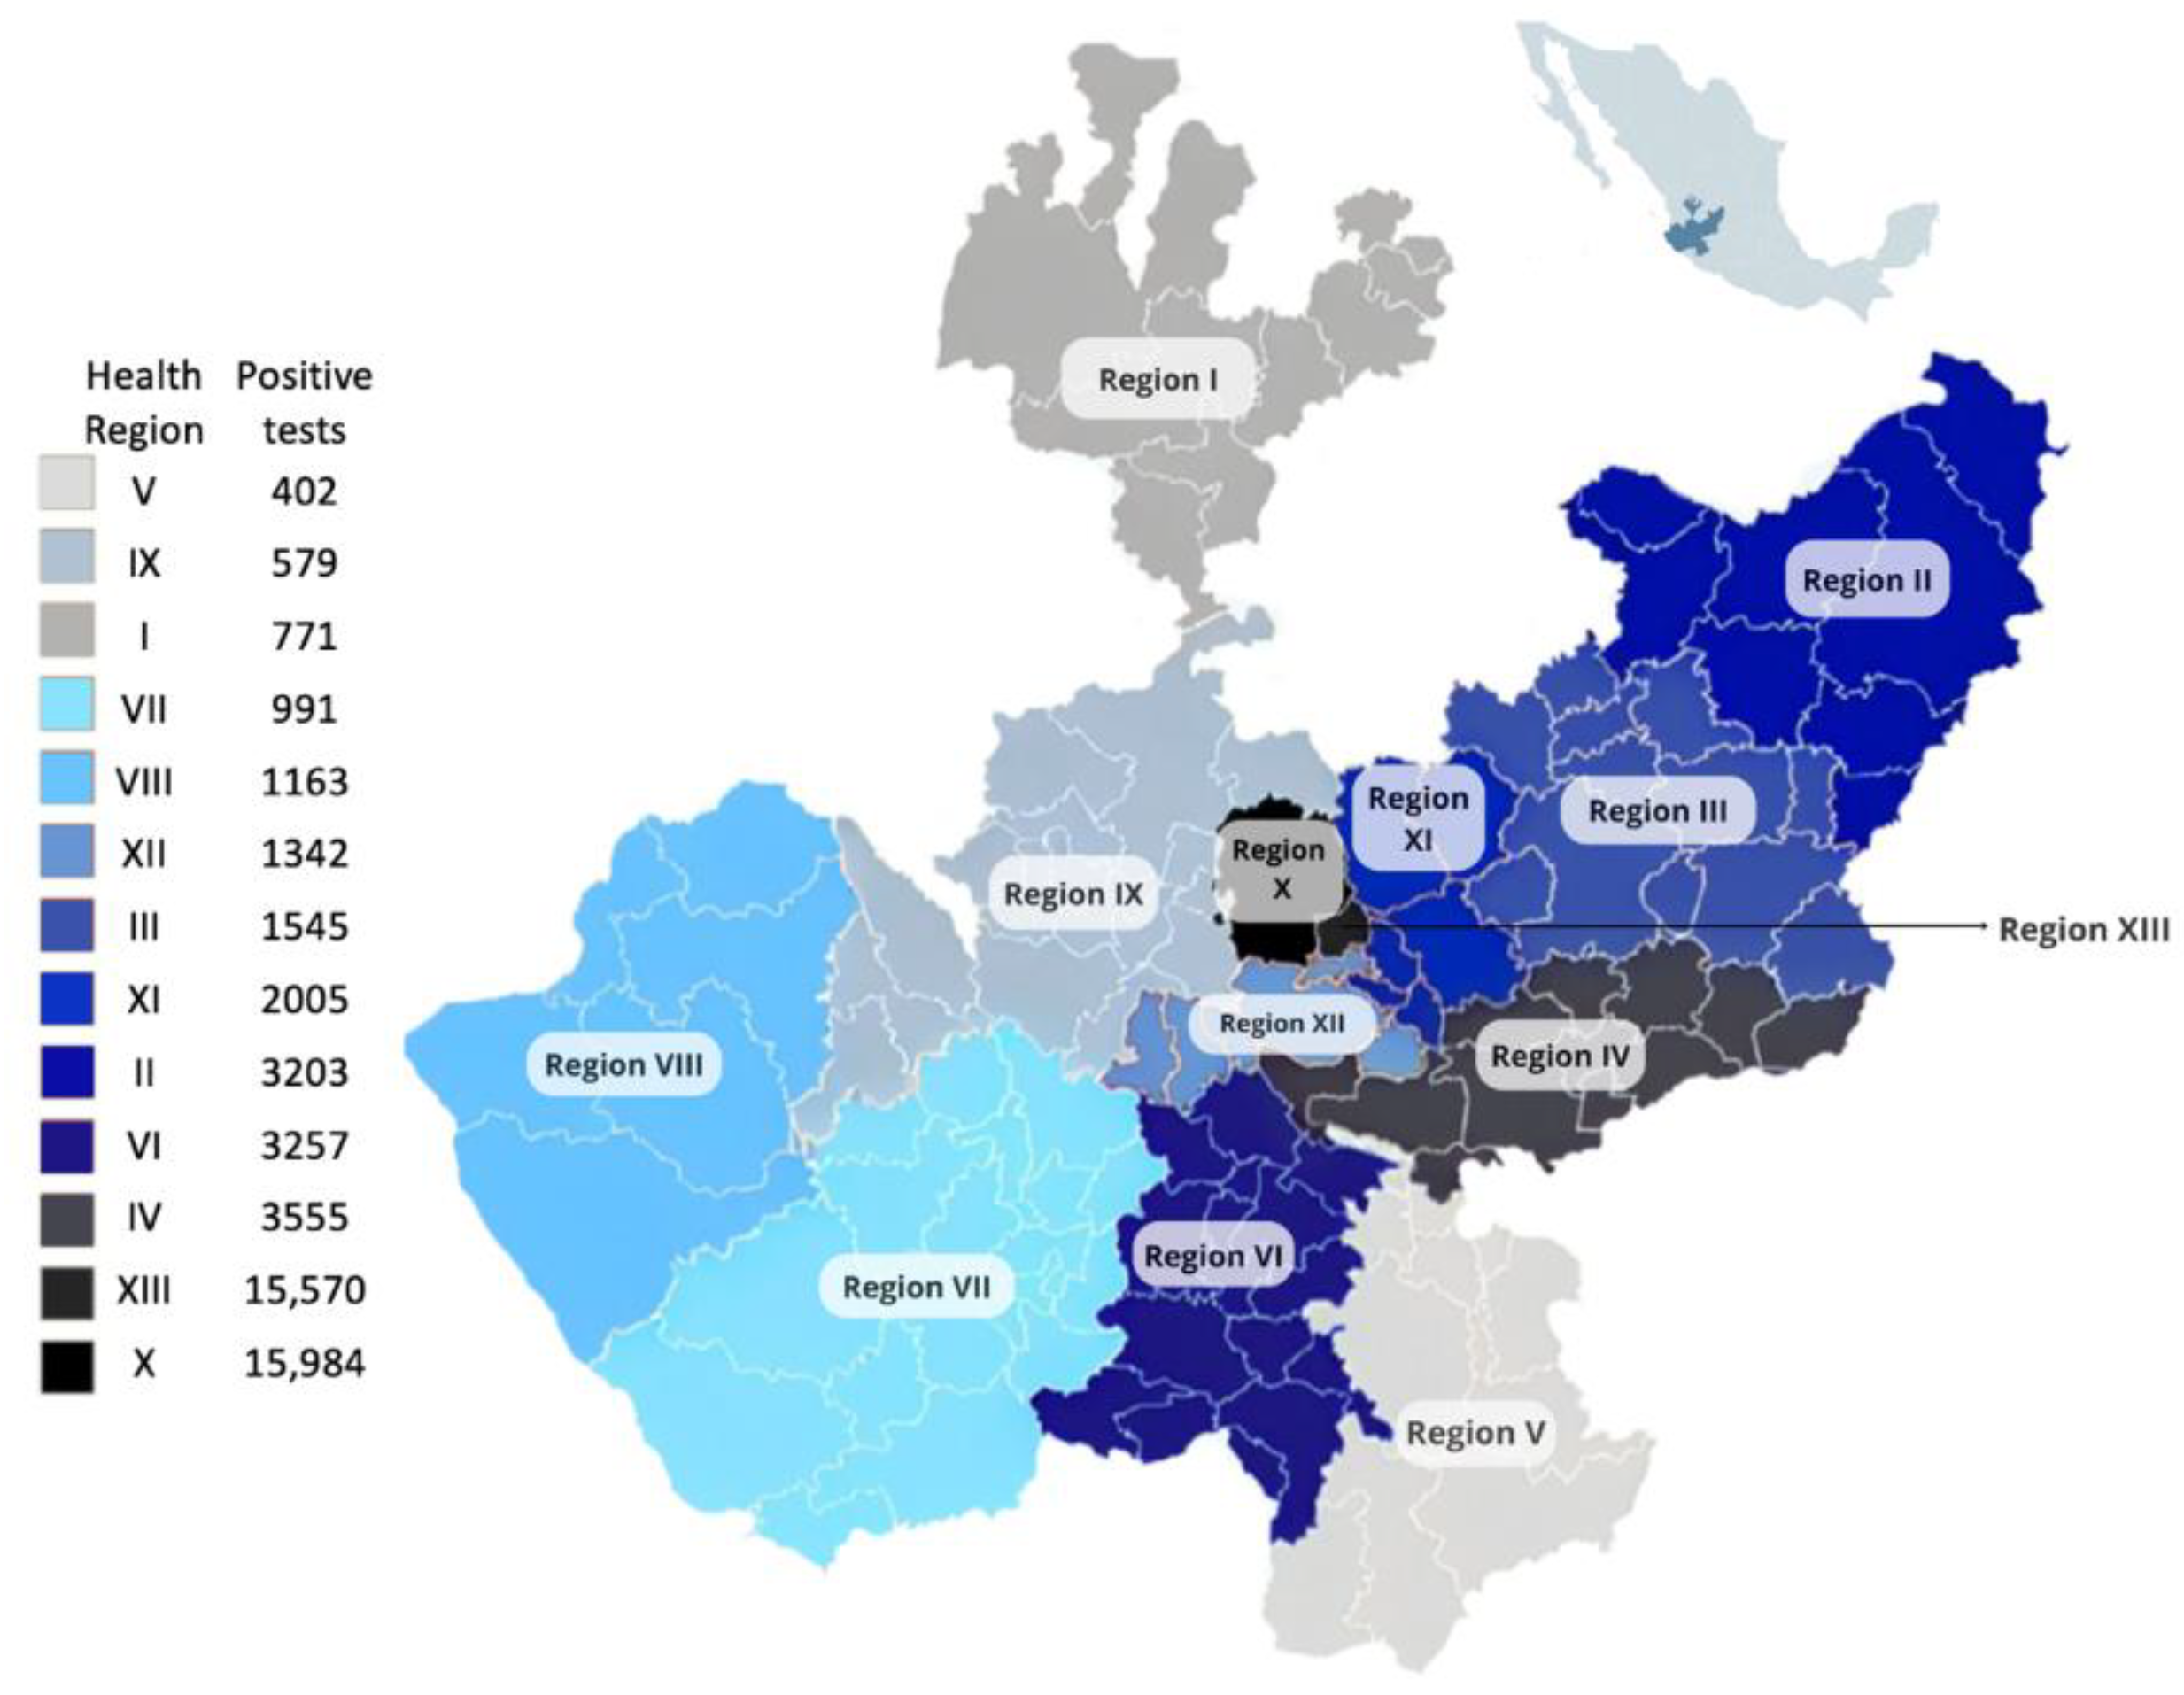
Figure 4.
Median Ct values from the SPHLJ positive SARS-CoV-2 RT-PCR tests and their relationship with acute respiratory disease and COVID‒19 metrics: (a) median Ct values alongside positive tests, confirmed cases, and outcomes; (b) median Ct values alongside the SPHLJ SARS-CoV-2 RT-PCR positivity rate, Statewide SARS-CoV-2 tests positivity rate, and Statewide SARS-CoV-2 tests positivity rate from RT‒PCR and antigen tests; (c) median Ct values alongside the effective reproduction number (Rt). Ct: cycle threshold; Rt: effective reproduction number; SPHLJ: State Public Health Laboratory of Jalisco.
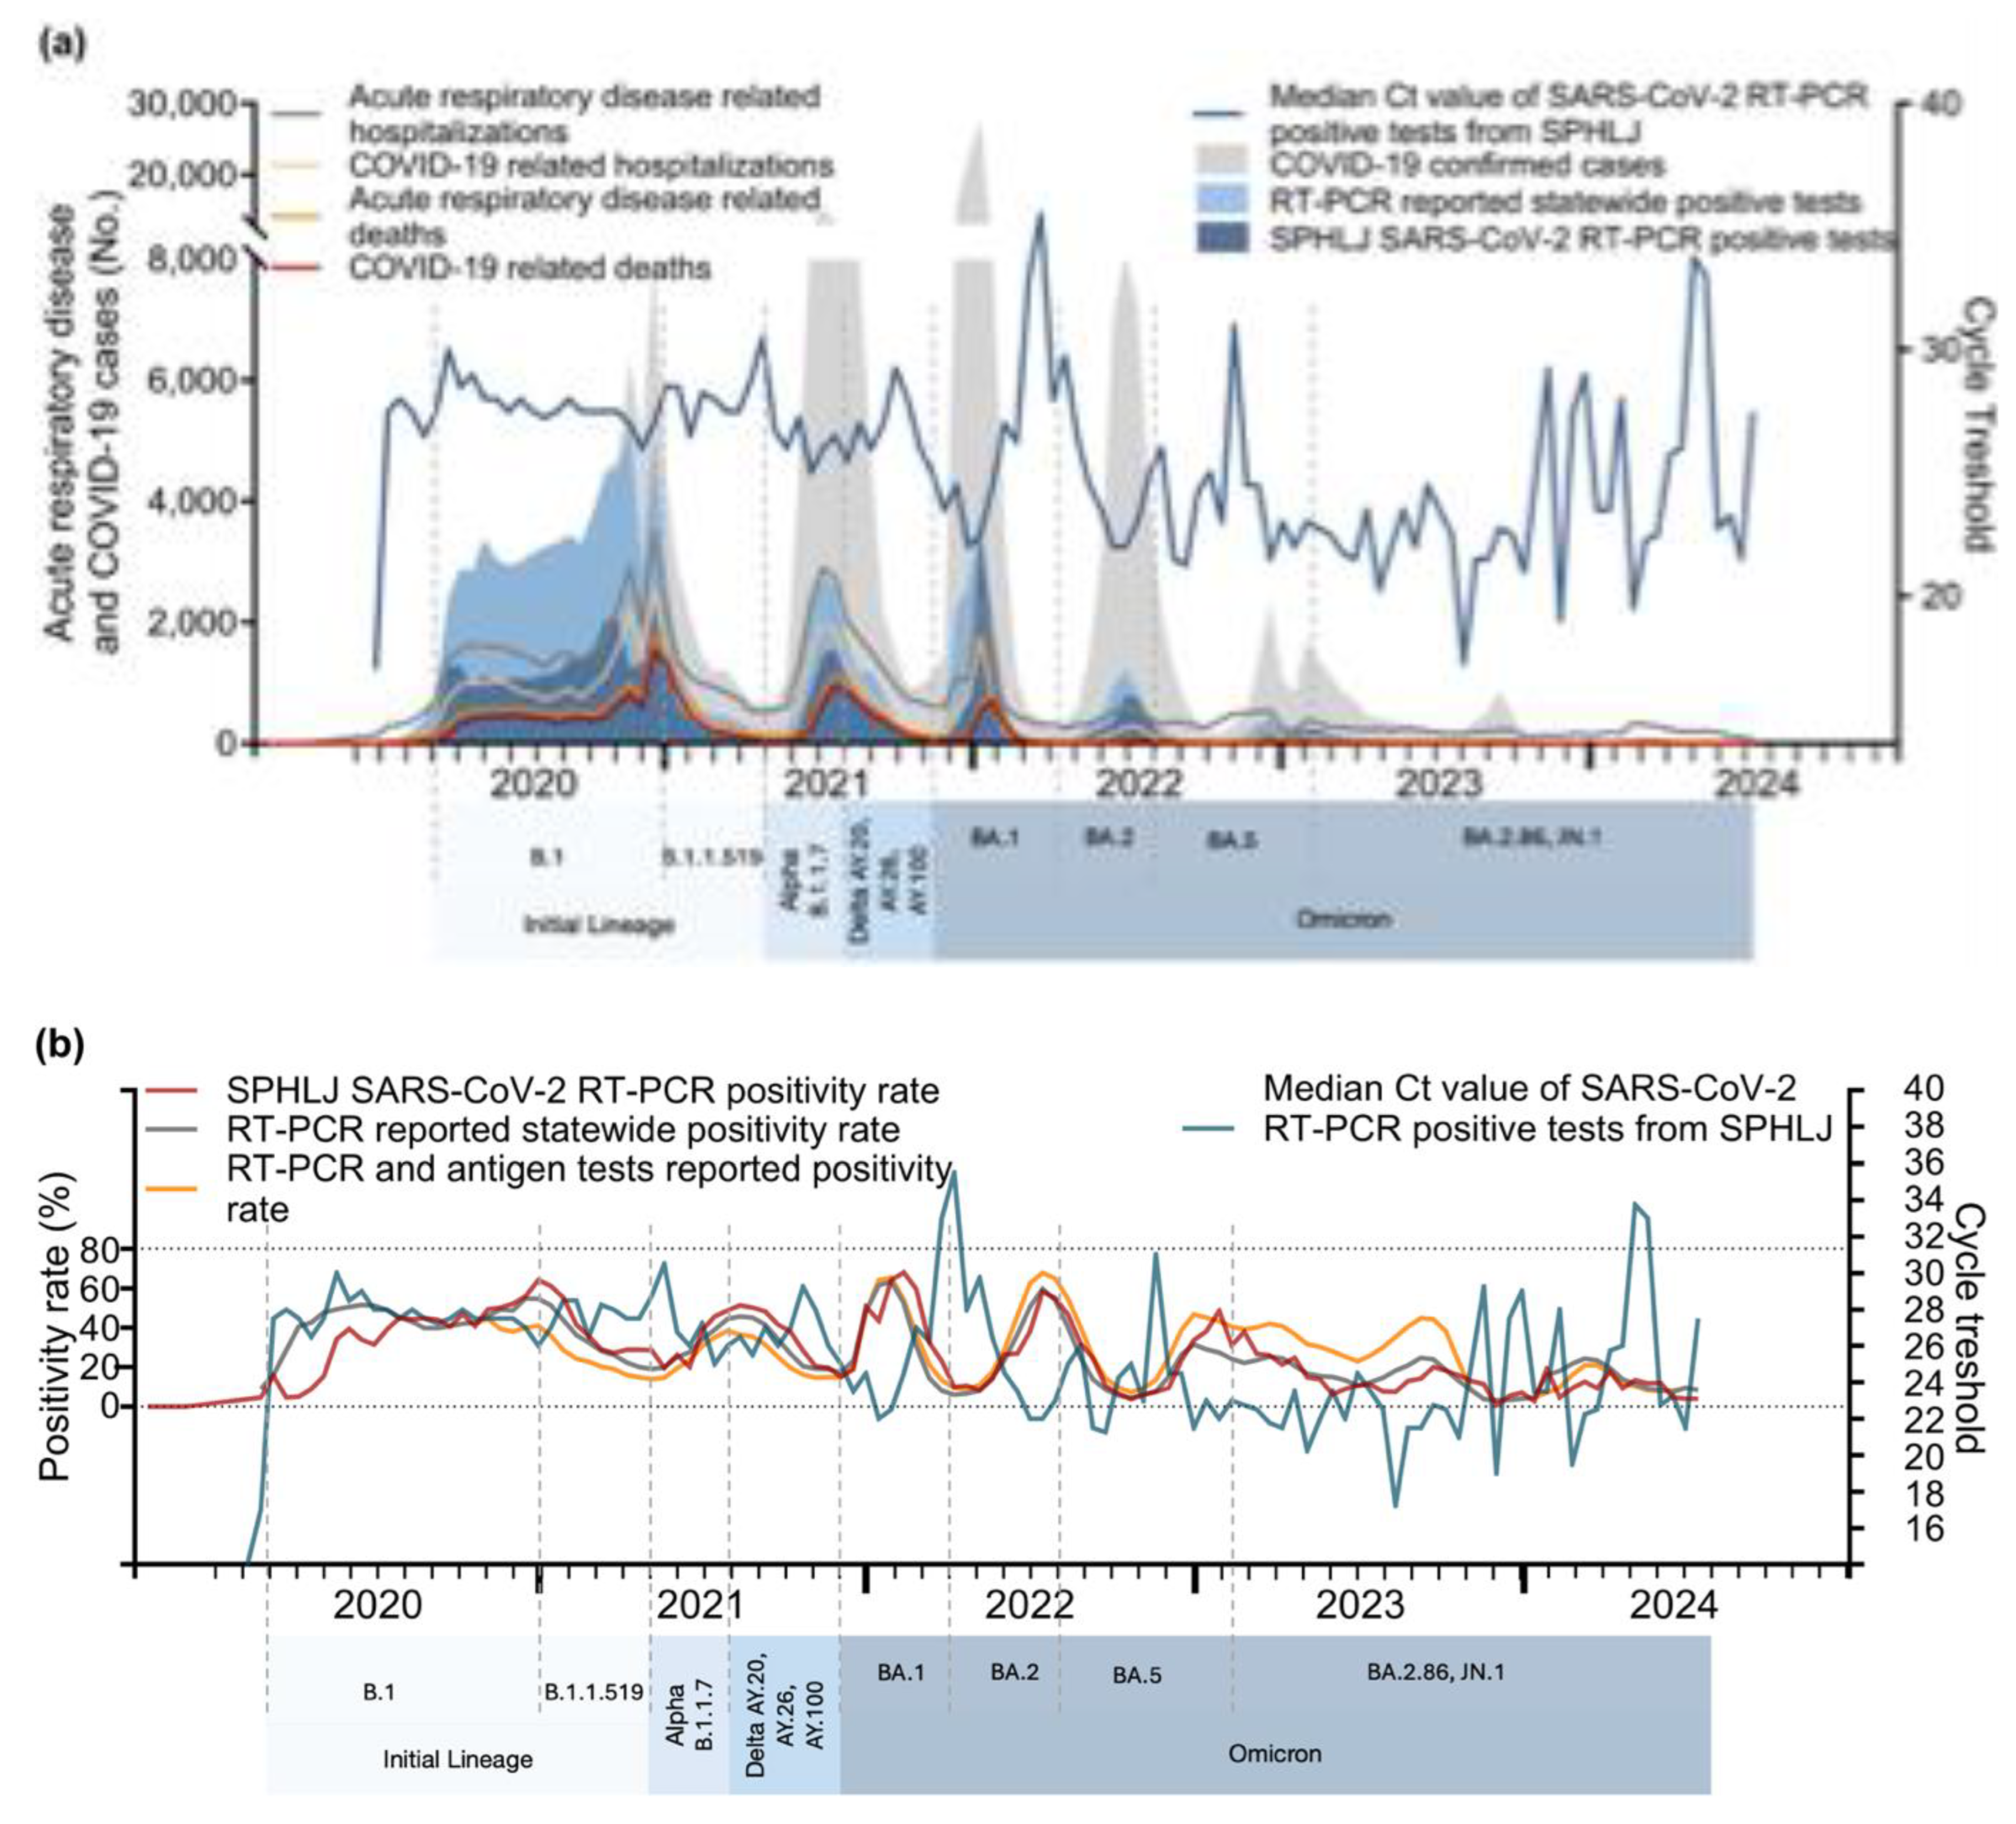
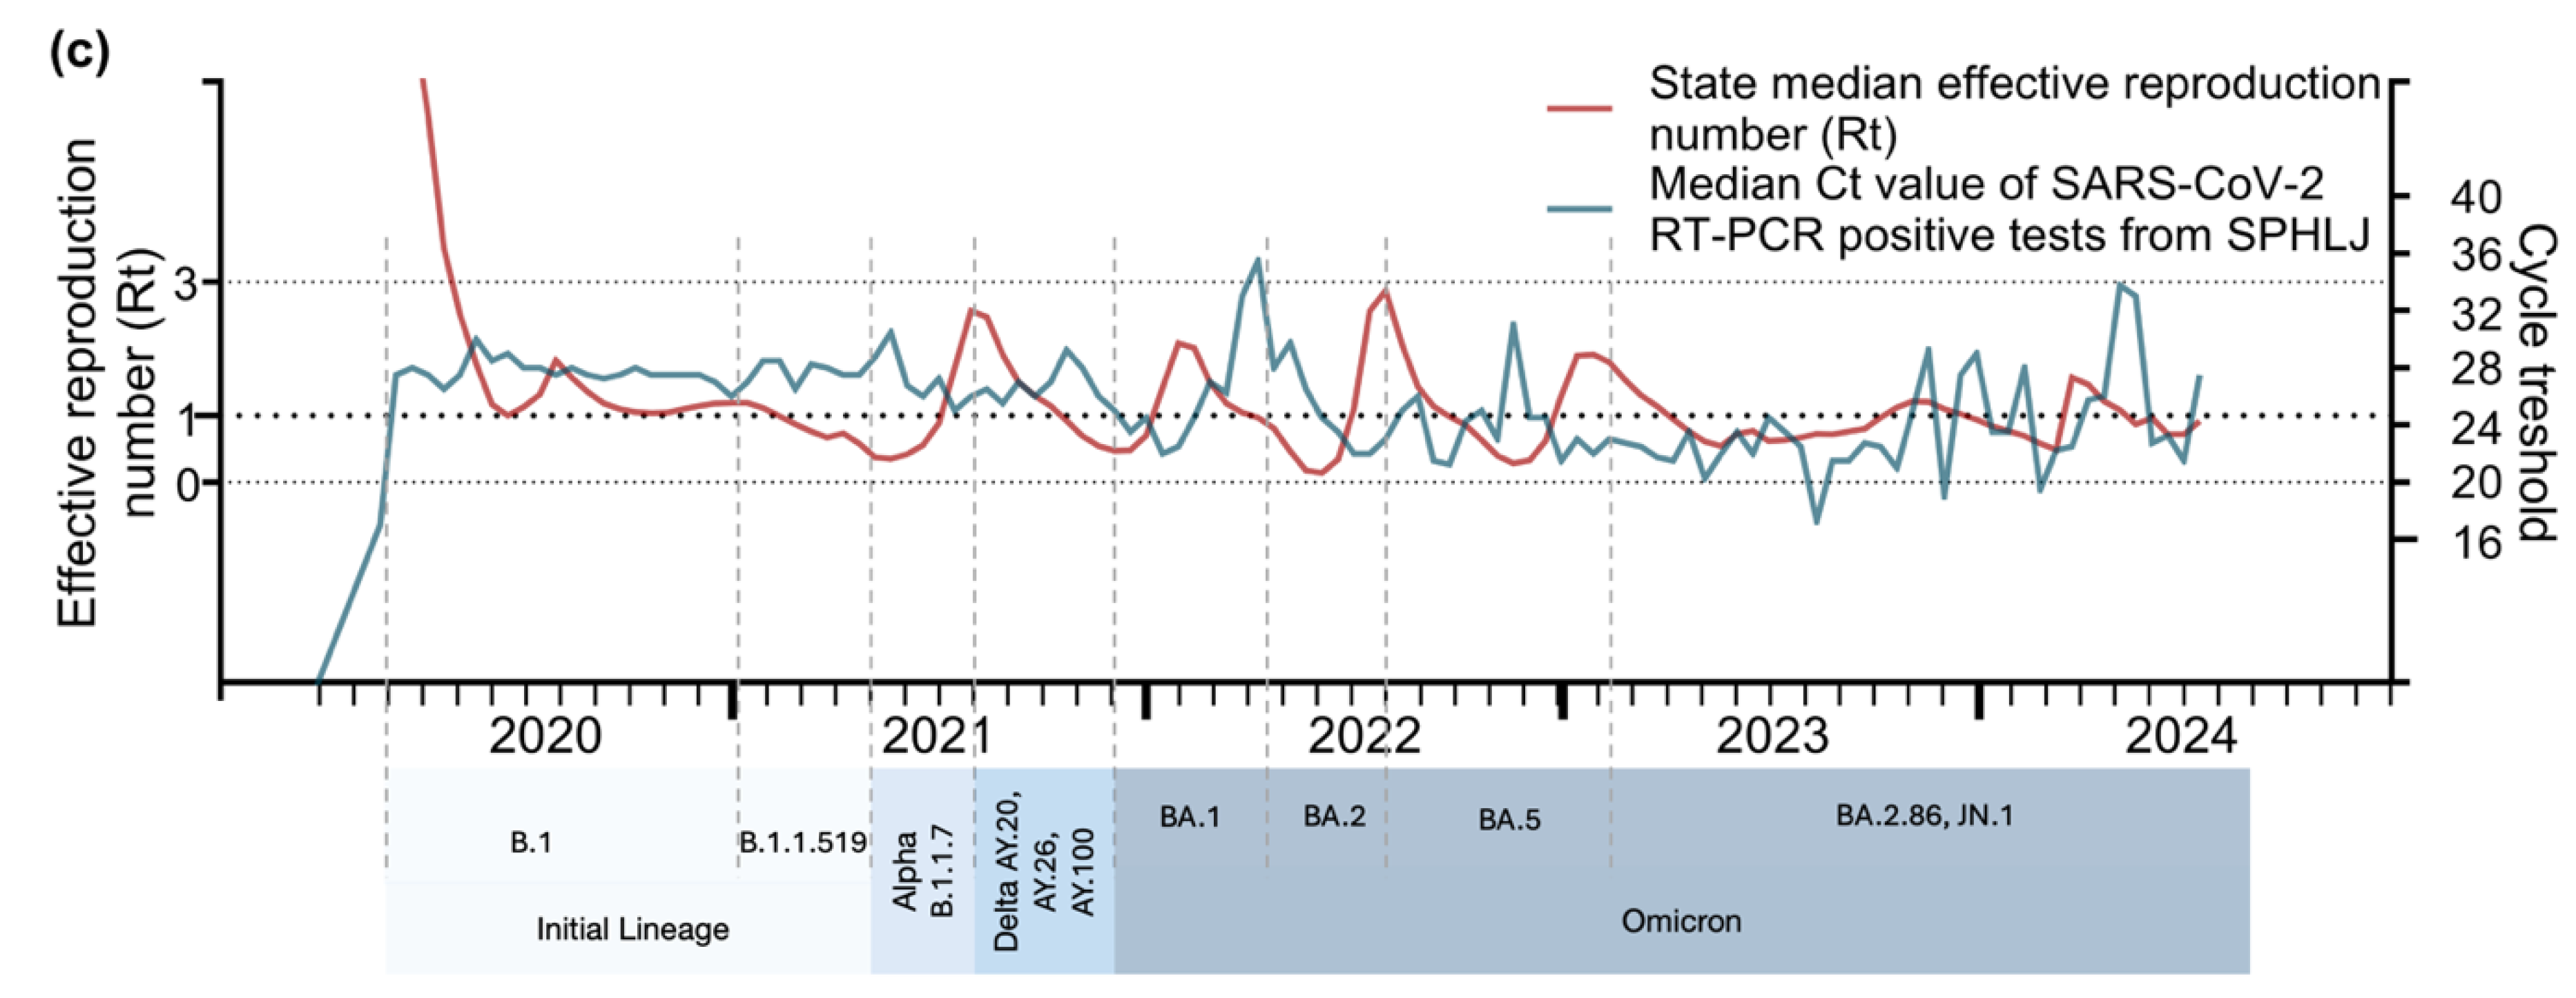
Figure 5.
Cross-correlation analysis of COVID-19 metrics and Ct lag across the studied time periods. *Includes positive RT‒PCR and rapid antigen tests.
Figure 5.
Cross-correlation analysis of COVID-19 metrics and Ct lag across the studied time periods. *Includes positive RT‒PCR and rapid antigen tests.
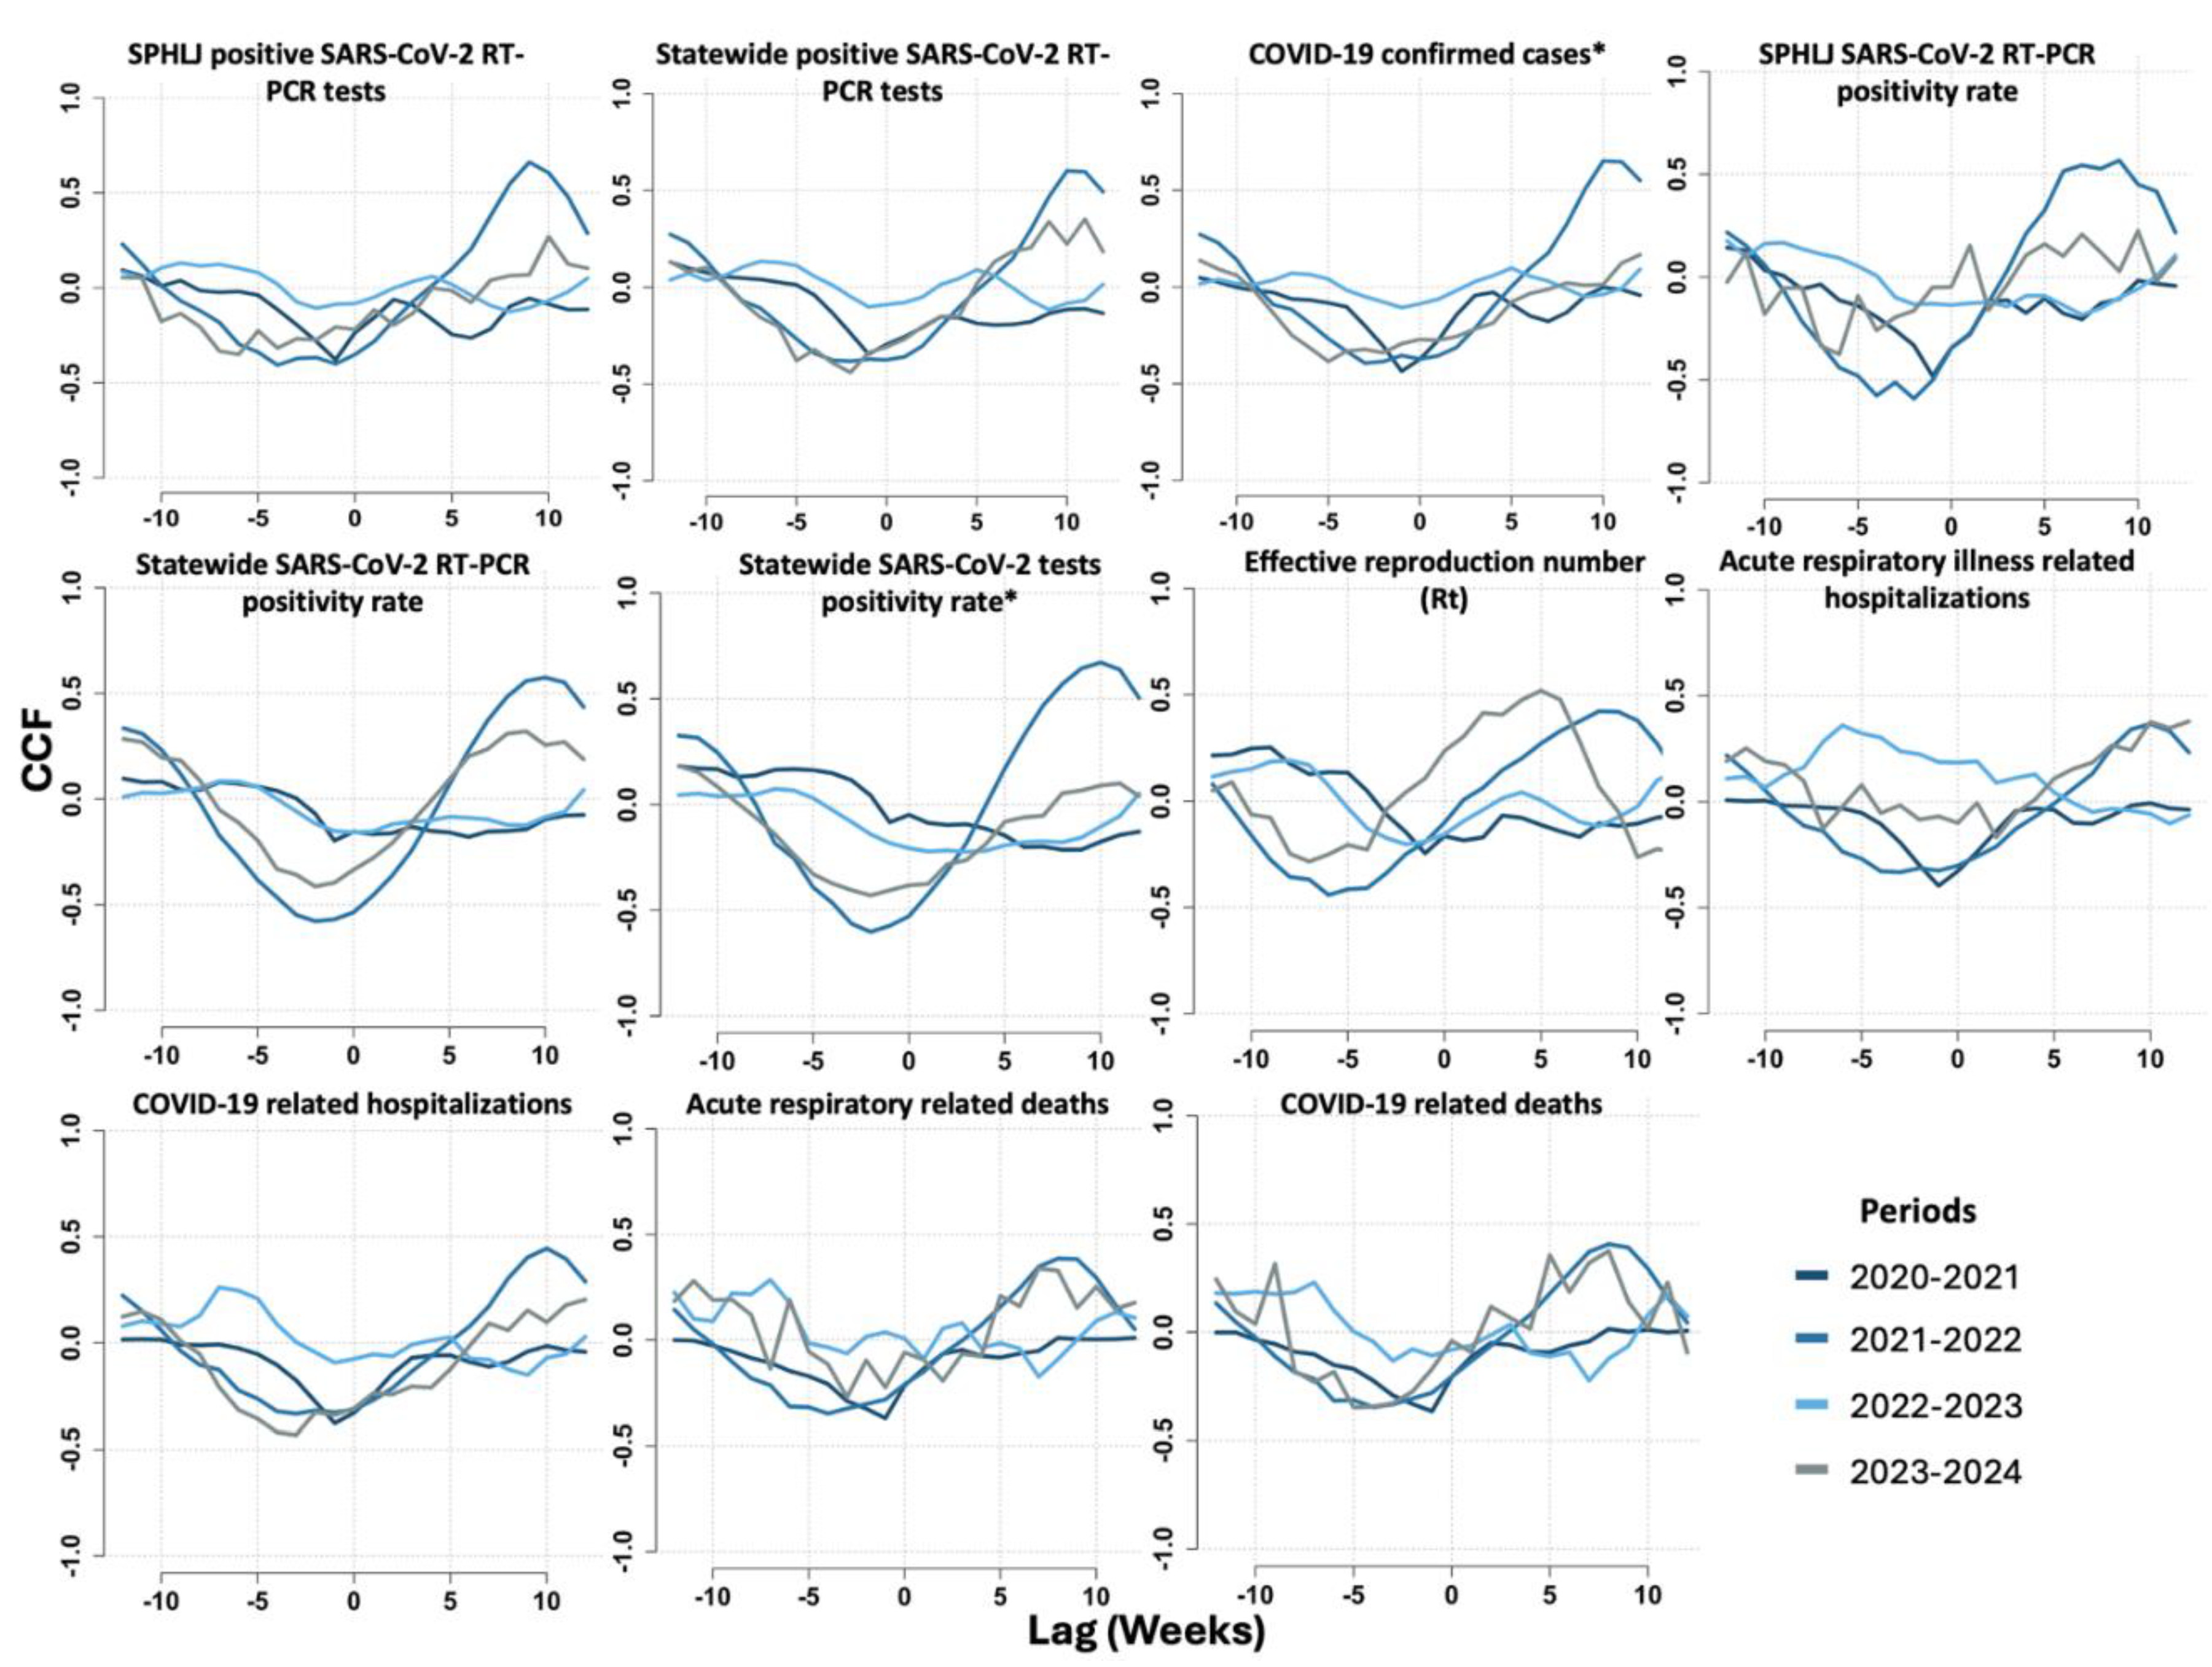
Figure 6.
Lagged regression analysis of Ct values and COVID-19 transmission and outcome metrics. *Includes positive RT‒PCR and rapid antigen tests.
Figure 6.
Lagged regression analysis of Ct values and COVID-19 transmission and outcome metrics. *Includes positive RT‒PCR and rapid antigen tests.
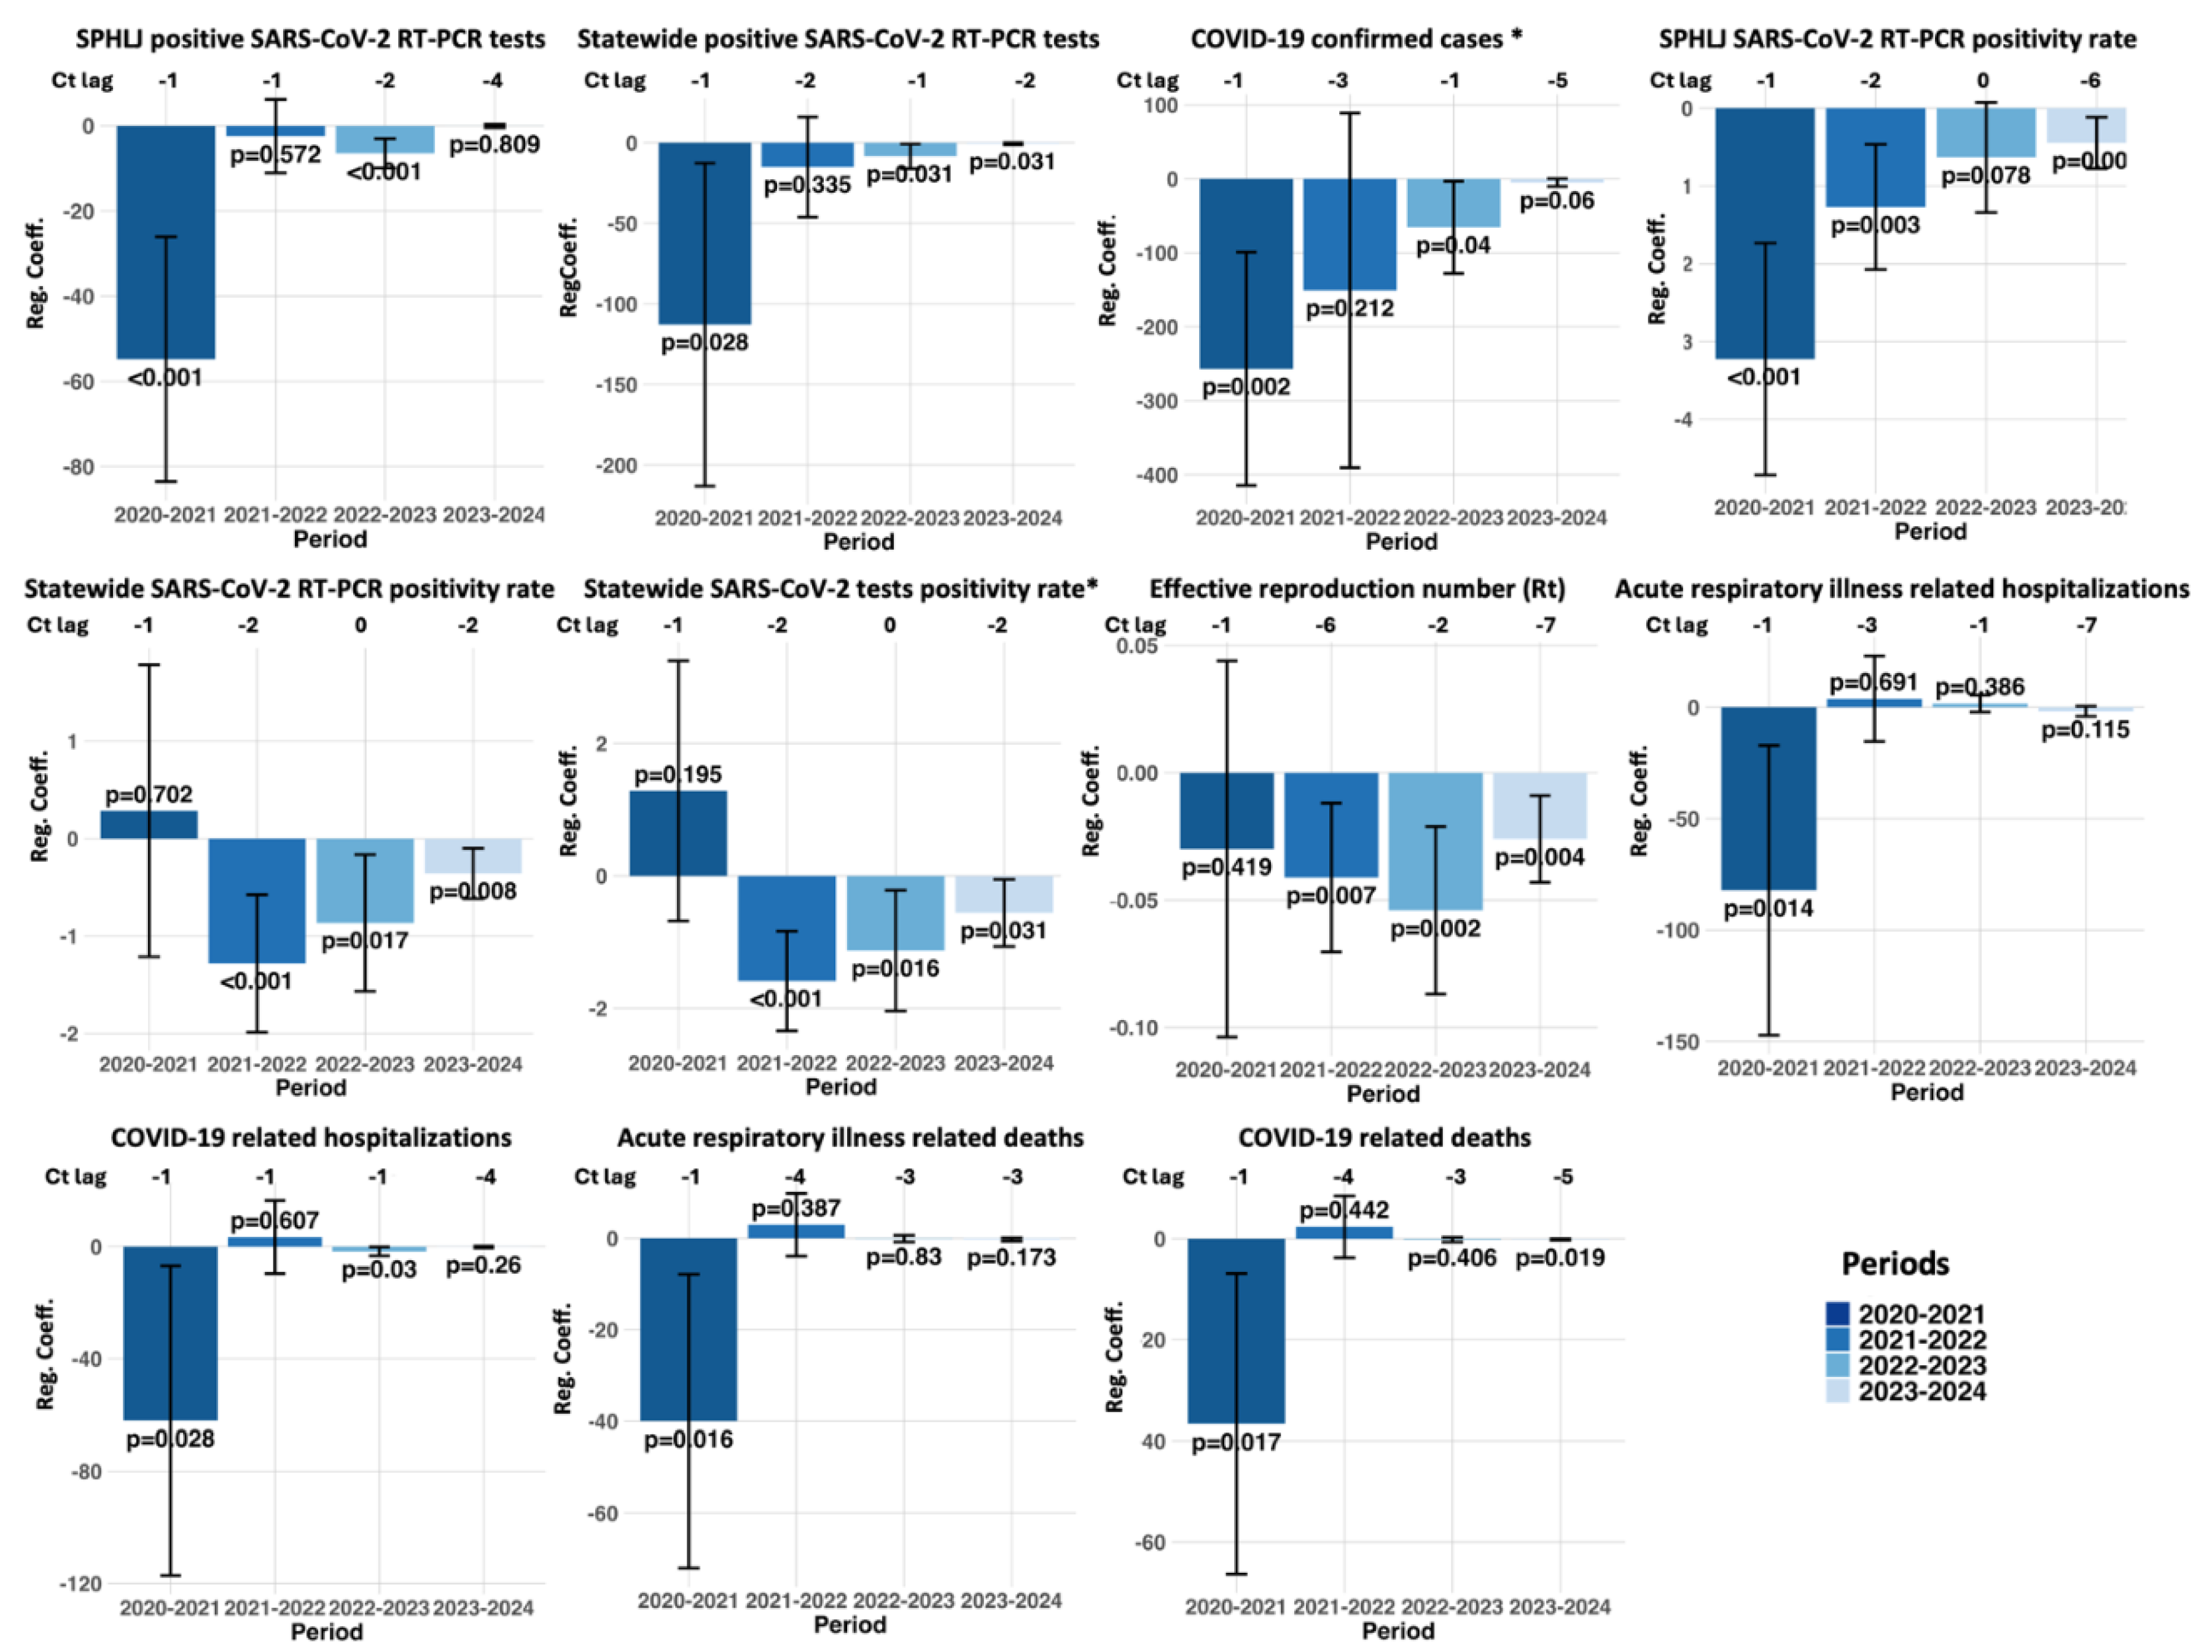

Table 1.
Distribution by age and sex of individuals with RT‒PCR-positive tests at the SPHLJ during the study period.
Table 1.
Distribution by age and sex of individuals with RT‒PCR-positive tests at the SPHLJ during the study period.
| 2020 | 2021 | 2022 | 2023 | 2024 | |||||||
|---|---|---|---|---|---|---|---|---|---|---|---|
| n | % | n | % | n | % | n | % | n | % | p value | |
| Sex | |||||||||||
| Women | 10,853 | 50.09 | 8062 | 51.20 | 6563 | 58.96 | 1043 | 62.64 | 103 | 50.49 | <0.001 |
| Men | 10,814 | 49.91 | 7638 | 48.80 | 4568 | 41.04 | 622 | 37.36 | 101 | 49.51 | |
| Age | |||||||||||
| 0-2 | 313 | 1.44 | 115 | 0.73 | 175 | 1.57 | 100 | 6.01 | 36 | 17.65 | <0.001 |
| 2 - 5 | 43 | 0.20 | 38 | 0.24 | 72 | 0.65 | 28 | 1.68 | 6 | 2.94 | |
| 5 - 18 | 585 | 2.70 | 700 | 4.46 | 709 | 6.37 | 77 | 4.62 | 18 | 8.82 | |
| 18-65 | 17,806 | 82.18 | 11,956 | 76.15 | 9065 | 81.44 | 1243 | 74.65 | 91 | 44.61 | |
| > 65 | 2920 | 13.48 | 2891 | 18.41 | 1110 | 9.97 | 217 | 13.03 | 53 | 25.98 | |
| Total | 21,667 | 100.00 | 15,700 | 100.00 | 11,131 | 100.00 | 1665 | 100.00 | 204 | 100.00 | |
| Number of tests performed | 55,806 | 35,114 | 25,133 | 8315 | 2025 | ||||||
Table 2.
Demographic, comorbidity, and clinical characteristics of SARS-CoV-2-positive patients according to sex.
Table 2.
Demographic, comorbidity, and clinical characteristics of SARS-CoV-2-positive patients according to sex.
| Variable | Total positive tests (n = 50,367) |
Positive tests in women (n = 26,624) |
Positive tests in men(n = 23,743) | p value |
|---|---|---|---|---|
| Demographic variables | ||||
| Age - median, (IQR) | 42 (30 - 57) | 41 (29 - 55) | 44 (31 - 59) | <0.001 |
| Metropolitan Areas n (%) | 34,909 (69.31) | 18,626 (69.96) | 16,283 (68.58) | <0.001 |
| Nonmetropolitan areas n (%) | 15,458 (30.69) | 7998 (30.04) | 7460 (31.42) | <0.001 |
| Comorbidities – n (%) | 20,454 (40.60) | 10,569 (39.69) | 9885 (41.63) | <0.001 |
| Asthma | 1566 (3.10) | 1045 (3.93) | 521 (2.19) | <0.001 |
| Diabetes mellitus | 6683 (13.26) | 3295 (12.38) | 3388 (14.27) | 0.111 |
| Cardiovascular disease | 1085 (2.15) | 520 (1.95) | 565 (2.38) | 0.059 |
| COPD diagnosis | 912 (1.81) | 438 (1.65) | 474 (2.00) | 0.101 |
| Chronic kidney disease | 851 (1.69) | 381 (1.43) | 470 (1.98) | <0.001 |
| Hypertension | 8271 (16.42) | 4201 (15.78) | 4070 (17.14) | 0.043 |
| Immunosuppression | 741 (1.47) | 375 (1.41) | 366 (1.54) | 0.678 |
| Obesity | 5724 (11.36) | 3040 (11.42) | 2684 (11.30) | <0.001 |
| Smoking | 3102 (6.16) | 1074 (4.03) | 2028 (8.54) | <0.001 |
| HIV infection | 201 (0.40) | 67 (0.25) | 134 (0.56) | <0.001 |
| Other comorbidities | 2774 (5.51) | 1682 (6.32) | 1092 (4.60) | <0.001 |
| Clinical and outcome variables | ||||
| Days from symptom onset to testing - median (IQR) | 3 (2 - 4) | 2 (2 - 4) | 3 (2 - 4) | <0.001 |
| RT‒PCR Ct value - median, (IQR) | 27 (22 - 32) | 27 (22 - 32) | 27 (22 - 32) | 0.022 |
| Pregnancy – n (%) | 146 (0.55) | 146 (0.55) | - | - |
| Hospitalization – n (%) | 7430 (14.75) | 3016 (11.33) | 4414 (18.59) | <0.001 |
| Pneumonia diagnosis – n (%) | 7389 (14.67) | 1392 (5.23) | 2160 (9.10) | <0.001 |
| Invasive mechanical ventilation – n (%) | 3531 (7.01) | 293 (1.10) | 523 (2.20) | <0.001 |
| COVID-19 related death – n (%) | 816 (1.62) | 1392 (5.23) | 2139 (9.01) | <0.001 |
Table 3.
Acute respiratory disease and SARS-CoV-2 statewide metrics.
| Variable – n (%) | Total cases of acute respiratory disease (n = 659,704) |
Cases of acute respiratory disease in women (n = 366,348) |
Cases of acute respiratory disease in men (n = 293,356) |
p value |
|---|---|---|---|---|
| Acute respiratory disease related hospitalizations | 89,410 (13.55) | 40,339 (11.01) | 49,071 (16.73) | <0.001 |
| Acute respiratory disease related deaths | 27,303 (4.14) | 10,683 (2.92) | 16,620 (5.67) | <0.001 |
| COVID-19 confirmed cases | 303,020 (45.93) | 163,872 (44.73) | 139,148 (47.43) | <0.001 |
| COVID-19 related hospitalizations* | 44,443 (14.66) | 18,573 (11.33) | 50,586 (36.35) | <0.001 |
| COVID-19 related deaths* | 20,325 (6.71) | 7784 (4.75) | 12,541 (9.01) | <0.001 |
*Proportions calculated from the total number of confirmed COVID-19 cases.
Table 4.
Median Ct values for SARS-CoV-2 RT‒PCR tests by year, sex, and age group.
| 2020 | 2021 | 2022 | 2023 | 2024 | p value* | |
|---|---|---|---|---|---|---|
| Sex | ||||||
| Women | 28.0 (24.0-33.0) | 27.0 (22.0-32.0) | 23.0 (20.0-29.0) | 22 .0 (19.0-28.0) | 23.0 (18.5-30.0) | <0.001 |
| Men | 28.0 (23.0-32.0) | 27.0 (22.0-32.0) | 23.0 (20.0-30.0) | 23.0 (19.0-30.0) | 23.9 (19.9-31.3) | <0.001 |
| Age | ||||||
| 0-2 | 29.0 (25.0-34.0) | 33.0 (24.0-37.0) | 27.5 (21.0-37.0) | 26.0 (19.0-35.0) | 25.1 (20.0-30.8) | 0.001 |
| 2-5 | 27.0 (24.0-34.5) | 31.0 (26.5-37.0) | 29.5 (23.0-37.0) | 30.0 (23.0-34.0) | 25.1 (18.1-35.0) | 0.659 |
| 5-18 | 28.0 (24.0-33.0) | 27.0 (22.0-33.0) | 23.0 (20.0-32.0) | 27.0 (20.0-34.0) | 24.0 (20.0-28.0) | <0.001 |
| 18-65 | 28.0 (24.0-33.0) | 27.0 (22.0-33.0) | 23.0 (20.0-29.0) | 22.0 (19.0-28.0) | 22.0 (18.0-30.1) | <0.001 |
| >65 | 28.0 (24.0-32.0) | 26.0 (22.0-31.0) | 24.0 (20.0-30.0) | 22.0 (18.0-26.25) | 23.1 (20.0-33.0) | <0.001 |
*Differences calculated within the same group across years.
Table 5.
Summary of the Granger causality test and vector autoregression model results.
| Period | Metric | Optimal Lag | Granger Test p value | Ct Lag Coefficient |
Ct Lag p value |
Adjusted R2 |
|---|---|---|---|---|---|---|
| 2020 – 2021 | SPHLJ positive SARS-CoV-2 RT‒PCR tests | 1 | 0.001 | -47.624 | 0.001 | 0.927 |
| SPHLJ SARS-CoV-2 positivity rate | 2 | 0.026 | -2.025 | 0.008 | 0.853 | |
| Statewide SARS-CoV-2 positivity rate* | 2 | 0.024 | -0.012 | 0.068 | 0.980 | |
| Acute respiratory disease related deaths | 3 | 0.114 | -20.153 | 0.018 | 0.941 | |
| COVID-19 related deaths | 3 | 0.071 | -19.426 | 0.011 | 0.944 | |
| 2021 – 2022 | SPHLJ SARS-CoV-2 positivity rate | 2 | 0.005 | -0.709 | 0.047 | 0.826 |
| Effective Reproduction Number (Rt) | 3 | 0.039 | -0.012 | 0.025 | 0.980 | |
| 2022 - 2023 | SPHLJ positive SARS-CoV-2 RT‒PCR tests | 2 | 0.015 | -1.627 | 0.079 | 0.942 |
Ct: cycle threshold; Rt: effective reproduction number; SPHLJ: State Public Health Laboratory of Jalisco. *Includes positive RT‒PCR and rapid antigen tests.
Disclaimer/Publisher’s Note: The statements, opinions and data contained in all publications are solely those of the individual author(s) and contributor(s) and not of MDPI and/or the editor(s). MDPI and/or the editor(s) disclaim responsibility for any injury to people or property resulting from any ideas, methods, instructions or products referred to in the content. |
© 2025 by the authors. Licensee MDPI, Basel, Switzerland. This article is an open access article distributed under the terms and conditions of the Creative Commons Attribution (CC BY) license (https://creativecommons.org/licenses/by/4.0/).
Copyright: This open access article is published under a Creative Commons CC BY 4.0 license, which permit the free download, distribution, and reuse, provided that the author and preprint are cited in any reuse.


