
Submitted:
09 September 2025
Posted:
09 September 2025
You are already at the latest version
Abstract
Obesity is a multifactorial condition associated with inflammatory processes, intestinal dysbiosis, and impaired quality of life. This study aimed to evaluate food consumption and quality of life in individuals with overweight and obesity, correlating them with inflammatory markers and intestinal permeability. We analyzed 83 patients, divided into three groups: control, overweight, and clinical obesity (CO), according to the new diagnostic criteria. Quality of life was measured using the SF-36 questionnaire, food consumption was assessed using 24-hour dietary recalls, and inflammatory and permeability markers were measured by ELISA and flow cytometry. Individuals with CO had poorer quality of life scores, higher intake of lipids, cholesterol, and saturated fatty acids, and lower consumption of fiber, MUFA, and PUFA. These dietary patterns correlated with higher concentrations of zonulin and inflammatory cytokines (p < 0.05), such as IL-6 and IL-17A, and lower levels of IL-10, IL-4, and IL-2. The findings reinforce the importance of updated diagnostic criteria and highlight the interaction between diet, inflammation, and quality of life in individuals with excess weight.
Keywords:
Clinical obesity
; Quality of life
; Dietary intake
; Systemic inflammation
; Gut permeability
1. Introduction
Obesity is a chronic, progressive, and multifactorial condition, characterized not only by excessive accumulation of body fat but also by its metabolic, functional, and structural repercussions on the human body [1]. Although genetic factors contribute to its development, environmental factors are the predominant drivers, such as dietary patterns, physical activity levels, and sedentary behavior, playing a crucial role in modulating the expression of genetic predisposition on an individual level [2].
According to the World Obesity Atlas 2022, published by the World Obesity Federation, it is estimated that by 2030, approximately one billion people worldwide will be living with obesity [3]. In addition to global projections, national surveys also reveal alarming rates of overweight and obesity across Latin America, including Brazil, where prevalence has nearly doubled over the past three decades[4,5]. This continuous rise in prevalence not only represents a significant epidemiological burden, but also amplifies the risk of chronic diseases, as obesity and overweight are strongly associated with multiple comorbidities, including type 2 diabetes, cardiovascular disease, and several types of cancer [6].
The social and economic burden of obesity also deserves attention. Rising healthcare costs, absenteeism, and reduced productivity represent substantial challenges not only for individuals but also for healthcare systems and national economies. These consequences underscore the multidimensional impact of obesity, beyond its clinical outcomes [3,7].
From a biological perspective, excessive macronutrient intake and metabolic dysfunction disrupt energy homeostasis, promoting pathological expansion of visceral adipose tissue. The adiposity is widely accepted as an active endocrine organ that contributes to systemic inflammation. This occurs through the production of monocyte chemoattractant protein-1 (MCP-1), which drives the infiltration of circulating monocytes into adipose tissue. These cells differentiate into macrophages that secrete a range of pro-inflammatory cytokines, including TNF-α, IL-1β, and IL-6, thereby sustaining chronic, low-grade systemic inflammation [8,9,10].
Such persistent inflammation can profoundly affect the gastrointestinal (GI) tract, particularly the maintenance of intestinal barrier integrity, which is regulated by tight junction proteins, such as occludin, tricellulin, claudins, junctional adhesion molecules, and zonulin (ZO). Their dysfunction increases gut permeability and facilitates the translocation of lipopolysaccharides (LPS), which activate immune pathways and aggravate systemic inflammation, further promoting insulin resistance [11,12,13].
In addition to elevated levels of pro-inflammatory markers, obese anthropometry and the consumption of a Western-style diet also represent important risk factors for elevated intestinal permeability [14,15] Evidence indicates that the interaction between diet, gut microbiota, and the immune system shapes intestinal permeability, and its impairment has been consistently associated with obesity [16]. In particular, the high consumption of refined carbohydrates, saturated fats, and additives, has been strongly linked to low-grade inflammation and gut dysbiosis, reinforcing the role of dietary quality in obesity-related outcomes [17,18].
Beyond its biological effects, psychological well-being is negatively affected, as obesity has been associated with depression, anxiety, and social stigma, which further compromise overall quality of life [19].
In this context, the 2025 Lancet Commission on Clinical Obesity introduces a transformative lens by redefining obesity beyond the limitations of BMI-based classification. It proposes distinguishing between preclinical obesity (PCO) and clinical obesity (CO) [1]. This reframing not only aligns the diagnosis of obesity with other chronic diseases but also underscores the urgency of integrated, longitudinal research that concurrently examines diet, gut microbiota, inflammation, and quality of life.
2. Materials and Methods
2.1. Study Design, Ethical Aspects and Patients’ Enrollment
This prospective observational study was approved by the Research Ethics Committee of UNESP (Process No. 6,767,461/2024). All patients signed an informed consent form (ICF). Volunteers were recruited by convenience sampling from a university and outpatient setting, ranging in age from 18 to 65 years. To minimize potential confounding factors affecting functional or metabolic status, exclusion criteria were applied. These included: (1) the presence of other severe comorbidities under active treatment; and (2) recent use of medications known to interfere with metabolic or immune function, such as antibiotics, anti-inflammatory drugs, immunosuppressants, laxatives, or hypoglycemic agents.
Nutritional diagnosis was carried out in three stages. The first stage consisted of anthropometric screening, following the criteria established by the World Health Organization (WHO). BMI and waist circumference (WC) were used to classify individuals as normal weight (BMI 18.5–24.9 kg/m²), overweight (BMI 25.0–29.9 kg/m² and WC >80 cm for women and >94 cm for men), or obese (BMI ≥30 kg/m² and WC >88 cm for women and >102 cm for men) [1]. However, BMI-based metrics of obesity can misclassify excess adiposity and could be both underdiagnosed and overdiagnoses disease.
In the second stage, individuals with obesity were screened using a self-administered questionnaire (anamnesis), which included closed-ended questions on comorbidities commonly associated with adipose tissue dysfunction, such as diabetes mellitus, systemic arterial hypertension., dyslipidemia, sleep apnea, and cardiovascular diseases, among others. The questionnaire also contained subjective questions regarding participants perceived relationship between lifestyle and illness, as well as the timing of comorbidity onset in relation to weight gain. The responses were used to support the clinical reasoning involved in functional diagnosis.
The third stage involved the analysis of the SF-36 questionnaire, Brazilian version translated, adapted, and validated by Ciconelli et al. [20], which has subsequently been standardized for different Brazilian regions and population profiles [6] (see Appendix A). The analysis focused on the domain of role limitations due to physical health (Role-Physical - RP), which assesses the impact of health status on daily activities such as walking, climbing stairs, and lifting weights, among others.
Patients were classified as having CO if they presented with a BMI > 30 kg/m² and an increased WC according to sex, a score < 50 in the RP domain or a score between 50 and 75 in at least one domain, comorbidities associated with excess weight, and self-reported causal relationship with weight gain. This approach resulted in three study groups: control (normal weight), overweight, and CO.
2.2. Food Intake Evaluation
Dietary intake was assessed using the 24-hour dietary recall (24hR) method, which identifies and quantifies foods and beverages consumed on the day prior to the interview. Since a single recall does not adequately reflect habitual intake, three 24hR interviews were conducted per patient to obtain a more accurate and representative estimate of dietary consumption [21,22].
Interviews were carried out by telephone at three different time points: 1) immediately after patient selection and recruitment (Tuesday to Saturday, referring to weekdays); 2) in a second contact by telephone (Tuesday to Saturday, also referring to weekdays); and 3) in a third contact also by telephone (Sunday or Monday, referring to the weekend). This distribution of interviews was designed to capture potential variations in eating patterns between weekdays and weekends.
During each interview, patients reported all foods and beverages consumed on the previous day, including quantities (household or standardized measures), preparation characteristics (e.g., type of fat, salt, or sweetener), as well as the timing and location of each meal. Questions were structured to minimize interviewer interference and improve the accuracy of dietary descriptions.
Data were initially recorded manually on standardized forms and subsequently entered the Nutrition Data System for Research (NDSR, University of Minnesota, Minneapolis, MN, USA). Data transfer to the NDSR was conducted in collaboration with the Department of Public Health, Faculty of Medicine. The software enabled quantitative analysis of 92 nutrients from each dietary recall, generating the nutritional composition of individual recalls. Finally, the mean intake of each nutrient was calculated across the three recalls for each participant, and group-level averages were determined for analysis [23].
2.3. Quality of Life Evaluation
The SF-36 was selected because it is comprehensive, concise, consistent with current guidelines for health-related quality of life instruments, and psychometrically robust. It consists of a multi-item scale that evaluates eight health domains: physical functioning (PF), role-physical (RP), role-emotional (RE), vitality (VT), mental health (MH), social functioning (SF), bodily pain (BP), and general health (GH) [24].
The questionnaire was self-administered in printed format, preceded by standardized instructions, and supervised to ensure comprehension and the integrity of responses. In cases of illiteracy or functional illiteracy, the instrument was administered through individual interviews. Participants were instructed to answer based on their usual health status over the previous four weeks, to minimize the influence of acute or atypical events, such as muscle pain induced by vigorous physical activity or transient emotional conditions. This orientation followed the standardized recommendations for the administration of the SF-36, thereby ensuring greater reliability and discriminant validity of the instrument [25].
For the evaluation of results, a standardized score was assigned to each question, which was subsequently transformed into a scale ranging from 0 to 100, where zero corresponds to the worst health status and 100 to the best. Each domain was analyzed separately in two stages [20,26,27]. The first stage consisted of data weighting (Table 1), and the second stage involved the calculation of the raw score (Formula 1). In this step, the values of each item were converted into scores ranging from 0 (zero) to 100 (one hundred).
The following formula was applied for the calculation of each parameter. In the formula, the limit and score range values are fixed and specified in Table 2. Question 02 is not included in the calculation of any domain and is used solely to assess whether the individual perceives their health as better or worse compared to one year earlier.
2.4. Cytokine Quantification by Cytometric Bead Array
Approximately 5 mL of peripheral blood samples from patients were collected in serum separator tubes containing clot activator. Samples were centrifuged at 3,500 rpm in 5 minutes. Serum concentrations of IL-2, IL-4, IL-6, IL-10, IL-17A, IFN-γ, and TNF were determined by flow cytometry (FACSCanto II) using the BD™ Cytometric Bead Array (CBA) kit (BD Biosciences, Franklin Lakes, NJ, USA). Serial dilutions were first performed to construct the standard curve, ranging from 0 to 1:256 of the lyophilized Th1/Th2/Th17 standards. After preparation of the curve, the bead mixture was vortexed, pooled in a Falcon tube, and centrifuged at 200 g for 5 minutes. The supernatant was discarded, and the pellet was resuspended with Serum Enhancement Buffer and incubated for 30 minutes at room temperature, protected from light. Then, 50 μL of cytokine standard dilutions and 50 μL of each sample were added to appropriately labeled tubes, followed by the addition of 28 μL of PE detection reagent to all tubes. Samples were incubated at room temperature, protected from light, for 3 hours. After incubation, 800 μL of Wash Buffer was added to each tube and centrifuged at 200 g for 5 minutes. The supernatant was discarded, and the pellet was resuspended in 200 μL of Wash Buffer. Data acquisition was performed on a FACSCanto II flow cytometer (BD Biosciences, Franklin Lakes, NJ, USA), and results were expressed after conversion of mean fluorescence intensity into pg/mL. This stage was conducted in collaboration with the Flow Cytometry Laboratory of IBB/UNESP.
2.5. Zonulin Quantification by ELISA Assay
Approximately 5 mL of peripheral blood was collected in a serum separator tube (BD Vacutainer® SST® II Advance®) containing a clot activator. The tube was homogenized and kept at room temperature for 60 minutes to allow clot retraction. After this period, the sample was centrifuged at 3,500 rpm for 5 minutes, and the serum was collected. Approximately 2–3 serum aliquots were prepared in 0.5 mL tubes and stored at -80ºC in the Department of Chemical and Biological Sciences, IBB/UNESP Botucatu.
Serum zonulin concentrations were measured using an enzyme-linked immunosorbent assay (ELISA) with commercial kits (Elabscience, Bethesda, MD, USA). Serial dilutions were first performed to construct the standard curve, ranging from 0 to 50 ng/mL of zonulin. A total of 100 μL of undiluted serum samples and standard curve points were added to the plates. After a 90-minute incubation at 37ºC, 100 μL of biotinylated detection antibody working solution was added, and the plate was incubated again for 1 hour at 37ºC. Subsequently, four washing cycles with 350 μL of buffer were performed to remove nonspecific binding. Next, 100 μL of HRP conjugate working solution was added, followed by incubation for 30 minutes at 37ºC. The wells were then washed five times with 350 μL of buffer, and 90 μL of substrate solution was added, followed by 15 minutes of incubation at 37ºC, protected from light. Finally, 50 μL of stop solution was added to each well, and optical density (OD) was read at 450 nm using a microplate spectrophotometer (BioTek Epoch 2NS).
Calibration curves were constructed in Excel spreadsheets using the formula y = ax + b, where x and y were the dependent variables (OD and concentration, respectively). Concentrations were calculated by converting the optical density (x variable) into ng/mL (y variable).
2.6. Statistical Analysis
All data will be characterized using frequency tables for categorical variables and measures of central tendency (mean, median) and dispersion (standard deviation, minimum, and maximum) for quantitative variables. Data analysis was conducted using one-way ANOVA with Holm-Sidak's multiple comparisons test and Spearman's rank correlation coefficient, implemented in GraphPad Prism version 10. Statistical significance was determined at a 5% alpha level (p < 0.05).
3. Results
3.1. Clinical and Demographic Characteristics of the Study Population
The sample consisted of 83 individuals classified according to updated diagnostic criteria for obesity: 24 overweight, 24 with clinical obesity, and 35 eutrophics. The OPC group was excluded from the analysis. The majority were women aged 19 to 29 years (35.8%), self-declared as White. Anthropometric data (weight, height, and waist circumference) were collected at recruitment for nutritional diagnosis. A predominance of Caucasian individuals was observed in the control group, whereas the overweight groups showed a higher proportion of individuals of African descent, particularly among men with obesity (75%). Class I obesity was the most prevalent in both sexes, suggesting an early stage of the condition, with 27.8% of women presenting with Class II obesity. Table 3 presents the demographic and anthropometric data of the three groups.
3.2. Evaluation of Quality of Life in Participants
The quality of life was assessed using the SF-36 questionnaire, which includes the domains: physical functioning (PF), role-physical (RP), role-emotional problems (RLEP), vitality (V), mental health (MH), social functioning (SF), bodily pain (BP), and general health (GH). Statistical analysis, performed using Tukey's multiple comparison test (α = 0.05), indicated significant differences between groups in all domains, except RE (Figure 1a).
The CO group had the lowest scores in almost all domains, especially FC (74.79 ± 17.03), V (40.42 ± 19.67), and GH (54.25 ± 17.26), while the control group had the best results. Significant differences were observed particularly between the control and CO groups, and between the overweight and CO groups, reflecting a decline in quality of life with worsening nutritional status. The overweight and CO groups showed greater variability in scores, suggesting greater heterogeneity.
Correlating with clinical data, we observed significant inverse correlations between BMI and the domains PF (r = -0.41; p < 0.0001), RP (r = -0.23; p = 0.035), VT (r = -0.28; p = 0.008), MH (r = -0.21; p = 0.049), SF (r = -0.20; p = 0.057), BP (r = -0.33; p = 0.002), and GH (r = -0.43; p < 0.0001), suggesting that increased BMI may be associated with worsening in these aspects (Figure 1b). The correlation with RE was not significant, suggesting no influence of nutritional status on emotional factors compared to physical and social factors.
3.3. Assessment of Participants' Dietary Intake
A total of 138 24hR from 62 patients were analyzed using specialized software for nutrient intake estimation. Ten nutrients were included in the statistical analysis: total lipids (LIP), carbohydrates (CHO), total protein (PTNt), animal protein (PTNa), plant protein (PTNp), cholesterol (CHOL), saturated fatty acids (SFA), monounsaturated fatty acids (MUFA), polyunsaturated fatty acids (PUFA), and total dietary fiber (DF).
Significant differences were observed between the control and CO groups for several nutrients. Compared with controls, the CO group showed higher intakes of total lipids (44.46 ± 32.75 vs. 137.7 ± 163.9 g; P = 0.0067), cholesterol (303.0 ± 182.7 vs. 500 ± 333.5 mg; P = 0.0204), and SFA (21.97 ± 9.09 vs. 31.54 ± 13.53 g; P = 0.0116). In contrast, MUFA (37.49 ± 18.91 vs. 24.25 ± 9.18 g; P = 0.0048), PUFA (29.19 ± 42.34 vs. 9.45 ± 5.24 g; P = 0.0427), and total dietary fiber (24.59 ± 9.97 vs. 16.06 ± 5.06 g; P = 0.0012) were significantly lower in the CO group. No significant differences were found for carbohydrates or total, animal, and plant proteins (Figure 2a).
Correlation analysis between nutrient intake and quality-of-life domains revealed significant inverse associations between cholesterol and PF (r = −0.40; P = 0.001) and BP (r = −0.37; P = 0.003). SFA intake was negatively correlated with BP (r = −0.25; P = 0.044) and GH (r = −0.25; P = 0.049). Conversely, total dietary fiber was positively associated with PF (r = 0.29; P = 0.0204) but negatively correlated with RP (r = −0.32; P = 0.012), SF (r = −0.30; P = 0.017), and BP (r = −0.27; P = 0.032). These findings suggest that higher fiber intake may be linked to better overall quality of life, while elevated cholesterol and SFA intake are associated with poorer physical and mental health outcomes (Figure 2b, c and d).
3.4. Increased Inflammatory Markers in Participants
We evaluated the concentrations of IL-2, IL-4, IL-6, IL-10, IL-17A, IFN-γ, and TNF in the serum of study participants. Statistical analysis (Tukey's multiple comparison test) revealed significant differences (p < 0.05) between the control and CO groups, as well as between the control and overweight groups. The concentrations of IL-17A, a pro-inflammatory cytokine of the Th17 pattern, showed a significant increase in the CO group compared to the control group (p < 0.0001). For IL-10, a significant elevation was observed in the overweight group compared to the control group (p = 0.0013). The levels of pro-inflammatory IL-6 were significantly higher in the CO (p = 0.0002) and overweight (p = 0.0002) groups compared to the control group. IL-4 also showed a significant elevation in the CO (p = 0.003) and overweight (p = 0.004) groups compared to the control group. Finally, IL-2 showed a significant increase in both the CO (p = 0.042) and overweight (p = 0.047) groups compared to the control group (Figure 3).
3.5. Increased Intestinal Permeability in Participants
The gut permeability was evaluated in 60 serum samples (n = 20 per group), and we observed a significant increase in zonulin concentrations in the serum of patients on CO group (75,95 ±4,86) compared to control group (49,52 ±5,805) (p = 0.003), as shown in Figure 4a.
Correlating intestinal permeability with nutrient intake, we observed a significant inverse correlation between serum zonulin levels and total dietary fiber (r = -0.43; p ≤ 0.0007), suggesting improved barrier function with higher fiber consumption. Interestingly, we detected a moderate positive correlation between zonulin and total lipids (r = 0.32; p = 0.010), suggesting increased intestinal permeability with higher lipid intake (Figure 4b).
4. Discussion
Overweight and obesity are complex conditions influenced by multiple factors, including sex and skin color. In Brazil, women are disproportionately affected [28], a finding consistent with this study, which showed a higher prevalence of grade II obesity among females. The literature indicates that skin color other than white is a significant risk factor for being overweight, both nationally and internationally [29,30], a finding corroborated by this study. Such associations between sex, skin color, and obesity prevalence provide a context for understanding how excess weight affects physical and functional well-being.
The results of this study confirm the link between higher BMI and poorer quality of life, particularly in the physical domains of the SF-36, except for the role limitations due to emotional problems. Previous research has also shown that increasing body weight is associated with a decline in quality of life, especially regarding pain and physical function [19]. Conversely, weight loss has been linked to improved physical function, reduced pain, and enhanced vitality [31,32].
The SF-36 was shown to be a useful instrument in identifying physical impairments, as scores in this domain were used to classify patients as OPC or OC. The importance of this classification was confirmed by analyses of intestinal permeability and inflammation, which initially failed to show significant differences between groups when conducted without the Rubino et al. classification. However, upon applying this new classification, meaningful differences emerged, underscoring its utility.
Data analysis revealed meaningful associations between health-related quality of life outcomes and nutrient intake. Previous research has demonstrated an inverse relationship between saturated fat consumption and SF-36 scores, as well as improved physical function with low-fat diets [31,33]. High cholesterol intake has been linked to poorer quality of life, increased cardiovascular risk, and symptoms such as anxiety and depression [34]. Notably, this study is the first to investigate the relationship between cholesterol and physical function and pain. While the literature on fiber and quality of life is limited, evidence suggests that higher fiber intake is associated with better physical performance and mental health [35], findings that support the results of this study.
This study's findings revealed that individuals with OC had a higher consumption of total lipids, saturated fatty acids, and cholesterol, coupled with lower intake of monounsaturated fatty acids (MUFA), polyunsaturated fatty acids (PUFA), and total dietary fiber, compared to the control group. This nutritional pattern is characteristic of a Western diet and has significant implications for modulating the immune and inflammatory response [16]. The literature shows that diets rich in saturated fat and cholesterol activate pro-inflammatory pathways, leading to intestinal dysbiosis, increased gut permeability, and release of endotoxins into the systemic circulation, which in turn stimulate the production of inflammatory cytokines and insulin resistance [36,37,38,39].
The findings of this study showed that individuals with obesity and overweight had elevated levels of the pro-inflammatory cytokines IL-17 and IL-6, accompanied by lower levels of IL-10, IL-4, and IL-2, compared to the control group [40]. These results support the presence of a chronic low-grade inflammatory state in these individuals, linked to excess adipose tissue and their dietary habits. IL-6 and IL-17 are well-established cytokines that play a key role in perpetuating inflammation, particularly in metabolic disorders. Notably, IL-6 is produced by hypertrophied adipocytes and immune cells in adipose tissue, while IL-17 amplifies tissue inflammatory responses [41,42].
In contrast, the cytokines IL-10, IL-4, and IL-2 are crucial for regulating the immune response and maintaining immunological homeostasis. The decrease in these cytokines in overweight individuals suggests a dysregulation between pro- and anti-inflammatory mechanisms, favoring a pro-inflammatory environment. This imbalance may be exacerbated by a diet lacking in MUFA, PUFA, and fiber, nutrients known to modulate the inflammatory response and gut microbiota [43].
The interplay between diet, gut microbiota, and inflammation is essential for preserving intestinal barrier function. Dysbiosis leads to increased gut permeability, allowing endotoxins to translocate and trigger systemic inflammation [44,45]. Zonulin, a key regulator of tight junctions, is an important indicator of this process, with elevated levels linked to high-fat diets. Gut barrier dysfunction is strongly associated with obesity and other chronic diseases [16]. Our findings support this connection between dietary patterns and zonulin levels, highlighting the impact of food consumption on gut permeability and systemic inflammation.
This study provides valuable insights into obesity, quality of life, dietary habits, intestinal permeability, and inflammation in a Brazilian population, while also emphasizing the importance of using the new diagnostic criteria for classifying obesity in academic research. The results show that failing to adopt this approach led to the misclassification of nutritional status in nine participants, which compromised the reliability of the analyses.
5. Conclusions
Our findings indicate that clinical obesity is linked to reduced quality of life, increased consumption of total lipids, cholesterol, and saturated fatty acids, decreased fiber intake, and heightened intestinal permeability and inflammation, marked by elevated IL-6 and IL-17A levels. We observed inverse relationships between BMI and multiple SF-36 domains, as well as connections between nutrient intake and intestinal health and inflammation parameters. Notably, higher fiber intake was associated with improved quality of life scores and lower zonulin levels. By excluding the OPC group, we achieved a more precise analysis, underscoring the importance of updated diagnostic criteria. These results enhance our understanding of the interplay between nutritional status, diet, inflammation, and well-being in adults with excess weight.
Author Contributions
Conceptualization, Luiza Machado, Caroline Gomes and Gislane de Oliveira; Data curation, Luiza Machado and Gislane de Oliveira; Formal analysis, Luiza Machado and Larissa Souza; Funding acquisition, Gislane de Oliveira; Investigation, Luiza Machado, Larissa Souza, Julia Pavão, Laura Cefali, Caroline Gomes and Gislane de Oliveira; Methodology, Luiza Machado, Larissa Souza, Julia Pavão and Laura Cefali; Project administration, Gislane de Oliveira; Resources, Caroline Gomes and Gislane de Oliveira; Software, Luiza Machado and Caroline Gomes; Supervision, Gislane de Oliveira; Validation, Luiza Machado, Larissa Souza, Caroline Gomes and Gislane de Oliveira; Visualization, Luiza Machado, Larissa Souza, Caroline Gomes and Gislane de Oliveira; Writing – original draft, Luiza Machado; Writing – review & editing, Gislane de Oliveira.
Funding
This study was supported by the São Paulo Research Foundation (FAPESP), process number #2023/11597-0 (Fellowship for LDM).
Institutional Review Board Statement
The study was conducted in accordance with the Declaration of Helsinki, and approved by the Sao Paulo State University Research Ethics Committee (Protocol code No. 6,767,461; date of approval: 16 April 2024).
Informed Consent Statement
Informed consent was obtained from all subjects involved in the study.
Conflicts of Interest
The authors declare no conflicts of interest.
References
- Rubino, F.; Cummings, D.E.; Eckel, R.H.; Cohen, R.V.; Wilding, J.P.H.; Brown, W.A.; Stanford, F.C.; Batterham, R.L.; Farooqi, I.S.; Farpour-Lambert, N.J.; et al. Definition and Diagnostic Criteria of Clinical Obesity. The Lancet Diabetes & Endocrinology 2025, 0. [Google Scholar] [CrossRef]
- Meldrum, D.R.; Morris, M.A.; Gambone, J.C. Obesity Pandemic: Causes, Consequences, and Solutions—but Do We Have the Will? Fertility and Sterility 2017, 107, 833–839. [Google Scholar] [CrossRef] [PubMed]
- Lobstein, T.; Jackson-Leach, R.; Powis, J.; Brinsden, H.; Gray, M. World Obesity Atlas 2023. 2023.
- Barboza, L.L.S.; Pierangeli Costa, A.; de Oliveira Araujo, R.H.; Barbosa, O.G.S.; Leitão, J.L.A.E.S.P.; de Castro Silva, M.; Molina, G.E.; Grossi Porto, L.G. Comparative Analysis of Temporal Trends of Obesity and Physical Inactivity in Brazil and the USA (2011–2021). BMC Public Health 2023, 23, 2505. [Google Scholar] [CrossRef] [PubMed]
- Almost Half of Brazilian Adults Will Be Living with Obesity within 20 Years Available online:. Available online: https://www.worldobesity.org/news/almost-half-of-brazilian-adults-will-be-living-with-obesity-within-20-years (accessed on 18 August 2025).
- Garvey, W.T.; Mechanick, J.I.; Brett, E.M.; Garber, A.J.; Hurley, D.L.; Jastreboff, A.M.; Nadolsky, K.; Pessah-Pollack, R.; Plodkowski, R. ; Reviewers of the AACE/ACE Obesity Clinical Practice Guidelines AMERICAN ASSOCIATION OF CLINICAL ENDOCRINOLOGISTS AND AMERICAN COLLEGE OF ENDOCRINOLOGY COMPREHENSIVE CLINICAL PRACTICE GUIDELINES FOR MEDICAL CARE OF PATIENTS WITH OBESITY. Endocr Pract 2016, 22 Suppl 3, 1–203. [Google Scholar] [CrossRef]
- Dall, T.M.; Sapra, T.; Natale, Z.; Livingston, T.; Chen, F. Assessing the Economic Impact of Obesity and Overweight on Employers: Identifying Opportunities to Improve Work Force Health and Well-Being. Nutr. Diabetes 2024, 14, 96. [Google Scholar] [CrossRef]
- Dousdampanis, P.; Aggeletopoulou, I.; Mouzaki, A. The Role of M1/M2 Macrophage Polarization in the Pathogenesis of Obesity-Related Kidney Disease and Related Pathologies. Front. Immunol. 2025, 15. [Google Scholar] [CrossRef]
- Dahdah, N.; Tercero-Alcázar, C.; Malagón, M.M.; Garcia-Roves, P.M.; Guzmán-Ruiz, R. Interrelation of Adipose Tissue Macrophages and Fibrosis in Obesity. Biochemical Pharmacology 2024, 225, 116324. [Google Scholar] [CrossRef]
- Li, B.; Sun, S.; Li, J.-J.; Yuan, J.-P.; Sun, S.-R.; Wu, Q. Adipose Tissue Macrophages: Implications for Obesity-Associated Cancer. Mil Med Res 2023, 10, 1. [Google Scholar] [CrossRef]
- Bischoff, S.C.; Barbara, G.; Buurman, W.; Ockhuizen, T.; Schulzke, J.-D.; Serino, M.; Tilg, H.; Watson, A.; Wells, J.M. Intestinal Permeability – a New Target for Disease Prevention and Therapy. BMC Gastroenterology 2014, 14, 189. [Google Scholar] [CrossRef]
- Groschwitz, K.R.; Hogan, S.P. Intestinal Barrier Function: Molecular Regulation and Disease Pathogenesis. Journal of Allergy and Clinical Immunology 2009, 124, 3–20. [Google Scholar] [CrossRef]
- Cani, P.D.; Amar, J.; Iglesias, M.A.; Poggi, M.; Knauf, C.; Bastelica, D.; Neyrinck, A.M.; Fava, F.; Tuohy, K.M.; Chabo, C.; et al. Metabolic Endotoxemia Initiates Obesity and Insulin Resistance. Diabetes 2007, 56, 1761–1772. [Google Scholar] [CrossRef]
- De Munck, T.J.I.; Xu, P.; Verwijs, H.J.A.; Masclee, A.A.M.; Jonkers, D.; Verbeek, J.; Koek, G.H. Intestinal Permeability in Human Nonalcoholic Fatty Liver Disease: A Systematic Review and Meta-Analysis. Liver International 2020, 40, 2906–2916. [Google Scholar] [CrossRef]
- Damms-Machado, A.; Louis, S.; Schnitzer, A.; Volynets, V.; Rings, A.; Basrai, M.; Bischoff, S.C. Gut Permeability Is Related to Body Weight, Fatty Liver Disease, and Insulin Resistance in Obese Individuals Undergoing Weight Reduction12. The American Journal of Clinical Nutrition 2017, 105, 127–135. [Google Scholar] [CrossRef]
- Randeni, N.; Bordiga, M.; Xu, B. A Comprehensive Review of the Triangular Relationship among Diet-Gut Microbiota-Inflammation. Int J Mol Sci 2024, 25, 9366. [Google Scholar] [CrossRef]
- Atzeni, A.; Martínez, M.Á.; Babio, N.; Konstanti, P.; Tinahones, F.J.; Vioque, J.; Corella, D.; Fitó, M.; Vidal, J.; Moreno-Indias, I.; et al. Association between Ultra-Processed Food Consumption and Gut Microbiota in Senior Subjects with Overweight/Obesity and Metabolic Syndrome. Front. Nutr. 2022, 9. [Google Scholar] [CrossRef] [PubMed]
- Rondinella, D.; Raoul, P.C.; Valeriani, E.; Venturini, I.; Cintoni, M.; Severino, A.; Galli, F.S.; Mora, V.; Mele, M.C.; Cammarota, G.; et al. The Detrimental Impact of Ultra-Processed Foods on the Human Gut Microbiome and Gut Barrier. Nutrients 2025, 17, 859. [Google Scholar] [CrossRef]
- Kolotkin, R.L.; Meter, K.; Williams, G.R. Quality of Life and Obesity. Obes Rev 2001, 2, 219–229. [Google Scholar] [CrossRef] [PubMed]
- Ciconelli, R.M.; Ferraz, M.B.; Santos, W.; Meinão, I.; Quaresma, M.R. Tradução para a língua portuguesa e validação do questionário genérico de avaliação de qualidade de vida SF-36 (Brasil SF-36). Rev. bras. reumatol 1999, 143–150. [Google Scholar]
- Dodd, K.W.; Guenther, P.M.; Freedman, L.S.; Subar, A.F.; Kipnis, V.; Midthune, D.; Tooze, J.A.; Krebs-Smith, S.M. Statistical Methods for Estimating Usual Intake of Nutrients and Foods: A Review of the Theory. J Am Diet Assoc 2006, 106, 1640–1650. [Google Scholar] [CrossRef]
- De Keyzer, W.; Huybrechts, I.; De Vriendt, V.; Vandevijvere, S.; Slimani, N.; Van Oyen, H.; De Henauw, S. Repeated 24-Hour Recalls versus Dietary Records for Estimating Nutrient Intakes in a National Food Consumption Survey. Food Nutr Res 2011, 55, 10.3402/fnr.v55i0.7307. [Google Scholar] [CrossRef]
- Miller, P.E.; Mitchell, D.C.; Harala, P.L.; Pettit, J.M.; Smiciklas-Wright, H.; Hartman, T.J. Development and Evaluation of a Method for Calculating the Healthy Eating Index-2005 Using the Nutrition Data System for Research. Public Health Nutr 2011, 14, 306–313. [Google Scholar] [CrossRef]
- Ware, J.E.; Sherbourne, C.D. The MOS 36-Item Short-Form Health Survey (SF-36). I. Conceptual Framework and Item Selection. Med Care 1992, 30, 473–483. [Google Scholar] [CrossRef]
- Lins, L.; Carvalho, F.M. SF-36 Total Score as a Single Measure of Health-Related Quality of Life: Scoping Review. SAGE Open Med 2016, 4, 2050312116671725. [Google Scholar] [CrossRef] [PubMed]
- Adorno, M.L.G.R.; Brasil-Neto, J.P. Avaliação da qualidade de vida com o instrumento SF-36 em lombalgia crônica. Acta ortop. bras. 2013, 21, 202–207. [Google Scholar] [CrossRef]
- 36-Item Short Form Survey from the RAND Medical Outcomes Study Available online:. Available online: https://www.rand.org/health-care/surveys_tools/mos/36-item-short-form.html (accessed on 21 July 2025).
- Lyrio, A.O.; Souza, E.S.; Conceição, S.D.S.; Batista, J.E.; Brito, S.M.; Gomes Filho, I.S.; Figueiredo, A.C.M.; da Cruz, S.S. Prevalence of Overweight and Obesity and Associated Factors among Women of Childbearing Age in Brazil. Public Health Nutr 2021, 24, 5481–5490. [Google Scholar] [CrossRef]
- Ferreira, S.R.G.; Macotela, Y.; Velloso, L.A.; Mori, M.A. Determinants of Obesity in Latin America. Nat Metab 2024, 6, 409–432. [Google Scholar] [CrossRef]
- Williams, M.S.; McKinney, S.J.; Cheskin, L.J. Social and Structural Determinants of Health and Social Injustices Contributing to Obesity Disparities. Curr Obes Rep 2024, 13, 617–625. [Google Scholar] [CrossRef]
- Yancy, W.S.; Almirall, D.; Maciejewski, M.L.; Kolotkin, R.L.; McDuffie, J.R.; Westman, E.C. Effects of Two Weight-Loss Diets on Health-Related Quality of Life. Qual Life Res 2009, 18, 281. [Google Scholar] [CrossRef] [PubMed]
- Okunogbe, A.; Nugent, R.; Spencer, G.; Ralston, J.; Wilding, J. Economic Impacts of Overweight and Obesity: Current and Future Estimates for Eight Countries. BMJ Glob Health 2021, 6, e006351. [Google Scholar] [CrossRef] [PubMed]
- Ruano, C.; Henriquez, P.; Bes-Rastrollo, M.; Ruiz-Canela, M.; del Burgo, C.L.; Sánchez-Villegas, A. Dietary Fat Intake and Quality of Life: The SUN Project. Nutr J 2011, 10, 121. [Google Scholar] [CrossRef] [PubMed]
- Germanova, O.A.; Vukolova, Y.Y.; Strelnik, A.; Izmailova, O.; Gubareva, I.V.; Galati, G. Application of SF-36 Health Status Survey in Patients with Arterial Hypertension. Psychiatr Danub 2023, 35, 318–321. [Google Scholar]
- Rees, J.; Radavelli Bagatini, S.; Lo, J.; Hodgson, J.M.; Christophersen, C.T.; Daly, R.M.; Magliano, D.J.; Shaw, J.E.; Sim, M.; Bondonno, C.P.; et al. Association between Fruit and Vegetable Intakes and Mental Health in the Australian Diabetes Obesity and Lifestyle Cohort. Nutrients 2021, 13, 1447. [Google Scholar] [CrossRef] [PubMed]
- Ding, S.; Chi, M.M.; Scull, B.P.; Rigby, R.; Schwerbrock, N.M.J.; Magness, S.; Jobin, C.; Lund, P.K. High-Fat Diet: Bacteria Interactions Promote Intestinal Inflammation Which Precedes and Correlates with Obesity and Insulin Resistance in Mouse. PLoS One 2010, 5, e12191. [Google Scholar] [CrossRef]
- Malesza, I.J.; Malesza, M.; Walkowiak, J.; Mussin, N.; Walkowiak, D.; Aringazina, R.; Bartkowiak-Wieczorek, J.; Mądry, E. High-Fat, Western-Style Diet, Systemic Inflammation, and Gut Microbiota: A Narrative Review. Cells 2021, 10, 3164. [Google Scholar] [CrossRef]
- Kang, C.; Wang, B.; Kaliannan, K.; Wang, X.; Lang, H.; Hui, S.; Huang, L.; Zhang, Y.; Zhou, M.; Chen, M.; et al. Gut Microbiota Mediates the Protective Effects of Dietary Capsaicin against Chronic Low-Grade Inflammation and Associated Obesity Induced by High-Fat Diet. mBio 2017, 8, e00470-17. [Google Scholar] [CrossRef] [PubMed]
- Cândido, F.G.; Valente, F.X.; Grześkowiak, Ł.M.; Moreira, A.P.B.; Rocha, D.M.U.P.; Alfenas, R. de C.G. Impact of Dietary Fat on Gut Microbiota and Low-Grade Systemic Inflammation: Mechanisms and Clinical Implications on Obesity. Int J Food Sci Nutr 2018, 69, 125–143. [Google Scholar] [CrossRef] [PubMed]
- Phu, T.A.; Ng, M.; Vu, N.K.; Bouchareychas, L.; Raffai, R.L. IL-4 Polarized Human Macrophage Exosomes Control Cardiometabolic Inflammation and Diabetes in Obesity. Mol Ther 2022, 30, 2274–2297. [Google Scholar] [CrossRef]
- Ellulu, M.S.; Patimah, I.; Khaza’ai, H.; Rahmat, A.; Abed, Y. Obesity and Inflammation: The Linking Mechanism and the Complications. Arch Med Sci 2017, 13, 851–863. [Google Scholar] [CrossRef]
- Sivasami, P.; Elkins, C.; Diaz-Saldana, P.P.; Goss, K.; Peng, A.; Hamersky, M.; Bae, J.; Xu, M.; Pollack, B.P.; Horwitz, E.M.; et al. Obesity-Induced Dysregulation of Skin-Resident PPARγ+ Treg Cells Promotes IL-17A-Mediated Psoriatic Inflammation. Immunity 2023, 56, 1844–1861.e6. [Google Scholar] [CrossRef]
- Calder, P.C.; Ahluwalia, N.; Brouns, F.; Buetler, T.; Clement, K.; Cunningham, K.; Esposito, K.; Jönsson, L.S.; Kolb, H.; Lansink, M.; et al. Dietary Factors and Low-Grade Inflammation in Relation to Overweight and Obesity. Br J Nutr 2011, 106 Suppl 3, S5–78. [Google Scholar] [CrossRef]
- Jergens, A.E.; Parvinroo, S.; Kopper, J.; Wannemuehler, M.J. Rules of Engagement: Epithelial-Microbe Interactions and Inflammatory Bowel Disease. Front. Med. 2021, 8. [Google Scholar] [CrossRef] [PubMed]
- Potrykus, M.; Czaja-Stolc, S.; Stankiewicz, M.; Kaska, Ł.; Małgorzewicz, S. Intestinal Microbiota as a Contributor to Chronic Inflammation and Its Potential Modifications. Nutrients 2021, 13, 3839. [Google Scholar] [CrossRef] [PubMed]
Figure 1.
(a) Calculated scores of quality-of-life parameters measured by the SF-36: Physical Functioning (PF), Role-Physical (RP), Vitality (VT), Mental Health (MH), Bodily Pain (BP), and General Health (GH). Results are expressed as mean ± standard error of the mean (SEM). A parametric ANOVA test with multiple comparisons was applied, and significant differences were detected (*P < 0.05) compared with controls. (b) Spearman’s correlation between BMI and quality-of-life parameters. Control (n = 35); Overweight (n = 24); and Clinical Obesity (CO, n = 24).
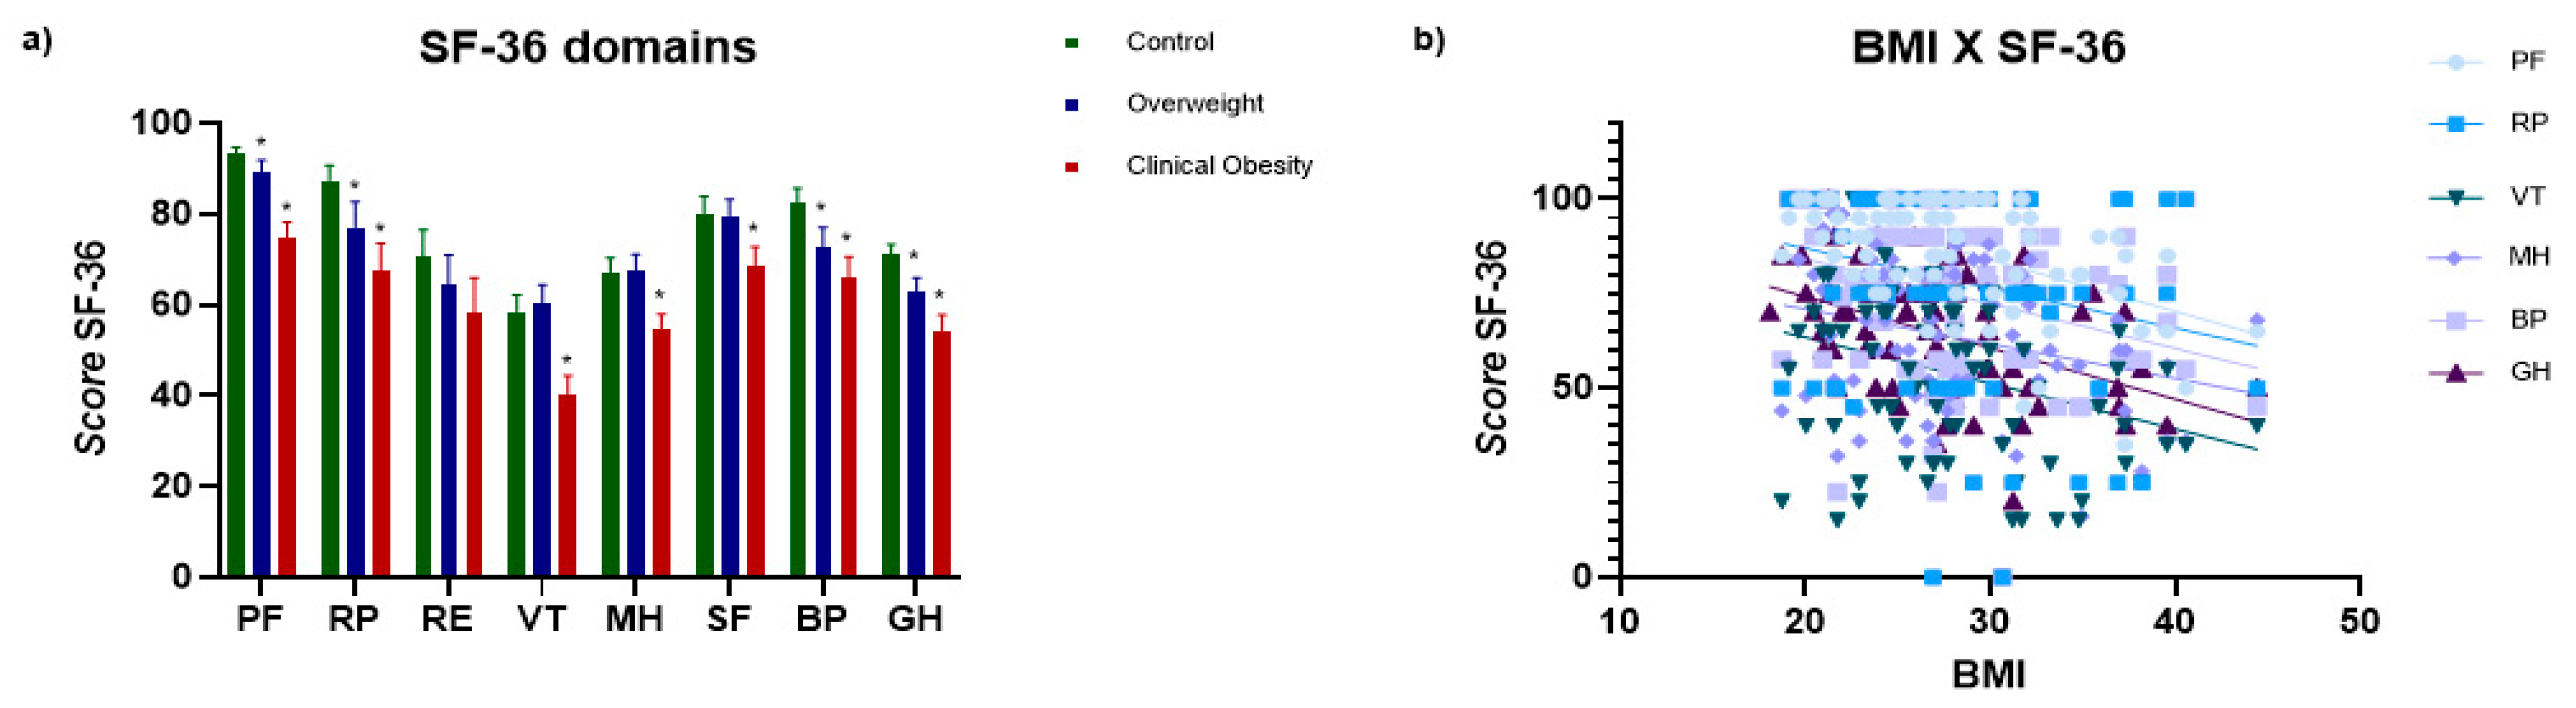
Figure 2.
(a) Mean nutrient intake in the Control, Overweight, and Clinical Obesity (CO) groups. Total lipids (LIP), total carbohydrates (CHO), total protein (PTNt), animal protein (PTNa), plant protein (PTNp), cholesterol (CHOL), saturated fatty acids (SFA), monounsaturated fatty acids (MUFA), polyunsaturated fatty acids (PUFA), and total dietary fiber (DT. Results are expressed as mean ± SEM. One-way ANOVA with multiple comparisons was applied, and significant differences were detected (*P < 0.05) compared with controls. (b–d) Spearman correlation between nutrient intake and quality-of-life parameters (SF-36). (b) Cholesterol (mg) vs. SF-36 domains; (c) SFA (g) vs. SF-36 domains; (d) Total dietary fiber (g) vs. SF-36 domains. Control (n = 25); Overweight (n = 15); CO (n = 22).
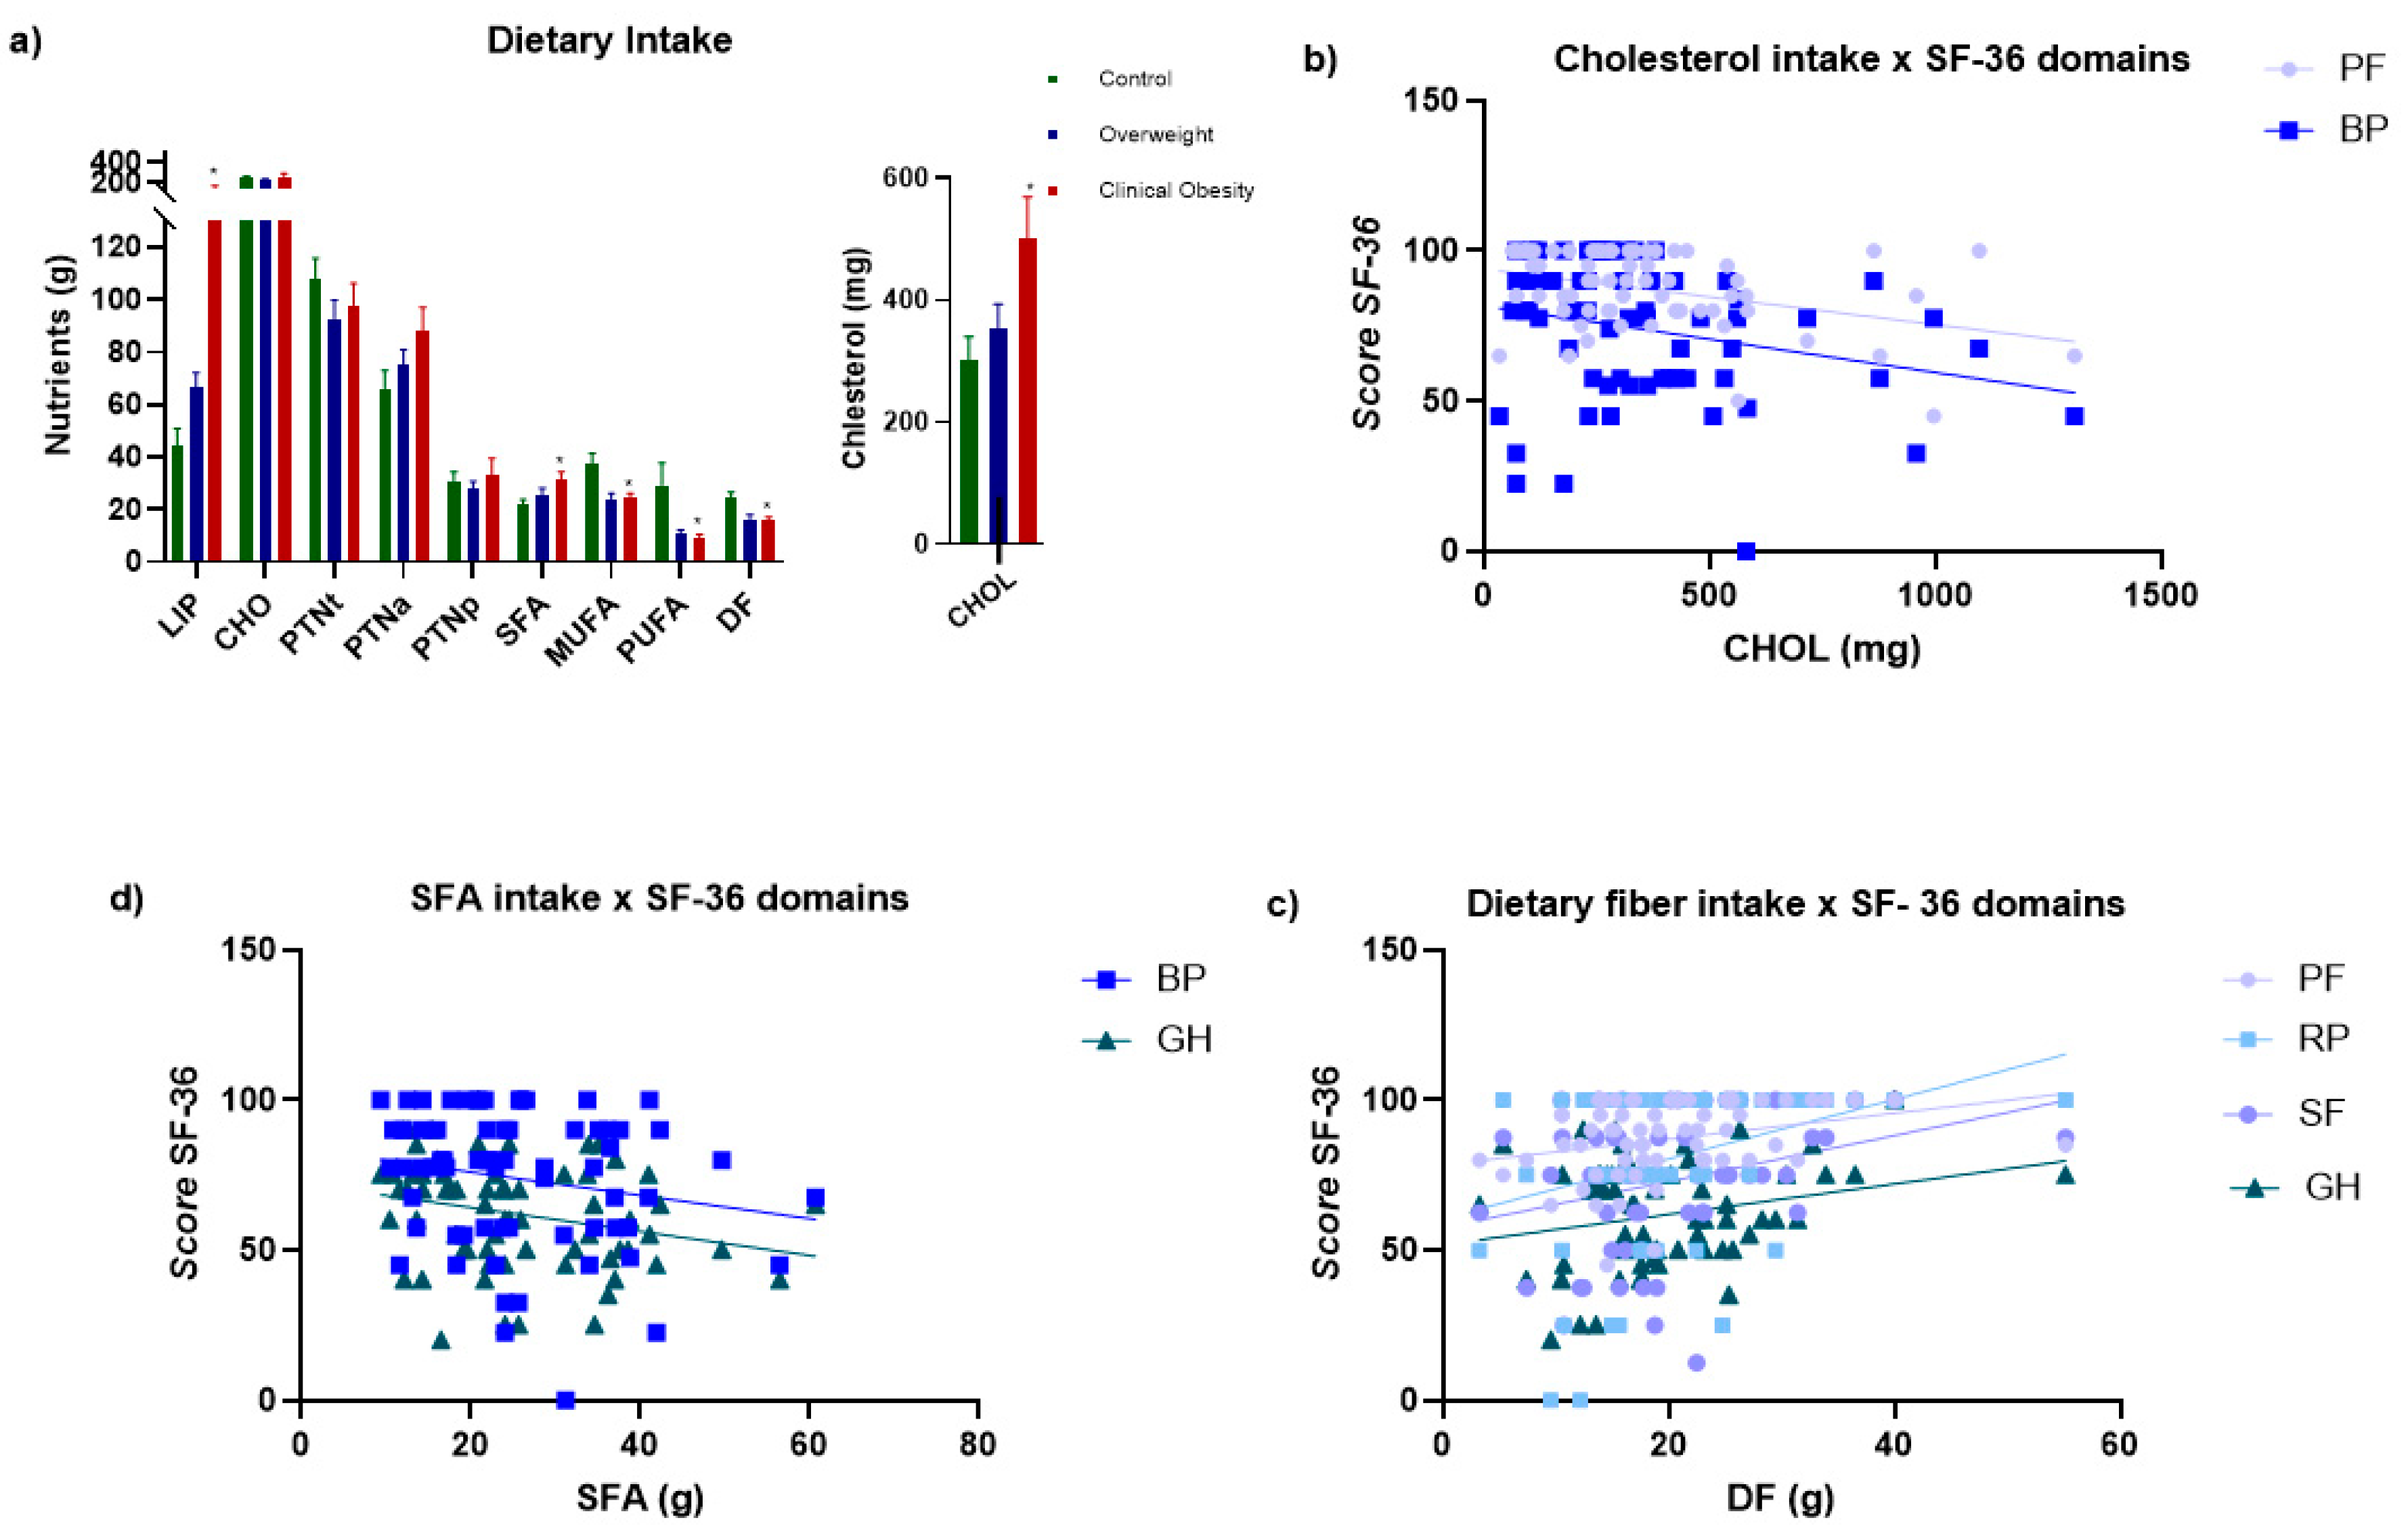
Figure 3.
Serum cytokine concentrations (pg/mL). Results are expressed as mean ± SEM. One-way ANOVA with multiple comparisons was applied, and significant differences were detected (*P < 0.05) compared with controls. Control (n = 34); Overweight (n = 26); Clinical Obesity (CO; n = 26).
Figure 3.
Serum cytokine concentrations (pg/mL). Results are expressed as mean ± SEM. One-way ANOVA with multiple comparisons was applied, and significant differences were detected (*P < 0.05) compared with controls. Control (n = 34); Overweight (n = 26); Clinical Obesity (CO; n = 26).
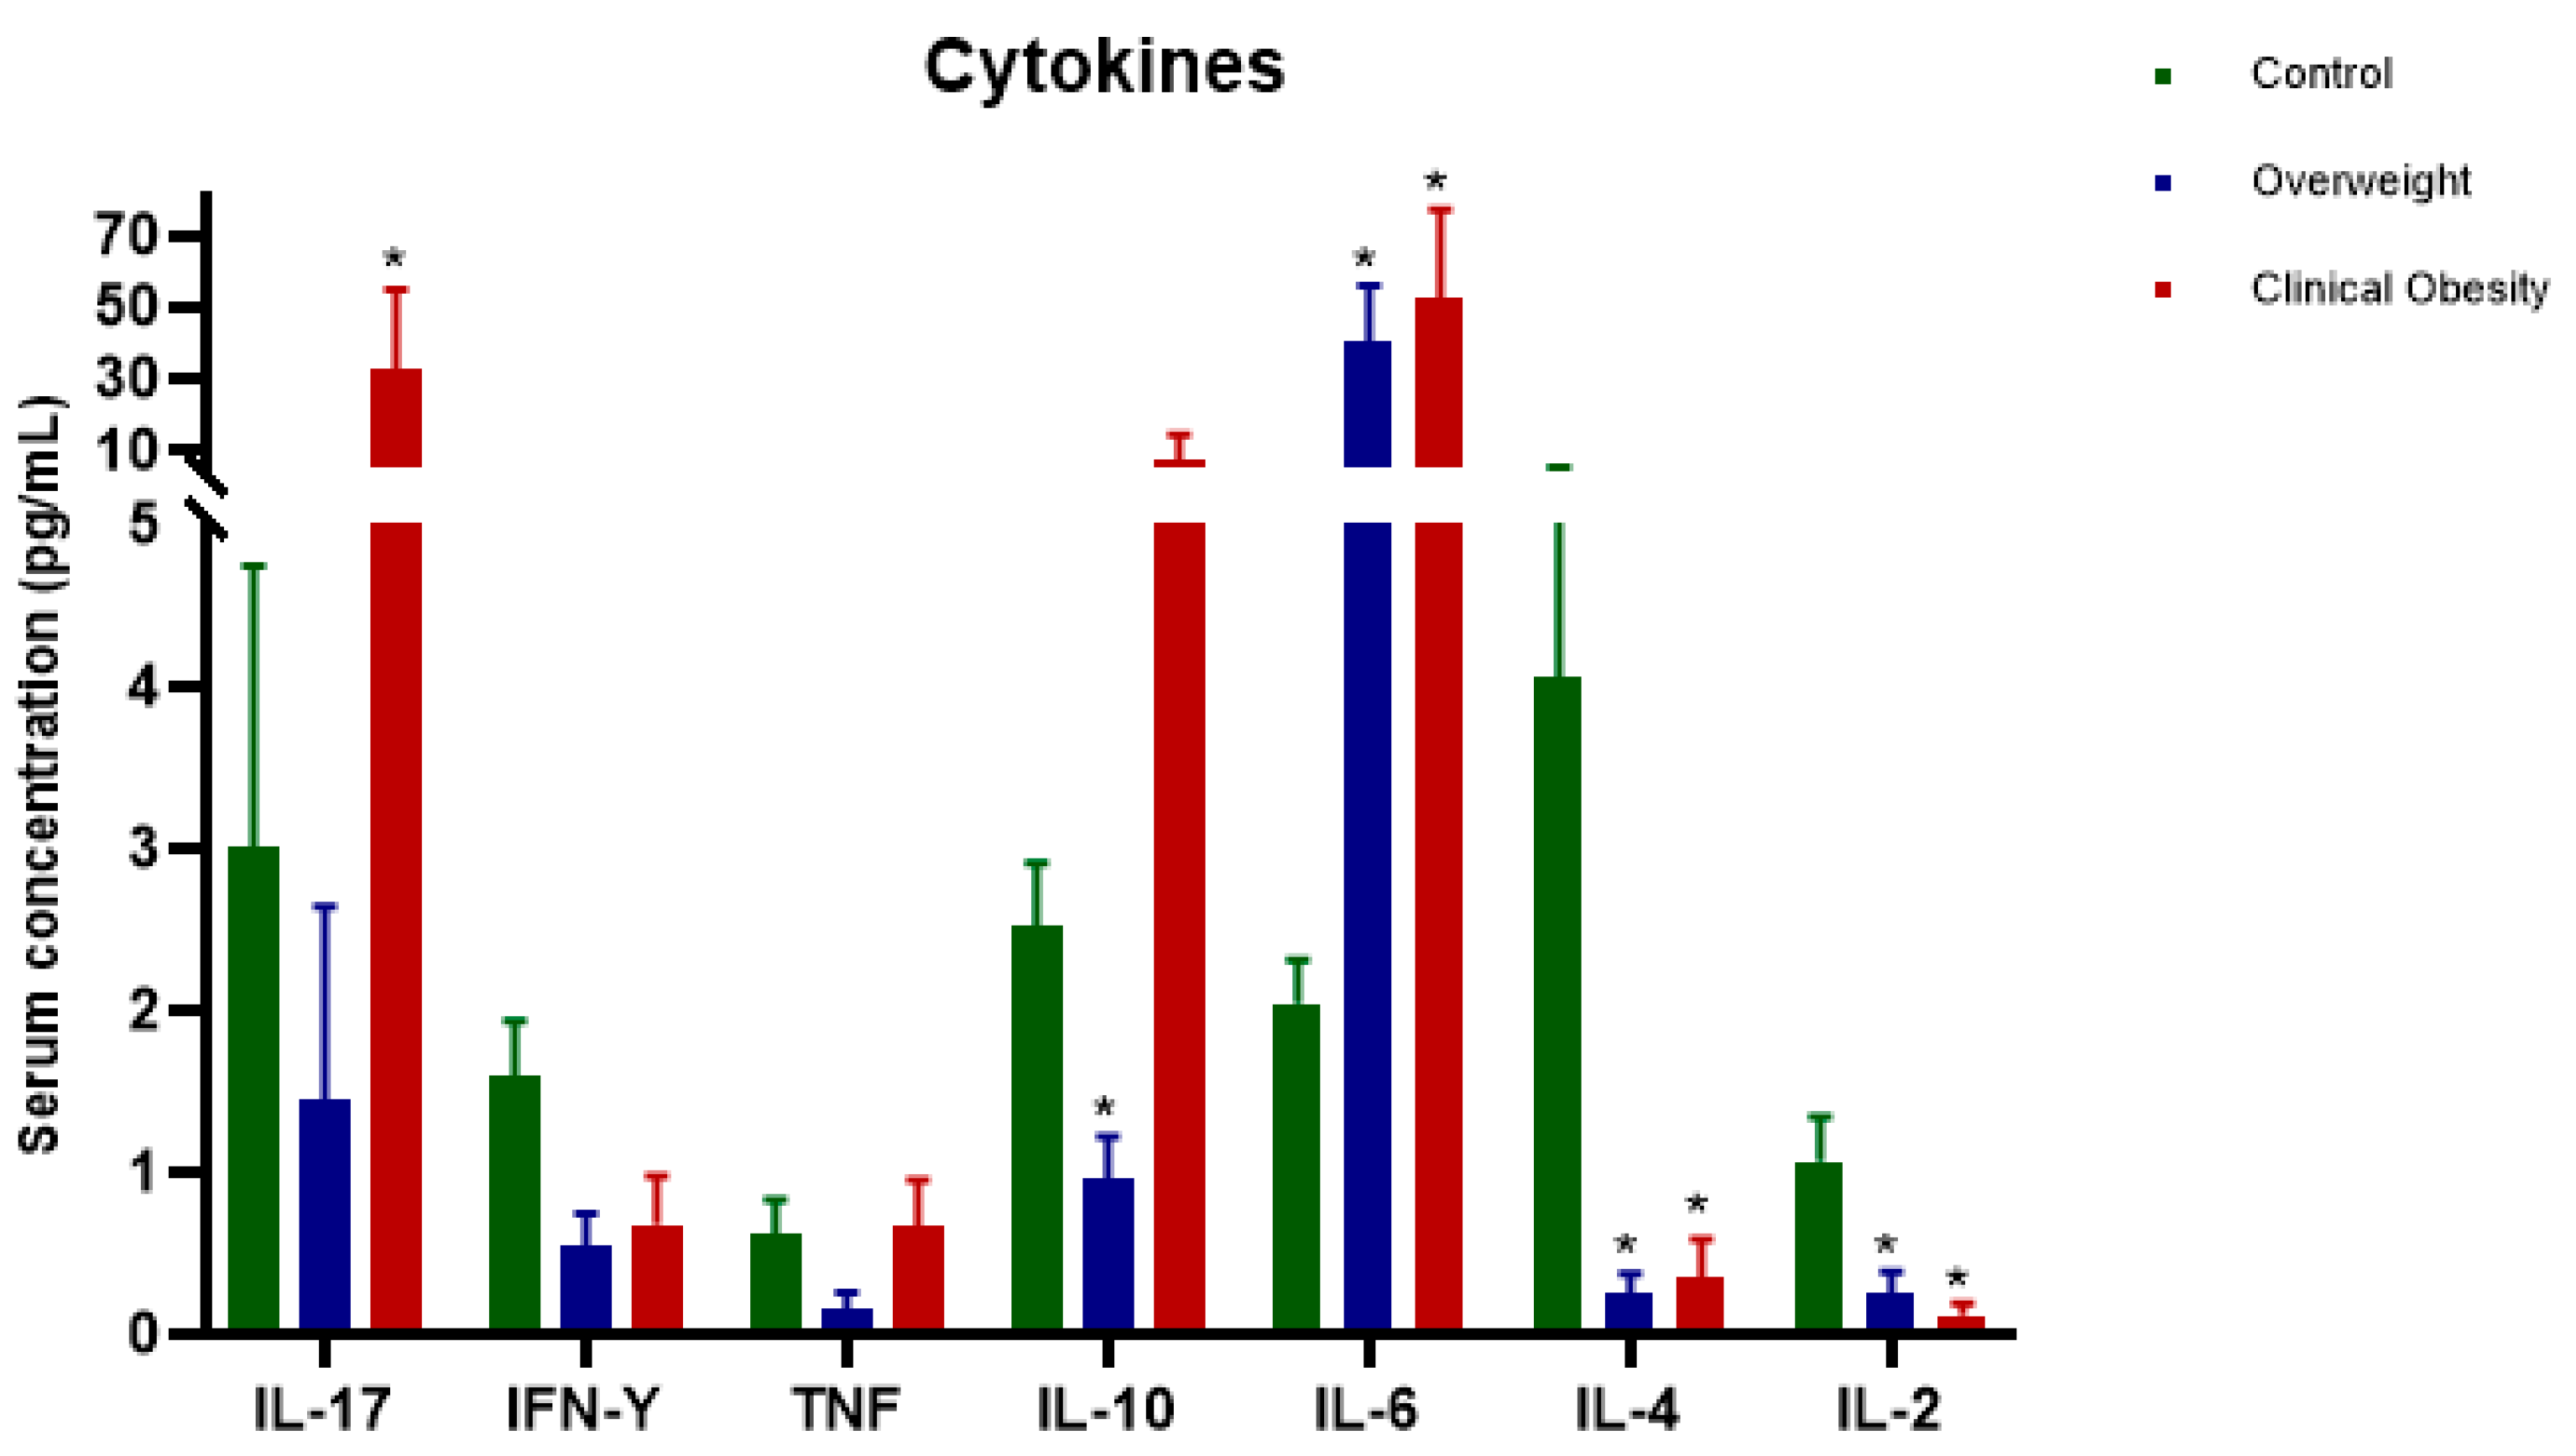
Figure 4.
(a) Serum zonulin concentrations (ng/mL) in participants’ serum samples. Results are expressed as mean ± SEM. One-way ANOVA with multiple comparisons was applied, and significant differences were detected (*P < 0.05) compared with controls. (b) Spearman correlation between nutrient intake and zonulin levels: LIP, CHO, PTNt, PTNa, PTNp, CHOL, SFA, MUFA, PUFA, and DF. Control (n = 20); Overweight (n = 20); CO (n = 20).
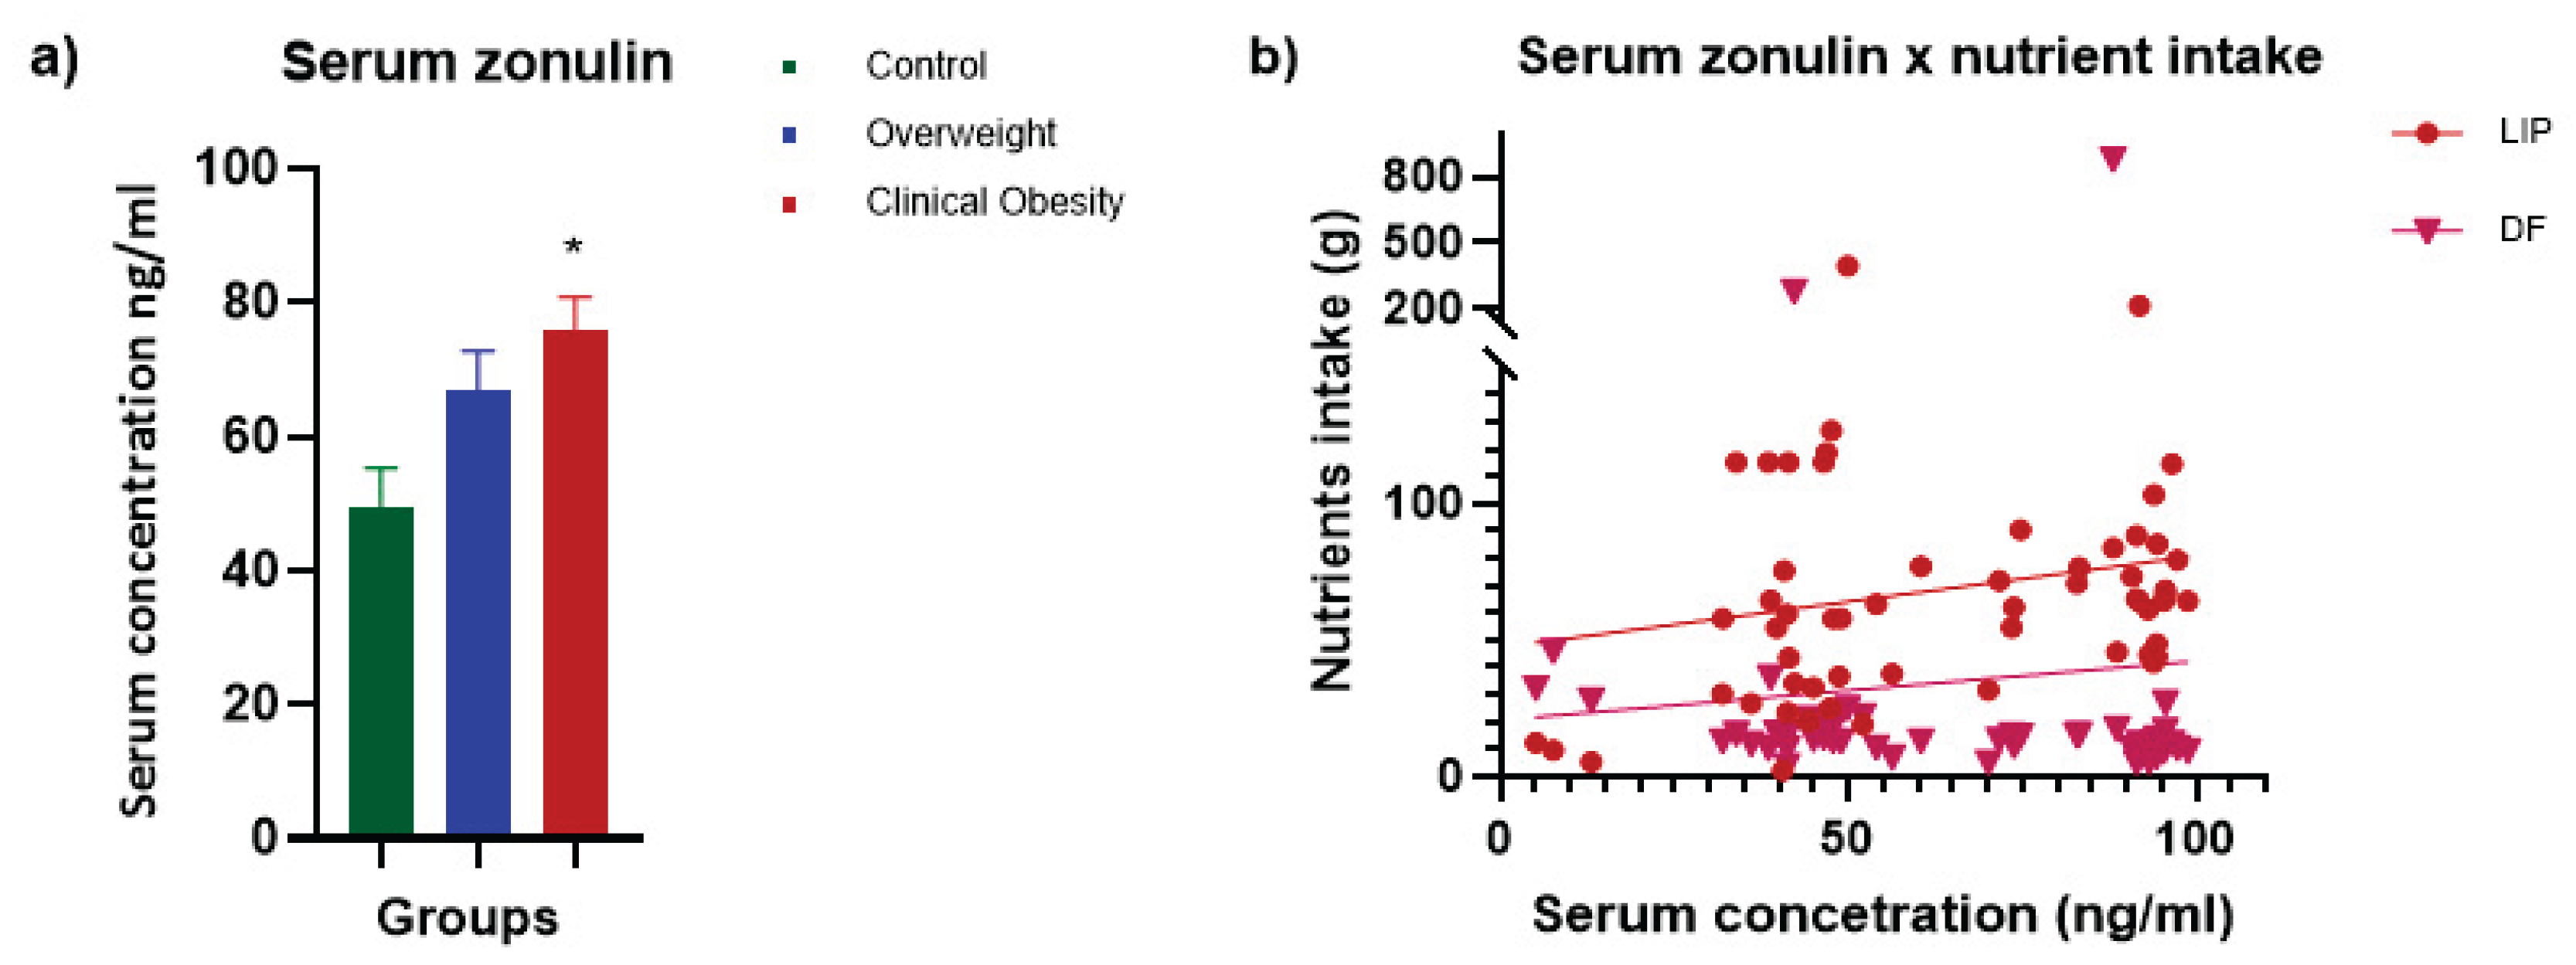

Table 1.
Scoring of the SF-36 questionnaire.
| Question | Scoring |
|---|---|
| 1 | If the answer is 1, score is 5 If the answer is 2, score is 4.4 If the answer is 3, score is 3.4 If the answer is 4, score is 2.0 If the answer is 5, score is 1 |
| 2 | Keep the original value |
| 3 | Sum of the original values |
| 4 | Sum of the original values |
| 5 | Sum of the original values |
| 6 | If the answer is 1, score is 5 If the answer is 2, score is 4 If the answer is 3, score is 3 If the answer is 4, score is 2 If the answer is 5, score is 1 |
| 7 | If the answer is 1, score is 6.0 If the answer is 2, score is 5.4 If the answer is 3, score is 4.2 If the answer is 4, score is 3.1 If the answer is 5, score is 2.2 If the answer is 6, score is 1.0 |
| 8 | If the answer to Q8 is 1 and to Q7 is 1, score is 6 If the answer to Q8 is 1 and to Q7 is 2 to 6, score is 5 If the answer to Q8 is 2 and to Q7 is 2 to 6, score is 4 If the answer to Q8 is 3 and to Q7 is 2 to 6, score is 3 If the answer to Q8 is 4 and to Q7 is 2 to 6, score is 2 If the answer to Q8 is 5 and to Q7 is 2 to 6, score is 1 If question 7 is not answered, the score for question 8 becomes the following: If the answer is 1, score is 6 If the answer is 2, score is 4.75 If the answer is 3, score is 3.5 If the answer is 4, score is 2.25 If the answer is 5, score is 1 |
| 9 | For items a, d, e, h: If the answer is 1, score is 6 If the answer is 2, score is 5 If the answer is 3, score is 4 If the answer is 4, score is 3 If the answer is 5, score is 2 If the answer is 6, score is 1 For items b, c, f, g, and i, the original value is kept. |
| 10 | Keep the original value |
| 11 | Items should be summed, but items b and d should follow the following scoring: If the answer is 1, score is 5 If the answer is 2, score is 4 If the answer is 3, score is 3 If the answer is 4, score is 2 If the answer is 5, score is 1 |
Table 2.
Score (0 to 100).
| Parameter | Question | Limit | Variation |
|---|---|---|---|
| Physical Functioning | 3 | 10 | 20 |
| Role-Physical | 4 | 4 | 4 |
| Role-Emotional | 5 | 3 | 3 |
| Vitality | 09 (items a, e, g, i) | 4 | 8 |
| Mental Health | 09 (items b, c, d, f, h) | 5 | 25 |
| Social Functioning | 06 and 10 | 2 | 8 |
| Bodily Pain | 07 and 08 | 2 | 10 |
| General Health | 01 and 11 | 5 | 20 |
Table 3.
Demographic and anthropometric data.
| Variables | Control (n=35) | Overweight (n=24) | Clinical Obesity (n=24) | |||
|---|---|---|---|---|---|---|
| Female (n=26) | Male (n=9) | Female (n=14) | Male (n=10) | Female (n=20) | Male (n=4) | |
| Ethnicity | ||||||
| Caucasian | 21 | 7 | 7 | 3 | 8 | 1 |
| Afro descent | 5 | 2 | 7 | 7 | 10 | 3 |
| Age - range (years) | ||||||
| 19 - 29 | 17 | 7 | 4 | 3 | 10 | 1 |
| 30 - 39 | 2 | 2 | 4 | 5 | 6 | 1 |
| 40 - 49 | 4 | - | 4 | 2 | 3 | 2 |
| 50 - 59 | 2 | - | 1 | 1 | 1 | - |
| 60 - 65 | 1 | - | 1 | - | - | - |
| BMI (Kg/m²) | ||||||
| Mean (SE) | 22,67 (±2,05) | 22,61 (±2,22) | 27,72 (±1,63) | 28,09 (±1,21) | 33,6 (±3,24) | 34,56 (±4,73) |
| Median (range) | 22,92 (18,74 - 25,47) | 25,60 (20,98 - 27,18) | 28,12 (23,83 - 29,96) | 28,07 (26,60 - 29,99) | 33,61 (30,17 - 40,56) | 33,42 (30,65 - 44,41) |
| WC (cm) | ||||||
| Mean (SE) | 68,1 (±6,46) | 85,8 (±4,13) | 84,7 (±3,18) | 95,5 (±4,51) | 103,8 (±13,79) | 112,9 (±13,21) |
| Median (range) | 71,25 (60 - 86) | 87 (80 - 91) | 88 (80 - 88) | 94 (94 - 102) | 97 (136 - 88) | 108 (102 - 142) |
| Obesity class | ||||||
| Class I | - | - | - | - | 14 | 3 |
| Class II | - | - | - | - | 5 | - |
| Class III | - | - | - | - | 1 | 1 |
Disclaimer/Publisher’s Note: The statements, opinions and data contained in all publications are solely those of the individual author(s) and contributor(s) and not of MDPI and/or the editor(s). MDPI and/or the editor(s) disclaim responsibility for any injury to people or property resulting from any ideas, methods, instructions or products referred to in the content. |
© 2025 by the authors. Licensee MDPI, Basel, Switzerland. This article is an open access article distributed under the terms and conditions of the Creative Commons Attribution (CC BY) license (http://creativecommons.org/licenses/by/4.0/).
Copyright: This open access article is published under a Creative Commons CC BY 4.0 license, which permit the free download, distribution, and reuse, provided that the author and preprint are cited in any reuse.


