Submitted:
06 September 2025
Posted:
08 September 2025
You are already at the latest version
Abstract
Aim
This paper evaluates the precision and trueness of facial scanners (FSs) by analyzing facial scans from ten 3D scanners, consisting of five professional devices and five mobile applications.
Material and Methods
A 3D facial model with human-like dimensions, shape, and proportions, featuring reference points, was used to standardize measurements. A reference file was acquired using an industrial laser scanner, specifically the Edge 14000 model from FARO®(Certified ISO 9001 - calibration ISO/IEC 17025:2017 accreditations). Each FS performed six scans. Computer-aided design (CAD) software was then used for precise measurements and alignments. The six scans from each FS were compared to evaluate precision and trueness, both locally and globally, against the reference file.
Result
Scans produced by the applications showed significant differences in image resolution and dimensional scale, making it impossible to achieve a match in Exocad. In contrast, the professional FSs exhibited dimensional matching with the reference file in .stl format, enabling comparable measurements that the applications could not provide. Consequently, the comparison of professional FSs with the reference file demonstrated overall trueness.
Conclusion
Given the limitations of this in-vitro study, significant dimensional discrepancies in the currently tested apps should continue to be evaluated. The professional FSs considered in this study demonstrated satisfactory trueness and precision when compared to the reference file, making them suitable for enhancing dental treatment plans.
Keywords:
Digital Dentistry
; Facial Scanners
; trueness
; Precision
; CAD Software
; Application
1. Introduction
Today, we are witnessing an increasing adoption of digital technologies in the dental field [1,2]. This can be attributed to improved patient comfort, as these technologies are less invasive and reduce the time required for analysis and evaluation of results [3]. Digital technologies are being applied in various areas of dentistry, such as prosthodontics, implantology, orthodontics, and restorative dentistry [4,5]. The latest innovation is the Facial Scanner (FS), which creates a virtual craniofacial model through a fully digitalized three-dimensional image [3,6]. As part of a fully digital workflow, facial scan images and intraoral scans can be integrated with CBCT data, enabling the creation of a 3D virtual patient that supports treatment planning and improves results [6,7,8]. The main advantage of using FSs lies in their ability to scan perioral soft tissues, which cannot be reproduced through CBCT or intraoral scanning, allowing for the creation of a fully digitalized 3D model of the patient's face [3,9,10]. FSs, like Intraoral Scanners (IOS) [11], must achieve a high level of trueness to create reliable 3D craniofacial models [1,10,12]. Facial scanners are used for diagnostic records, virtual patient creation, smile design, virtual articulation, and the diagnosis and treatment of Obstructive Sleep Apnea (OSA) [13]. They deliver precise 3D modeling for personalized treatment planning and improved clinical outcomes. These capabilities are further enhanced by incorporating jaw motion tracking (JMT) devices, which offer innovative and valuable tools for achieving fully facially driven treatment plans. With JMT, a fourth dimension (dynamic patient-specific jaw motion) can be integrated, enabling even greater refinement and personalization in treatment [14,15]. Accuracy refers to how closely a test result matches the accepted reference value. Two related terms are also used: precision, which measures the consistency of results under specific conditions, and trueness, which describes how close the average of multiple measurements is to the true or reference value, regardless of result variability [16,17]. Therefore, while trueness is essential, it alone is not sufficient for evaluating a FS. The FS must also demonstrate precision by delivering reproducible results across multiple measurements of the same object. In addition to professional facial scanning devices, which provide high-performance levels at a significant investment, dental apps are now available for download on mobile devices, offering low-cost options for capturing images of faces and objects [18]. The aim of this study was to evaluate the precision and trueness of facial scans obtained from ten different FSs, including both professional devices and mobile applications: Metascan (App Store), TRNIO (App Store), Scaniverse (App Store), MagiScan (App Store), Polycam (App Store), Face Hunter (Zirkonzahn), Space Spider (Artec3D), Ray Face (Micerium), Easy Face Scan (Revopoint), and MetiSmile (Shining 3D). The files generated by these various scans were compared to a reference file created using the industrial scanner Edge 14,000 (FARO: Certified ISO 9001 - calibration ISO/IEC 17025:2017 accreditations). If scans are not accurate, treatment failures can occur, such as misfit dental restorations [19]. Therefore, this research aimed to assess the accuracy of the virtual patient. The null hypothesis is that facial scans from different scanners show significant differences in precision and trueness compared to the reference scanner, with no difference between mobile apps and professional facial scanners.
2. Materials and Methods
To standardize the measurements, a three-dimensional facial model made of polyvinyl chloride was used, with dimensions, shape, and proportions comparable to those of the human face (Figure 1).
The local markers were created using Cobalt-Chrome laser fusion technology and subsequently coated with pink enamel, similar to the color of the face. The geometry and positioning of the local markers were carefully considered, opting for a convex spherical shape that is more accurate to scan [13]. To ensure repeatability and ease of assessment, six linear measurement markers were selected: tragus, ala, and chin on both the right and left sides.
The number and arrangement of the points intended for matching always have a spherical geometry, which is larger in size compared to the reference points used for linear measurements, in order to distinguish them from the others. After selecting their distribution, the local markers were permanently affixed using a liquid cyanoacrylate adhesive to ensure the repeatability of the different scans (Figure 2). The scanning phase began with the acquisition of the reference file, which is the representation of the three-dimensional facial model. This file is necessary to compare the scans produced by the various FSs used in the study, in order to determine their local and global trueness. An industrial laser scanner, specifically the Edge 14000 model by FARO®, was used to acquire the reference file. The .stl format was chosen for export.
After an in-depth product review prior to the study, five professional FSs intended for dental use and available on the Italian market were selected. Similarly, five scanning apps were chosen for download, including only those with the highest number of reviews and good ratings. The professional FSs included in the study were: Face Hunter (Zirkonzahn), Space Spider (Artec3D), Ray Face (Micerium), Easy Face Scan (Revopoint), and MetiSmile (Shining 3D); the apps tested were: Metascan (App Store), TRNIO (App Store), Scaniverse (App Store), MagiScan (App Store), and Polycam (App Store). All FSs and applications are capable of exporting files in .stl and .obj formats. The applications differ from the professional scanners in terms of the technology they use, as while all scanners employ structured light technology, the applications primarily rely on photogrammetry, which reconstructs 3D objects by analyzing multiple 2D images, relying on feature detection and triangulation.
Six scans of the model were performed for each scanner, and, like the reference file, the .stl format was chosen so that the resulting files could be imported into the CAD software used for the subsequent measurements. The Exocad DentalCAD software was then used for the measurement phase; Exocad also offers a wide range of implant libraries integrated within the software to support precise and customized implant design. In collaboration with New Ancorvis S.r.l. (Via dell'Industria, 15, 40012 Bargellino (BO) - Italy), and using the CAD method to create implant libraries, a volumetric conversion library was created. This allowed a conical geometry to be associated with each spherical local marker, facilitating the subsequent measurement phase. Distances were measured from the apex of each cone, corresponding to the reference point. The measurement process was carried out using a virtual ruler integrated into the software. To verify the correct cone-sphere matching, there is a specific function that allows the software to calculate the best possible placement based on the acquired data and actual alignment (Figure 3).
To evaluate the trueness of the various scanners along the x, y, and z axes, and thus perform a 3D assessment based on the previously established reference points, the following distances were chosen: Right ala - Right tragus, Left ala - Left tragus, Right tragus - Right chin, Left tragus - Left chin, Right ala - Left ala, Right chin - Left chin, Right ala - Right chin, Left ala - Left chin (Figure 4).
The same protocol was applied to each FS in the study. First, the .stl file from the scan was uploaded to the Exocad platform, and the custom volumetric conversion library was opened to align the reference points (Figure 5 and Figure 6). Then, the predefined linear distances in millimeters were measured using the specific measurement tool.
After taking the measurements, the results from the six scans of each facial scanner were analyzed for precision.
These measurements were then compared with the reference values to assess overall trueness. Trueness analysis was conducted globally by comparing linear distances between the files produced by the different facial scanners and the reference file. Local trueness was evaluated at the reference point surface by measuring the axial distance between the scanned reference surface and the hemisphere surface on the reference model, corresponding to the apex of the associated cone (Figure 7).
Statistical analyses were conducted using R software (version 4.2.2, R Foundation for Statistical Computing), an open-source platform for data manipulation, computation, analysis, and graphical visualization. Numerical data were reported as means and standard deviations. Differences in linear measurements obtained from the scanners relative to the reference file, along with discrepancies in markers between the study group files and the reference file across different scanners, were evaluated using linear mixed regression models. In these models, scanner type and measurement were treated as fixed effects, while a random intercept was assigned to each scan. This methodology enables the analysis of complex datasets by distinguishing between systematic and random variability, enhancing the trueness of estimates in scenarios involving repeated measurements or data collected from multiple groups. Correlation classifications were defined as follows: poor for ICC ≤ 0.2, fair for 0.2 < ICC ≤ 0.4, moderate for 0.4 < ICC ≤ 0.6, substantial for 0.6 < ICC ≤ 0.8, almost perfect for 0.8 < ICC < 1, and perfect for ICC = 1. The same scale was applied to the concordance correlation coefficient (CCC). The ICC quantifies the similarity or consistency of measurements across different instruments, while the CCC measures the closeness of the measurements to each other and to the reference value. Bland-Altman analysis was performed to estimate the bias (the mean difference between measurements) and the limits of agreement (LoA), which represent the range within which differences between the two methods are considered acceptable. These estimates were accompanied by confidence intervals for each scanner, indicating the probability that the true value lies within a specified range. Confidence intervals for bias were calculated at 95%, while those for LoA were calculated at 90%, as the latter were determined using two one-sided tests (TOST). The significance level (α) was set at 0.05.
3. Results
The results from the statistical analysis were divided into two categories of scanners examined: applications downloadable on devices and professional scanners. Regarding the applications, although the scan preview appears to closely resemble reality, substantial differences emerge in terms of image resolution when analyzing the files exported in .stl format. Additionally, it was observed that the files generated from scanning the model were exported either over- or under-scaled relative to the reference. This discrepancy makes it impossible to align the hemispherical local markers scanned by the applications with the conical geometry of the volumetric conversion library specifically created in Exocad. As a result, due to these significant dimensional differences, it was not possible to proceed with the intended measurements. The preliminary check with 3Shape Viewer confirmed that the five professional FSs produced scan files accurately scaled to the reference, unlike the apps. This ensured the feasibility of proceeding with the measurement phase.
For each FS, including the reference model (Table 1), the data generated by the various scans were sorted based on their distances in millimeters.
The mean values and standard deviations of the linear distances measured across the six scans were also calculated, along with the discrepancies at each local marker relative to the reference for each scanner (Table 2).
Globally, by comparing the distances obtained from the various FSs to those from the reference, the performance of the scanners was evaluated using the intraclass correlation coefficient (ICC). In this case, all scanners demonstrated a consistency of 1 relative to the reference, which is considered perfect.
The concordance correlation coefficient (CCC), similar to the ICC, was calculated to assess the agreement between the measurements produced by the various scanners and the reference values. The CCC accounts for both the correlation between measurements and the systematic bias relative to the reference, both of which were also equal to 1. A comparison was made between the average linear distances measured across the six scans for each scanner and the corresponding values from the reference. Most scanners did not show statistically significant differences compared to the reference (p-value > 0.05). The only scanner that produced statistically significant differences was Easy Face Scan (p-value = 0.003).
Analyzing the mean difference (MD) and its confidence interval, a slight underestimation was observed, with an average discrepancy of only 0.304 mm. This indicates that the scanner generates a 3D facial model slightly smaller than the actual size. However, the average discrepancy was minimal, with a 95% confidence interval ranging from -0.497 mm to -0.110 mm.
In the global context, all scanners demonstrated high reliability in terms of precision, as evidenced by the absence of statistically significant differences in the linear distances measured across the six scans.
The data presented in Table 3 represent the local trueness values of the five scanners, measured at the markers relative to the reference file. As shown, the presence of discrepancies with a mean greater than 0 compared to the reference was tested under the null hypothesis. Consequently, all scanners showed statistically significant differences (p-value < 0.001). However, for almost all scanners, these differences were very close to 0.
In particular, the scanner that showed the highest local trueness values was the Space Spider by Artec 3D, followed by MetiSmile by Shining 3D, Easy Face Scan, and Face Hunter by Zirkonzahn. The only scanner that produced more noticeable differences compared to the reference was RayFace by Micerium.
Regarding local precision, which refers to the ability of scanners to obtain similar measurements during different scans of the same object, without considering the reference value, all the scanners examined showed high levels of precision. This was confirmed by the absence of statistically significant differences between the measurements, irrespective of the reference value (p-values > 0.05) (Table 4).
4. Discussion
This study aimed to evaluate the performance of facial scanning technologies in generating accurate and precise facial representations for clinical use. While professional facial scanners demonstrated high trueness and precision, scanning applications were found unsuitable due to significant limitations in their resolution and dimensions (Figure 8). Thus, the null hypothesis is rejected.
The study highlights several novel contributions to the field. Firstly, it underscores the superior performance of professional facial scanners in both global and local measurements. At the global level, the intraclass correlation coefficient (ICC = 1.000) confirmed perfect agreement for all tested professional scanners, indicating excellent repeatability and reliability. This level of reliability has significant implications for clinical workflows, as consistent and repeatable scans are crucial for ensuring precise treatment planning and execution.
Among the professional scanners evaluated, the Space Spider by Artec 3D emerged as the top performer, as seen in previous studies that highlighted its superior trueness and precision in capturing facial geometries [21,22], excelling in both global precision and local trueness.
In contrast, RayFace by Micerium showed notable limitations in local trueness, indicating potential constraints in its application for treatments requiring high spatial resolution, such as orthodontics or prosthodontics.
Scanning applications, such as Scaniverse, Polycam, MagiScan, and TRNIO Plus, demonstrated significant deviations from the reference models, with undersized or oversized 3D representations. These findings are consistent with earlier research [23] highlighting the limitations of low-cost, non-specialized scanning solutions in capturing complex anatomical details when compared with professional FSs. However, recent studies have demonstrated positive outcomes for these applications [24], and further research is needed to validate their clinical reliability.
Professional-grade facial scanners offer a reliable solution for capturing patient-specific facial geometries, supporting facially driven treatment planning. This approach is particularly beneficial in complex treatment scenarios, such as occlusal plane orientation and the integration of facial aesthetics into prosthetic and orthodontic workflows. Moreover, the study emphasizes the role of high-precision scanning in improving patient involvement and understanding, thereby enhancing overall treatment outcomes. Future research should aim to establish standardized guidelines for the clinical use of facial scanners, addressing factors such as trueness thresholds, compatibility standards, and best practices for integrating scanning technologies into routine workflows. Additionally, using a rigid model removes patient-related variability but fails to reflect real clinical conditions. Future studies should address in vivo variables to enhance applicability.
5. Conclusion
The apps downloadable on devices, due to the limitations of this in-vitro study, showed significant dimensional discrepancies and should continue to be tested. In contrast, professional FSs demonstrated high global trueness and reproducibility, making them reliable tools for the three-dimensional reconstruction of facial morphology.
Clinical Significance
This study evaluates the precision and trueness of professional and mobile facial scanners, highlighting their limitations in dental applications. The findings emphasize the reliability of professional scanners for precise measurements, which aid in treatment planning and digital workflows.
References
- Khurshid, Z. Digital dentistry: transformation of oral health and dental education with technology. Eur J Dent 2023, 17, 943–944. [Google Scholar] [CrossRef]
- Alauddin, M.S.; Baharuddin, A.S.; Mohd Ghazali, M.I. The modern and digital transformation of oral health care: a mini review. Healthcare 2021, 9, 118. [Google Scholar] [CrossRef] [PubMed]
- Vandenberghe, B. The digital patient – imaging science in dentistry. J Dent 2018, 74 (Suppl 1), S21–S26. [Google Scholar] [CrossRef] [PubMed]
- Spagnuolo, G.; Sorrentino, R. The role of digital devices in dentistry: clinical trends and scientific evidences. J Clin Med 2020, 9, 1692. [Google Scholar] [CrossRef]
- Joda, T.; Zarone, F.; Ferrari, M. The complete digital workflow in fixed prosthodontics: a systematic review. BMC Oral Health 2017, 17, 124. [Google Scholar] [CrossRef] [PubMed]
- Fasbinder, D. Using digital technology to enhance restorative dentistry. Compend Contin Educ Dent 2012, 33, 666–668. [Google Scholar]
- Politi, M.; Perrotti, G.; Testori, T. Face-Scan: utilizzo clinico della scansione facciale in ambito diagnostico, terapeutico-riabilitativo implantare e ortodontico. Quintessence Int 2014, 30, 80–83. [Google Scholar]
- Li, Q.; Bi, M.; Yang, K.; Liu, W. The creation of a virtual dental patient with dynamic occlusion and its application in esthetic dentistry. J Prosthet Dent 2021, 126, 14–18. [Google Scholar] [CrossRef]
- Ayoub, A.F.; Xiao, Y.; Khambay, B.; Siebert, J.P.; Hadley, D. Towards building a photo-realistic virtual human face for craniomaxillofacial diagnosis and treatment planning. Int J Oral Maxillofac Surg 2007, 36, 423–428. [Google Scholar] [CrossRef]
- Joda, T.; Gallucci, G.O. The virtual patient in dental medicine. Clin Oral Implants Res 2015, 26, 725–726. [Google Scholar] [CrossRef]
- Kravitz, N.D.; Groth, C.; Jones, P.E.; Graham, J.W.; Redmond, W.R. Intraoral digital scanners. J Clin Orthod 2014, 48, 337–347. [Google Scholar] [PubMed]
- Giavarina, D. Understanding Bland Altman analysis. Biochem Med (Zagreb) 2015, 25, 141–151. [Google Scholar] [CrossRef]
- Lee, J.D.; Nguyen, O.; Lin, Y.C.; Luu, D.; Kim, S.; Amini, A.; Lee, S.J. Facial scanners in dentistry: an overview. Prosthesis 2022, 4, 664–678. [Google Scholar] [CrossRef]
- Harris, B.T.; Montero, D.; Grant, G.T.; Morton, D.; Llop, D.R.; Lin, W.S. Creation of a 3-dimensional virtual dental patient for computer-guided surgery and CAD-CAM interim complete removable and fixed dental prostheses: a clinical report. J Prosthet Dent 2017, 117, 197–204. [Google Scholar] [CrossRef] [PubMed]
- Feng, Y.; Zhan, L.; Sun, X.; et al. A fully digital workflow to register maxillomandibular relation using a jaw motion tracer for fixed prosthetic rehabilitation: a technical report. J Esthet Restor Dent 2023, 35, 1068–1076. [Google Scholar] [CrossRef]
- International Organization for Standardization. ISO 5725-1:1994; Accuracy (trueness and precision) of measurement methods and results – Part 1: General principles and definitions. Geneva: ISO, 1994.
- Gallardo, Y.N.R.; Salazar-Gamarra, R.; Bohner, L.; De Oliveira, J.I.; Dib, L.L.; Sesma, N. Evaluation of the 3D error of 2 face-scanning systems: an in vitro analysis. J Prosthet Dent 2023, 129, 630–636. [Google Scholar] [CrossRef]
- Ozsoy, U.; Sekerci, R.; Hizay, A.; Yildirim, Y.; Uysal, H. Assessment of reproducibility and reliability of facial expressions using a 3D handheld scanner. J Craniomaxillofac Surg 2019, 47, 895–901. [Google Scholar] [CrossRef]
- Bohner, L.; Gamba, D.D.; Hanisch, M.; Marcio, B.S.; Tortamano Neto, P.; Laganá, D.C.; Sesma, N. Accuracy of digital technologies for the scanning of facial, skeletal, and intraoral tissues: a systematic review. J Prosthet Dent 2019, 121, 246–251. [Google Scholar] [CrossRef]
- Zhao, Y.J.; Xiong, Y.X.; Wang, Y. Three-dimensional accuracy of facial scan for facial deformities in clinics: a new evaluation method for facial scanner accuracy. PLoS One 2017, 12, e0169402. [Google Scholar] [CrossRef]
- Schipper, J.A.M.; Merema, B.J.; Hollander, M.H.J.; Spijkervet, F.K.L.; Dijkstra, P.U.; Jansma, J.; Schepers, R.H.; Kraeima, J. Reliability and validity of handheld structured light scanners and a static stereophotogrammetry system in facial three-dimensional surface imaging. Sci Rep 2024, 14, 8172. [Google Scholar] [CrossRef]
- Ritschl, L.M.; Classen, C.; Kilbertus, P.; Eufinger, J.; Storck, K.; Fichter, A.M.; Wolff, K.D.; Grill, F.D. Comparison of three-dimensional imaging of the nose using three different 3D-photography systems: an observational study. Head Face Med 2024, 20, 7. [Google Scholar] [CrossRef] [PubMed]
- Jindanil, T.; Xu, L.; Fontenele, R.C.; Cadenas de Llano Perula, M.; Jacobs, R. Smartphone applications for facial scanning: a technical and scoping review. Orthod Craniofac Res 2024, 27, 65–87. [Google Scholar] [CrossRef] [PubMed]
- Abdelhakim, N.A.; Salazar-Gamarra, R.; Segaan, L.G.; Soliman, I.S. Evaluation of different technologies used for extraoral surface data acquisition for 3D facial scanning. J Prosthodont Res, 2025; In press. [Google Scholar]
Figure 1.
A three-dimensional facial model made of polyvinyl chloride, with dimensions, shape, and proportions comparable to those of the human face, was used.
Figure 1.
A three-dimensional facial model made of polyvinyl chloride, with dimensions, shape, and proportions comparable to those of the human face, was used.
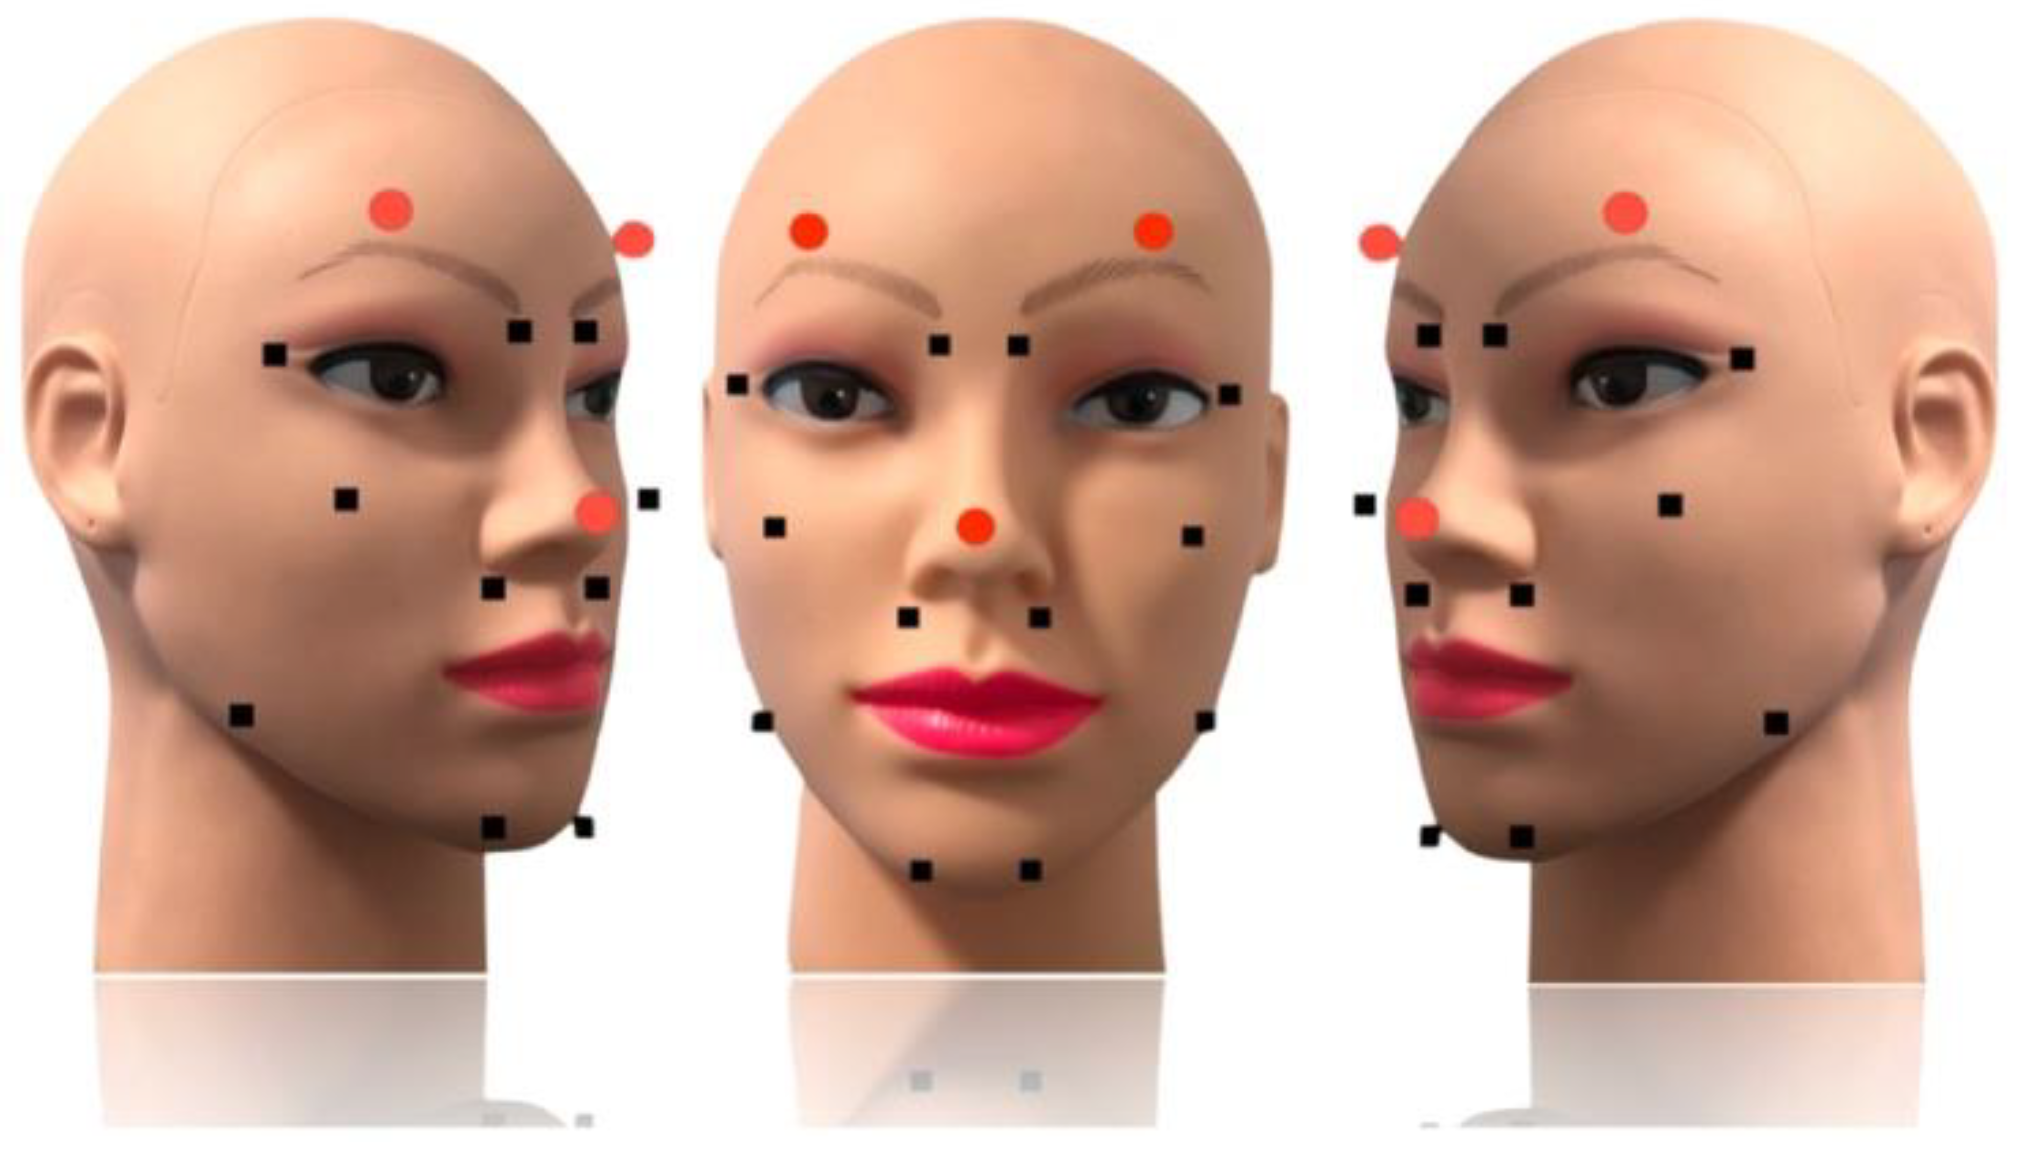
Figure 2.
Markers permanently attached using a liquid cyanoacrylate-based adhesive to ensure the repeatability of various scans.
Figure 2.
Markers permanently attached using a liquid cyanoacrylate-based adhesive to ensure the repeatability of various scans.
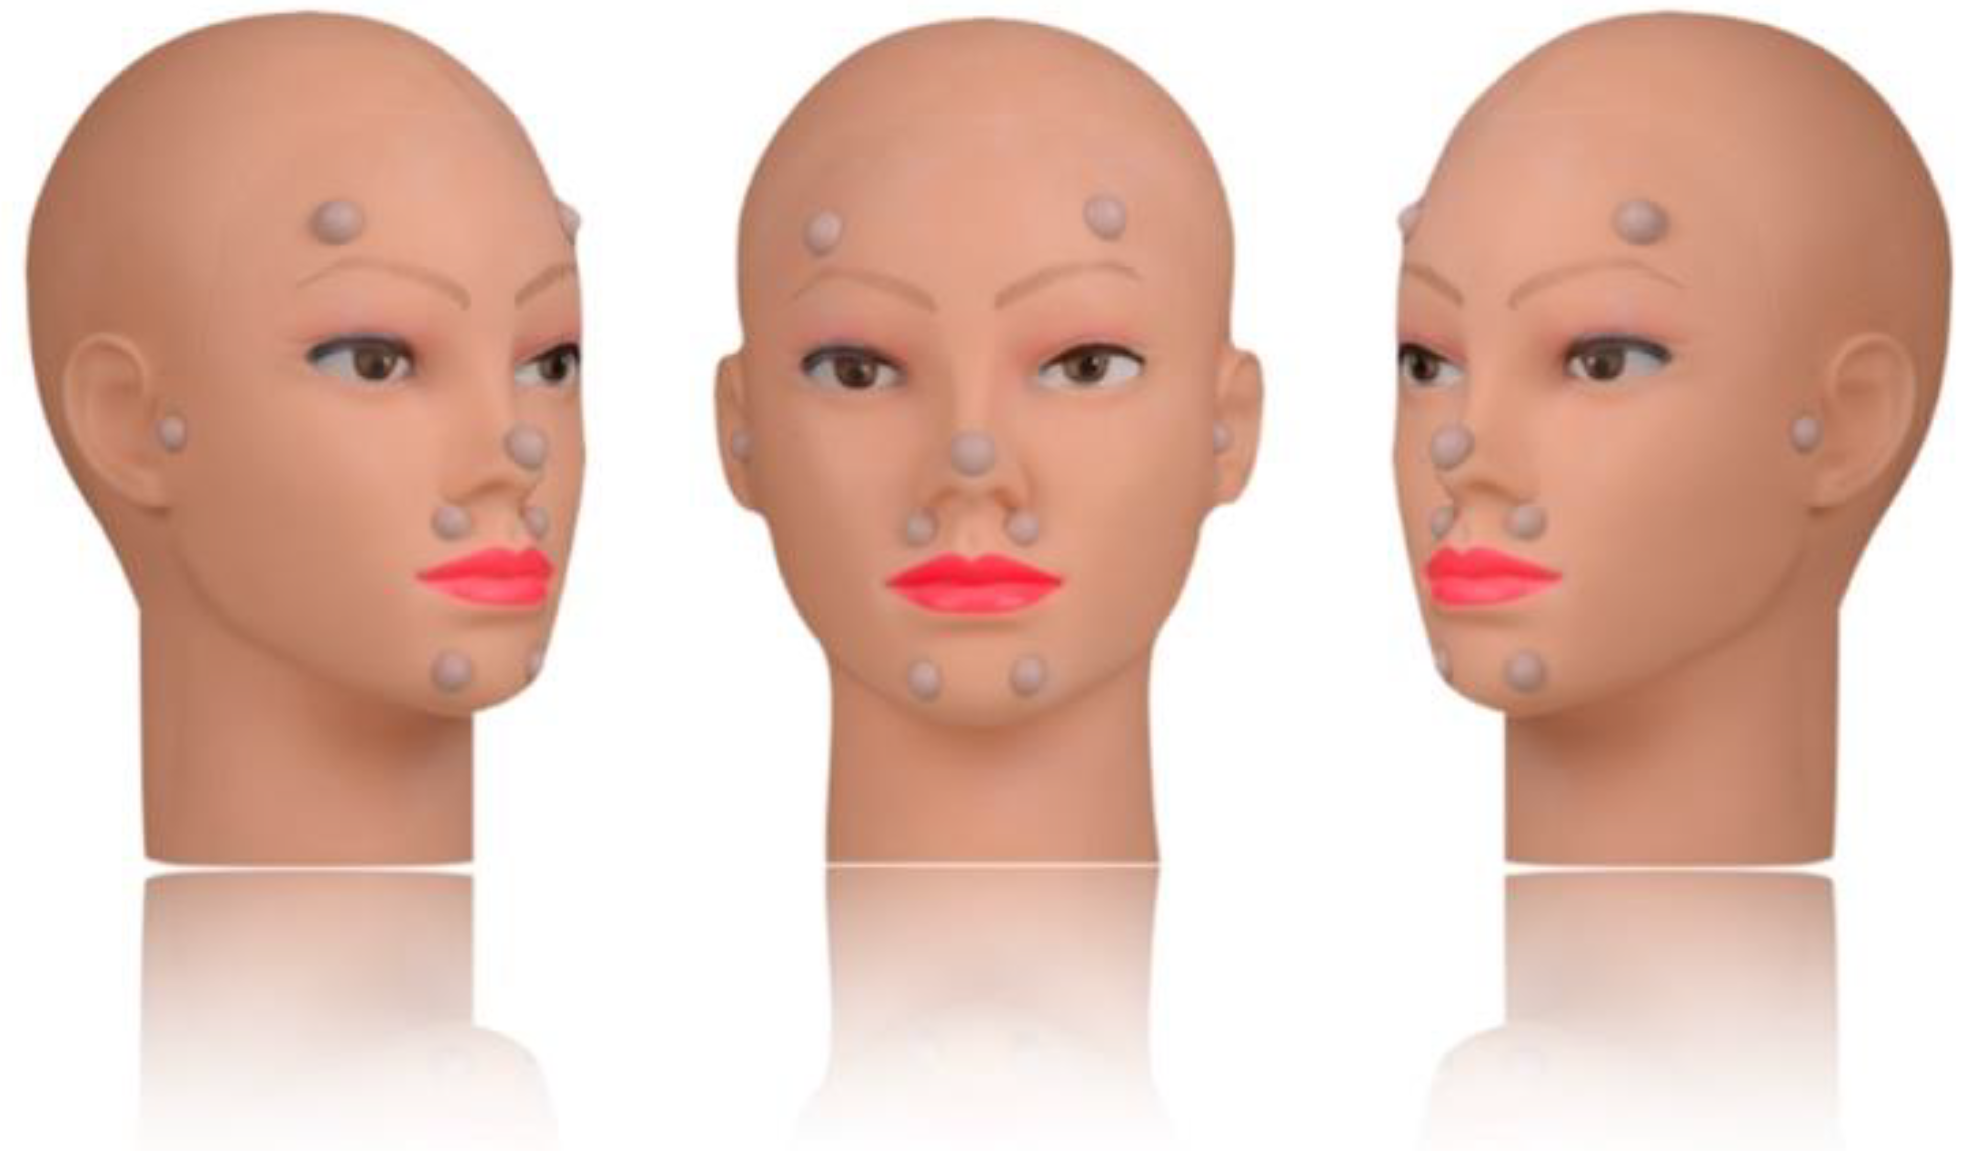
Figure 3.
This software feature enables the software to determine the optimal positioning based on the acquired data and the actual alignment.
Figure 3.
This software feature enables the software to determine the optimal positioning based on the acquired data and the actual alignment.
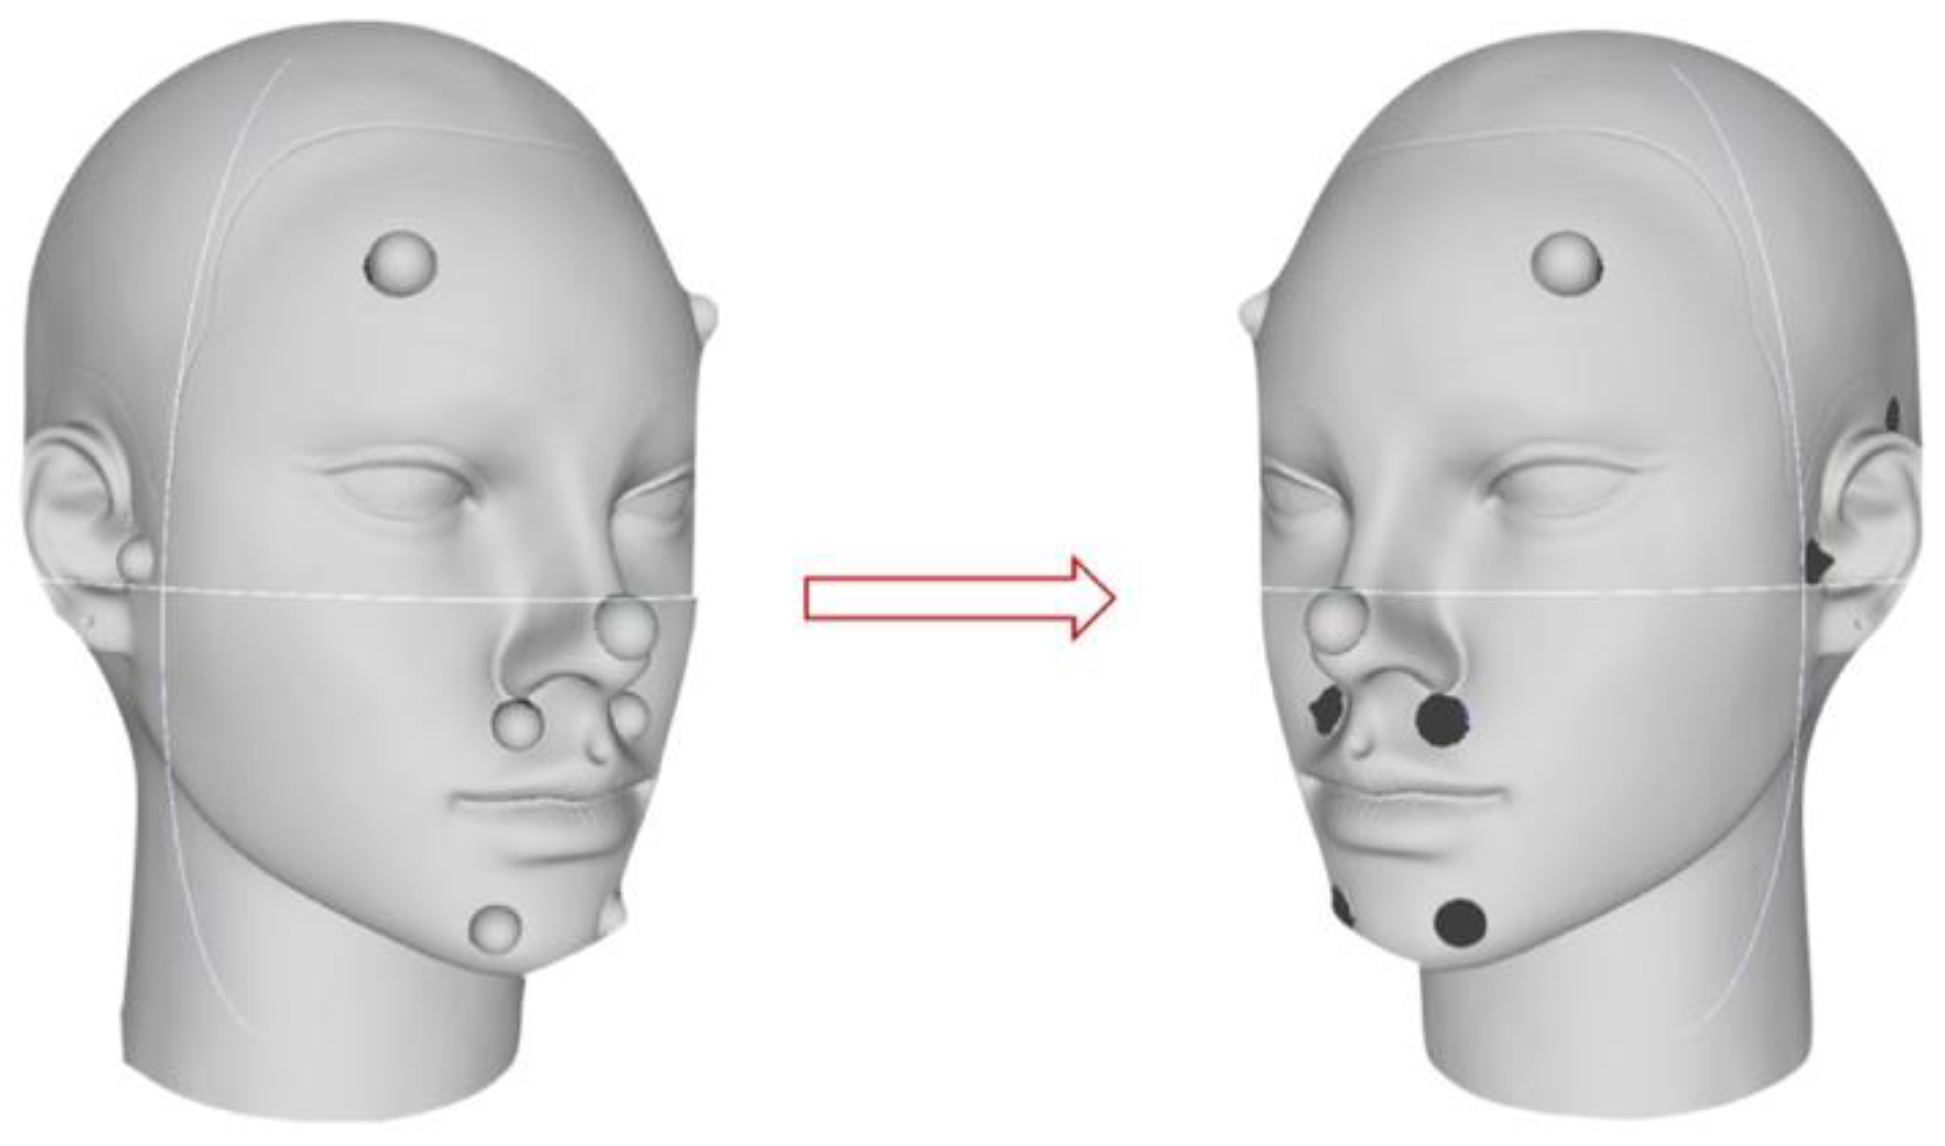
Figure 4.
The distances were chosen to assess the trueness of the various scanners in relation to the measurements in the reference file: right nose wing - right tragus, left nose wing – left tragus, right tragus – right chin, right tragus – left chin, right nose wing - left nose wing, right chin – left chin, right nose wing – right chin, left nose wing - left chin.
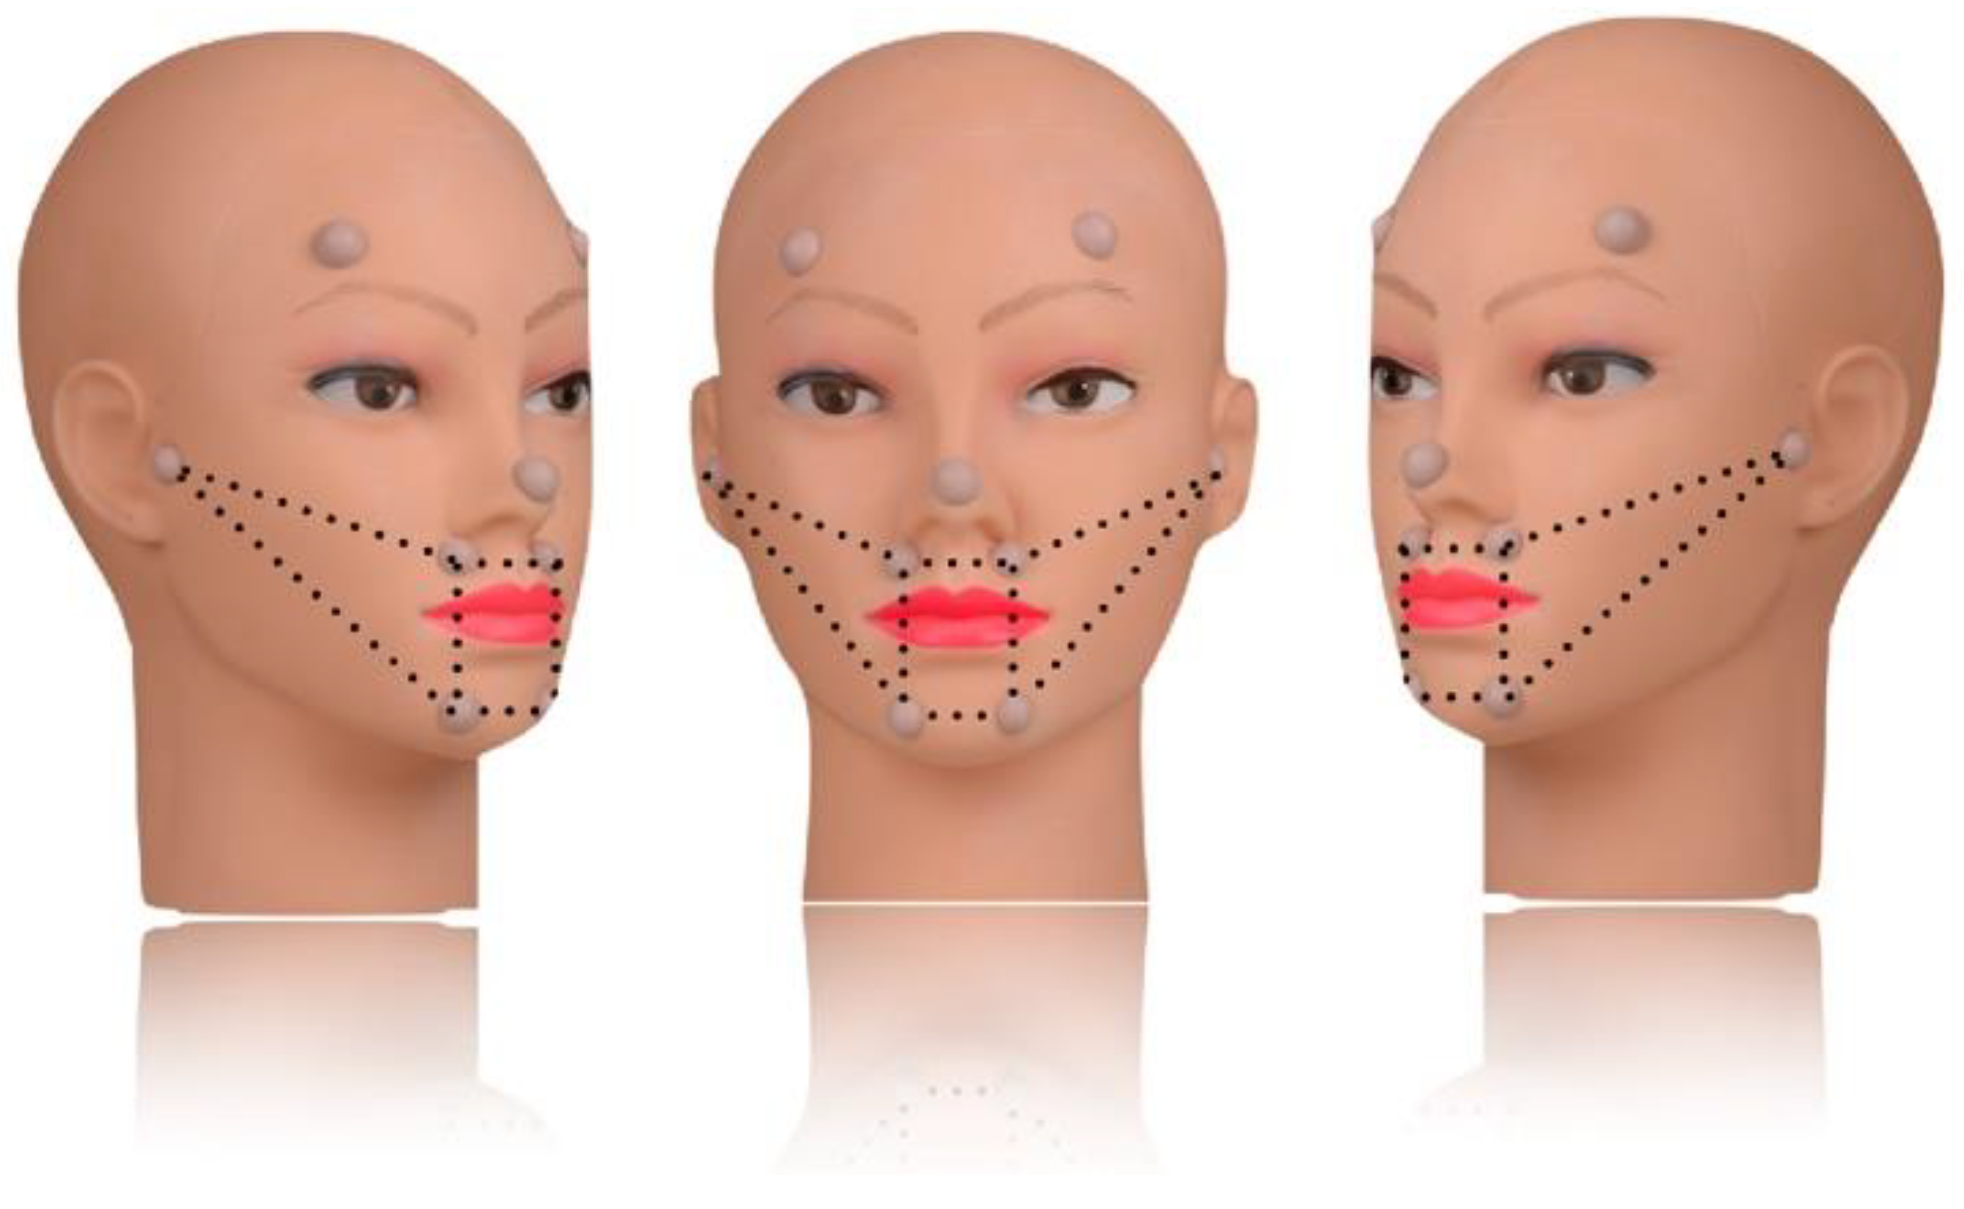
Figure 5.
A volumetric conversion library specifically created to enable the geometric alignment of the reference points by matching each reference point with the conical geometry.
Figure 5.
A volumetric conversion library specifically created to enable the geometric alignment of the reference points by matching each reference point with the conical geometry.
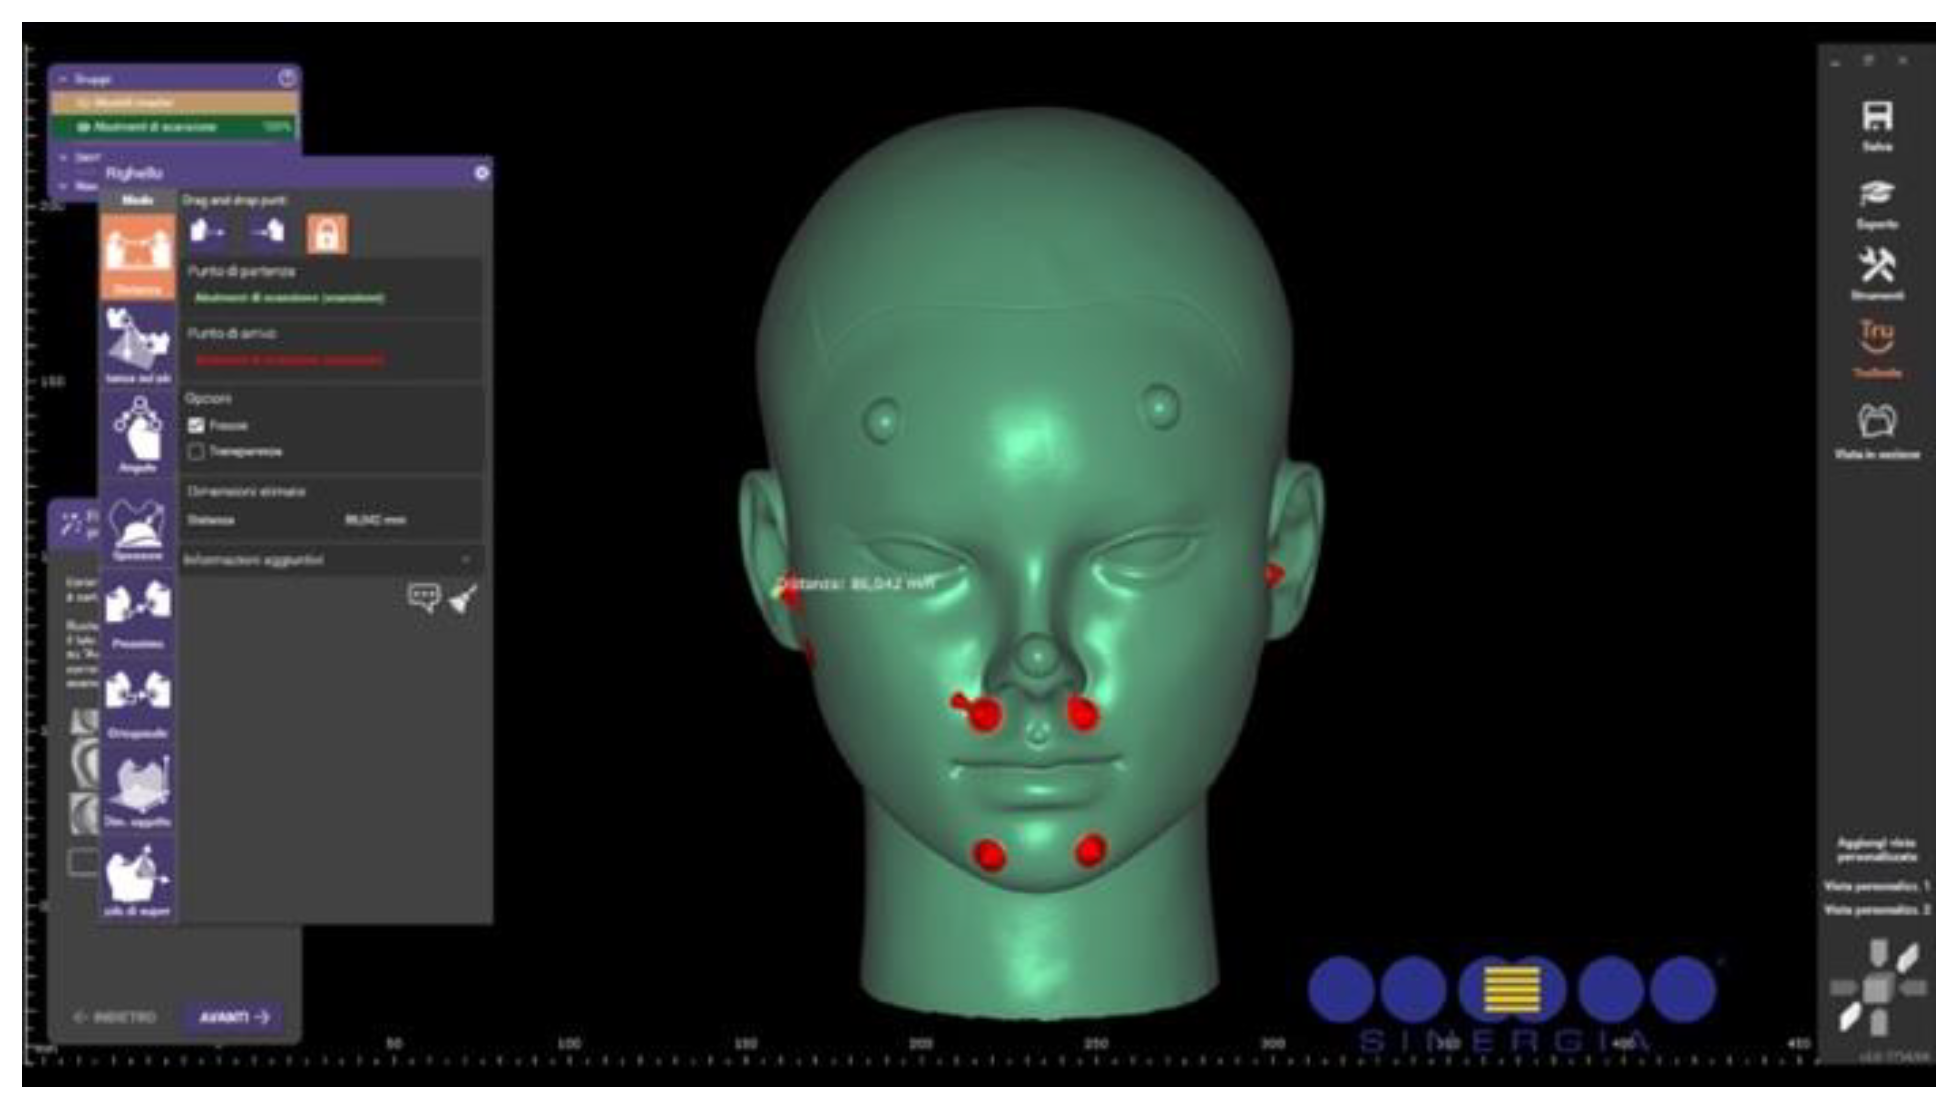
Figure 6.
A volumetric conversion library specifically created to enable the geometric alignment of the reference points by matching each reference point with the conical geometry.
Figure 6.
A volumetric conversion library specifically created to enable the geometric alignment of the reference points by matching each reference point with the conical geometry.
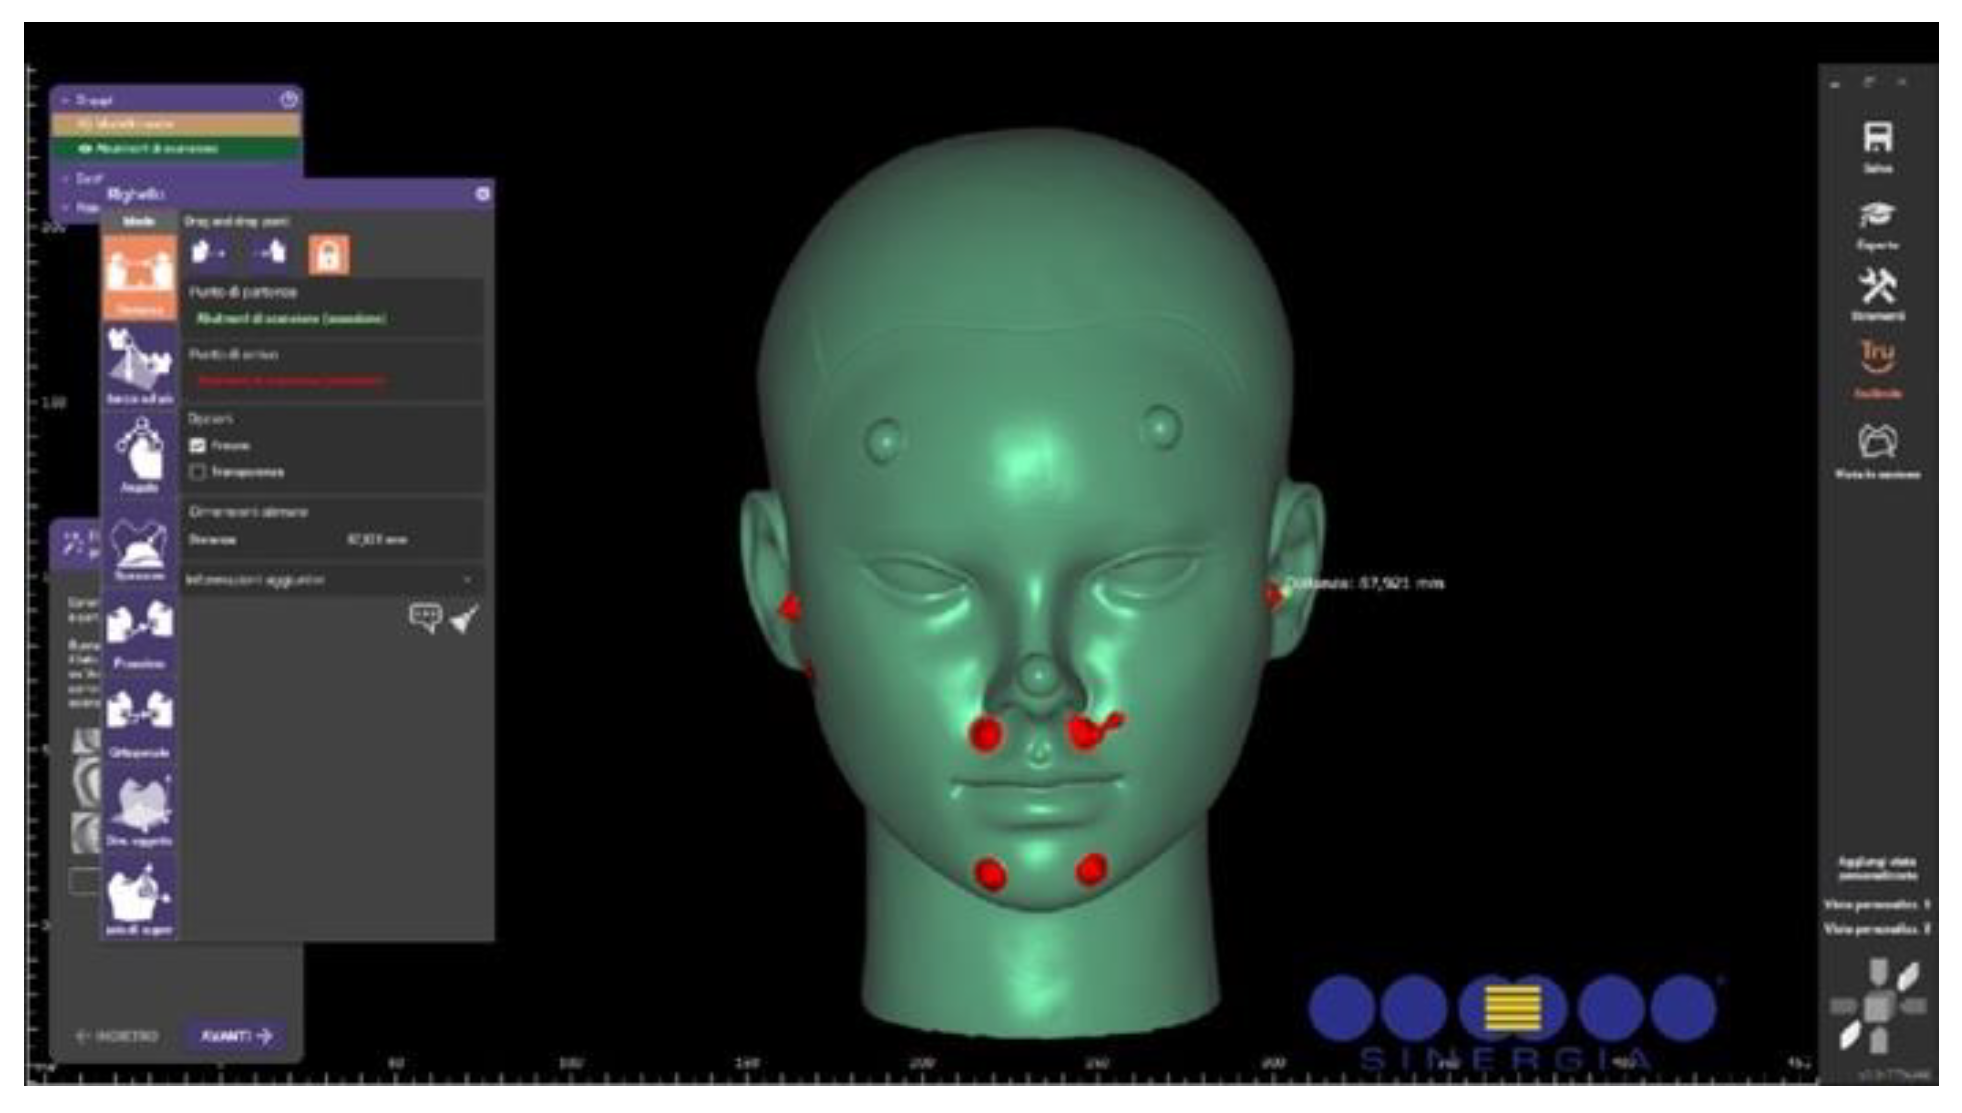
Figure 7.
Analysis of the axial distance between the scanned reference surface and the hemisphere surface on the reference model, at the cone apex, to assess local trueness.
Figure 7.
Analysis of the axial distance between the scanned reference surface and the hemisphere surface on the reference model, at the cone apex, to assess local trueness.
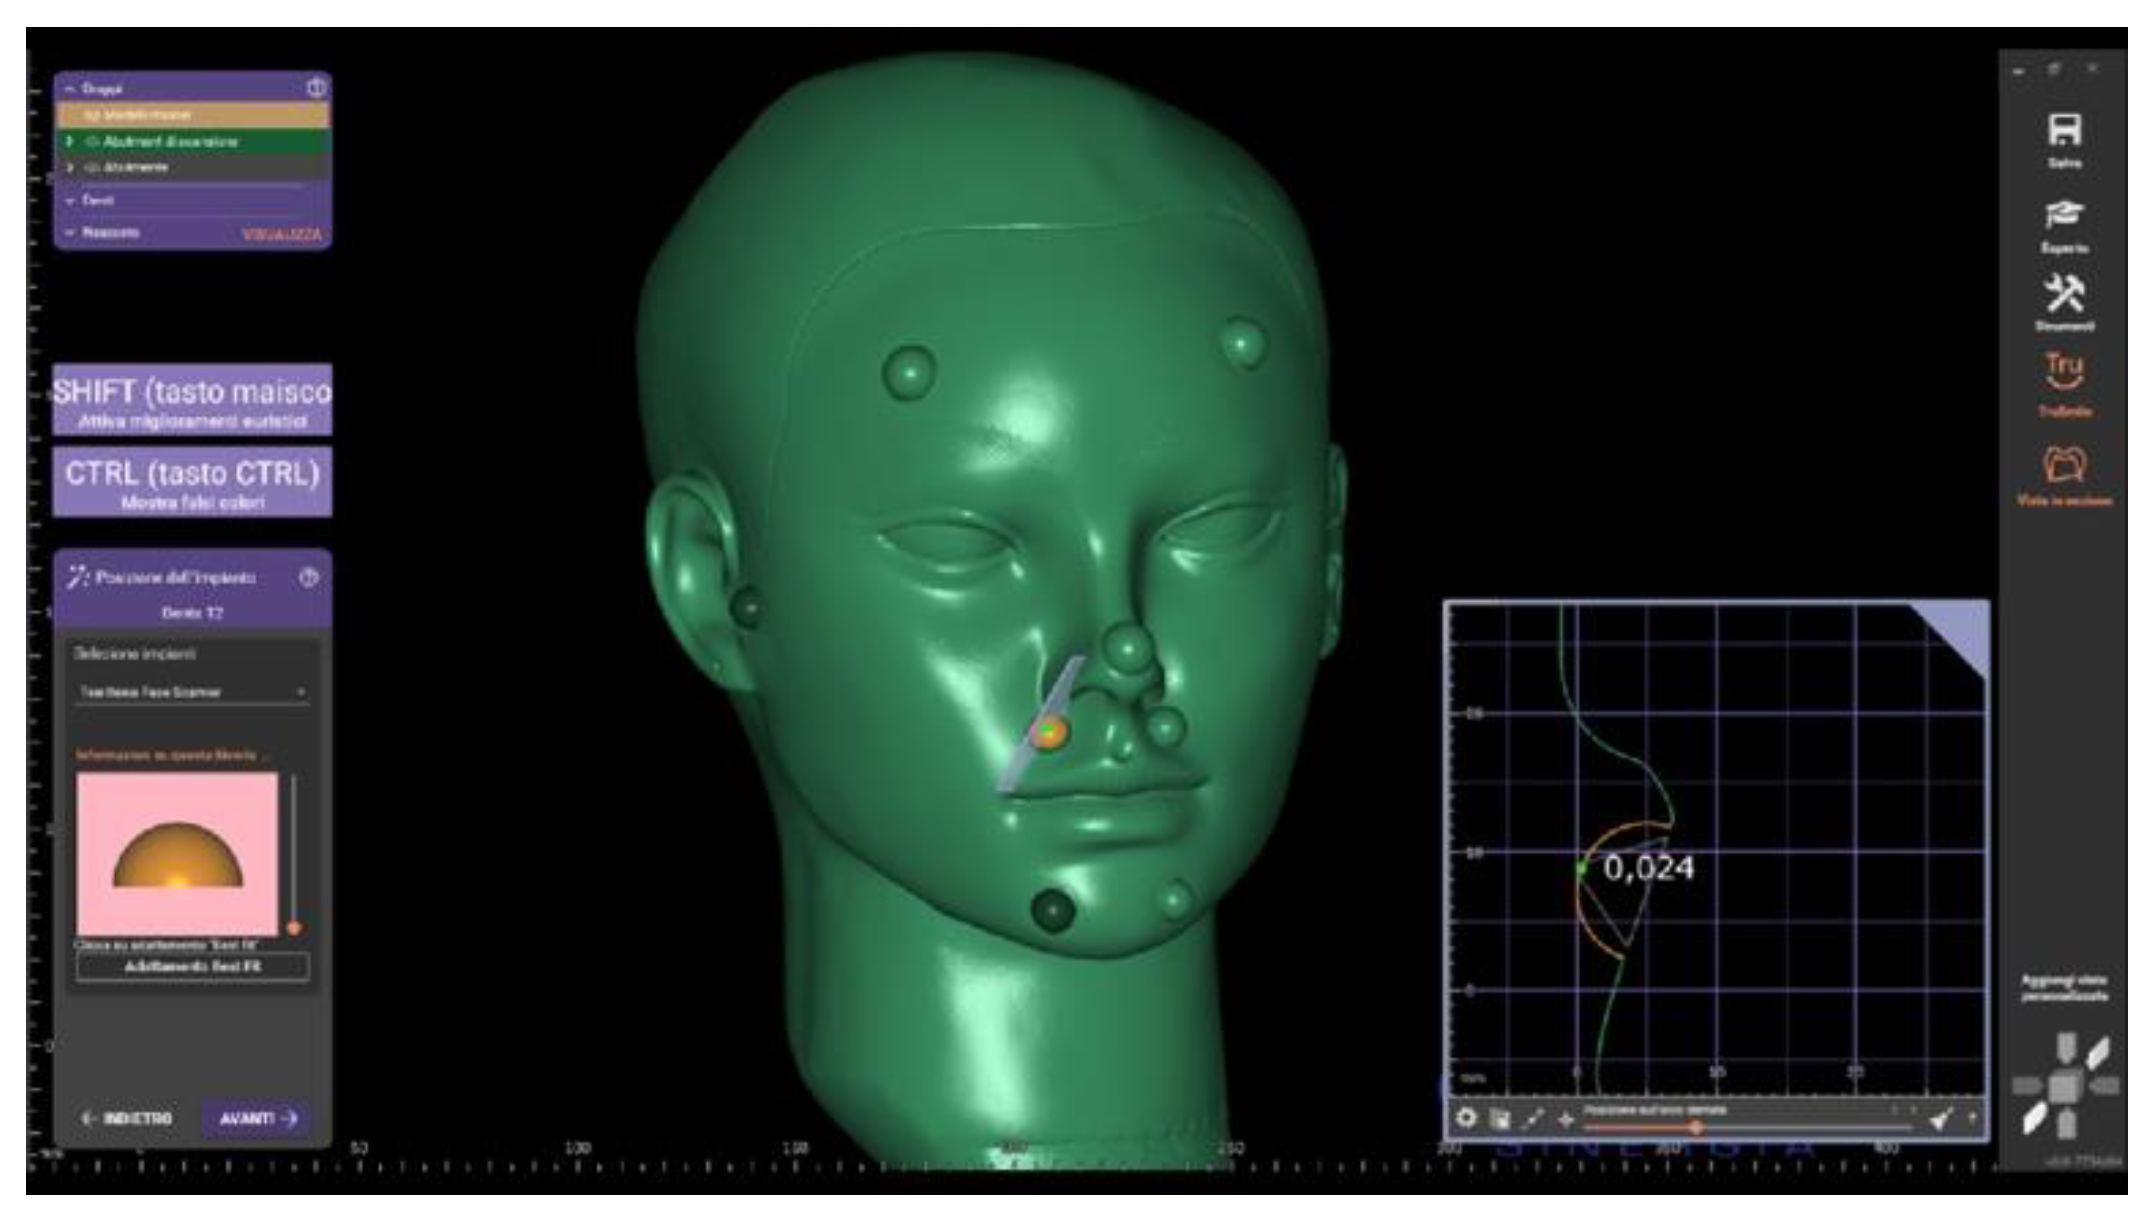
Figure 8.
The limited resolution of the images generated by the scanning apps does not meet the requirement for capturing high-precision details of the perioral tissues.
Figure 8.
The limited resolution of the images generated by the scanning apps does not meet the requirement for capturing high-precision details of the perioral tissues.
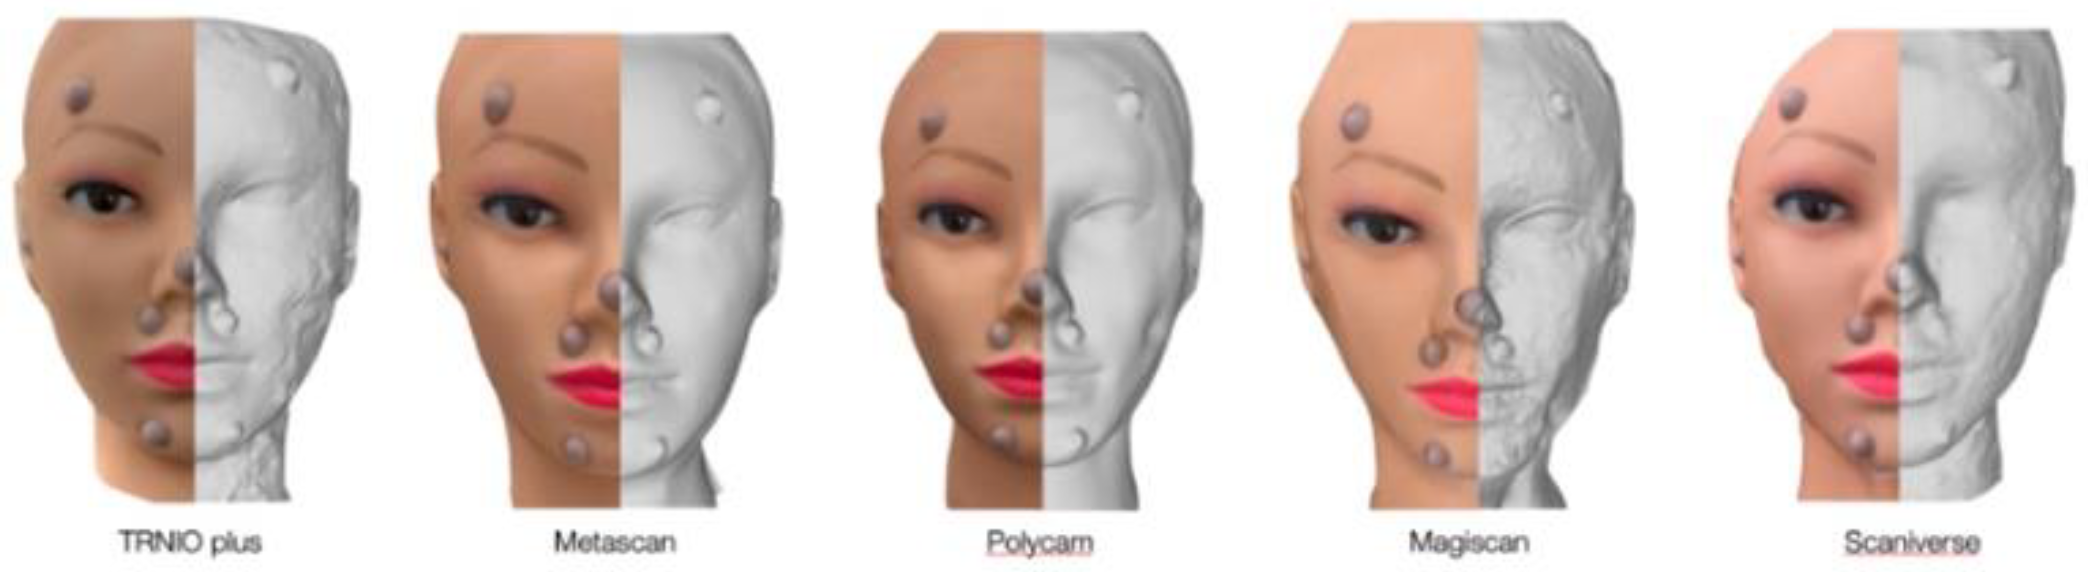

Table 1.
Reference - Linear Distances (mm).
| Reference Point | Ala - Right tragus | Ala - Left tragus | Tragus - Right chin | Tragus - Left chin | Right chin – Left chin | Right Ala - Left Ala | Ala - Right chin | Ala – Left chin |
| Distance (mm) | 86,042 | 87,921 | 106,23 | 107,19 | 33,26 | 32,701 | 43,95 | 41,404 |
Table 2.
The arithmetic mean and standard deviation of the linear distances measured during the six scans, along with the discrepancies at each reference point compared to the reference file.
Table 2.
The arithmetic mean and standard deviation of the linear distances measured during the six scans, along with the discrepancies at each reference point compared to the reference file.
| LINEAR MEASUREMENTS | DISCREPANCIES to reference file | |||
| DISTANCE (mm) | Mean ± SD | MARKER DISCREPANCY (mm) | Mean ± SD | |
| RAYFACE | Right ala - Right tragus | 85,39733±0,810033 | Right tragus | 1,2318333±0,0542749 |
| Left ala - Left tragus | 87,567±0,293826 | Left tragus | 1,1466667±0,2555853 | |
| Right tragus- Right chin | 106,0583±0,711152 | Right chin | 1,0586667±0,1369199 | |
| Left tragus - Left chin | 106,7033±0,567368 | Left chin | 1.0211667±0,2038994 | |
| Right ala - Left ala | 33,023±0,565392 | Right ala | 1,4261667±0,119949 | |
| Right chin-Left chin | 33,22833±0,584853 | Left ala | 1,3331667±0,1246859 | |
| Right ala - Right chin | 42,83733±0,448235 | |||
| Left ala – Left chin | 42,44233±0,498875 | |||
| FACE HUNTER | Right ala - Right tragus | 86,234833±0,3304841 | Right tragus | 0,076±0,0279285 |
| Left ala - Left tragus | 87,418±0,2159537 | Left tragus | 0,0915±0,0550373 | |
| Right tragus- Right chin | 106,26133±0,2902052 | Right chin | 0,092±0,0459783 | |
| Left tragus - Left chin | 106,34033±0,2106577 |
Left chin | 0,061±0,0283761 | |
| Right ala - Left ala | 33,27±0,1906137 | Right ala | 0,1515±0,1117654 | |
| Right chin-Left chin | 31,892833±0,0991068 | Left ala | 0,133±0,0819463 | |
| Right ala - Right chin | 43,283333±0,1710096 | |||
| Left ala – Left chin | 42,6815±0,1536838 | |||
| ARTEC | Right ala - Right tragus | 86,6095±0,0478362 | Right tragus | 0,0301667±0,0194979 |
| Left ala - Left tragus | 87,655833±0,1523134 | Left tragus | 0,0285±0,0213049 | |
| Right tragus- Right chin | 106,7545±0,2159831 | Right chin | 0,0213333±0,0135154 | |
| Left tragus - Left chin | 106,69417±0,17686554 | Left chin | 0,0155±0,0075565 | |
| Right ala - Left ala | 33,414333±0,1468219 | Right ala | 0,0268333±0,0054559 | |
| Right chin-Left chin | 31,852667±0,132408 | Left ala | 0,0245±0,0070356 | |
| Right ala - Right chin | 43,784667±0,0827663 | |||
| Left ala – Left chin | 42,639333±0,1205416 | |||
| EASY FACE SCAN | Right ala - Right tragus | 85,92566667±0,133627343 | Right tragus | 0,0223333±0,0079666 |
| Left ala - Left tragus | 87,863167±0,0950693 | Left tragus | 0,0575±0,0549731 | |
| Right tragus- Right chin | 105,78283±0,0889931 | Right chin | 0.1225±0,078457 | |
| Left tragus - Left chin | 106,31733±0,1052609 | Left chin | 0,0703333±0,0266658 | |
| Right ala - Left ala | 33,858167±0,2365091 | Right ala | 0,0353333±0,016765 | |
| Right chin-Left chin | 32,005±0,2443497 | Left ala | 0,0346667±0,0219332 | |
| Right ala - Right chin | 42,521333±0,0649605 | |||
| Left ala – Left chin | 41,995667±0,0510399 | |||
| METISMILE | Right ala - Right tragus | 87,045667±0,0977766 | Right tragus | 0,0195±0,0222778 |
| Left ala - Left tragus | 88,545333±0,0918296 | Left tragus | 0,028±0,0231517 | |
| Right tragus- Right chin | 107,01±0,0504738 | Right chin | 0,0245±0,0138672 | |
| Left tragus - Left chin | 107,02533±0,0587424 | Left chin | 0,0213333±0,0100731 | |
| Right ala - Left ala | 33,1875±0,0916488 | Right ala | 0,0198333±0,0108336 | |
| Right chin-Left chin | 31,340167±0,1110089 | Left ala | 0,0465±0,0135462 | |
| Right ala - Right chin | 43,289±0,0936739 | |||
| Left ala – Left chin | 42,573667±0,0834306 |
Table 3.
Local Trueness Values of the Five Scanners: -MD: Mean of the differences between the obtained measurements. -95% CI LOW/UP: 95% Confidence Interval – Lower and Upper Limits.
Table 3.
Local Trueness Values of the Five Scanners: -MD: Mean of the differences between the obtained measurements. -95% CI LOW/UP: 95% Confidence Interval – Lower and Upper Limits.
| Scanner | MD | 95 CI.LOW | 95 CI.UP | P.VALUE* |
| ARTEC | 0,024 | 0,020 | 0,029 | <0,001 |
| EASY FACE SCAN | 0,057 | 0,040 | 0,075 | <0,001 |
| FACE HUNTER | 0,101 | 0,078 | 0,124 | <0,001 |
| METISMILE | 0,027 | 0,021 | 0,033 | <0,001 |
| RAYFACE | 1,203 | 1,132 | 1,274 | <0,001 |
Table 4.
Local Precision.
| MD | 95% CI LOW | 95% CI UP | P-VALUE | ||
| MEASUREMENT | 1 | Reference | |||
| 2 | 0,002 | -0,046 | 0,051 | 0,921 | |
| 3 | 0,001 | -0,047 | 0,050 | 0,953 | |
| 4 | 0,002 | -0,047 | 0,050 | 0,948 | |
| 5 | 0,016 | -0,032 | 0,065 | 0,524 | |
| 6 | -0,040 | -0,088 | 0,009 | 0,119 |
Disclaimer/Publisher’s Note: The statements, opinions and data contained in all publications are solely those of the individual author(s) and contributor(s) and not of MDPI and/or the editor(s). MDPI and/or the editor(s) disclaim responsibility for any injury to people or property resulting from any ideas, methods, instructions or products referred to in the content. |
© 2025 by the authors. Licensee MDPI, Basel, Switzerland. This article is an open access article distributed under the terms and conditions of the Creative Commons Attribution (CC BY) license (http://creativecommons.org/licenses/by/4.0/).
Copyright: This open access article is published under a Creative Commons CC BY 4.0 license, which permit the free download, distribution, and reuse, provided that the author and preprint are cited in any reuse.


