
Submitted:
05 September 2025
Posted:
08 September 2025
You are already at the latest version
Abstract
Mechanical characterization of fiber-reinforced composites is a cornerstone of materials engineering but typically relies on destructive and time-consuming experimental protocols. To address this limitation, we present a novel deep learning framework that leverages image-based analysis for automated prediction of tensile behavior in 3D-printed fiber-reinforced nylon composites. The proposed system integrates a YOLOv8n object detection model with a Convolutional Neural Network (CNN), using scanning electron microscopy (SEM) images as input. The YOLOv8n model was trained to detect and quantify deformation regions before and after tensile testing, achieving an accuracy of 0.93, precision of 0.895, recall of 0.832, F1-score of 0.899, and a Matthews correlation coefficient (MCC) of 0.851 for deformation classification. Complementarily, the CNN was employed to predict the deformation rate directly from raw SEM image data. These outputs were further processed to estimate maximum deformation rate and ultimate tensile load, yielding near-perfect agreement with experimental measurements (R² = 0.9995, Pearson r = 0.9998). Model interpretability was enhanced through Gradient-weighted Class Activation Mapping (Grad-CAM), which highlighted the localized image features most influential in CNN predictions. By combining high-resolution imaging, robust object detection, and predictive modeling, this framework provides an accurate, explainable, and scalable solution for virtual mechanical testing. The proposed approach has potential to reduce reliance on destructive testing, accelerate composite material design, and facilitate the development of digital twins for advanced manufacturing applications.
Keywords:
3D Printed Composites
; Fiber Reinforced Nylon
; Scanning Electron Microscopy (SEM)
; YOLOv8
; Deformation Detection
1. Introduction
In recent years, the development and adoption of 3D printing technologies have expanded rapidly across various industrial sectors including aerospace, automotive, medical devices, and consumer products [1,2]. Among the wide range of printable materials, nylon reinforced with fibers has emerged as a popular choice due to its enhanced mechanical properties, including increased strength, flexibility, and thermal resistance [3,4]. The reinforcement of nylon with short or continuous fibers, such as carbon or glass, allows for the creation of lightweight components that maintain structural integrity under mechanical stress [5,6,7]. This makes fiber-reinforced nylon composites highly suitable for applications that demand both durability and design flexibility, especially in custom or low-volume production environments [8,9].
To assess the mechanical performance of fiber-reinforced nylon materials, tensile testing serves as one of the most essential experimental procedures [10]. In its most common configuration, a specimen is gripped at both ends and subjected to a gradually increasing axial force until it fractures [11]. The applied force is recorded as the load, and the corresponding elongation of the specimen is tracked as displacement [12]. These two parameters are fundamental in generating a load-displacement curve, which visually represents how the material responds to mechanical stress over time [13,14]. The test is typically conducted using a universal testing machine equipped with precision load cells and extensometers or linear variable displacement transducers, which ensure accurate real-time data acquisition [15,16].
The shape and features of the load-displacement curve reveal important aspects of the material’s behavior under tension [17]. The initial slope of the curve indicates stiffness, which corresponds to the material’s resistance to elastic deformation [18]. As the load increases, the curve typically transitions through distinct phases such as the elastic region, yield point, plastic deformation region, and finally the point of fracture [19]. Each of these regions provides insight into specific mechanical properties including elastic modules, yield strength, tensile strength, and strain-to-failure [20]. These properties are critical for engineers and researchers to understand whether a material can meet the requirements of a specific application, especially when reliability and safety are of primary concern [21]. Accurate interpretation of tensile test results is therefore vital in material selection, quality control, and structural design processes [22].
Technological advances in imaging analysis and computational diagnostics have opened new pathways for evaluating the mechanical performance of advanced materials, providing researchers with more refined tools for predictive modeling and structural assessment [23,24]. Artificial intelligence, particularly machine learning and deep learning, has demonstrated considerable potential in transforming the way materials are characterized and analyzed [25,26]. Machine learning has significantly influenced diverse fields such as natural language processing, autonomous systems, biomedical engineering, and image-based diagnostics [27].
Among the various architectures in deep learning, Convolutional Neural Networks have shown exceptional effectiveness in analyzing image-based data, such as microscopic and diagnostic images used in materials science and mechanical characterization [28,29]. CNNs are specifically engineered to capture spatial and structural features using convolutional filters that extract localized patterns within an image [30]. One of the most well-known CNN-based object detection frameworks is the You Only Look Once family, which has gained attention for its ability to perform rapid and precise localization of features within a single forward pass [31]. The latest iteration, YOLOv8, applies advanced convolutional techniques to identify and extract relevant spatial hierarchies from visual data, including complex microstructural patterns observed in scanning electron microscopy [32].
Recent studies have demonstrated the effectiveness of machine learning in predicting mechanical properties across various material systems, including metals, composites, and geological materials as summarized in Table 1. Techniques such as artificial neural networks, graph neural networks, and convolutional models have been widely applied to estimate stress strain behavior, typically relying on structured numerical datasets, simulation derived data, or manually engineered features. By integrating YOLOv8n and CNN models to detect and quantify microstructural deformation, applying a novel calculation strategy to derive ultimate load and deformation rate, and using Grad CAM visualizations to interpret model predictions, our approach captures material behavior directly from image data. This enables fully automated and scalable prediction of mechanical performance without reliance on predefined variables or simulation data, marking a significant step toward data driven material characterization grounded in high resolution imaging.
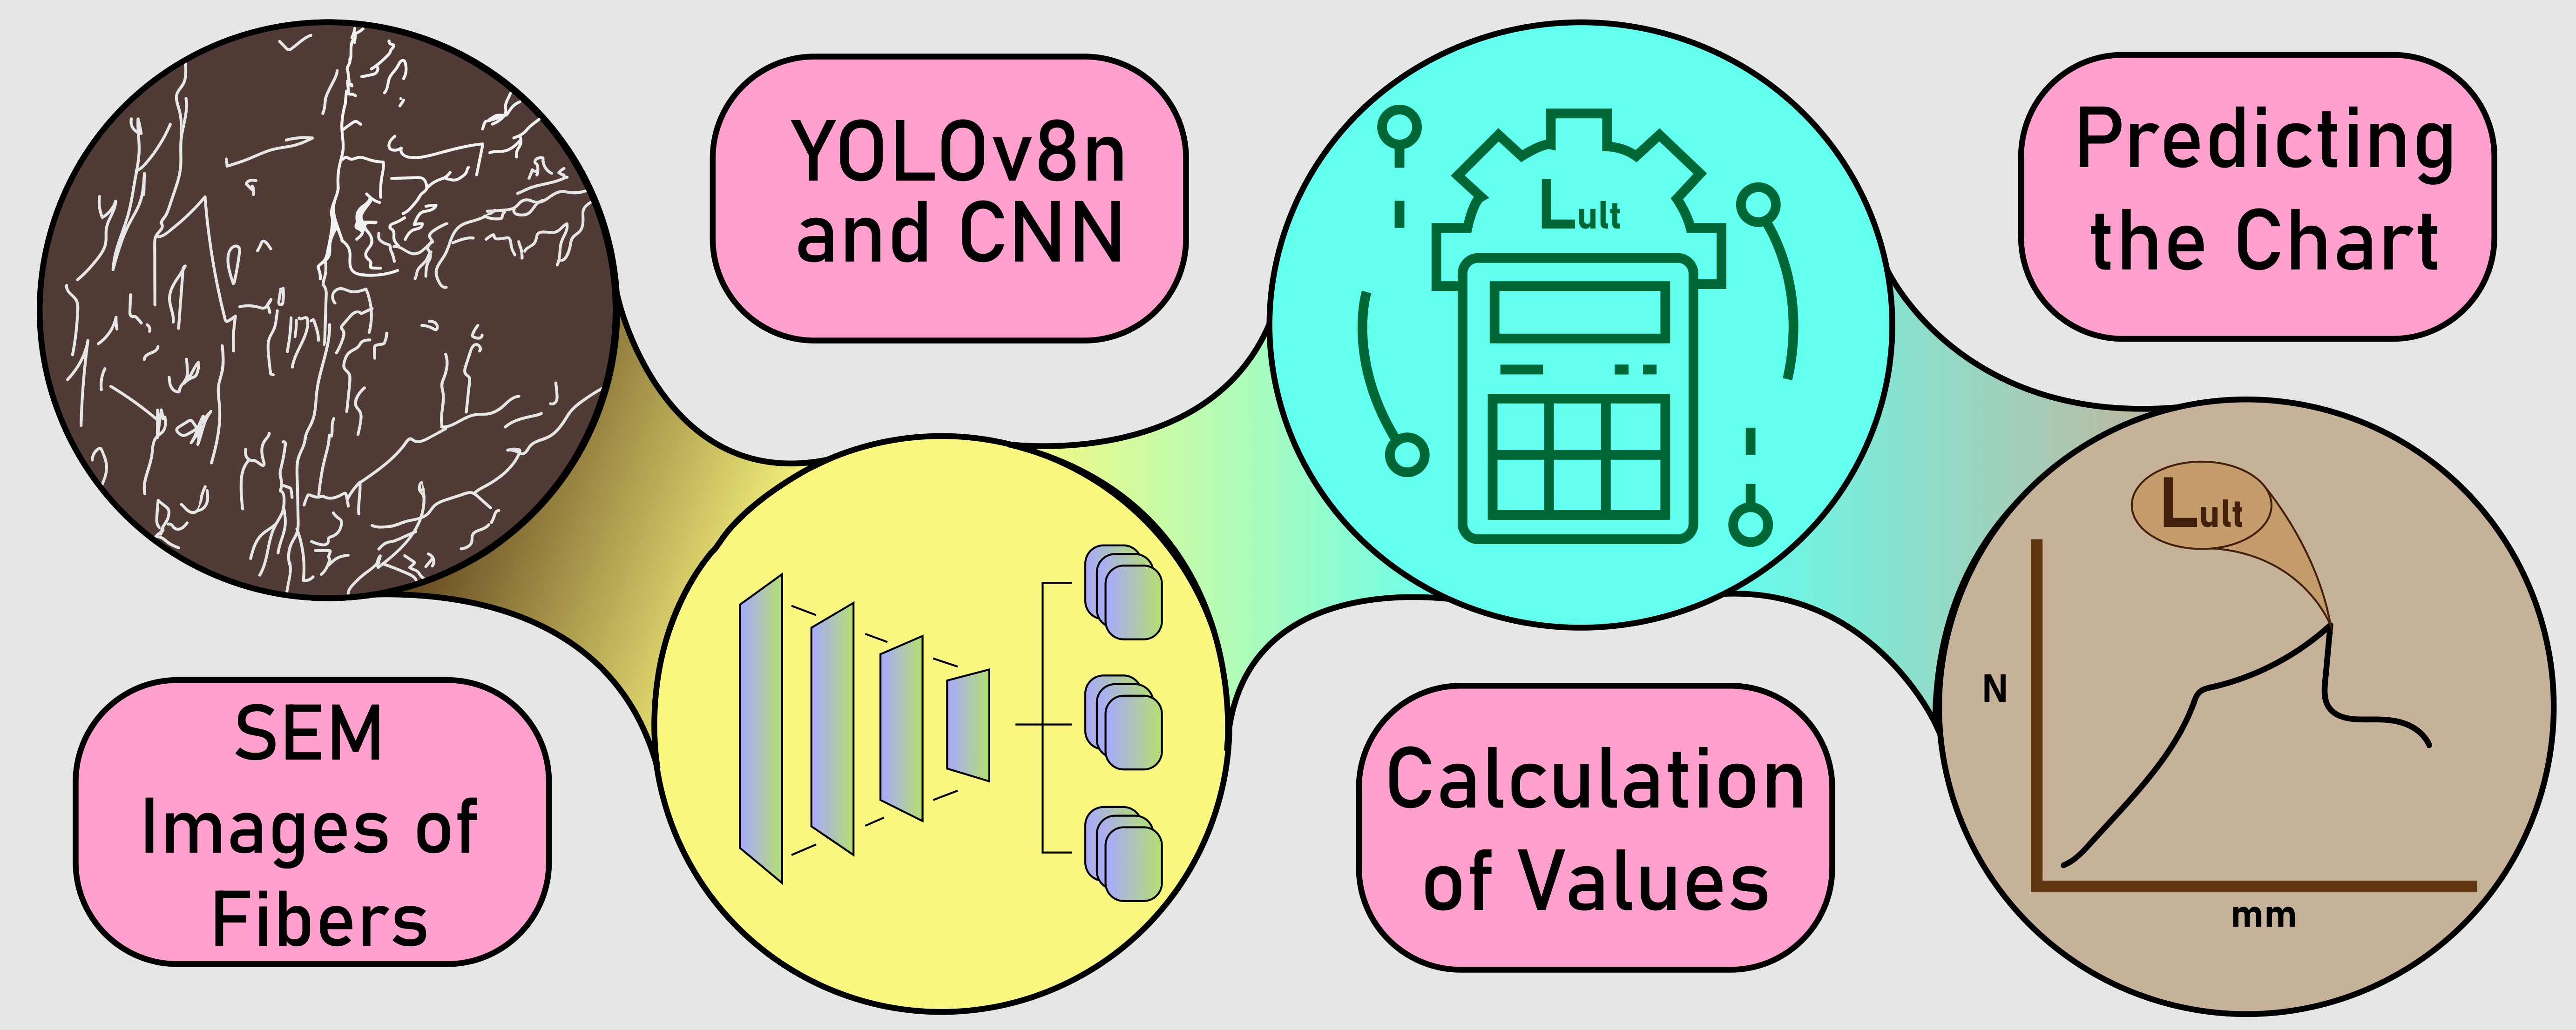
This study proposes a novel driven deep learning framework for automated prediction of mechanical behavior in three-dimensional printed fiber reinforced nylon composites based on scanning electron microscopy imagery. The approach integrates a convolutional neural network with a YOLOv8n object detection model to extract and quantify microstructural features that influence tensile performance. By computing variables such as deformation change, maximum deformation rate, and ultimate load derived from the outputs of the YOLOv8n and CNN models, the framework directly maps localized morphological patterns to the overall mechanical response. The 50 load–displacement curves represent the full range of experimentally observed mechanical behaviors of 3D-printed nylon fiber specimens. By predicting the ultimate tensile load using image-based calculations, the corresponding load–displacement response can be estimated, enabling virtual characterization of material behavior without the need for direct mechanical testing.
2. Methods
The following sections detail a deep learning–based framework for predicting the mechanical response of 3D-printed fiber-reinforced nylon specimens using scanning electron microscopy (SEM) imagery. The proposed methodology integrates object detection and classification models to assess microstructural deformation and estimate the ultimate tensile load and load–displacement behavior. The analysis relies exclusively on image data, enabling automated, non-destructive prediction of material performance.
2.1. Data Information
A total of 450 high-resolution SEM images of 3D-printed nylon fiber composites (approximately 6 mm) were collected from tensile experiments which are available on Mendeley Dataset [39]. Each specimen was imaged twice: once prior to mechanical testing and once after tensile loading, allowing for precise evaluation of deformation progression. All images were standardized to a resolution of 640×640 pixels and normalized to provide consistent input for YOLOv8n model training. Moreover, all input SEM images were resized to a resolution of 100×100×3 pixels for CNN model.
For the object detection stage, each SEM image was annotated with a single bounding box labeled as “deformation” to localize regions exhibiting visible structural changes. In the subsequent classification stage, images were assigned binary labels: 0 for non-deformed specimens and 1 for deformed specimens.
To enhance generalization and mitigate overfitting, extensive data augmentation was applied during training. Augmentation techniques included random rotation (±30°), width and height shifts (±10%), zoom adjustments (±10%), brightness modulation (range: 0.8–1.2), and horizontal and vertical flipping.
2.2. Machine Learning Models
Two separate deep learning models were developed for this study: an object detection model using YOLOv8n for identifying deformation regions, and a CNN for predicting deformation rates. Both models were trained using supervised learning with matched labels from mechanical test data.
The YOLOv8n model was employed to detect deformation regions in both pre- and post-test SEM images. This compact and efficient version of the YOLO object detection architecture was chosen for its real-time performance and high localization accuracy. The model was trained for 500 epochs using a batch size of 16, with early stopping to prevent overfitting. A warm-up phase was included in the first three epochs to stabilize initial gradient updates. Training was conducted with a learning rate initialized at 0.0005, decaying gradually to 0.0001, and regularized via a weight decay of 0.0005 and a momentum factor of 0.937. During training, augmentations such as color-space perturbations (hue, saturation, and brightness) and spatial transformations (translation and scaling) were also incorporated into the YOLO training pipeline. Grad-CAM generates visual heatmaps that highlight the spatial regions in the SEM input that most strongly influenced the model’s predictions (illustrated at Figure 1). Specifically, it computes the gradients of the predicted class score with respect to the final convolutional layer activations, enabling localization of high-importance areas associated with microstructural deformation.
To predict deformation rates from post-test SEM images, a custom CNN regression model (illustrated at Figure 2) was implemented using the TensorFlow framework. The input layer received images resized to 100×100×3, followed by two convolutional layers with ReLU activation functions and max pooling operations for spatial down sampling. The extracted feature maps were flattened and passed through two fully connected dense layers, culminating in a single-neuron output layer with a sigmoid activation to constrain predictions between 0 and 1. This scalar output represented the predicted deformation rate. The model was trained using the Adam optimizer with mean squared error loss, optimized over multiple epochs with validation-based early stopping to restore the best-performing weights.
The performance of the proposed framework was quantitatively assessed using standard evaluation metrics, including accuracy, precision, recall, F1-score, and Matthews Correlation Coefficient (MCC). These metrics were computed to evaluate the classification quality of both the object detection and regression components. For the object detection model (YOLOv8n), precision-recall dynamics and confusion matrices were employed to examine the alignment between predicted and true deformation regions. For the CNN regression model, predictions were discretized using optimal thresholds to enable metric calculation. In addition, training and validation curves were plotted to monitor learning behavior, diagnose potential overfitting or underfitting, and guide hyperparameter tuning. A summary of the metric definitions and their mathematical formulations is provided in Table 2.
2.3. Load Prediction and Curve Reconstruction
The mechanical response of each 3D-printed nylon fiber specimen was estimated using a formulation that combined visually extracted features with experimentally defined load boundaries. The predicted ultimate tensile load () was derived by integrating the CNN-predicted deformation rate with the change in deformation area detected by the YOLOv8n model. These values were used to calculate the maximum deformation rate (), which was then scaled against the known load range to determine the expected peak force a specimen could withstand. This predictive mechanism enabled a direct estimation of tensile capacity without requiring physical load application.
As summarized in Table 3, the proposed framework predicts the ultimate tensile load of 3D-printed fiber-reinforced nylon specimens by leveraging deformation characteristics extracted from SEM imagery. The approach begins by detecting the deformation area before () and after () tensile testing using the YOLOv8n model. The difference between these measurements () represents the change in deformation attributable to mechanical loading. Concurrently, a CNN model predicts the deformation rate () directly from the SEM images. Combining these outputs, is derived as the product of the square root of and the CNN-predicted deformation rate, thereby integrating localized and global deformation information.
The ultimate load is then estimated, where is the difference between the experimentally defined maximum load () and minimum load (), which are fixed at 22,892 N and 7276 N, respectively. The normalized ultimate load () is computed to allow comparison across specimens.
This formulation enables direct prediction of ultimate tensile load and the load–displacement response from SEM imagery alone, bridging microstructural observations with macroscopic mechanical performance in a fully automated, image-driven workflow. Figure 3 illustrates the full spectrum of load–displacement behavior obtained from 50 experimental tensile tests, each corresponding to a unique 3D-printed nylon fiber specimen. These curves capture the mechanical variability across samples and are arranged in descending order based on their ultimate tensile load, ranging from 7276 N to approximately 22,892 N.
Overall, after extracting deformation features from the YOLOv8n and CNN models, the maximum deformation rate can be calculated by combining the detected deformation areas and the predicted deformation rate. This value serves as the basis for estimating the normalized ultimate load , supported by the strong relationship identified between and that are slightly equal. Once is known, the ultimate load can be derived, representing the highest load the material can withstand. Finally, using these predicted values, the corresponding load displacement curve can be constructed to visualize the mechanical response of the specimen.
3. Results
The results of this study provide a comprehensive evaluation of the proposed deep learning framework for predicting the mechanical behavior of 3D-printed fiber-reinforced nylon composites using SEM images. The framework integrates a CNN and a YOLOv8n object detection model to analyze microstructural features and predict key mechanical indicators such as deformation change, maximum deformation rate, and ultimate tensile load. Performance assessment encompasses prediction accuracy, correlation with experimentally measured values, and consistency across a diverse set of 50 load–displacement curves representing a wide spectrum of material responses.
The training performance of the YOLOv8n model for microstructural deformation detection in 3D-printed nylon composites is presented in Figure 4, with key metrics plotted over 300 training epochs. The top left panel shows the precision curve, which increases rapidly in the early stages and stabilizes above 0.98 after approximately 150 epochs, indicating the model’s high accuracy in correctly identifying true deformation regions. The recall curve (top right) follows a similar trajectory, reaching and maintaining values near 1.0, demonstrating the model’s strong ability to detect nearly all relevant deformation instances without missing true positives.
The bottom left panel displays the mean Average Precision at IoU threshold 0.5 (mAP@0.5), which steadily rises and levels off close to 1.0, confirming that the model performs exceptionally well under standard detection criteria. Likewise, the bottom right panel illustrates mAP@0.5:0.95, which also shows continuous improvement and stabilizes just under 1.0, indicating robust detection performance across a range of IoU thresholds. Collectively, these curves reflect the YOLOv8n model’s effectiveness and reliability in extracting deformation patterns from SEM images, forming a solid foundation for accurate downstream mechanical predictions.
Table 4 summarizes the classification performance of the YOLOv8n model in detecting deformation regions within 3D-printed fiber-reinforced nylon composites. The model achieved a class-specific accuracy of 93.0%, with a precision of 89.5% and a recall of 83.2% for the “deformation” class, indicating a strong ability to correctly identify true deformation areas while minimizing false positives. The F1-score, calculated as the harmonic mean of precision and recall, reached 89.9%, reflecting balanced and reliable detection capability. Moreover, the MCC was 0.851, confirming strong agreement between predicted and actual labels even under potential class imbalance. These metrics demonstrate the model’s effectiveness in classifying microstructural deformation from SEM images, supporting its integration into the broader framework for mechanical behavior prediction of 3D-printed composites.
Figure 5 presents the K Fold cross validation results for the CNN model used to predict deformation related mechanical behavior from SEM images of 3D printed fiber reinforced nylon composites. The model was evaluated using a 3-fold cross validation scheme to assess its generalization capability across different data partitions. Fold wise validation accuracies were recorded as approximately 82 percent, 72 percent, and 98 percent for Folds 1, 2, and 3 respectively. Although there is some variation in accuracy between folds, likely due to differences in microstructural features within each subset, the CNN model maintained a strong overall performance. The high accuracy observed in Fold 3 and the consistent trend across all folds indicate that the model effectively learns meaningful deformation patterns from image data.
The confusion matrix illustrates the classification performance of the model across two distinct classes: nondeformed and deformed (showed in Figure 6). Among the 83 true nondeformed samples, the model accurately classified 78, while misclassifying 5 as deformed. For the deformed class, all 88 instances were correctly identified, yielding a recall of 100 percent. The precision for the nondeformed class was calculated as 1.000, indicating no false positive predictions for this category. Conversely, the precision for the deformed class was 0.946, reflecting a small proportion of false positives originating from the misclassification of nondeformed instances. The model achieved an overall accuracy of 97.08 percent, with macro-averaged precision, recall, and F1-score values of 0.973, 0.970, and 0.971, respectively.
Figure 7 illustrates the visual analysis pipeline used to evaluate microstructural deformation in 3D printed fiber reinforced nylon composites based on scanning electron microscopy images. Image A presents the specimen surface before mechanical testing, showing a relatively smooth and continuous fiber distribution. Image B captures the same region after tensile loading, revealing clear signs of fiber pull out and matrix cracking that indicate mechanical damage. Image D displays the output of the YOLOv8n model, which automatically detects and localizes deformation regions by drawing bounding boxes and assigning confidence scores to each detected area. Image C shows the Grad CAM visualization produced by the convolutional neural network, highlighting the regions that most strongly influence the model’s classification of deformation.
Table 5 presents the calculated variables and predicted mechanical properties for three representative examples of fiber reinforced nylon composites based on scanning electron microscopy analysis. For each example, the YOLOv8n model quantified the deformation area before and after mechanical testing, noted as and post, which allowed computation of the deformation change . The convolutional neural network provided an independent prediction of the deformation rate . These values were combined to calculate the maximum deformation rate , which was then used to derive the calculation with our formulas for ultimate load and the normalized load value . For “Example-A”, which corresponds to the images shown in Figure 7, the calculated was approximately 0.473 and the CNN predicted deformation rate was 0.9660, resulting in a maximum deformation rate of 0.6644 and an ultimate load prediction of 17672 newtons. This systematic process enabled generation of proportional load displacement curves directly from image data, demonstrating the potential of the framework to predict mechanical response across different specimens without the need for physical testing.
Figure 8 illustrates the relationship between the normalized ultimate load L norm and the maximum deformation rate D max predicted for the 3-fiber reinforced nylon composite specimens detailed in Table 5. The scatter plot presents the data points derived from YOLOv8n and CNN model outputs, while the red line represents the linear regression model expressed as equals 0.9617 multiplied by the sum of and 0.0271. The regression achieved an R squared value of 0.9995 and a Pearson correlation coefficient of 0.9998, indicating an exceptionally strong linear association between the normalized load and the corresponding deformation rate. This strong correlation supports the effectiveness of the proposed calculation strategy in linking microstructural deformation features to macroscopic mechanical performance, further validating the predictive capability of the integrated deep learning framework.
Based on these results, it becomes possible to calculate the maximum deformation rate D max directly from the outputs of the YOLOv8n and CNN models. Given the strong correlation demonstrated between and the , these values can be linked confidently within the predictive framework. Using this information, the proportional load displacement curve can then be generated, as illustrated in Figure 3, enabling visualization of the predicted mechanical response without the need for physical testing.
Figure 9 shows the curve that demonstrates a smooth and continuous increase in load with displacement, reflecting a typical nonlinear elastic response followed by a plateau near the maximum tensile capacity. The trajectory accurately captures the material’s deformation behavior and the transition toward yielding. The sharp decline at the end indicates the onset of structural failure, aligning with mechanical trends observed in experimental testing. This predictive curve was constructed by computing the maximum deformation rate and the associated ultimate load, allowing the model to estimate the full mechanical response solely from image-based inputs.
4. Discussion
This section discusses the performance and implications of the proposed deep learning framework developed for predicting the mechanical behavior of 3D printed fiber reinforced nylon composites. By integrating deformation area detection from the YOLOv8n model with deformation rate estimation from a convolutional neural network, the system extracts meaningful microstructural features directly from scanning electron microscopy images. The formulation for maximum deformation rate involves taking the square root of the deformation change and multiplying it by the CNN output, yielding a dynamic and specimen-specific indicator. This approach not only links morphological damage to mechanical response but also enables generalization across different fiber distributions and manufacturing inconsistencies.
A critical finding in this study is the strong linear relationship observed between the predicted maximum deformation rate and the normalized ultimate load. The resulting regression model produced a coefficient of determination of 0.9995 and a Pearson correlation coefficient of 0.9998. This level of association is rarely encountered in experimental mechanics, and it highlights the precision of the framework in mapping image-derived deformation indicators to mechanical strength. This relationship affirms the use of the maximum deformation rate as a reliable surrogate for normalized load capacity and validates the mathematical foundation of the proposed system. In effect, the model transforms high resolution visual patterns into interpretable mechanical predictions without requiring force sensors or destructive testing.
Once the ultimate load is known, it becomes possible to reconstruct the entire load displacement curve by referencing the most similar experimental profile. This matching process ensures that the predicted curve reflects both the magnitude and the shape of the material’s mechanical behavior. The success of this curved selection system, driven solely by calculated values, demonstrates the framework’s potential to serve as a practical tool for virtual material testing. From a materials science perspective, the extracted features and predicted deformation patterns offer important insights into the physical behavior of fiber-reinforced nylon composites. The strong correlation between image-derived deformation rates and mechanical strength suggests that surface morphology, as captured by SEM, reflects underlying damage mechanisms. The convolutional neural network appears to recognize these features, enabling quantification of microstructural damage. The object detection model further highlights deformation zones that correspond to common failure initiation sites, such as areas of fiber misalignment or discontinuity.
Several recent studies have explored predictive modeling and optimization strategies for the mechanical characterization of fiber-reinforced composites, particularly in the context of 3D printing. For instance, prior work utilizing artificial neural networks to model the flexural performance of nylon-carbon composites has demonstrated the effectiveness of data-driven approaches in capturing the influence of process parameters [44]. While these studies focus on parameter-based prediction, the present work differs by relying entirely on microstructural image analysis, thus eliminating the need for explicit input of manufacturing variables and enabling deformation prediction through high-resolution morphology alone.
In another study on polyamide-6 multi-ply yarns, researchers integrated geometric modeling with neural networks to simulate full-range tensile behavior, attaining a high degree of accuracy (R2 = 0.97, MAPE = 4.65%) [45]. This hybrid approach shares conceptual similarities with our framework in its effort to generalize tensile performance, but it requires a layered understanding of fiber orientation and structure, whereas our method leverages end-to-end feature extraction from SEM imagery through deep learning, requiring no explicit geometric input or physical modeling.
Work by other authors involving generalized additive models (GAMs) for synthetic fiber ropes highlighted the utility of statistical learning to analyze failure behavior under varying diameters and load conditions [46]. Although this approach offered valuable correlations between geometry and failure strain or force, it is limited by its reliance on engineered variables and predefined functional forms.
Recent advances in optimization through reinforcement learning and finite element modeling have also shown promise in improving mechanical properties of 3D printed fiber-reinforced constructs [47]. For example, the integration of reinforcement learning to optimize fiber orientation angles resulted in a 64.51 percent increase in stiffness. While such optimization techniques are effective for design enhancement, they depend heavily on simulation environments and parametric models. Our framework, by comparison, directly links image-derived deformation patterns to mechanical outcomes without requiring a simulation layer, enabling fast and scalable virtual testing.
Lastly, studies on crashworthy nested tube structures made of carbon fiber-reinforced nylon composites have shown that the structural optimization of geometry via genetic algorithms can dramatically improve energy absorption and deformation stability [48].
Taken together, these works underscore the growing role of machine learning and AI in advancing composite material analysis. The proposed image-based deep learning framework complements and extends these methodologies by offering a generalized, non-destructive, and highly adaptable solution for predicting mechanical behavior based solely on SEM imagery.
While the present framework was developed for fiber-reinforced nylon composites with unidirectional reinforcement, its core approach may be extended to other architectures such as woven or multidirectional laminates, provided sufficient image data is available. However, complex interactions between fibers and matrix in these systems may require retraining or structural adaptations of the model. Similarly, applying this method across different matrix systems or reinforcement types will likely demand adjustments due to variations in failure morphology. Future research should explore these generalizations to assess the framework’s broader applicability in composite material analysis.
5. Conclusions
This study introduces a novel deep learning–based framework for the virtual characterization of mechanical behavior in 3D-printed fiber-reinforced nylon composites using scanning electron microscopy imagery. By integrating a YOLOv8n object detection model with a convolutional neural network, the approach enables precise extraction of deformation-related microstructural features. The proposed system calculates the maximum deformation rate and derives the normalized and ultimate load values, which are then used to reconstruct full load–displacement curves, eliminating the need for physical tensile testing. The framework demonstrated strong agreement with experimental data across a diverse range of specimens, capturing variations in material response due to microstructural heterogeneity. These findings highlight the potential of combining computer vision and predictive modeling for image-based mechanical analysis, offering a scalable and non-destructive solution for the evaluation of advanced composite materials. Future work may focus on expanding the dataset, incorporating additional imaging modalities, and applying the method to a broader range of additively manufactured materials.
Conflicts of competing interests
In this article, the author states that they have no competing commercial interests or personal affiliations.
Data Availability
The datasets used in this study are publicly available on the Internet. The code developed for this study is available upon reasonable request.
Acknowledgements
The endeavor was exclusively conducted using the organization’s current staff and infrastructure, and all resources and assistance came from inside sources. Ethical approval is not applicable. The data supporting the study’s conclusions are accessible inside the journal, according to the author. Upon a reasonable request, the corresponding author will provide the raw data supporting the study’s findings.
References
- S. K. Panda, K. C. Rath, S. Mishra, and A. Khang, ‘Revolutionizing product development: The growing importance of 3D printing technology’, Mater Today Proc, 2023. [CrossRef]
- C. W. J. Lim, K. Q. Le, Q. Lu, and C. H. Wong, ‘An overview of 3-D printing in manufacturing, aerospace, and automotive industries’, IEEE potentials, vol. 35, no. 4, pp. 18–22, 2016. [CrossRef]
- B. Safaei et al., ‘Challenges and advancements in additive manufacturing of nylon and nylon composite materials: a comprehensive analysis of mechanical properties, morphology, and recent progress’, J Mater Eng Perform, vol. 33, no. 13, pp. 6261–6305, 2024. [CrossRef]
- G. D. Goh, Y. L. Yap, S. Agarwala, and W. Y. Yeong, ‘Recent progress in additive manufacturing of fiber reinforced polymer composite’, Adv Mater Technol, vol. 4, no. 1, p. 1800271, 2019. [CrossRef]
- E. Giarmas, K. Tsongas, E. K. Tzimtzimis, A. Korlos, and D. Tzetzis, ‘Mechanical and FEA-assisted characterization of 3D printed continuous glass fiber reinforced nylon cellular structures’, Journal of Composites Science, vol. 5, no. 12, p. 313, 2021. [CrossRef]
- D. K. Rajak, P. H. Wagh, and E. Linul, ‘Manufacturing technologies of carbon/glass fiber-reinforced polymer composites and their properties: A review’, Polymers (Basel), vol. 13, no. 21, p. 3721, 2021. [CrossRef]
- M. A. Masuelli, ‘Introduction of fibre-reinforced polymers− polymers and composites: concepts, properties and processes’, in Fiber reinforced polymers-the technology applied for concrete repair, IntechOpen, 2013.
- A. Mirabedini, A. Ang, M. Nikzad, B. Fox, K. Lau, and N. Hameed, ‘Evolving strategies for producing multiscale graphene-enhanced fiber-reinforced polymer composites for smart structural applications’, Advanced Science, vol. 7, no. 11, p. 1903501, 2020. [CrossRef]
- A. Rajpurohit, ‘Fiber Reinforced Composites: Advances in Manufacturing Techniques’, FRP Today, vol. 14, no. 04, p. 22, 2014.
- I. M. Alarifi, ‘A performance evaluation study of 3d printed nylon/glass fiber and nylon/carbon fiber composite materials’, journal of materials research and technology, vol. 21, pp. 884–892, 2022. [CrossRef]
- R. W. Hertzberg, R. P. Vinci, and J. L. Hertzberg, Deformation and fracture mechanics of engineering materials. John Wiley & Sons, 2020.
- C. Du, J. P. M. Hoefnagels, L. Bergers, and M. G. D. Geers, ‘A uni-axial nano-displacement micro-tensile test of individual constituents from bulk material’, Exp Mech, vol. 57, pp. 1249–1263, 2017. [CrossRef]
- N. Leclerc, A. Khosravani, S. Hashemi, D. B. Miracle, and S. R. Kalidindi, ‘Correlation of measured load-displacement curves in small punch tests with tensile stress-strain curves’, Acta Mater, vol. 204, p. 116501, 2021. [CrossRef]
- N. Rom and E. Priel, ‘A Data-Driven Methodology for Obtaining the Stress–Strain Curves of Metallic Materials Using Discrete Indentation Tests’, Metals (Basel), vol. 15, no. 1, p. 40, 2025. [CrossRef]
- H. Moayedi, B. Kalantar, M. M. Abdullahi, A. S. A. Rashid, R. Nazir, and H. Nguyen, ‘Determination of young elasticity modulus in bored piles through the global strain extensometer sensors and real-time monitoring data’, Applied Sciences, vol. 9, no. 15, p. 3060, 2019. [CrossRef]
- S. Hassani and U. Dackermann, ‘A systematic review of advanced sensor technologies for non-destructive testing and structural health monitoring’, Sensors, vol. 23, no. 4, p. 2204, 2023. [CrossRef]
- N. Leclerc, A. Khosravani, S. Hashemi, D. B. Miracle, and S. R. Kalidindi, ‘Correlation of measured load-displacement curves in small punch tests with tensile stress-strain curves’, Acta Mater, vol. 204, p. 116501, 2021.
- S. Likitlersuang, S. Teachavorasinskun, C. Surarak, E. Oh, and A. Balasubramaniam, ‘Small strain stiffness and stiffness degradation curve of Bangkok Clays’, Soils and Foundations, vol. 53, no. 4, pp. 498–509, 2013. [CrossRef]
- S. Tu, X. Ren, J. He, and Z. Zhang, ‘Stress–strain curves of metallic materials and post-necking strain hardening characterization: A review’, Fatigue Fract Eng Mater Struct, vol. 43, no. 1, pp. 3–19, 2020. [CrossRef]
- L. G. Malito, S. Arevalo, A. Kozak, S. Spiegelberg, A. Bellare, and L. Pruitt, ‘Material properties of ultra-high molecular weight polyethylene: Comparison of tension, compression, nanomechanics and microstructure across clinical formulations’, J Mech Behav Biomed Mater, vol. 83, pp. 9–19, 2018. [CrossRef]
- D. J. Smith, Reliability, maintainability and risk: practical methods for engineers. Butterworth-Heinemann, 2021.
- M. Moayyedian et al., ‘Tensile Test Optimization Using the Design of Experiment and Soft Computing’, Processes, vol. 11, no. 11, p. 3106, 2023. [CrossRef]
- V. Singh, S. Patra, N. A. Murugan, D.-C. Toncu, and A. Tiwari, ‘Recent trends in computational tools and data-driven modeling for advanced materials’, Mater Adv, vol. 3, no. 10, pp. 4069–4087, 2022. [CrossRef]
- W. Y. Wang, J. Li, W. Liu, and Z.-K. Liu, ‘Integrated computational materials engineering for advanced materials: A brief review’, Comput Mater Sci, vol. 158, pp. 42–48, 2019. [CrossRef]
- K. Guo, Z. Yang, C.-H. Yu, and M. J. Buehler, ‘Artificial intelligence and machine learning in design of mechanical materials’, Mater Horiz, vol. 8, no. 4, pp. 1153–1172, 2021. [CrossRef]
- D. M. Dimiduk, E. A. Holm, and S. R. Niezgoda, ‘Perspectives on the impact of machine learning, deep learning, and artificial intelligence on materials, processes, and structures engineering’, Integr Mater Manuf Innov, vol. 7, pp. 157–172, 2018. [CrossRef]
- G. K. Thakur, A. Thakur, S. Kulkarni, N. Khan, and S. Khan, ‘Deep learning approaches for medical image analysis and diagnosis’, Cureus, vol. 16, no. 5, 2024. [CrossRef]
- Z. Liu et al., ‘A survey on applications of deep learning in microscopy image analysis’, Comput Biol Med, vol. 134, p. 104523, 2021. [CrossRef]
- L. Zhang and S. Shao, ‘Image-based machine learning for materials science’, J Appl Phys, vol. 132, no. 10, 2022. [CrossRef]
- A. Khan, A. Sohail, U. Zahoora, and A. S. Qureshi, ‘A survey of the recent architectures of deep convolutional neural networks’, Artif Intell Rev, vol. 53, pp. 5455–5516, 2020. [CrossRef]
- L. Aziz, M. S. B. H. Salam, U. U. Sheikh, and S. Ayub, ‘Exploring deep learning-based architecture, strategies, applications and current trends in generic object detection: A comprehensive review’, Ieee Access, vol. 8, pp. 170461–170495, 2020. [CrossRef]
- Y. Jiang et al., ‘Microscopic Defect Detection on Aircraft Engine Blades via Improved YOLOv8’, IEEE Access, 2024. [CrossRef]
- D. Merayo Fernández, A. Rodríguez-Prieto, and A. M. Camacho, ‘Prediction of the Bilinear Stress-Strain Curve of Aluminum Alloys Using Artificial Intelligence and Big Data’, Metals (Basel), vol. 10, no. 7, 2020. [CrossRef]
- Y. Mao et al., ‘AI for Learning Deformation Behavior of a Material: Predicting Stress-Strain Curves 4000x Faster Than Simulations’, in 2023 International Joint Conference on Neural Networks (IJCNN), 2023, pp. 1–8. [CrossRef]
- T. Pradeep, P. Samui, N. Kardani, and P. G. Asteris, ‘Ensemble unit and AI techniques for prediction of rock strain’, Frontiers of Structural and Civil Engineering, vol. 16, no. 7, pp. 858–870, 2022. [CrossRef]
- M. Maurizi, C. Gao, and F. Berto, ‘Predicting stress, strain and deformation fields in materials and structures with graph neural networks’, Sci Rep, vol. 12, no. 1, p. 21834, 2022. [CrossRef]
- João P A Ribeiro, Sérgio M O Tavares, and Marco Parente, ‘Stress–strain evaluation of structural parts using artificial neural networks’, Proceedings of the Institution of Mechanical Engineers, Part L: Journal of Materials: Design and Applications, vol. 235, no. 6, pp. 1271–1286, Feb. 2021. [CrossRef]
- C. Yang, Y. Kim, S. Ryu, and G. X. Gu, ‘Prediction of composite microstructure stress-strain curves using convolutional neural networks’, Mater Des, vol. 189, p. 108509, 2020. [CrossRef]
- E. H. da Silva, J. V. Barreto Netto, and M. Ribeiro, ‘Raw Dataset from Tensile Tests of 3D-Printed Nylon Reinforced with Short Carbon Fibers’, 2024, Mendeley Data. [CrossRef]
- A. E. Maxwell, T. A. Warner, and L. A. Guillén, ‘Accuracy assessment in convolutional neural network-based deep learning remote sensing studies—Part 1: Literature review’, Remote Sens (Basel), vol. 13, no. 13, p. 2450, 2021. [CrossRef]
- G. K. Armah, G. Luo, and K. Qin, ‘A deep analysis of the precision formula for imbalanced class distribution’, Int J Mach Learn Comput, vol. 4, no. 5, pp. 417–422, 2014. [CrossRef]
- T. Alam, W.-C. Shia, F.-R. Hsu, and T. Hassan, ‘Improving breast cancer detection and diagnosis through semantic segmentation using the Unet3+ deep learning framework’, Biomedicines, vol. 11, no. 6, p. 1536, 2023. [CrossRef]
- D. Chicco and G. Jurman, ‘An invitation to greater use of Matthews correlation coefficient in robotics and artificial intelligence’, Front Robot AI, vol. 9, p. 876814, 2022. [CrossRef]
- V. Kumar, D. Veeman, M. Vellaisamy, and V. Singh, ‘Evaluation of flexural strength of 3D-Printed nylon with carbon reinforcement: An experimental validation using ANN’, Polymer (Guildf), vol. 316, p. 127854, 2025. [CrossRef]
- M. Razbin, A. A. Gharehaghaji, M. Salehian, Y. Zhu, M. H. Kish, and N. H. Kouchehbaghi, ‘Artificial neural network-assisted theoretical model to predict the viscoelastic–plastic tensile behavior of polyamide-6 multi-ply yarns’, Neural Comput Appl, vol. 36, no. 29, pp. 18107–18123, 2024. [CrossRef]
- Y. Halabi, H. Xu, Z. Yu, W. Alhaddad, Y. Cheng, and C. Wu, ‘Predictive Modeling of Tensile Fracture in Synthetic Fiber Ropes Using Generalized Additive Models’, Fatigue Fract Eng Mater Struct, vol. 48, no. 6, pp. 2686–2707, Jun. 2025. [CrossRef]
- G. W. Hyun, J. C. Yuk, and S. H. Park, ‘Mechanical Characterization of 3D Printed Fiber-Reinforced Composite Structures for Reinforcement Learning-Aided Design’, International Journal of Precision Engineering and Manufacturing, 2025. [CrossRef]
- Z. Jiang, J. Zhao, S. Xing, X. Sun, M. Qu, and H. Lv, ‘Crashworthiness design and multi-objective optimization of 3D-printed carbon fiber-reinforced nylon nested tubes’, Polym Compos, vol. 45, no. 12, pp. 11289–11311, Aug. 2024,. [CrossRef]
Figure 1.
Graphical Representation of YOLOv8n Architecture.
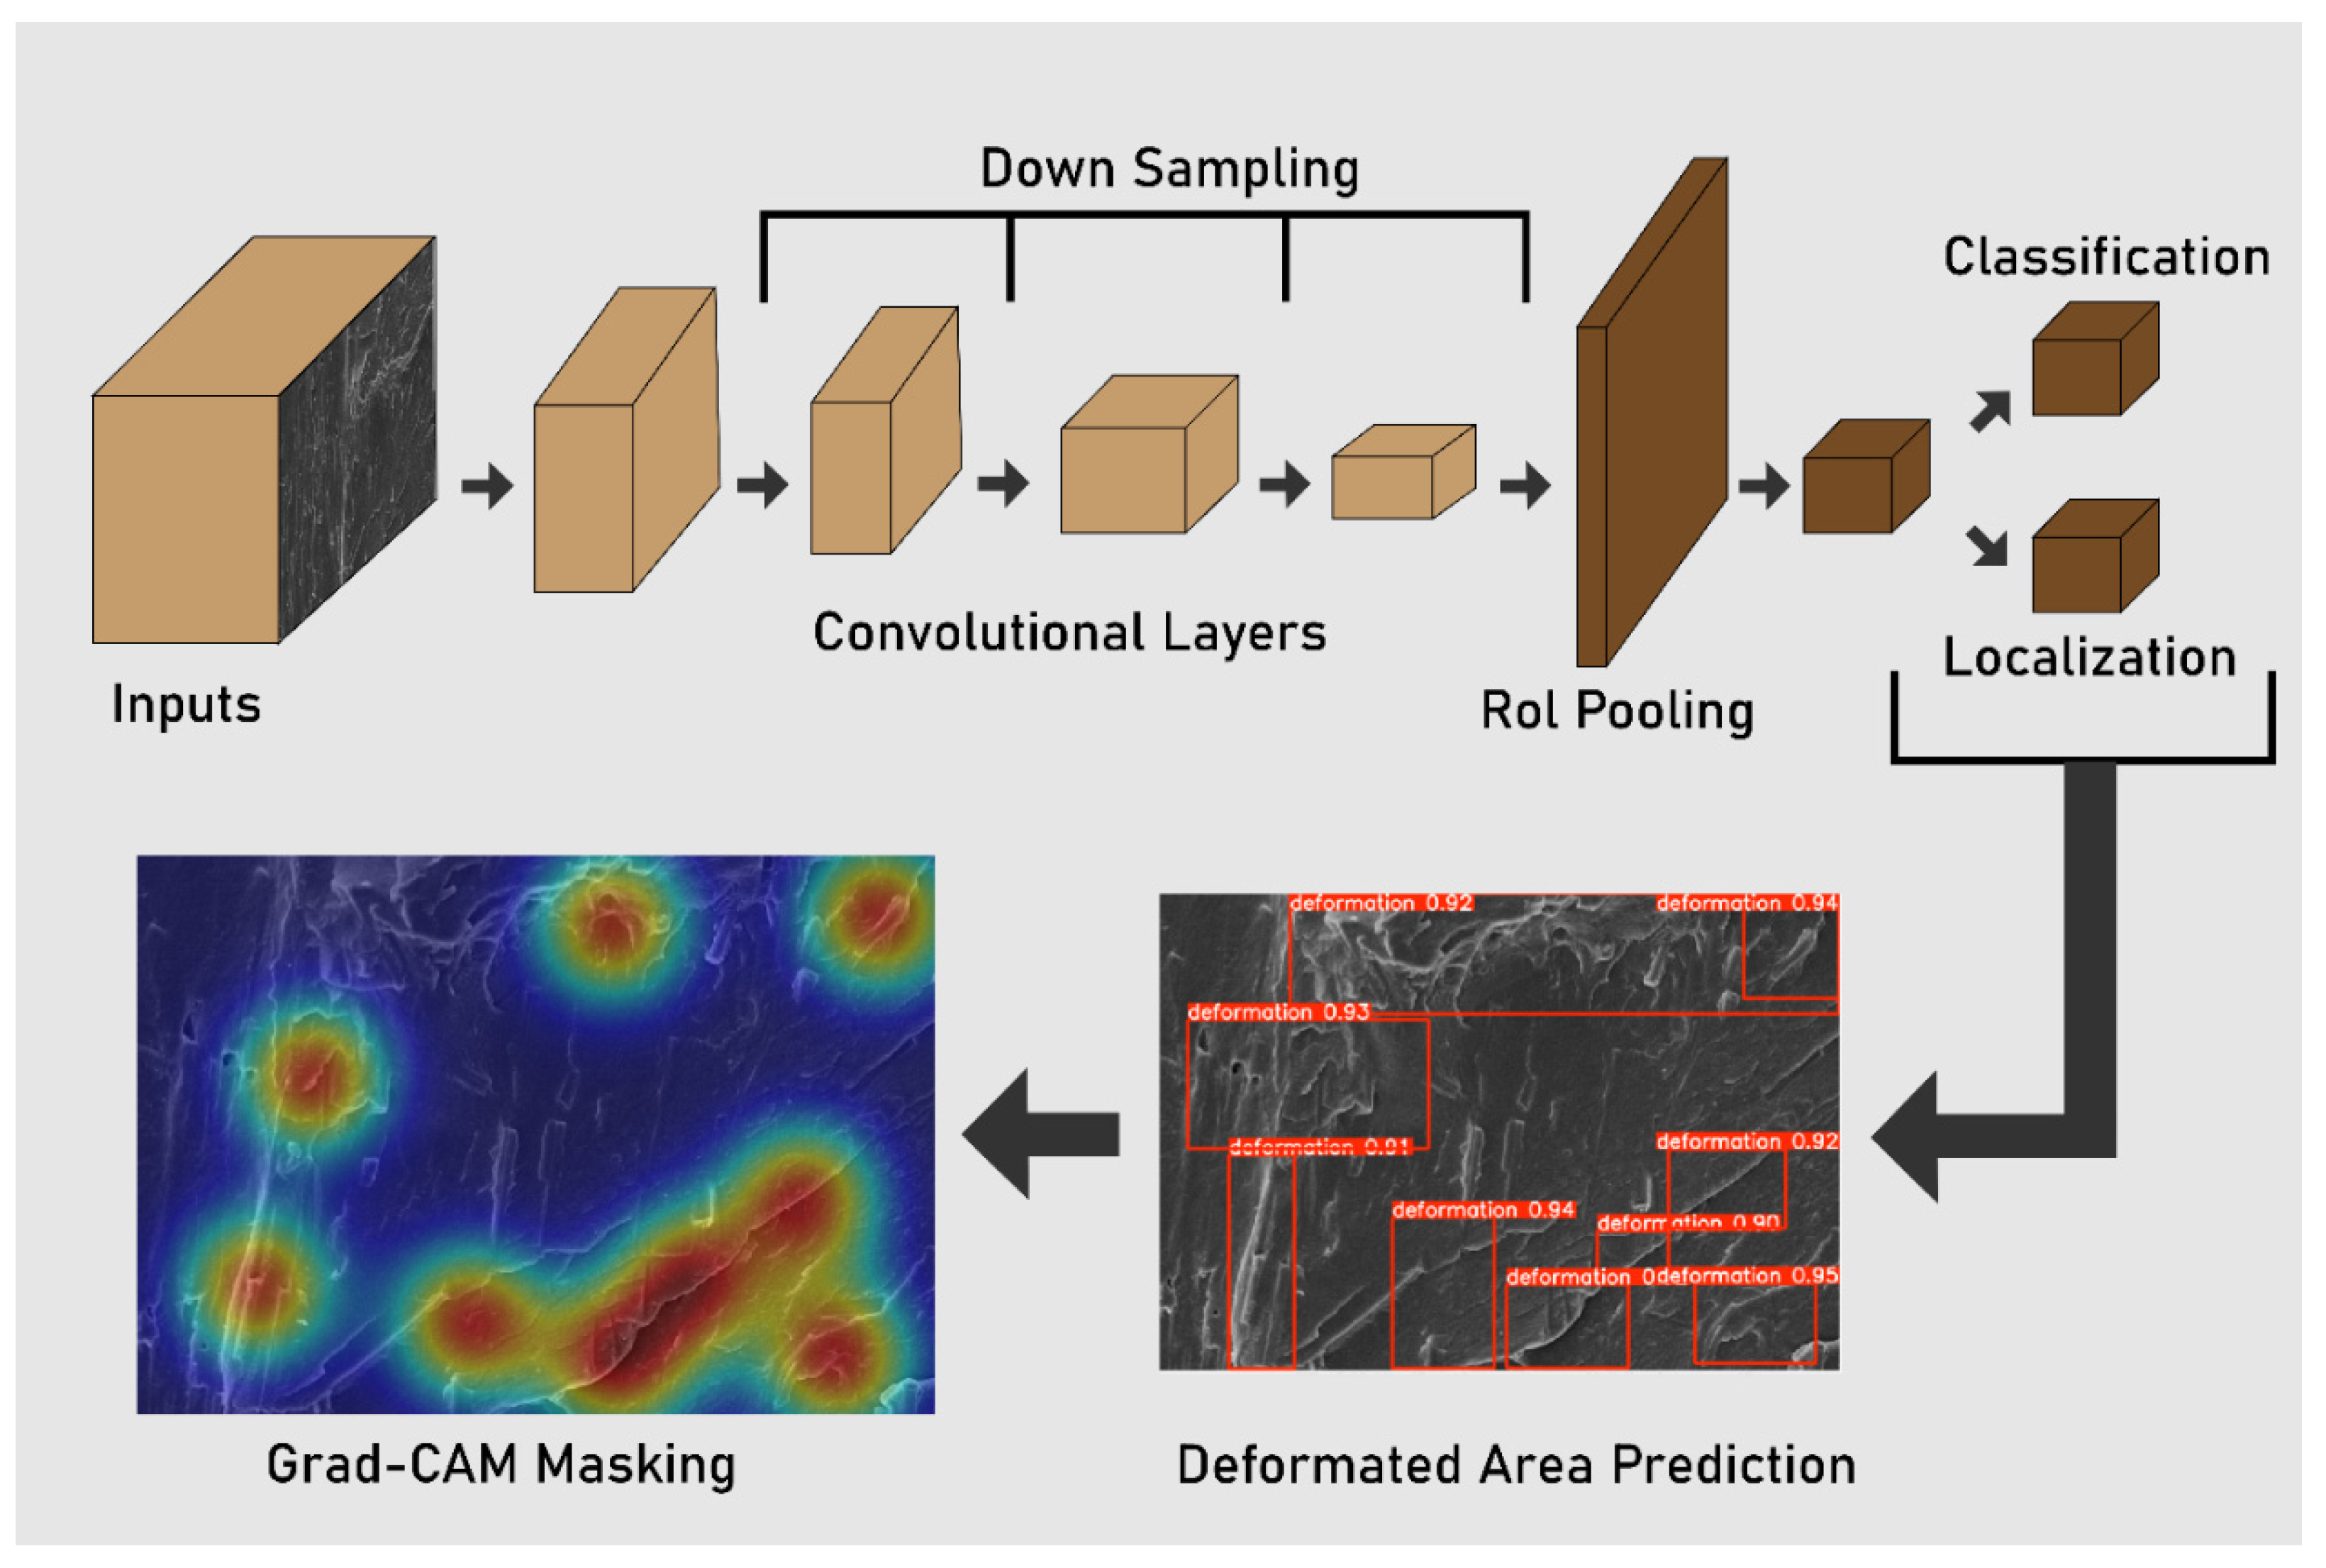
Figure 2.
Graphical Representation of CNN Architecture.
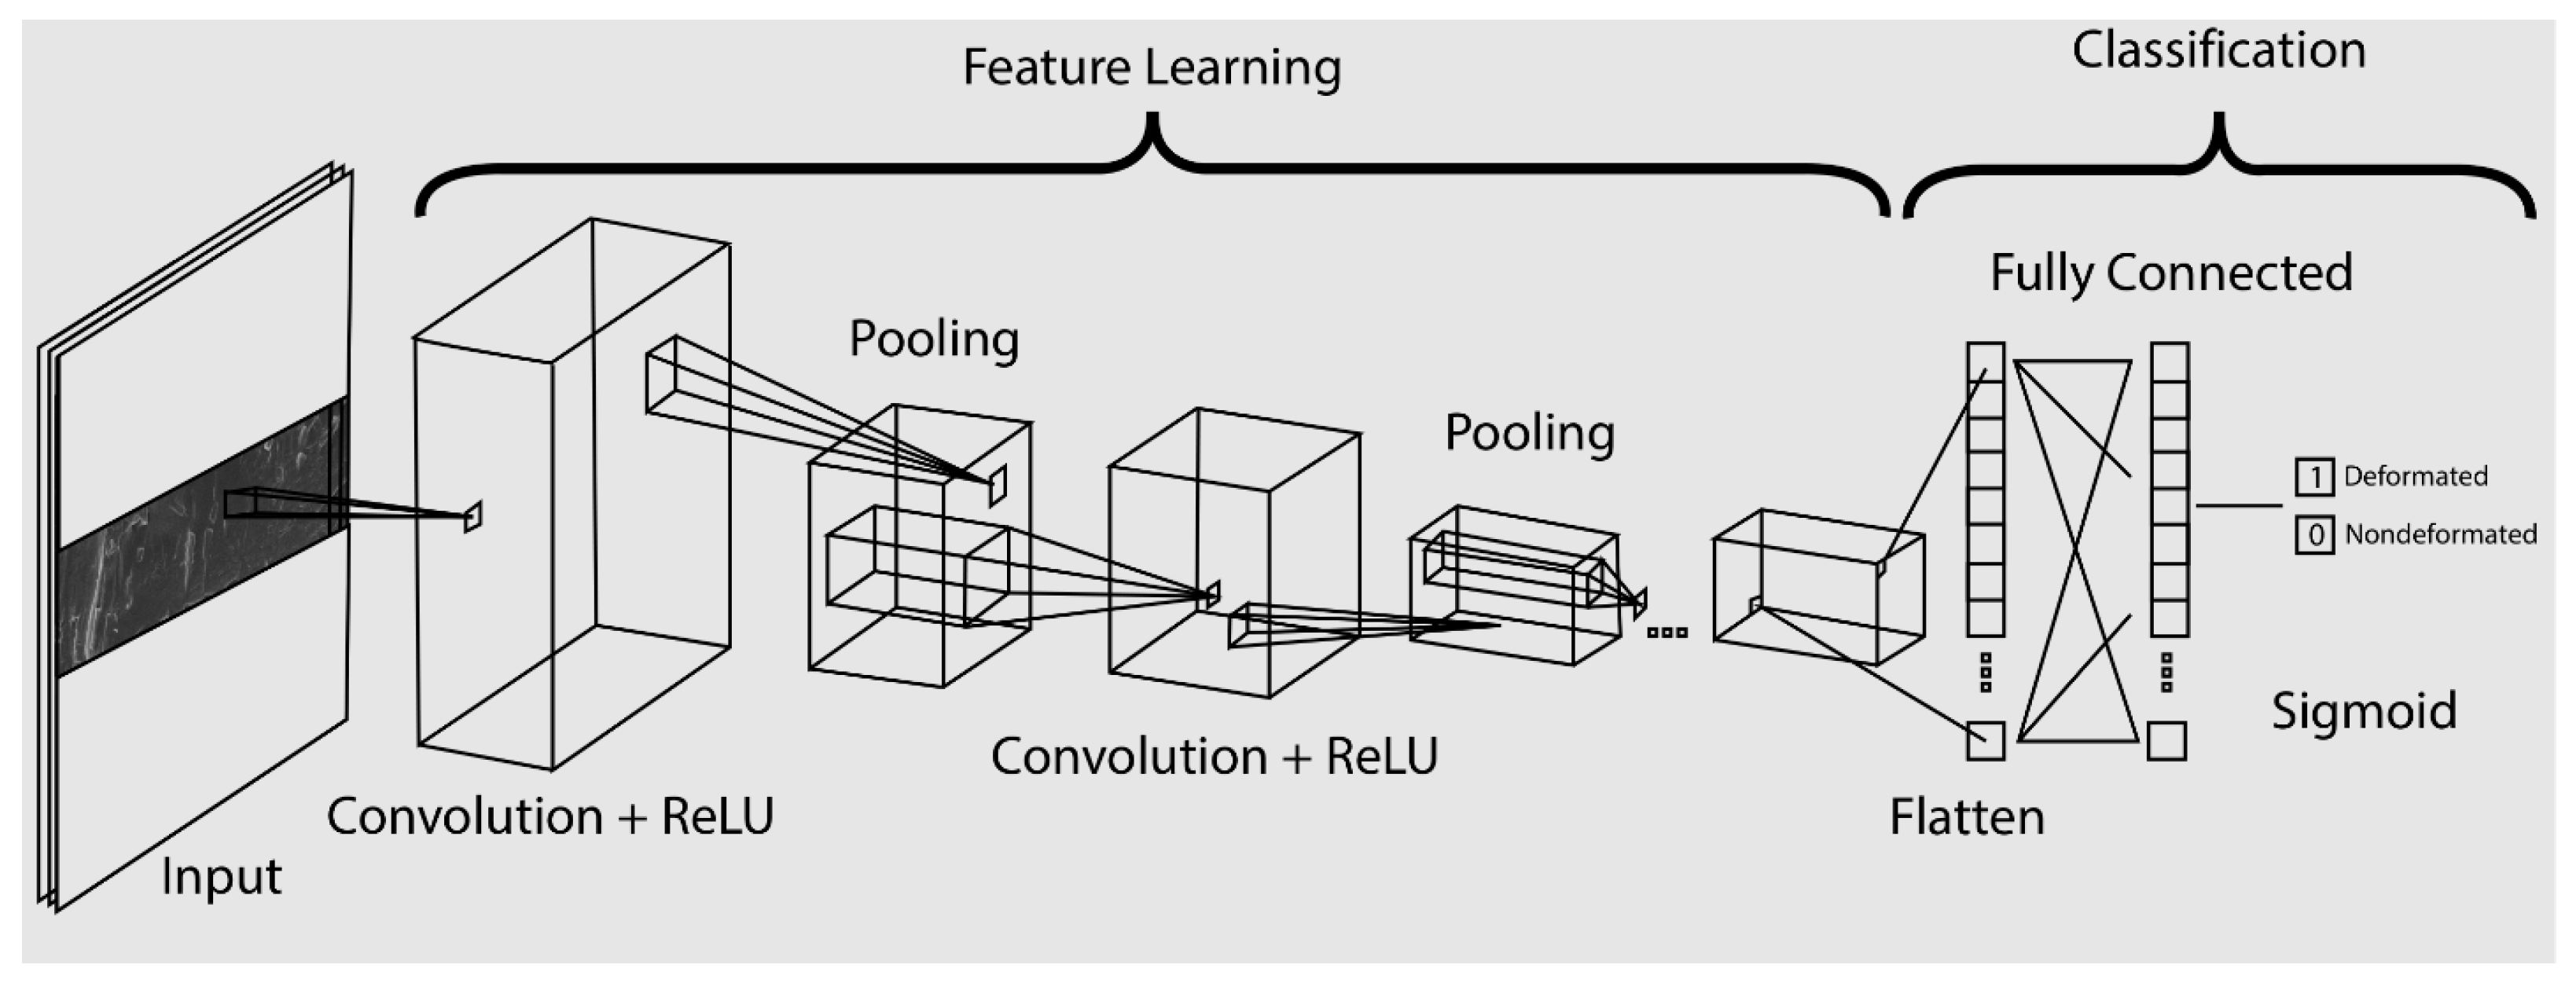
Figure 3.
Load–Displacement Curves of All Tested Specimens.
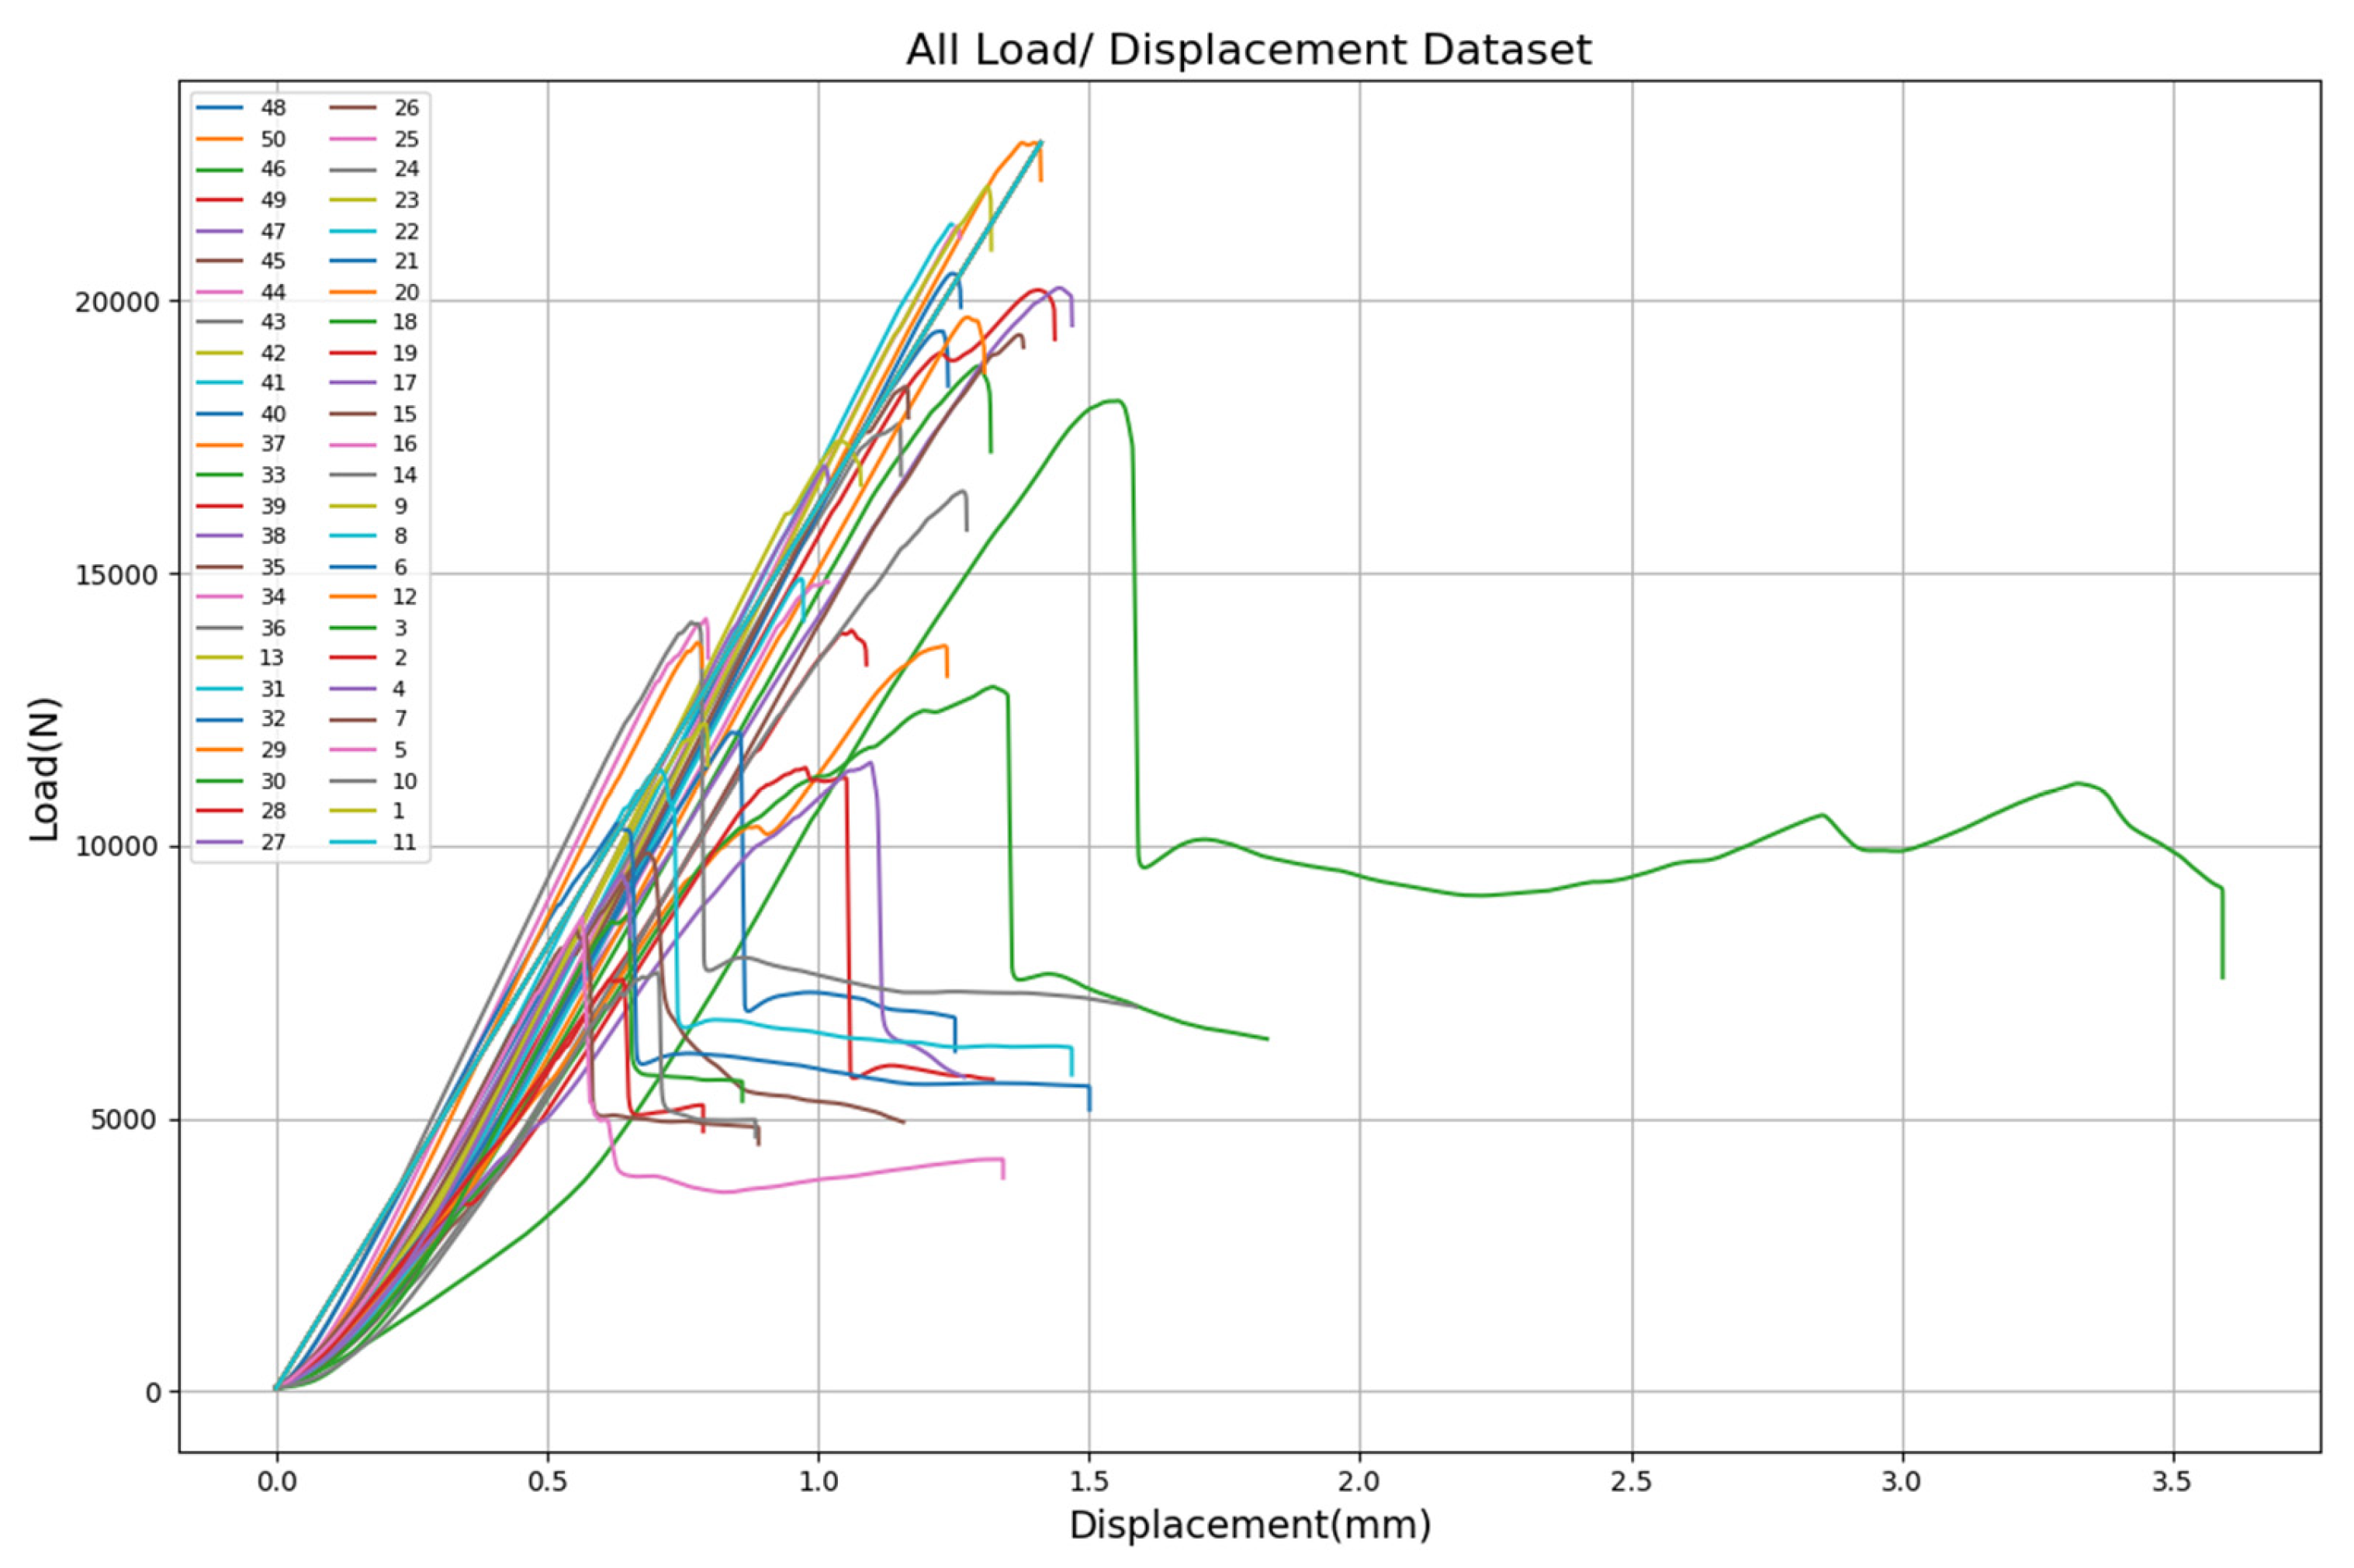
Figure 4.
Evaluation of YOLOv8n Training Dynamics.
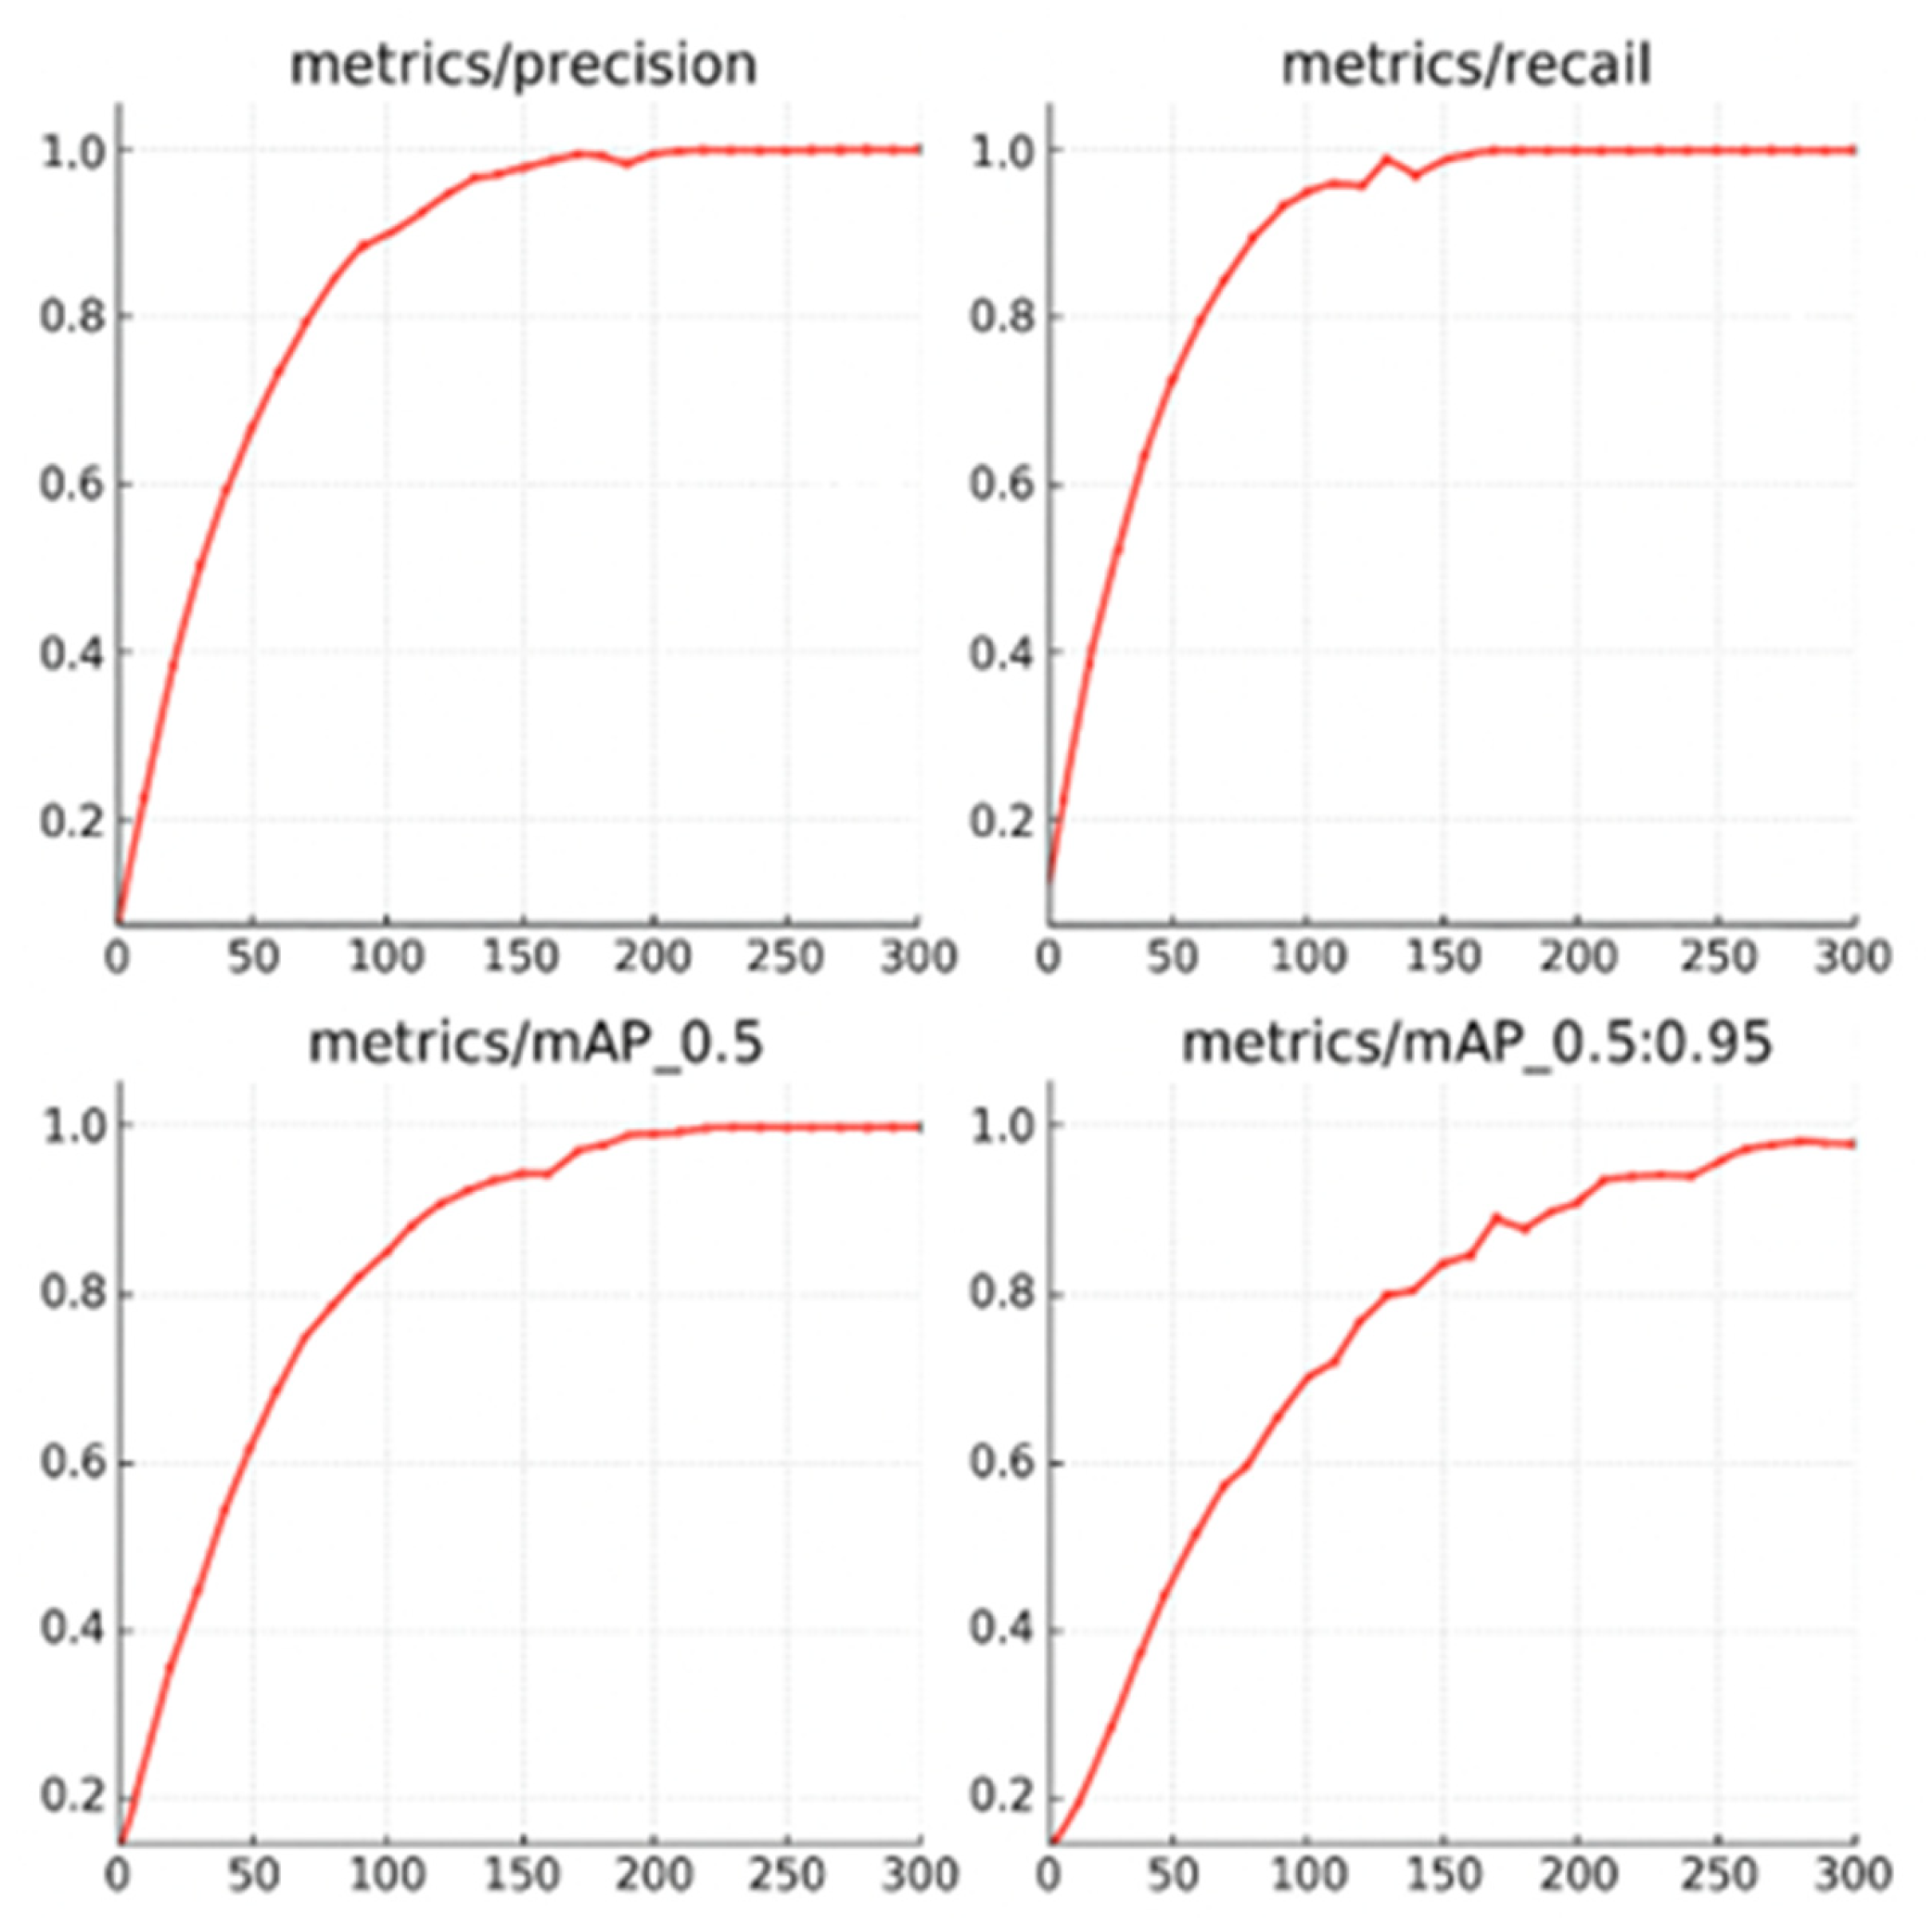
Figure 5.
Cross Validation Accuracy of CNN Model Across Three Folds.
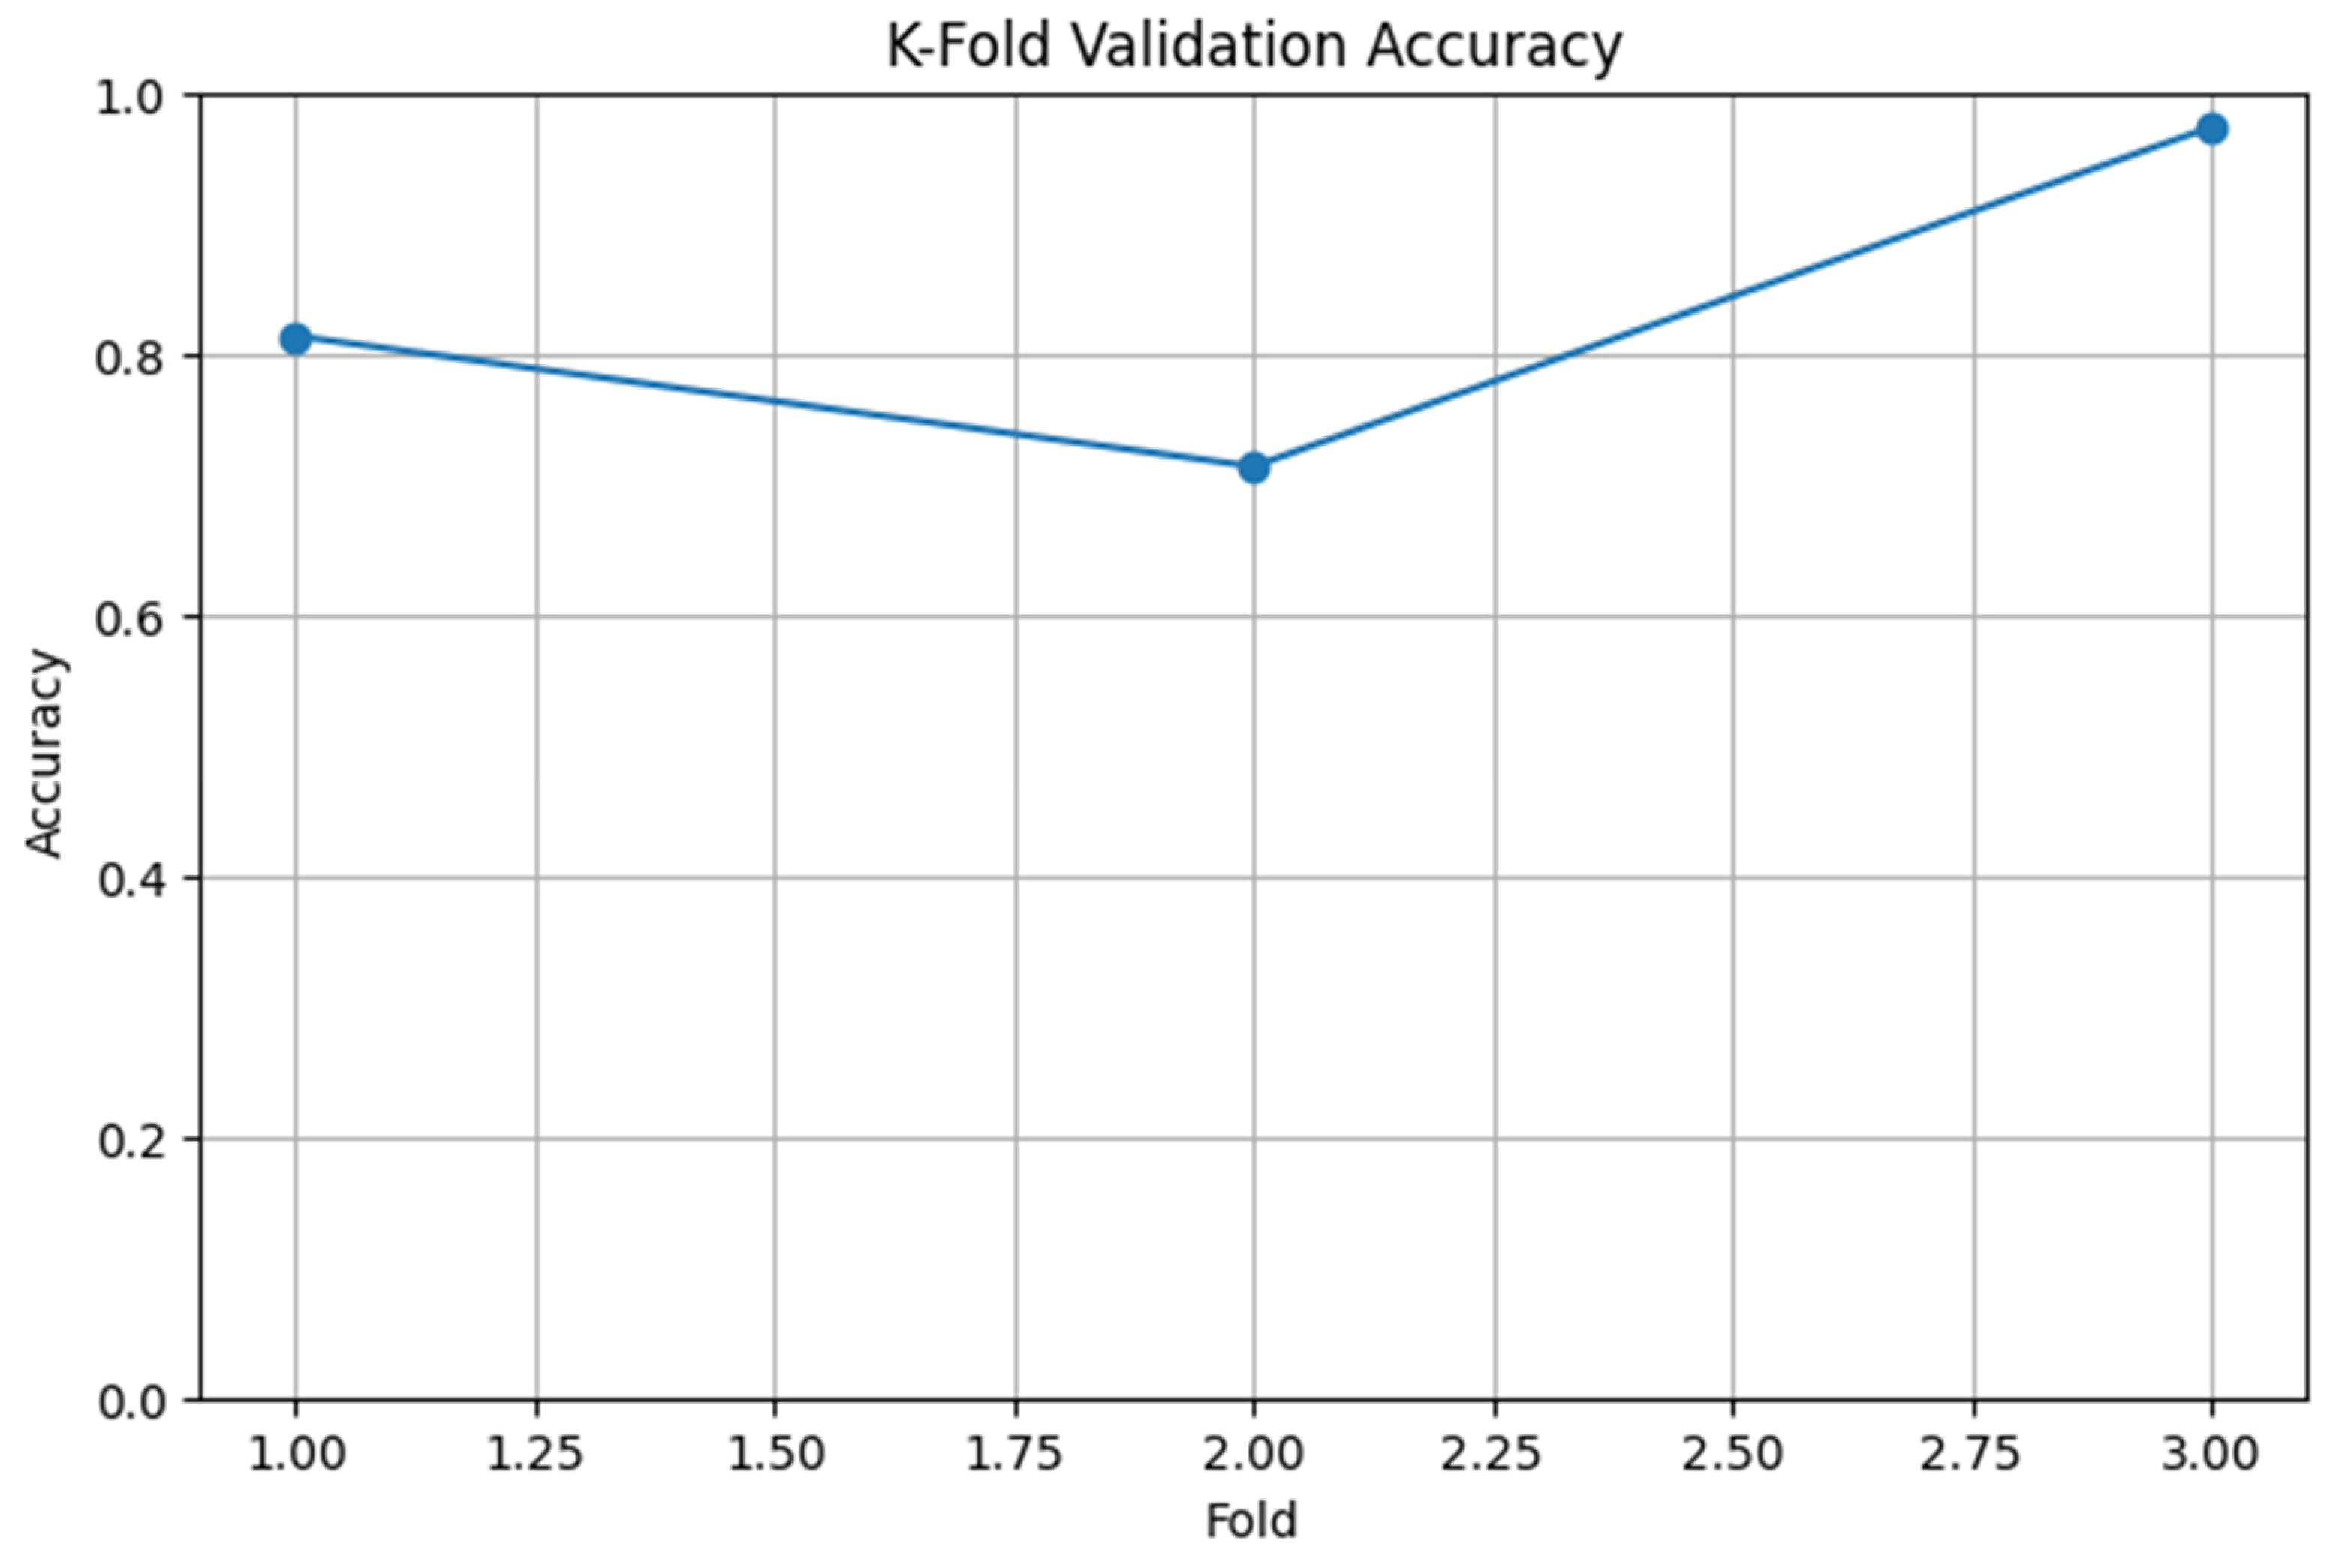
Figure 6.
Confusion Matrix for CNN-Based Deformation Classification in 3D-Printed Nylon Composites.
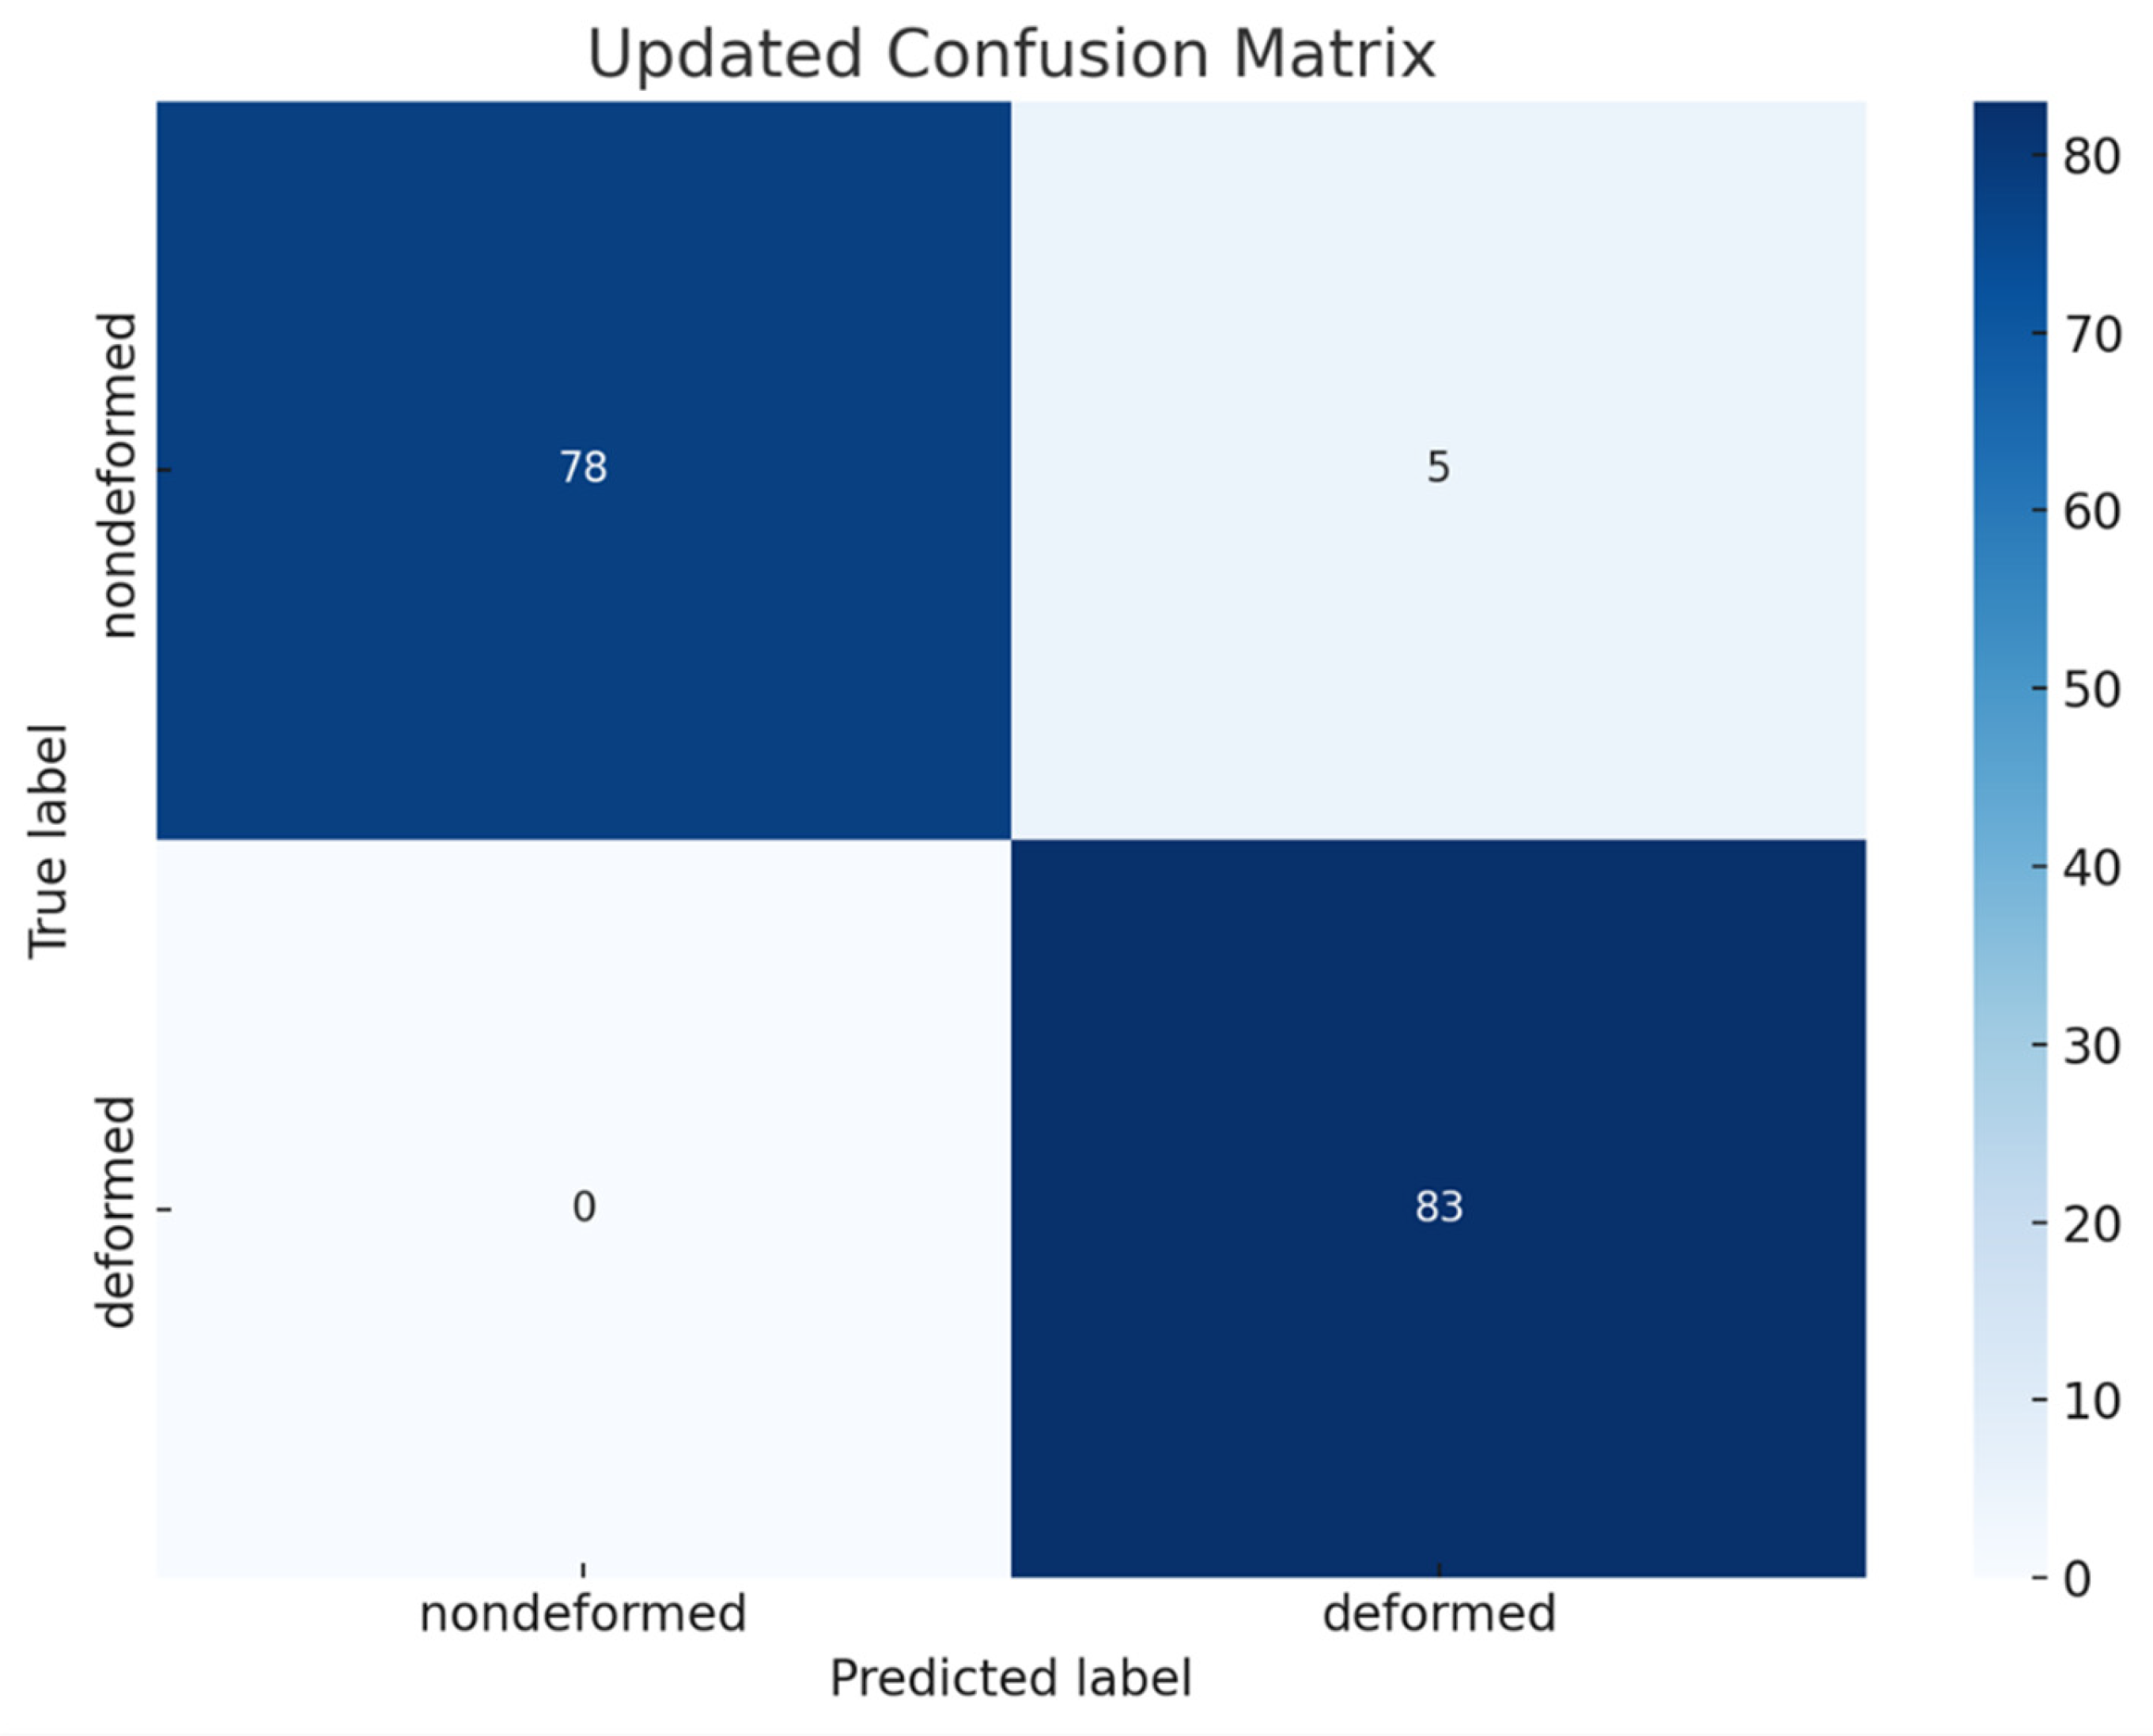
Figure 7.
Visual Analysis of Deformation in 3D Printed Fiber Reinforced Nylon Composites to Visualization for Example-A.
Figure 7.
Visual Analysis of Deformation in 3D Printed Fiber Reinforced Nylon Composites to Visualization for Example-A.
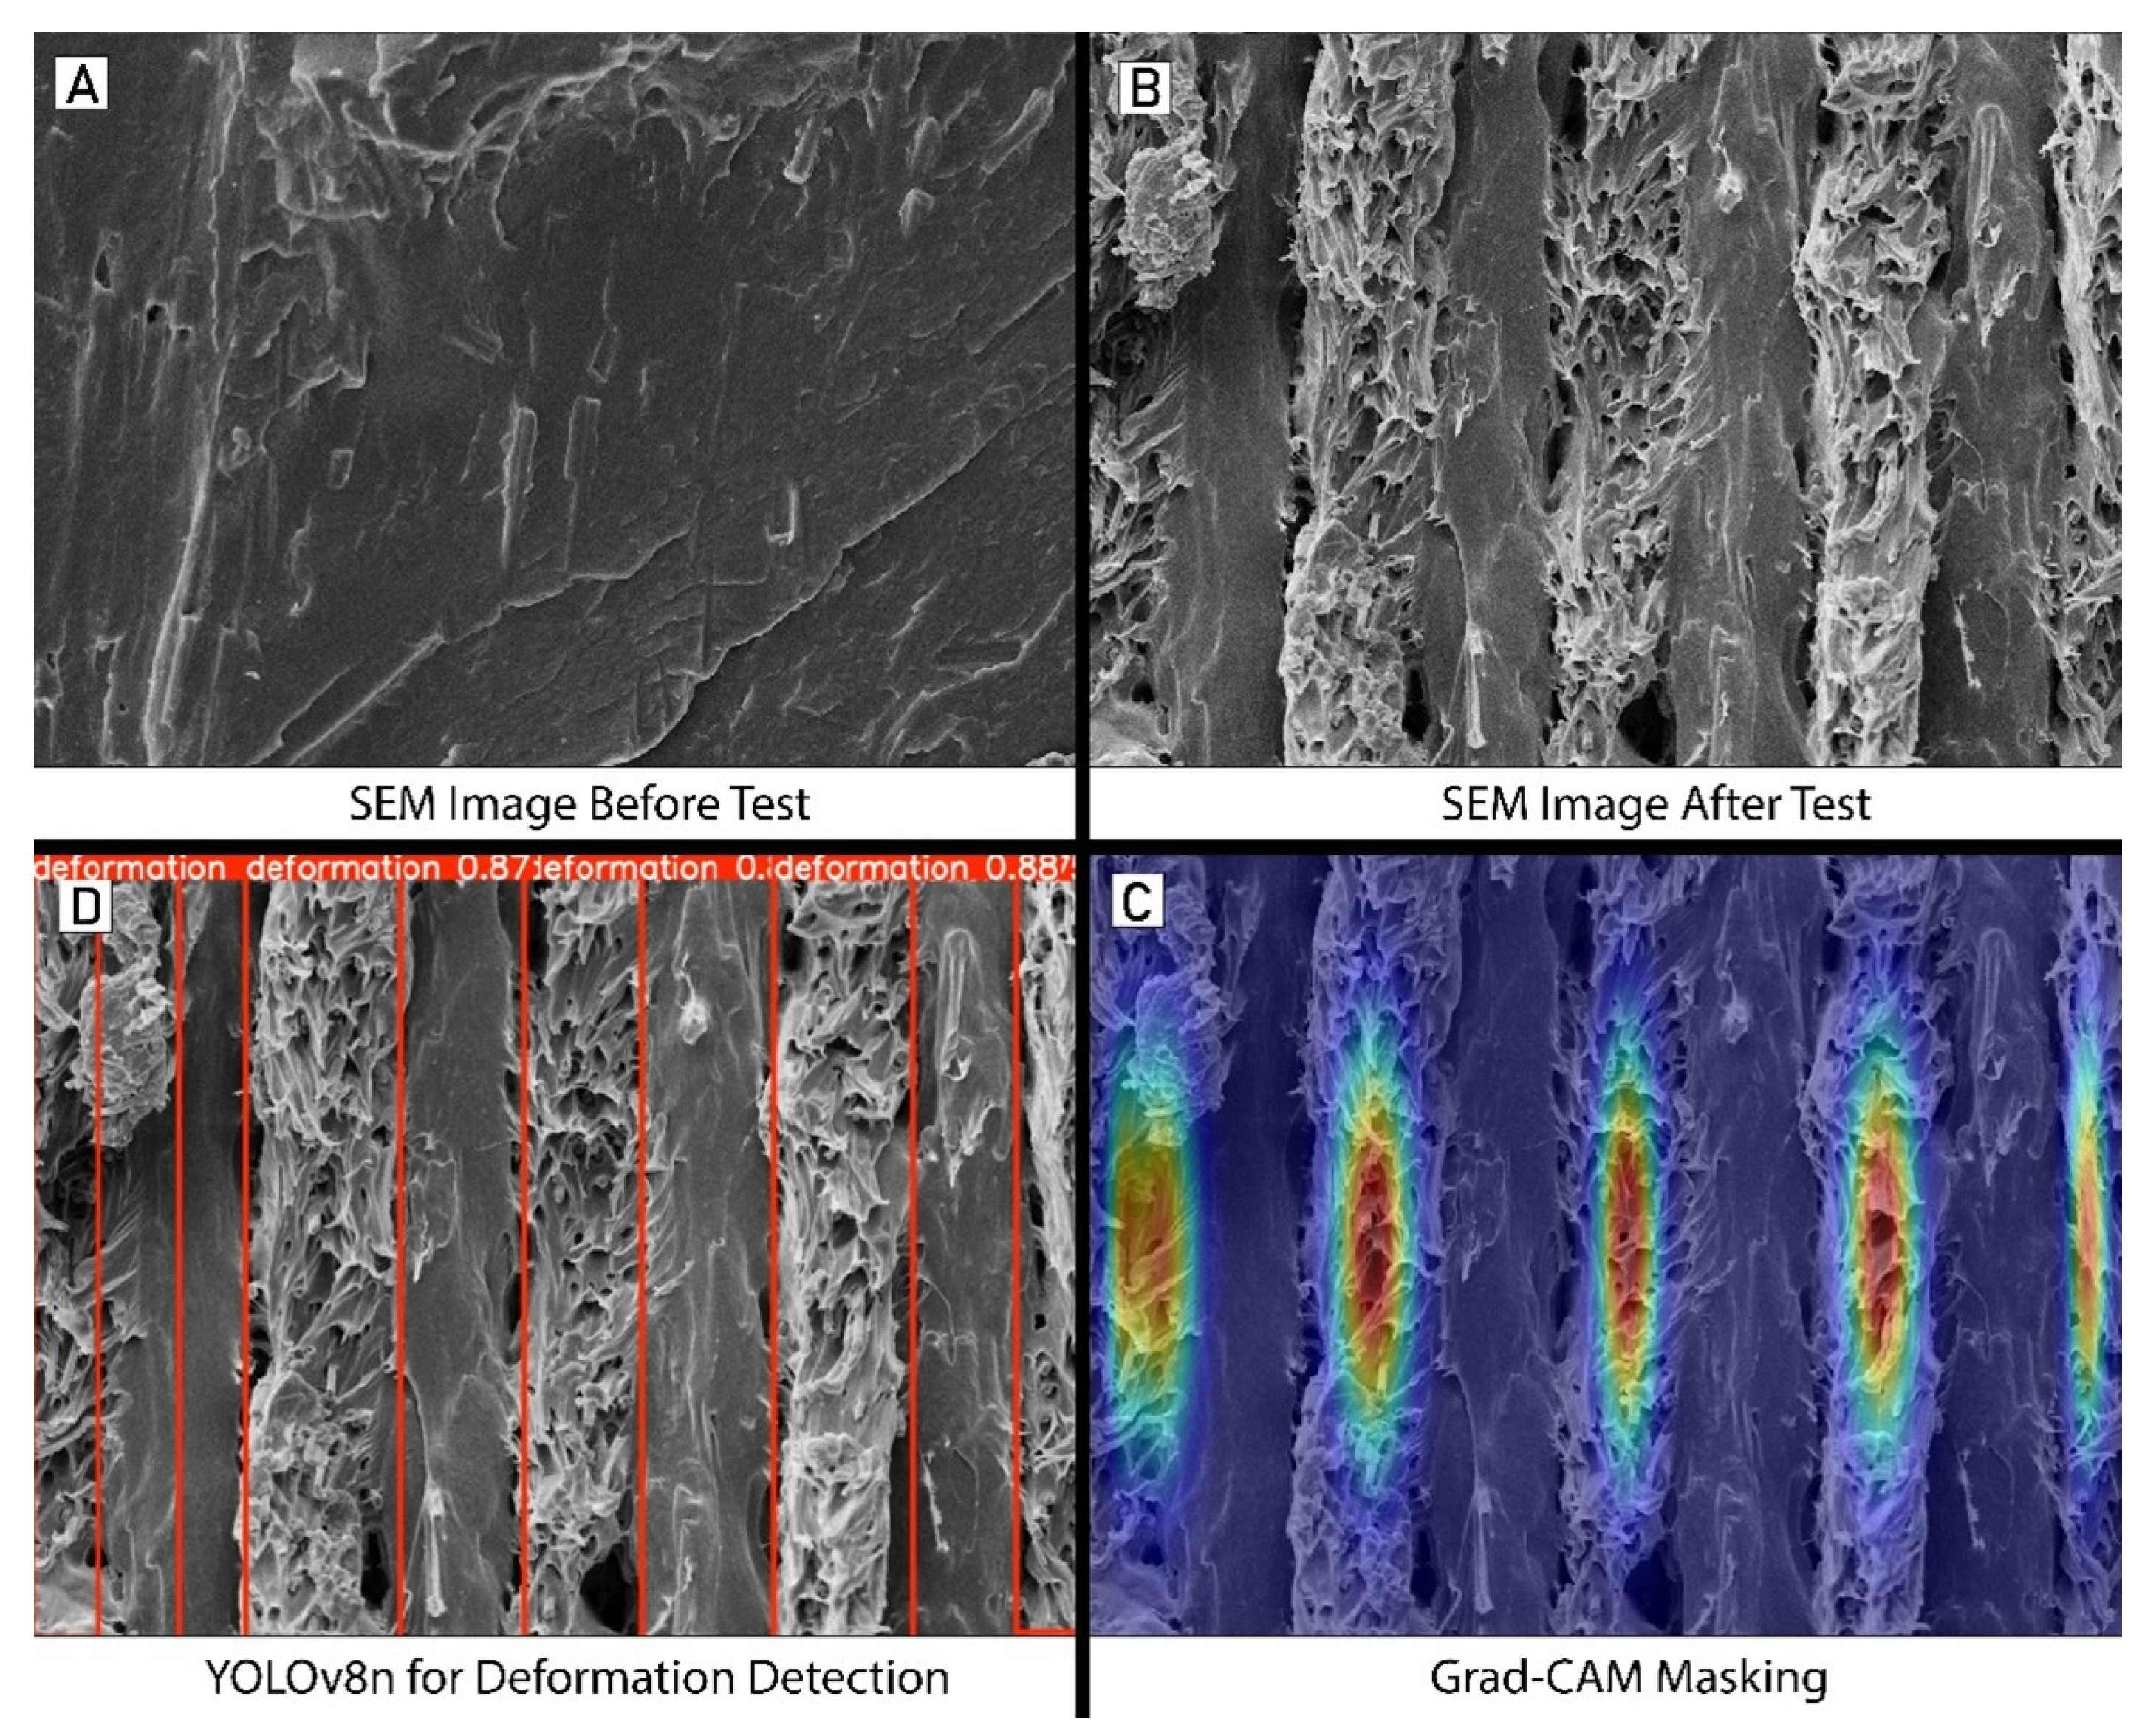
Figure 8.
Correlation between normalized load and maximum deformation rate.
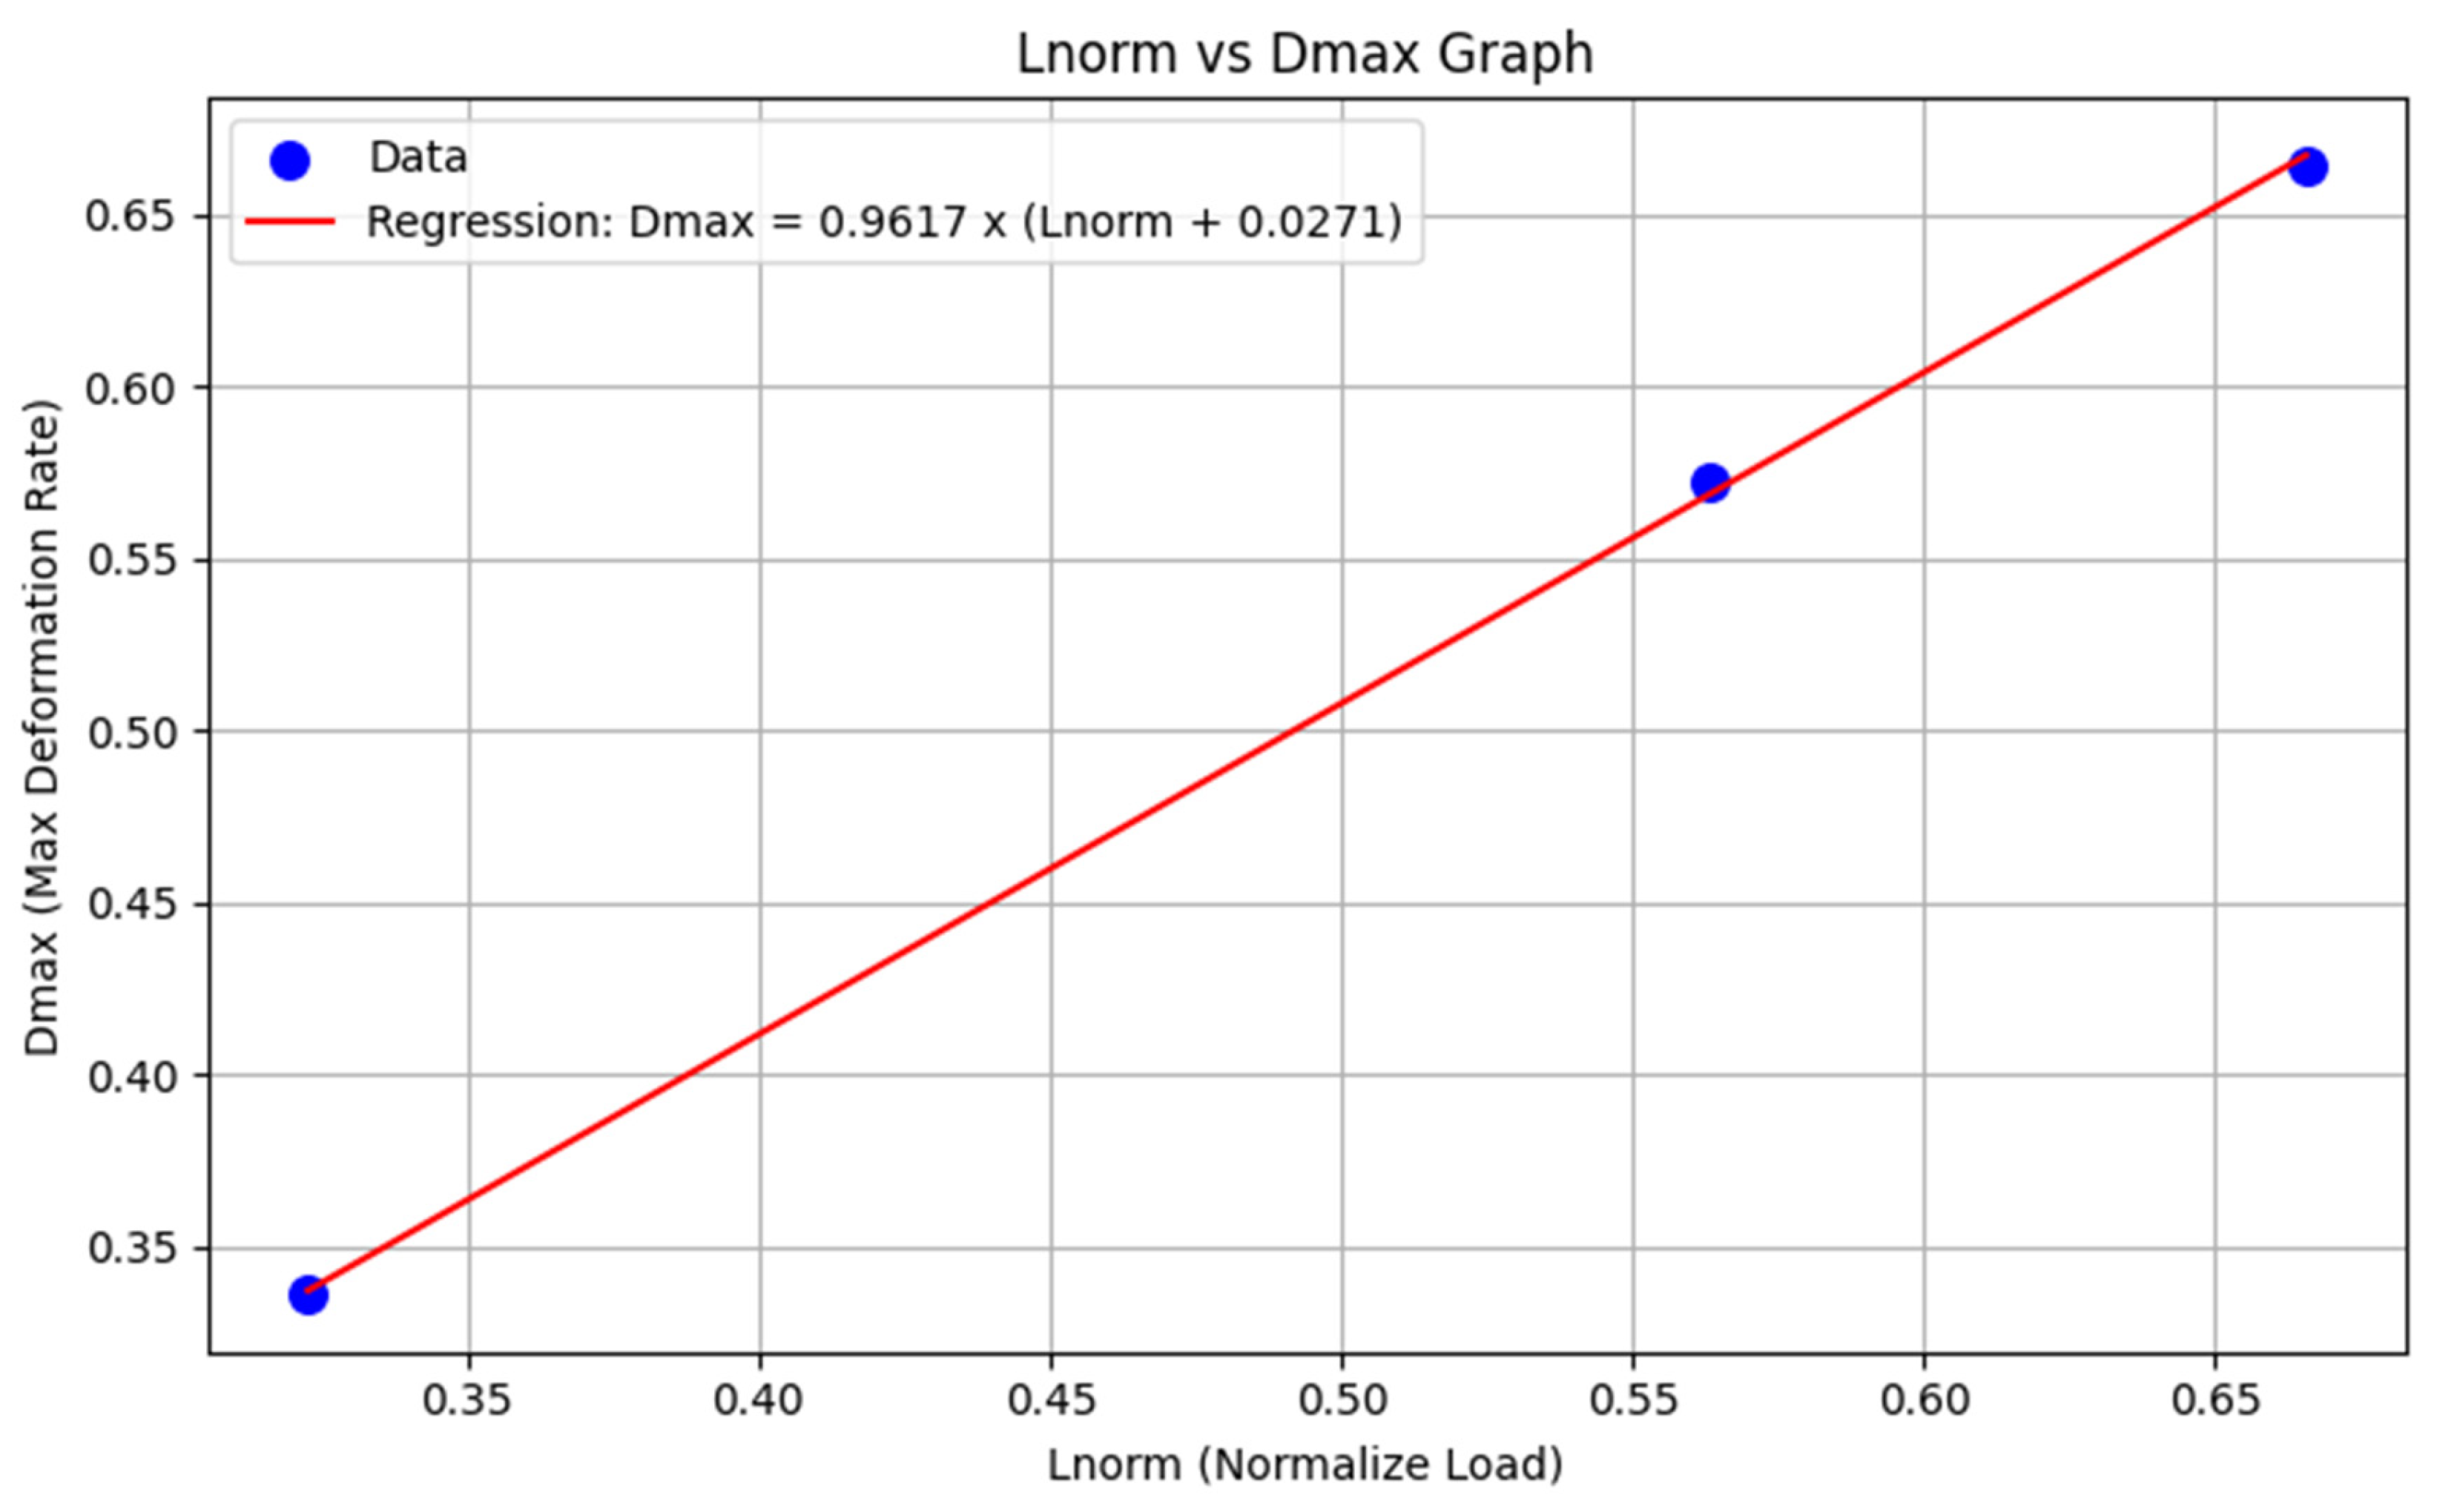
Figure 9.
Load-Displacement Predicted Graph of “Example-A”.
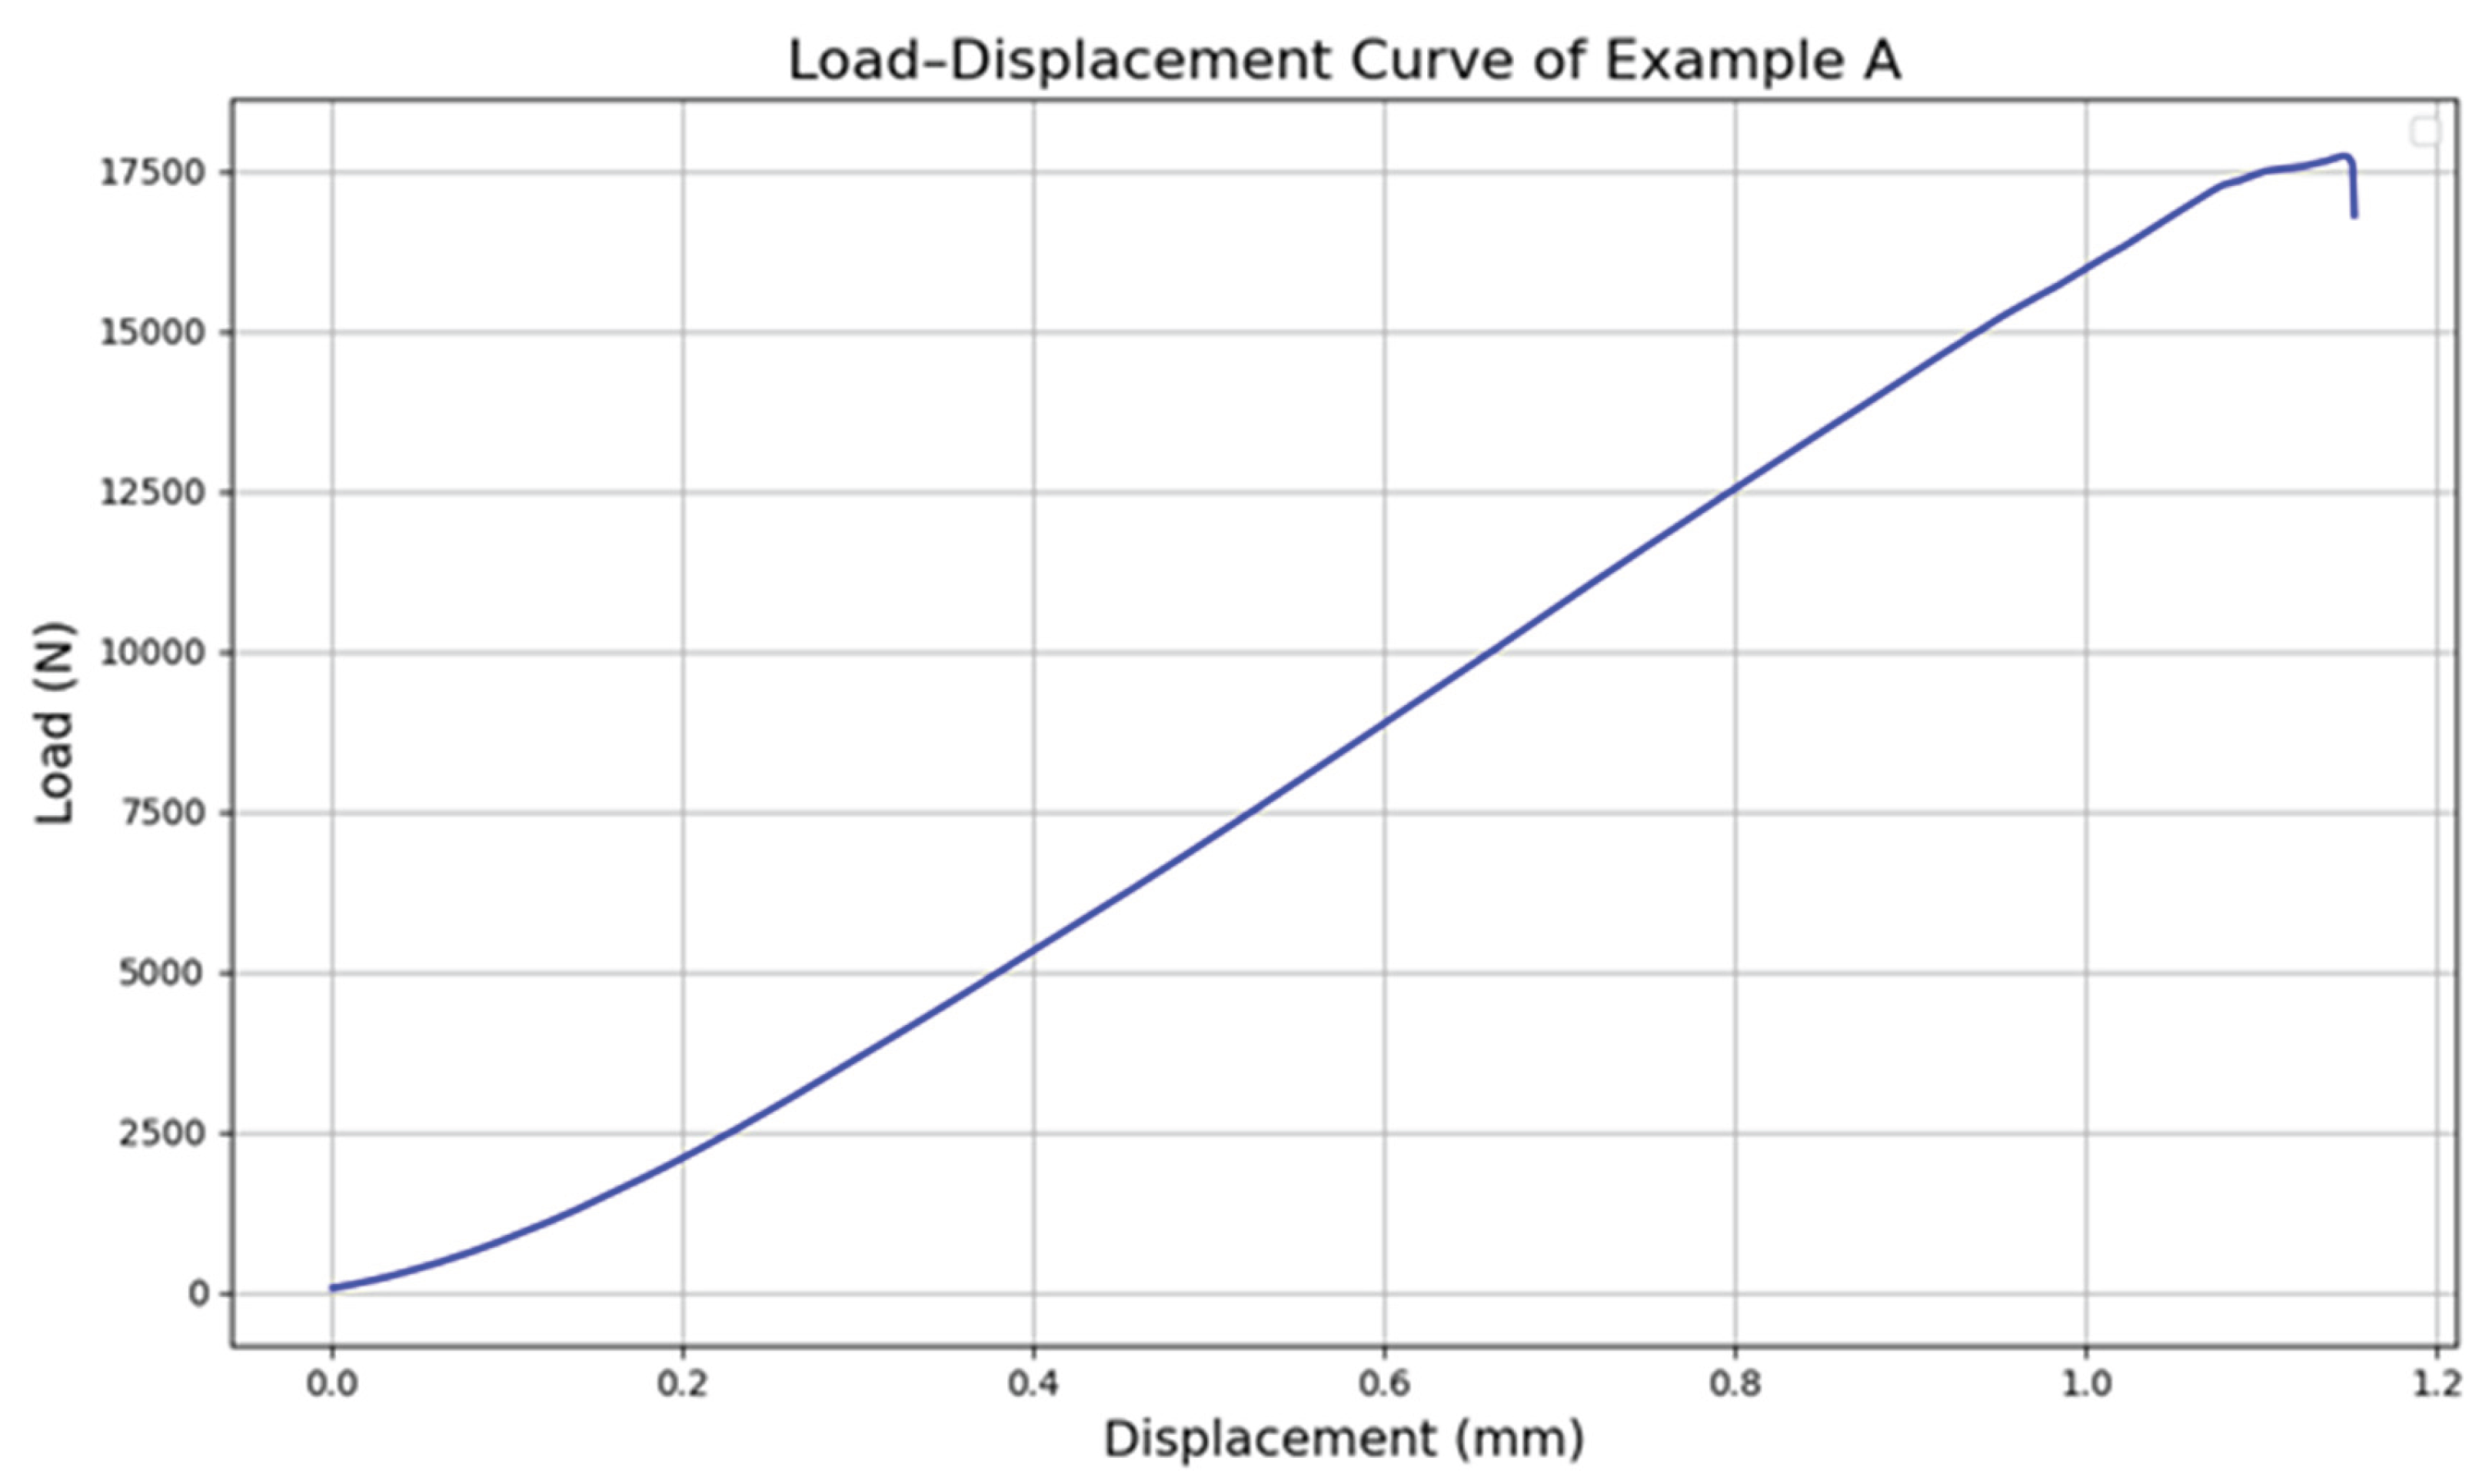

Table 1.
Summary of The Previous Studies.
| Study | Dataset | Techniques | Results |
|---|---|---|---|
| [33] | A big data collection of over 5,000 entries containing technological characteristics (chemical composition, tempers). | Artificial Neural Networks (ANN); data preprocessing (retrieval, filtering, organization). | The trained ANN predicts Young’s modulus, yield stress, ultimate tensile strength, and elongation at break with over 95% confidence. |
| [34] | 100 CPFE-generated stress-strain curves (4,000 steps each) for different crystal orientations. | Supervised + Unsupervised Deep Learning; Transfer Learning. | <2% error; 4000x speedup over CPFE; curve predicted from a single strain step. |
| [35] | 3,000 experimental data points on rock strain. | GBM, SVR, RF, GMDH, Ensemble Unit (EnU); model comparison using R², AIC, error matrix. | GBM achieved 98.16% (longitudinal) and 99.98% (lateral) R²; outperformed other models. |
| [36] | A few hundred simulation data across various material systems (e.g., composites, metamaterials). | Graph Neural Networks (GNN); mesh-to-graph mapping. | Accurately predicts stress, strain, and deformation; captures nonlinear effects like plasticity and buckling. |
| [37] | Simulation data from two structural cases: a fixed plate and a reinforced panel under pressure. | Artificial Neural Networks (ANN); reduced order modeling. | ~40× faster than Ansys; ~20% average error; suitable for early-stage digital twin applications. |
| [38] | Limited dataset (10–27% of all possible microstructures). | PCA + CNN; stress-strain curve and prediction. | <10% MAE on key descriptors (modulus, strength, toughness) |
Table 2.
Summary of Performance Metrics Used in the Study and Their Calculation Methods.
| Metrics | Calculation |
|---|---|
| Accuracy [40] | |
| Precision [41] | |
| Recall [42] | |
| F1-Score [40] | |
| MCC [43] |
Table 3.
Key Parameters and Derived Variables Used in the Deep Learning–Based Prediction of Ultimate Tensile Load And Deformation Behavior from SEM Imagery.
Table 3.
Key Parameters and Derived Variables Used in the Deep Learning–Based Prediction of Ultimate Tensile Load And Deformation Behavior from SEM Imagery.
| Description | ||
|---|---|---|
| The predicted ultimate load that the 3D printed nylon takes can withstand, calculated from deformation rate and load range. | ||
| The constant minimum loads a 3D nylon take can support (7276 N). | ||
| The maximum load that a 3D nylon takes can carry during testing. | ||
| The normalized ultimate load is computed to allow comparison across specimens. | ||
| The difference between the maximum and minimum load value. | ||
| The deformation rate predicted by the CNN model is based on visual input. | ||
| The deformation area was detected by YOLOv8n after the mechanical test. | ||
| The deformation area was detected by YOLOv8n before the mechanical test. | ||
| The change in deformation area during the test | ||
| The maximum deformation rate, derived from the square root of deformation change and CNN-predicted deformation rate |
Table 4.
Performance Metrics of the YOLOv8n Model.
| Class | Accuracy | Precision | Recall | F1-Score | MCC |
|---|---|---|---|---|---|
| “deformation” | 0.930 | 0.895 | 0.832 | 0.899 | 0.851 |
Table 5.
Predicted Deformation Characteristics and Values.
| Example | YOLOv8n Values(andpost) | CNN PredictionValue () | Maximum Deformation Rate() | UltimateLoad Value () | Normalized() |
| A | = 0.2971post = 0.77010.4731 | 0.9660 | 0.6644 | 17672 N | 0.6657 |
| B | = 0.3412post = 0.75910.4179 | 0.8863 | 0.5729 | 16071 N | 0.5632 |
| C | = 0.3175post = 0.66370.3462 | 0.5713 | 0.3361 | 12314 N | 0.3226 |
Disclaimer/Publisher’s Note: The statements, opinions and data contained in all publications are solely those of the individual author(s) and contributor(s) and not of MDPI and/or the editor(s). MDPI and/or the editor(s) disclaim responsibility for any injury to people or property resulting from any ideas, methods, instructions or products referred to in the content. |
© 2025 by the authors. Licensee MDPI, Basel, Switzerland. This article is an open access article distributed under the terms and conditions of the Creative Commons Attribution (CC BY) license (http://creativecommons.org/licenses/by/4.0/).
Copyright: This open access article is published under a Creative Commons CC BY 4.0 license, which permit the free download, distribution, and reuse, provided that the author and preprint are cited in any reuse.


