
Submitted:
07 September 2025
Posted:
08 September 2025
You are already at the latest version
Abstract
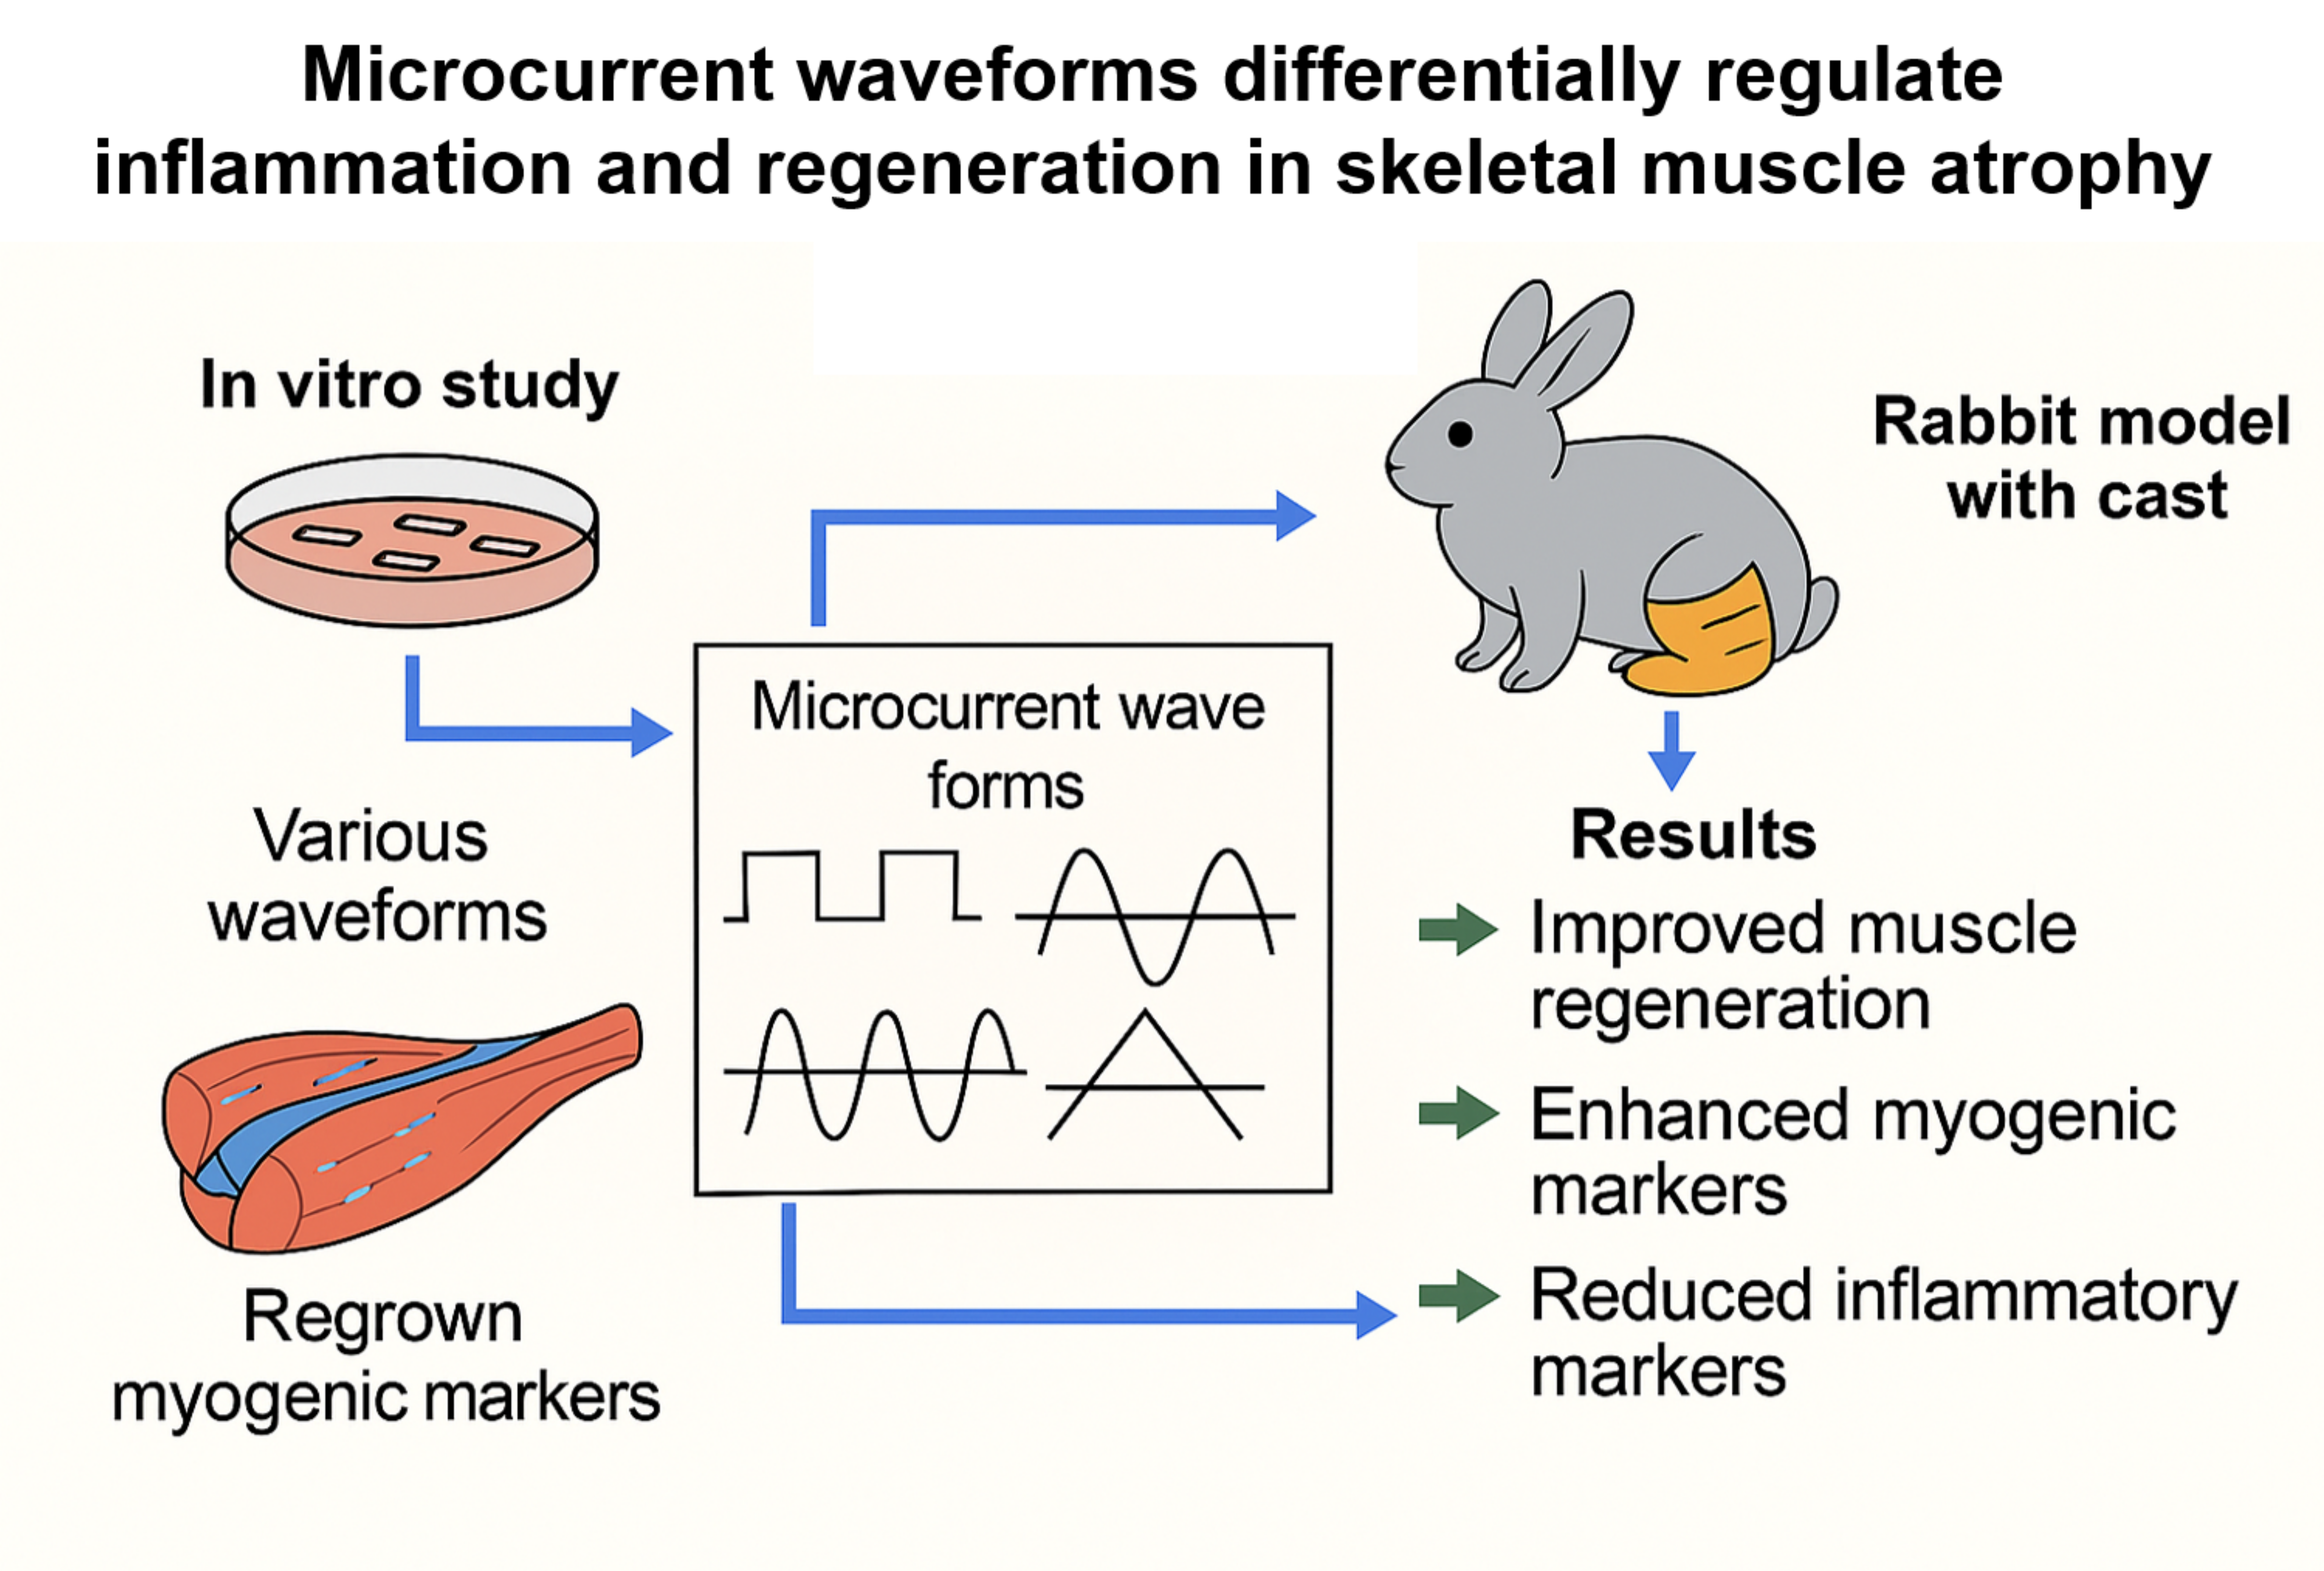
Objective: To evaluate the regenerative effects of various microcurrent waveforms in cast-induced gastrocnemius muscle atrophy in rabbits, with comprehensive in vitro and in vivo analyses.
Methods: After two weeks of enforced hindlimb immobilization via casting, twenty-four rabbits, four studied groups were formed. Each group received a different treatment for two weeks: Group 1 (control) was given sham microcurrent; Group 2 was treated with a square waveform microcurrent; Group 3 with a sine waveform; and Group 4 with a tri-angular waveform. Treatments were administered daily for one hour. We assessed calf circumference, muscle thickness via ultrasound, tibial nerve CMAP, muscle fiber CSA, and protein expressions through Western blot analysis.
Results: Notably, the sine waveform group (Group 3) showed significantly enhanced recovery across all measured parameters (p < 0.05). This group exhibited superior im-provements in muscle thickness, CMAP amplitude, and fiber CSA. Detailed immuno-histochemical analysis showed a marked rise in the expression of cellular proliferation and angiogenesis markers such as BrdU, PCNA, VEGF, and PECAM-1. Furthermore, western blot analysis highlighted a robust upregulation in myogenic regulatory factors including MyoD and Myogenin. It also showed a reduction in inflammatory and apop-totic markers such as TNF-α, NF-κB, cleaved caspase-3, and a notable decrease in stress response proteins p-CHK1 and p-CHK2.
Conclusion: Sine waveform microcurrent stimulation was the most potent in promoting muscle regeneration in both dexamethasone-induced C2C12 myoblasts and cast-induced muscle atrophy, highlighting its significant therapeutic potential. Further studies are warranted to refine clinical application parameters.
Keywords:
muscle atrophy
; microcurrent
; skeletal muscle regeneration
; waveforms
; rabbit model
1. Introduction
Skeletal muscle plays a crucial role in human life, contributing to mobility, posture, and metabolic homeostasis. When its normal function is compromised, it can lead to musculoskeletal disorders, characterized by muscle weakening, size reduction, and reduced muscle mass and fiber cross-sectional area that are revealed histologically, significantly reducing overall quality of life [1,2]. Moreover, these conditions contribute to increased morbidity and mortality rates, imposing substantial socioeconomic burdens on families and communities.1 As a result, there is a strong drive to develop therapeutic approaches that can regenerate muscles and counteract muscle atrophy.
Microcurrent stimulation therapy is a treatment technique that delivers currents below 1,000 μA, a level that is barely perceptible to the human body [3]. Factors influencing the muscle-regenerative effects of microcurrent include intensity, waveform, current type (direct [DC] or alternating current [AC]), and treatment duration, etc. Previous studies have demonstrated that low-intensity electrical stimulation (25–500 μA) significantly increases VEGF levels and enhances muscle and skin regeneration following injury and cast-induced atrophy. These effects were shown to be superior to those of high-intensity electrical stimulation (2.5–5.0 mA) in promoting wound and muscle healing [4,5]. Thus, these findings confirm that lower-intensity currents are more effective for regeneration.
The waveform of the electrical current has also been shown to influence muscle regeneration.6 Among various waveforms, the sine wave (SW) was found to be more effective than the rectangular wave (RW) in rat models due to its higher conductivity in the deeper portions of muscles [6]. Furthermore, SW stimulation generated significantly greater muscle strength and caused less pain compared to RW, suggesting that the sine wave may be more efficient for muscle regeneration [7].
In addition, a prior study revealed that direct current (DC) passing through a capacitor undergoes distortion and reduction, whereas alternating current (AC) remains unaffected under similar conditions [6]. This finding highlights the superior conductivity of AC in deeper muscle tissues, making it more effective than DC in stimulating muscle regeneration in rats.
Based on this evidence, we hypothesize that sine wave microcurrent is the most effective form of microcurrent for muscle regeneration. While former studies have revealed the efficacy of microcurrent therapy in treating muscle atrophy in rat models [6], no research has specifically investigated the impact of different microcurrent waveforms with alternative current on muscle regeneration in a rabbit model with cast-induced muscle atrophy. Thus, the aim of our research is to analyze the impact of different microcurrent waveforms on regenerative processes in atrophied calf muscles of immobilized rabbits.
2. Results
2.1. In Vitro
2.1.1. Establishment of Muscle Cell Differentiation and Muscle Reduction Cell Model
Before examining the effect of microcurrent on muscle loss, in order to establish a muscle cell differentiation and muscle loss cell model, C2C12 cells were differentiated from the myoblast state into myotubes and the morphology of the myotubes was observed. Myoblasts underwent the differentiation to myotubes with 2% HS (Horse Serum), and the morphology of the cells was observed for up to 8 days. It was observed that differentiation into myotubes occurred from the 2nd day, and on the 6th day, it was confirmed that complete myotube morphology was formed (Figure 1A).
2.1.2. DAPI Staining
Nuclear staining with DAPI revealed a rise in the number of cells with chromatin condensation and nuclear fragmentation following dexamethasone treatment, whereas microcurrent treatment reduced the incidence of these processes (Figure 1B).
2.1.3. Western Blot
2.1.3.1. Effects of Microcurrent Waveforms on Muscle Growth, Anti-Atrophy Signaling Pathway, and Expression of Proteins Related to Inflammation In Vitro
The change in protein expression levels for muscle cell prodution was confirmed through Western blot. As a result, when the control group was considered as 1, the protein expression levels of Myo-D and myogenin decreased to 0.14±0.03 and 0.15±0.02, respectively, when dexamethasone was applied (Group-A), and MC treatment after dexamethasone treatment was shown to increase the expression level. In particular, the sine wave treatment (Group-C) resulted in the increase to a similar degree to the control (0.91±0.03 and 0.92±0.01, respectively) (Figure 2A). To evaluate the mechanism of action of microcurrent on muscle atrophy inhibition, C2C12 myotubes were preprocessed with 10 μM dexamethasone for 24 hours, and then treated with microcurrent for 15 minutes. After 24 hours of reaction, proteins were collected by RIPA, and Akt and FOXO1a proteins, which are factors of the signaling pathway linked to protein synthesis and degradation, were confirmed through Western blotting. Dexamethasone treatment significantly decreased the p-Akt level, but the microcurrent treatment increased p-Akt and p-FOXO1a, and in particular, it was confirmed that the treatment with sine wave recovered to a level similar to the control. p-FOAO1a was 1.00±0.22 in the control group, 0.46±0.04 in group A, 0.61±0.02 in group B, 0.80±0.02 in group C, 0.70±0.07 in group D, and p-Akt was 1.00±0.06 in the control group, 0.52±0.02 in group A, 1.60±0.02 in group B, 1.57±0.01 in group C, 0.91±0.03 in group D (Figure 2B). To analyze the impact of microcurrent therapy on the expression of inflammatory proteins, the expression levels of TNF-α, NF-kB, pp38, and HMGB1 were compared using Western blot. TNF-α was 1.00±0.01 in the control group, 5.77±0.19 in Group-A, 3.23±0.33 in Group-B, 1.36±0.01 in Group-C, and 4.47±0.28 in Group-D, and NF-kB was 1.00±0.03 in the control group, 6.06±0.46 in Group-A, 4.68±0.29 in Group-B, 1.49±0.09 in Group-C, and 3.71±0.14 in Group-D. In addition, pp38 was 1.00±0.07 in the control group, 1.68±0.12 in Group-A, 1.17±0.02 in Group-B, 0.98±0.06 in Group-C, and 1.24±0.01 in Group-D, and HMGB1 was 1.00±0.07 in the control group, 6.40±0.05 in Group-A, 4.60±0.08 in Group-B, 1.55±0.10 in Group-C, and 5.06±0.17 in Group-D. In Group-A, the dexamethasone treatment group, the expression levels of inflammation-related proteins significantly rose in comparison with the control group, but the expression levels decreased by microcurrent treatment, and in particular, Group-C showed the values similar to the control group (Figure 2C).
2.1.3.2. Effects of Microcurrent Waveforms on Angiogenic Factors, Epithelial-Mesenchymal Transition (EMT), DNA Damage Markers, and Apoptosis Markers In Vitro
In our research, the expression levels of VEGF, PECAM-1, and PCNA were measured using Western blot after microcurrent treatment in cells with dexamethasone-induced muscle atrophy. As shown in the figure, VEGF in the control group was 1.00±0.06, in group A 0.17±.0.01, in group B 0.82±0.01, in group C 0.85±0.01, and in group D 0.68±0.03, PECAM-1 was 1.00±0.03 in the control group, 0.19±0.01 in group A, 0.90±0.03 in group B, 1.01±0.04 in group C, 0.89±0.02 in group D, and PCNA was 1.00±0.01 in the control group, 0.16±0.00 in group A, 0.88±0.00 in group B, 0.96±0.01 in group C, 0.82±0.01 in group D. Dexamethasone treatment enabled to significantly reduce the expression of VEGF, PECAM-1, and PCNA, but increase the expression levels decreased by MC treatment. In particular, the sine wave treatment group (group-C) showed the values similar to the control group (Figure 3A). To analyze the effect of microcurrent on EMT expression in cells with dexamethasone-induced muscular atrophy, the expression levels of E-cadherin, slug, and Vimentin were compared with Western blotting. E-cadherin was 1.00±0.06 in the control group, 5.82±0.15 in Group-A, 1.81±0.09 in Group-B, 1.27±0.15 in Group-C, and 2.92±0.28 in Group-D, slug was 1.00±0.29 in the control group, 0.33±0.02 in Group-A, 1.03±0.05 in Group-B, 1.19±0.04 in Group-C, and 0.66±0.11 in Group-D, and vimentin was 1.00±0.06 in the control group, 0.25±0.01 in Group-A, 0.79±0.02 in Group-B, 0.91±0.05 in Group-C, and 0.64±0.05 in Group-D. The sine wave treatment group (Group-C)showed the values changed by dexamethasone treatment similar to the control group (Figure 3B). The p-Chk1 and p-Chk2 levels were assessed by Western blot to analyze the impact of microcurrent on DNA damage. Group-A treated with dexamethasone demonstrated significantly higher phosphorylation of Chk1 and Chk2 (5.03±0.19 and 4.74±0.23, respectively) than the control, but the protein expression of p-Chk1 and p-Chk2 decreased by microcurrent treatment. Particularly, the protein expression of Group-C was hindered similarly to the control group (1.05±0.03 and 1.51±0.11, respectively) (Figure 3C). To analyze the impact of MC as per the type of apoptosis of muscle cells in a dexamethasone-induced atrophy cell model, the expression levels of major regulatory factors related to apoptosis, such as Bax, Bcl-2, caspase-3, cleaved caspase-3, PARP, and cleaved PARP, were examined. As a result, the dexamethasone-induced atrophy group (Group-A) showed elevated expression levels of caspase-3, PARP, and Bax, while the expression of Bcl-2 decreased. Meanwhile, the sine wave treatment group (Group-C) among the microcurrents recovered similarly to the control (Figure 3D).
2.2. In Vivo
2.2.1. Clinical Parameters
There were no significant differences of mean atrophic changes (%) in the clinical, imaging, and electrophysiologic parameters between the four groups after the two weeks of immobilization (p<0.05, Table 1).
The mean changes (%) in the right medial and lateral GCM muscle thickness, right calf circumference, and CMAP amplitude of the right tibial nerve in Group 2, Group 3, and Group 4, indicative of regeneration, significantly exceeded those in Group 1 (p<0.05, Table 2). Among these groups, Group 3 showed the greatest changes in regeneration, although the parameters between Group 3 and Group 4 did not have significant differences (p<0.05, Table 2).
On motion analysis, walking distance and fast walking time in Group 2, Group 3, and Group 4were significantly longer/higher than those in Group 1, but showed no significant differences among Group 2, Group 3, and Group 4 (p<0.05, Table 3).
2.2.2. Histological Examination
The results for the CSA of muscle fibers showed significant differences in multiple parameters. In the medial GCM, Type 1, and total muscle fibers, there were significant differences across all groups (P = 0.000, Figure 4), while Type 2 muscle fibers exhibited them only in Groups 1 and 4 (P = 0.001, Figure 4). In the lateral GCM, Type 1 muscle fibers showed significant differences across all groups (P = 0.000, Figure 4). Type 2 muscle fibers differed significantly in the Groups 2 and 4 (P = 0.011, Figure 4), while this was not characteristic of others. For all muscle fibers in the lateral GCM, the Groups 2 and 4 exhibited no significant differences, while the other groups did not differ significantly (P = 0.000, Figure 4). For the total GCM, Type 1 muscle fibers demonstrated significant differences across all groups (P = 0.000, Figure 4), while both Type 2 and total muscle fibers did not in the Groups 2 and 4 but had significant differences in other groups (P = 0.000, Figure 4).
The findings from the immunohistochemical analysis showed group-specific differences in BrdU, PCNA, PECAM, and VEGF markers. BrdU staining differed significantly in the medial and lateral GCM for the Groups 1 and 3 (P = 0.000, Figure 5 and Figure 6), while the Groups 2 and 4 did not. The intergroup comparative analysis also demonstrated a similar pattern (P = 0.05, Figure 5 and Figure 6). For total BrdU ratio (%), the Groups 2 and 4 did not demonstrate them, whereas the comparisons involving other groups consistently showed them (P = 0.000, Figure 5). PCNA staining indicated no significant differences in the Groups 2 and 4 for the medial GCM, while the comparisons involving other groups demonstrated them (P = 0.05, Figure 5). In the lateral GCM, the Groups 1 and 3 differed significantly (P = 0.000, Figure 5), while the Groups 2 and 4 did not. For the total PCNA ratio (%), the Groups 2 and 4 had no significant differences, whereas others had (P = 0.000, Figure 5).
ECAM staining showed no significant differences in the Groups 2 and 4 for both medial and lateral GCM, but significant differences were observed in comparisons involving Groups 1 and 2 (P = 0.01, Figure 68) and Groups 1 and 4 (P = 0.05, Figure 6). Comparisons among other groups also demonstrated statistically significant differences (P = 0.000, Figure 6). VEGF staining revealed no significant differences in Groups 2 and 4 for both medial and lateral GCM. However, the Groups 1 and 3 did not differ significantly (P = 0.000, Figure 8), as well as the others (P = 0.01, Figure 6). For the total VEGF ratio (%), the Groups 2 and 4 showed no significant differences, while the comparisons involving other groups consistently did (P = 0.000, Figure 6).
2.2.3. Western Blot
2.2.3.1. Effects of Microcurrent Waveforms on Muscle Growth, Anti-Atrophy Signaling Pathway, and Expression of Proteins Related to Inflammation In Vivo
The findings from the Western blot analysis revealed group-specific differences in Myo-D and myogenin. Myo-D level showed 1.00±0.05 in the control group (Group-1), 6.02±0.27 in the Group-2, 8.40±0.53 in Group-3, 5.27±0.20 in the Group-4. The Groups -1 and -2, -3, -4 differed significantly, while the Groups-3 and -4 did not them. Myogenin level demonstrated 1.00±0.02 in the control group(Group-1), 2.44±0.03 in Group-2, 2.61±0.15 in Group-3, 2.21±0.07 in Group-4. Groups-1 and -2, -3, -4 differed significantly, while Groups-2 and -3 showed no significant differences (Figure 7A). Changes in the levels of p-Foxo1a and p-Akt, factors of the muscle atrophy supression signaling pathway, were measured using Western blotting. p-Foxo1a and p-Akt levels were increased by microcurrent treatment, and in particular, the group-3, which was treated with sine waveform, showed the highest increases to 6.16±0.21 and 3.07±0.14, respectively (Figure 7B). The TNF-α, NF-κB, pp38, and HMGB1 expression levels were comparatively analyzed with Western blotting to outline the impact of different microcurrent waveforms treatment of pro-inflammatory expression. The TNF-α levels were 1.00±0.00, 0.60±0.08, 0.36±0.01, 0.77±0.04, and those for NF-κB were 1.00±0.04, 0.55±0.00, 0.26±0.02, 0.75±0.02 in groups 1,2, 3, and 4, respectively. The pp38 levels were 1.00±0.05, 0.60±0.05, 0.50±0.02, 0.69±0.01, and those for HMGB1 were 1.00±0.11, 0.58±0.05, 0.26±0.02, 0.76±0.17 in groups 1,2, 3, and 4, respectively. The expression levels of inflammation-indicative proteins decreased by microcurrent treatment, and the group-3 treated with sine waveforms showed the greatest significant decrease (Figure 7C).
2.2.3.2. Effects of Microcurrent Waveforms on Angiogenic Factors, Epithelial-Mesenchymal Transition (EMT), DNA Damage Markers, and Apoptosis Markers In Vivo
The expression changes in VEGF, PECAM-1, and PCNA, the most important factor in angiogenesis, were covered by Western blot analysis. VEGF expression increased from 3.46±0.06 in the group-2, 4.63±0.04 in group-3, and 2.96±0.05 in the group-4 compared to the group-1 (1.00±0.05), and in particular, the group-3 treated with sine waveforms showed the highest expression. PECAM-1 and PCNA were also the highest in the group-3 at 3.54±0.11 and 4.46±0.03, respectively (Figure 8A). Changes in E-cadherin, slug, and vimentin were analyzed by Western blotting to investigate the effect of different microcurrent waveforms on epithelial-mesenchymal transition expression. E-cadherin expression significantly decreased from 0.73±0.04 in the group-2, 0.58±0.03 in the group-3, and 0.74±0.21 in the group-4 than the group-1 (1.00±0.18), and in particular, the group-3 treated with sine waveforms showed the lowest expression. The slug levels were 1.00±0.12, 2.11±0.06, 2.24±0.10, 2.00±0.07, and those for vimentin were 1.00±0.08, 4.42±0.24, 6.97±0.47, 4.14±0.83 in the groups 1,2,3, and 4, respectively (Figure 8B). To analyze the effect of different microcurrent waveforms on DNA damage, the changes in p-CHK1 and p-CHK2 were confirmed through Western blot analysis. Microcurrent enabled to significantly reduce phosphorylation in CHK1 and CHK2, and although p-CHK1 did not differ significantly between groups 1 and 2, p-CHK2 protein expression decreased during microcurrent procedure. Particularly, the protein expression level of the Group 3 was the lowest among others (Figure 8C). To analyze the impact of microcurrent waveforms on apoptosis, changes in the expression rates of apoptosis-related factors, cleaved caspase-3, caspase-3, cleaved PARP, PARP, BAX, and Bcl-2, were determined by Western blotting. The level of cleaved caspase-3 decreased in Group-2 (0.46±0.07), Group-3 (0.20±0.01), and Group-4 (0.50±0.04) compared to Group-1 (1.00±0.04), and the level of cleaved PARP also decreased in Group-2 (0.75±0.05), Group-3 (0.41±0.02), and Group-4 (0.75±0.06) compared to Group-1 (1.00±0.04). In addition, the levels in the Bax represent Group-2 (0.57±0.03), Group-3 (0.33±0.01), and Group-4 (0.66±0.03). Compared to Groups 2 and 4, Group-3 treated with sine waveform showed the best decrease in the levels of markers related to apoptosis (Figure 8D).
3. Discussion
The most noteworthy outcome of this investigation is the enhanced recovery effect observed in atrophied GCMs muscle tissues following sine wave electrical stimulation, as compared to treatments using square or triangular waveforms. Among the various stimulation types applied after immobilization-induced muscle wasting, the sine waveform yielded the most favorable improvements in both structural and functional indicators of muscle regeneration. These findings were consistently demonstrated across multiple assessment modalities, including ultrasound-based muscle thickness measurements, tibial nerve compound muscle action potentials, and histological analysis of muscle fiber cross-sectional area.
Moreover, this regenerative advantage of sine wave stimulation was corroborated in an in vitro model of dexamethasone-induced atrophy using C2C12 myotubes, where sine wave-treated groups exhibited superior preservation of myotube diameter and morphology relative to other waveform conditions. These outcomes collectively suggest that sine wave stimulation can offer a more efficacious approach for mitigating muscle atrophy in both in vivo and cellular models.
In both in vitro and in vivo models of muscle atrophy, sine wave stimulation consistently produced superior outcomes compared to square and triangular waveforms. Western blot analysis of myogenic regulatory factors revealed that sine wave treatment significantly upregulated MyoD and myogenin expression, which are the key drivers of myoblast differentiation and muscle regeneration. Simultaneously, it attenuated apoptosis by decreasing levels of cleaved caspase-3, cleaved PARP, and BAX, while increasing the expression of anti-apoptotic Bcl-2 and full-length caspase-3, and PARP. These outcomes indicate that sine wave stimulation can promote muscle cell survival and regeneration by modulating apoptotic pathways [9].
In addition, the expression of angiogenesis-associated proteins, including VEGF, PECAM-1, and PCNA, was markedly elevated in the sine wave group. Notably, VEGF plays a vital role in endothelial proliferation and neovascularization, while PECAM-1 contributes to capillary density and tissue repair [10,11]. Sine wave stimulation was also shown to enhance p-Akt and p-Foxo1a expression, suggesting its involvement in muscle-preserving signaling cascades that are known to counteract atrophy-associated pathways [12].
Immunohistochemical analysis performed in vivo further supported these findings, revealing group-specific enhancements in BrdU, PCNA, VEGF, and PECAM-1 expression in the sine wave-treated animals. These markers collectively indicate increased cellular proliferation, angiogenic activity, and tissue regeneration.
Moreover, sine wave therapy effectively suppressed pro-inflammatory signaling molecules, including TNF-α, NF-κB, HMGB1, and phosphorylated p38 MAPK. These mediators are known to exacerbate muscle degradation and impair regeneration [13,14]. Furthermore, sine wave-treated groups showed reduced expression of DNA damage-related proteins p-CHK1 and p-CHK2, implicating its protective effects on genomic integrity during recovery. Finally, EMT-related protein analysis revealed decreased expression of mesenchymal markers slug and vimentin, alongside preserved E-cadherin levels, suggesting that sine wave therapy can help maintain epithelial phenotype and reduce fibrotic transition in regenerating tissues.
Taken together, these outcomes indicate that sine wave stimulation confers a broad spectrum of therapeutic effects, including pro-regenerative, anti-apoptotic, anti-inflammatory, angiogenic, and genomic protective benefits. Its multifactorial action profile highlights sine wave as a promising modality for mitigating muscle atrophy and enhancing recovery in both cellular and animal models.
In a previous study [15], triangular, sine, and square waveforms were comparatively analyzed during functional electrical stimulation (FES) of the upper extremity. The triangular waveform was found to require the least average current to produce the same movement and was associated with less discomfort compared to the square. These findings suggest that gradual increase and decrease in current amplitude inherent to triangular waveform may help reduce abrupt changes in stimulation, thereby minimizing patient discomfort.
In contrast, our study found the sine waveform to be the most effective. This discrepancy may be attributed to the differences in current intensity. While conventional FES typically uses stimulation intensities in the mA range to induce muscle contraction, our study had a 50 µA. This substantial difference in current levels may have contributed to the differing responses observed between the triangular and sine waveforms.
Compared to the widely used hindlimb unloading (HU) model in rodents, the cast-induced immobilization model employed in this study offers distinct advantages for studying skeletal muscle atrophy. A HU model, while effective in mimicking microgravity or reduced weight-bearing conditions, does not replicate joint fixation or localized neuromuscular inactivity as seen in clinical settings [16]. In contrast, cast-induced immobilization results in more pronounced and site-specific muscle disuse, which better reflects clinical conditions, such as casting or post-operative immobilization [17,18].
Furthermore, the use of rabbits allows for higher-resolution ultrasound imaging and electrophysiological assessment due to their larger muscle mass, thereby enhancing translational relevance. These features make a cast-induced immobilization model a more physiologically and clinically representative system for evaluating anti-atrophic interventions.
Collectively, these features suggest that the rabbit cast-immobilization model provides a more clinically relevant and physiologically accurate platform for evaluating therapeutic strategies aimed at mitigating disuse-induced muscle atrophy.
This research has some limitations that warrant consideration. Firstly, the total experimental period was restricted to four weeks, including baseline assessments, two weeks of immobilization, and a two-week intervention phase. As such, the long-term regenerative effects of different microcurrent electrical waveforms remain widely unclear. Extended observation periods are needed to determine whether the observed benefits persist over time.
Secondly, only the single current intensity (50 μA) was applied in our study. The study did not examine the effects of varying microcurrent amplitudes, and it is possible that different intensities may elicit distinct physiological responses. Future research should explore a range of stimulation intensities to establish optimal parameters for muscle recovery.
Thirdly, the duration of daily stimulation was fixed at one hour, which may not represent the most effective treatment schedule. Investigating different session lengths and frequencies can provide more insight into dose-dependent therapeutic effects.
Moreover, while molecular and histological markers were analyzed, the functional assessments, such as those on muscle strength, endurance, or behavioral outcomes were not included. These evaluations are critical for translating experimental findings into clinically meaningful applications.
Lastly, the study was conducted using a limited sample size and only one animal species. Further investigations involving larger cohorts and multiple animal models are essential to improve the generalizability and translational relevance of the outcomes.
4. Materials and Methods
4.1. In Vitro Study
4.1.1. In Vitro Study Design
C2C12 myoblasts used in the experiment were purchased from ATCCⓇ (C2C12 myoblasts, ATCC, Manassas, Virginia) and cultivated in DMEM (Dulbecco's Modified Eagle's Medium, WELGENE, Daegu, Korea) medium enriched with 10% FBS (fetal bovine serum, WELGENE, Daegu, Korea) and 1% antibiotics (penicillin-streptomycin, WELGENE, Daegu, Korea) at 37°C and 5% CO2. To promote myotube differentiation, when C2C12 myoblasts confluency was achieved at 80%, the medium was substituted daily with that of DMEM having 2% horse serum and 1% antibiotics for eight days. Meanwhile, muscle atrophy was induced using 10 µM dexamethasone (Sigma-Aldrich, St. Louis, MO, USA). Dexamethasone was treated alone or in combination with microcurrent for 15 minutes, and then left for 1 day (Figure 9). The cell application of a microcurrent (MC) device (intensity 0.25 μA, frequency 8 Hz; Flowmater Korea, Seoul, Korea) was performed once daily for 1 h with platinum electrodes in a CO2 incubator. The C2C12 myoblasts were assigned to five groups (n = 3 per group), with a computerized randomization method. Group 1 (control): C2C12 myoblasts with no treatment; group-A: C2C12 myoblasts with 10 µM dexamethasone; group-B: C2C12 myoblasts with 10 µM dexamethasone and MC with square waveform for 1 day; group-C: C2C12 myoblasts with 10 µM dexamethasone and MC with sine waveform for 1 day; group-D: C2C12 myoblasts with 10 µM dexamethasone and MC with triangle waveform for 1 day. An identical appearance of the sham MT to a real stimulator with no electrical current was detected.
4.1.2. DAPI Staining
Nuclear fragmentation and chromatin condensation were detected by 4',6-diamidino-2-phenylindole (DAPI) staining. Cells (105 cells/well) were cultured in 6-well plates with dexamethasone (10 μM) in DMEM containing 2% horse serum at 37°C for 48 h. The cells were distributed onto slides, cover slips were placed with mounting medium, and visually analyzed with a Leica EL6000 fluorescence microscope (microscope, Leica Microsistems GmbH, Wetzlar, Germany).
4.1.3. Western Blot Analysis
A 0.2 × 0.2 × 0.2 cm tissue sample was treated with 180 μL of 1× radioimmunoprecipitaion assay buffer (RIPA, 1× phosphate-buffered saline, 1% NP-40, 0.5% sodium deoxycholate, 0.1% SDS, 10 μg/mL phenylmethanesulfonyl fluoride, and a protease inhibitor cocktail tablet), homogenized, while the proteins were separated. The latter were quantitatively analyzed at 40 μg with a bicinchoninic acid assay kit (Thermo Fisher Scientific Inc., Waltham, MA, USA). The quantified structures were segregated by SDS-polyacrylamide gel electrophoresis, with NuPAGE 4%–12% bis-Tris gels (Invitrogen, Carlsbad, CA, USA) and then removed to a 0.2 μm PVDF membrane (Cytiva, Marborough, MA, USA). The membrane was fixed with casein blocking buffer (Thermo Fisher scientific, Blocker Casein in PBS cat. no. 37528), and the rinsing solution, PBST, was obtained by mixing PBS and Tween 20. The membrane was fixed by adding 5% casein blocking buffer for two hours. After eliminating the solution, there were added the primary antibodies Myo D(1:500) (sc-71629, Santa Cruz Biotechnology), Myogenin(1:500) (sc-13137, Santa Cruz Biotechnology), HMGB1(1:500), (ab79823, abcam), TNF-α(1:500) (sc-52746, Santa Cruz Biotechnology), E-cadherin(1:500) (#3195, cell signaling), slug(1:500) (#9585, cell signaling), Vimentin(1:500) (#5741, cell signaling), p-CHK1(1:500) (#2348, cell signaling), CHK1(1:500) (sc-8408, Santa Cruz Biotechnology), p-CHK2(1:500) (#2197, cell signaling), CHK2(1:500) (sc-17748, Santa Cruz Biotechnology), PECAM-1(sc-376764, Santa Cruz Biotechnology), PCNA(sc-56, Santa Cruz Biotechnology), VEGF(1:500) (sc-7269, Santa Cruz Biotechnology), NF-kB(1:500) (#8242, cell signaling), cleaved caspase-3(1:500) (#9664, cell signaling), caspase-3(1:500) (#14220, cell signaling), cleaved PARP(1:500) (#9541, cell signaling), PARP(1:500) (#9542, cell signaling), Bax(1:500) (#5023, cell signaling), Bcl-2(1:500) (#2870, cell signaling), p-Foxo1a(ab47326, abcam), Foxo1a(1:500) (HPA001252), p-Akt(1:500)(#9271, cell signaling), Akt(1:500)(#9272, cell signaling), p-p38 MAPK(1:500) (#9211, cell signaling), p38 MAPK(1:500) (#8690, cell signaling), and β-actin(1:1,000) (A2228, Sigma-Aldrich Corp.). They were placed in 5% casein fixing buffer for the reaction at 4°C for 24 hours. After eliminating the solution and rinsing with PBST, the secondary antibody was diluted in 5% casein blocking buffer for the reaction at room temperature for 1 hour. Then, the membrane was rinsed with PBST three times for 15 minutes each, then ECL Western Blotting Substrate was dispensed, and the X-ray film was developed. Densitometry was carried out on blots using ImageJ software (National Institute of Health, USA).
4.2. In Vivo Study
4.2.1. Animal Grouping
The study protocol was approved by the Institutional Animal Care and Use Committee (IACUC) of the Catholic University of Daegu School of Medicine, complying with IACUC guidelines for animal care and use (IRB No. DCIAFCR-230613-13-Y). Male New Zealand white rabbits (n = 24, 12 weeks old) weighing an average of 3.3 kg (with the range from 2.8 to 3.6 kg) were stored individually in steel cages at a stable temperature (23 ± 2°C) and humidity rate (45 ± 10%), with a free access to tap water and commercial rabbit diet. After a one-week adaptation period, the right legs of them were immobilized with a cast (IC) for two weeks. Then, the casts were removed along with the hair on lower limbs with a commercial hair remover. Subsequently, the rabbits were assigned to four groups (n = 6 per group), using a computerized randomization method. Group 1 (control): IC for 2 weeks and sham microcurrent (MC) for the same time after cast removal (CR); group 2: IC and MC with square waveform after CR for 2 weeks; group 3: IC and MC after CR with sine waveform for 2 weeks; group 4: IC and MC after CR with triangle waveform for 2 weeks. The visualized sham MT was identical to the real stimulator with no electrical current. No medication was administered, and all the animals were sacrificed two weeks after the procedure.
4.2.2. Immobilized-By-Cast (IC)
For 2 weeks, the right GCM muscle underwent immobilization with a PVC plastic splint, non-, and adhesive elastic bandages (Tensoplast®; Smith & Nephew Medical, London, UK), following standardized IC methods. We extended right knee and ankle with a splint (Figure 10A).
4.2.3. Microcurrent (MC)
The MC generator (alternating current, 50 μA, 8 Hz) was set to deliver three distinct waveform patterns, with polarity switching per 3 seconds. An MC electric patch was applied to all rabbits” skin, targeting a GCM by positioning the anode proximally and the cathode distally. Under anesthesia induced by ketamine and xylazine, microcurrent stimulation was performed to trigger the GCM of groups 1, 2, and 3 for 60 minutes daily over a two-week period (Figure 10B). Notably, no visible muscle contractions were observed in the hind limbs during the microcurrent application. Throughout the experiment, the rabbits could move freely within their cages. Prior to euthanasia, calf circumference, the complex muscle action potential (CMAP) of the tibial nerve, and the mid-belly thickness of GCM muscles were evaluated by ultrasound. The experimental protocol was adapted based on the techniques described by Moon et al. 8 and Park et al [4].
4.2.4. Clinical Parameters
All the parameters were analyzed by a group-blinded physiatrist. Motor nerve conduction study was done to evaluate the amplitude of CMAP of a tibial nerve. An active electrode was positioned at the midpoint of the GCM muscle, while the reference was at an ankle subcutaneously. Electrical stimulation of the nerve in a popliteal fossa was carried out, with recording the greatest CMAP values after 7–10 stimuli (Figure 10C).
The greatest circumference of calf areas was determined with a tape, where the knee joints of the animals were flexed at a 90° angle and with relaxation of ankles. The thickness of lateral and medial GCM was evaluated superficially to the deep fascia of the muscle, with real-time B-mode ultrasound (Figure 10D). Ultrasound visualization of the GCM was done longitudinally at fixed points, comparable to the injection sites.
The changes in CMAP amplitude, GCM thickness, and calf circumference, indicative of regeneration, were analyzed with the following equation: [(Values determined two weeks after treatment - Values obtained after two weeks of IC)/Values measured two weeks after treatment × 100]. The results are shown as a percentage of regenerative changes on a right side.
We performed the motion analysis of the rabbits at 2 weeks after MC application, in which the rabbits were released for 30 min to the open field before The latter was the area of 3 m2, where they could walk in for 5 min and evaluate their motions with a video-tracking system having a camera (Smart, Panlab, Barcelona, Spain) that noted down the activities in horizontal plane. Walking distance, fast walking time, and mean walking speed for 5 min were estimated.
4.2.5. Tissue Preparation
Following all intramuscular injections, the animals were sacrificed under general anesthesia. The GCM muscles from both sides were dissected and fixed with neutral-buffered formalin for 24 hours. Subsequently, the specimen was immersed in paraffin (Paraplast; Oxford, St. Louis, Missouri) and put into transversal sections of 5-μm thickness for further evaluation.
4.2.6. Histology and Immunohistochemistry
All histologic analyses were done in a blinded manner, ensuring independence of evaluations, including group assignment. Muscle slices were analyzed with an Axiophot Photomicroscope (Carl Zeiss). In all groups, five randomly chosen fields were acquired. A whole muscle cross-sectional area (CSA) images of anti-myosin immune-stained muscles (at ×100 magnification) was extracted. Subsequently, we determined that of the anti-myosin-positive type I and II muscle fibers with an image morphometry program (AxioVision SE64; Carl Zeiss) and the mean value.
Monoclonal anti-myosin antibodies (Skeletal, Slow; Sigma-Aldrich, St. Louis, MO, USA) were used for the staining of sectioned muscles for both type I and type II fibers. The slices were immune-stained to detect proliferating cells with monoclonal anti-PCNA (proliferating cell nuclear antigen) (Clone PC10; Santa Cruz Technologies, Dallas, TX, USA) and monoclonal anti-BrdU (bromodeoxyuridine) antibodies (Clone BU-33; Sigma-Aldrich), followed by angiogenic markers in polyclonal anti-VEGF (vascular endothelial growth factor) (A-20; Santa Cruz Biotechnology, Santa Cruz, CA, USA), and anti-PECAM-1 (platelet endothelial cell adhesion molecule-1) antibody (M-20; Santa Cruz Biotechnology).
For BrdU staining, all the animals received 25 mg/kg of BrdU (B5002; Sigma-Aldrich) intraperitoneally and were sacrificed 24 hours later, with the further preparation of paraffin-fixed slices.
The slices were subjected to incubation in 0.1% trypsin for 10 minutes at 37°C and 1 N HCl for 30 minutes at 56°C for DNA denaturation. Then, the immunohistochemical slices were rinsed with phosphate-buffered saline (PBS). Endogenous peroxidases underwent deactivation with pre-cultivation in 0.3% H2O2 in PBS for 30 minutes, and non-specific protein binding was done in PBS having 10% normal horse serum (Vector Laboratories, Burlingame, CA, USA) for 30 minutes.
Subsequently, the slices were infested with primary antibodies (diluted 1:100–1:500) for 2 hours at room temperature and rinsed thrice with PBS. Then, the secondary antibody (biotinylated anti-mouse IgG, diluted 1:100; Vector Laboratories) was incubated in the muscle slices for 1 hour at room temperature, followed by the other three rinses with PBS. The avidin-biotin-peroxidase complex (ABC; Vector Laboratories) was added to the slices for 1 hour, with the following three rinses with PBS. Finally, the peroxidase reaction was performed with 0.05 mol/L Tris-HCl (pH 7.6) having 0.01% H2O2 and 0.05% 3,3'-diaminobenzidine (DAB; Sigma-Aldrich). The sections were subjected to counterstaining with hematoxylin and mounting. The slides were analyzed with an Axiophot Photomicroscope (Carl Zeiss, Oberkochen, Germany) and AxioCam MRc5 (Carl Zeiss).
For the evaluation of BrdU, PCNA, PECAM-1, VEGF, and immunostaining, the photos of 20 randomly chosen fields from each group were acquired with AxioVision SE64 software (Carl Zeiss). The number of VEGF, PECAM-1, PCNA, and BrdU-positive nuclei, and the total of muscle fibers within each image were calculated. We reported the VEGF, PECAM-1, PCNA, and BrdU ratios as that of the number of positive cells or nuclei per 1,000 muscle fibers.
4.2.7. Western Blot Analysis
Calf tissue samples were preserved in radioimmunoprecipitation assay buffer (1× PBS, 1% NP-40, 0.5% sodium deoxycholate, 0.1% sodium dodecyl sulfate (SDS), 10 µg/mL of phenylmethanesulfonylfluoride, and a protease inhibitor cocktail tablet) for 1 minute on ice. Subsequently, the homogenates underwent the centrifugation at 10,000× g for 10 minutes at 4°C and preserved at -70°C for the following Western blotting. The protein clusters in the supernatants were outlined with a BCA assay kit (Thermo Scientific Inc., Waltham, MA, USA) according to the manufacturer's instructions.
For Western blotting, 40 µg protein samples were segregated by SDS-polyacrylamide gel electrophoresis with NuPAGE 4–12% bis-Tris gels (Invitrogen, Waltham, MA, USA) and removed to polyvinylidene difluoride (PVDF) membranes (GE Healthcare Life Sciences, Amersham, Bucks, Germany). The membranes were then fixed with a casein-blocking buffer (Sigma-Aldrich, St. Louis, MO, USA), followed by the incubation of antibodies. After rinsing with PBS Tween-20 buffers, they were infested with anti-mouse IgG (sc-2005; Santa Cruz Biotechnology, Santa Cruz, CA, USA)-HRP-linked species-specific whole antibody (diluted 1:5000). Protein bands on them were observed with enhanced chemiluminescence (Promega Corp., Madison, WI, USA), and an anti-β-actin antibody (A2228; Sigma-Aldrich, St. Louis, MO, USA) was used as a loading control. The primary antibodies applied were against VEGF (sc-7269; Santa Cruz Biotechnology, Santa Cruz, CA, USA), IL-1α (interleukin 1α) (1:500, ab239517; Abcam), IL-1β (interleukin 1β) (1:500, ab1832P; Merck Millipore), and TNF-α (tumor necrosis factor α) (1:500, SC-52746; Santa Cruz Biotechnology). The quantitative evaluation of density of the protein bands was performed with TINA software (Version 2.10e).
4.32.1. Statistical Analysis
The initial power analysis, performed according to pilot results, showed that the sample of 24 subjects had the power of 0.8 at the significance level of 0.05. Statistical analysis was done with the SPSS program for Windows version 22.0 (SPSS Inc., Chicago, IL, USA) and GraphPad Prism software (GraphPad Prism wersion 9.0, Dotmatics, Boston, MA,USA). Additionally to descriptive statistics (means and standard deviations), ANOVA was applied to evaluate intra- and inter-group differences. When ANOVA was indicative of significant differences between the groups, Tukey's test was done for post-hoc analysis. Mean values were shown with 95% confidence intervals, and all the data were expressed as means ± standard deviations. The predetermined statistical significance was set at P < 0.05. Post-hoc power analysis was carried out, and the estimated power was found to be > 0.95.
5. Conclusions
This study demonstrates that sine waveform microcurrent stimulation exerts superior therapeutic effects on immobilization-induced skeletal muscle atrophy. Compared to square and triangular waveforms, sine wave treatment proved to more effectively promote muscle regeneration, reduce inflammatory signaling, suppress apoptotic pathways, and elevate angiogenic and proliferative markers in both in vitro and in vivo models. The beneficial effects of sine wave stimulation were supported by the higher expression of myogenic proteins (MyoD, myogenin), angiogenic markers (VEGF, PECAM-1), and proliferation-related factors (PCNA, BrdU), as well as the decreased expression of pro-inflammatory cytokines and apoptotic proteins.
The obtained findings give new insights into the regenerative potential of sine waveform therapy and highlight its promise as an effective, non-invasive strategy for mitigating disuse-induced muscle loss. Future studies are warranted to optimize stimulation parameters, such as current intensity, duration, and frequency to maximize therapeutic efficacy and facilitate clinical translation.
Authors Contributions
(I) Conception and design: K.D.R, L.Y.J and K.E.S (II) Administrative support: K.D.R and K.E.S (III) Provision of study materials or patients: K.D.R and K.E.S (IV) Collection and assembly of data: K.D.R, K.E.S, L.Y.J, and M.Y.S (V) Data analysis and interpretation: All authors (VI) Manuscript writing: All authors (VII) Final approval of manuscript: All authors.
Funding
Please add: This work was financially supported by the Basic Science Research Program through the National Research Foundation of Korea (NRF) funded by the Ministry of Education, Science, and Technology (MEST) (2022R1A2C2091162).
Institutional Review Board Statement
The authors are accountable for all aspects of this work, including ensuring that questions related to the accuracy or integrity of any part of the work are appropriately investigated and resolved. This study was conducted according to the guidelines of the IACUC and approved by the Catholic University of Daegu School of Medicine Animal Care and Use Committee (IRB No. DCIAFCR-230613-13-Y).
Informed Consent Statement
Not applicable.
Data Availability Statement
All data generated or analysed during this study are included in this published article.
Conflicts of Interest
The authors declare no conflicts of interest.
References
- Qiu D, Zhang Y, Ni P, Wang Z, Yang L, Li F. Muscle-enriched microRNA-486-mediated regulation of muscular atrophy and exercise. J Physiol Biochem. 2024;80(4):795-809.
- Yin L, Li N, Jia W, Wang N, Liang M, Yang X, Du G. Skeletal muscle atrophy: From mechanisms to treatments. Pharmacol Res. 2021; 172:105807.
- Kwon DR, Kim J, Kim Y, An S, Kwak J, Lee S, Park S, Choi YH, Lee YK, Park JW. Short-term microcurrent electrical neuromuscular stimulation to improve muscle function in the elderly: A randomized, double-blinded, sham-controlled clinical trial. Medicine (Baltimore). 2017; 96(26):e7407.
- Park GY, Kwon DR, Moon YS. Low-intensity microcurrent therapy promotes regeneration of atrophied calf muscles in immobilized rabbits. J Biomed Res. 2018; 33(1):30–37.
- Asadi MR, Torkaman G, Hedayati M. Effect of sensory and motor electrical stimulation in vascular endothelial growth factor expression of muscle and skin in full-thickness wound. J Rehabil Res Dev. 2011; 48(3):195–201.
- Tanaka M, Hirayama Y, Fujita N, Fujino H. Electrical stimulation using sine waveform prevents unloading-induced muscle atrophy in the deep calf muscles of rat. Acta Histochem. 2014; 116(7):1192–1198.
- Petrofsky J, Laymon M, Prowse M, Gunda S, Batt J. The transfer of current through skin and muscle during electrical stimulation with sine, square, Russian and interferential waveforms. J Med Eng Technol. 2009; 33(2):170–181.
- Moon YS, Kwon DR, Lee YJ. Therapeutic effect of microcurrent on calf muscle atrophy in immobilized rabbit. Muscle Nerve. 2018; 58(2):270–276.
- Lee G, Bae H. Bee Venom Phospholipase A2: Yesterday's Enemy Becomes Today's Friend. Toxins (Basel). 2016; 8(2):48.
- Sebestyén E, Csige D, Antal-Szalmás P, Horváth Á, Végh E, Soós B, Pethő Z, Bodnár N, Hamar A, Bodoki L, et al. Effects of Tofacitinib Therapy on Circulating Tumour-Associated Antigens and Their Relationship with Clinical, Laboratory and Vascular Parameters in Rheumatoid Arthritis. Biomolecules. 2025;15(5):648.
- Lee YJ, Moon YS, Kwon DR, Cho SC, Kim EH. Polydeoxyribonucleotide and Shock Wave Therapy Sequence Efficacy in Regenerating Immobilized Rabbit Calf Muscles. Int J Mol Sci. 2023;24(16):12820.
- Orea-Soufi A, Paik J, Bragança J, Donlon TA, Willcox BJ, Link W. FOXO transcription factors as therapeutic targets in human diseases. Trends Pharmacol Sci. 2022:1070-1084.
- Zhang JL, Wang DY, Xie WG. Enhancing Mechanisms of p38MAPK/NF-κB in Regulating Postdebridement Inflammatory Response during the Shock Period in Burned Rats. J Burn Care Res. 2025;46(4):809-817.
- Jang BC, Kwon ES, Lee YJ, Jung JI, Moon YS, Kwon DR. Comparison of Muscle Regeneration Effects at Different Melittin Concentrations in Rabbit Atrophied Muscle. Int J Mol Sci. 2024; 25(9):5035.
- Han TR, Kim JH, Lee SH, Paik NJ, Lim SJ, Ko KR, Kim HC. Ideal Carrier Waveform for Functional Electrical Stimulation in Upper Extremity. Journal of the Korean Academy of Rehabilitation Medicine. 2000; 24(3), 492–501.
- Morey-Holton ER, Globus RK. Hindlimb unloading rodent model: technical aspects. J Appl Physiol (1985). 2002; 92(4):1367–1377.
- Booth FW, Thomason DB. Molecular and cellular adaptation of muscle in response to exercise: perspectives of various models. Physiol Rev. 1991; 71(2):541–585.
- Appell HJ. Muscular atrophy following immobilisation. A review. Sports Med. 1990; 10(1):42–58.
Figure 1.
C2Cl2 myoblats were incubated with 2% horse serum to induce myotube differentiation for different day periods (A) and nuclear morphology by DAPI staining (scale bar, 25μm) (B). Group 1 (control): C2C12 myoblasts with no treatment; group-A: C2C12 myoblasts with 10 µM dexamethasone; group-B: C2C12 myoblasts with 10 µM dexamethasone and microcurrent with square waveform for 1 day; group-C: C2C12 myoblasts with 10 µM dexamethasone and microcurrent with sine waveform for 1 day; and group-D: C2C12 myoblasts with 10 µM dexamethasone and microcurrent with triangle waveform for 1 day.
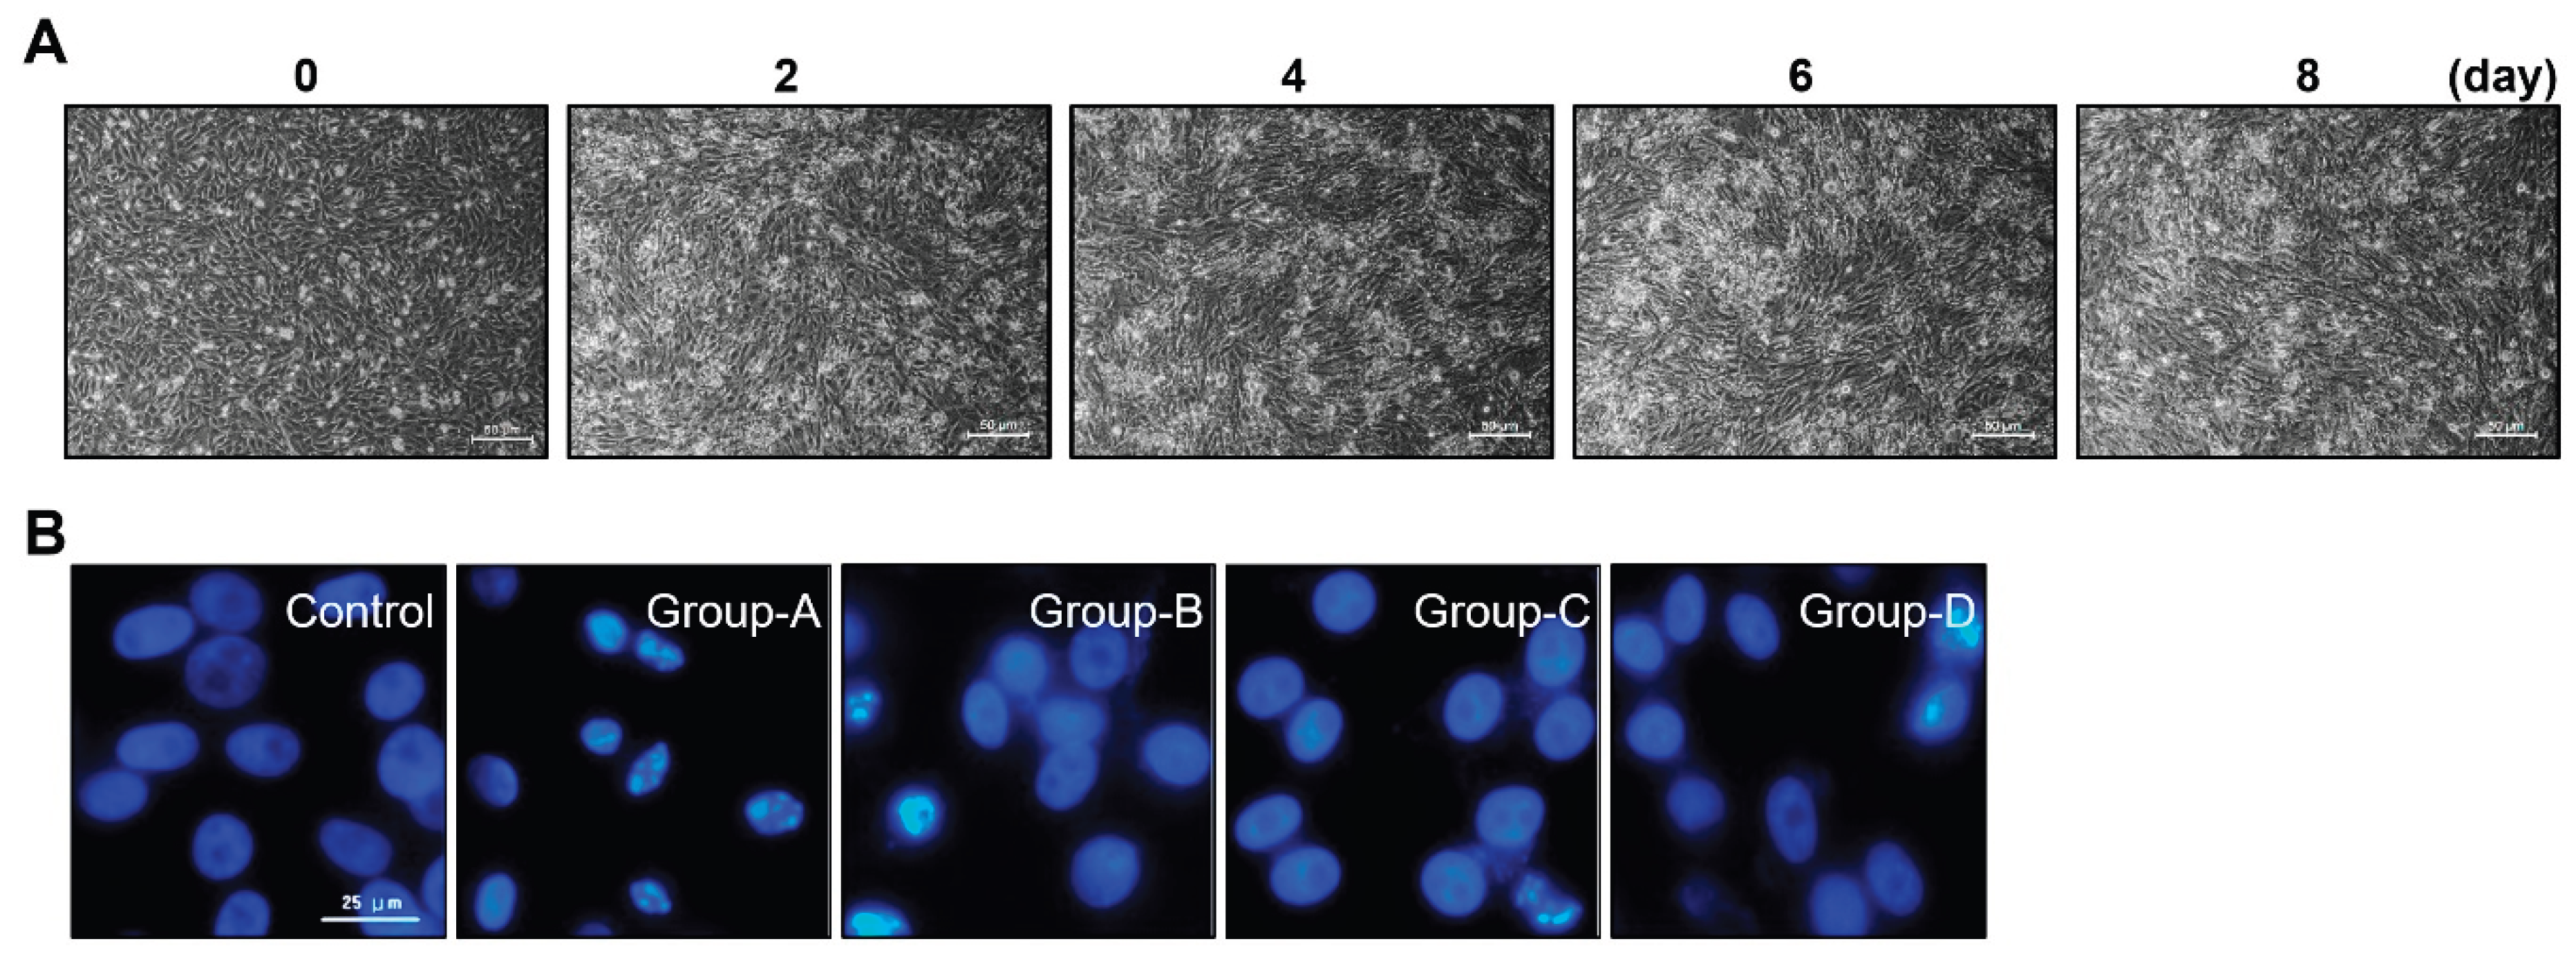
Figure 2.
The Western blotting outcomes of muscle prodution-related proteins (Myo D and myogenin) (A), muscle atrophy suppression signaling pathway-related proteins (p-Foxo1a and p-Akt) (B) and pro-inflammatory expression-related proteins(TNF-α, NFκB, HMGB1 and pp38) (C). Group 1 (control): C2C12 myoblasts with no treatment; group-A: C2C12 myoblasts with 10 µM dexamethasone; group-B: C2C12 myoblasts with 10 µM dexamethasone and microcurrent with square waveform for 1 day; group-C: C2C12 myoblasts with 10 µM dexamethasone and microcurrent with sine waveform for 1 day; and group-D: C2C12 myoblasts with 10 µM dexamethasone and microcurrent with triangle waveform for 1 day. *p indicates <0.05, ** p reflects <0.01, *** p shows <0.001, and **** p displays <0.0001 (post-hoc intergroup tests).
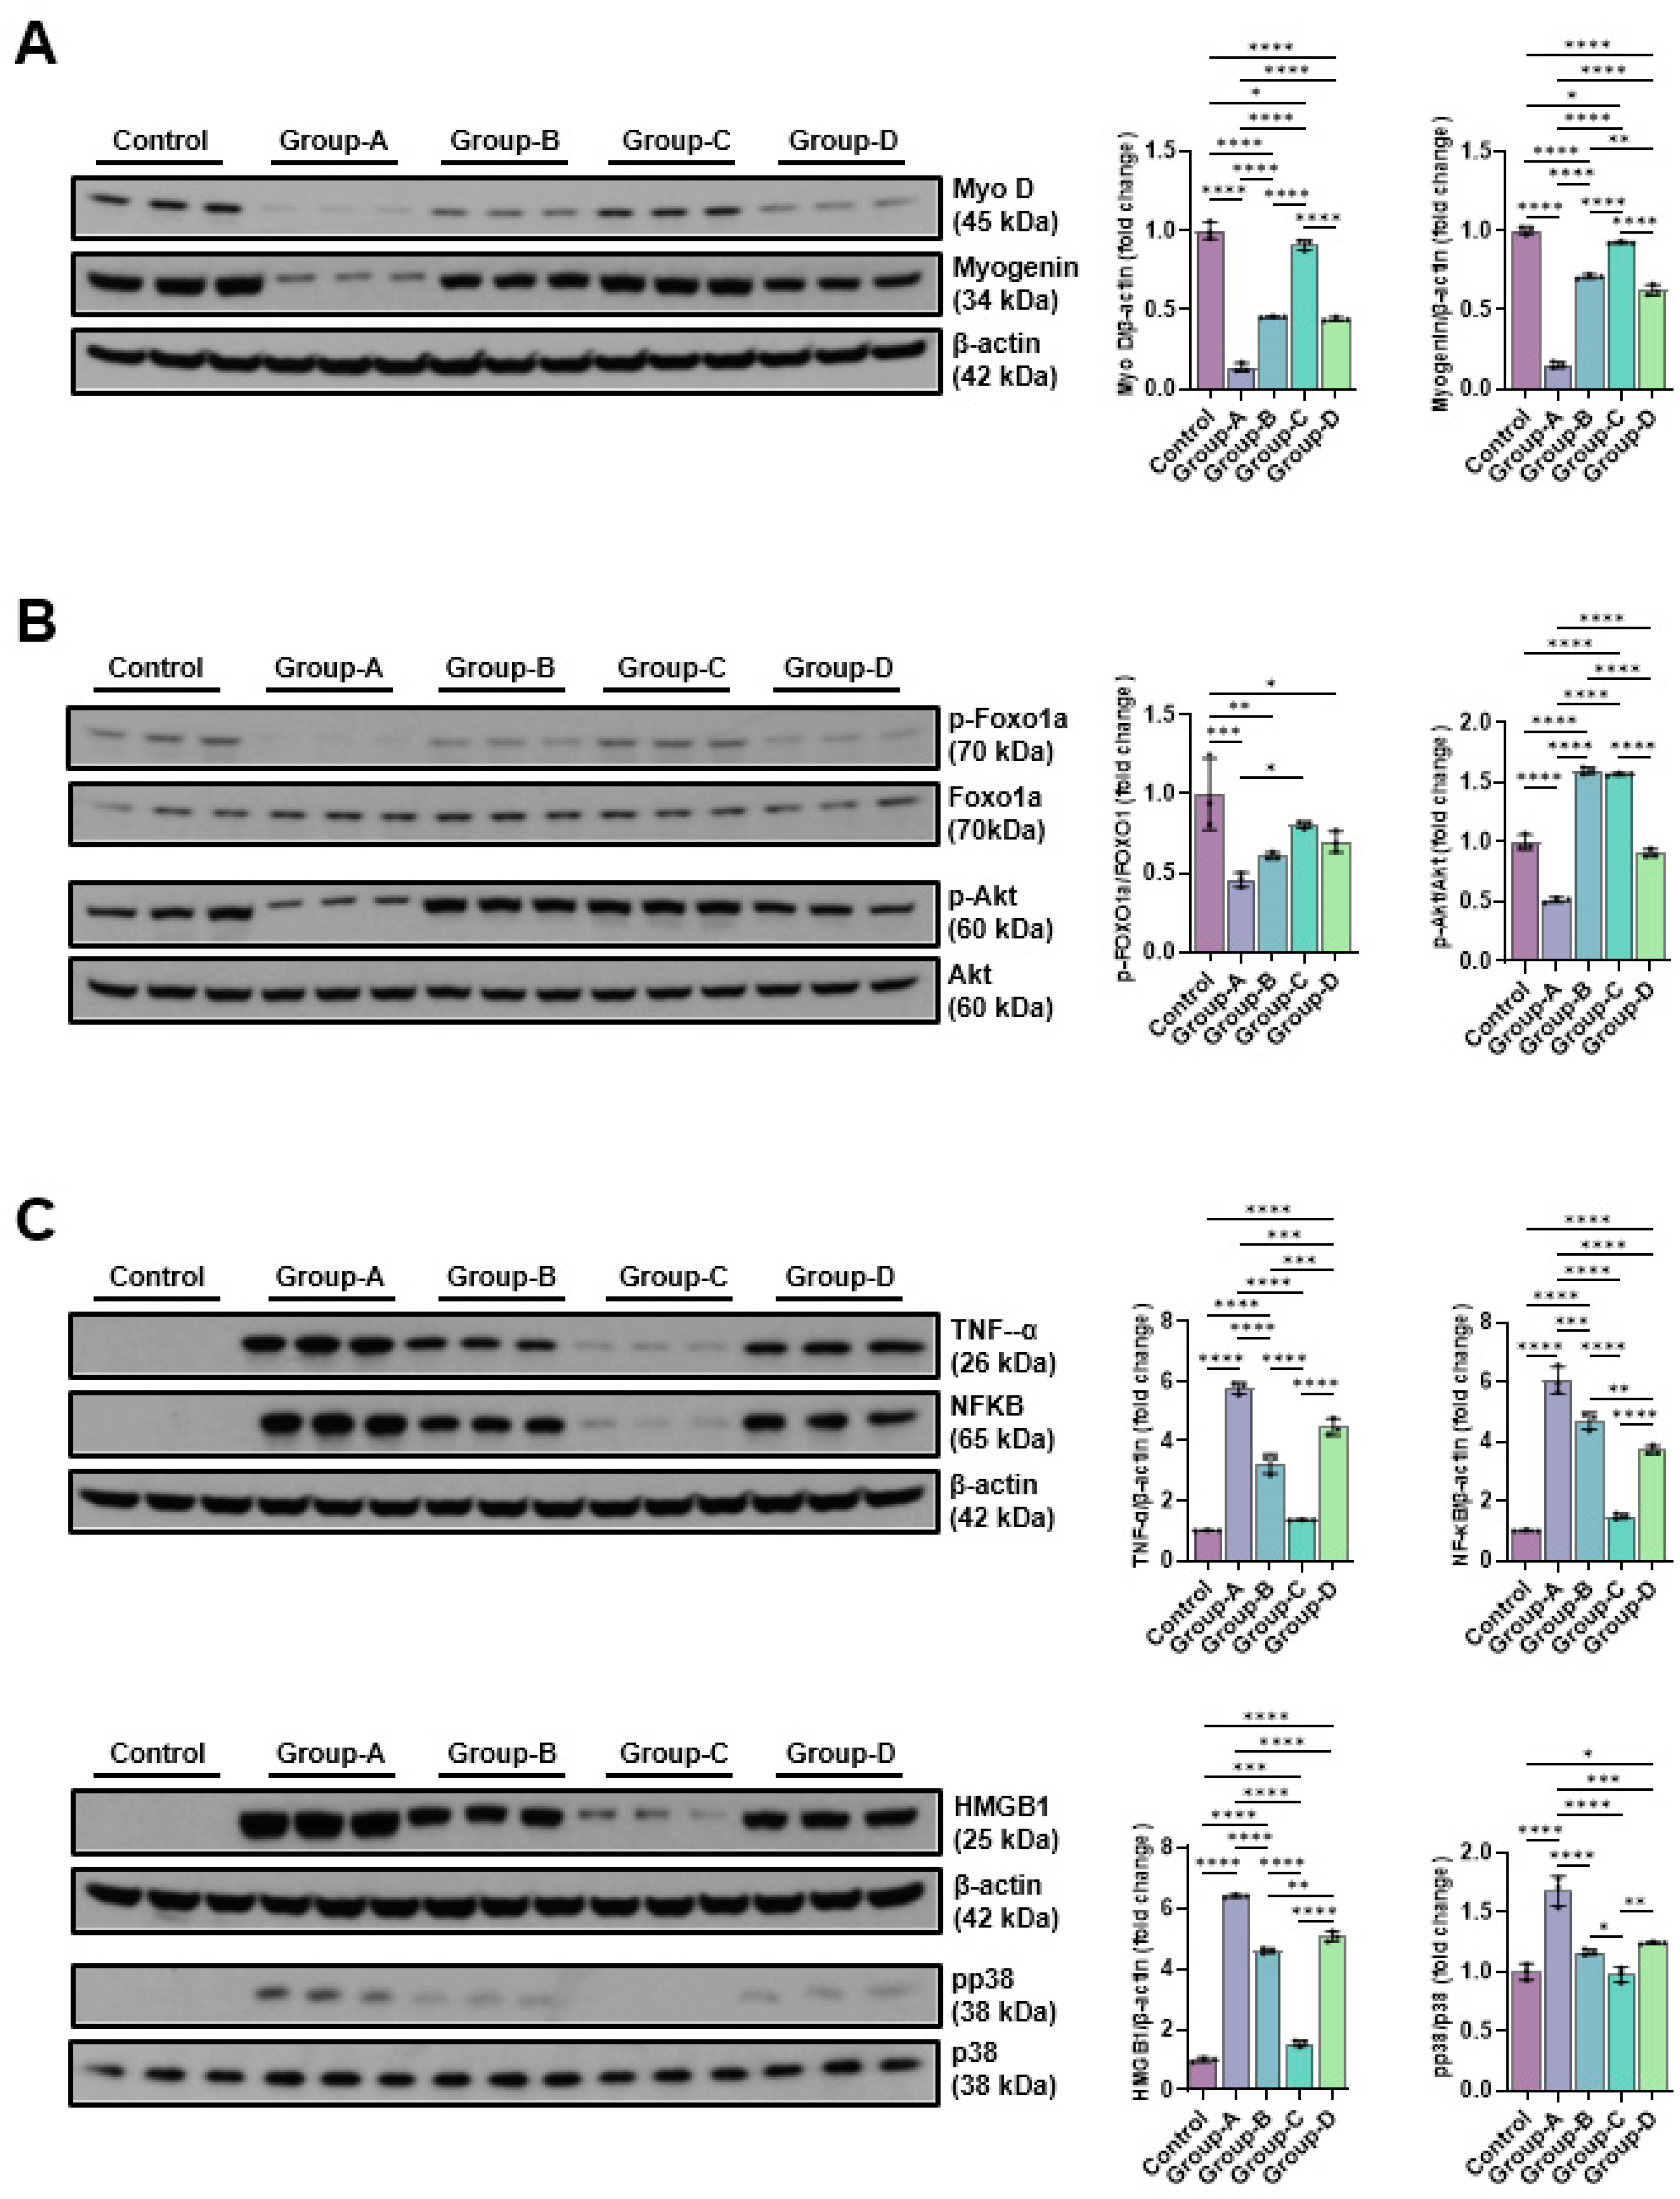
Figure 3.
The Western blot results of angiogenic factors-related proteins (VEGF, PECAM-1 and PCNA) (A), EMT expression-related proteins (E-cadherin, slug, and vimentin) (B), DNA damage-indicative proteins (p-CHK1 and p-CHK2) (C) and apoptosis-related proteins(BAX, Bcl-2, cleaved caspase-3, caspase-3, cleaved-PARP, and PARP) (D). Group 1 (control): C2C12 myoblasts with no treatment; group-A: C2C12 myoblasts with 10 µM dexamethasone; group-B: C2C12 myoblasts with 10 µM dexamethasone and microcurrent with square waveform for 1 day; group-C: C2C12 myoblasts with 10 µM dexamethasone and microcurrent with sine waveform for 1 day; and group-D: C2C12 myoblasts with 10 µM dexamethasone and microcurrent with triangle waveform for 1 day. *p indicates <0.05, ** p reflects <0.01, *** p shows <0.001, and **** p displays <0.0001 (post-hoc intergroup tests).
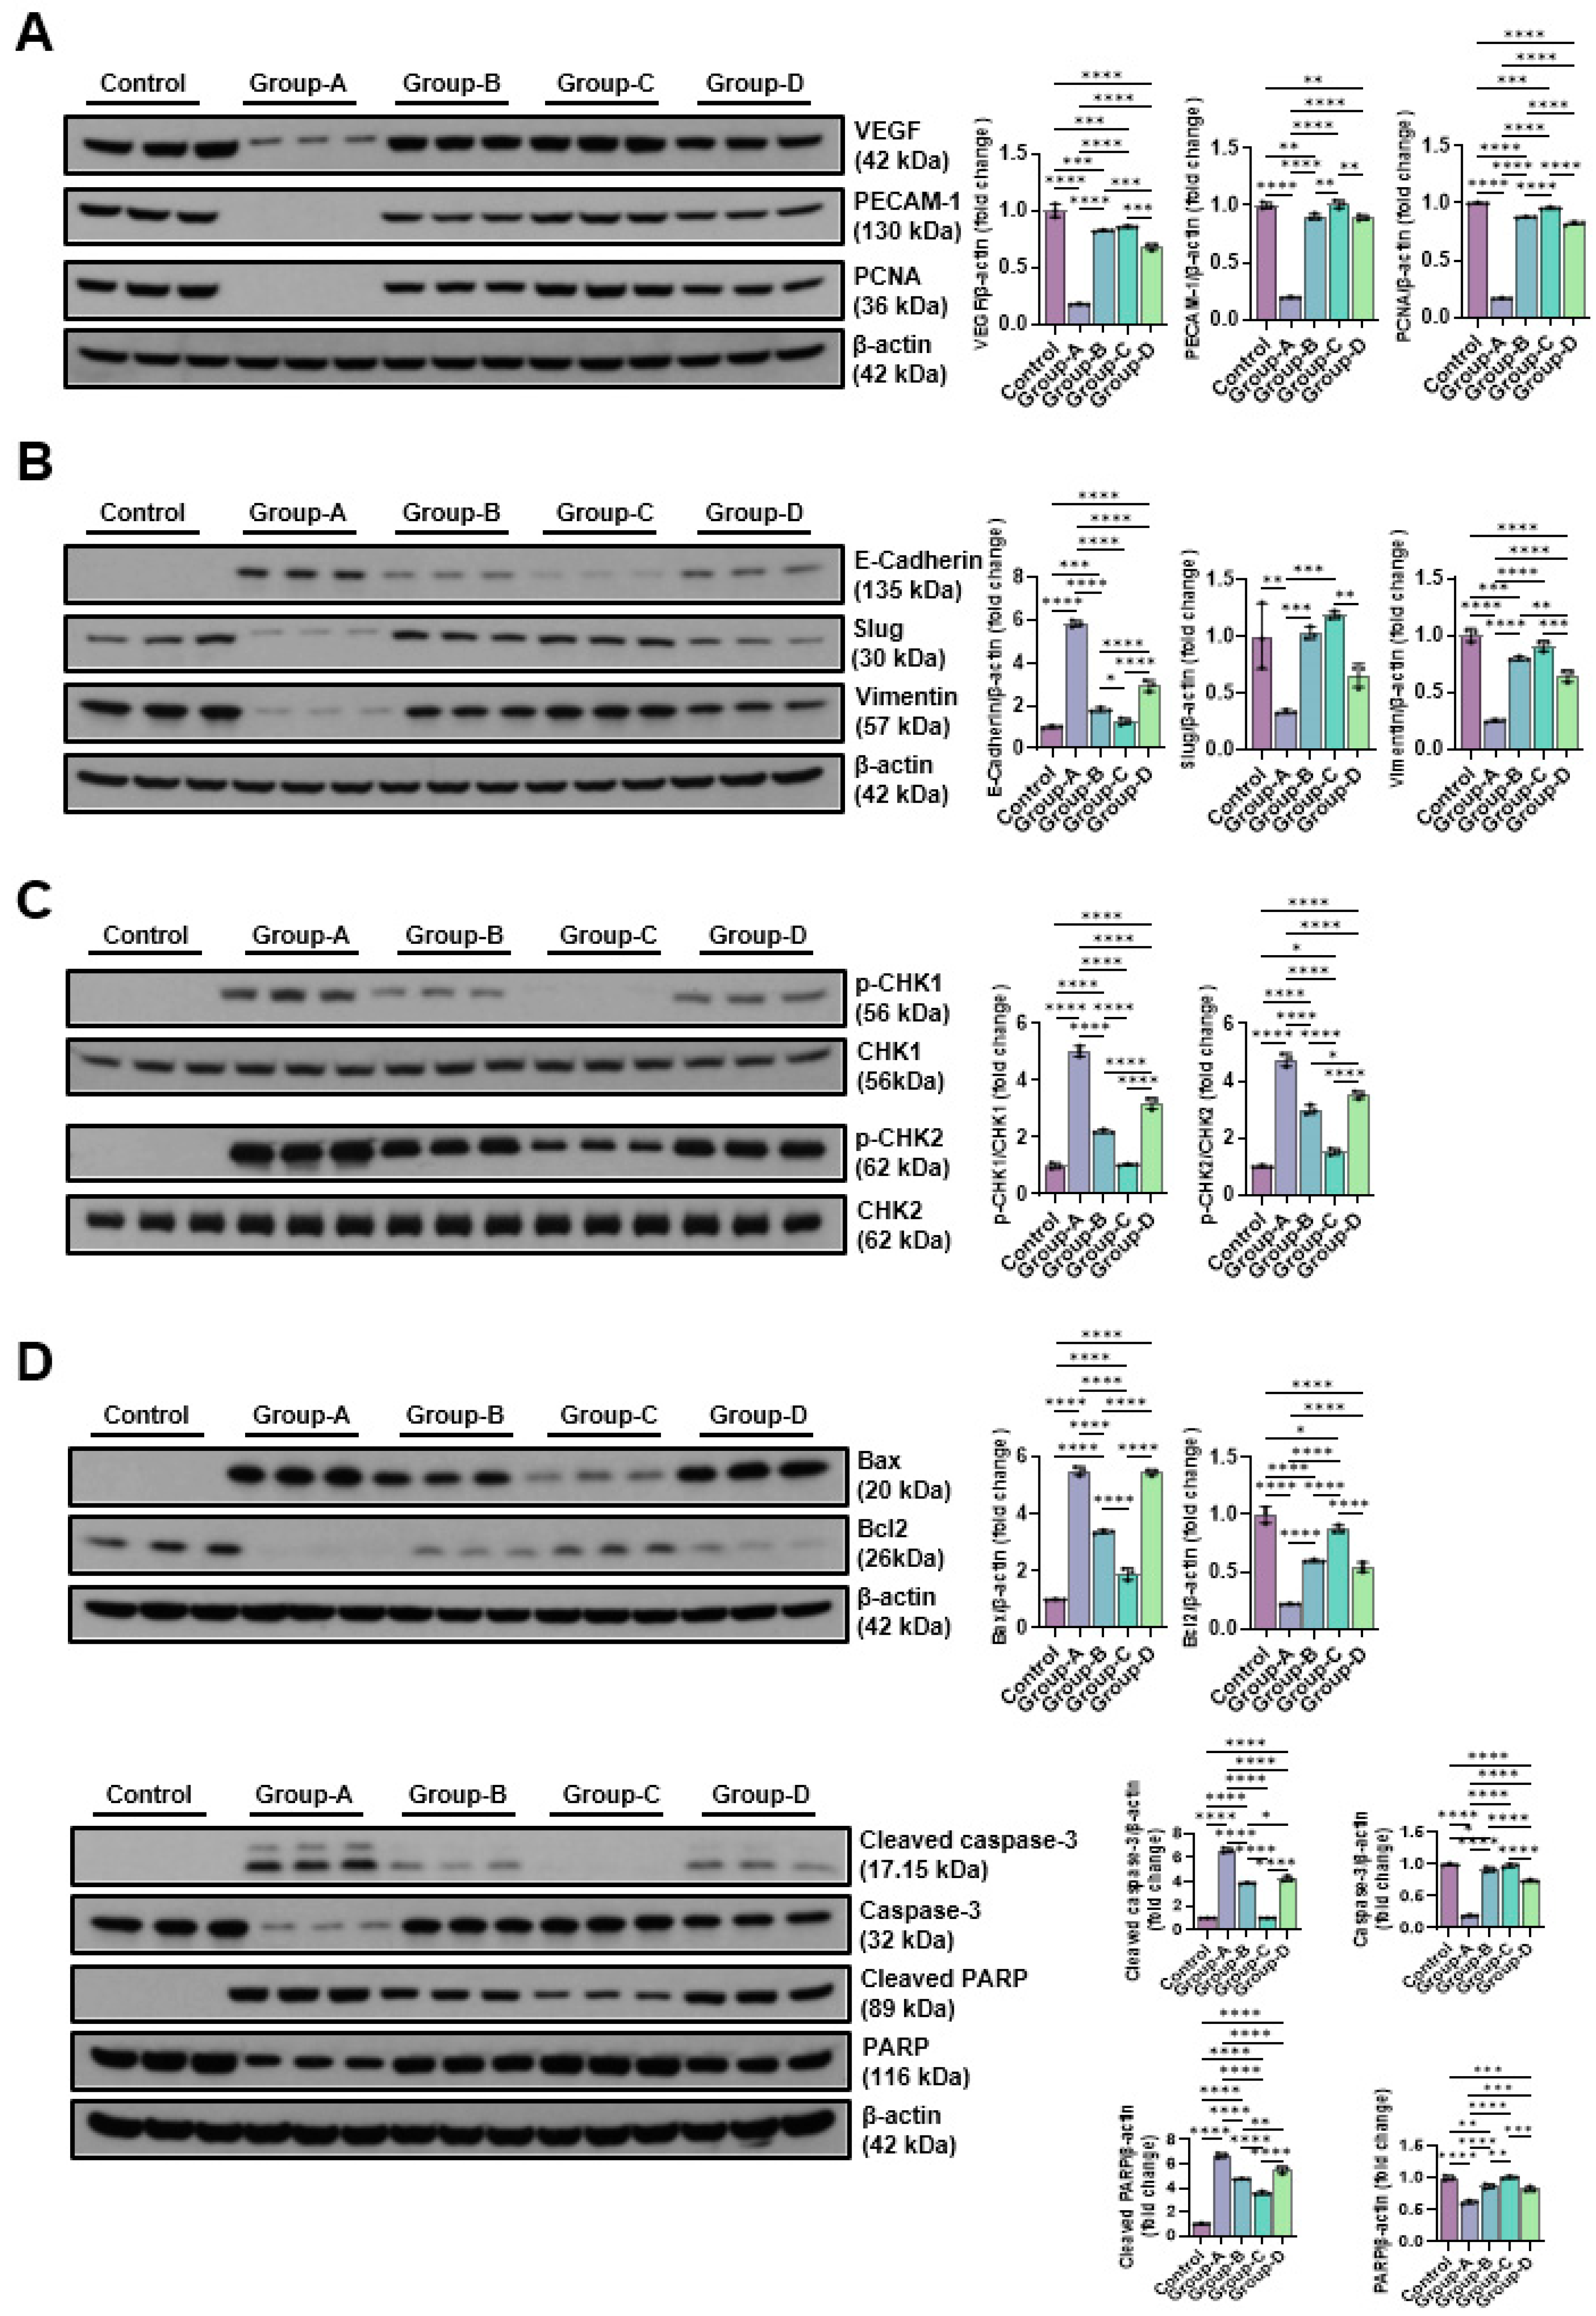
Figure 4.
Immunohistochemical analysis of GCM (gastrocnemius muscle) fibers was conducted among the four groups, focusing on immobilized GCM muscles stained with monoclonal anti-myosin type II antibodies. The cross-sectional areas of type I and type II gastrocnemius muscle fibers, highlighted by red circles, were measured using an image morphometry program.
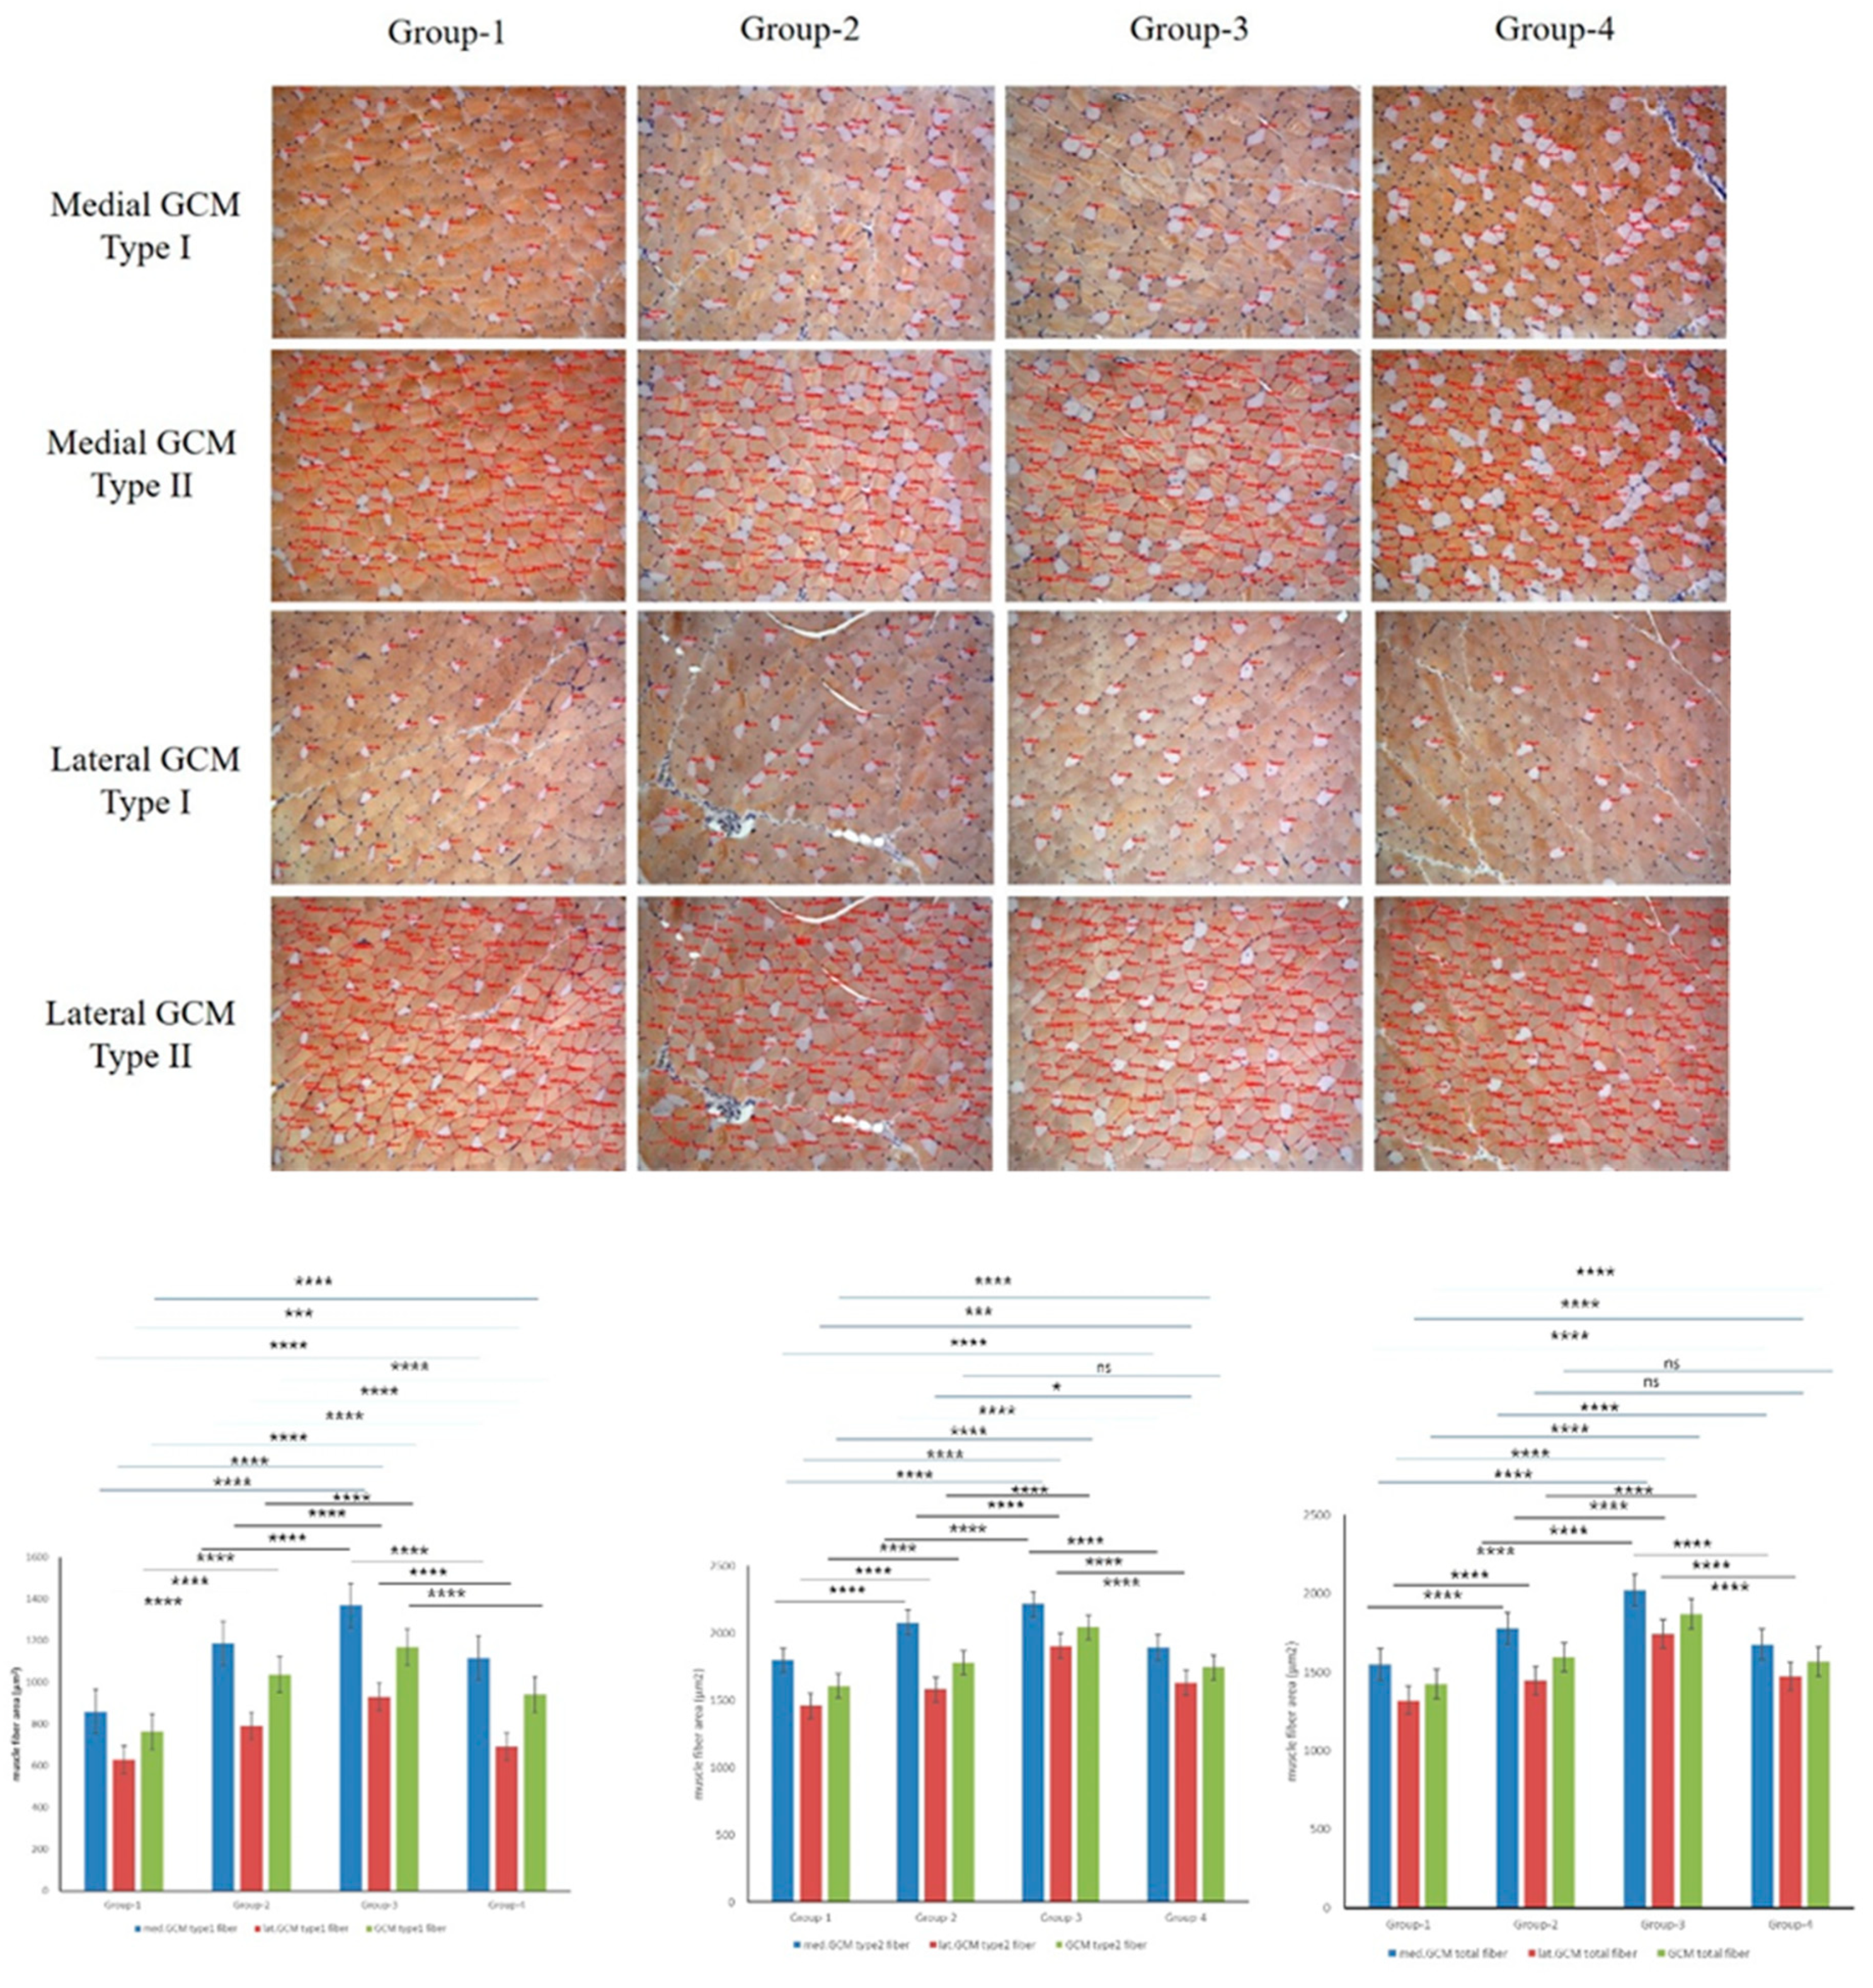
Figure 5.
Immunohistochemical analysis of GCM (gastrocnemius muscle) fibers was conducted across the four groups, focusing specifically on immobilized GCM muscles stained with anti-BrdU and anti-PCNA antibodies. Cells or nuclei positive for BrdU and PCNA were counted along with the total number of muscle fibers within each image.
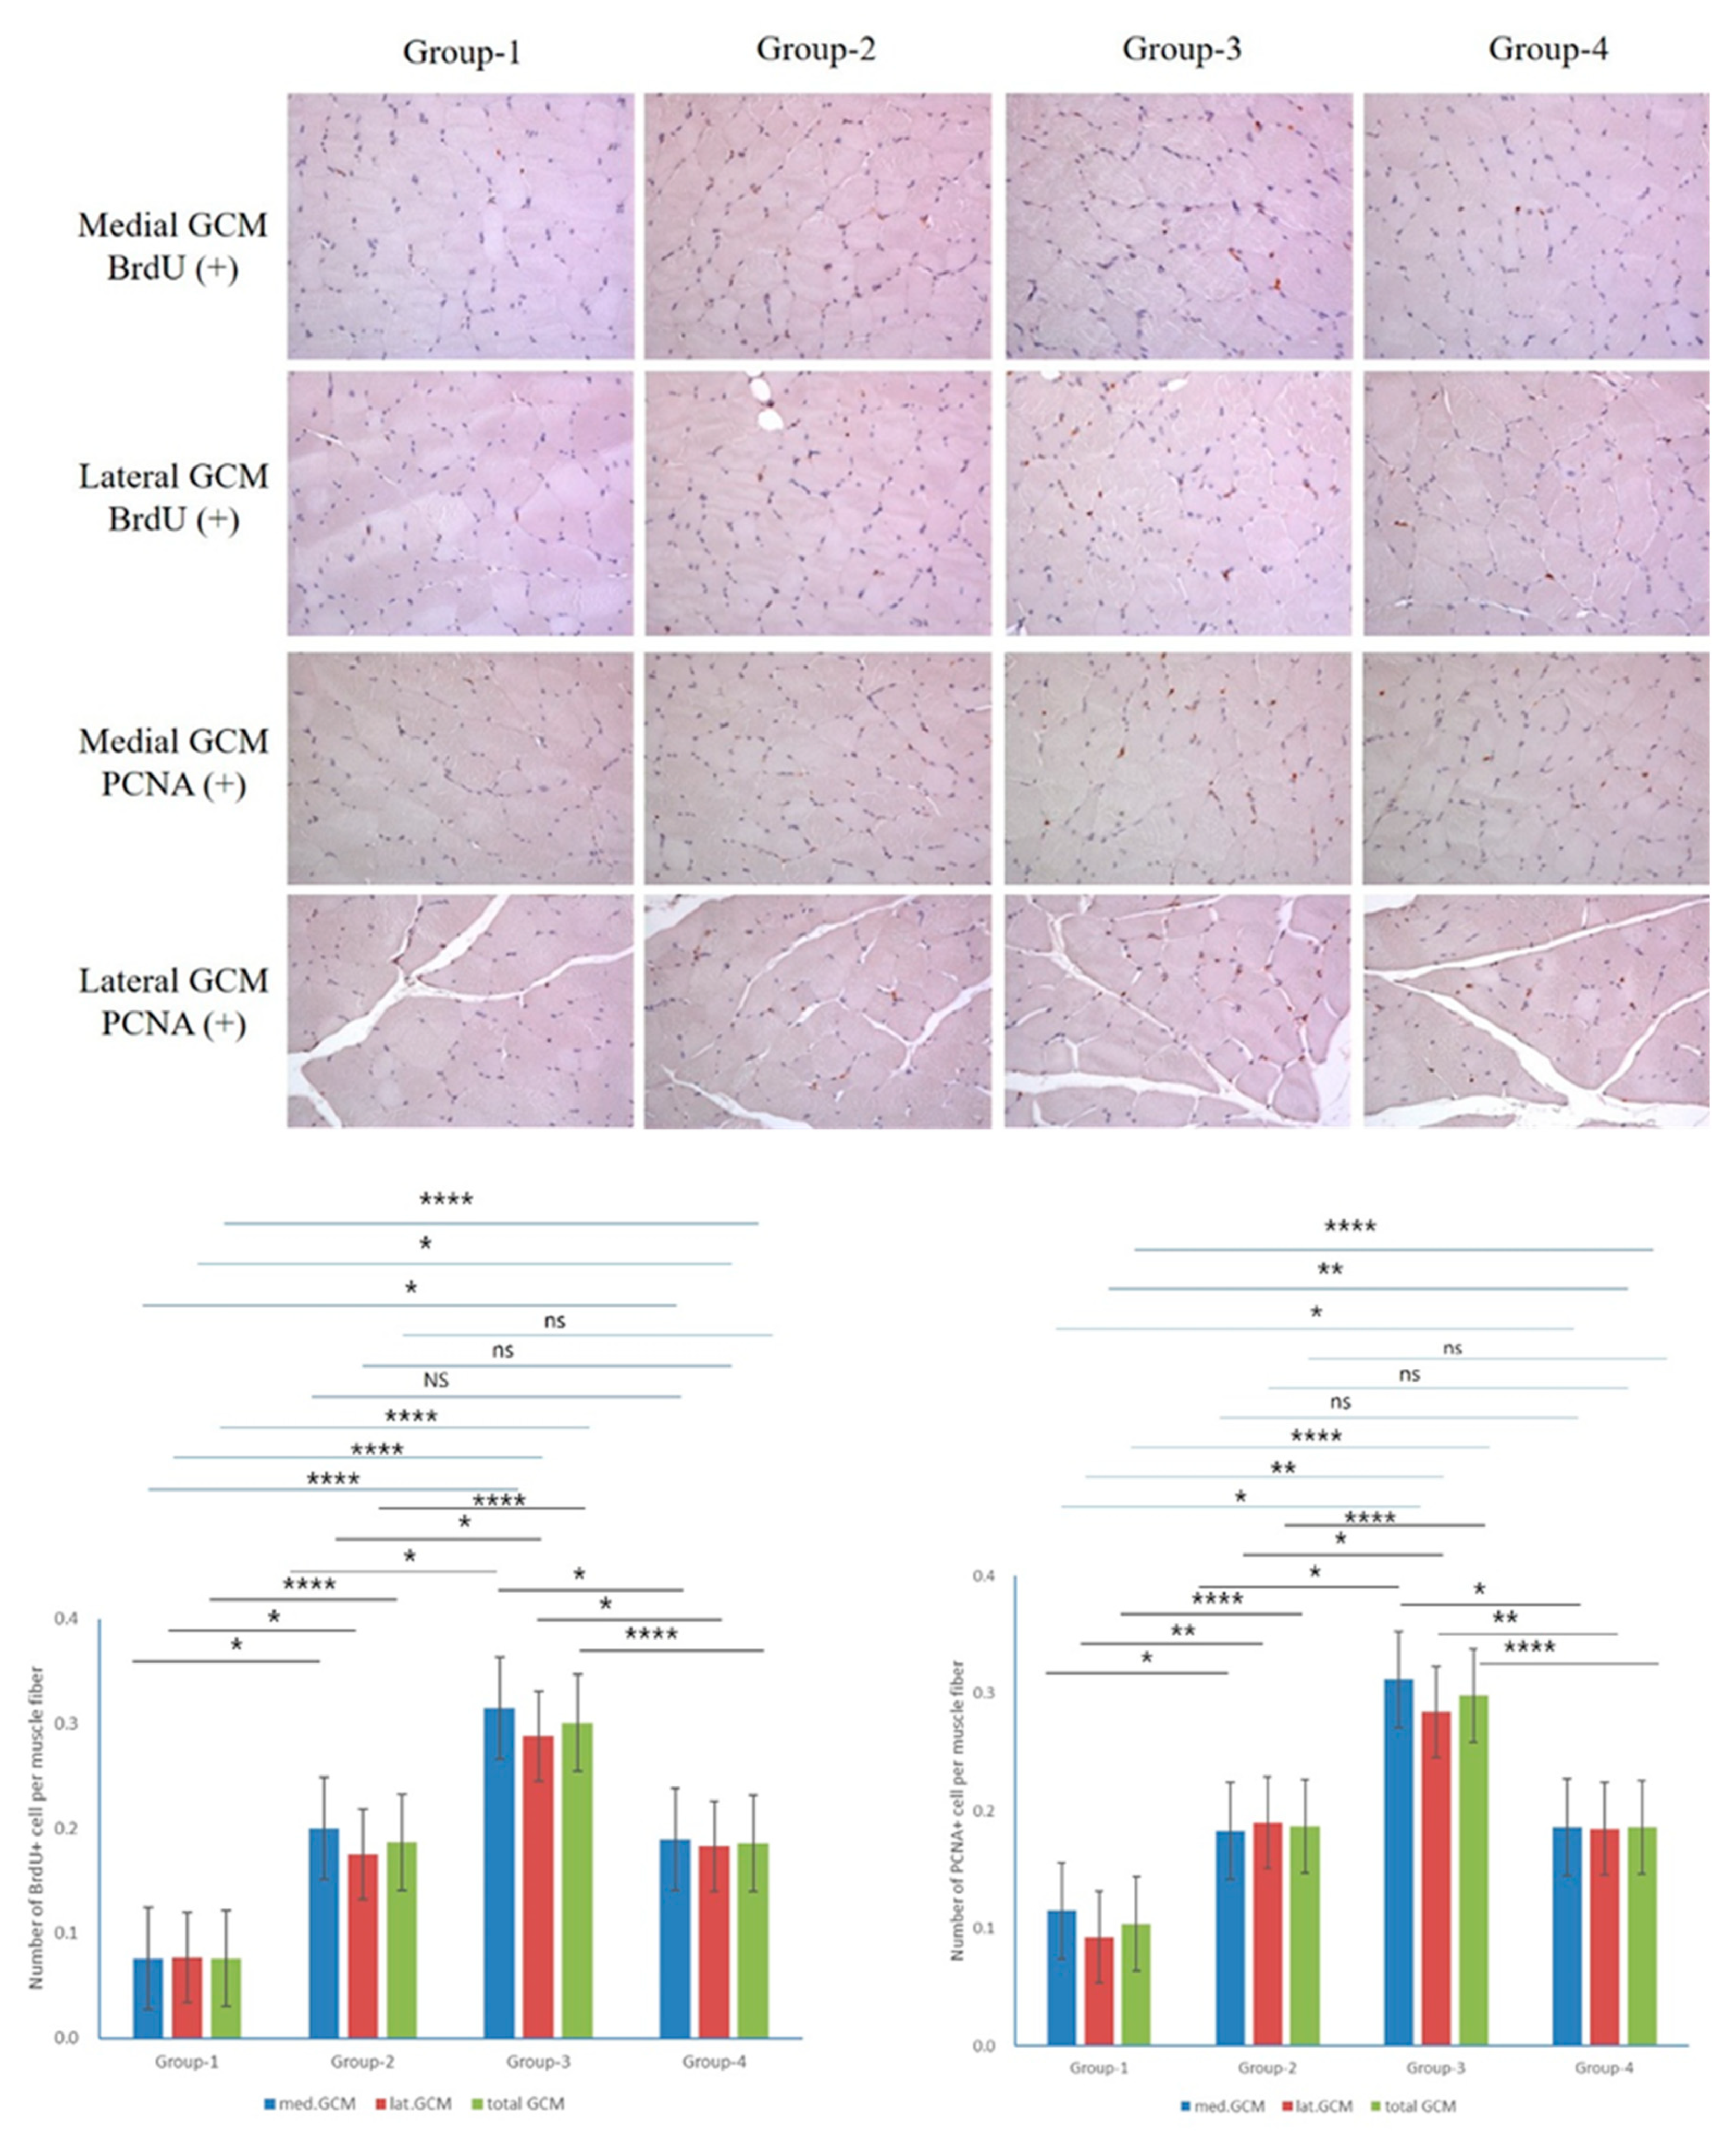
Figure 6.
Immunohistochemical analysis of GCM (gastrocnemius muscle) fibers across the four groups involved examining immobilized GCM muscles stained with anti-VEGF and anti-PECAM-1 antibodies. The number of cells or nuclei that were positive for VEGF and PECAM-1 was counted, along with the total number of muscle fibers present in each image.
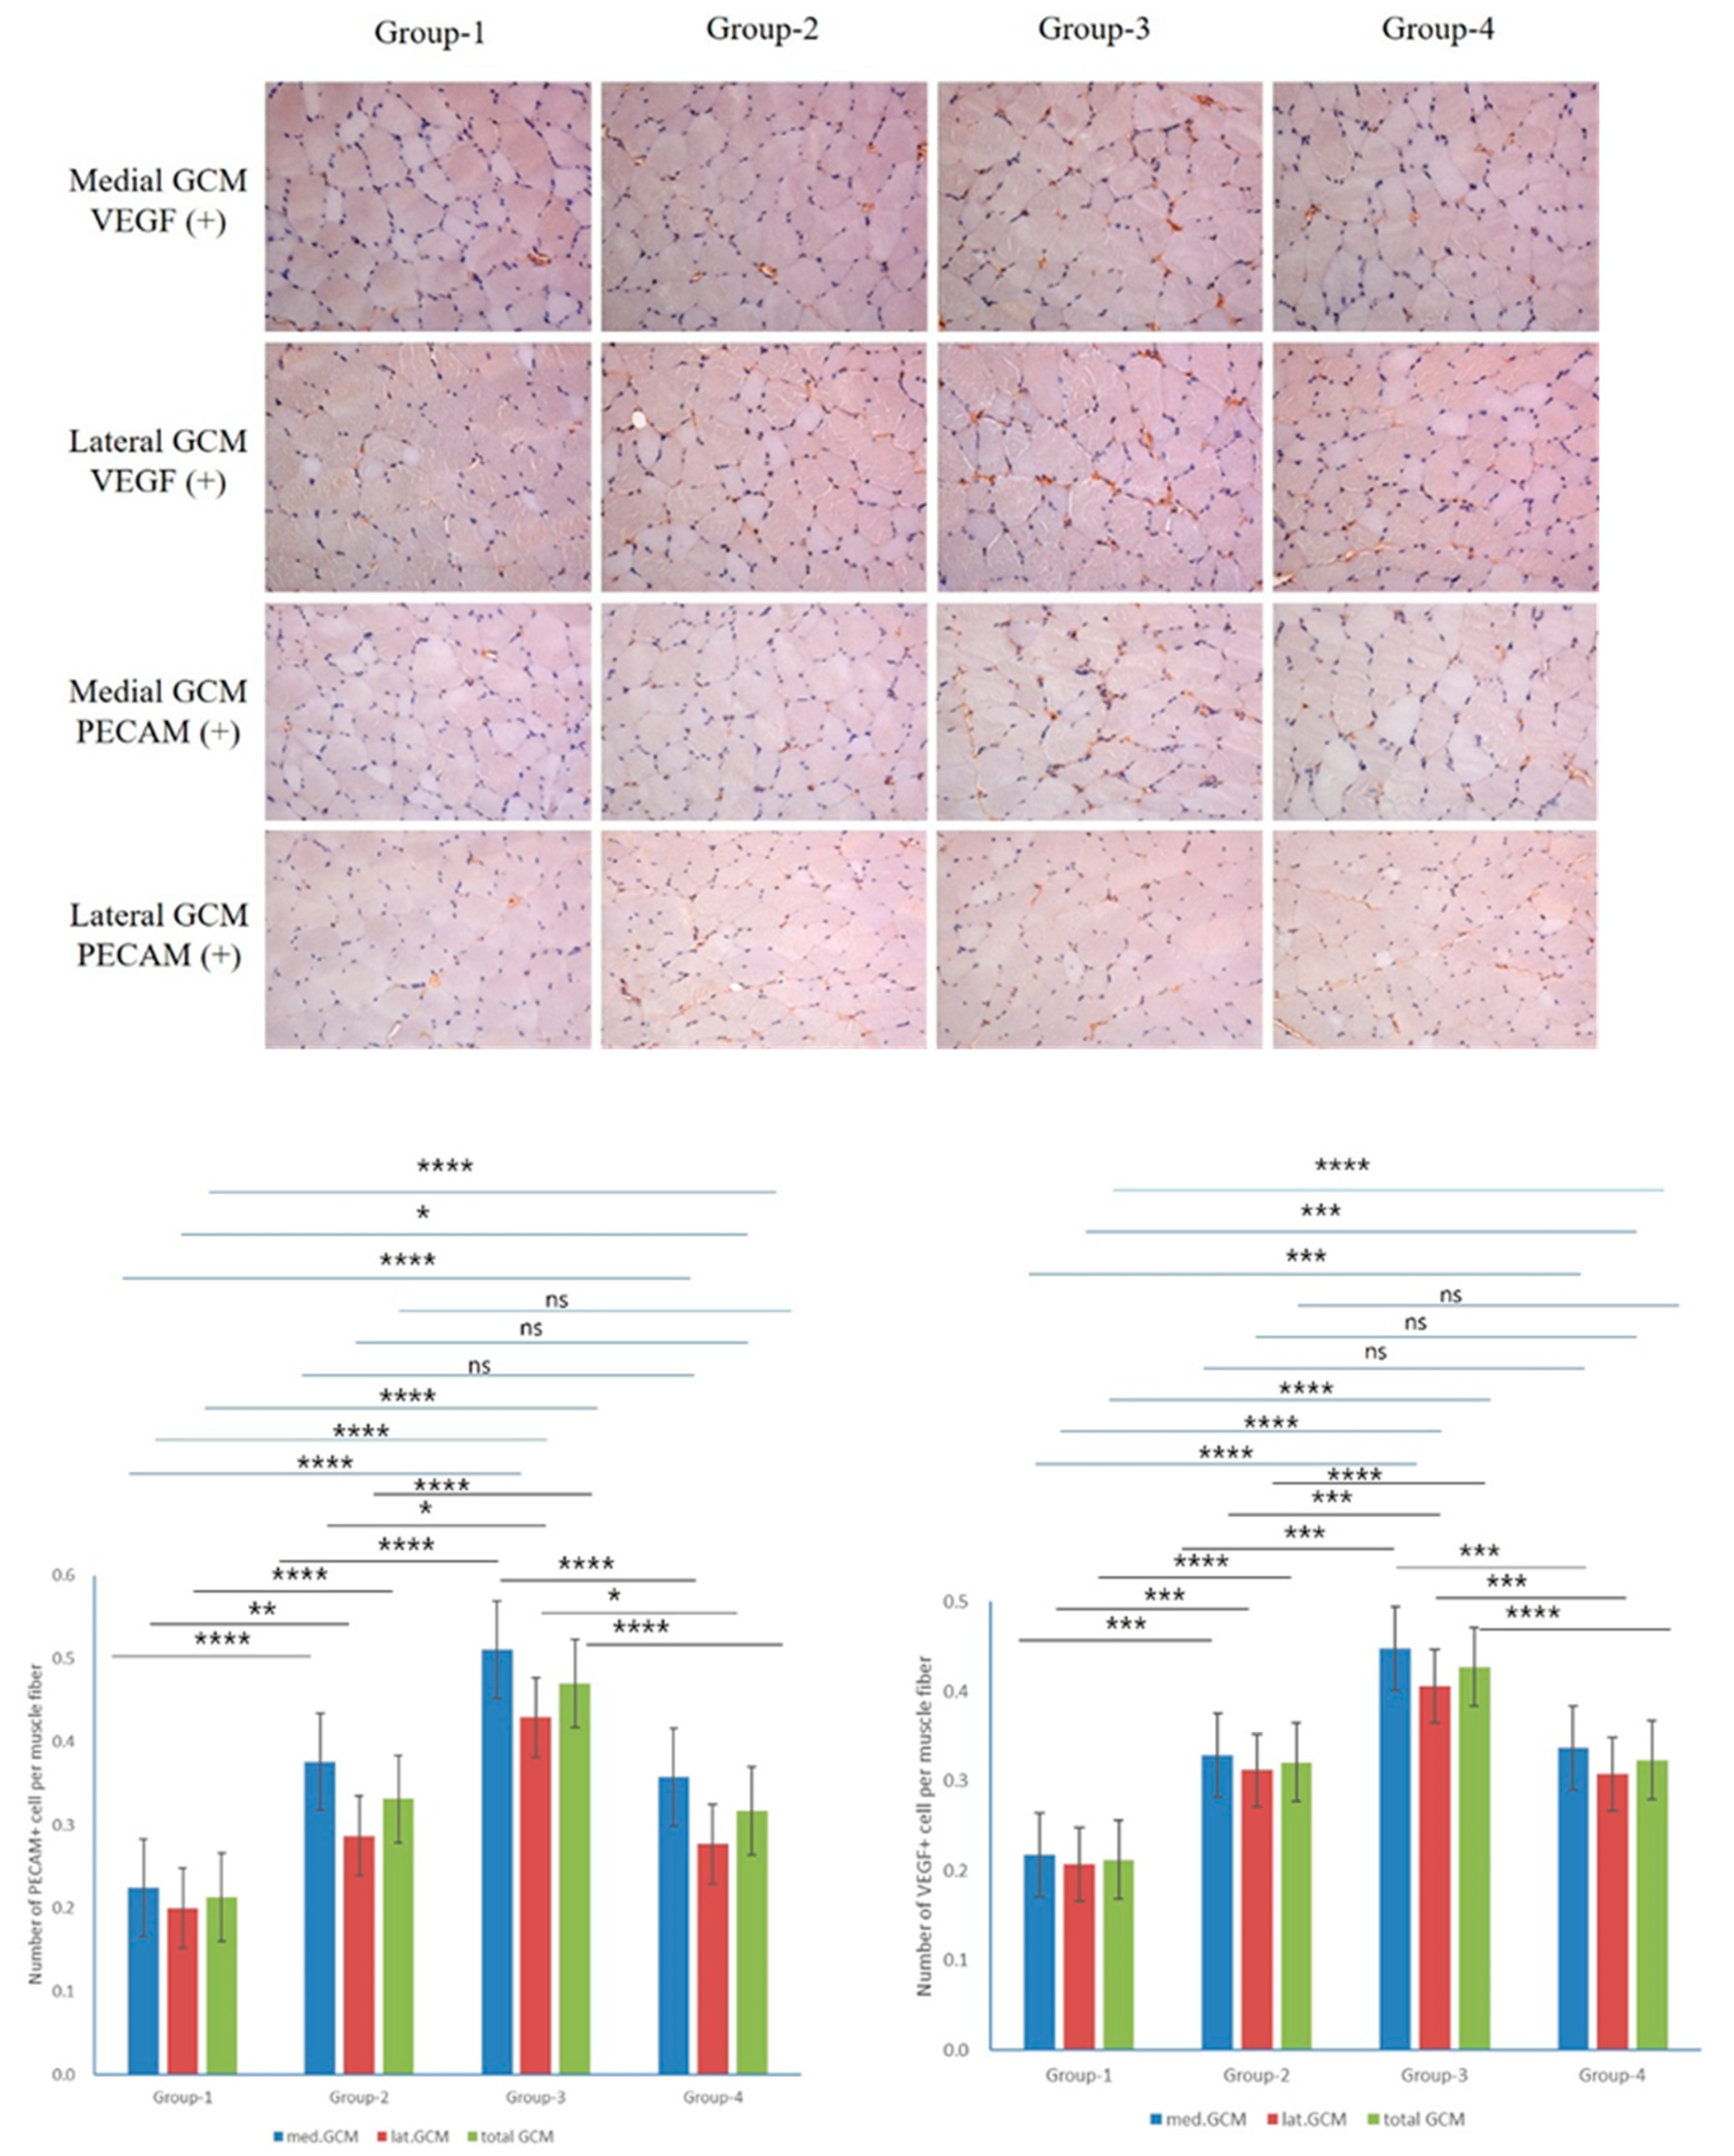
Figure 7.
The Western blot results of muscle production-linked proteins(Myo D and myogenin), muscle atrophy suppression signaling pathway-related proteins (p-Foxo1a and p-Akt), and pro-inflammatory expression-indicative proteins (TNF-α, NFκB, HMGB1, and pp38). Group 1 (control): IC and sham MC after CR for 2 weeks; group 2: IC and MC after CR with square waveform for 2 weeks; group 3: IC and MC after CR with sine waveform for 2 weeks; group 4: IC and MC after CR with triangle waveform for 2 weeks. β-actin, and p38 were applied as a loading control. *p demonstrates <0.05, ** p shows <0.01, *** p stands for <0.001, and **** p reflects <0.0001 (intergroup post-hoc tests).
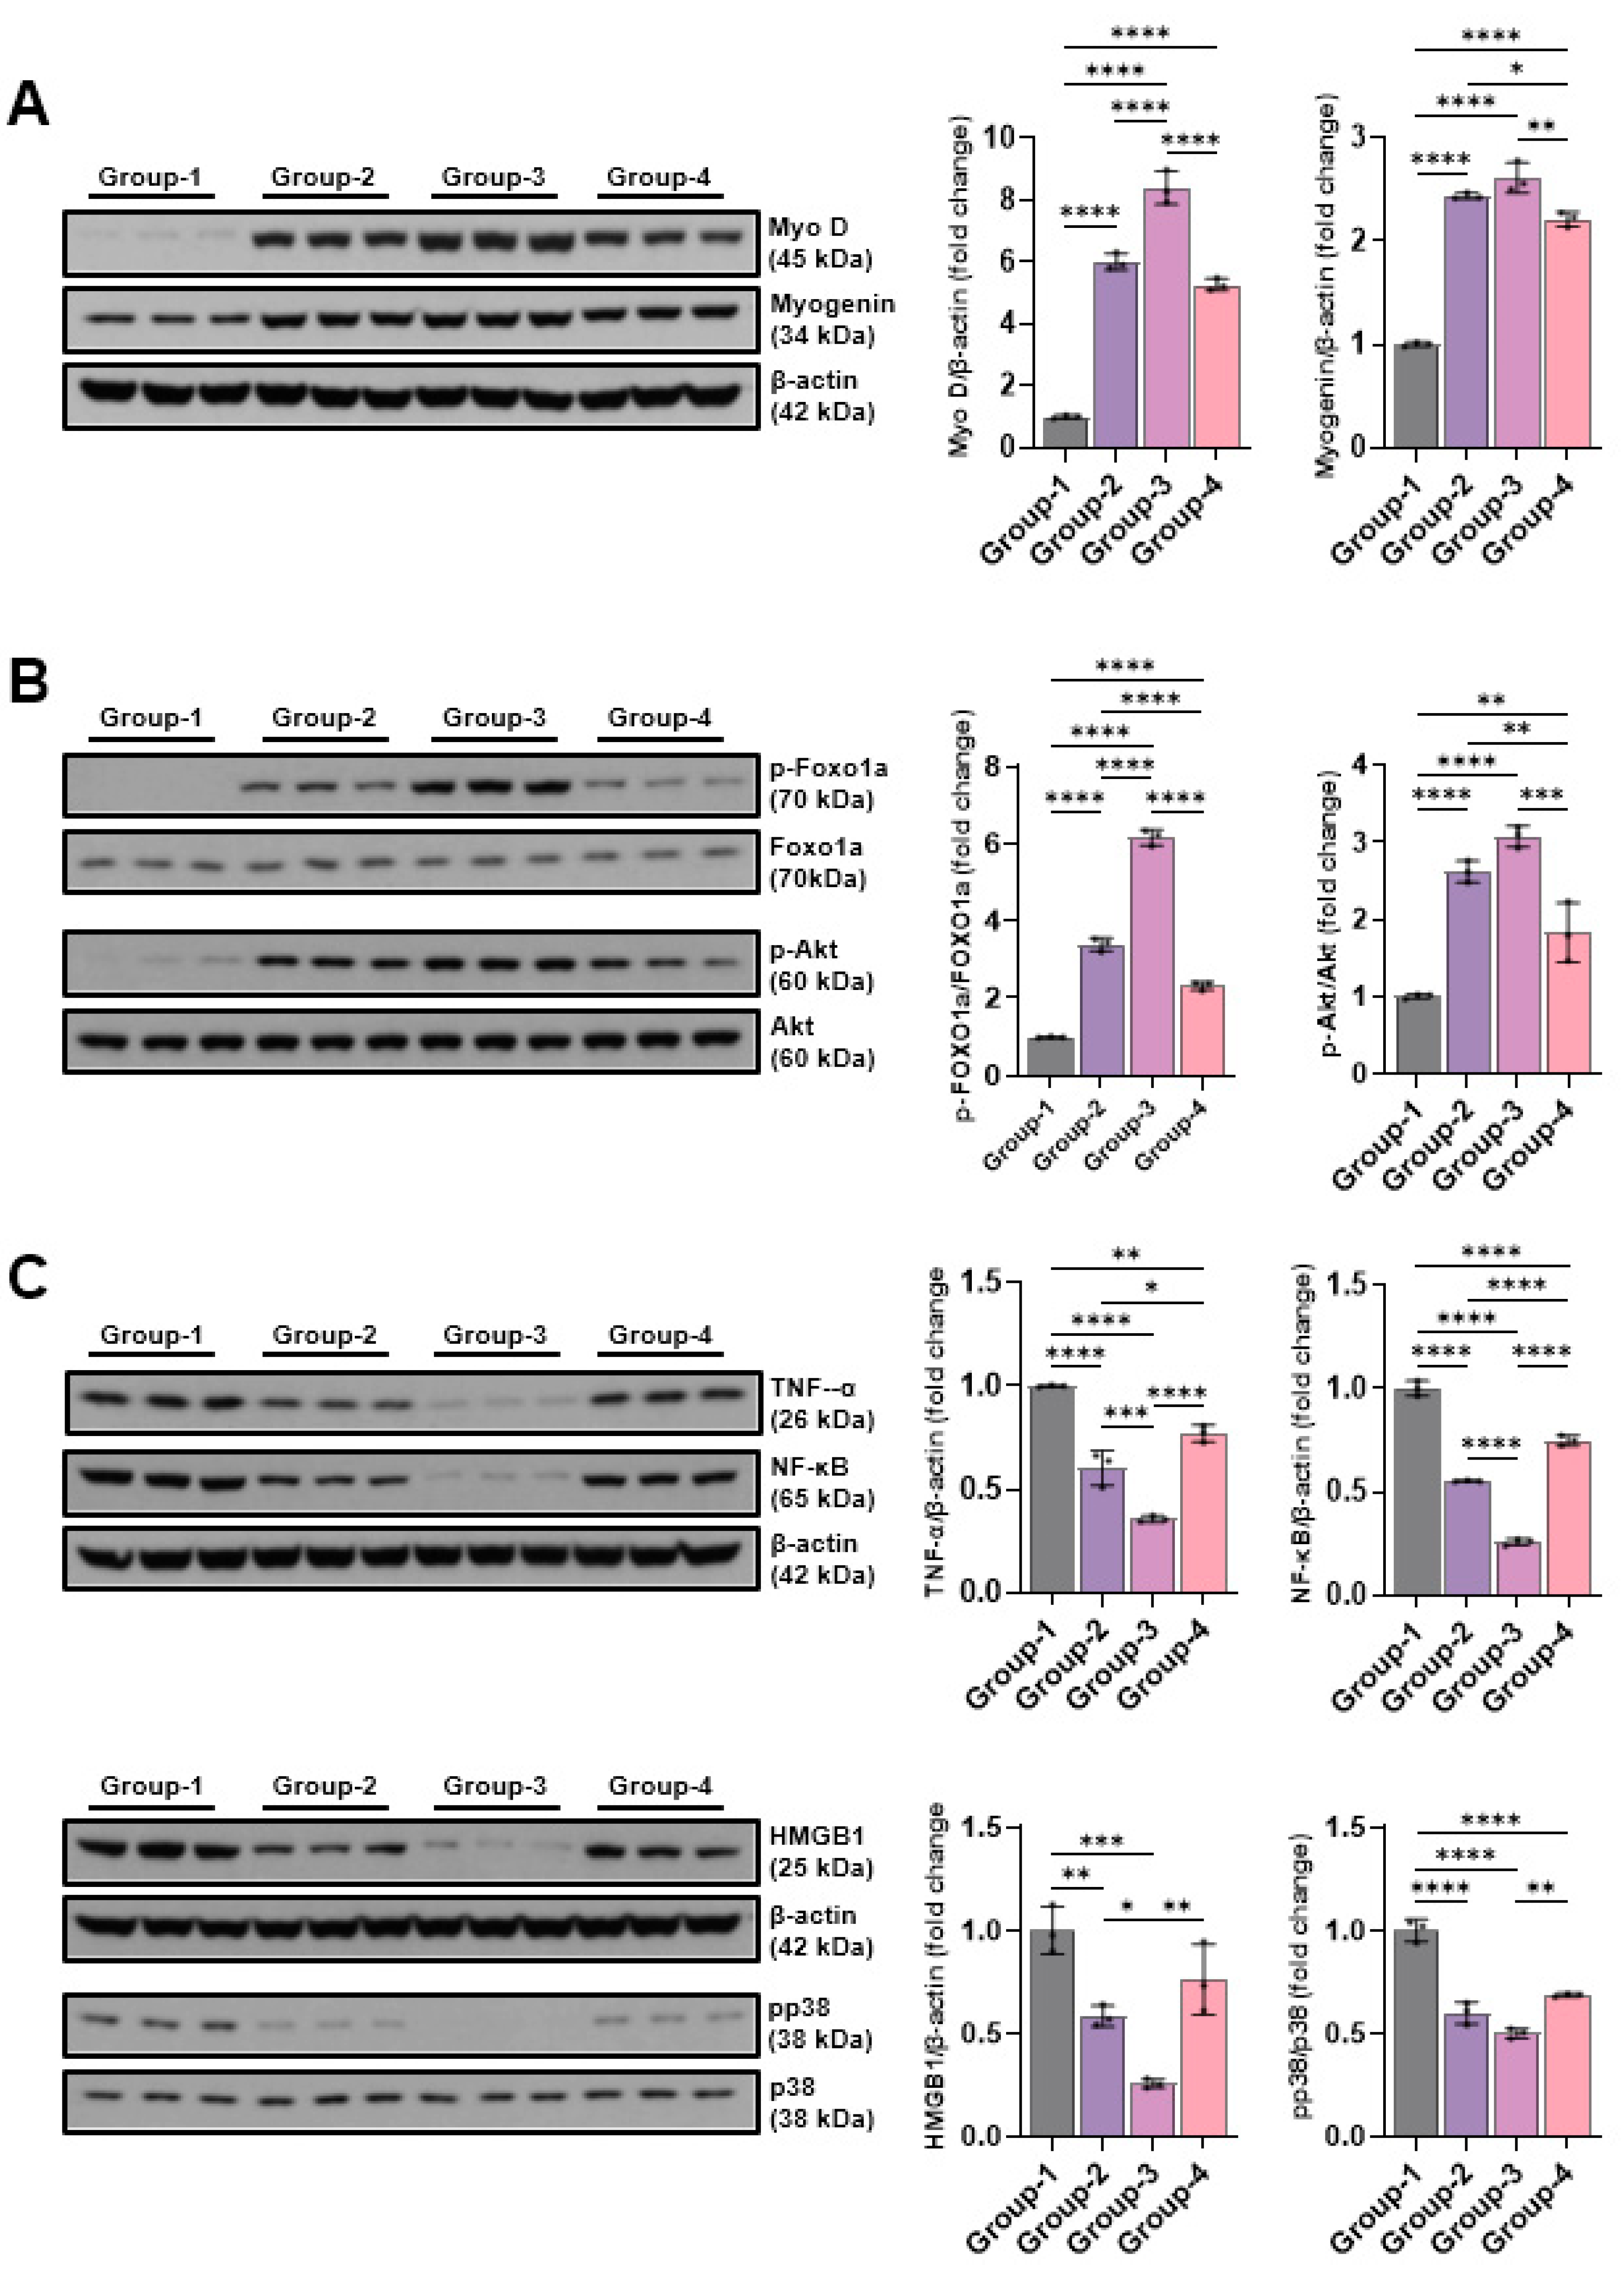
Figure 8.
The Western blotting outcomes of angiogenic factors-related proteins(VEGF, PECAM-1, and PCNA), EMT expression-indicative proteins (E-cadherin, slug, and vimentin), DNA damage-indicative proteins (p-CHK1 and p-CHK2), and apoptosis-indicative proteins (BAX, Bcl-2, cleaved caspase-3, caspase-3, cleaved-PARP, and PARP). Group-1 (control): IC and sham microcurrent (MC) after cast removal (CR) for 2 weeks; group-2: IC and MC with square waveform after CR for 2 weeks; group-3: IC and MC with sine waveform after CR for 2 weeks; group-4: IC and MC with triangle waveform after CR for 2 weeks. β-actin was applied as a loading control. *p shows <0.05, ** p indicates <0.01, *** p reflects <0.001, and **** p stands for <0.0001 (post-hoc tests between groups).
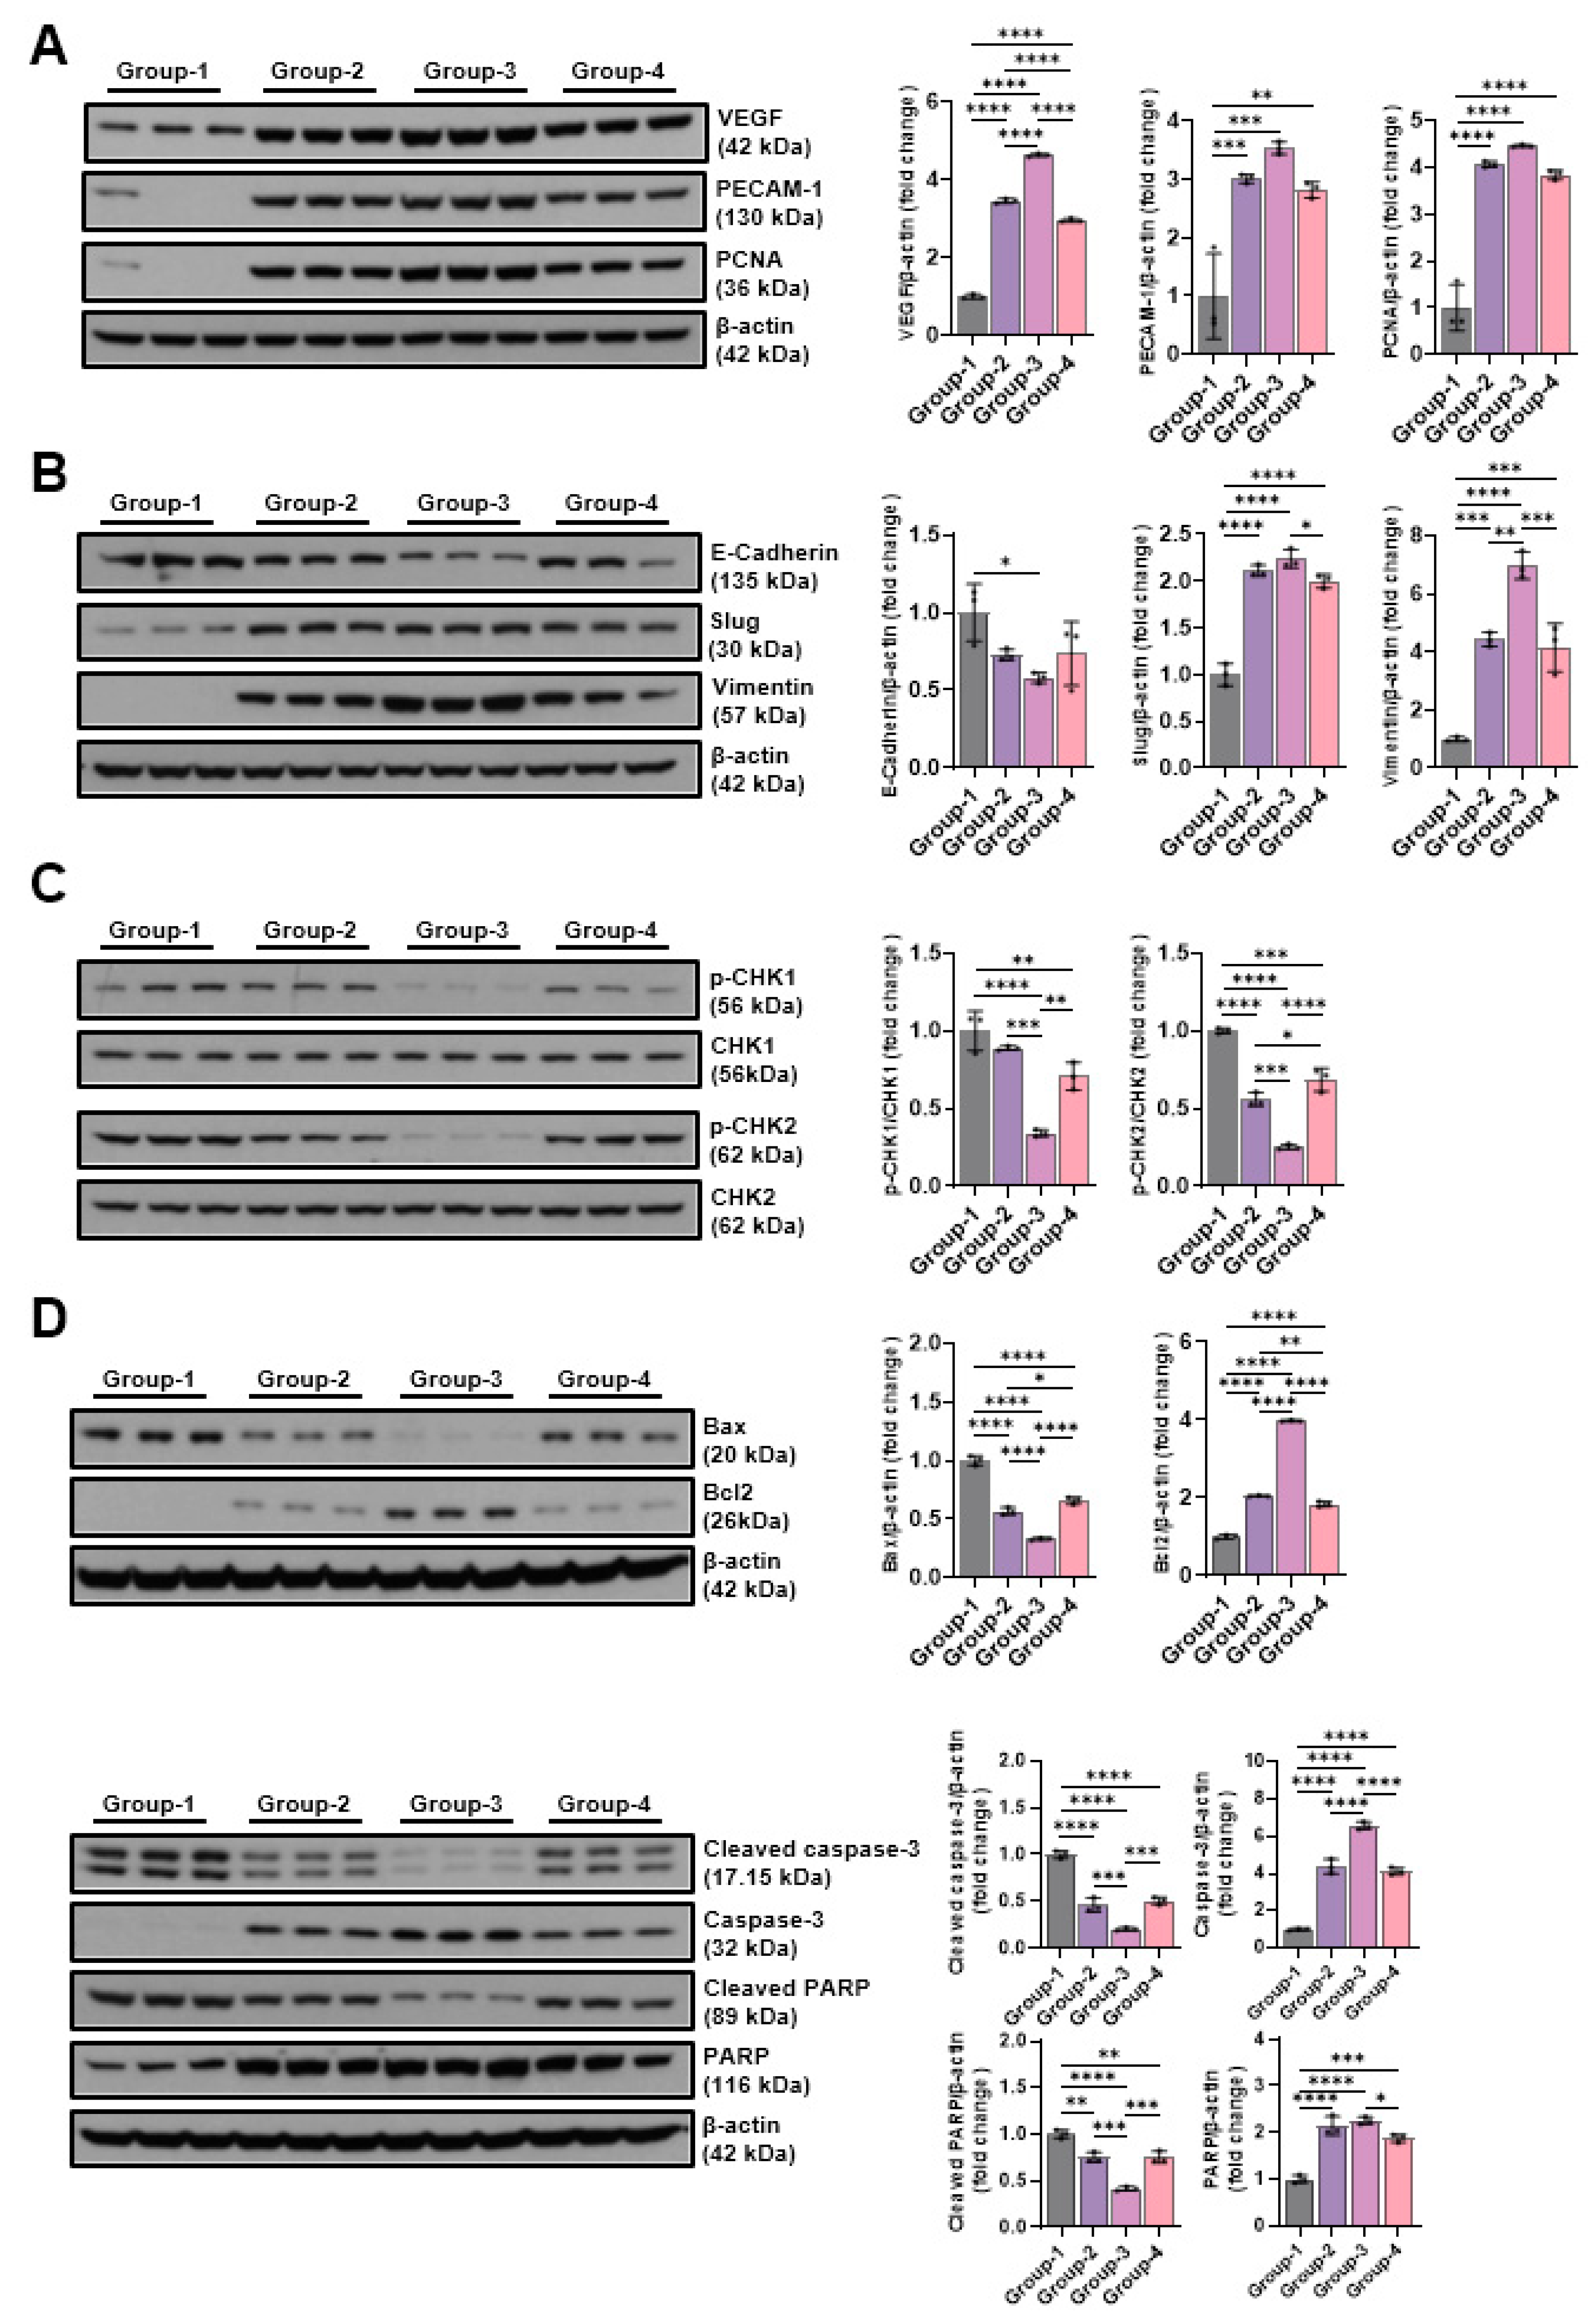
Figure 9.
Schematic diagram of C2C12 cell culture.
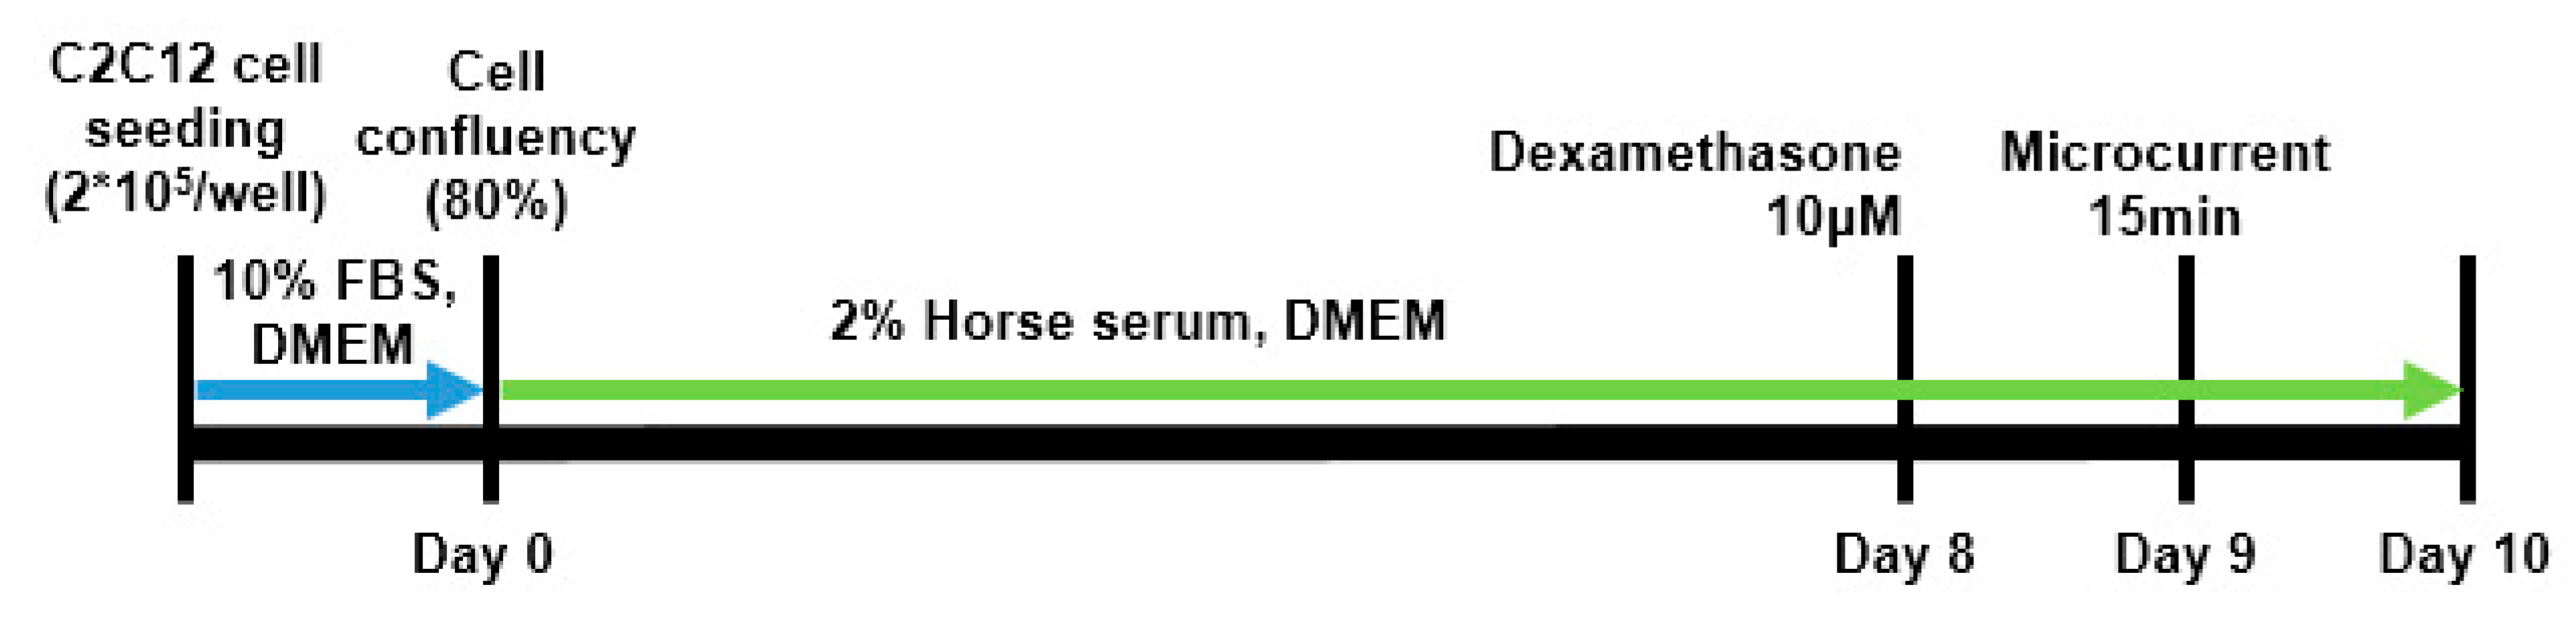
Figure 10.
d calf muscle in cast-immobilized rabbit model (B). The amplitude of the CMAP in a tibial nerve, a motor nerve conduction study was carried out (C). The thickness of the GCM (gastrocnemius muscle) was measured using ultrasound, defined as the distance between the superficial and deep aponeuroses of the GCM muscle, indicated by up–down arrows (D).
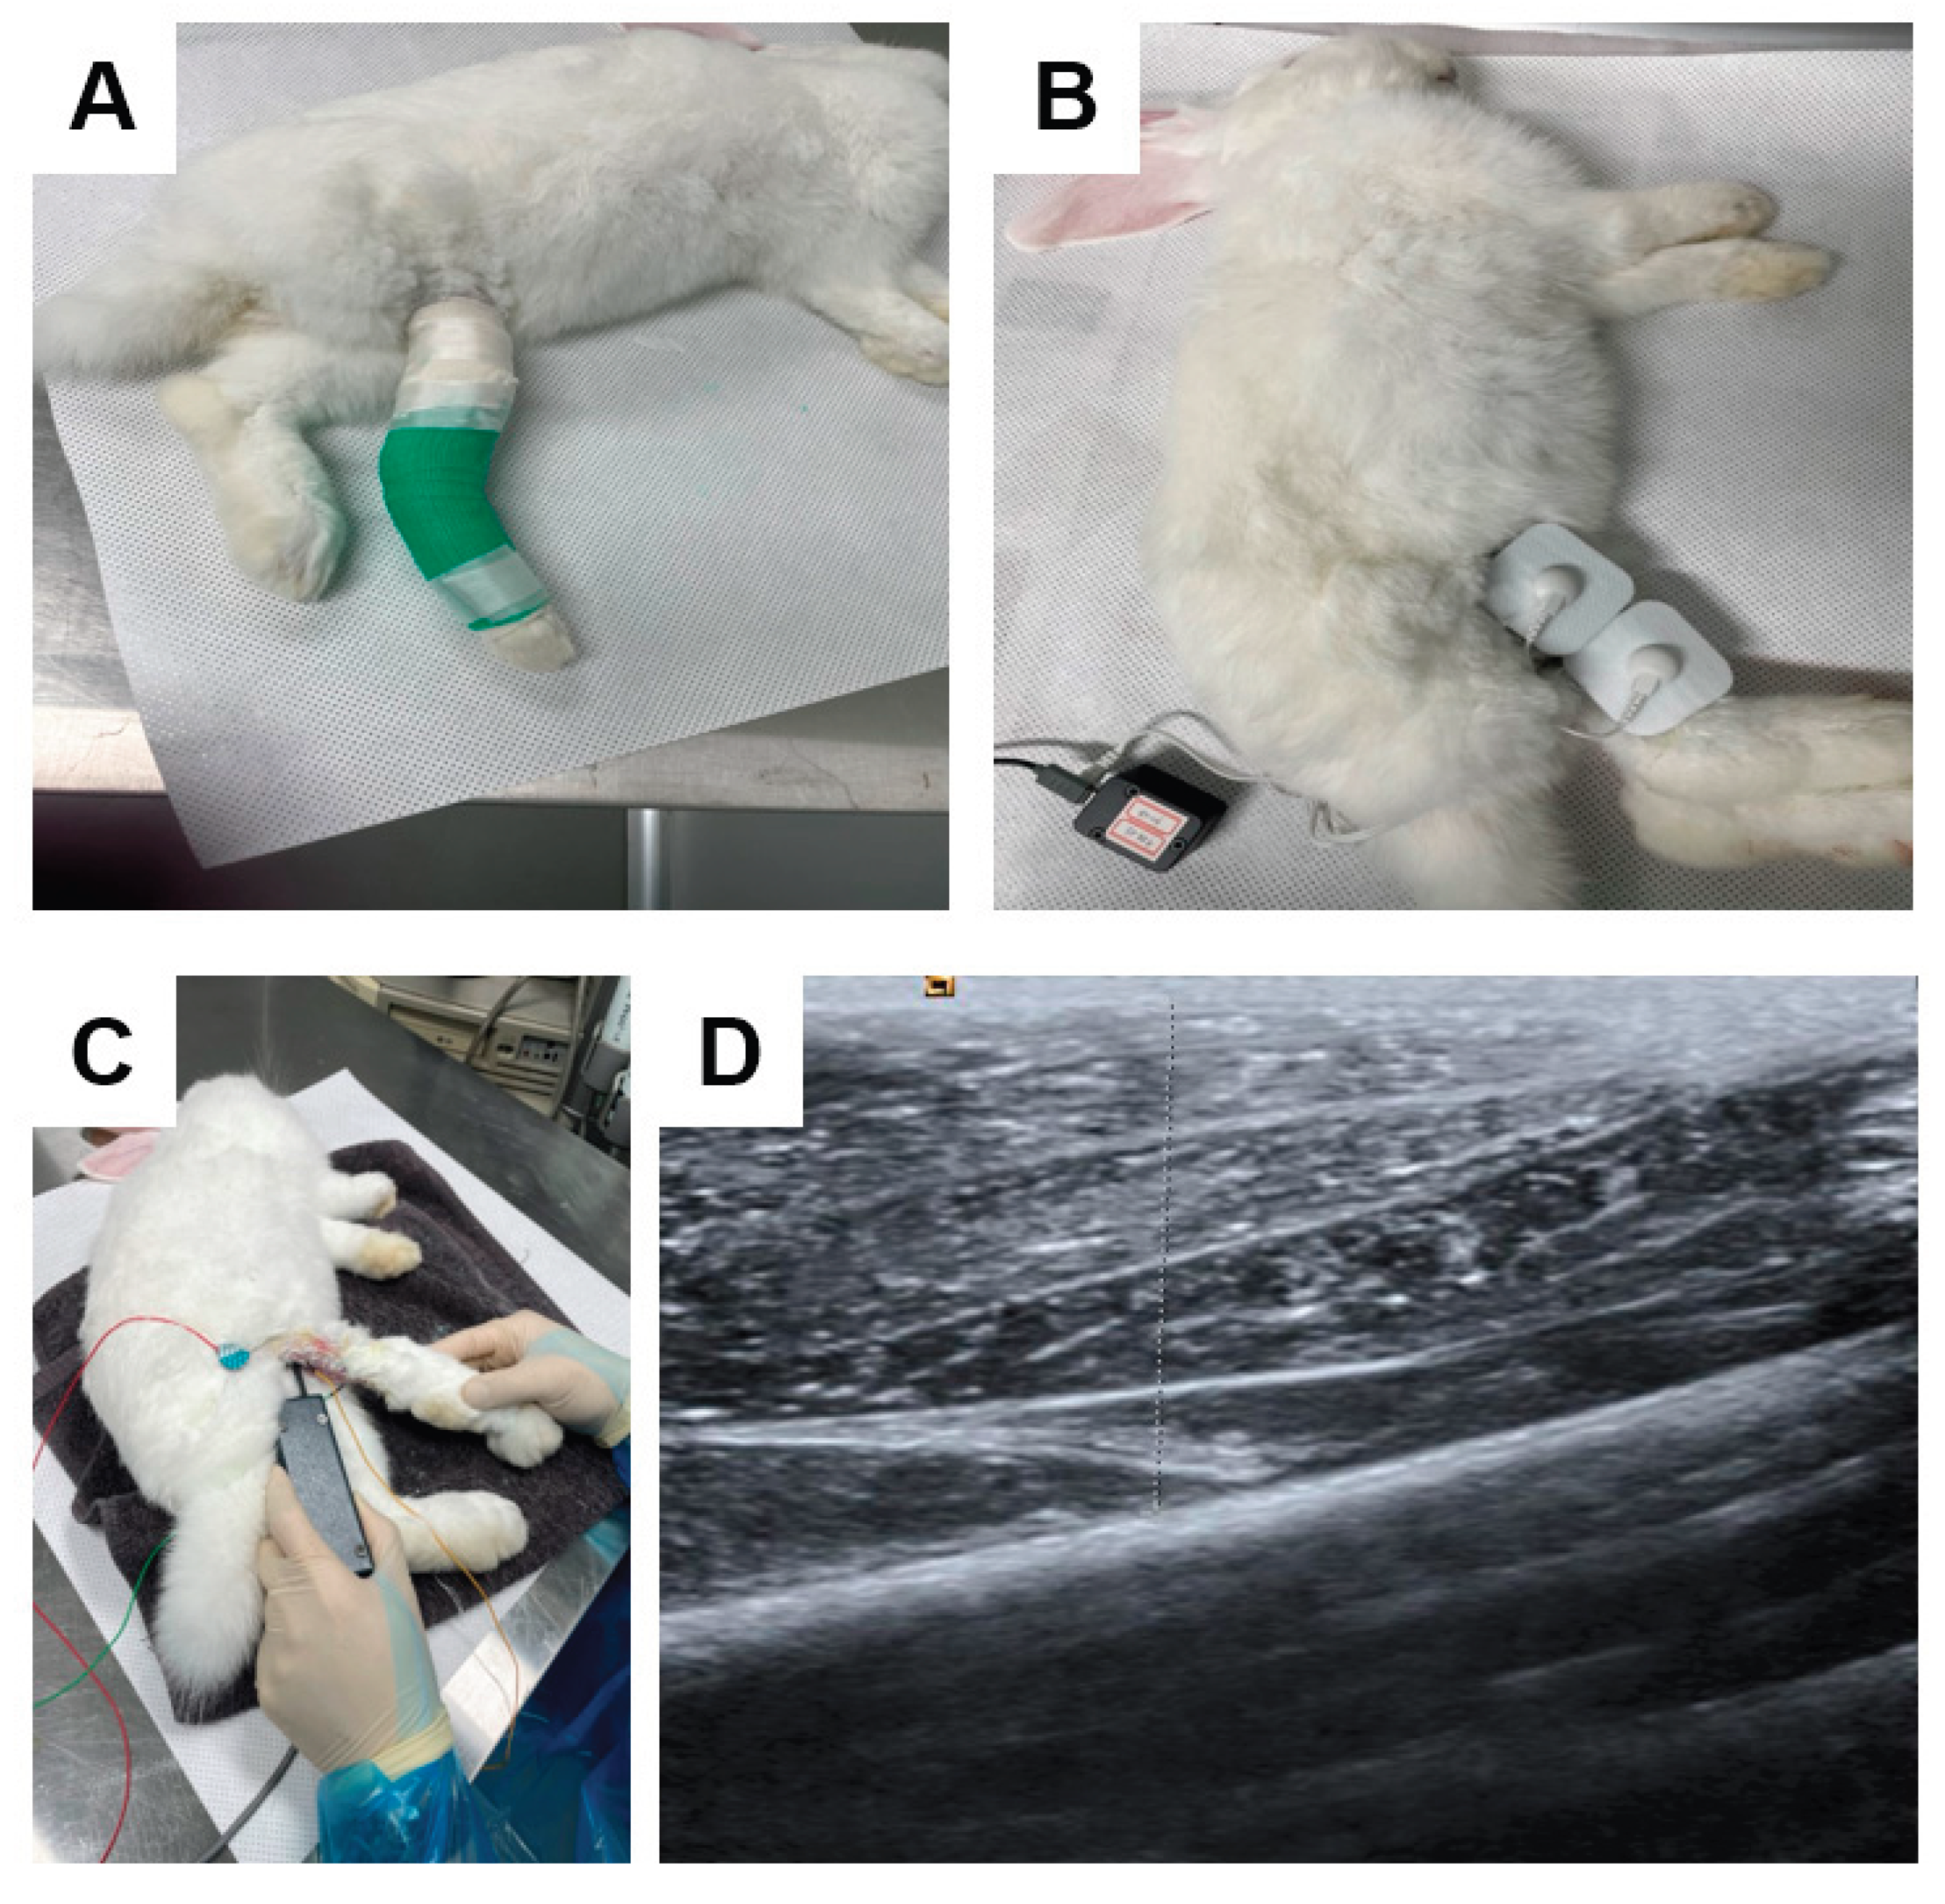

Table 1.
Atrophic changes in four groups.
| Atrophic change (%) | ||||
| Groups | Circumference on Rt calf (cm) | CMAP on Rt. Tibial nerve (mV) | Rt. GCM thickness (mm) | |
| Medial | Lateral | |||
| G1 (Control) | 11.1 ± 4.1 | 37.7 ± 4.6 | 24.2 ± 5.7 | 21.1 ± 4.9 |
| G2 (square 50uA) | 10.6 ± 2.3 | 35.8 ± 4.4 | 26.1 ± 7.2 | 21.5 ± 7.8 |
| G3 (sine 50uA) | 11.0 ± 3.4 | 30.2 ± 7.6 | 26.7 ± 7.4 | 23.2 ± 7.4 |
| G4 (triangle 50uA) | 11.7 ± 1.6 | 35.0 ± 3.6 | 24.1 ± 4.7 | 21.8 ± 7.5 |
Values are shown as mean ± standard deviation. There were no significant differences among four groups. P value calculated using one-way ANOVA.
Table 2.
Comparison of regenerative effect in four groups.
| Regenerative change (%) | ||||
| Groups | Circumference on Rt calf (cm) | CMAP on Rt. Tibial nerve (mV) | Rt. GCM thickness (mm) | |
| Medial | Lateral | |||
| G1 (Control) | 3.8 ± 2.5a | 14.7 ± 5.4a | 6.8 ± 2.3a | 4.5 ± 2.9a |
| G2 (square 50uA) | 10.9 ± 2.3b | 27.8 ± 5.3b | 16.9 ± 2.4b | 13.4 ± 3.3b |
| G3 (sine 50uA) | 16.1 ± 1.6c | 43.2 ± 6.4c | 21.8 ± 2.7c | 19.0 ± 3.0c |
| G4 (triangle 50uA) | 10.6 ± 1.5b | 25.8 ± 7.8b | 14.2 ± 3.3b | 10.6 ± 3.4b |
Values are demonstrated as mean ± standard deviation. a-c Different letters on the bar stand for significantly different p-values <0.05 upon Tukey’s post- hoc test in the groups.
Table 3.
Comparison of motion analysis data in four groups.
| Motion Analysis | ||
| Groups | Total Distance (cm) | Mean Speed (cm/sec) |
| G1 (Control) | 1275.1 ± 276.2a | 4.3 ± 1.0a |
| G2 (square 50uA) | 3479.8 ± 531.4b | 11.6 ± 1.8b |
| G3 (sine 50uA) | 3734.1 ± 1077.0b | 12.4 ± 3.6b |
| G4 (triangle 50uA) | 2922.1 ± 358.9b | 9.2 ± 1.7b |
Values are demonstrated as mean ± standard deviation. a-c Different letters on the bar stand for significantly different p-values <0.05 upon Tukey’s post- hoc test in the groups.
Disclaimer/Publisher’s Note: The statements, opinions and data contained in all publications are solely those of the individual author(s) and contributor(s) and not of MDPI and/or the editor(s). MDPI and/or the editor(s) disclaim responsibility for any injury to people or property resulting from any ideas, methods, instructions or products referred to in the content. |
© 2025 by the authors. Licensee MDPI, Basel, Switzerland. This article is an open access article distributed under the terms and conditions of the Creative Commons Attribution (CC BY) license (http://creativecommons.org/licenses/by/4.0/).
Copyright: This open access article is published under a Creative Commons CC BY 4.0 license, which permit the free download, distribution, and reuse, provided that the author and preprint are cited in any reuse.


