Submitted:
04 September 2025
Posted:
05 September 2025
You are already at the latest version
Abstract
The search for bioactive compounds against chronic diseases such as cancer and diabetes includes curcuminoids as promising scaffolds. Here, we report the synthesis of a family of curcuminoid analogue compounds with an extended unsaturated central chain: difluoroboron complex 1, the enolised curcuminoid 2, and its homoleptic copper complex 3, in moderate to good yields (68-90%). Additionally, their β-cyclodextrin (BCD) association complexes, 4 and 5, were prepared through a mechanochemical method and characterised by spectroscopic techniques. Complete ¹H and ¹³C NMR assignments and NOESY correlations revealed unique solvent effects on the conformational disposition of compound 2, while the copper complex 3 displayed the highest extinction coefficient (1.20 × 10⁵ M⁻¹cm⁻¹). Furthermore, the authentication of the polymorph of 1 and the new crystal structures of 2 and 3, determined by single-crystal X-ray analysis, are highlighted. Although the copper complex three initially exhibited the lowest a-glucosidase inhibitory activity (IC50>100 µM), it showed a significant increase (IC50= 36.27 µM) upon association with BCD, reaching values comparable to the free ligand (IC50= 45.63 µM). Compounds 1-5 were non-toxic to healthy cells (COS-7), but compound 5 stands out as a promising candidate against this metabolic condition.
Keywords:
analogue curcuminoid
; copper complex
; single-crystal structure
; π-elongated chain
; β-cyclodextrin complex
; α-glucosidase
1. Introduction
The search for new compounds with biological activity has, in the family of natural products, a primary source that provides unique structural scaffolds with exceptional chemical and biological properties, and curcumin stands out with particular relevance [1,2]. Curcumin, demethoxycurcumin, and bisdemethoxycurcumin are polyphenols present in the rhizome of Curcuma longa [3]. Currently, the extensive study of these curcuminoids is due to their various reported biological activities, including antioxidant [4], anticancer [5], anti-inflammatory [6,7], antimicrobial [8], antidiabetic [9], and neuroprotective effects against Alzheimer’s disease [10,11]. Structurally, curcuminoids are composed of two aromatic rings connected by an unsaturated seven-carbon chain containing a β-diketone group, which exists in equilibrium between keto and enol tautomeric forms.
The current molecular architecture features an extended conjugated system that enables the formation of complexes with metal ions, altering its optical properties and interactions with biological targets [12]. Research has shown that modifications to the conjugation within the structure of curcuminoids, alongside their chelation with transition metals, can improve both the optical and biological properties of these compounds [13,14,15].
On the other hand, copper is a transition metal, and its ionic form is of physiological relevance, as an essential component of many metalloenzymes involved in redox reactions [16]. Copper complexes have attracted increasing interest due to their biocompatibility and promising biological potential [17,18]. Several studies have reported the antitumor [19,20], antimicrobial [21], and antioxidant [22] properties of copper complexes, as well as their inhibitory activity toward enzymes such as α-glucosidase [23]. The α-glucosidase is an enzyme of carbohydrate degradation, and its inhibition leads to control of postprandial blood glucose levels, resulting in interest for patients with type 2 diabetes treatment [24,25]. Curcumin and curcuminoids exhibit inhibitory ability against the α-glucosidase enzyme, and the development of synthetic analogues has led to compounds with improved inhibitory potency [26,27,28].
Previous research reports homoleptic copper complexes with curcumin, diacetylcurcumin, dimethoxycurcumin, diphenylcurcumin, dibenzylcurcumin, and dietoxycurcumin as ligands. These copper complexes exhibited predominantly a square-planar geometry, forming ML2 structures through coordination with the β-diketone group of curcuminoids. Their antioxidant and antiproliferative activities, and imaging properties improved in comparison with the free ligand [15,22,29].
There are limited investigations related to the synthesis, characterisation, and evaluation of the biological activity of curcuminoid analogues with extended conjugation in the unsaturated central chain. These curcuminoid analogues are particularly noteworthy for their optical properties [14,30,31] and as potential photosensitisers [32,33].
Although the biological and optical potential of curcuminoids is significant, their low aqueous solubility, susceptibility to hydrolysis, and photodegradation limit a practical biological evaluation and bioavailability. Among the strategies to improve solubility in aqueous media, the formation of complexes with cyclodextrin has proven particularly effective in improving solubility and chemical stability [34,35]. β-Cyclodextrin is efficient at forming complexes and is the most common available cyclodextrin. Structurally, BCD is composed of seven α-1,4-linked D-glucopyranose units, resulting in a toroid structure with a cavity (6-6.5 Å) of lower polarity than the surface [36,37].
Considering the potential for exploring curcuminoids and their metal complexes, the present study aims to examine a family of analogue curcuminoids with the extended eleven-carbon unsaturated central chain, using cinnamaldehyde for synthetic convenience due to the favourable aldolic condensation reaction and the lack of functional groups in the aromatic fragment promoting efficient chelation at the β-diketone function.
The curcuminoid analogue, its boron and copper complexes, were fully characterised by spectroscopic, spectrometric, and X-ray diffraction methods. Furthermore, we report the formulation of the analogue and its copper complex with BCD (compounds 4 and 5), as well as their spectroscopic characterisation, evaluating the α-glucosidase and antiproliferative activity inhibition of these compounds.
2. Results
2.1. Synthesis
The synthon was prepared in good yield (88%), using 2,4-pentanodione and THF-boron trifluoride complex. In this compound, the -BF2 group increases the acidity of the methyl groups and prevents the Knovenagel reaction in the next step. Then, the condensation reaction between synthon and cinnamaldehyde was conducted with tributyl borate and n-butylamine to produce the curcuminoid-BF2 analogue 1 as a dark purple solid in moderate yield (68%). The synthesis of ligand 2 was carried out following the reaction conditions previously reported [35], introducing minor modifications in the removal of the difluoroboron group. The cleavage of the diflouroboron group was carried out trough reflux with triethylamine and methanol-DMSO-water as solvent (yield: 81%) or applying microwave irradiation using sodium oxalate in methanol-water as solvent at 140 °C during ten minutes (yield: 85%). Both methods have been reported as efficient to cleavage -BF2 group in the synthesis of curcuminoids [40,41]. Finally, compound 2, with the free β-diketone group, and copper (II) acetate in ethyl acetate solution, produced the homoleptic copper complex (3) with a 90% yield. Scheme 1 shows the reactions to obtain compounds 1-3.
2.2. Nuclear Magnetic Resonance
Few reports document the synthesis of curcuminoid analogue (2). These reports provide limited information regarding their chemical shifts, with the assignments for protons and carbons largely absent. We examined the NMR spectra of 1 and 2 using 1D and 2D nuclear magnetic resonance experiments (Supplementary material). Figure 1 presents the stacked 1H-NMR spectra of compounds 1 and 2, alongside the hydrogen and carbon assignments in DMSO-d6 and CDCl3, shown in Table 1.
The 1H NMR spectra of 1 and 2 show their own set of signals due to magnetic equivalence. Thus, the aromatic protons in 1 (CDCl3) appear as multiplets at δ7.38 and δ7.52 ppm, while in compound 2 (DMSO), they are multiplets at δ7.35, δ7.40, and δ7.59 ppm. Unsaturated protons HD and HE in 1 appear as a doublet of doublets at δ7.82 and δ6.98 ppm, while in 2, they appear at δ7.45 and δ7.18 ppm, respectively. Coupling constants for HD and HE in both compounds are ca. 15 Hz due to the trans coupling of the unsaturated proton system. HF and HC hydrogens in 1, appear at δ7.09 and δ6.27 ppm with ca. J=15.4 and 14.8, respectively. The corresponding set for 2, are doublets at δ7.11 and δ6.38 ppm with J=15.6 and J=15.1 Hz, respectively. The methine hydrogen appears as a singlet at δ5.93 and δ5.7 ppm for 1 and 2, respectively. In addition, the 1H-NMR spectrum of 2 displays a broad signal at 16.06 ppm corresponding to the -OH, which forms a hydrogen bond, indicating the keto-enol tautomer.
The 1H-NMR of compound 2 was also acquired in CDCl3 besides DMSO and its assignments are shown in Figure 1c and Table 1. Comparisson with the spectrum in DMSO-d6, different multiplicities for HD, HE, and HF were observed as consequence of changes in chemical shifts. In addition, the NOESY spectrum shows interactions at larger distances between HD-HA and HH-Hc when chloroform, is used as solvent. The complete set of interactions is shown in the Table S1.
2.3. Electronic Paramagnetic Resonance
The electron paramagnetic resonance spectrum of compound 3 (Figure S22), exhibited two sets of quartet hyperfine lines, characteristic of copper (II) coordination complexes, indicating the coexistence of two species. The experimental values obtained directly from the spectrum are: g∥= 2.2819 and 2.3040, gꞱ = 2.0430 and 2.0544, while Aǁ values are 168.9 and 160.0 x 10 -4 cm-1. In both cases, gǁ > gꞱ, suggesting an axial square-planar coordination geometry [38]. The calculated ratios f = gǁ/Aǁ are 135.1 and 144 cm, close to 150 cm, which is associated with slight to moderate distortion from planar geometry [39].
2.4. Mass Spectrometry
The mass spectrum compound (1) showed a peak at m/z 411.6 [M+Cl] −, which is in agreement with the mass expected for this compound. In the case of ligand (2), a peak at m/z 329.9 corresponds to [M+H]+ molecular ion, and the mass spectrum of the copper complex (3) showed a peak at m/z 781.538 [M+Cu]+.
2.5. Optical Properties
The absorption and fluorescence spectra of compound 1-3 were carried out using DMSO as solvent. The maximum absorption and emission are shown in Table 2 and the spectra in Figure 2. Compound 1 showed two main maximum absorption bands in the UV-Vis at 487 and 511 nm, while compounds 2 and 3 showed it at 434 and 435 nm, respectively, due to π-π* transitions.
2.6. Infrarred-FT Spectroscopy
FT-IR spectrum of compound 1, shows medium intensity bands at 1598 and 1587 cm-1 corresponding to stretching vibration of C=O and C=C; a very intense band at 1504 cm-1 revealed the C=C bond vibration, while the B-O vibration is evidenced with the medium intensity bands at 1384 and 1050 cm-1. The IR spectrum of compound 2 showed intense bands at 1604 and 1488 cm-1 corresponding to C=O and C=C, respectively. Copper (II) complex (3) FT-IR spectrum exhibited medium intensity bands at 1612 and 1598 cm-1, which correspond to C=O and C=C stretching and at 1505 cm-1; an intense band was observed due to coordination with Cu (II); furthermore, new low intensity bands were observed at 472 and 544 cm-1, indicating the Cu-O bond vibration.
2.7. Single Crystal X-Ray Diffraction
The crystallographic structures of compounds 1-3 were obtained, and the ORTEP diagrams are in Figure 3; the crystallographic data are summarized in Table 3 and the full dataset is available in the Supplementary material (Tables S6-S21. The crystal structure of analogue-BF2 (1) shows a triclinic system. Three planes were defined, finding a significant deviation in planarity in the unsaturated eleven-carbon chain (3E,6Z,8E)-7-hydroxyundeca-1,3,6,8,10-pentaen-5-one (RMS=0.135 Å), whereas the phenyl moieties remain essentially planar (RMS = 0.002 and 0.004 Å). The angles formed between the central carbon chain plane and the phenyl groups are 25.18 and 30.78°. However, the phenyl group planes have a dihedral angle of 55.90°. The disposition of the -BF2 group is ca 90° with respect to the plane of the curcuminoid structure core.
The analogue (2) crystal structure has an orthorhombic system and is co-crystallized with THF, which interacts with three analogue molecules in the crystal packing. The asymmetric unit consists of half of a curcuminoid analogue, and the linear structure exhibits a significant deviation in planarity. Two planes were defined: (3E,6Z,8E)-7-hydroxyundeca-1,3,6,8,10-pentaen-5-one (RMS= 0.1710 Å) and phenyl moiety (RMS= 0.003 Å), both are at 21.45° from each one. An intramolecular hydrogen bond within the keto-enol group was observed (distance O···H 1.67 Å).
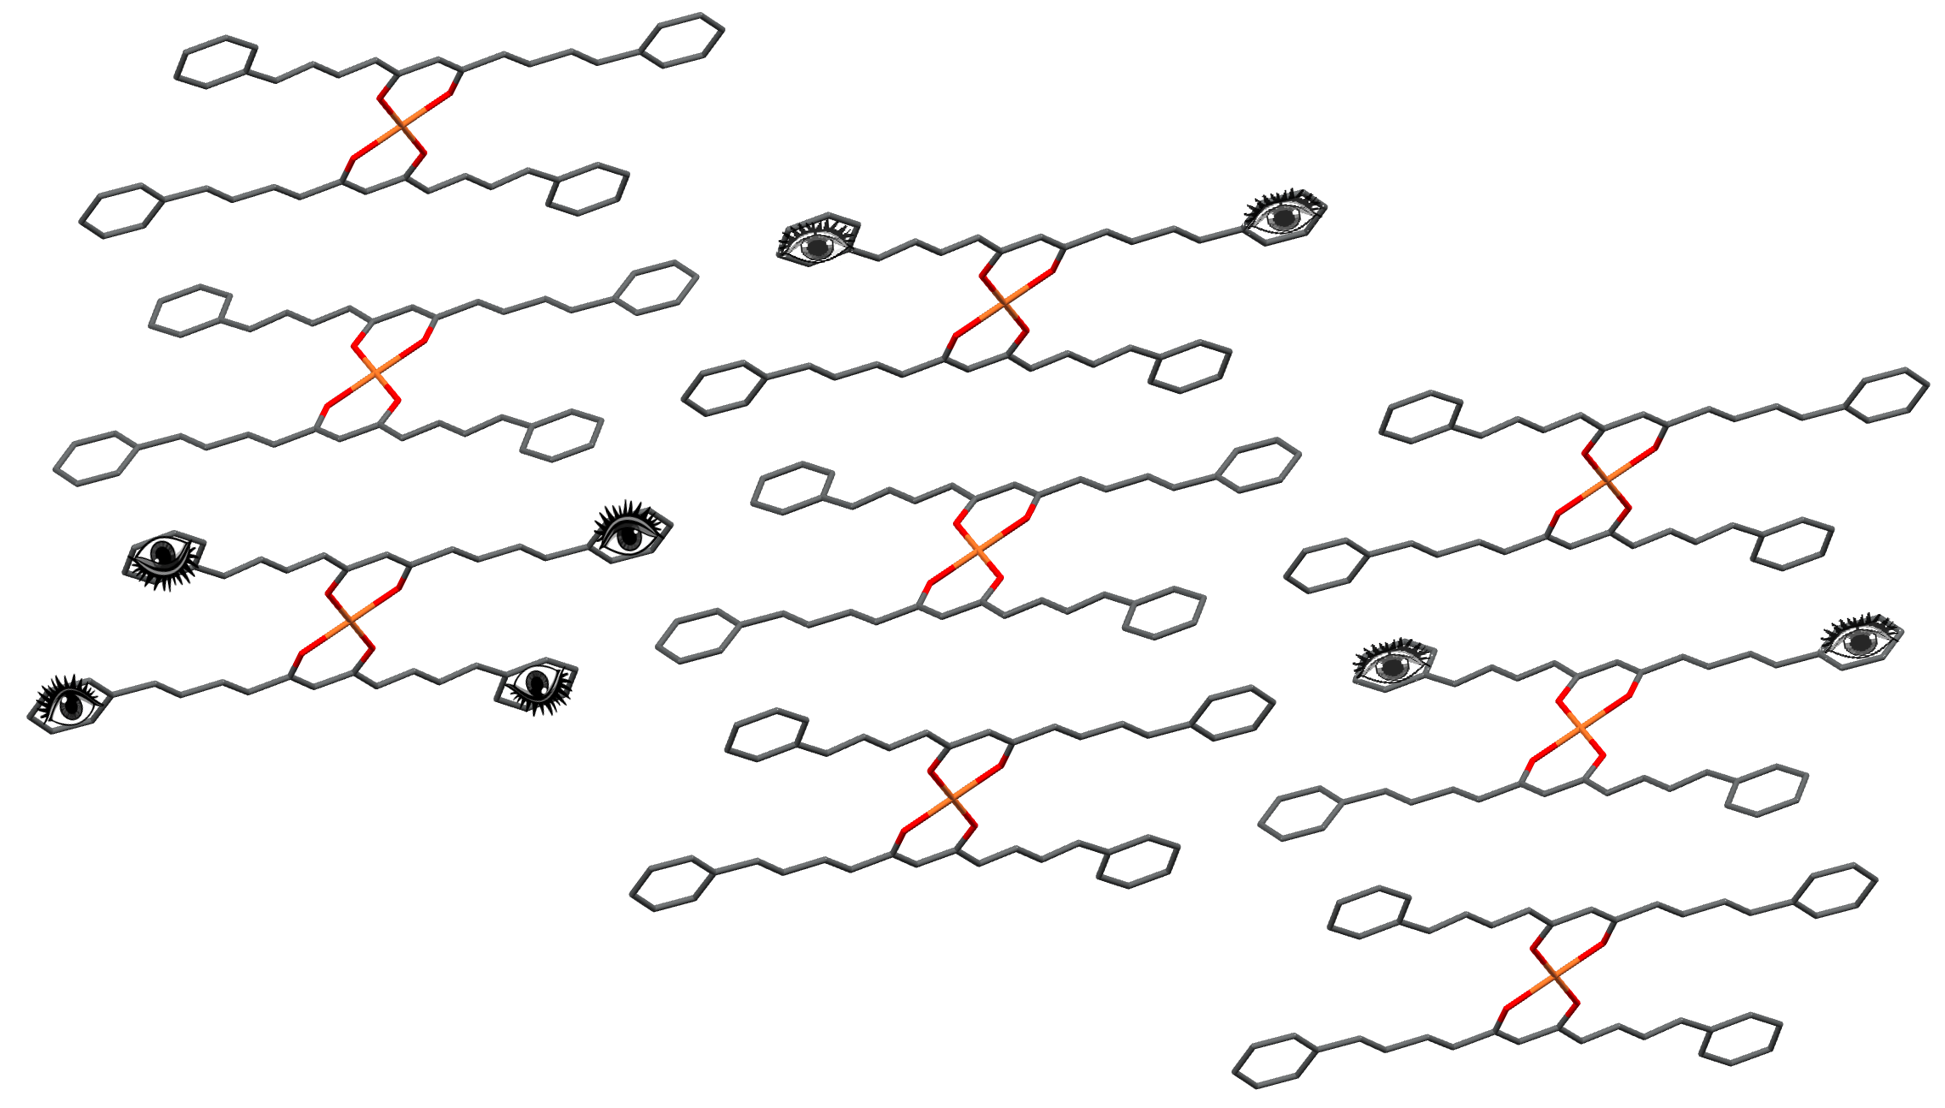
The crystal of the copper complex (3) showed a monoclinic system and reveals a four-coordinate number for copper, adopting a square planar geometry. The asymmetric unit includes a ligand unit binding to a copper atom. The planes formed by deprotonated (3E,6Z,8E)-7-hydroxyundeca-1,3,6,8,10-pentaen-5-one (RMS= 0.082 Å) and phenyl groups (0.0020 and 0.007 Å) showed a slight deviation from planarity, forming an angle of 4.33° and 5.23°. The Cu–O bond distances are approximately 1.91 Å.
Intermolecular interactions in the crystal packing of compounds 1-3 were performed in Crystal Explorer software through the Hirshfeld surface (HS) and the related 2D fingerprint plots.
The HS were mapped using the descriptor dnorm, which indicates the intermolecular contact distances normalised with the van der Waals radius of the atoms, involving the distance from the surface to the closest atom inside (di) and outside (de) [42,43]. In the HS of the compounds 1-3, some red pots were distinguished, corresponding to the closer contacts (strong interactions), blue to those longer than the van der Waals radius, and a white surface represents distances equal to the sum of van der Waals radii [44]. In all crystal structures, longer distance contacts (weak interactions) are predominant. In the HS of compound 1, B-F···H-C interactions are represented by red pots (Figure 4), while in compounds 2 and 3, red pots are established by C-C···H-C contacts.
The fingerprint plots (Figure S38) reveal that the percentages of contact contributions in the crystal packing of compounds 1-3 are H···H (38-51%) and C···H/H···C (29-44%) interactions, which extend along the fingerprint plots and are related to the Van der Waals forces. However, in the case of analogue-BF2, the interactions H···F/F···H are relevant (19%) and appear in the two sharp spikes extending from bottom to top of the 2D fingerprint plot, suggesting strong interactions when the distance is shorter than the sum of Van der Waals radii [43]. Other interactions, like C-C (π-π contacts), are scarce.
2.8. Improvement of Water Solubility Through Association with β-Ciclodextrin (BCD) Formation and Biological Activity Evaluation
The analogue curcuminoid 2 and its copper complex 3 showed poor solubility in polar solvents; therefore, formulations with dry BCD were prepared using mechanochemistry. The solid obtained directly from the mill was shaken with water and filtered to obtain the association complex as a solid yellow and brown for 4 and 5, respectively (Figure 5), which was analysed by NMR, infrared, and UV-Vis spectroscopy.
2.8.1. Nuclear Magnetic Resonance of the Association Complexes with BCD
The shifts in the 1H-NMR spectrum of BCD were consistent with those reported in the literature [45]. The stacked 1H-NMR spectra of free BCD and compound 2, and 4 association complex are shown in Figure 6. The signals of BCD in the 1H-NMR spectrum of 4 are observed between 3 and 5.8 ppm. The 1H and 13C chemical shift changes defined by Δδ = δcomplex - δfree (Table S2-S3) suggest interactions between BCD and 2 in the complex. The hydrogen shifts of BCD indicated a shielding effect on H3, H4, and H6 due to the anisotropy caused by π the electron of the conjugate system in 2. A deshielding effect was observed on H1, H2, and C3-OH, with the highest Δδ values for H2, followed by H1, H4, and H6. Additionally, NOE’s are observed between the enol-hydroxyl group of 2 and H2 and the C6-OH of BCD, indicating the interactions with the exterior of BCD.
2.8.2. UV-Vis and Infrared Spectroscopy of Association Complexes with BCD.
The FT-IR spectrum of the 4 complex shows two intense bands at 3311 and 1026 cm-1, corresponding to the -OH and C-O-C vibrations, respectively, which are related to the BCD structure (Figure 7a). Additionally, a broad and intense band absorption at 1488 cm-1 attributed to the vibration of the C=C bond of compound 2 (Figure 7b) is not observed in the complex with BCD, which may be attributed to changes in band intensity and wavelength number.
The FT-IR spectrum of the inclusion complex of 5 displays the characteristic BCD bands at 3340 cm–1 (O–H stretching) and 1029 cm–1 (C–O–C stretching), which shift from 3307 and 1021 cm–1, respectively (see FT-IR spectrum of BCD, Figure S32). Minor shifts in wavelength number are also observed in the bands assigned to the C=O and C=C stretching vibrations, which appear at 1612 and 1599 cm-1; however, in the spectrum of the BCD complex, they collapse at 1604 cm–1 (Figure 7c,d).
The UV–Vis absorption maxima of the association complexes 4 and 5 in DMSO were observed at 431 and 438 nm, respectively. In comparison, the free forms of compounds 2 and 3 exhibit absorption maxima at 434 and 435 nm, respectively, as shown in Table 2. These results reveal a hypsochromic shift for compound 2 upon complexation with BCD, whereas compound 3 exhibited a bathochromic shift upon BCD association. The concentration of association complexes 4 and 5 was determined by UV-Vis spectroscopy, yielding values of 393.60 μg/mg and 685.94 μg/mg, respectively.
2.9. Biological Activity
The antiproliferative and α-glucosidase inhibitory activities of compounds 2 and 3, as well as their BCD complexes 4 and 5, were evaluated.
Antiproliferative activity was assessed in various cancer cell lines using the sulforhodamine B assay at a concentration of 10 µM. The resulting cell growth inhibition percentages are presented in Table S4. Neither the compounds nor their BCD complexes demonstrated antiproliferative activity at this concentration.
A yeast α-glucosidase inhibition assay was performed for compounds 2, 3, and their BCD complexes 4 and 5 using quercetin as a positive control; complete data are shown in Table S5. and in Figure 8, the half-inhibition concentrations (IC50) are shown.
The inhibitory activity of compound 2 shows no change concerning its BCD complex 4, exhibiting IC50 values of 45.63±13.12 and 51.11±11.05 µM, respectively. In contrast, the compound 3 does not have important inhibitory activity of α- glucosidase (16.19±3.18 % at 100 µM, Table S5); however, in complex with BCD showed an enhanced activity, exhibiting IC50= 36.27±12.85 µM, which is comparable with the compound 2 inhibitory activity. The enzyme inhibitory activities of 2 and 5 do not show a significant difference with quercetin activity.
3. Discussion
Curcumin and curcuminoids are fascinating compounds due to their biological activity and applications as dyes and photosensitizers [10,33,46,47]. The research about the synthesis of analogue curcuminoids has centred on modifications around the aromatic or β-diketone group [48]; however, analogues with an extended central chain are unexplored, and a few reports describe spectroscopic and biological properties [14,30,31,32,33]. The synthesis of an analogue curcuminoid with an eleven-carbon central chain follows the previously reported methodology through a condensation reaction of cinnamaldehyde and synthon, followed by the removal of the difluoroboron group. In this final step, microwave irradiation and reflux result in efficient methodologies for obtaining compound 2 in good yields (81-85%). The microwave irradiation method required less time compared to refluxing conditions. This synthetic route to synthesise compound 2 led to an improvement in time and yield compared to the reported method by Kazantzis et al., which used an acetone-boric oxide complex as the first step (63%) [33].
Overlap suppression of signals in 1D and 2D NMR experiments at 700 MHz, led to a complete hydrogen and carbon assignment, observing the characteristic deshielding effect of the -BF2 group over vinyl and aromatic hydrogens in compound 1. In addition, the influence of the solvents DMSO-d6and CDCl3 on the multiplicity of HD, HE and HF was evidenced in the 1H-NMR spectrum of compound 2. In addition, the NOESY spectrum showed distinctive hydrogen interactions between HD-HA and HH-Hc when CDCl3 is used as solvent. Such effect can be attributed to the polarity and viscosity of the deuterated solvent, which favors different conformer populations [49]. This fact suggests that the molecular flexibility of compound 2 is due to the extended central chain, in comparison with the parent diphenylcurcuminoid, for which no changes in the multiplicity of proton signals in CDCl3 and DMSO-d6 have been reported in the literature [22,50].
Similarly, the EPR spectrum of compound 3 exhibits the coexistence of two species and the g∥, gꞱ, and Aǁ and F values agree with the previously reported homoleptic complexes of copper with curcuminoids and curcumin, whose predominant species exhibit a square-planar geometry with distortion [22,29]. In contrast, none of the reported homoleptic copper–curcuminoid complexes have shown evidence for the coexistence of different species. Also, a change in solvent can alter the electronic distribution and geometry of the coordination sphere of copper complexes [51].
The observed optical properties show that the complexation with the -BF2 group in compound 1 gives rise to red-shifted absorption bands compared to the analogue curcuminoid 2; this effect has been observed in reported curcuminoid-boron complexes [52,53,54]. Additionally, Bai and coworkers studied curcuminoids-BF2, finding that an extra double bond in the central chain leads to a red shift compared to the seven-carbon chain curcuminoids-BF2 [14]. On the other hand, Tahay and coworkers report a red shift in the maximum absorption of compound 2 compared to diphenylcurucuminoid, attributed to the length of the π-conjugation [32]. The extinction coefficient of 2 exceeds those of curcumin and bisdemethoxycurcumin, and agrees with the reported value [33]. The copper complex 3 demonstrates an even higher extinction coefficient (Table 2), indicating a better interaction with light, a desirable property for applications in dyes and photosensitizers [14]. In addition, this opens the possibility of a phototherapeutic applicability.
In the present work, the crystal structures of compounds 1-3 are reported by the first time, although Bai and coworkers reported previously a polymorphic monoclinic crystal of compound 1 [14]. The cooper complex 3 showed a square planar geometry, which is predominantly observed in reported curcuminoid copper complexes [22,29]. In addition, the copper complex exhibited the best planarity, revealing efficient conjugation, as evidenced by a significant extinction coefficient, which could improve its optical properties, a phenomenon observed in copper complexes with extended conjugation [55].
Hirshfeld surface and the related 2D fingerprint plots of crystal structures, reveal that the main interactions are governed by Van der Waals forces (H···H and C···H), similar contributions are reported in the crystal packing for a copper complex of curcumin [29], an asymmetric curcuminoid [56] and zinc complexes of curcuminoids [57]. The closer contacts (strong interactions) are displayed on the extreme sides of aromatic rings in compounds 2 and 3. In contrast, in compound 1, the BF2 region, through B-F···H-C interactions, reveals strong interactions.
These predominant interactions described for compounds 2 and 3 are related to a reduced solubility in polar solvents, which has led us to the development of BCD-based formulations and further biological evaluation. The improvement in solubility enhances potential applications, particularly considering that the cytotoxic effect of compound 2 against a prostate cancer cell line has been documented, leading to increased efficacy under irradiation in photodynamic therapy experiments [28].
The spectroscopic analysis of BCD complexes of compounds 2 and 3 demonstrates guest–host interactions; 1H-NMR shifts reveal shielding and deshielding effects attributed to guest aromatic moieties in guest molecules, an effect that has been reported in complexes with BCD [58,59,60]. These results suggest a partial insertion of compound 2 in the cavity of BCD through the interaction of the π-conjugated system with H3, which resides in the cavity near the wider rim of BCD [61]. In addition, NOE’s correlations confirm the interactions with the exterior of BCD. Infrared spectra showed changes in intensity and shifts, mainly in bands related to the C=C and C=O stretching vibrations of the guest molecules and the O-H or C-O-C stretching vibrations of BCD. This effect is observed in the association of curcumin or azomethine with BCD, where the disappearance of the band corresponding to the aromatic ring was reported, suggesting the introduction of the benzene rings into the BCD cavity [62]. Likewise, changes in wavenumber are a consequence of interactions between guest and host [63].
The UV-Vis spectra of 4 and 5 association complexes show both bathochromic and hypsochromic effects in the maximum absorption, respectively. The literature reports bathochromic effects for inclusion complexes of ursolic acid, oleanolic acid, and sulfabenzamide with BCD, attributed to changes in the medium’s polarity and to interactions within the BCD cavity or at its outer surface [64,65]. The results provide evidence for the effective formation of complexes with BCD.
We evaluated compounds 2, 3, and their BCD complexes, for their antiproliferative and β-glucosidase inhibition effects. All compounds showed no antiproliferative activity against the different cancer cell lines; however, compound two and its BCD complex inhibited the α-glucosidase without a significant difference and are comparable to curcumin inhibitory activity (IC50= 37.2/78.2 µM) and better than demetoxicurcumin (IC50= 82.4 µM) and bisdemetoxicurcumin (IC50= 90.6 µM) activities [26,66]. In the case of 3, there is no inhibition activity at high concentrations; however, its BCD complex 5 exhibits a notable improvement in inhibition activity (IC50 = 36.27 μM), highlighting the importance of the formulation with BCD. Reports indicate that the copper ion exhibits better α-glucosidase inhibition than divalent metal ions like Zn2+, Ca2+, Mg2+, and Mn2+ [67]. In the same manner, the metallorganic copper complexes have also shown better enzyme inhibitory activity than free ligands [68,69]. Even the complex of hesperidin with copper exerts a synergistic effect with acarbose, and kinetic studies suggest that its copper complex could interact with the active site pocket, inhibiting carbohydrate hydrolysis [69]. The latter fact, reinforces the importance of the formulation of 3 with BCD, aiming to improve its potency as inhibitor of α-glucosidase.
4. Materials and Methods
2,4-Pentanodione, boron trifluoride THF complex (CAS 462-34-0), cinnamaldehyde (CAS 080687), copper acetate (CAS), tributyl borate (CAS 688-74-4), N-butylamine (CAS 109-73-9), β-cyclodextrin (CAS 7585-39-9), triethylamine (CAS 142-71-2), and solvents HPLC grade were commercially acquired from Sigma Aldrich®. Cinnamaldehyde (40 mL) was previously destilated under reduced pressure (10 mm de Hg) collecting cinnamaldehyde fraction at 80 °C.
Melting points were measured using an Electrothermal Engineering IA9100 digital apparatus and values are uncorrected.
Analitycal Determinations
Infrared spectra were recorded on an FT-IR NICOLET IS-50, (Thermo Fisher Scientific, Waltham, MA, USA.) using the attenuated total reflectance (ATR) technique (4000–400 cm-1).
1H, 13C NMR and two-dimensional spectra (COSY, HSQC, HMBC, NOESY and ROESY) were recorded on a Bruker Avance III HD 700 MHz spectrometer (Bruker, Rheinstetten, Germany) using DMSO-d6 as solvent and reference. Spectra were processed using MestReNova software 14.2.0 [70].
The mass spectrum of compound 3 was acquired on a Bruker Microflex MALDI-TOF spectrometer (Bruker Daltonics, Bremen, Germany) equipped with a nitrogen laser (λ = 337 nm). Analyses were performed in positive ion mode with an acceleration voltage of 20 kV, using 2,5-dihydroxybenzoic acid (DHB) as the matrix.
The electron paramagnetic resonance (EPR) spectrum was recorded on a JEOL JES-TE300 (JEOL Ltd., Akishima, Tokyo, Japan) spectrometer operating in the X-band at 9.5 GHz. Magnetic field calibration was performed using an ES-FC5 NMR field meter. Spectral acquisition and data processing were carried out with the ES-IPRITS data system (v3, 1997). The sample was prepared as a 3 mM solution in THF and placed in a 5 mm quartz tube. Measurements were conducted at 77 K, with the magnetic field centered at 300.0 mT.
Mass spectra of compounds 1 and 2 were recorded on a Bruker Esquire 6000 spectrometer (Bruker Daltonics, Bremen, Germany) equipped with an electrospray ionization (ESI) source, operated in both positive and negative ion modes. The drying temperature was set at 300 °C, and the nebulizer pressure was maintained at 10 psi.
HPLC-UV was performed on an Agilent 1200 (Agilent Technologies, Waldbnn, Germany) with UV-Vis diode array detector Waters 2996. Separation was performed on Eclipse Plus C18 (2.1 x 100 mm x 3.5 μm) column using a gradient of methanol and water starting 60:40 and ending with 100% of methanol at a flow rate of 0.2 mL/min a gradient methanol:water starting 60:40. Samples were dissolved in DMSO.
Single-crystal X-ray diffraction were collected on a Bruker D8 Venture diffractometer (Bruker, Karlsruhe, Germany), CCD equipped with a graphite monochromator and MoKα as the source of radiation (λ = 0.71073) at 150 K for compounds 1 and 2 and 100 K for compound 3. The structures were solved by direct methods by SHELXS [71] and refined by full-matrix least-squares on F2 using SHELXL [72]. All non-hydrogen atoms were refined anisotropically. For compound 2 the symmetry transformation #1-x+1,y,z was used to generate equivalent atoms. The structure was visualised using the MERCURY software (v2025.1.1) [73] and RMS values were calculated in Olex2 (v1.5) [74].
Intermolecular interactions present in the crystal packing were analyzed using CrystalExplorer (v. 21.5, University of Western Australia, Perth, Australia) [75]. Hirshfeld surfaces and finger 2D plots were generated from the crystallographic information files (CIF) obtained by single-crystal X-ray diffraction.
UV-Vis spectra were determined on Shimadzu UV-160 and Shimadzu UV-1800 spectrophotometers Shimadzu, Kioto, Japan) in the range of 200-800 nm. Measurements were performed using quartz cuvettes of 1.0 cm, and DMSO was used as a blank.
Fluorescence spectra were recorded on an Agilent Cary Eclipse spectrofluorometer (Agilent Technologies, Santa Clara, CA, USA) using quartz cuvettes with 1.0 cm of length. Samples were prepared at a concentration of 3 μM using DMSO as the solvent and measured at 25 °C. Each compound was excited at its maximum absorption wavelength (compound 1: 487 nm; compound 2: 434 nm; and compound 3: 435 nm). Excitation and emission slit widths were set to 5 nm and scan rate was 600 nm/min.
Complexes with β-cyclodextrin were prepared in a planetary ball mill PQ-N04 (Across International, New Jersey, EE.UU.) using zirconia jars of 100 mL and balls of 0.5 cm of diameter.
Synthetic Procedures
Synthon was prepared using 2,4-pentanodione and boron trifluoride-THF complex as previously report [76].
Compound 1: Distilled cinnamaldehyde (7.000 g, 53 mmol) was placed in a 125 mL Erlenmeyer flask and dissolved in ethyl acetate (20 mL). Tributyl borate (6.70 mL, 28 mmol) was added, and the mixture was stirred to ensure complete homogenization. The resulting solution was added to a 250 mL round-bottom flask containing the synthon (4.70 g, 53 mmol) previously dissolved in ethyl acetate (47 mL). Separately, n-butylamine (2.80 mL, 28 mmol) was dissolved in ethyl acetate (6 mL) and placed in an addition funnel. This amine solution was added dropwise to the reaction mixture under continuous stirring. The reaction was maintained at room temperature with stirring for 4 hours to afford a purple precipitate, which was filtered and washed with a 90:10 water/acetone mixture. Crystallisation was performed in an acetone-tetrahydrofuran mixture. Yield: 68%, m.p.= 220 °C, 1H NMR (700 MHz, Chloroform-d) δ 7.82 (t, J = 14.8 Hz, 2H), 7.53 – 7.49 (m, 4H), 7.41 – 7.31 (m, 6H), 7.09 (d, J = 15.4 Hz, 2H), 6.98 (t, J = 15.3 Hz, 2H), 6.27 (d, J = 14.8 Hz, 2H), 5.93 (s, 1H). 13C NMR (176 MHz, CDCl3) δ 179.59, 147.66, 145.13, 135.80, 130.27, 129.14, 128.01, 126.64, 124.22, 102.22. FT-IR (ATR) 3024, 2158, 11972, 1172, 1667, 1599 cm-1, 1586.55 cm-1, 1503, 1383, 1130, 1050, 984 885, 849, 752, 689. MS (ESI-) m/z 411.6 [M+Cl]-.
Compound 2: Reflux: In a 1 L round-bottom flask, compound 1 (3.000 g, 8 mmol) was dissolved in DMSO (7.5 mL), then methanol (400 mL) and water (2.5 mL) were added. Triethylamine (2.20 mL, 16 mmol) was added to the solution, and the reaction mixture was stirred under reflux for 10 h. The orange precipitate was filtered and washed with a solution of acetone–water (90:10, v/v). Yield: 81%, orange powder, mp: 189-191 °C. Crystallization was performed in tetrahydrofuran.
Microwave irradiation: The experimental procedure was carried out according to the methodological conditions described in the literature [77,78], and some variations have been made. Compound 1 (0.400 g, 1 mol) and sodium oxalate (0.250 g, 1.8 mol) were placed in a sealed microwave reaction vessel, and 20 mL of methanol-water (75:25, v/v) solution was added. The reaction mixture was subjected to microwave irradiation at 140 °C for 10 minutes. The precipitate was collected by vacuum filtration and washed with water. Recrystallisation from ethyl acetate-hexane afforded the orange solid product. Yield: 85%, orange powder, mp: 189-191 °C.
1H NMR (700 MHz, DMSO-d6) δ 16.06 (br s, 1H), 7.59 (d, J = 7.5 Hz, 4H), 7.45 (t, J = 14.9 Hz, 2H), 7.40 (t, J = 7.6 Hz, 4H), 7.34 (t, J = 7.3 Hz, 2H), 7.18 (t, J = 15.4 Hz, 2H), 7.11 (d, J = 15.6 Hz, 2H), 6.38 (d, J = 15.1 Hz, 2H), 6.09 (s, 1H). 13C NMR (176 MHz, DMSO) δ 182.88, 141.00, 140.34, 136.10, 129.06, 128.87, 127.74, 127.36, 127.25, 101.3. FT-IR (ATR) 3023 cm-1, 2992 cm-1, 2239 cm-1, 1985 cm-1, 1605 cm-1, 1488 cm-1, 1281 cm-1, 1119 cm-1, 993 cm-1, 747 cm-1, 684 cm-1, 502 cm-1, 436 cm-1. MS (ESI+) m/z= 329.9 [M+H]+. Purity 99.85% (HPLC).
Compound 3: Compound 2 (0.400 g, 1.20 mmol) was dissolved in 70 mL of ethyl acetate in a round-bottom flask. Separately, copper (II) acetate (0.1320 g, 0.7 mmol) was dissolved in a methanol-water solution. The resulting solution was added dropwise to the reaction mixture, which was stirred at room temperature for 36 h. The precipitate was filtered and washed with a water–acetone solution (90:10, v/v). Crystallisation was carried out in acetonitrile and acetonitrile-tetrahydrofuran mixture. Brown powder, yield: 90%, decomposition temperature: 269-270 °C. FT-IR (ATR) 3052 cm-1, 3017 cm-1, 1975 cm-1, 1873 cm-1, 1794 cm-1, 1691.05 cm-1, 1612 cm-1, 1599 cm-1, 1505 cm-1, 1435 cm-1, 1130 cm-1, 988 cm-1, 686 cm-1, 544 cm-1, 504 cm-1, 472 cm-1 and 441 cm-1. MS (MALDI-TOF) m/z= 781.538 [M+Cu]+. Purity 100% (HPLC).
Preparation of Association Complexes with β-Cyclodextrin
The formulations with β-cyclodextrin were prepared using a planetary mill ball.
Compounds 2: (0.120 g, 0.365 mmol) or 3 (0.120 g, 0.160 mmol) and β-cyclodextrin (2 equivalents), previously dried in a conventional microwave, were placed in separate zirconia jars with 15 balls (0.5 cm in diameter). The mixtures were subjected to four 30-minute mill cycles at 500 rpm, alternating between clockwise and counterclockwise rotation. The unreacted β-cyclodextrin was removed by extraction with water (10 mL) under stirring for 10 minutes, and the solids were collected by vacuum filtration.
Compound 4: yellow powder, yield 45%, m.p. 281-285 °C. 1H NMR (700 MHz, DMSO) δ 16.06 (br s, 1H), 7.59 (d, J = 7.6 Hz, 4H), 7.45 (t, J = 14.9 Hz, 2H), 7.40 (t, J = 7.6 Hz, 4H), 7.34 (t, J = 7.4 Hz, 2H), 7.17 (t, J = 15.6 Hz, 2H), 7.11 (d, J = 15.5 Hz, 2H), 6.37 (d, J = 15.1 Hz, 2H), 6.09 (s, 1H), 5.71 (d, J = 6.9 Hz, 4H), 5.67 (d, J = 2.55 Hz, 3H), 4.83 (d, J = 3.64 Hz, 3H), 4.44 (t, J = 5.60, 3H), 3.63 (m, 10H), 3.56 (m, 3H), 3.35 (m, 4H), 3.30 (m, 4H). 13C NMR (176 MHz, DMSO) δ 182.89, 141.02, 140.35, 136.10, 129.07, 128.88, 127.74, 127.36, 127.26, 101.93, 101.36, 81.53, 73.03, 72.41, 72.03, 59.90. FT-IR (ATR) 3312 cm-1, 2922 cm-1, 2160 cm-1, 2033 cm-1, 1979 cm-1, 1611 cm-1, 1557 cm-1, 1447 cm-1, 1026 cm-1, 996 cm-1, 749 cm-1, 688 cm-1, 577 cm-1, 505 cm-1, 438 cm-1. Concentration by UV/VIS = 393.60 μg/mg.
Compound 5: brown powder, yield 35%, decomposition temperature = 300 °C, FT-IR (ATR) 3340 cm-1, 3022 cm-1, 2159 cm-1, 1976 cm-1, 1604 cm-1, 1504 cm-1, 1411 cm-1, 1135 cm-1, 1029 cm-1, 988 cm-1, 750 cm-1, 687 cm-1, 504 cm-1, 471 cm-1, 436 cm-1. Concentration by UV/VIS = 685.94 μg/mg.
Antiproliferative Activity
Antiproliferative activity was evaluated by Sulforhodamine B assay against colon cancer (HCT-15), breast cancer (MCF-7), leukemia (K-262 CLM), central nervous system glial (U-251), and prostate cancer (PC-3) cell lines which were supplied by the National Cancer Institute. The cell lines were cultured in RPMI-1640 medium supplemented with 10% fetal bovine serum, 2 mM L-glutamine, 10000 units per mL penicillin G, 100 µg/mL streptomycin sulfate, and 0.25 µg/mL amphotericin B (Gibco). They were incubated at 37°C in an atmosphere of 5% CO2 and 95% humidity. For the assay, cells were suspended in a 0.1% trypsin-EDTA solution (Gibco). Cell viability was counted using a hematocytometer and diluted with medium to achieve the following densities: 5 × 10⁴ cells/mL (SKLU-1, K562) and 7.5 × 10⁴ cells/mL (U251, PC-3). 100 µL/well of the aforementioned cell suspensions were seeded in 96-well plates and incubated at 37°C to allow cell adhesion. A control plate (time zero evaluation) was used, containing the same volumes of each cell line and the target (RPMI-1640 growth medium).
After 24 hours, the cells were treated with 100 µL of the compounds to be evaluated, previously dissolved in RPMI-1640 medium and 1% DMSO, and then incubated for 48 hours at 37°C in a 5% CO2 atmosphere. Only 100 µL of RPMI-1640 culture medium was added to the control plate.
After 48 hours, the adherent cells were fixed by adding 50 µL of a cold 50% (m/vol) trifluoroacetic acid solution and incubated at 4°C for 60 minutes. The supernatant was then removed, washed three times with water, and allowed to dry at room temperature. The trifluoroacetic acid-fixed cells were then treated with 100 µL of a SRB solution (0.4% m/vol in 1% acetic acid) for 30 minutes at room temperature. Unbound SRB was removed with four washes with 1% acetic acid, and bound SRB was extracted with 100 µL of unbuffered 10 mM Tris base. The optical density of the treated samples was determined in a Bio Kinetics microplate reader at a wavelength of 515 nm (Synergy HT, BioTek). The color intensity is directly proportional to the number of live cells.
Inhibition of Yeast α-Glucosidase
The inhibition of α-glucosidase was evaluated using a previously adapted method [79,80]. Briefly, a solution (25 μL) of tested samples in DMSO-H2O 1:1 was added to 150 μL of phosphate buffer (PBS, 67 mM, pH 6.8) and incubated at 37°C for 10 min with 25 μL of reduced glutatione (3 mM in PBS) and 25 µL of of α-glucosidase type I solution(0.2 U/mL in PBS, Sigma CAS G5003-100UN). Subsequently, 25 μL of the substrate solution (23.2 mM p-nitrophenyl-α-D-glucopyranoside, Sigma CAS N1377-1G, in PBS) was added, and the mixture was incubated at 37°C for 15 min under shaking. The reaction mixture was stopped by the addition of a CaCO3 1M solution (50 μL), followed by agitation for 5 min. The optical density was measured at 405 nm, and quercetin was used as a positive standard. The percentage of inhibition was calculated according to the following equation:
where A is the absorbance at 405 nm of sample and control.
Inhibition (%) = [(Acontrol- Asample) / Acontrol]x100.
5. Conclusions
The successful synthesis of a group of extended chain curcuminoid analogues containing eleven carbon atoms as the primary component has been achieved with commendable yields. The alternative use of microwave radiation or reflux demonstrates the effectiveness of these methods in the final stages of the synthesis process. Moreover, we have obtained the crystal structures of ligand 2 and its BF2 complex, as well as those of the first copper complexes, 1 and 3. We also provided the 1H and 13C NMR assignments of compounds 1 and 2 in detail. Notably, the conformational changes of compound 2 are dependent on the solvent, highlighting a degree of flexibility within the unsaturated central chain. All compounds (1-3) exhibit promising optical properties, showing a red shift in maximum absorption and a high extinction coefficient compared to their seven-carbon curcuminoid counterparts. Additionally, we report a formulation of compounds 2 and 3 with BCD, underscoring the effectiveness of the mechanochemical method. Compounds 2 and 3 exhibited moderate/good inhibitory activity against α-glucosidase and were comparable to the positive control. Notably, the formulation of a copper complex with BCD 5 was crucial in enhancing enzyme inhibition activity, highlighting the significance of solubility improvement in these compounds for biological activity evaluation.
Supplementary Materials
The following supporting information can be downloaded at the website of this paper posted on Preprints.org, Figure S1: 1H-NMR spectrum of compound 1 (DMSO-d6, 700 MHz); Figure S2: 13C-NMR spectrum of compound 1 (DMSO-d6, 175 MHz); Figure S3: COSY spectrum of compound 1 (DMSO-d6); Figure S4: HSQC spectrum of compound 1 (DMSO-d6); Figure S5: HMBC spectrum of compound 1 (DMSO-d6); Figure S6: 1H-NMR spectrum of compound 2 (DMSO-d6, 700 MHz); Figure S7: 13C-NMR spectrum of compound 2 (DMSO-d6, 175 MHz); Figure S8: COSY spectrum of compound 2 (DMSO-d6); Figure S9: HSQC spectrum of compound 2 (DMSO-d6); Figure S10: HMBC spectrum of compound 2 (DMSO-d6); Figure S11: NOESY spectrum of compound 2 (DMSO-d6, 700 MHz); Figure S12: 1H-NMR spectrum of compound 2 (CDCl3, 700 MHz); Figure S13: 13C-NMR spectrum of compound 2 (CDCl3, 175 MHz); Figure S14: COSY spectrum of compound 2 (CDCl3); Figure S15: HSQC spectrum of compound 2 (CDCl3); Figure S16: HMBC spectrum of compound 2 (CDCl3); Figure S17: NOESY spectrum of compound 2 (CDCl3, 700 MHz); Figure S18: 1H-NMR spectrum of association complex 4(DMSO-d6, 700 MHz); Figure S19: 13C-NMR spectrum of spectrum of association complex 4 (DMSO-d6, 175 MHz); Figure S20: NOESY spectrum of spectrum of association complex 4 (DMSO-d6, 700 MHz); Figure S21: NOESY spectrum expansion of spectrum of association complex 4 (DMSO-d6, 700 MHz); Figure S22: Electron paramagnetic resonance spectrum of compound 3 (THF); Figure S23: Mass spectrometry spectrum of compound 1 (ESI-); Figure S24: Mass spectrometry spectrum of compound 2 (ESI+); Figure S25: Mass spectrometry spectrum of compound 3 (MALDI-TOF); Figure S26: Mass spectrometry spectrum of compound 3, expansion (MALDI-TOF); Figure S27: Infrared spectrum of compound 1 (ATR); Figure S28: Infrared spectrum of compound 2 (ATR); Figure S29: Infrared spectrum of compound 3 (ATR); Figure S30: Infrared spectrum of spectrum of association complex 4 (ATR); Figure S31: Infrared spectrum of spectrum of association complex 5 (ATR); Figure S32: Infrared spectrum of β-cyclodextrin (ATR); Figure S33: UV-Vis spectrum of compound 2 (DMSO); Figure S34: UV-Vis spectrum of compound 3 (DMSO); Figure S35: UV-Vis spectra of association complexes 4 and 5 in DMSO; Figure S36: HPLC-UV chromatogram of compound 2; Figure S37: HPLC-UV chromatogram of compound 2; Figure S38: 2D-Fingerprint of Hirshfeld surface of compounds 1-3 and percentage of intermolecular interaction contributions in the crystal; Table S1: NOESY correlations of compound 2 in DMSO-d6 and CDCl3 (700 MHz); Table S2: Differences in 1H and 13C chemical shifts of free compound 2 and in complex; Table S3: Differences in 1H and 13C chemical shifts of free BCD and in complex; Table S4: Cellular growth inhibition (%); Table S5: Inhibition of yeast α-glucosidase. Determination of half-maximal inhibitory concentration (IC50); Table S6: Crystal data and structure refinement for 1; Table S7: Atomic coordinates (x104) and equivalent isotropic displacement parameters (Å2x 10³) for 1: U(eq) is defined as one third of the trace of the orthogonalized Uij tensor; Table S8: Bond lengths [Å] and angles [°] for 1; Table S9: Anisotropic displacement parameters (Å2x 10³) for 1. The anisotropic displacement factor exponent takes the form: -2π2[ h2 a*2U11 + ... + 2hka* b* U12]; Table S10: Hydrogen coordinates (x104) and isotropic displacement parameters (Å2x 10 3) for 1; Table S11: Crystal data and structure refinement for 2; Table S12. Atomic coordinates (x104) and equivalent isotropic displacement parameters (Å2x 10³) for 2. U(eq) is defined as one third of the trace of the orthogonalized Uij tensor; Table S13: Bond lengths [Å] and angles [°] for 2; Table S14: Anisotropic displacement parameters (Å2x 10³) for 2. The anisotropic displacement factor exponent takes the form: -2π2[ h2 a*2U11 + ... + 2 h k a* b* U12]; Table S15: Hydrogen coordinates (x 104) and isotropic displacement parameters (Å2x 10³) for 2; Table S16: Hydrogen bonds for 1 [Å and °]; Table S17: Crystal data and structure refinement for 3: Table S18: Atomic coordinates (x104) and equivalent isotropic displacement parameters (Å2x 10³) for 3. U(eq) is defined as one third of the trace of the orthogonalized Uij tensor; Table S19: Bond lengths [Å] and angles [°] for 3; Table S20: Anisotropic displacement parameters (Å2x 10³) for 3. The anisotropic displacement factor exponent takes the form: -2π2[ h2 a*2U11 + ... + 2 h k a* b* U12]; Table S21: Hydrogen coordinates (x104) and isotropic displacement parameters (Å2x 10³) for 3. The crystallographic data of compounds 1-3 were deposited in the CCDC with numbers 2483475-2483477, https://www.ccdc.cam.ac.uk/.
Author Contributions
The following statements should be used “Conceptualisation, R.G.H., R.T.-H. and M.A.O.-M.; methodology, R.T.-H. and R.S.-O.; formal analysis, R.T.-H. and M.A.O.-M.; investigation R.T.-H., R.S.-O., M.T.R.-A, A.N.-C , R.G.E.; resources, R.G.E.; writing—original draft preparation, R.T.-H.; writing—review and editing, R.T.-H., M.A.O.-M., L.L.P.-G., R.G.E.; supervision, R.G.E.; project administration, R.G.E.; funding acquisition, R.G.E. All authors have read and agreed to the published version of the manuscript.”
Funding
This research was funded by CONAHCyT-FOINS-PRONACES 307152 and PAPIIT DGAPA, UNAM, IT202125.
Acknowledgments
R.T.-H. is thankful for a post-doctoral fellowship (CVU 662794) from Secretaría de Ciencia, Humanidades, Tecnología e Innovación (SECIHTI) and Universidad Nacional Autónoma de México, Instituto de Química, UNAM. M.A.O.-M. CVU 599367 is thankful to SECIHTI. L.L.P.-G is thankful for a doctoral scholarship to SECIHTI CVU 1234478 and Programa de Maestría y Doctorado en Ciencias Químicas, UNAM. The authors are grateful to: Simón Hernández-Ortega, Virginia Gómez Vidales, Martha Elena García Aguilera, María de los Ángeles Peña González, Isabel Chávez, Rubén Gaviño Ramírez, Adriana Romo Pérez, Eréndira García, Lucero Ríos, and Jorge Jesús Villa Rivera for technical assistance. Authors acknowledge to IA (Grammarly IA) for improving the clarity and grammar of this manuscript. The results, analysis, and conclusions are made by the authors.
Conflicts of Interest
The authors declare no conflicts of interest.
Abbreviations
The following abbreviations are used in this manuscript:
| NOESY | Nuclear Overhauser Effect Spectroscopy |
| NMR | Nuclear magnetic resonance |
| FT-IR | Fourier Transform Infrared spectroscopy |
| UV-Vis | Ultraviolet-Visible spectroscopy |
| BDC | β-Cyclodextrin |
| ORTEP | Oak Ridge Thermal Ellipsoid Plot |
| RMS | Root Mean Square |
| CCDC | Cambridge Crystallographic Data Centre |
| MS | Mass Spectrometry |
References
- Mir, R.H.; Mohi-ud-din, R.; Mir, P.A.; Shah, A.J.; Banday, N.; Sabreen, S.; Maqbool, M.; Jan, R.; Shafi, N.; Masoodi, M.H. Chapter 9 - Curcumin as a Privileged Scaffold Molecule for Various Biological Targets in Drug Development. In Studies in Natural Products Chemistry; Atta-ur-Rahman, Ed.; Elsevier, 2022; Vol. 73, pp. 405–434 ISBN 1572-5995.
- Yang, H.; Zeng, F.; Luo, Y.; Zheng, C.; Ran, C.; Yang, J. Curcumin Scaffold as a Multifunctional Tool for Alzheimer’s Disease Research. Molecules 2022, 27, 3879. [CrossRef]
- Li, S.; Yuan, W.; Deng, G.; Wang, P.; Yang, P.; Aggarwal, B.B. Chemical Composition and Product Quality Control of Turmeric (Curcuma Longa L.). Pharm. Crops 2011, 5, 28–54. [CrossRef]
- Inoue, K.; Nomura, C.; Ito, S.; Nagatsu, A.; Hino, T.; Oka, H. Purification of Curcumin, Demethoxycurcumin, and Bisdemethoxycurcumin by High-Speed Countercurrent Chromatography. J. Agric. Food Chem. 2008, 56, 9328–9336. [CrossRef]
- Huang, C.; Lu, H.-F.; Chen, Y.-H.; Chen, J.-C.; Chou, W.-H.; Huang, H.-C. Curcumin, Demethoxycurcumin, and Bisdemethoxycurcumin Induced Caspase-Dependent and –Independent Apoptosis via Smad or Akt Signaling Pathways in HOS Cells. BMC Complement Med Ther 2020, 20, 68. [CrossRef]
- Ramsewak, R.S.; DeWitt, D.L.; Nair, M.G. Cytotoxicity, Antioxidant and Anti-Inflammatory Activities of Curcumins I–III from Curcuma Longa. Phytomedicine 2000, 7, 303–308. [CrossRef]
- Guo, L.Y.; Cai, X.F.; Lee, J.J.; Kang, S.S.; Shin, E.M.; Zhou, H.Y.; Jung, J.W.; Kim, Y.S. Comparison of Suppressive Effects of Demethoxycurcumin and Bisdemethoxycurcumin on Expressions of Inflammatory Mediators In Vitro and In Vivo. Arch. Pharm. Res. 2008, 31, 490–496. [CrossRef]
- Hung, S.-J.; Hong, Y.-A.; Lin, K.-Y.; Hua, Y.-W.; Kuo, C.-J.; Hu, A.; Shih, T.-L.; Chen, H.-P. Efficient Photodynamic Killing of Gram-Positive Bacteria by Synthetic Curcuminoids. IJMS 2020, 21, 9024. [CrossRef]
- Den Hartogh, D.J.; Gabriel, A.; Tsiani, E. Antidiabetic Properties of Curcumin II: Evidence from In Vivo Studies. Nutrients 2019, 12, 58. [CrossRef]
- Amalraj, A.; Pius, A.; Gopi, S.; Gopi, S. Biological Activities of Curcuminoids, Other Biomolecules from Turmeric and Their Derivatives – A Review. J. Tradit. Complement. Med. 2017, 7, 205–233. [CrossRef]
- Zhang, H.A.; Kitts, D.D. Turmeric and Its Bioactive Constituents Trigger Cell Signaling Mechanisms That Protect against Diabetes and Cardiovascular Diseases. Mol Cell Biochem 2021, 476, 3785–3814. [CrossRef]
- Bhagat, K.K.; Cheke, R.S.; Gavali, V.D.; Kharkar, P.S.; Arote, N.D. A Brief Review on Metal-Curcumin Complexes: Synthesis Approaches and Their Pharmaceutical Applications. Discov. Chem. 2025, 2, 119. [CrossRef]
- Liu, Y.; Zhang, C.; Pan, H.; Li, L.; Yu, Y.; Liu, B. An Insight into the in Vivo Imaging Potential of Curcumin Analogues as Fluorescence Probes. Asian J. Pharm. Sci. 2021, 16, 419–431. [CrossRef]
- Bai, G.; Yu, C.; Cheng, C.; Hao, E.; Wei, Y.; Mu, X.; Jiao, L. Syntheses and Photophysical Properties of BF2 Complexes of Curcumin Analogues. Org. Biomol. Chem. 2014, 12, 1618–1626. [CrossRef]
- Xu, G.; Wang, J.; Liu, T.; Wang, M.; Zhou, S.; Wu, B.; Jiang, M. Synthesis and Crystal Structure of a Novel Copper( ii ) Complex of Curcumin-Type and Its Application in in Vitro and in Vivo Imaging. J. Mater. Chem. B 2014, 2, 3659–3666. [CrossRef]
- Festa, R.A.; Thiele, D.J. Copper: An Essential Metal in Biology. Curr Biol 2011, 21, R877-883. [CrossRef]
- Esmaeili, L.; Perez, M.G.; Jafari, M.; Paquin, J.; Ispas-Szabo, P.; Pop, V.; Andruh, M.; Byers, J.; Mateescu, M.A. Copper Complexes for Biomedical Applications: Structural Insights, Antioxidant Activity and Neuron Compatibility. J. Inorg. Biochem. 2019, 192, 87–97. [CrossRef]
- Ashraf, J.; Riaz, M.A. Biological Potential of Copper Complexes: A Review. Turk. J. Chem. 2022, 46, 595–623. [CrossRef]
- Shoair, A.F.; El-Bindary, A.A.; El-Ghamaz, N.A.; Rezk, G.N. Synthesis, Characterization, DNA Binding and Antitumor Activities of Cu(II) Complexes. J. Mol. Liq. 2018, 269, 619–638. [CrossRef]
- Choroba, K.; Machura, B.; Erfurt, K.; Casimiro, A.R.; Cordeiro, S.; Baptista, P.V.; Fernandes, A.R. Copper(II) Complexes with 2,2′:6′,2″-Terpyridine Derivatives Displaying Dimeric Dichloro−μ–Bridged Crystal Structure: Biological Activities from 2D and 3D Tumor Spheroids to In Vivo Models. J. Med. Chem. 2024, 67, 5813–5836. [CrossRef]
- Ngece, K.; Khwaza, V.; Paca, A.M.; Aderibigbe, B.A. The Antimicrobial Efficacy of Copper Complexes: A Review. Antibiotics 2025, 14, 516. [CrossRef]
- Meza-Morales, W.; Machado-Rodriguez, J.C.; Alvarez-Ricardo, Y.; Obregón-Mendoza, M.A.; Nieto-Camacho, A.; Toscano, Rubén.A.; Soriano-García, M.; Cassani, J.; Enríquez, R.G. A New Family of Homoleptic Copper Complexes of Curcuminoids: Synthesis, Characterization and Biological Properties. Molecules 2019, 24, 910. [CrossRef]
- Sohrabi, M.; Binaeizadeh, M.R.; Iraji, A.; Larijani, B.; Saeedi, M.; Mahdavi, M. A Review on α-Glucosidase Inhibitory Activity of First Row Transition Metal Complexes: A Futuristic Strategy for Treatment of Type 2 Diabetes. RSC Adv. 2022, 12, 12011–12052. [CrossRef]
- Dirir, A.M.; Daou, M.; Yousef, A.F.; Yousef, L.F. A Review of Alpha-Glucosidase Inhibitors from Plants as Potential Candidates for the Treatment of Type-2 Diabetes. Phytochem Rev 2022, 21, 1049–1079. [CrossRef]
- Gong, L.; Feng, D.; Wang, T.; Ren, Y.; Liu, Y.; Wang, J. Inhibitors of A-amylase and A-glucosidase: Potential Linkage for Whole Cereal Foods on Prevention of Hyperglycemia. Food Sci. Nutr. 2020, 8, 6320–6337. [CrossRef]
- Du, Z.; Liu, R.; Shao, W.; Mao, X.; Ma, L.; Gu, L.; Huang, Z.; Chan, A.S.C. α-Glucosidase Inhibition of Natural Curcuminoids and Curcumin Analogs. Eur. J. Med. Chem. 2006, 41, 213–218. [CrossRef]
- Mehrabi, M.; Esmaeili, S.; Ezati, M.; Abassi, M.; Rasouli, H.; Nazari, D.; Adibi, H.; Khodarahmi, R. Antioxidant and Glycohydrolase Inhibitory Behavior of Curcumin-Based Compounds: Synthesis and Evaluation of Anti-Diabetic Properties in Vitro. Bioorg. Chem. 2021, 110, 104720. [CrossRef]
- Liu, Y.; Zhu, J.; Yu, J.; Chen, X.; Zhang, S.; Cai, Y.; Li, L. Curcumin as a Mild Natural A-glucosidase Inhibitor: A Study on Its Mechanism in Vitro. Int J of Food Sci Tech 2022, 57, 2689–2700. [CrossRef]
- Arenaza-Corona, A.; Obregón-Mendoza, M.A.; Meza-Morales, W.; Ramírez-Apan, M.T.; Nieto-Camacho, A.; Toscano, R.A.; Pérez-González, L.L.; Sánchez-Obregón, R.; Enríquez, R.G. The Homoleptic Curcumin–Copper Single Crystal (ML2): A Long Awaited Breakthrough in the Field of Curcumin Metal Complexes. Molecules 2023, 28, 6033. [CrossRef]
- Cai, L.; Du, H.; Wang, D.; Lyu, H.; Wang, D. Synthesis and Photophysical Properties of Ditrifluoroacetoxyboron Complexes with Curcumin Analogues. Spectrochim. Acta A Mol. Biomol. Spectrosc. 2021, 249, 119297. [CrossRef]
- Lyu, H.; Wang, D.; Cai, L.; Wang, D.-J.; Li, X.-M. Synthesis, Photophysical and Solvatochromic Properties of Diacetoxyboron Complexes with Curcumin Derivatives. Spectrochim. Acta A Mol. Biomol. Spectrosc. 2019, 220, 117126. [CrossRef]
- Tahay, P.; Parsa, Z.; Zamani, P.; Safari, N. A Structural and Optical Study of Curcumin and Curcumin Analogs. J. Iran. Chem. Soc. 2022, 19, 3177–3188. [CrossRef]
- Kazantzis, K.T.; Koutsonikoli, K.; Mavroidi, B.; Zachariadis, M.; Alexiou, P.; Pelecanou, M.; Politopoulos, K.; Alexandratou, E.; Sagnou, M. Curcumin Derivatives as Photosensitizers in Photodynamic Therapy: Photophysical Properties and in Vitro Studies with Prostate Cancer Cells. Photochem Photobiol Sci 2020, 19, 193–206. [CrossRef]
- Urošević, M.; Nikolić, L.; Gajić, I.; Nikolić, V.; Dinić, A.; Miljković, V. Curcumin: Biological Activities and Modern Pharmaceutical Forms. Antibiotics 2022, 11, 135. [CrossRef]
- Tønnesen, H.H.; Másson, M.; Loftsson, T. Studies of Curcumin and Curcuminoids. XXVII. Cyclodextrin Complexation: Solubility, Chemical and Photochemical Stability. Int. J. Pharm 2002, 244, 127–135. [CrossRef]
- Arruda, T.R.; Marques, C.S.; Soares, N.F.F. Native Cyclodextrins and Their Derivatives as Potential Additives for Food Packaging: A Review. Polysaccharides 2021, 2, 825–842. [CrossRef]
- Del Valle, E.M.M. Cyclodextrins and Their Uses: A Review. Process Biochem 2004, 39, 1033–1046. [CrossRef]
- Karunakaran, C.; Balamurugan, M.; Karthikeyan, M. Applications of Electron Paramagnetic Resonance. In Spin Resonance Spectroscopy; Elsevier, 2018; pp. 281–347 ISBN 978-0-12-813608-9.
- Łabanowska, M.; Bidzińska, E.; Para, A.; Kurdziel, M. EPR Investigation of Cu(II)-Complexes with Nitrogen Derivatives of Dialdehyde Starch. Carbohydr. Polym. 2012, 87, 2605–2613. [CrossRef]
- Barik, A.; Mishra, B.; Shen, L.; Mohan, H.; Kadam, R.M.; Dutta, S.; Zhang, H.-Y.; Priyadarsini, K.I. Evaluation of a New Copper(II)–Curcumin Complex as Superoxide Dismutase Mimic and Its Free Radical Reactions. Free Radic. Biol. Med 2005, 39, 811–822. [CrossRef]
- Gál, E.; Nagy, L.C. Photophysical Properties and Electronic Structure of Symmetrical Curcumin Analogues and Their BF2 Complexes, Including a Phenothiazine Substituted Derivative. Symmetry 2021, 13, 2299. [CrossRef]
- Feddaoui, I.; Abdelbaky, M.S.M.; García-Granda, S.; Essalah, K.; Ben Nasr, C.; Mrad, M.L. Synthesis, Crystal Structure, Vibrational Spectroscopy, DFT, Optical Study and Thermal Analysis of a New Stannate(IV) Complex Based on 2-Ethyl-6-Methylanilinium (C9H14N)2[SnCl6]. J. Mol. Struct. 2019, 1186, 31–38. [CrossRef]
- Li, S.; Bu, R.; Gou, R.; Zhang, C. Hirshfeld Surface Method and Its Application in Energetic Crystals. Cryst. Growth Des. 2021, 21, 6619–6634. [CrossRef]
- Surface Properties | CrystalExplorer Available online: https://crystalexplorer.net/docs/manual/isosurfaces/properties/ (accessed on 17 July 2025).
- Schneider, H.-J.; Hacket, F.; Rüdiger, V.; Ikeda, H. NMR Studies of Cyclodextrins and Cyclodextrin Complexes. Chem. Rev. 1998, 98, 1755–1786. [CrossRef]
- Han, W.; You, J.; Li, H.; Zhao, D.; Nie, J.; Wang, T. Curcuminoid-Based Difluoroboron Dyes as High-Performance Photosensitizers in Long-Wavelength (Yellow and Red) Cationic Photopolymerization. Macromol. Rapid Commun. 2019, 40, 1900291. [CrossRef]
- Kaur, K.; Al-Khazaleh, A.K.; Bhuyan, D.J.; Li, F.; Li, C.G. A Review of Recent Curcumin Analogues and Their Antioxidant, Anti-Inflammatory, and Anticancer Activities. Antioxidants 2024, 13, 1092. [CrossRef]
- Kuzminska, J.; Szyk, P.; Mlynarczyk, D.T.; Bakun, P.; Muszalska-Kolos, I.; Dettlaff, K.; Sobczak, A.; Goslinski, T.; Jelinska, A. Curcumin Derivatives in Medicinal Chemistry: Potential Applications in Cancer Treatment. Molecules 2024, 29, 5321. [CrossRef]
- Sobornova, V.V.; Belov, K.V.; Krestyaninov, M.A.; Khodov, I.A. Influence of Solvent Polarity on the Conformer Ratio of Bicalutamide in Saturated Solutions: Insights from NOESY NMR Analysis and Quantum-Chemical Calculations. IJMS 2024, 25, 8254. [CrossRef]
- Leow, P.-C.; Bahety, P.; Boon, C.P.; Lee, C.Y.; Tan, K.L.; Yang, T.; Ee, P.-L.R. Functionalized Curcumin Analogs as Potent Modulators of the Wnt/β-Catenin Signaling Pathway. Eur. J. Med. Chem 2014, 71, 67–80. [CrossRef]
- Lutskii, A.E.; Kotelevskii, N.M.; Osipov, O.A.; Zamaraev, K.I. Effect of Solvent on EPR Spectra of Cu(II) Complexes. Theor Exp Chem 1971, 4, 296–300. [CrossRef]
- Kamada, K.; Namikawa, T.; Senatore, S.; Matthews, C.; Lenne, P.; Maury, O.; Andraud, C.; Ponce-Vargas, M.; Le Guennic, B.; Jacquemin, D.; et al. Boron Difluoride Curcuminoid Fluorophores with Enhanced Two-Photon Excited Fluorescence Emission and Versatile Living-Cell Imaging Properties. Chem. – Eur. J. 2016, 22, 5219–5232. [CrossRef]
- Ferreira, J.R.M.; Alves, M.; Sousa, B.; Vieira, S.I.; Silva, A.M.S.; Guieu, S.; Cunha, Â.; Nunes da Silva, R. Curcumin-Based Molecular Probes for Fluorescence Imaging of Fungi. Org. Biomol. Chem. 2023, 21, 1531–1536. [CrossRef]
- Weiss, H.; Reichel, J.; Görls, H.; Schneider, K.R.A.; Micheel, M.; Pröhl, M.; Gottschaldt, M.; Dietzek, B.; Weigand, W. Curcuminoid–BF2 Complexes: Synthesis, Fluorescence and Optimization of BF2 Group Cleavage. Beilstein J. Org. Chem. 2017, 13, 2264–2272. [CrossRef]
- Bessho, T.; Constable, E.C.; Graetzel, M.; Hernandez Redondo, A.; Housecroft, C.E.; Kylberg, W.; Nazeeruddin, Md.K.; Neuburger, M.; Schaffner, S. An Element of Surprise—Efficient Copper-Functionalized Dye-Sensitized Solar Cells. Chem. Commun. 2008, 3717. [CrossRef]
- Abbo, H.; Ashfaq, M.; Feizi-Dehnayebi, M.; Titinchi, S. Asymmetrical Curcumin Derivative: Synthesis, Structural Exploration, Hirshfeld Surface Analysis, and Computational Study. Struct Chem 2025. [CrossRef]
- Meza-Morales, W.; Alvarez-Ricardo, Y.; Obregón-Mendoza, M.A.; Arenaza-Corona, A.; Ramírez-Apan, M.T.; Toscano, R.A.; Poveda-Jaramillo, J.C.; Enríquez, R.G. Three New Coordination Geometries of Homoleptic Zn Complexes of Curcuminoids and Their High Antiproliferative Potential. RSC Adv. 2023, 13, 8577–8585. [CrossRef]
- Zhao, R.; Tan, T.; Sandström, C. NMR Studies on Puerarin and Its Interaction with Beta-Cyclodextrin. J Biol Phys 2011, 37, 387–400. [CrossRef]
- Maheshwari, A.; Sharma, M.; Sharma, D. Complexation of Sodium Picosulphate with Beta Cyclodextrin: NMR Spectroscopic Study in Solution. J Incl Phenom Macrocycl Chem 2013, 77, 337–342. [CrossRef]
- Jiang, H.; Sun, H.; Zhang, S.; Hua, R.; Xu, Y.; Jin, S.; Gong, H.; Li, L. NMR Investigations of Inclusion Complexes between β-Cyclodextrin and Naphthalene/Anthraquinone Derivatives. J Incl Phenom Macrocycl Chem 2007, 58. [CrossRef]
- Saha, S.; Roy, A.; Roy, K.; Roy, M.N. Study to Explore the Mechanism to Form Inclusion Complexes of β-Cyclodextrin with Vitamin Molecules. Sci Rep 2016, 6. [CrossRef]
- Rachmawati, H.; Edityaningrum, C.A.; Mauludin, R. Molecular Inclusion Complex of Curcumin–β-Cyclodextrin Nanoparticle to Enhance Curcumin Skin Permeability from Hydrophilic Matrix Gel. AAPS PharmSciTech 2013, 14, 1303–1312. [CrossRef]
- Sambasevam, K.; Mohamad, S.; Sarih, N.; Ismail, N. Synthesis and Characterization of the Inclusion Complex of β-Cyclodextrin and Azomethine. IJMS 2013, 14, 3671–3682. [CrossRef]
- Yuan, H.; Peng, Q.; Yongwei, W.; Dongsheng, Z.; Mingwan, Z.; Rui, L.; Nan, J. Host-Guest Interaction of β-Cyclodextrin with Isomeric Ursolicacid and Oleanolic Acid: Physicochemical Characterization Andmolecular Modeling Study. J Biomed Res 2017, 31, 395. [CrossRef]
- alizadeh, N.; Poorbagher, N. Host-Guest Inclusion Complexes of Sulfabenzamide with β- and Methyl-β-Cyclodextrins: Characterization, Antioxidant Activity and DFT Calculation. J. Mol. Struct. 2022, 1260, 132809. [CrossRef]
- Nguyen, A.-T.; Pham, M.Q.; Nguyen, P.-H.; To, D.C.; Dang, N.Q.; Nguyen, T.-H.; Nguyen, H.-T.; Nguyen, T.-D.; Thi Pham, K.-H.; Tran, M.-H. Identification of Natural Curcumins as Potential Dual Inhibitors of PTP1B and α-Glucosidase through Experimental and Computational Study. Kuwait J. Sci. 2025, 52, 100312. [CrossRef]
- Yoshikawa, Y.; Hirata, R.; Yasui, H.; Hattori, M.; Sakurai, H. Inhibitory Effect of CuSO4 on α-Glucosidase Activity in DdY Mice. Metallomics 2010, 2, 67–73. [CrossRef]
- Malik, N.P.; Ashiq, U.; Jamal, R.A.; Gul, S.; Lateef, M. Design, Synthesis, In Vitro and In Silico Alpha Glucosidase and Lipoxygenase Inhibition Studies of Copper(II) Oxamide Complexes. Chem. Select 2024, 9, e202400398. [CrossRef]
- Peng, X.; Liu, K.; Hu, X.; Gong, D.; Zhang, G. Hesperetin-Cu(II) Complex as Potential α-Amylase and α-Glucosidase Inhibitor: Inhibition Mechanism and Molecular Docking. Spectrochim. Acta A Mol. Biomol. Spectrosc. 2023, 290, 122301. [CrossRef]
- MestReNova 2020.
- Sheldrick, G.M. A Short History of SHELX. Acta Crystallogr. A 2008, 64, 112–122. [CrossRef]
- Sheldrick, G.M. Crystal Structure Refinement with SHELXL. Acta Crystallogr C Struct Chem 2015, 71, 3–8. [CrossRef]
- Macrae, C.F.; Sovago, I.; Cottrell, S.J.; Galek, P.T.A.; McCabe, P.; Pidcock, E.; Platings, M.; Shields, G.P.; Stevens, J.S.; Towler, M.; et al. Mercury 4.0 : From Visualization to Analysis, Design and Prediction. J Appl Crystallogr 2020, 53, 226–235. [CrossRef]
- Dolomanov, O.V.; Bourhis, L.J.; Gildea, R.J.; Howard, J.A.K.; Puschmann, H. OLEX2 : A Complete Structure Solution, Refinement and Analysis Program. J Appl Crystallogr 2009, 42, 339–341. [CrossRef]
- Spackman, P.R.; Turner, M.J.; McKinnon, J.J.; Wolff, S.K.; Grimwood, D.J.; Jayatilaka, D.; Spackman, M.A. CrystalExplorer : A Program for Hirshfeld Surface Analysis, Visualization and Quantitative Analysis of Molecular Crystals. J Appl Crystallogr 2021, 54, 1006–1011. [CrossRef]
- Obregón-Mendoza, M.A.; Meza-Morales, W.; Alvarez-Ricardo, Y.; Estévez-Carmona, M.M.; Enríquez, R.G. High Yield Synthesis of Curcumin and Symmetric Curcuminoids: A “Click” and “Unclick” Chemistry Approach. Molecules 2022, 28, 289. [CrossRef]
- Laali, K.K.; Rathman, B.M.; Bunge, S.D.; Qi, X.; Borosky, G.L. Fluoro-Curcuminoids and Curcuminoid-BF2 Adducts: Synthesis, X-Ray Structures, Bioassay, and Computational/Docking Study. J. Fluor. Chem. 2016, 191, 29–41. [CrossRef]
- Abonia, R.; Laali, K.K.; Raja Somu, D.; Bunge, S.D.; Wang, E.C. A Flexible Strategy for Modular Synthesis of Curcuminoid-BF2 /Curcuminoid Pairs and Their Comparative Antiproliferative Activity in Human Cancer Cell Lines. ChemMedChem 2020, 15, 354–362. [CrossRef]
- Zhou, T.; Zhang, S.; Liu, S.; Cong, H.; Xuan, L. Daphnodorin Dimers from Edgeworthia Chrysantha with α-Glucosidase Inhibitory Activity. Phytochem. Lett. 2010, 3, 242–247. [CrossRef]
- Ye, X.-P.; Song, C.-Q.; Yuan, P.; Mao, R.-G. α-Glucosidase and α-Amylase Inhibitory Activity of Common Constituents from Traditional Chinese Medicine Used for Diabetes Mellitus. Chin. J. Nat. Med. 2010, 8, 349–352. [CrossRef]
Scheme 1.
Reaction conditions in the synthesis of curcuminoid analogue (2) and its homoleptic copper complex (3).
Scheme 1.
Reaction conditions in the synthesis of curcuminoid analogue (2) and its homoleptic copper complex (3).
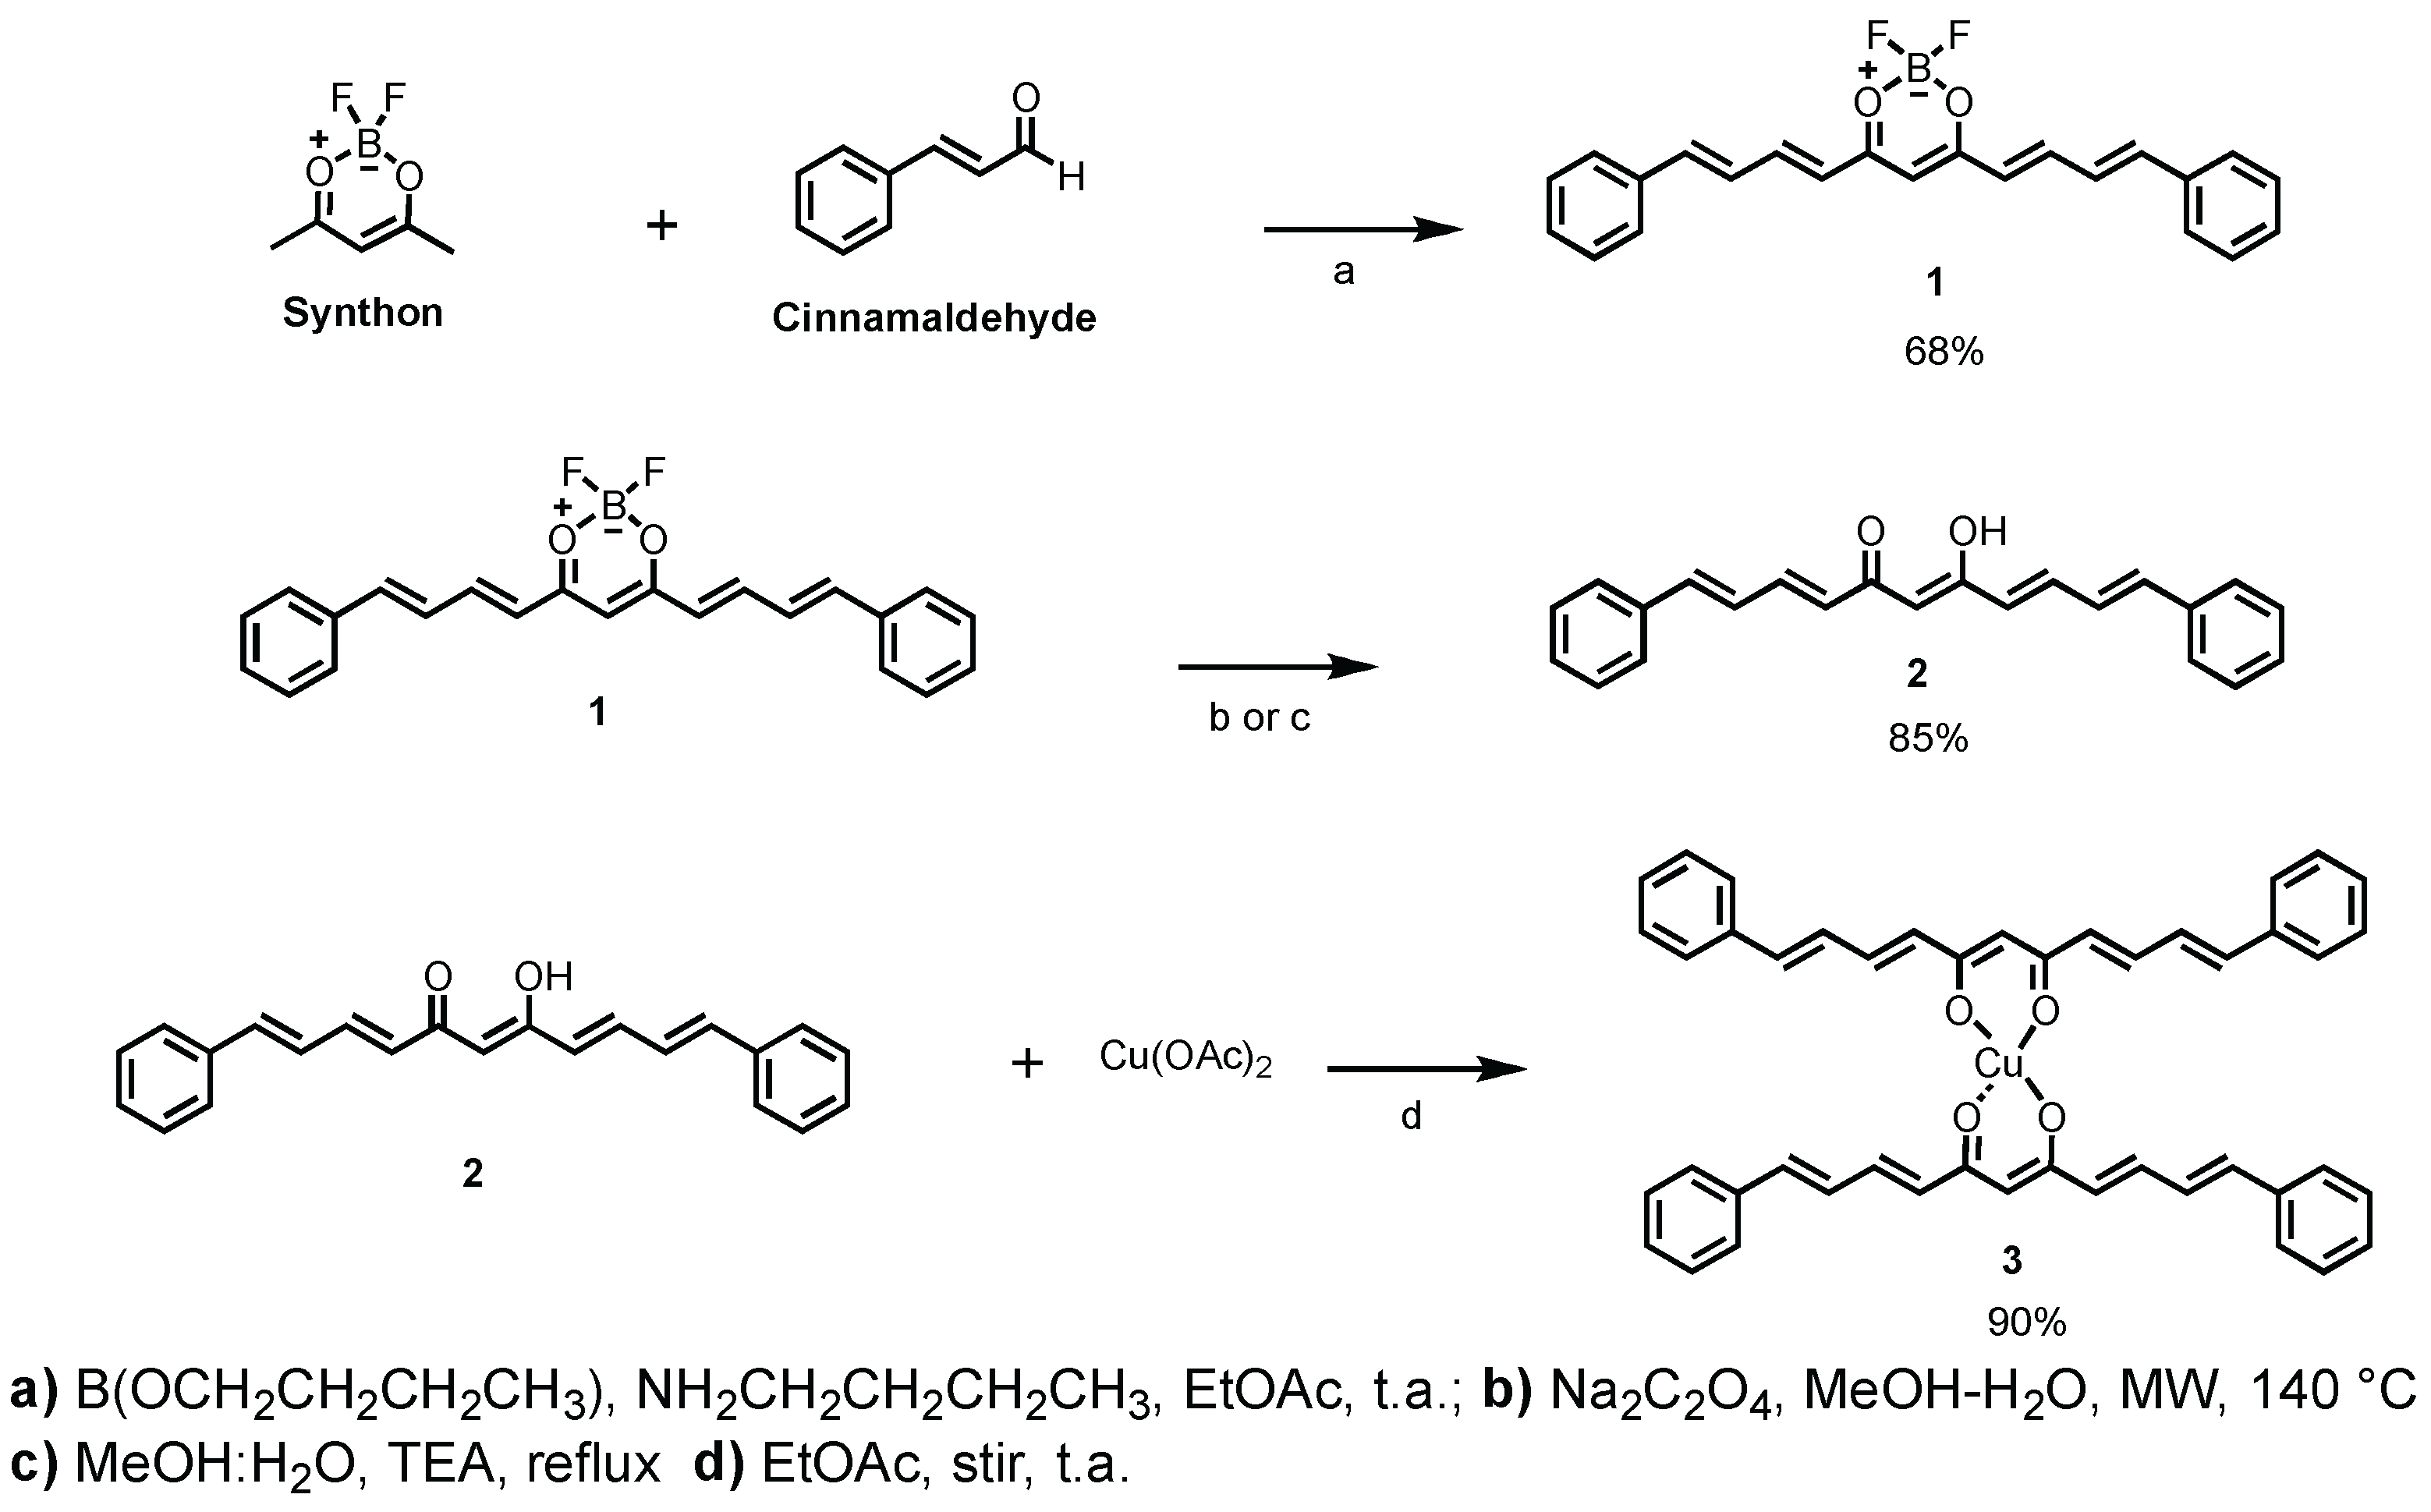
Figure 1.
700 MHz 1H-NMR spectra of a) curcuminoid-BF2 1 in CDCl3; b) curcuminoid analogue 2 in DMSO-d6 and c) compound 2 in CDCl3.
Figure 1.
700 MHz 1H-NMR spectra of a) curcuminoid-BF2 1 in CDCl3; b) curcuminoid analogue 2 in DMSO-d6 and c) compound 2 in CDCl3.
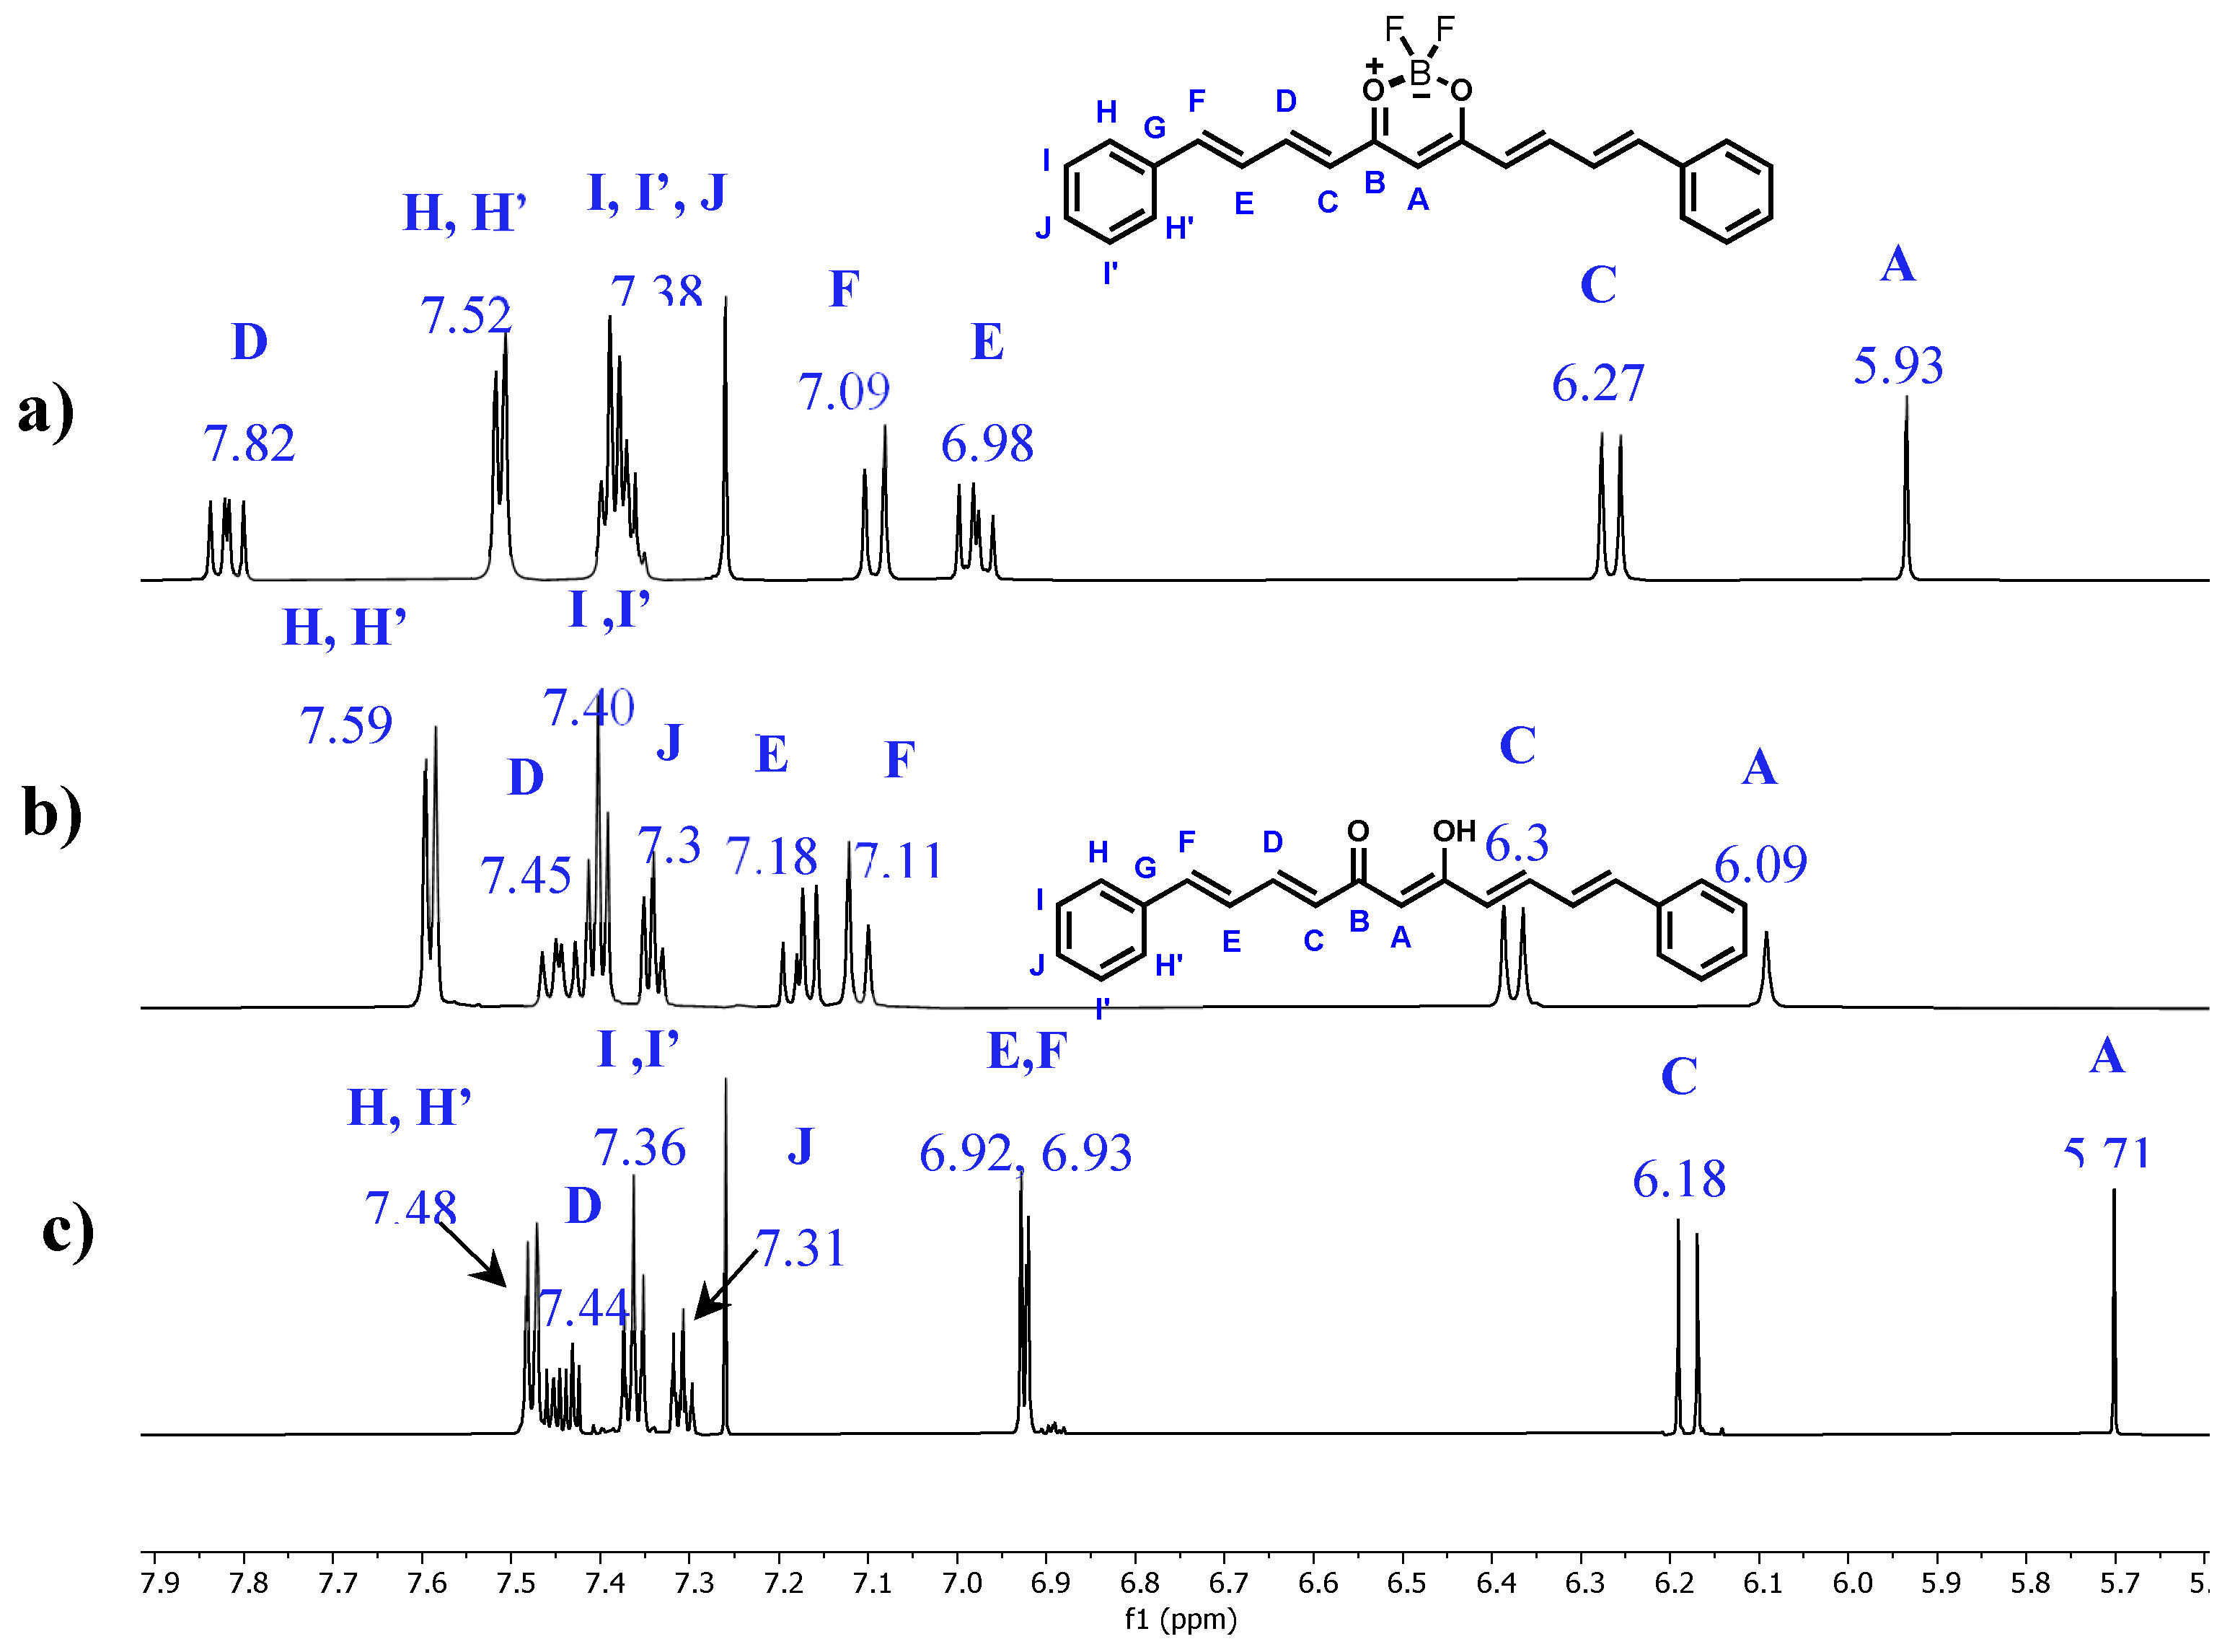
Figure 2.
a) Absorbance and b) emission spectra of curcuminoid analogue-BF2 (1) (purple), analogue curcuminoid (2) (orange), and copper (II) complex (3) (brown) in DMSO.
Figure 2.
a) Absorbance and b) emission spectra of curcuminoid analogue-BF2 (1) (purple), analogue curcuminoid (2) (orange), and copper (II) complex (3) (brown) in DMSO.
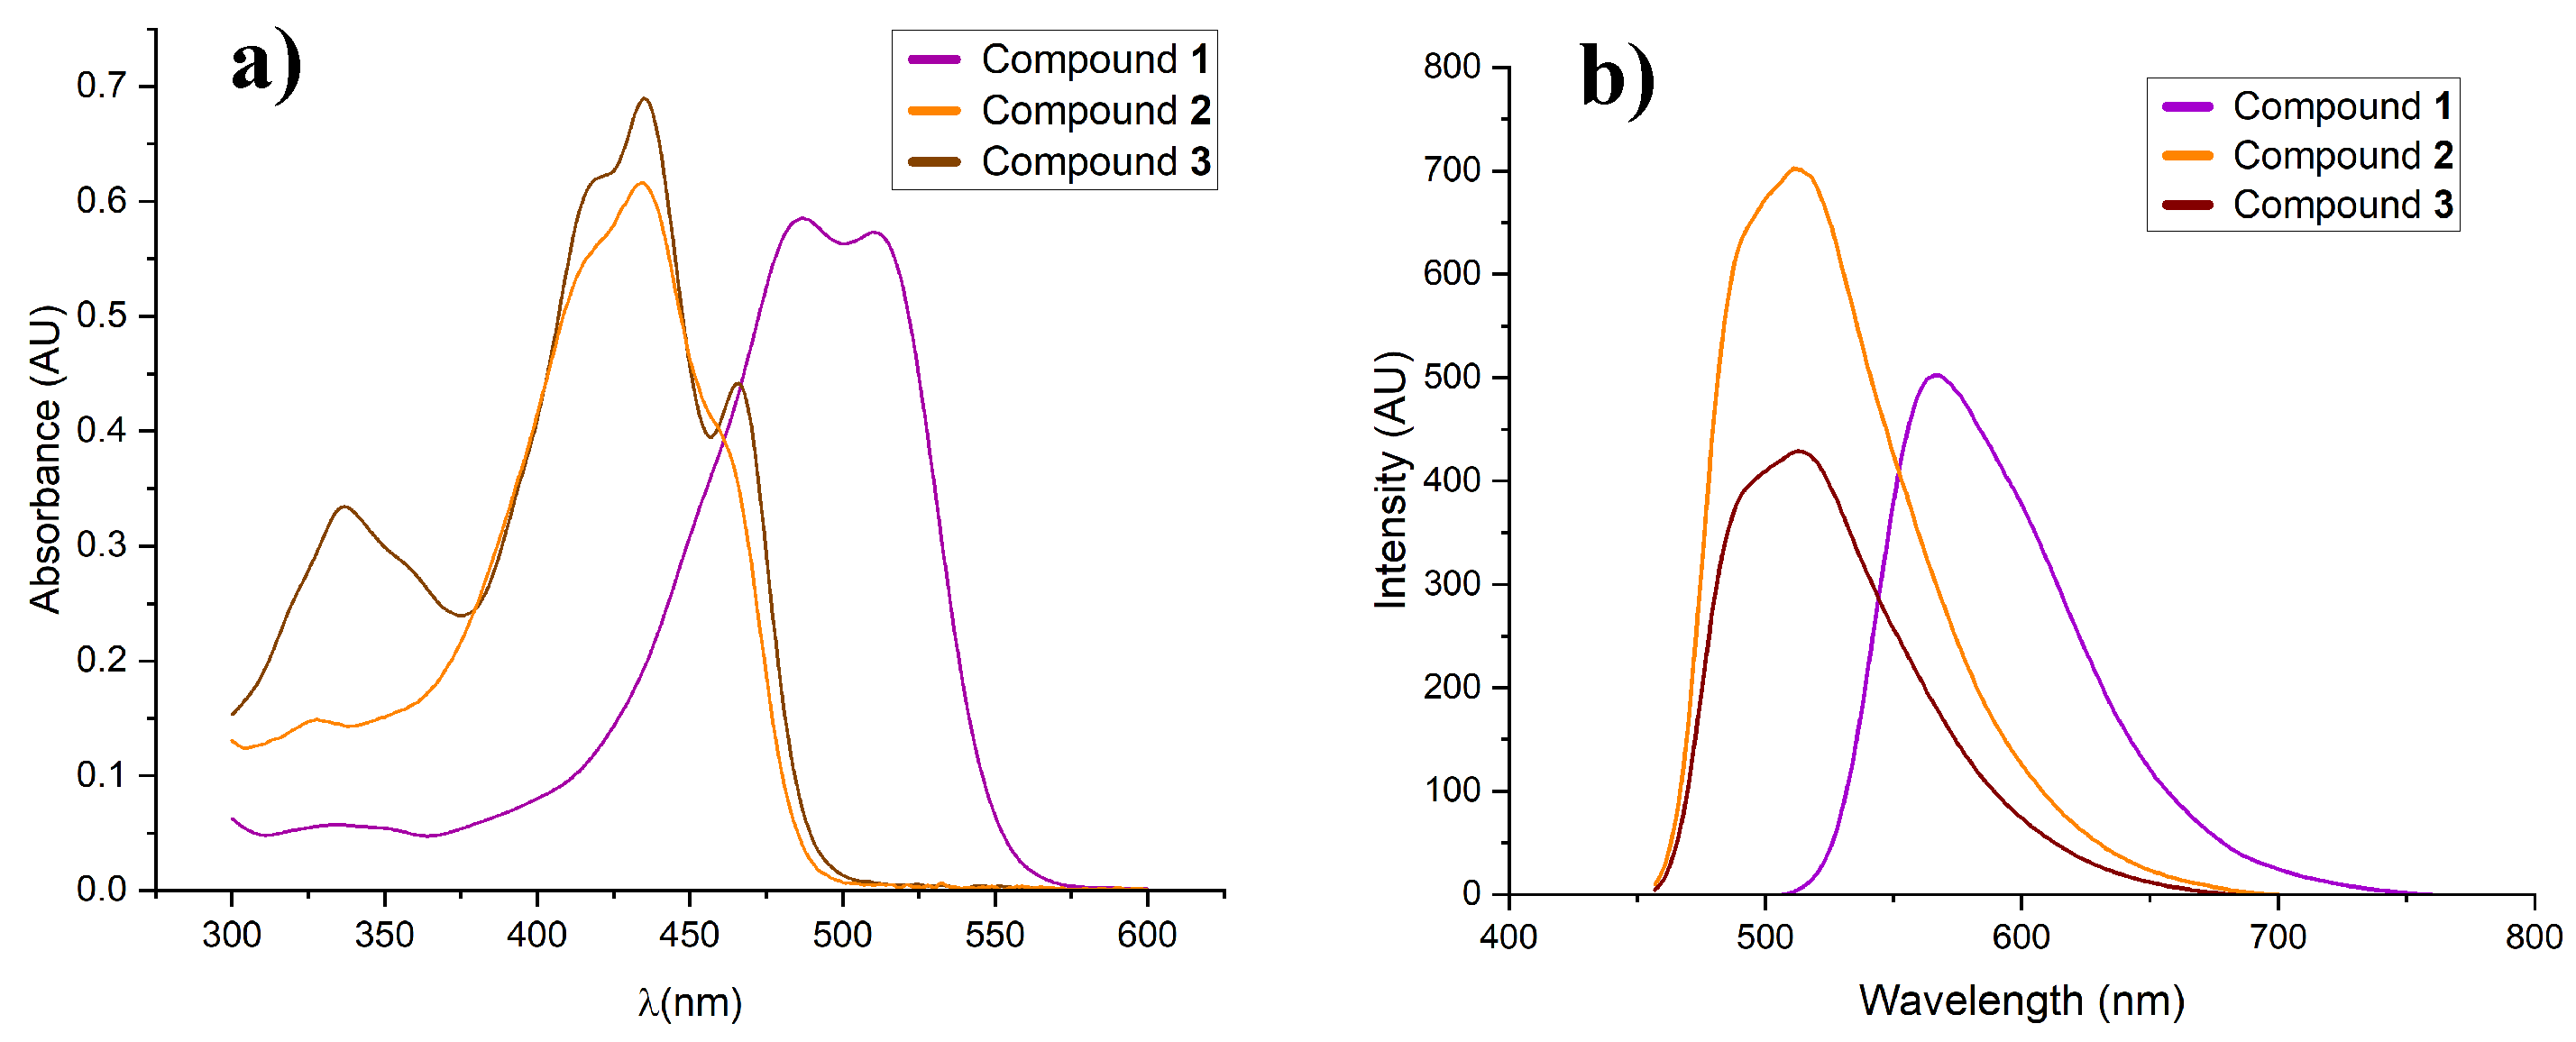
Figure 3.
ORTEP diagrams of compounds 1, 2 and 3. Ellipsoids were drawn at 50% of probability level.
Figure 3.
ORTEP diagrams of compounds 1, 2 and 3. Ellipsoids were drawn at 50% of probability level.
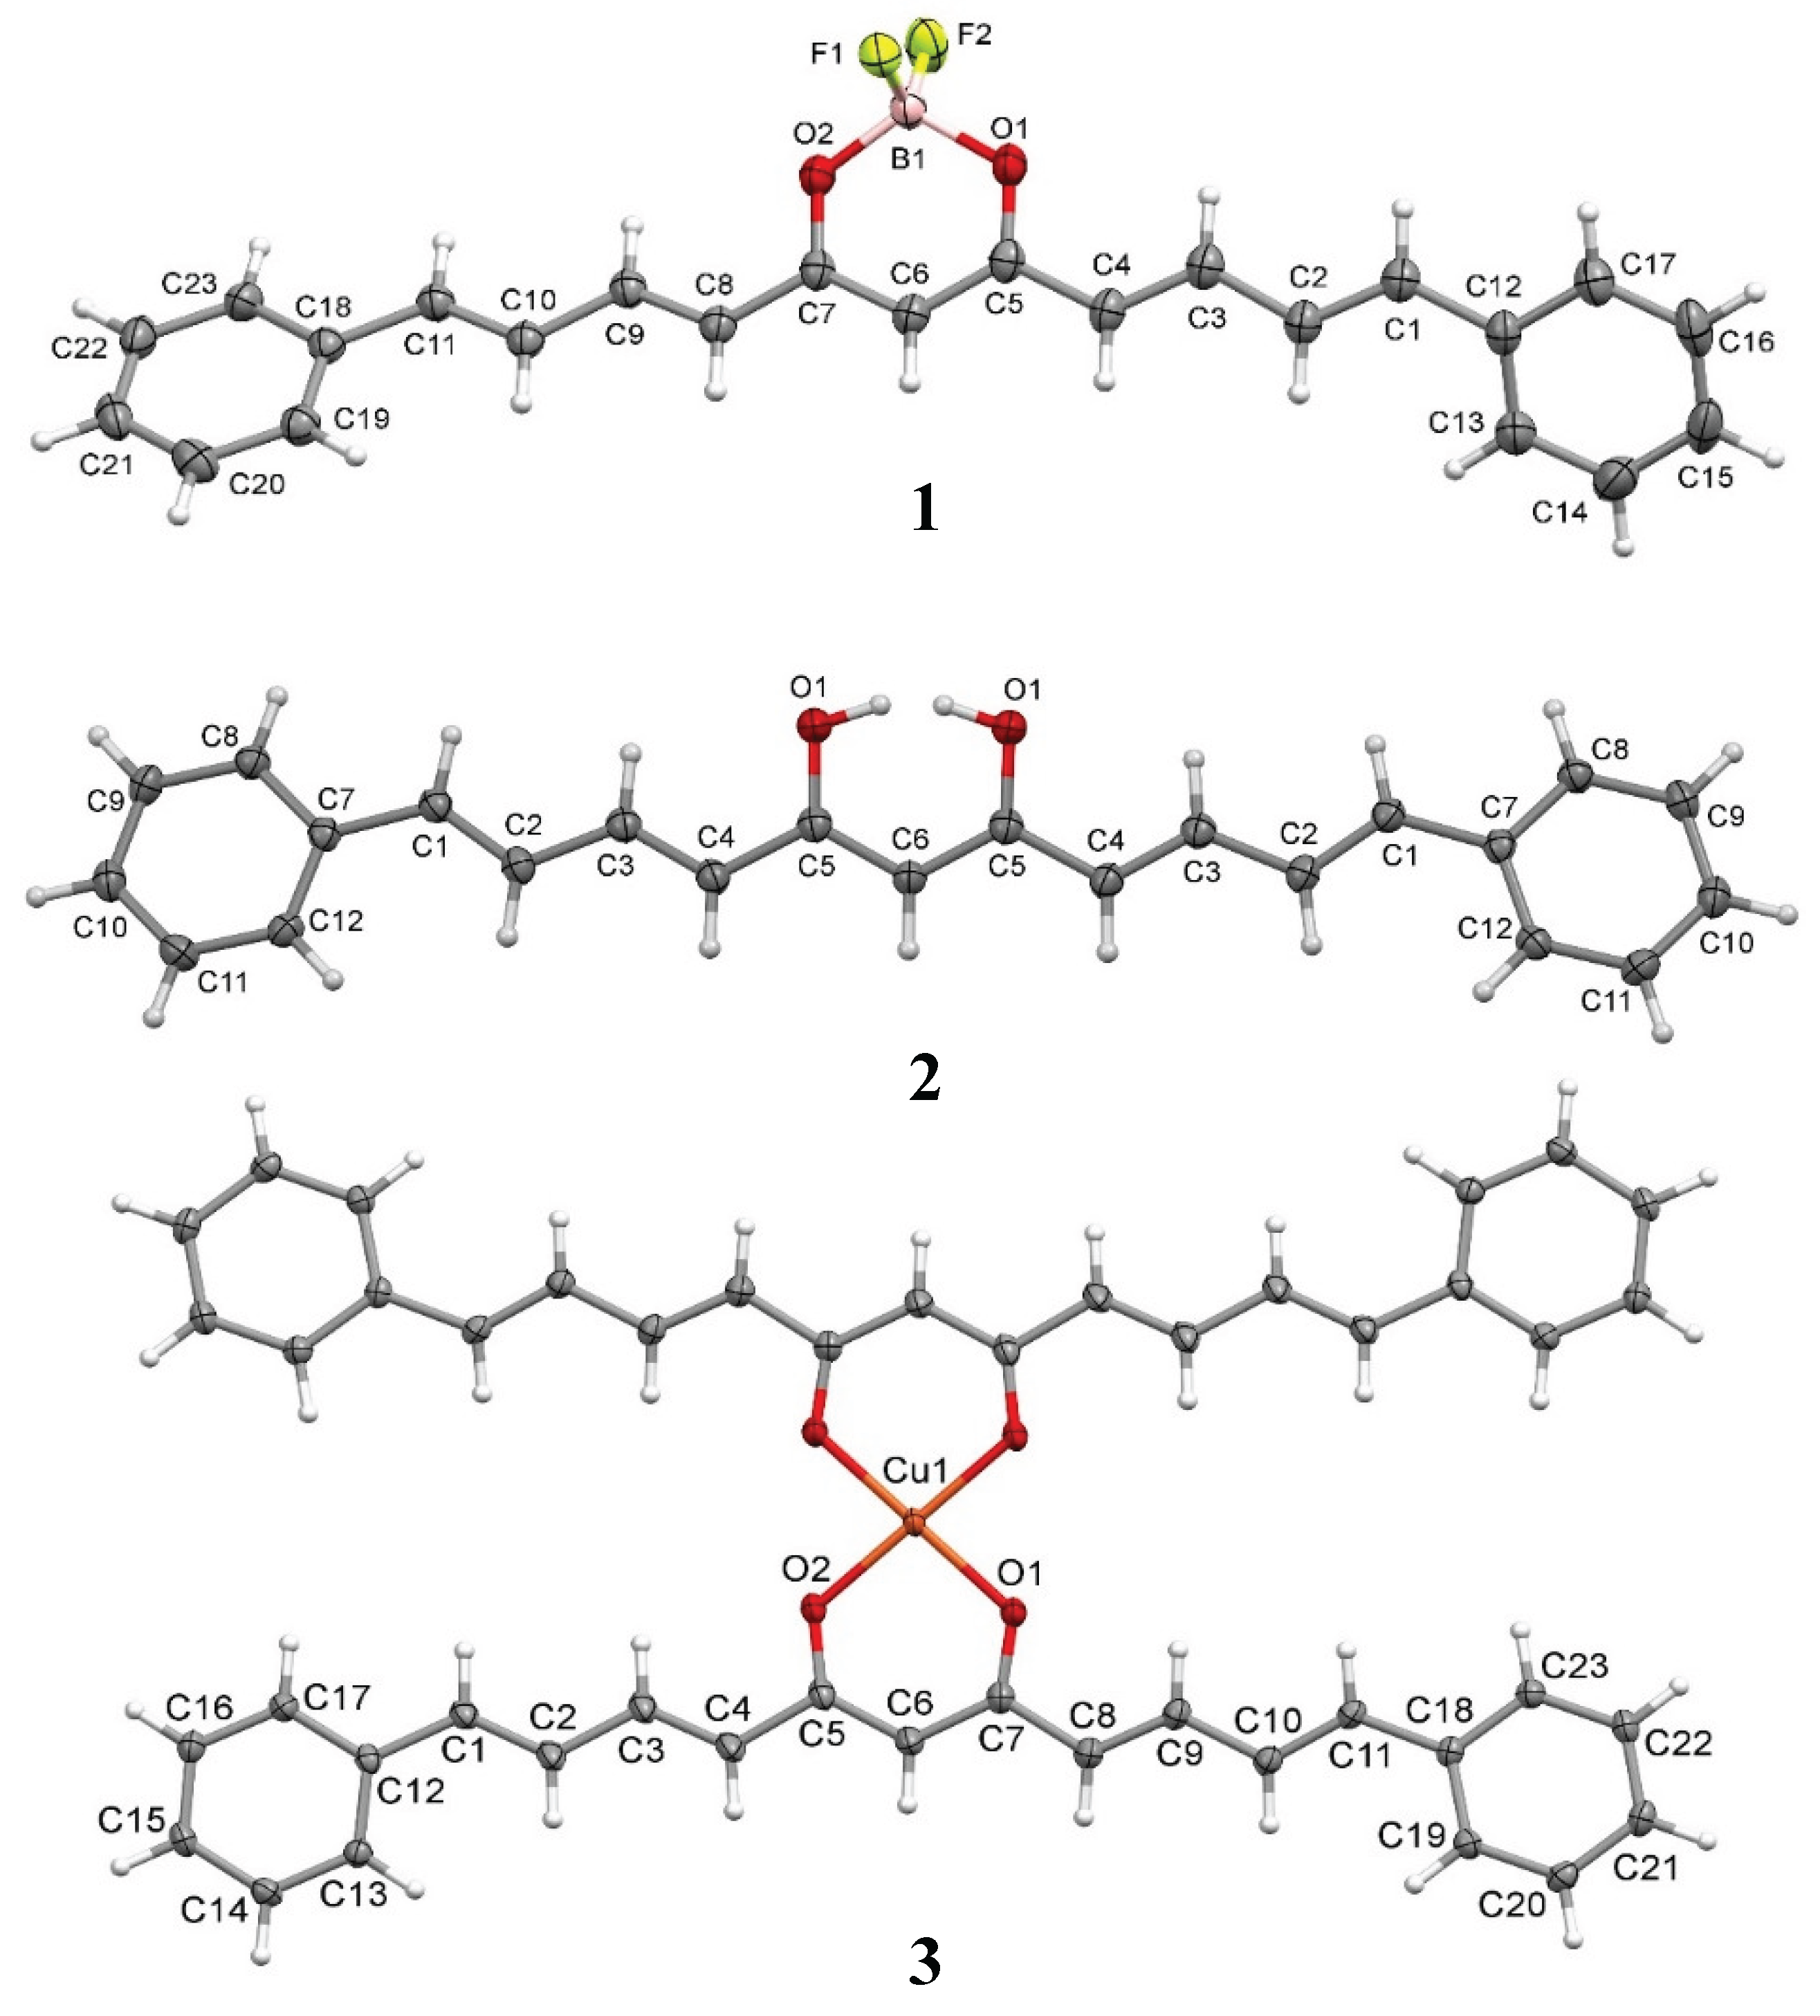
Figure 4.
Hirshfeld surface and percentages of intermolecular interaction contributions in the crystal of compounds a) 1, b) 2, and c) 3. The images showed interactions at 2.9 Å (carbons are in gray, hydrogens in white, oxygens in red, fluorine in yellow, copper in orange and boron in pink).
Figure 4.
Hirshfeld surface and percentages of intermolecular interaction contributions in the crystal of compounds a) 1, b) 2, and c) 3. The images showed interactions at 2.9 Å (carbons are in gray, hydrogens in white, oxygens in red, fluorine in yellow, copper in orange and boron in pink).
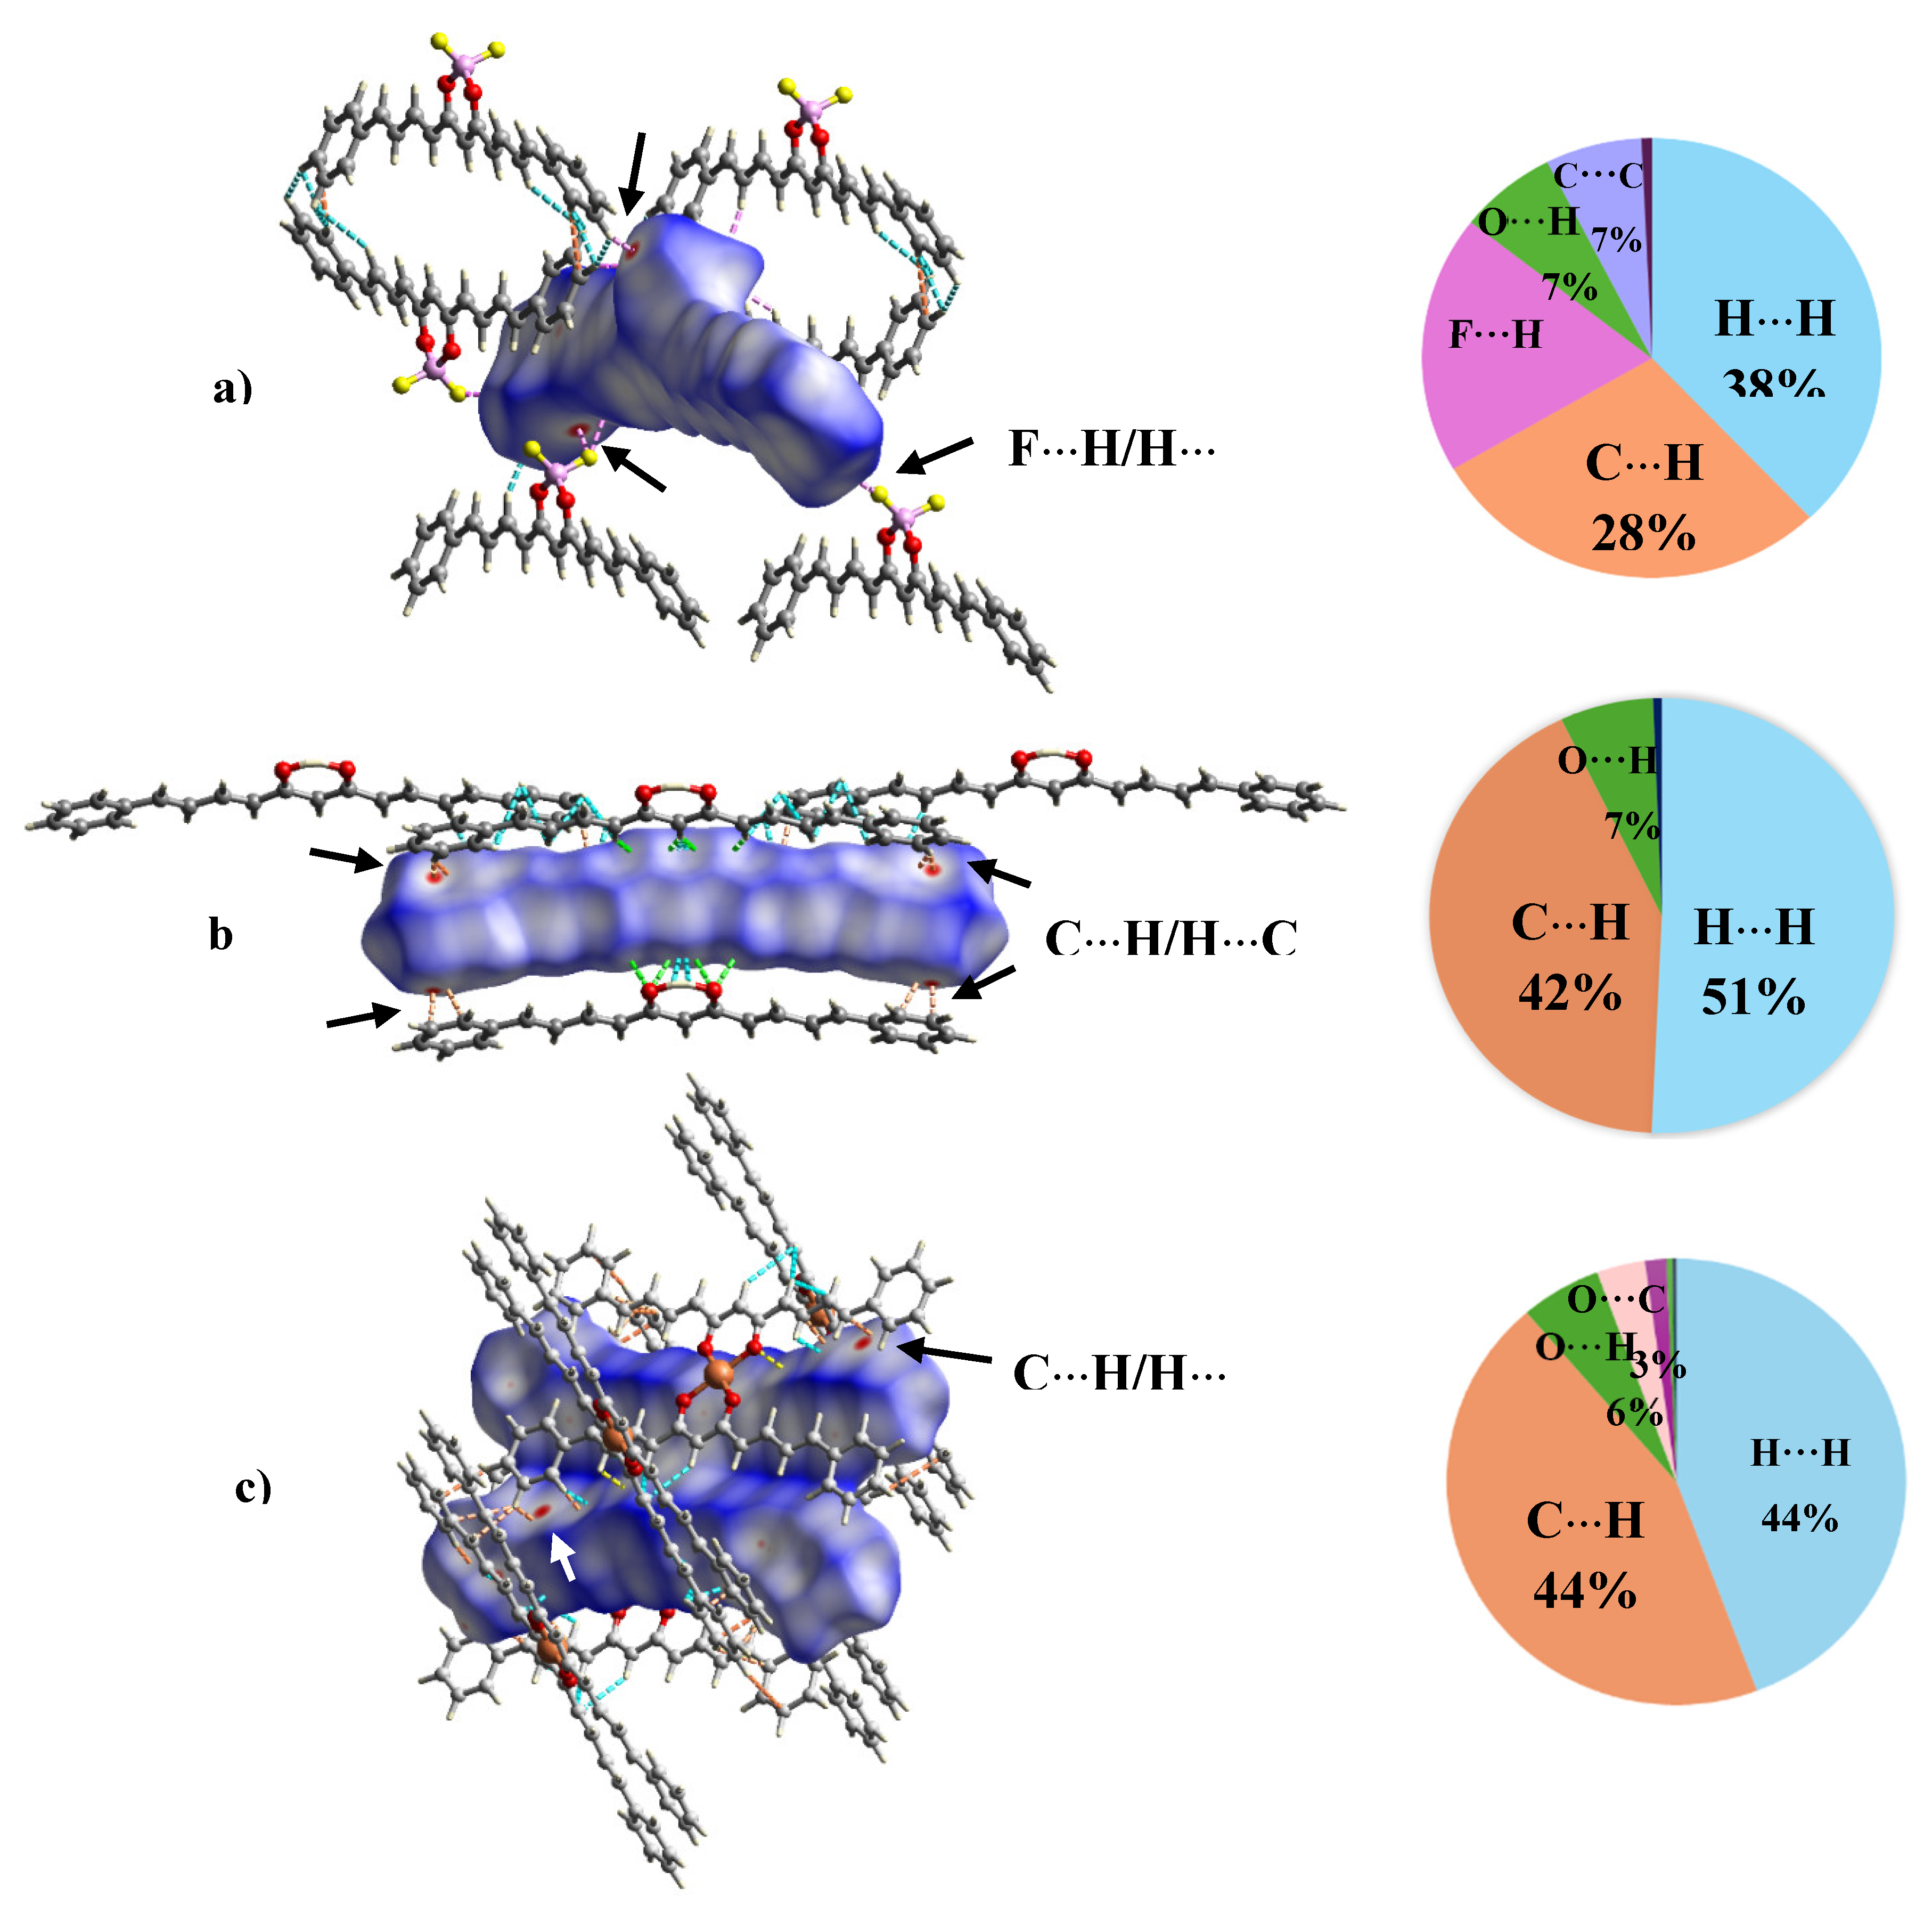
Figure 5.
Formulations of a) curcuminoid analogue with β-cyclodextrin 4, and b) analogue copper complex with β-cyclodextrin 5.
Figure 5.
Formulations of a) curcuminoid analogue with β-cyclodextrin 4, and b) analogue copper complex with β-cyclodextrin 5.
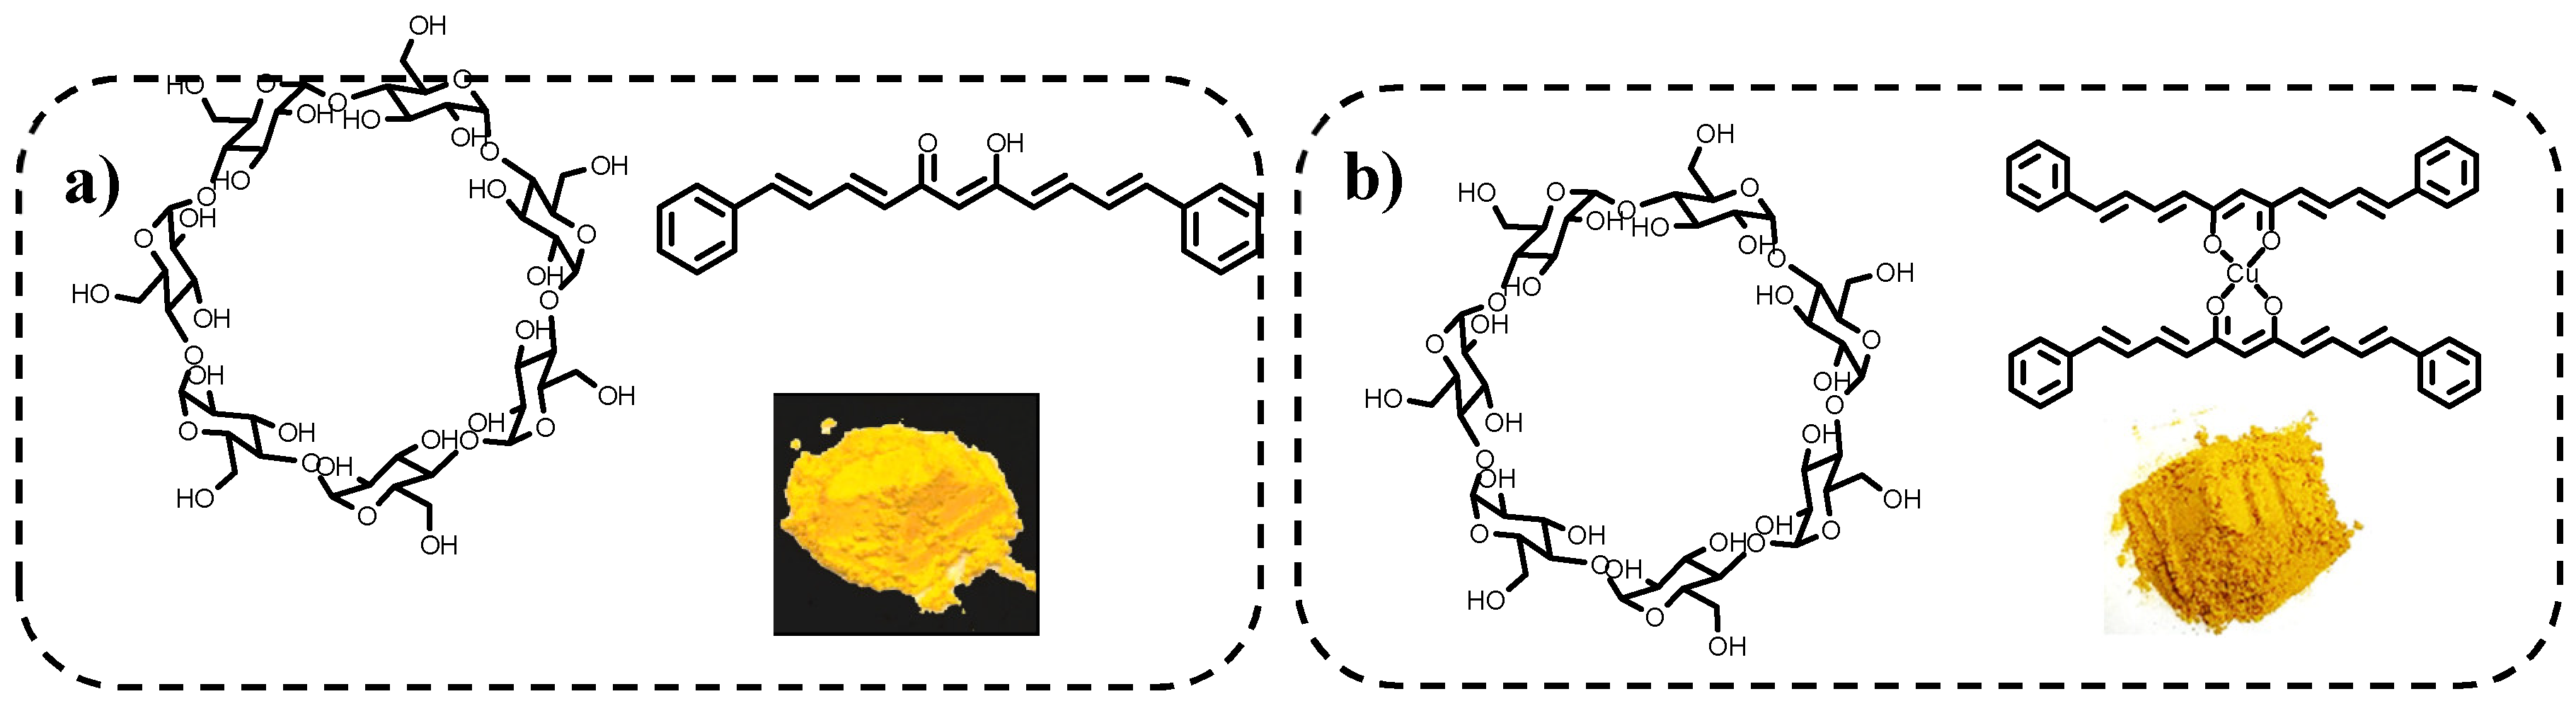
Figure 6.
Stacked 1H-NMR spectra of BCD, compound (2), and association complex 4 (DMSO-d6, 700 MHz).
Figure 6.
Stacked 1H-NMR spectra of BCD, compound (2), and association complex 4 (DMSO-d6, 700 MHz).
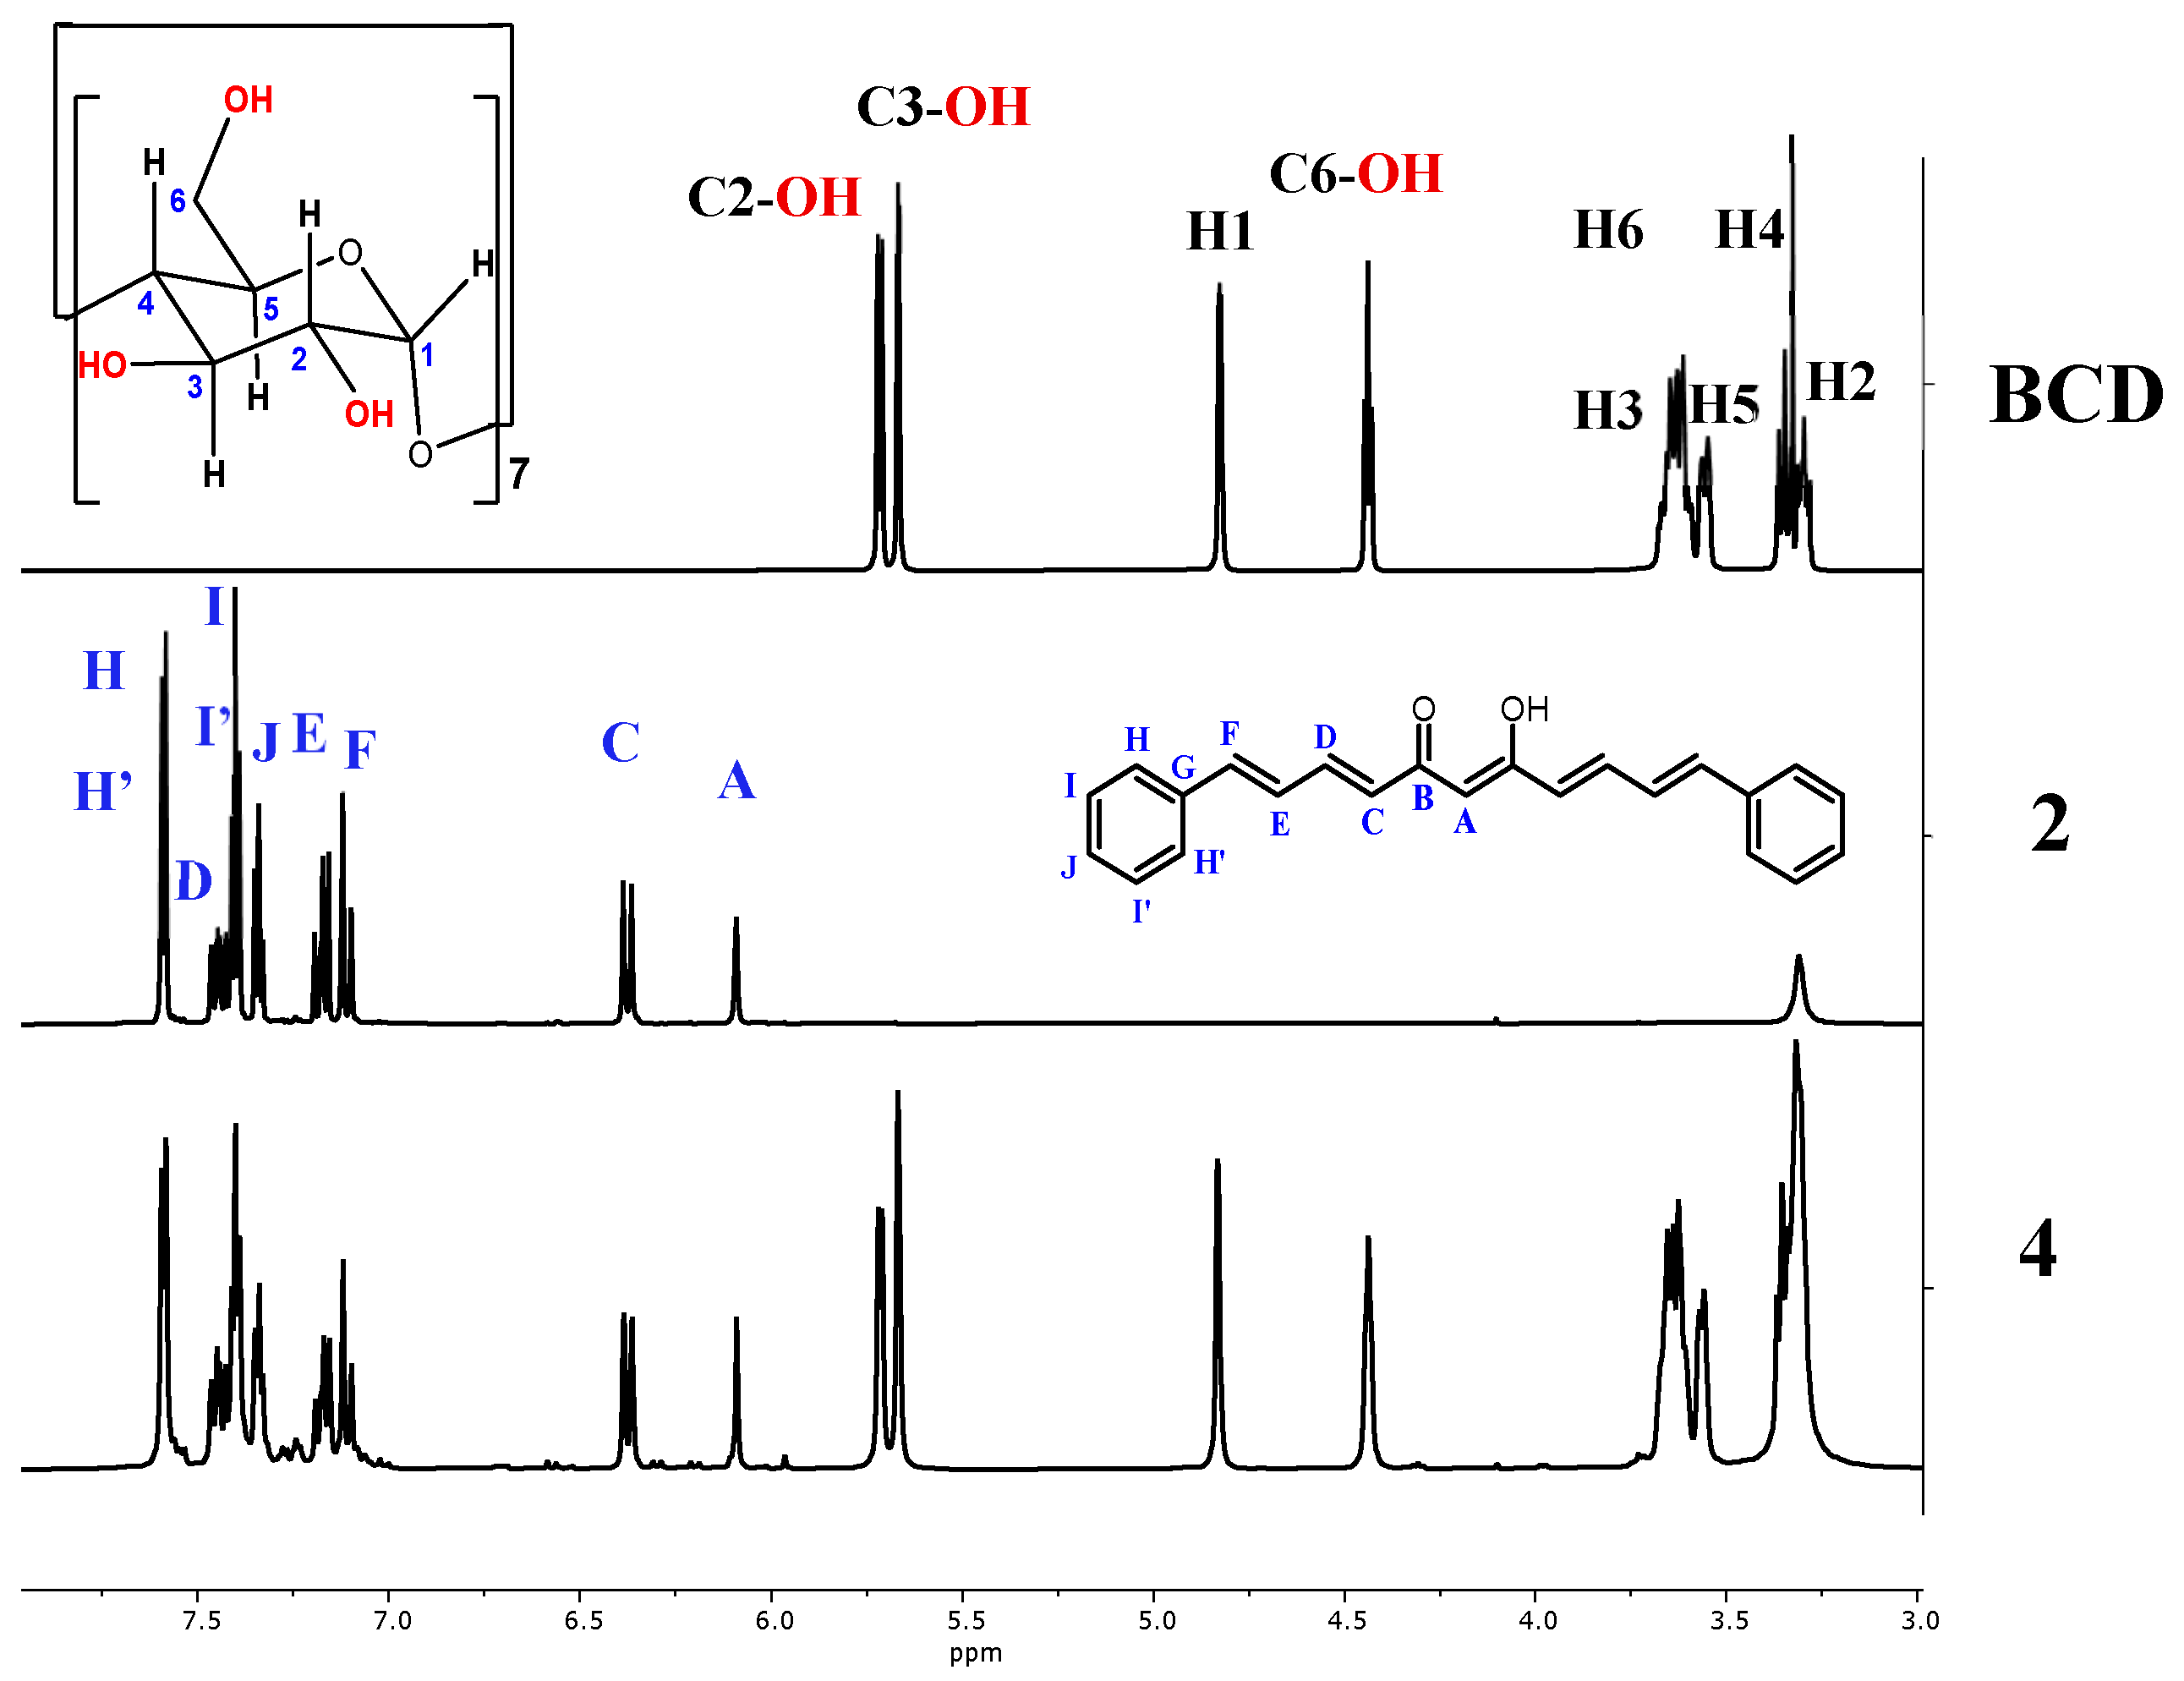
Figure 7.
Main absorption bands in the infrared spectra of a) association complex 4, b) compound 2, c) association complex 5 and d) copper complex 3.
Figure 7.
Main absorption bands in the infrared spectra of a) association complex 4, b) compound 2, c) association complex 5 and d) copper complex 3.
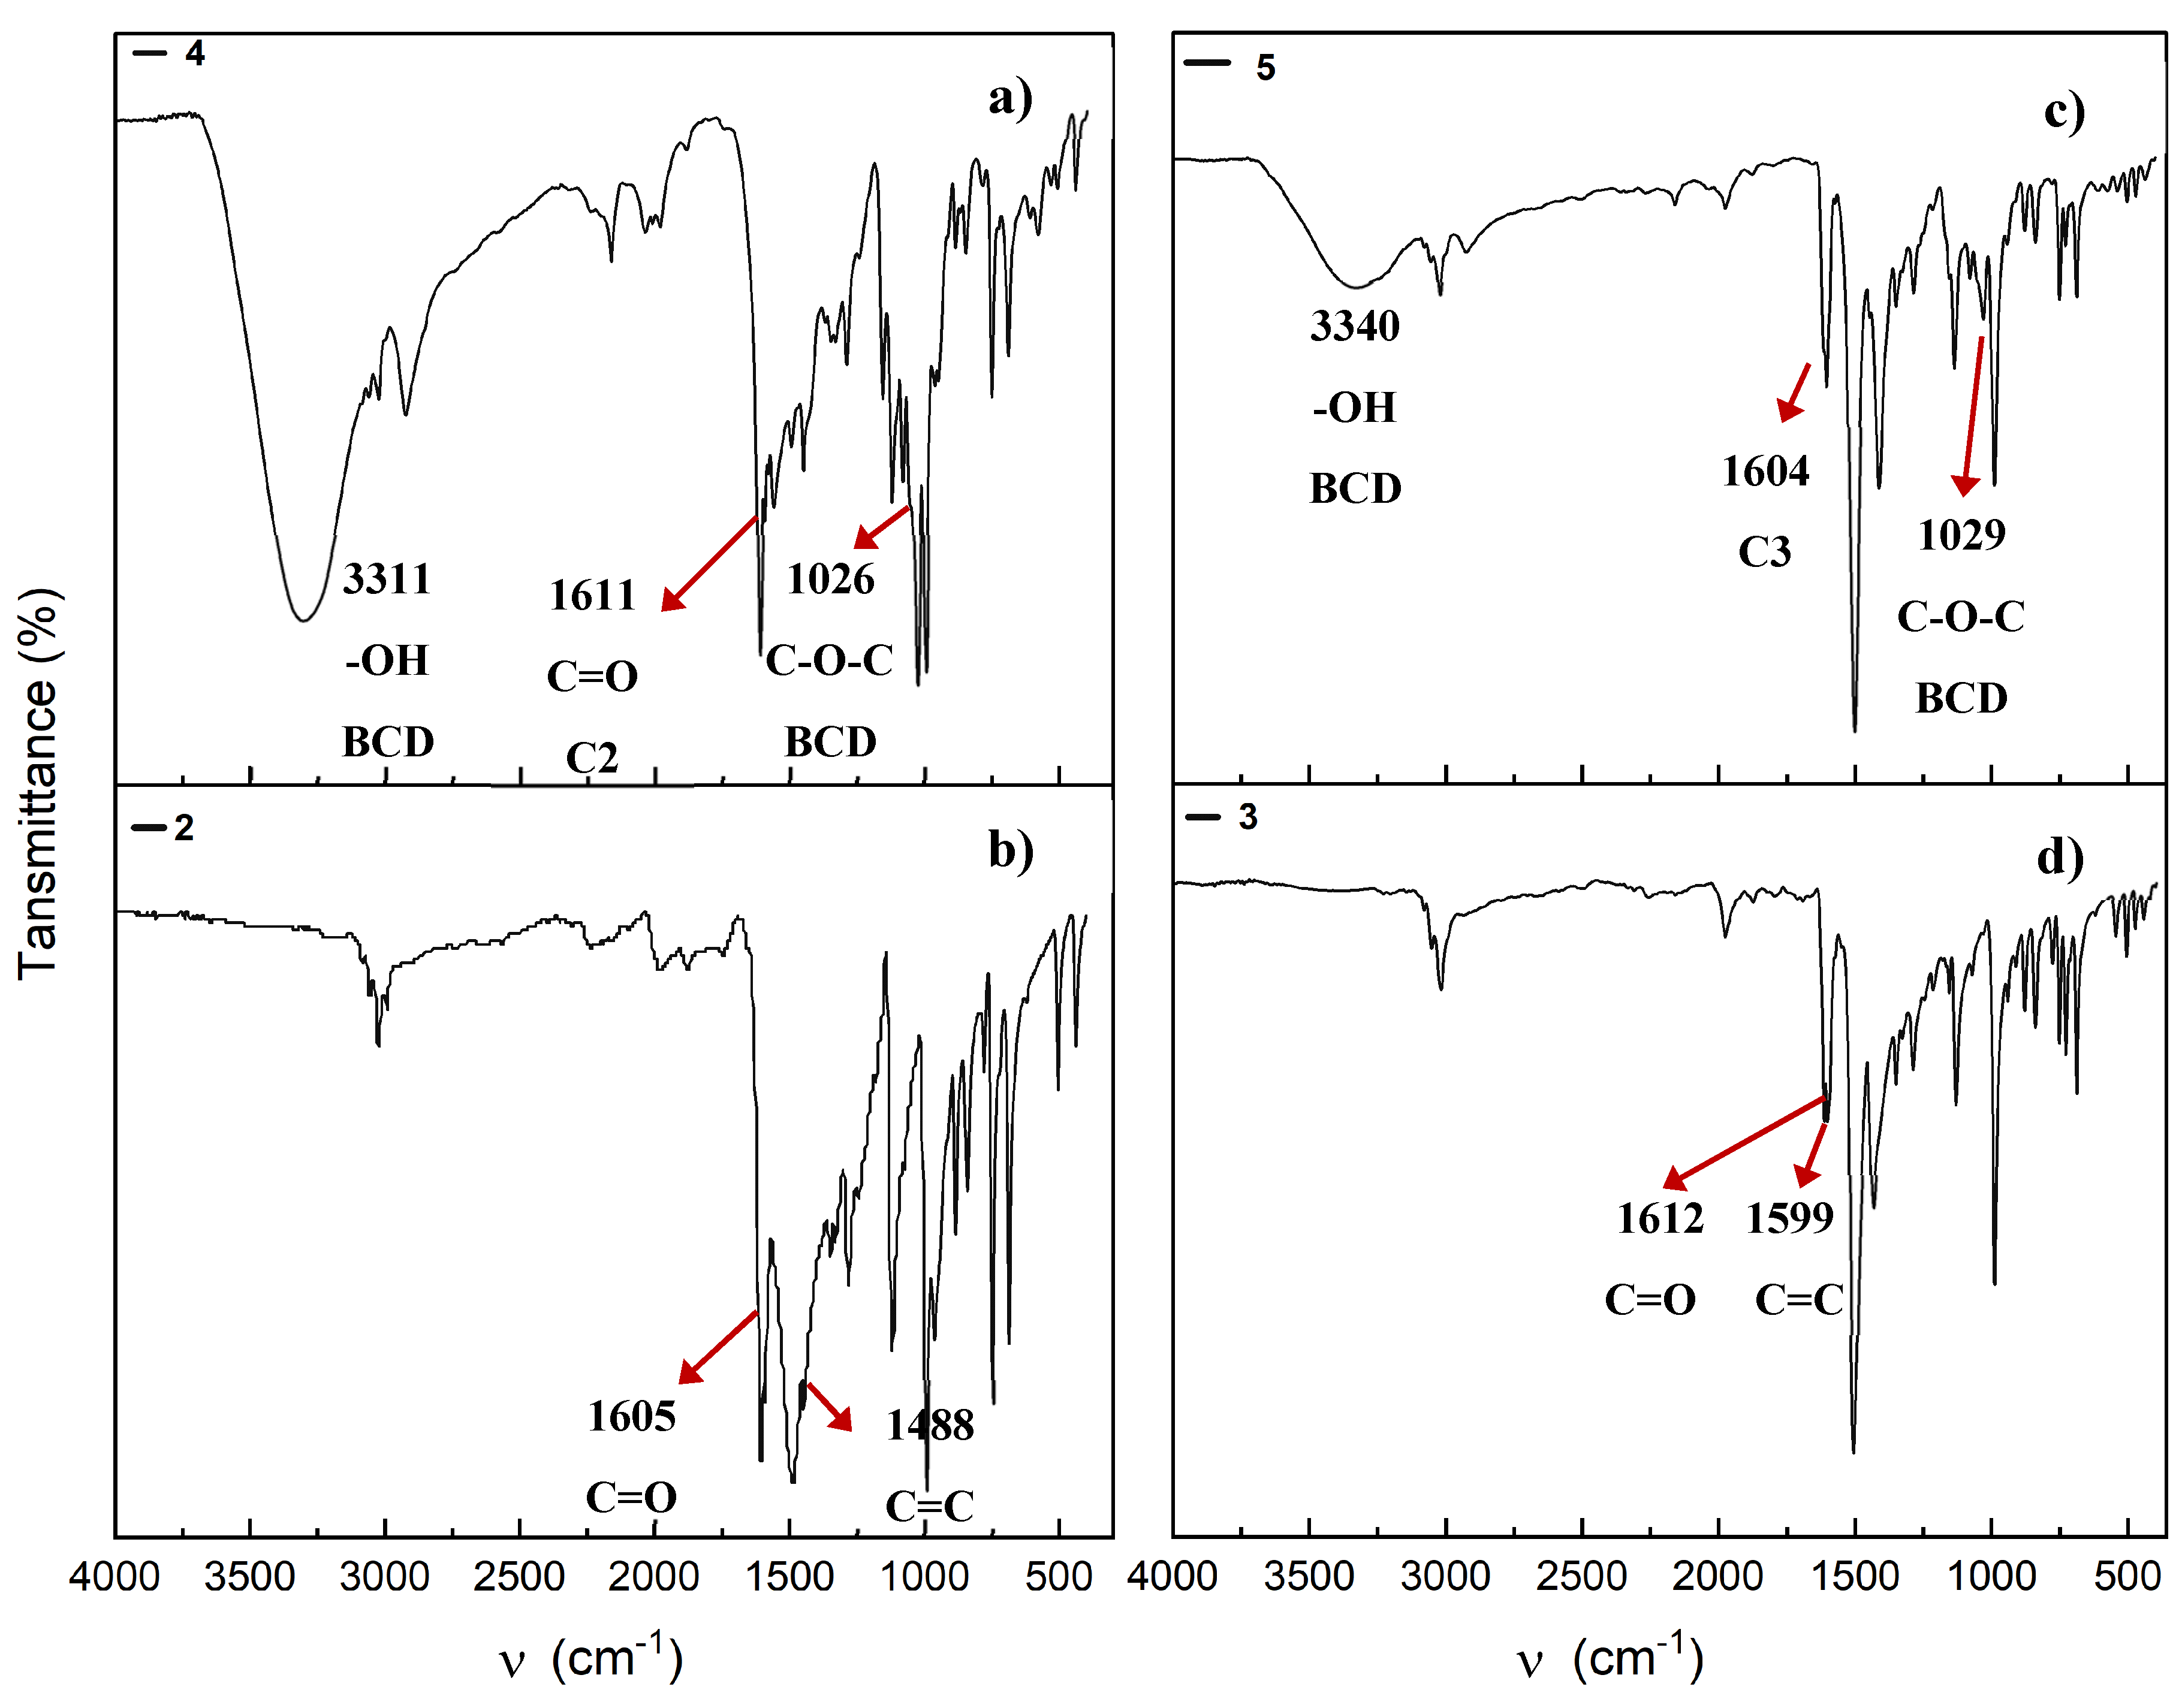
Figure 8.
Yeast α-glucosidase inhibition activity of compound 2 and BCD association complexes 4 and 5, expressed as half inhibitory concentration. n= 3,4,5 p<0.05.
Figure 8.
Yeast α-glucosidase inhibition activity of compound 2 and BCD association complexes 4 and 5, expressed as half inhibitory concentration. n= 3,4,5 p<0.05.
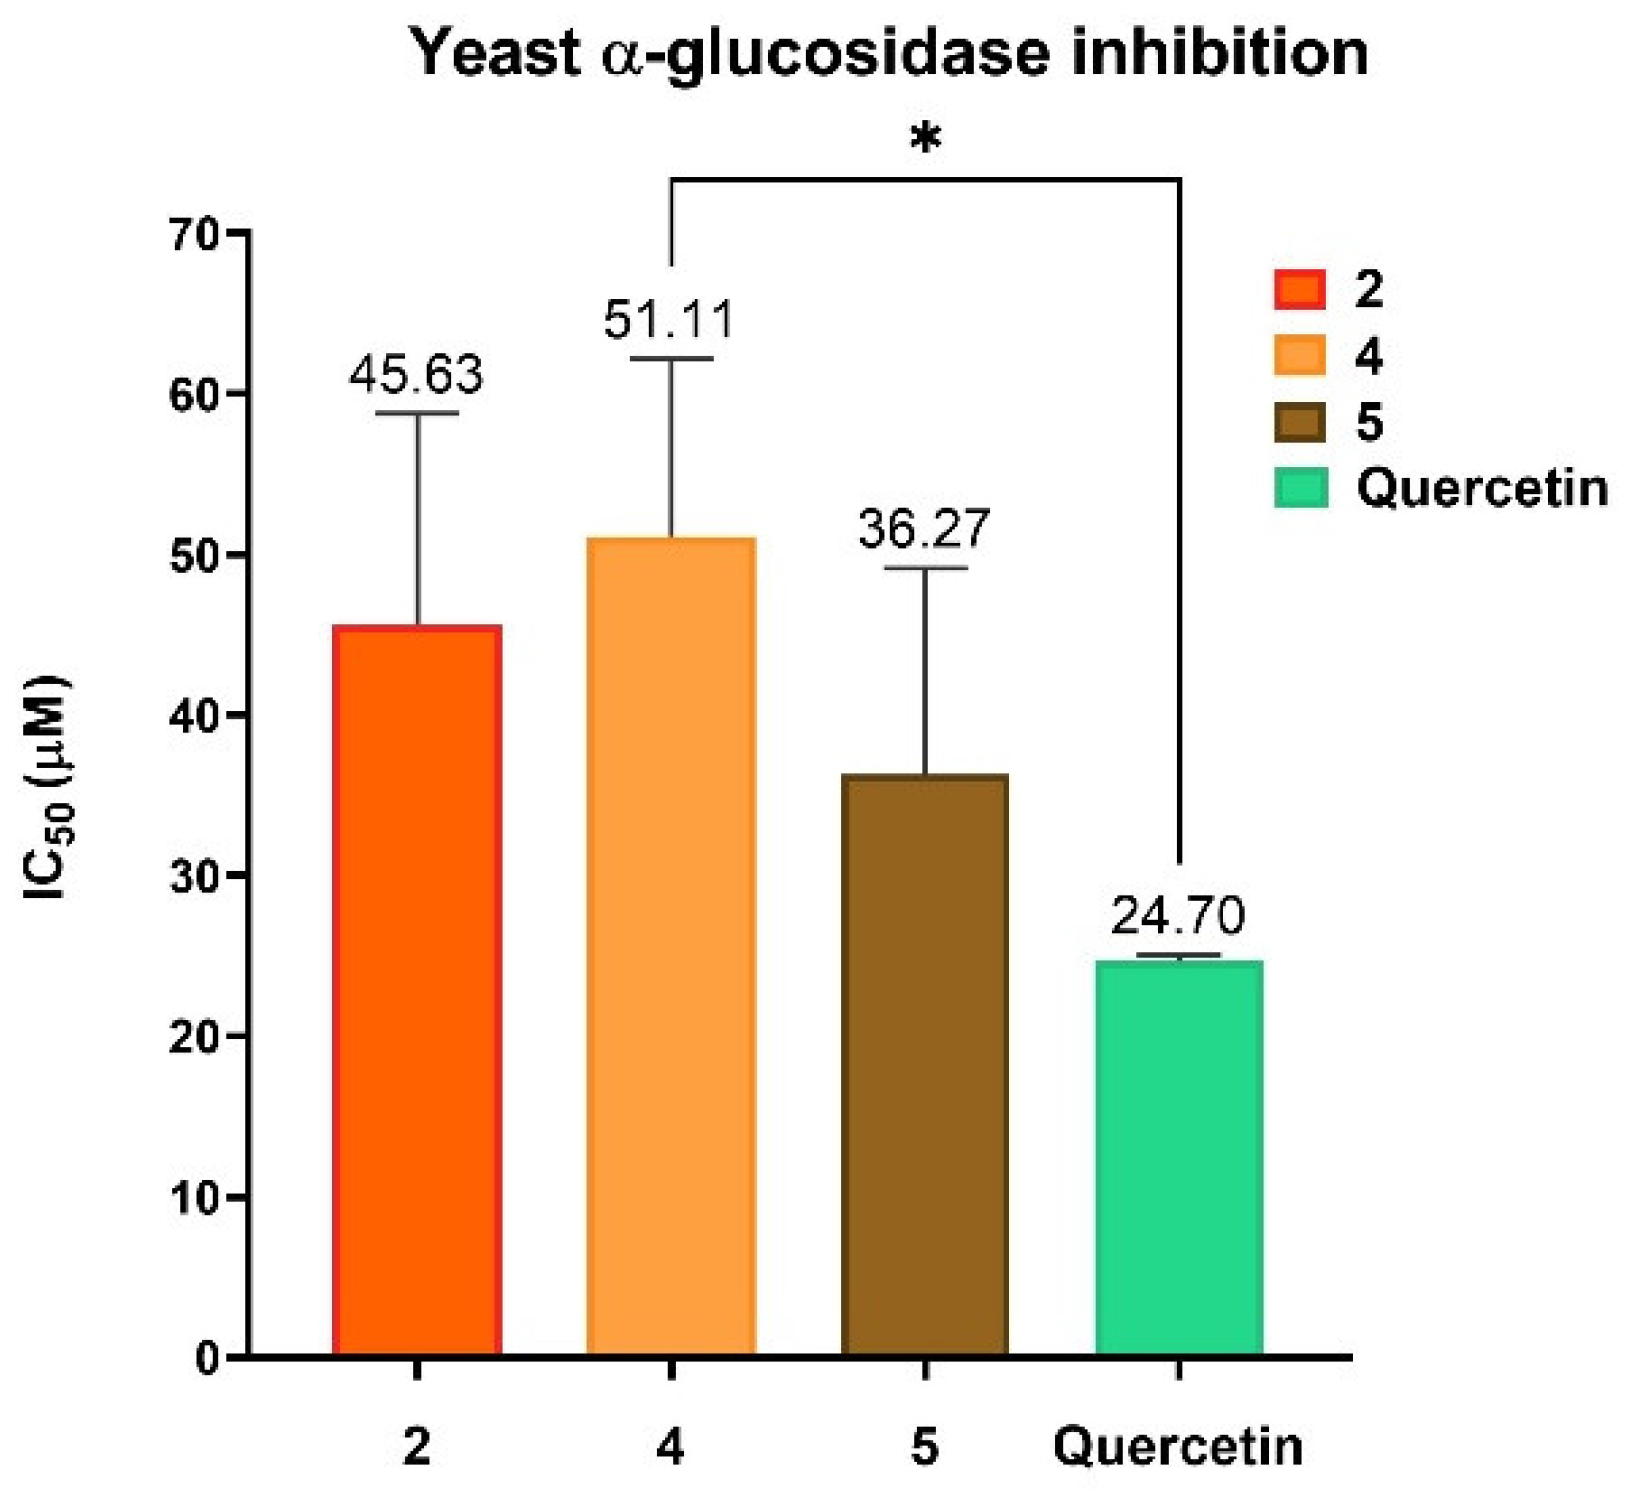

Table 1.
1H and 13C chemical shifts of compounds 1 and 2 (700 MHz).
| Compound 1 (CDCl3) | Compound 2 (DMSO-d6) | Compound 2 (CDCl3) | ||||
| 13C (δ, ppm) | 1H (δ, ppm) | 13C (δ, ppm) | 1H (δ, ppm) | 13C (δ, ppm) | 1H (δ, ppm) | |
| A | 102.22 | 5.93 | 101.34 | 6.09 (s) | 101.87 | 5.71 (s) |
| B | 179.59 | 182.88 | 183.24 | |||
| C | 124.22 | 6.27 | 127.74 | 6.38 (d) | 127.87 | 6.18 (d) |
| D | 147.66 | 7.82 | 141.00 | 7.45 (dd) | 140.88 | 7.44 (m) |
| E | 126.64 | 6.98 | 127.36 | 7.18 (dd) | 127.22 | 6.92 (d)* |
| F | 145.13 | 7.09 | 140.34 | 7.11 (d) | 140.38 | 6.93 (d)* |
| G | 135.8 | 136.10 | 136.44 | |||
| H, H’ | 128.01 | 7.52 | 127.25 | 7.59 (m) *** | 127.22 | 7.48 (m) |
| I, I’ | 129.14 | 7.38 | 128.87 | 7.40 (m) ** | 128.97 | 7.36 (m) |
| J | 130.27 | 7.38 | 129.06 | 7.34 (m) ** | 129.15 | 7.31 (m) |
| -OH | 16.06 (br, s) | 15.85 (br, s) | ||||
* Superimposed signals, shifts can exchange **triplet-like; doublet-like***.
Table 2.
Maximum absorption and emission bands, and extinction coefficient (ε) of curcuminoid analogue-BF2 (1), curcuminoid analogue (2), and cooper complex (3) in DMSO.
Table 2.
Maximum absorption and emission bands, and extinction coefficient (ε) of curcuminoid analogue-BF2 (1), curcuminoid analogue (2), and cooper complex (3) in DMSO.
| Compound | Absorption λ (nm) | ε (M-1cm-1) [log ε] | Emission λ (nm) |
| 1 | 487 | 75372.75 [4.9] | 567.01 |
| 2 | 434 | 63305.95 [4.8] | 511.04 |
| 3 | 435 | 120156.79 [5.1] | 512.98 |
Table 2.
Crystal data of compounds 1, 2 and 3.
| Compound | 1 | 2 | 3 |
| CCDC (deposition number) | 2483477 | 2483476 | 2483475 |
| Empirical formula | C23H19BF2O2 | C27H28O3 | C46H38CuO4 |
| Formula weight | 376.19 | 400.49 | 718.30 |
| Crystal system | Triclinic | Orthorhombic | Monoclinic |
| Space group | P-1 | Cmc21 | C2/c |
| Unit cell dimensions a (Å) b (Å) c (Å) α (°) β (°) γ (°) |
a = 9.1069 (6) b = 10.0955 (7) c = 10.7715 (7) α= 74.270 (2) β= 85.586 (2) γ = 85.457(2) |
a = 28.5258 (9) b = 9.7389 (3) c = 7.6957 (2) α= 90 β= 90 γ= 90 |
a = 41.1114 (11) b = 5.56190 (10) c = 16.1765 (4) α= 90 β= 100.2810 (10) γ= 90 |
| Volume (Å3) | 948.65 (11) | 2137.94 (11) | 3639.49 (15) |
| Z | 2 | 4 | 4 |
| Density (calculate) (mg/m3) | 1.317 | 1.244 | 1.311 |
| Absorption coefficient (mm-1) |
0.095 | 0.080 | 0.644 |
| F (000) | 392 | 856 | 1500 |
| Crystal size (mm3) | 0.291 x 0.239 x 0.178 | 0.400 x 0.280 x 0.200 | 0.346 x 0.106 x 0.089 |
Disclaimer/Publisher’s Note: The statements, opinions and data contained in all publications are solely those of the individual author(s) and contributor(s) and not of MDPI and/or the editor(s). MDPI and/or the editor(s) disclaim responsibility for any injury to people or property resulting from any ideas, methods, instructions or products referred to in the content. |
© 2025 by the authors. Licensee MDPI, Basel, Switzerland. This article is an open access article distributed under the terms and conditions of the Creative Commons Attribution (CC BY) license (http://creativecommons.org/licenses/by/4.0/).
Copyright: This open access article is published under a Creative Commons CC BY 4.0 license, which permit the free download, distribution, and reuse, provided that the author and preprint are cited in any reuse.


