
Submitted:
04 September 2025
Posted:
05 September 2025
You are already at the latest version
Abstract
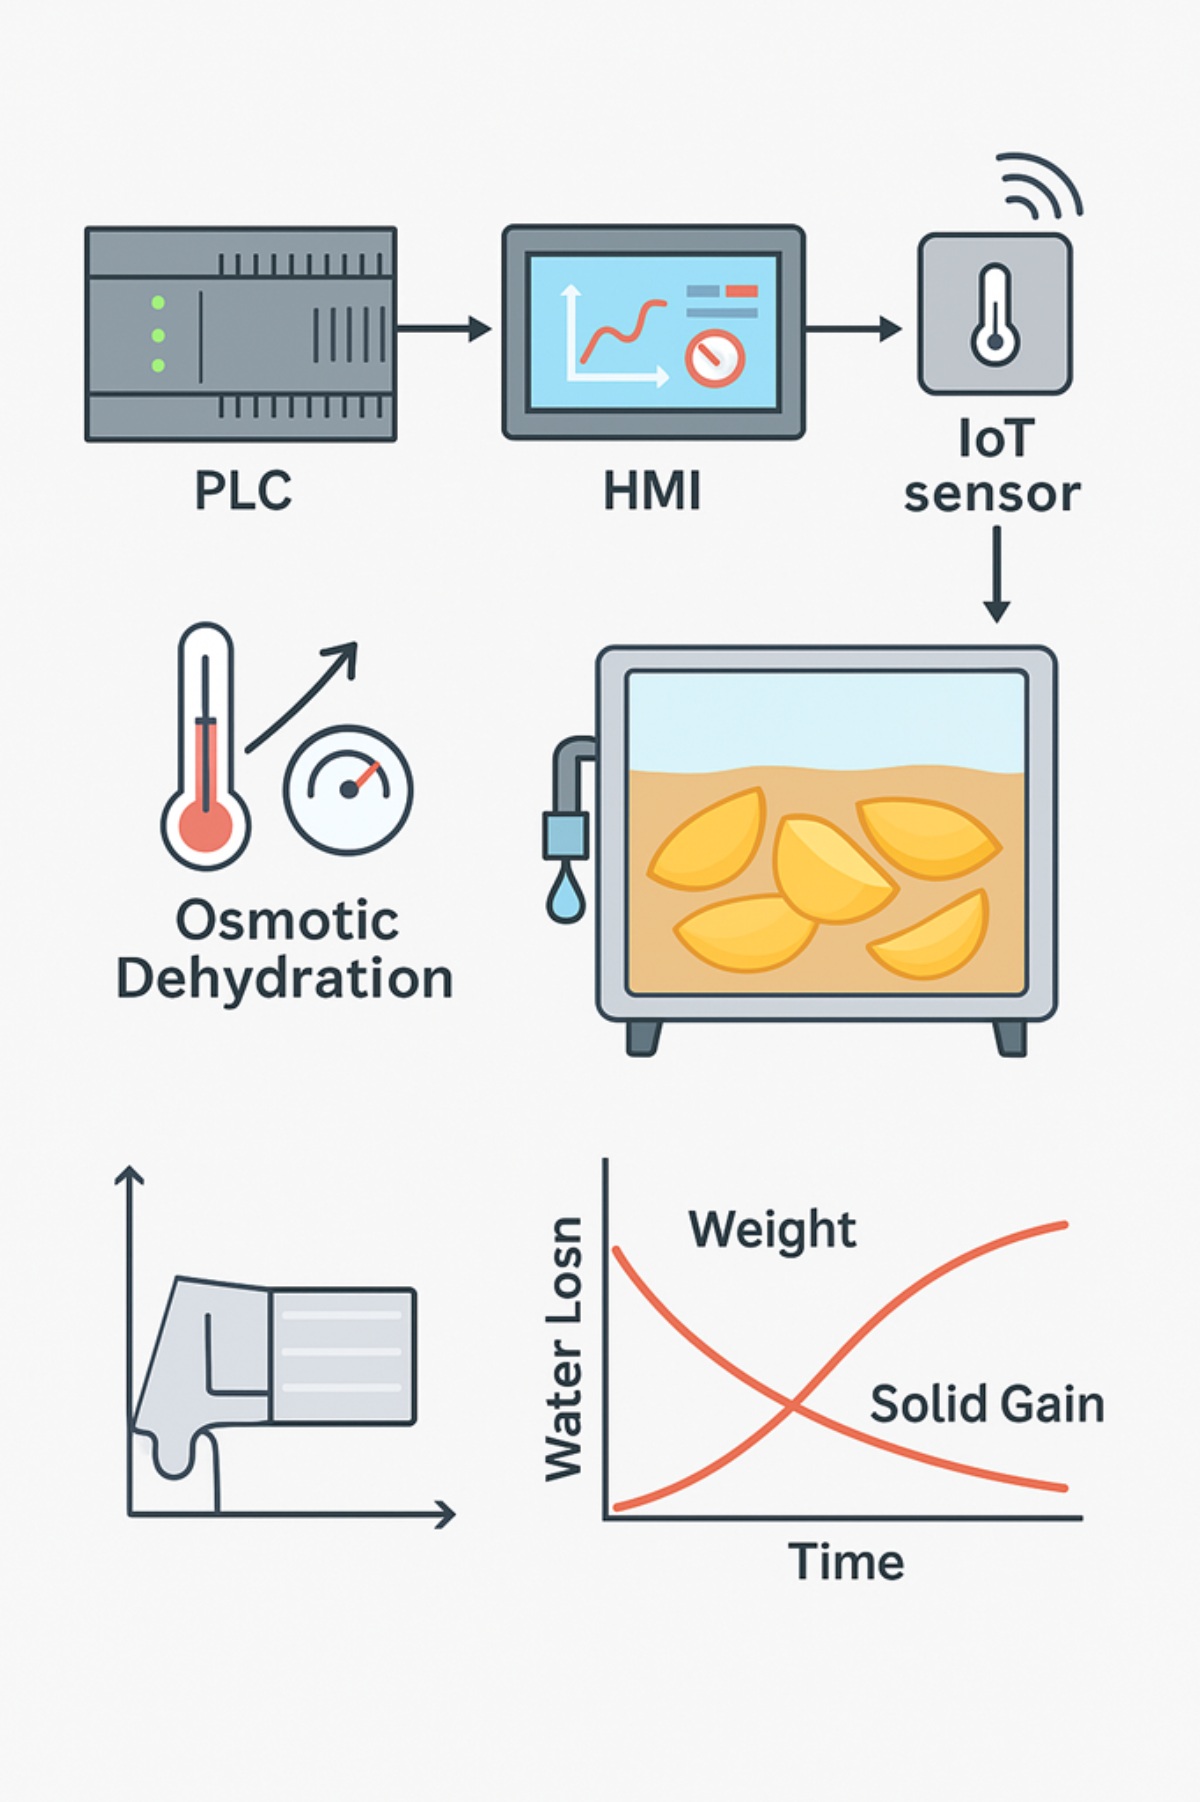
This study presents the design and development of an innovative osmotic dehydrator integrating a Programmable Logic Controller (PLC), Human-Machine Interface (HMI), and IoT sensors dedicated to real-time, automated monitoring and control of syrup concentration—a critical but often overlooked parameter. Additional key process variables such as temperature, recirculation rate, and time are also precisely controlled to optimize the osmotic dehydration process and improve food preservation quality and operational efficiency. Validation included eight treatments combining two sucrose concentrations (45 and 50 °Brix), two temperatures (30 and 40 °C), and two immersion times (120 and 180 minutes). Weight reduction, water loss, and solid gain were measured. The treatment with the highest concentration, temperature, and time showed the greatest mass transfer. Statistical analysis revealed significant effects (p < 0.001) and strong fits (R² = 0.995) for weight and water loss, while solid gain showed moderate fit (R² = 0.772). Kinetic modeling using the Page model best described drying dynamics (R² > 0.97). Results suggest the automated system can improve operational efficiency and product quality. However, practical validation under real conditions is needed to confirm functionality and scalability. This work advances osmotic dehydration technology by combining automation with precise process control, aiming to enhance food processing applications.
Keywords:
osmotic dehydration
; process automation
; syrup concentration control
; kinetic modeling
1. Introduction
The increasing demand for high-quality, minimally processed food products with extended shelf life has driven the development of innovative preservation techniques that maintain nutritional and sensory attributes [1,2]. Among these, osmotic dehydration has emerged as an efficient pre-treatment method that reduces water activity while preserving the texture, flavor, and bioactive compounds of fruits and vegetables [3,4].
Osmotic dehydration is a process that uses concentrated solutions to extract water from foods while preserving their structure and essential properties[5,6]. This method is particularly useful for delicate products such as fruits and vegetables, where water loss must be controlled to avoid degradation of bioactive compounds and maintain their natural appearance and flavor [7,8]. However, traditional osmotic dehydration processes often rely on manual operations and lack precise control over critical parameters, which may result in inconsistencies in product quality and process inefficiencies [9,10].
Recent advances in automation and digital technologies, particularly the integration of Internet of Things (IoT) devices, programmable logic controllers (PLC), and human-machine interfaces (HMI), offer new opportunities to overcome these limitations by enabling real-time monitoring, data-driven control, and improved process reliability [11,12,13].
The implementation of IoT in this context allows remote and real-time monitoring of critical variables such as temperature and concentration, optimizing process control without the need for constant operator intervention[14]. In addition, automation improves process accuracy and repeatability, reducing operating costs and minimizing human error [15].
IoT integration in osmotic dehydration also opens up new possibilities for scalability and process customization. Connected sensors can collect detailed data on food behavior during the process, making it possible to adjust conditions for different types of products and obtain optimal results [16,17]. In addition, the ability to monitor and control the process remotely facilitates equipment supervision and maintenance, reducing downtime and improving overall system efficiency[18,19,20].
In this context, the objective of this article is to present the design and construction of an automated osmotic dehydration equipment integrating IoT sensors specifically for monitoring syrup concentration, along with PLC and HMI for precise control of other key process variables. The aim is to optimize the osmotic dehydration process, improve the quality of the final product, and reduce operating costs through enhanced process control and automation. Validation of the prototype was conducted through experimental trials on mango samples, applying various treatments combining sucrose concentration, temperature, and immersion time. The results were positive, demonstrating effective weight reduction and water loss, which confirm the system’s capacity to control and optimize the osmotic dehydration process. These outcomes highlight the potential of the prototype to improve product quality and operational efficiency in real-world food processing applications.
2. Materials and Methods
2.1. Equipment Design
2.1.1. Process Variables
Among the process variables used in the design of the equipment are temperature, agitation, concentration of the osmotic solution and the ratio between the feed and the osmotic medium. Temperature directly influences the kinetics of mass transfer, accelerating or retarding the loss of water and the gain of solids; agitation guarantees a homogeneous distribution of concentration and temperature, avoiding stagnation zones that could affect the uniformity of the process [6,21]. On the other hand, the concentration of the solution determines the osmotic rate, the main driving force of the process, while the ratio between the food and the solution impacts the saturation and efficiency of the medium [22]. Table 1, lists the selected variables and the working range considered for the design of devices and sensors.
2.1.2. Selection of Elements for the Automation of the Equipment
- Temperature control: For the temperature control of the designed equipment, a system based on a high-precision temperature sensor and a PID (Proportional-Integral-Derivative) controller was implemented. This system allowed continuous monitoring of the process temperature and automatic adjustment of the heating element power, ensuring a stable and accurate maintenance of the desired temperature. The PID controller calculates the deviation or error between the measured value and the desired value by applying three control actions: proportional, which determines the reaction to the actual error; integral, which generates a correction proportional to the integral of the error; and derivative, which determines the reaction according to the rate of change of the error [23,24].
- Agitation control: For the recirculation control in the process tank of the designed equipment, a water pump connected by means of stainless-steel piping was used, which guarantees a constant and corrosion-resistant flow during the process. This system allows maintaining a homogeneous circulation of the liquid, favouring the transfer of mass and temperature [11]. On the other hand, in the syrup preparation tank, an ON-OFF type control was implemented for the agitation system, using blades that facilitate the efficient mixing of the components. This simple and effective method ensures the uniformity of the syrup prior to its use in the process, thus optimising the initial conditions of the system.
- IoT sensor selection: For this research it was decided to use a sensor with IoT technology called Tilt Hydrometer (Figure 1), which is an affordable alternative and allows the remote and real-time measurement of the concentration of sugars and the temperature of liquids during fermentation processes, mainly in the production of beer and wine. It has a specific gravity measurement range of 0.9900 to 1.1200, with a resolution of 0.0001, and a temperature range of -17.8 °C to 60 °C (0 °F to 140 °F) with an accuracy of 0.1 °C, which allows very precise monitoring of the process [25].
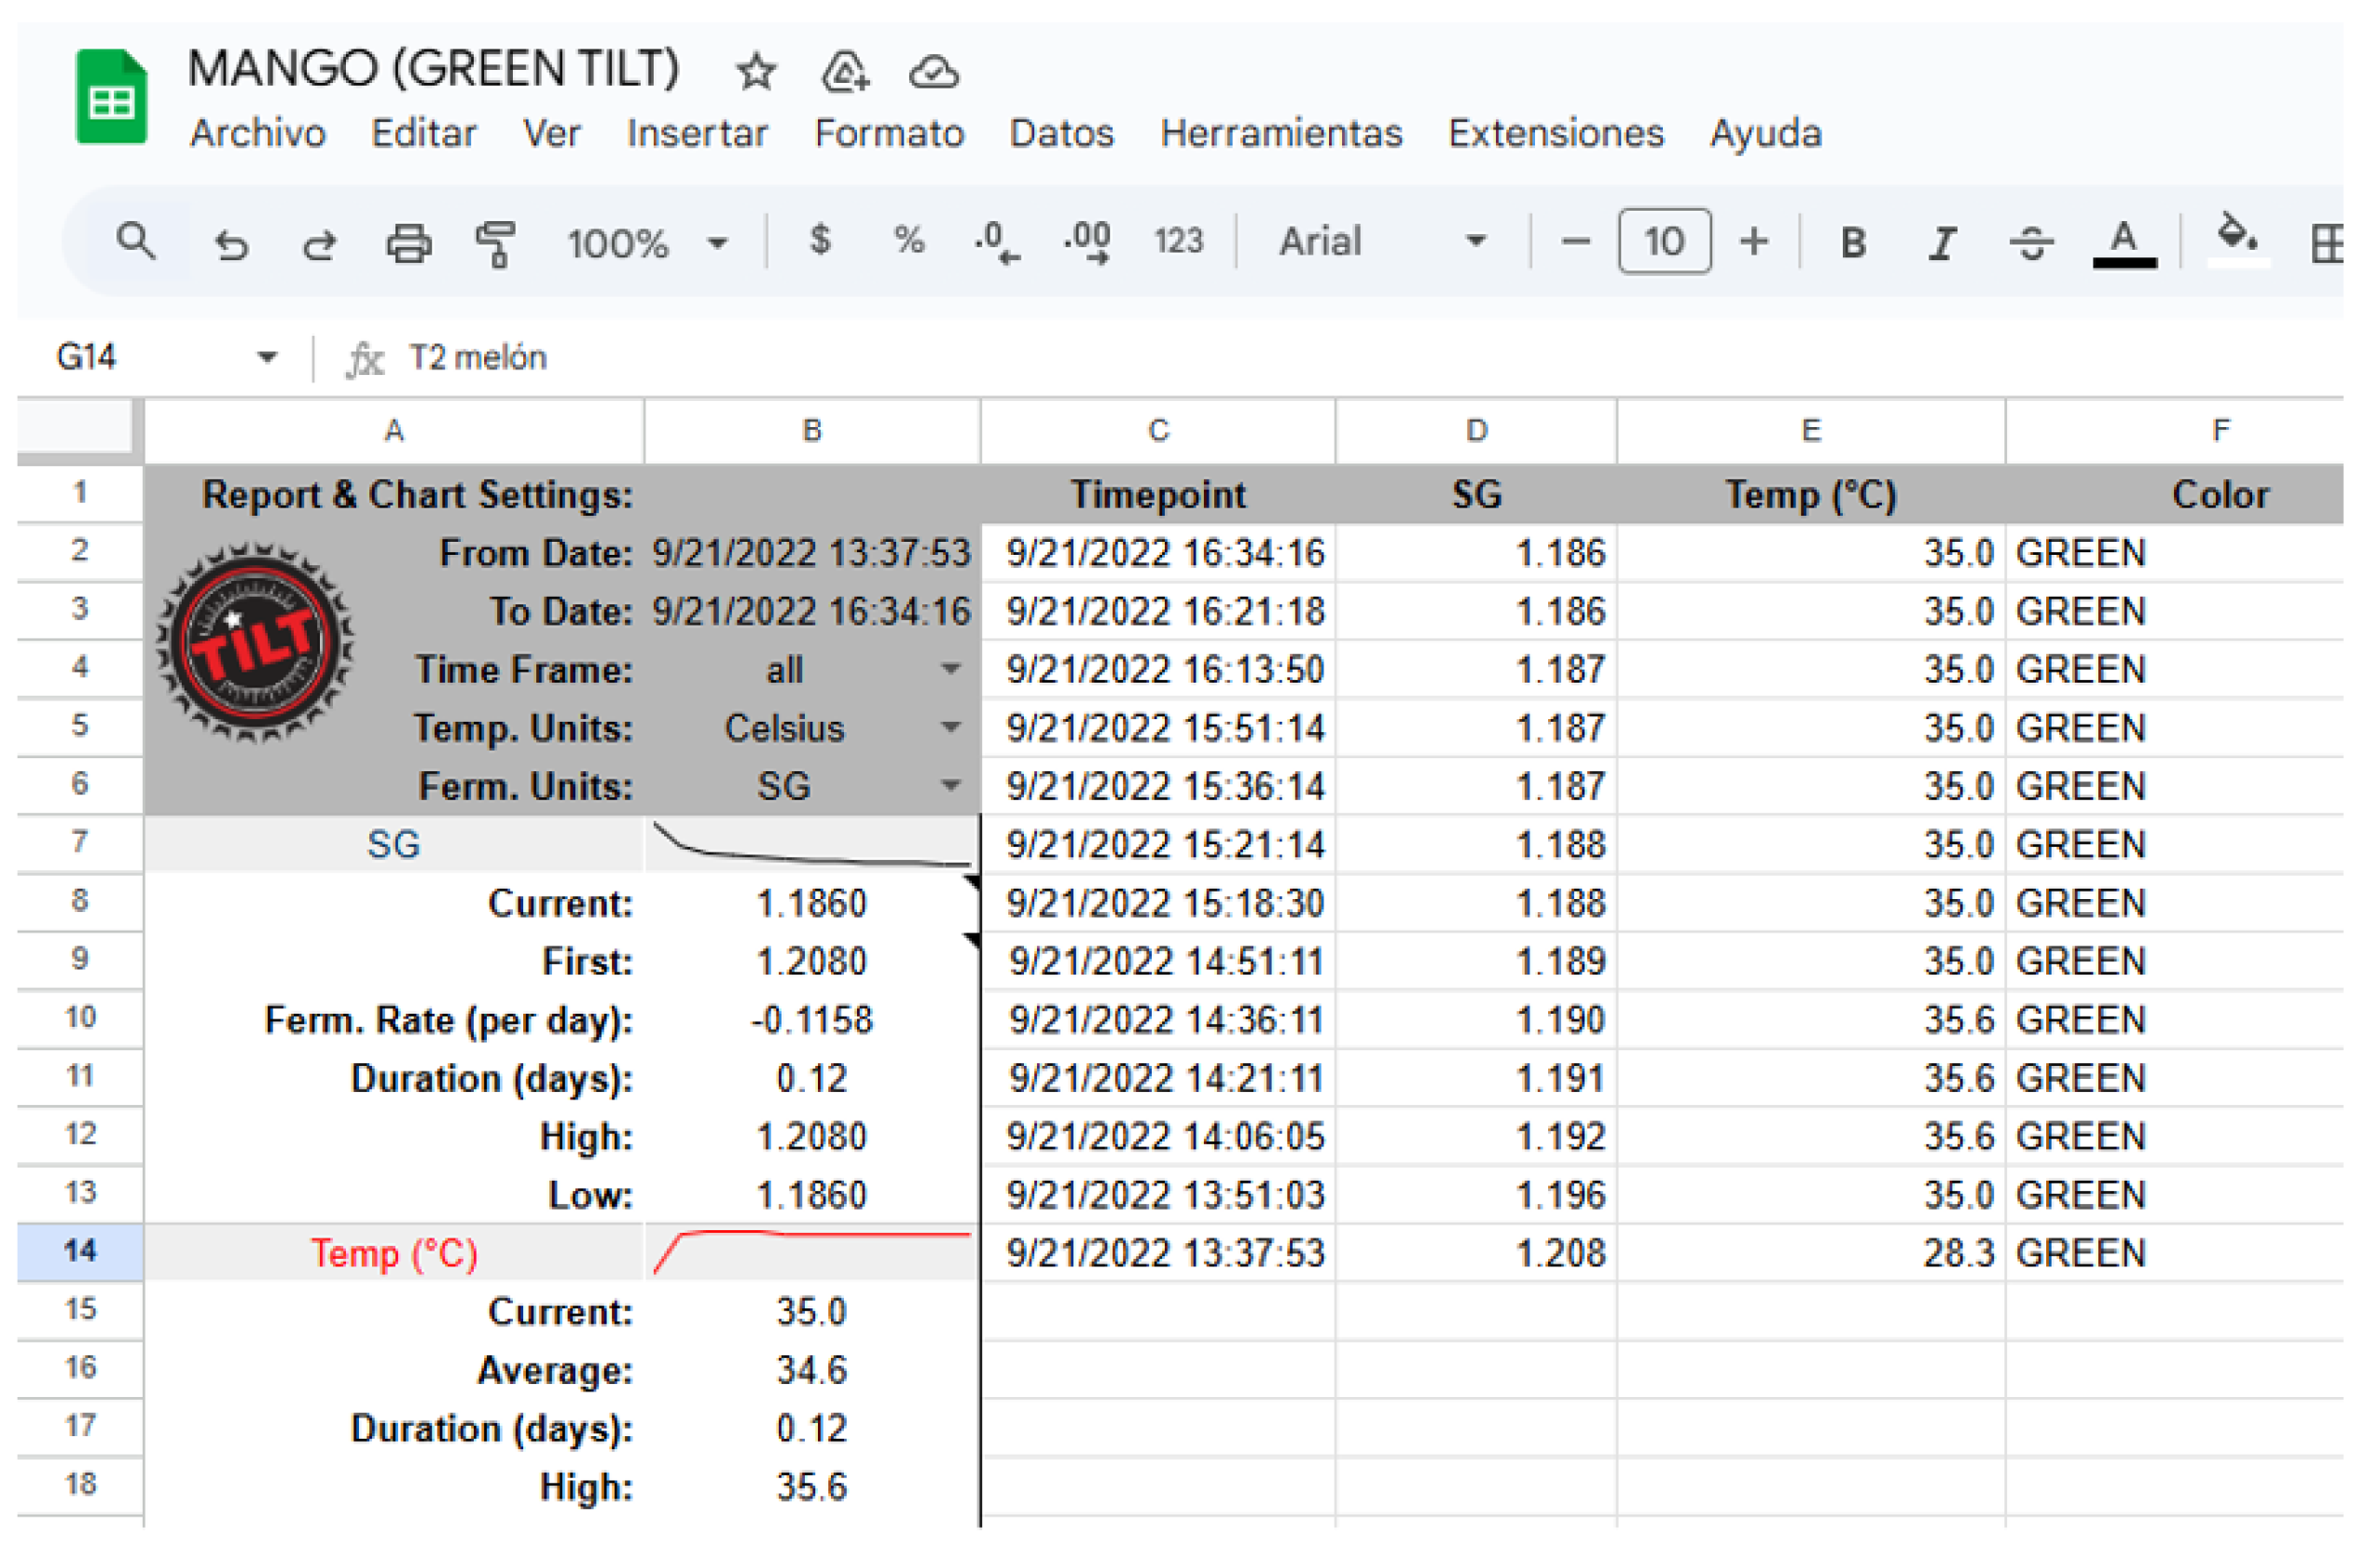
In terms of IoT technology, the Tilt Hydrometer uses Bluetooth 4.0+ connectivity to transmit data in real time to compatible devices such as smartphones (iOS and Android), tablets or systems such as Raspberry Pi via the free ‘Tilt 2’ app, which allows automatic viewing and recording of measurements, even storing them in the cloud through platforms such as Google Sheets (Figure 2), facilitating remote and continuous analysis of the process [26,27].
Figure 1.
“Tilt Hydrometer” float sensor (https://tilthydrometer.com/).
Figure 1.
“Tilt Hydrometer” float sensor (https://tilthydrometer.com/).
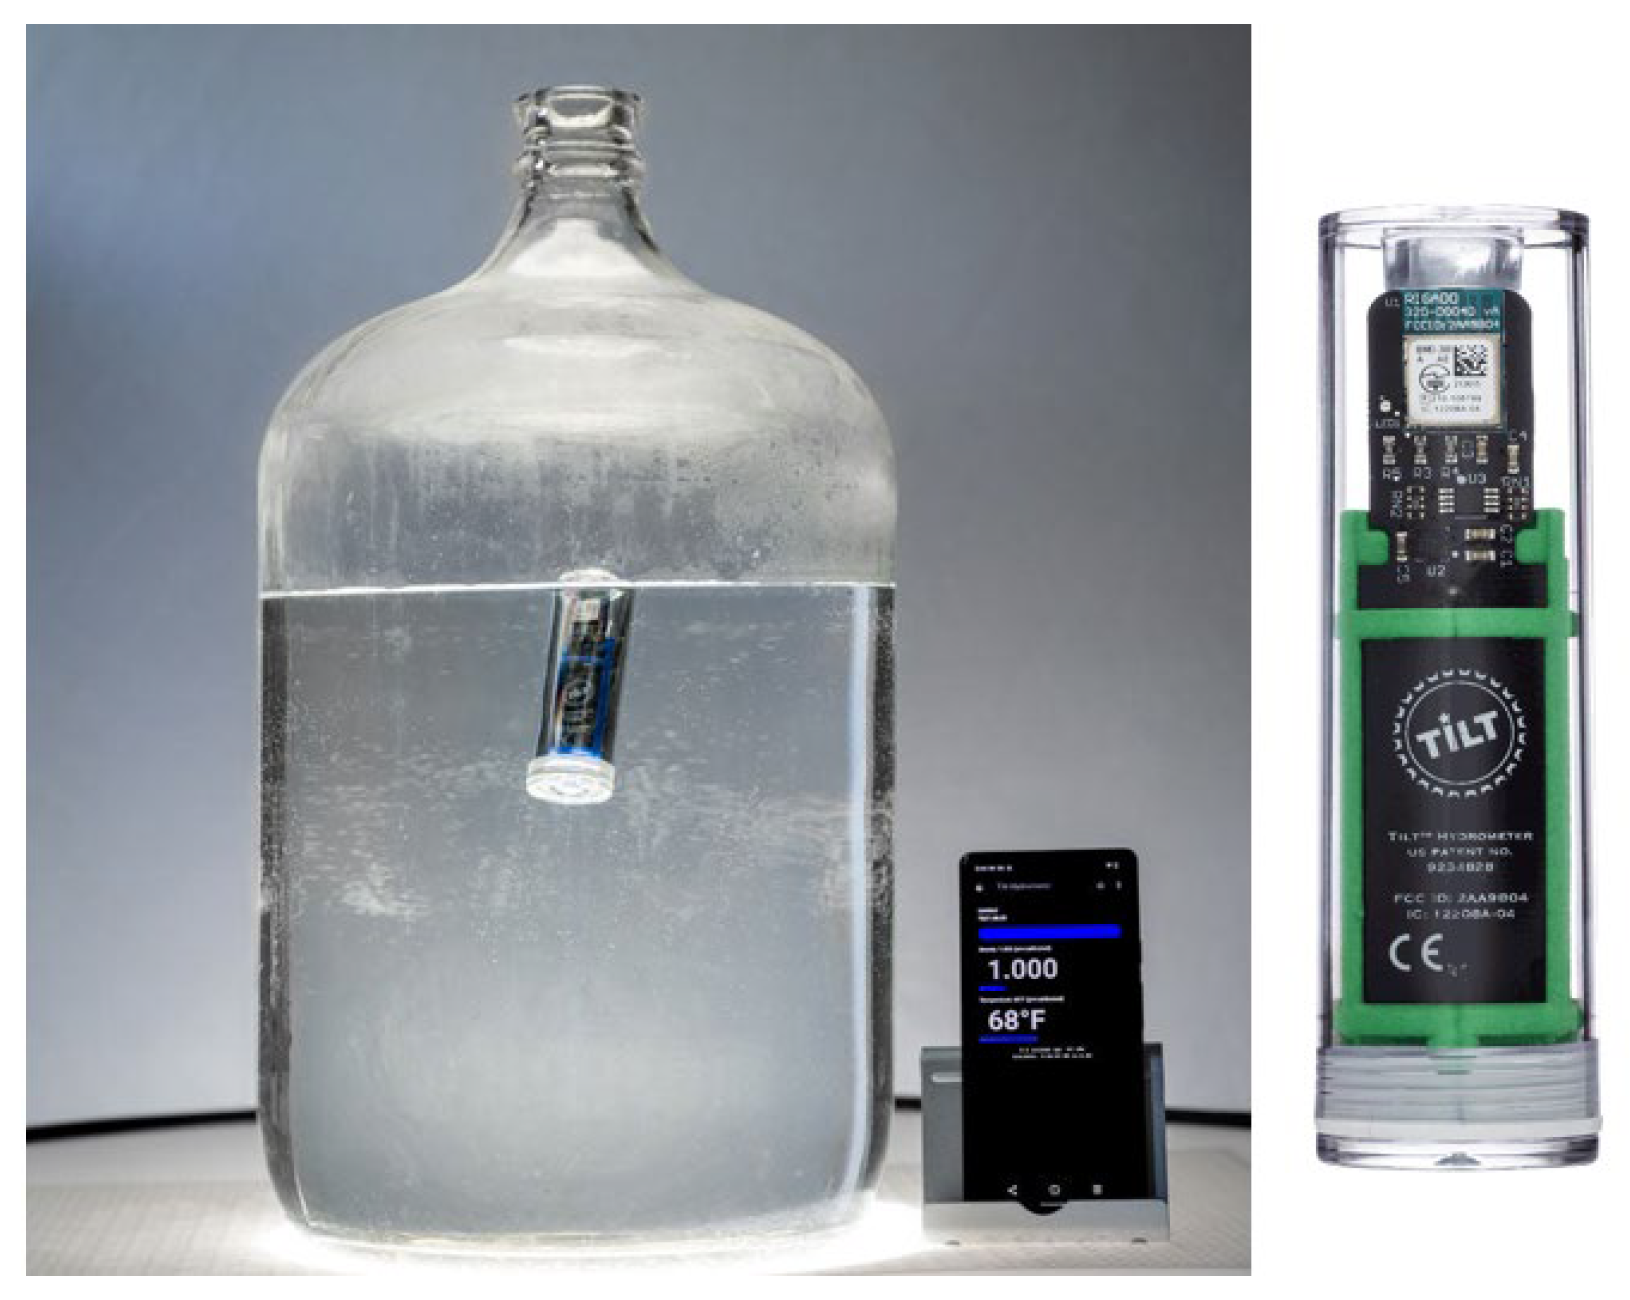
Figure 2.
Data obtained in real time by the “Tilt Hydrometer” stored in Google Sheets.
2.1.3. Control System
The control system was based on the use of an integrated system between a PLC and HMI HT3000-B7H where, the PLC programs dehydration cycles, adjusting parameters such as time, temperature and agitation according to the type of food The PLC activates/deactivates heating elements and recirculation pumps according to sensor readings. Moreover, The HMI allows real time data visualization and setpoint modification through touch screens (e.g., 45ºC temperature).
2.2. Evaluation of Equipment Performance
The methodology for testing the equipment was based on the work of [28] with some modifications. The fruit chosen for testing was mango, as it is a high-yield fruit in Peru. The tests correspond to the evaluation carried out by a group of thesis students from the Food Industries Engineering at the Universidad Nacional d Frontera who were part of the funded project from which this equipment originated. Figure 3 shows the resulting steps, which are explained below.
2.3. Sample Preparation
The mangoes (Mangifera indica) used in this study were obtained from a local market in the city of Tambogrande, Perú, selecting only fruits in good condition, without signs of excessive ripeness, bruising, or visible deterioration. To remove any residue or surface dirt, the fruits were washed with running water. They were then immersed in a 50-ppm chlorinated water solution for 5 minutes as a disinfection measure, following the guidelines established by FAO [29]. Ater disinfection, the peel was carefully removed using a peeler, and with the help of a specialized cutter, the mangoes were cut into 10 x 10 mm cubes, ensuring that the sizes were uniform to optimize the dehydration process.
2.3. Osmotic Dehydration
The designed equipment allowed maintaining the syrup temperature at 30 and 40 °C during the process and programming the recirculation in intervals for 120 and 180 minutes, which was the duration of the treatments. The fruit-to-syrup ratio used was 1:4. This process involved mass transfer, where the water contained in the fruit moved towards the osmotic solution, and the solutes from the solution entered the fruit. This process resulted in water loss from the fruit and solids gain. The mass transfer was evaluated by calculating water loss (WL), weight reduction (WR), and solids uptake (SG) following the method described in [30].
(1)
(2)
(3)
where and represent the initial weight and the weight after osmotic dehydration (OD), respectively, and and correspond to the moisture content before and after OD. Finally, and denote the concentration values in °Brix prior to and following the OD process.
Moisture content was measured using an MX-50 moisture analyzer, which enables faster determination compared to conventional methods. Meanwhile, the °Brix values were obtained through refractometry.
2.3. Hot air Drying
The drying process was performed using a hot air tray dryer set at a temperature of 50ºC. Drying continued until the moisture content was reduced to below 15%, as moisture levels above this threshold can promote fungal growth and spoilage [31]. Maintaining humidity below this limit is crucial to ensure the microbial stability and extended shelf life of the dried product [32].
2.4. Evaluation of Drying Kinetics
The moisture data obtained were recorded on a wet basis and subsequently converted to a dry basis for analysis. The reduced moisture (RM) was calculated for each drying time using the following equation:
(4)
Lewis: (5)
Page: (6)
Henderson–Pabis: (7)
The adjustment was performed using nonlinear regression with least squares, and the degree of representation of each model was evaluated using the coefficients of determination (R2) and the root mean square error (RMSE), according to criteria suggested by [36].
2.5. Evaluation of Drying Kinetics
A 23 factorial design (Table 2), where the factors are concentration (45 and 50 °Brix), temperature (30 and 40 °C), and time (120 and 180 min), with the response variables being weight reduction (WR), water loss (WL), solids gain (SG), and drying time. The treatments will be carried out in triplicate and the data obtained will be analyzed using ANOVA. An untreated control sample was used for drying kinetics comparisons.
3. Results and Discussions
3.1. Design of the Osmodehydrator
An osmotic dehydration equipment was built (Figure 4) with two tanks, one for the formulation of the syrups and the other for the process. The equipment also allows the process tank to be drenated, facilitating the extraction of the fruit after the process, with the help of a grid. The grid is specially designed to contain the fruit and to maintain the buoyancy of the sensor.
The process tank is also equipped with a heating system and a temperature control system to control the process temperature. Authors note that implementing a temperature control system is essential for optimizing mass transfer, minimizing energy consumption, and ensuring the quality and safety of osmo-dehydrated foods [4,37].
Moreover, the equipment incorporates a concentration sensor equipped with a Bluetooth module, which enables connection to the network and access to the sensor data from anywhere. A critical aspect in the design and control of osmotic dehydrators is the accurate and continuous measurement of the sugar concentration during the process, as this variable directly influences the dehydration kinetics and the final product properties [38]. Despite its importance, existing literature and designs do not include accessible sensors to measure this concentration in real time, due to the lack of inexpensive and suitable devices for this purpose [39]. This lack is due to the fact that most of the sensors available in the industry, such as industrial Brix meters (e.g., the BRIX MONITOR from Centec or the Teqwave H from Endress+Hauser), are oriented towards industrial applications with high costs and technical complexity that do not suit smaller scale projects or budget constraints.
The design also proposes an automated recirculation system with stainless steel pipes and a set of solenoid valves for control, avoiding the formation of diluted zones in the process tank. The use of systems with conventional blades or agitators can cut or damage the fruit, affecting its integrity and final quality [11,21].
The control system is interactive and with graphic interface of the process, in this way, on the panel we can observe a process graph, but also program the factors such as process temperature, agitation rpm for the syrup preparation tank, and the control of the valves for recirculation.
3.2. Automated Control System (PLC and HMI)
3.2.1. Control System Diagram
Figure 5 shows the diagram of the control system designed for the osmo-dehydration process, which integrates a PLC with an HMI model HT3000-B7H for automation and real-time monitoring. The diagram illustrates the connection between the temperature sensor, the heating actuator (electrical resistances) and the recirculation system, all controlled by the PLC. This scheme ensures efficient two-way communication between the components, ensuring thermal stability and homogeneity of the osmotic solution, key factors in optimizing mass transfer and preserving the quality of the final product.
3.2.2. HMI Functionalities
In the present automated system, the HT3000-B7H HMI (Human Machine Interface) played a key role in facilitating real-time monitoring and control of the osmo-dehydration process. Through its high-resolution touch screen, the HMI allowed continuous visualization of critical variables such as temperature, osmotic solution concentration (°Brix) and actuator status, providing the operator with clear and accessible information for immediate decision making.
The interface has a main menu (Figure 6) where the process development is graphically displayed, allowing an intuitive and dynamic visual monitoring of the variables during the operation.
In addition, the HMI interface has a specific submenu for syrup preparation (Figure 7), where the motor speed, running time, clockwise or counterclockwise rotation, as well as system start-up and shutdown can be controlled.
Additionally, it has a submenu dedicated to the control of the syrup temperature in the process tank (Figure 8), where it is possible to adjust and maintain the desired temperature, ensuring optimal conditions for dehydration.
Finally, the HMI includes a menu where the temperature trend is graphed over time (Figure 9), allowing the operator to perform a detailed follow-up and detect any deviation that requires intervention.
The integration of Human-Machine Interfaces (HMI) and Programmable Logic Controllers (PLC) in the design and automation of osmotic dehydrators is essential for optimizing the dehydration process and ensuring the quality of the final product. Both HMI and PLC enhance the control and monitoring capabilities of the system, allowing for precise adjustments in response to real-time data inputs.
Osmotic dehydration (OD) applications in food processing necessitate precise control over several parameters, such as osmotic agent concentration, temperature, and time, which are critical for achieving desired moisture content and preserving food quality. The HMI provides a user-friendly interface for operators to interact with the system, enabling them to set parameters, monitor progress, and assess the performance of the dehydration process visually [40]. With features to display critical data, HMI systems enhance users’ ability to manage variations in fluid dynamics and mass transfer mechanisms occurring during osmotic dehydration, which have been discussed in various studies [41,42].
On the other side, PLC plays a vital role in automation by executing control commands based on the parameters set through the HMI. It enables the orchestration of multiple processes such as maintaining the osmotic solution’s temperature, which are crucial for optimal mass transfer. The automation capabilities of PLC enhance reproducibility and consistency in food processing, leading to improved product quality [43]. The seamless communication between HMI and PLC allows operators not only to observe the process but also to intervene directly adjusting setpoints, initiating start/stop commands, or troubleshooting faults in real time [19,44,45]. This integration reduces manual intervention, minimizes human error, and enhances the reliability and repeatability of industrial processes [18,46].
Recent advancements have led to the development of integrated HMI-PLC units, which combine control and visualization in a single device, further streamlining system architecture, reducing wiring and installation costs, and facilitating remote access and diagnostics [46]. Such systems are particularly valuable in applications requiring high flexibility, rapid changeovers, and stringent quality control, as seen in food processing, pharmaceuticals, and advanced manufacturing [45,46]. Overall, the combined use of HMI and PLC not only optimizes process automation but also empowers operators with actionable information, contributing to improved productivity, safety, and process transparency [18,46].
3.3. Performance Test
An osmotic dehydration process was carried out on mango (Mangifera indica) by immersing pieces of the fruit in sucrose solutions of different concentrations. For this experiment, the main variables considered were solution concentration, temperature, and immersion time, following a 23 factorial design. Throughout the procedure, the osmotic dehydration equipment operated optimally, maintaining stable and controlled conditions that allowed precise management of temperature and recirculation time. This technological efficiency facilitated the observation of significant changes in the mango’s response to the different treatments, enabling a more accurate analysis of how these factors influence mass transfer and the final product quality. The results demonstrated that osmotic dehydration was effective in reducing the water content of the mango while preserving the fruit’s structure, a fundamental aspect for subsequent drying stages.
3.3.1. Mass Transfer Evaluation
Mass transfer was evaluated using three response variables: weight reduction (WR), water loss (WL), and solid gain (SG). The data were evaluated using the Shapiro-Wilk normality test, obtaining p-values > 0.05, allowing the application of factorial ANOVA. Table 3 presents a summary of the mass transfer results obtained.
Statistical analyses using ANOVA models for the variables water loss (WL) and weight reduction (WR) showed highly significant results with an excellent fit, having coefficients of determination R2 of 0.995 in both cases (WL: p < 0.001; WR: p < 0.001). Regarding WL, significant effects were identified for the three main factors—concentration, temperature, and time—as well as for the interactions concentration*temperature and temperature*time. For WR, these same main factors were also significant, along with the interactions concentration*time and temperature*time. The average values of WL ranged from 18.62 ± 0.33 to 39.15 ± 1.34, while for WR the values varied from 9.48 ± 0.46 to 34.47 ± 1.34, showing a clear increase in both variables as the levels of sucrose concentration, temperature, and time increased. The predominant effect of temperature on water loss stands out, reflecting its decisive influence on the osmotic process.
In the case of solids gain (SG), the analysis of variance revealed a statistically significant model (p < 0.001), although with a lower coefficient of determination (R2 = 0.772), indicating a more moderate fit compared to the other variables. Significance was found only for the main effect of concentration and its interaction with time. SG values ranged from 6.87 ± 0.23 (T3) to 9.31 ± 0.73 (T7), clearly showing that this variable was primarily influenced by the concentration of the osmotic agent. Treatments with more concentrated solutions promoted greater incorporation of soluble solids into the fruit, especially when combined with longer immersion times.
Figure 10 shows the interaction graphs for WR and Wl at temperatures of 30°C and 40°C. The interaction shows that both water loss (WL) and weight reduction (WR) in mango increase with longer immersion times, higher osmotic solution concentrations (45 and 50 °Brix), and temperature. At 30 °C, both processes show a moderate increase: WL rises from approximately 18.62% to 23.45% at 45 °Brix and from 19.38% to 25.20% at 50 °Brix, while WR increases from 9.48% to 16.42% at 45 °Brix and from 11.67% to 19.53% at 50 °Brix, reflecting less intense mass transfer. At 40 °C, both WL and WR increase significantly, with WL reaching between 32.76% and 36.89% at 45 °Brix and from 35.80% to 39.15% at 50 °Brix; WR rises from 25.36% to 31.80% at 45 °Brix and from 29.25% to 34.47% at 50 °Brix. This greater increase is attributed to enhanced molecular mobility and diffusion rate, which favor the movement of water and solids from inside the fruit to the solution. In all cases, the final loss is clearly influenced by the osmotic gradient, exposure time, and especially temperature, which is a key factor for process efficiency.
Regarding the effect of temperature, various studies have shown that increasing temperature, especially within the range of 45 °C to 60 °C, promotes greater water loss. Authors of Ref. [47] attribute this effect to the expansion of cell membranes, which lowers resistance to mass transfer and facilitates water exit. Similarly, Ref. [48] indicate that elevated temperatures reduce the viscosity of the osmotic solution, easing the movement of water and solutes through the mango’s membranes. Likewise, Ref. [49] reported a statistically significant influence of temperature on water loss during osmotic dehydration, with a p-value below 0.05, confirming the crucial role temperature plays in the efficiency of water removal in this process.
In Figure 11, the interaction shows that when the solution was kept at 40°C, a similar trend was observed, but with considerably higher weight loss values. In the treatments with 50°Brix, the WR increased from 29.25% to 34.47% when going from 120 to 180 minutes, while with 45°Brix it increased from 25.36% to 31.80%. The immersion time in osmotic solutions is a key factor in mango osmotic dehydration, as longer durations significantly increase both water loss (WL) and solids gain (SG). Ref. [50] reported a statistically significant correlation between treatment time and these parameters (p < 0.01). More recent studies, such as Ref. [51], indicated that SG tends to stabilize after 2 to 4 hours under controlled conditions, supporting previous findings that suggest a linear relationship between immersion time and both WL and SG [52].
The concentration of the osmotic agent has also been extensively studied in these processes. Ref. [53] observed that moderate increases in osmotic solution concentration favor weight loss and solids gain with statistical significance (p < 0.05). However, other researchers have found that very high concentrations may reduce solids gain efficiency, indicating the existence of an optimal point that maximizes the benefits of the process [54]. This is explained by the formation of a solute layer on the mango surface, which acts as a barrier to solute transfer, a phenomenon documented in the osmotic dehydration of various fruits [55]. Therefore, intermediate concentrations, typically between 40 and 60 °Brix, are considered most suitable for maintaining product quality and optimizing the process [53,56].
Finally, the interaction among different process factors is crucial for its effectiveness. Ref. [57] demonstrated that the combination of temperature and osmotic solution concentration synergistically influences the efficiency of osmotic dehydration. This view is supported by various studies concluding that the highest levels of water loss and solids gain are achieved when temperature, concentration, and treatment time are optimized together [55,58,59].
3.3.2. Evaluation of Drying Kinetics After Osmotic Dehydration
Figure 12 presents a graph showing the drying curves of the treatments. Treatments T1, T2, T3, and T5 display a rapid decline, indicating more efficient drying and greater water loss within a shorter time frame. In contrast, T6 and T7 maintain higher moisture levels for a longer period, suggesting increased resistance to drying, which may be related to solids gain. The treatment T0, representing fresh mango, starts with the highest moisture content, approximately between 4 and 5 g/g dry matter, and experiences a steep decrease. Lastly, treatments T4 and T8 show a reduction in moisture as well, but in a more moderate manner compared to the others.
The results of the kinetic model fitting for each evaluated treatment are shown in Table 4. Overall, the Page model provided the highest coefficients of determination (R2 > 0.97), indicating the best fit in most cases, particularly in treatments T2 (R2 = 0.9919) and T3 (R2 = 0.9978). This superior performance of the Page model aligns with previous studies; for instance, Ref. [60] reported that this model accurately described the drying kinetics of onion slices, while Ref. [61] found similar results in mango slices, demonstrating its efficacy for products with varying moisture contents. Additionally, Ref. [62], in a comprehensive review, highlighted the robustness and applicability of the Page model in diverse drying processes. Meanwhile, the Henderson-Pabis model, which includes an additional parameter, showed comparable performance, particularly in treatment T6 (R2 = 0.9950), suggesting it is also suitable for handling the complexity of mango drying kinetics, a finding supported by Ref. [63], who reported R2 values above 0.97 for this model in banana cultivars. In contrast, the Lewis model exhibited limitations, as evidenced by its poor fit in treatment ST (R2 = 0.7370). Studies such as Ref. [64] have documented that the Lewis model is insufficient to represent complex moisture transfer dynamics under variable conditions.
The parameter k, representing the drying rate constant, varied across treatments, reflecting differences in drying speed likely influenced by variations in fruit characteristics or treatment conditions (see Figure 13 for treatments T0 to T3, and Figure 14 for treatments T4 to T8). Treatments such as T3 showed notably high k values in the Page model, indicative of a more rapid drying process possibly due to increased porosity or lower moisture retention. Furthermore, the parameter n in the Page model, which modulates the curve shape, suggested differing drying mechanisms among treatments, with values diverging from unity pointing to more complex moisture removal dynamics beyond simple exponential decay. In this regard, treatments T1 and T2 exhibited higher drying rates compared to T6 and T8, a result consistent with Ref. [65], who indicated that prolonged exposures can create diffusion barriers slowing drying, as observed in treatments with higher concentrations and longer times.
5. Conclusions
An innovative and automated osmotic dehydrator design was presented, integrating PLC, HMI technologies, and IoT sensors for real-time control of syrup concentration, a critical parameter in the osmotic dehydration process. This integration allows precise and automated management of process variables, as well as an intuitive interface for operator monitoring and adjustment, significantly improving operational efficiency and user experience. However, it is important to note that the system is still at the design stage, and validation tests to evaluate its practical functionality and effectiveness under real operating conditions have not yet been conducted.
Regarding the practical application, osmotic dehydration of mango was successfully performed under different combinations of sucrose concentration, immersion time, and temperature, achieving an adequate balance between water loss and solids gain. The osmotic pretreatment contributed to accelerating the drying rate, optimizing the time required to reach low moisture levels without compromising the organoleptic properties of the product, which were well received in sensory evaluation. These results confirm the potential of the process to improve quality and efficiency in mango dehydration. Furthermore, it is recommended to assess the impact of the automated process on the nutritional and functional quality of the final product, as well as to study the scalability of the system for industrial applications.
6. Patents
Currently, a utility model application is being prepared to protect the technical innovation of the developed osmotic dehydration prototype.
Author Contributions
Conceptualization and project coordination, M.S.-C.; Methodology and investigation, M.S.-C. and L.C.F.-M.; Validation and formal analysis, W.R.M.-Z. and J.S.-C.; Data curation, L.C.F.-M.; Writing—original draft preparation, M.S.-C. and L.C.F.-M.; Writing—review and editing, W.R.M.-Z. and J.S.-C. All authors have read and approved the final manuscript.
Funding
This research was funded by the project “Deshidratación osmótica como tecnología emergente para la innovación en la conservación de alimentos”, developed and financed under agreement No. 004-2024 by the Universidad Nacional de Frontera (UNF). The publication costs were also funded by the same project.
Data Availability Statement
The data that support the findings of this study are available from the corresponding author upon reasonable request. No publicly archived datasets were generated or analyzed during this study. Data sharing is not applicable due to ongoing project confidentiality.
Conflicts of Interest
The authors declare no conflicts of interest. The funders had no role in the design of the study; in the collection, analyses, or interpretation of data; in the writing of the manuscript; or in the decision to publish the results.
Abbreviations
The following abbreviations are used in this manuscript:
| OD | Osmotic Dehydration |
| WR | Weight reduction |
| WL | Water loss |
| SG | Solid gain |
| PLC | Programmable Logic Controller |
| HMI | Human-Machine Interface |
| IoT | Internet of things |
| PID | Proportional-Integral-Derivative |
References
- De Corato, U. Improving the Shelf-Life and Quality of Fresh and Minimally-Processed Fruits and Vegetables for a Modern Food Industry: A Comprehensive Critical Review from the Traditional Technologies into the Most Promising Advancements. Crit Rev Food Sci Nutr 2020, 60, 940–975. [Google Scholar] [CrossRef]
- Robles-Sánchez, R.M.; Rojas-Graü, M.A.; Odriozola-Serrano, I.; González-Aguilar, G.A.; Martín-Belloso, O. Effect of Minimal Processing on Bioactive Compounds and Antioxidant Activity of Fresh-Cut “Kent” Mango (Mangifera Indica L.). Postharvest Biol Technol 2009, 51, 384–390. [Google Scholar] [CrossRef]
- Abrahão, F.R.; Corrêa, J.L.G. Osmotic Dehydration: More than Water Loss and Solid Gain. Crit Rev Food Sci Nutr 2023, 63, 2970–2989. [Google Scholar] [CrossRef] [PubMed]
- Chandra, S.; Kumari, D. Recent Development in Osmotic Dehydration of Fruit and Vegetables: A Review. Crit Rev Food Sci Nutr 2015, 55, 552–561. [Google Scholar] [CrossRef] [PubMed]
- Ciurzy, A.; Kowalska, H.; Czajkowska, K.; Lenart, A. Osmotic Dehydration in Production of Sustainable and Healthy Food. Trends Food Sci Technol 2016, 50, 186–192. [Google Scholar] [CrossRef]
- Ahmed, I.; Qazi, I.M.; Jamal, S. Developments in Osmotic Dehydration Technique for the Preservation of Fruits and Vegetables. Innovative Food Science and Emerging Technologies 2016, 34, 29–43. [Google Scholar] [CrossRef]
- Nowacka, M.; Dadan, M.; Tylewicz, U. Current Applications of Ultrasound in Fruit and Vegetables Osmotic Dehydration Processes. Applied Sciences 2021, Vol. 11, Page 1269 2021, 11, 1269. [Google Scholar] [CrossRef]
- Asghari, A.; Zongo, P.A.; Osse, E.F.; Aghajanzadeh, S.; Raghavan, V.; Khalloufi, S. Review of Osmotic Dehydration: Promising Technologies for Enhancing Products’ Attributes, Opportunities, and Challenges for the Food Industries. Compr Rev Food Sci Food Saf 2024, 23, e13346. [Google Scholar] [CrossRef]
- Dermesonlouoglou, E.; Pittas, L.; Taoukis, P.; Giannakourou, M. Osmodehydrofreezing of Tomatoes: Optimization of Osmotic Dehydration and Shelf Life Modeling. Foods 2024, 13, 2689. [Google Scholar] [CrossRef]
- Mari, A.; Parisouli, D.N.; Krokida, M. Exploring Osmotic Dehydration for Food Preservation: Methods, Modelling, and Modern Applications. Foods 2024, Vol. 13, Page 2783 2024, 13, 2783. [Google Scholar] [CrossRef]
- Flores-Mendoza, L.C.; Calle-Berru, E.M.; Sanchez-Chero, M. IoT Implemented Osmotic Dehydrator. Current Research in Nutrition and Food Science 2023, 11, 1204–1217. [Google Scholar] [CrossRef]
- Caldwell, D.G.; Davis, S.; Moreno Masey, R.J.; Gray, J.O. Automation in Food Processing. Springer Handbook of Automation 2009, 1041–1059. [Google Scholar] [CrossRef]
- Rehg, J. Plcs In The New Automation Laboratory. 2020, 7.920.1-7.920.6. [CrossRef]
- Nica, E.; Stehel, V. Internet of Things Sensing Networks, Artificial Intelligence-Based Decision-Making Algorithms, and Real-Time Process Monitoring in Sustainable Industry 4.0. Journal of Self-Governance and Management Economics 2021, 9, 35–47. [Google Scholar]
- Ahmed, J.; Shafiur Rahman, M. Automation and Process Control. In Handbook of Food Process Design; Wiley, 2012; p. 1522 ISBN 9781444330113.
- Arreola-Burciaga, J.; Garza-Moya, L.; Tovar-Rosas, C. Automation of Solar Fruit and Vegetable Dehydrator. Revista de Ingeniería Innovativa 2018, 2, 1–7. [Google Scholar]
- Gunasekaran, S. Automation of Food Processing. In Food Engineering; Barbosa-Cánovas, G.V., Ed.; EOLSS Publishers/UNESCO: Oxford, 2009; Volume IV, pp. 102–122. [Google Scholar]
- Mhetraskar, S.S.; Namekar, S.A.; Holmukhe, R.M.; Tamke, S.M. Industrial Automation Using PLC, HMI and Its Protocols Based on Real Time Data for Analysis. Int. J. Adv. Res. Eng. Technol. 2020, 11, 1353–1363. [Google Scholar]
- Koshti, V.M.; Joshi, S.M. Design of Human Machine Interface for Plc Based Automation System. IFAC Proceedings Volumes 2007, 40, 343–346. [Google Scholar] [CrossRef]
- Ahmed, J.; Shafiur Rahman, M. Automation and Process Control. In Handbook of Food Process Design; Wiley, 2012; p. 1522 ISBN 9781444330113.
- Tortoe, C. A Review of Osmodehydration for Food Industry. African Journal of Food Science 2010, 4, 303–324. [Google Scholar]
- Muñiz-Becerá, S.; Méndez-Lagunas, L.L.; Rodríguez-Ramírez, J. Solute Transfer in Osmotic Dehydration of Vegetable Foods: A Review. J Food Sci 2017, 82, 2251–2259. [Google Scholar] [CrossRef]
- Tu, W.A.; F. ; Ali, S.W.; Terriche, Y.; Guerrero, J.M.; Hooman, K.; Jamil, A.A.; Fu Tu, W.; Ali, S.W.; Terriche, Y.; Guerrero, J.M.; et al. Fractional-Order PID Controllers for Temperature Control: A Review. Energies 2022, Vol. 15, Page 3800 2022, 15, 3800. [Google Scholar] [CrossRef]
- Nair, R.; Mohan, K. Control of Temperature Using PID Controller. International Journal of Science and Research (IJSR) 2016, 5, 1203–1206. [Google Scholar] [CrossRef]
- TiltHydrometer. Available online: https://tilthydrometer.com/products/copy-of-dealer-price-float-tank-hydrometer (accessed on 21 June 2025).
- TiltHydrometer Tilt Float Hydrometer for Float Pods—Tilt Hydrometer Available online:. Available online: https://tilthydrometer.com/products/copy-of-dealer-price-float-tank-hydrometer (accessed on 22 May 2022).
- Schlegel, B. Review: TILT Electric Hydrometer Tracking Specific Gravity over Time Available online:. Available online: https://bierbot.com/blog/hardware-reviews/tilt-electric-hydrometer-specific-gravity/ (accessed on 16 April 2025).
- Valdiviezo-Seminario, C.S.; Sánchez-Chero, M.J.; Flores-Mendoza, L.C. Effect of Osmotic Dehydration Pretreatment On Melon (Cucumis Melo) Drying Time. Current Research in Nutrition and Food Science 2024, 12, 1421–1432. [Google Scholar] [CrossRef]
- FDA Guidance for Industry: Guide to Minimize Microbial Food Safety Hazards for Fresh Fruits and Vegetables; 1998.
- Bozkir, H.; Rayman Ergün, A.; Serdar, E.; Metin, G.; Baysal, T. Influence of Ultrasound and Osmotic Dehydration Pretreatments on Drying and Quality Properties of Persimmon Fruit. Ultrason Sonochem 2019, 54, 135–141. [Google Scholar] [CrossRef]
- Badui D, Salvador. Química de Los Alimentos; 5th ed.; PEARSON EDUCAClÓN: México, 2013. [Google Scholar]
- Kilic, M.; Sahin, M.; Hassan, A.; Ullah, A. Preservation of Fruits through Drying—A Comprehensive Review of Experiments and Modeling Approaches. J Food Process Eng 2024, 47, e14568. [Google Scholar] [CrossRef]
- Akpinar, E.K.; Bicer, Y.; Yildiz, C. Thin Layer Drying of Red Pepper. J Food Eng 2003, 59, 99–104. [Google Scholar] [CrossRef]
- Vega-Gálvez, A.; Notte-Cuello, E.; Lemus-Mondaca, R.; Zura, L.; Miranda, M. Mathematical Modelling of Mass Transfer during Rehydration Process of Aloe Vera (Aloe Barbadensis Miller). Food and bioproducts processing 2009, 87, 254–260. [Google Scholar] [CrossRef]
- Doymaz, I. Evaluation of Some Thin-Layer Drying Models of Persimmon Slices (Diospyros Kaki L.). Energy Convers Manag 2012, 56, 199–205. [Google Scholar] [CrossRef]
- Doymaz, I. Drying Kinetics of White Mulberry. J Food Eng 2004, 61, 341–346. [Google Scholar] [CrossRef]
- Anil, A.; Jadhav, H.B.; Shewale, S.R.; Annapure, U.S. Osmo Hydrocolloid Assisted Dehydration of Onion Slices: Effect on Bioactive Components, Rehydration, Microstructure. Measurement: Food 2024, 16, 100207. [Google Scholar] [CrossRef]
- Rastogi, N.K.; Raghavarao, K.S.M.S.; Niranjan, K.; Knorr, D. Recent Developments in Osmotic Dehydration: Methods to Enhance Mass Transfer. Trends Food Sci Technol 2002, 13, 48–59. [Google Scholar] [CrossRef]
- Flores-Mendoza, L.C.; Calle-Berru, E.M.; Sanchez-Chero, M. IoT Implemented Osmotic Dehydrator. Current Research in Nutrition and Food Science 2023, 11, 1204–1217. [Google Scholar] [CrossRef]
- Silva, M.A. da C.; Silva, Z.E. da; Mariani, V.C.; Darche, S. Mass Transfer during the Osmotic Dehydration of West Indian Cherry. LWT—Food Science and Technology 2012, 45, 246–252. [Google Scholar] [CrossRef]
- Kucner, A.; Papiewska, A.; Klewicki, R.; Sójka, M.; Klewicka, E. Influence of Thermal Treatment on the Stability of Phenolic Compounds and the Microbiological Quality of Sucrose Solution Following Osmotic Dehydration of Highbush Blueberry Fruits. Acta Sci Pol Technol Aliment 2014, 13, 79–88. [Google Scholar] [CrossRef] [PubMed]
- Haneef, N.; Hanif, N.; Hanif, T.; Raghavan, V.; Garièpy, Y.; Wang, J. Food Fortification Potential of Osmotic Dehydration and the Impact of Osmo-Combined Techniques on Bioactive Component Saturation in Fruits and Vegetables. Brazilian Journal of Food Technology 2024, 27. [Google Scholar] [CrossRef]
- Qubasi, M.; Shekib, L.; El-Shimy, N.M.; Mousa, H. Effect of Osmotic-Air Dehydration on Drying Kinetics and Microstructure of Apple Slices and Cubes. Journal of Food and Dairy Sciences 2015, 6, 405–418. [Google Scholar] [CrossRef]
- Koondhar, M.A.; Kaloi, G.S.; Junejo, A.K.; Soomro, A.H.; Chandio, S.; Ali, M. The Role of PLC in Automation, Industry and Education Purpose: A Review. Pakistan Journal of Engineering, Technology & Science 2023, 11, 22–31. [Google Scholar]
- Chang, W.; Xie, J.; Wang, J.; Teng, W.; Sun, Y.; Zheng, M. Application of PLC and HMI in the Measurement and Control Platform of Single-Tube Heat Transfer Experiment Rig. Advances in Mechanical Engineering 2020, 12. [Google Scholar] [CrossRef]
- Harwell, R. Integrated HMI and PLC. Intech with Industrial Computing 2012, 59. [Google Scholar]
- Devic, E.; Guyot, S.; Daudin, J.D.; Bonazzi, C. Effect of Temperature and Cultivar on Polyphenol Retention and Mass Transfer during Osmotic Dehydration of Apples. J Agric Food Chem 2010, 58, 606–614. [Google Scholar] [CrossRef]
- Vieira, G.S.; Pereira, L.M.; Hubinger, M.D. Optimisation of Osmotic Dehydration Process of Guavas by Response Surface Methodology and Desirability Function. International Journal of Food Science & Technology 2012, 47, 132–140. [Google Scholar] [CrossRef]
- Filho, R. dos S.F.; Gusmão, R.P. de; Silva, W.P. da; Gomes, J.P.; Filho, E.V.C.; El-Aouar, Â.A. Osmotic Dehydration of Pineapple Stems in Hypertonic Sucrose Solutions. Agricultural Sciences 2015, 06, 916–924. [Google Scholar] [CrossRef]
- Nagai, L.Y.; Santos, A.B.; Faria, F.A.; Boscolo, M.; Mauro, M.A. Osmotic Dehydration of Mango with Ascorbic Acid Impregnation: Influence of Process Variables. J Food Process Preserv 2015, 39, 384–393. [Google Scholar] [CrossRef]
- Zongo, A.P.; Khalloufi, S.; Ratti, C. Sugar Profiles Modulation of Mangoes during Osmotic Dehydration in Agave Syrup Solutions. J Food Sci 2023, 88, 228–243. [Google Scholar] [CrossRef]
- Zhao, J.H.; Ding, Y.; Yuan, Y.J.; Xiao, H.W.; Zhou, C.L.; Tan, M.L.; Tang, X.M. Effect of Osmotic Dehydration on Desorption Isotherms and Glass Transition Temperatures of Mango. International Journal of Food Science & Technology 2018, 53, 2602–2609. [Google Scholar] [CrossRef]
- Galdino, P.O.; Queiroz, A.J. de M.; Figueirêdo, R.M.F. de; Santiago, Â.M.; Galdino, P.O. Production and Sensory Evaluation of Dried Mango. Revista Brasileira De Engenharia Agrícola E Ambiental 2021, 25, 44–50. [Google Scholar] [CrossRef]
- do Carmo, J.R.; Corrêa, J.L.G.; Resende, M.; Cirillo, M.Â.; Corona-Jiménez, E.; Telis-Romero, J. Mango Enriched with Sucrose and Isomaltulose (Palatinose®) by Osmotic Dehydration: Effect of Temperature and Solute Concentration through the Application of Multilevel Statistical Models. J Food Process Preserv 2022, 46. [Google Scholar] [CrossRef]
- Mundada, M.; Singh, B.; Maske, S. Optimisation of Processing Variables Affecting the Osmotic Dehydration of Pomegranate Arils. International Journal of Food Science & Technology 2010, 45, 1732–1738. [Google Scholar] [CrossRef]
- Azoubel, P.M.; Da Silva, F.O. Optimisation of Osmotic Dehydration of ‘Tommy Atkins’ Mango Fruit. International Journal of Food Science & Technology 2008, 43, 1276–1280. [Google Scholar] [CrossRef]
- Liu, B.; Peng, B. Modelling and Optimization of Process Parameters for Strawberry Osmotic Dehydration Using Central Composite Rotatable Design. J Food Qual 2017, 2017. [Google Scholar] [CrossRef]
- Assis, F.R.; Morais, R.M.S.C.; Morais, A.M.M.B. Mathematical Modelling of Osmotic Dehydration Kinetics of Apple Cubes. J Food Process Preserv 2017, 41. [Google Scholar] [CrossRef]
- Bhagya Raj, G.V.S.; Dash, K.K. Ultrasound Assisted Osmotic Dehydration of Dragon Fruit Slices: Modeling and Optimization Using Integrated Artificial Neural Networks and Genetic Algorithms. J Food Process Preserv 2022, 46. [Google Scholar] [CrossRef]
- Süfer, Ö.; Sezer, S.; Demir, H. Thin Layer Mathematical Modeling of Convective, Vacuum and Microwave Drying of Intact and Brined Onion Slices. J Food Process Preserv 2017, 41. [Google Scholar] [CrossRef]
- Xia, D.; Jiang, L.; Cheng, J.; Hou, X.; Li, S.; Luo, Q.; Shen, G.; Wu, H.; Chen, A.; Zhang, Z. Influence of Drying Methods on Quality of Zanthoxylum Armatum DC. and Mathematical Modelling of the Drying Kinetics. E3S Web of Conferences 2021, 269. [Google Scholar] [CrossRef]
- Topuz, F.C. Examination of Rehydration Ratio, Color Properties and Drying Kinetics of Microwave Dried Garlic (Allium Sativum L.). NOHU J. Eng. Sci 2022, 11, 642–646. [Google Scholar] [CrossRef]
- Furtado, T.D.R.; Muniz, J.A.; Silva, E.M.; Frühauf, A.C.; Fernandes, T.J. Natural Convection Drying Kinetics of ‘Prata’ and ‘D’Água’ Banana Cultivars (Musa Ssp) by Nonlinear Regression Models. Rev Bras Frutic 2019, 41. [Google Scholar] [CrossRef]
- Akowuah, J.O.; Bart-Plange, A.; Dzisi, K.A. Thin Layer Mathematical Modelling of White Maize in a Mobile Solar-Biomass Hybrid Dryer. Research in Agricultural Engineering 2021, 67, 74–83. [Google Scholar] [CrossRef]
- de Moraes, M.S.; de Melo Queiroz, A.J.; de Figueirêdo, R.M.F.; Paz de Matos, J.D. arc; da Silva, L.P.F.R.; do Nascimento Silva, S.; Vieira, A.F. Germinated Seeds of Three Cucurbita Varieties: Physical Characteristics, Minerals Profile, and Drying Behavior. J Food Process Eng 2021, 44. [Google Scholar] [CrossRef]
Figure 3.
Flow chart of the osmodeshydration process.
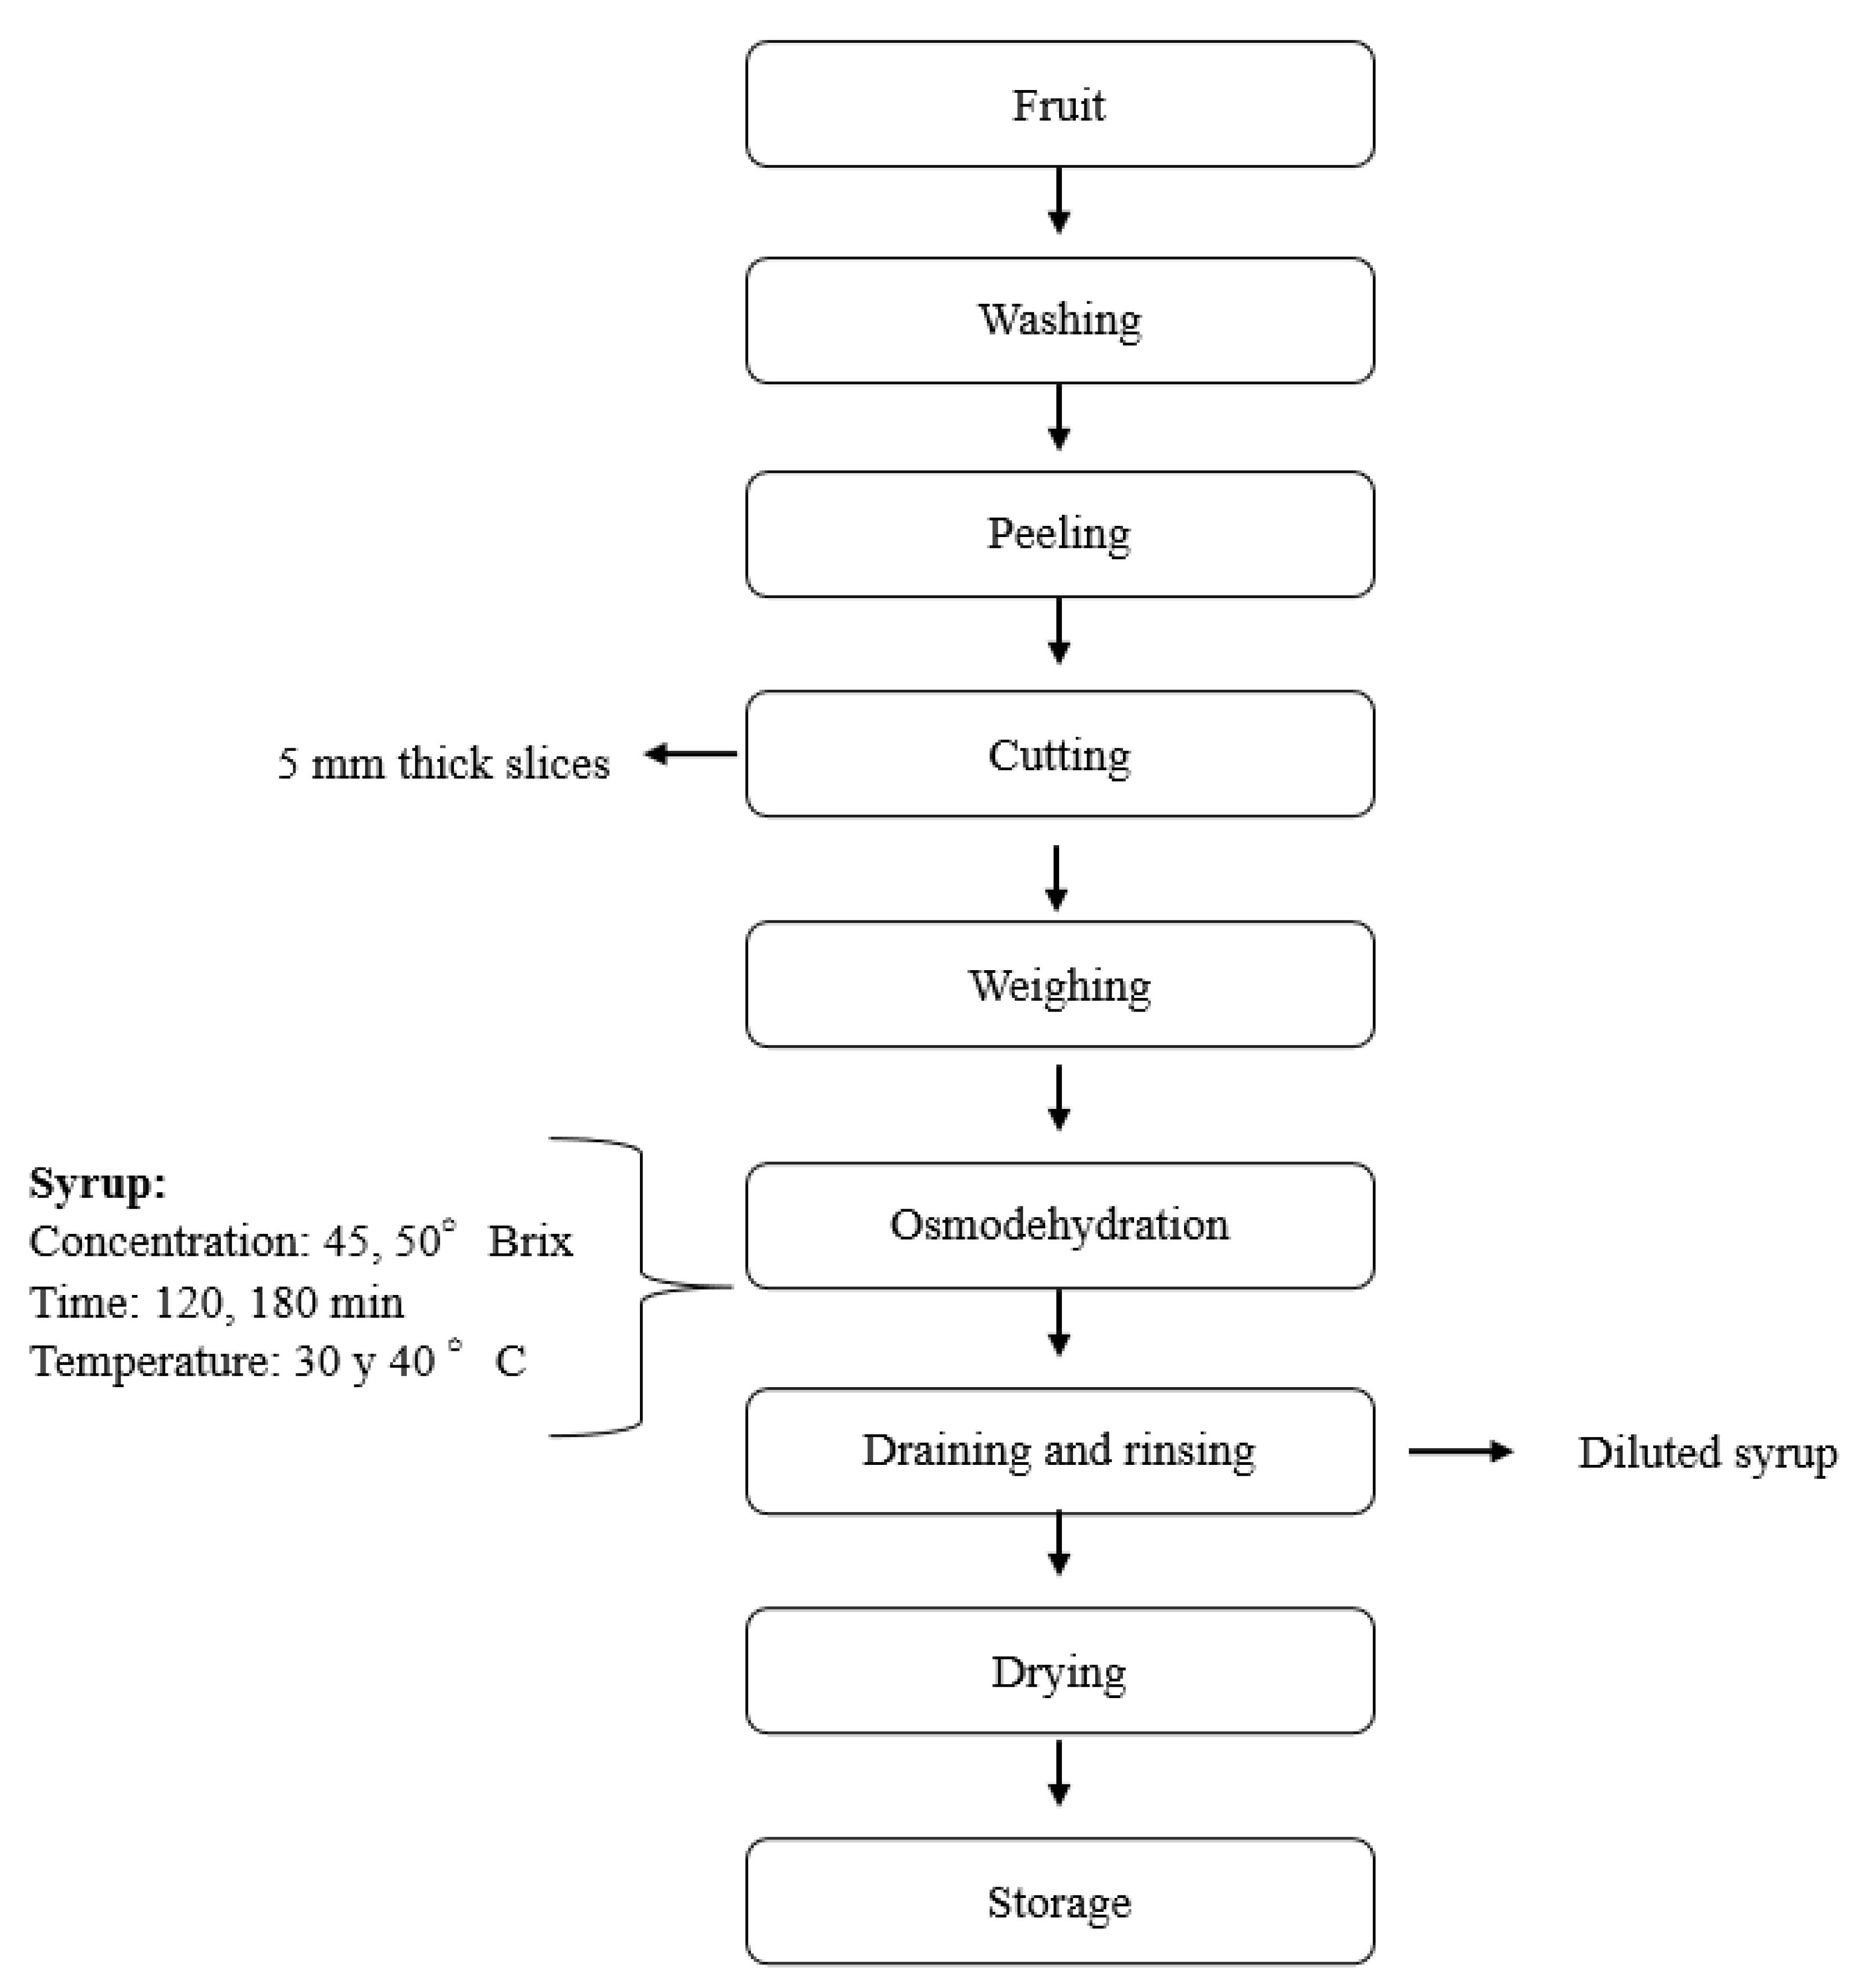
Figure 4.
The figure shows the 3D design of the prototype, showing the two tanks (syrup preparation and process), the HMI screen, the control box and bearings for transporting the equipment. It also shows the design of the grid used in the process tank.
Figure 4.
The figure shows the 3D design of the prototype, showing the two tanks (syrup preparation and process), the HMI screen, the control box and bearings for transporting the equipment. It also shows the design of the grid used in the process tank.
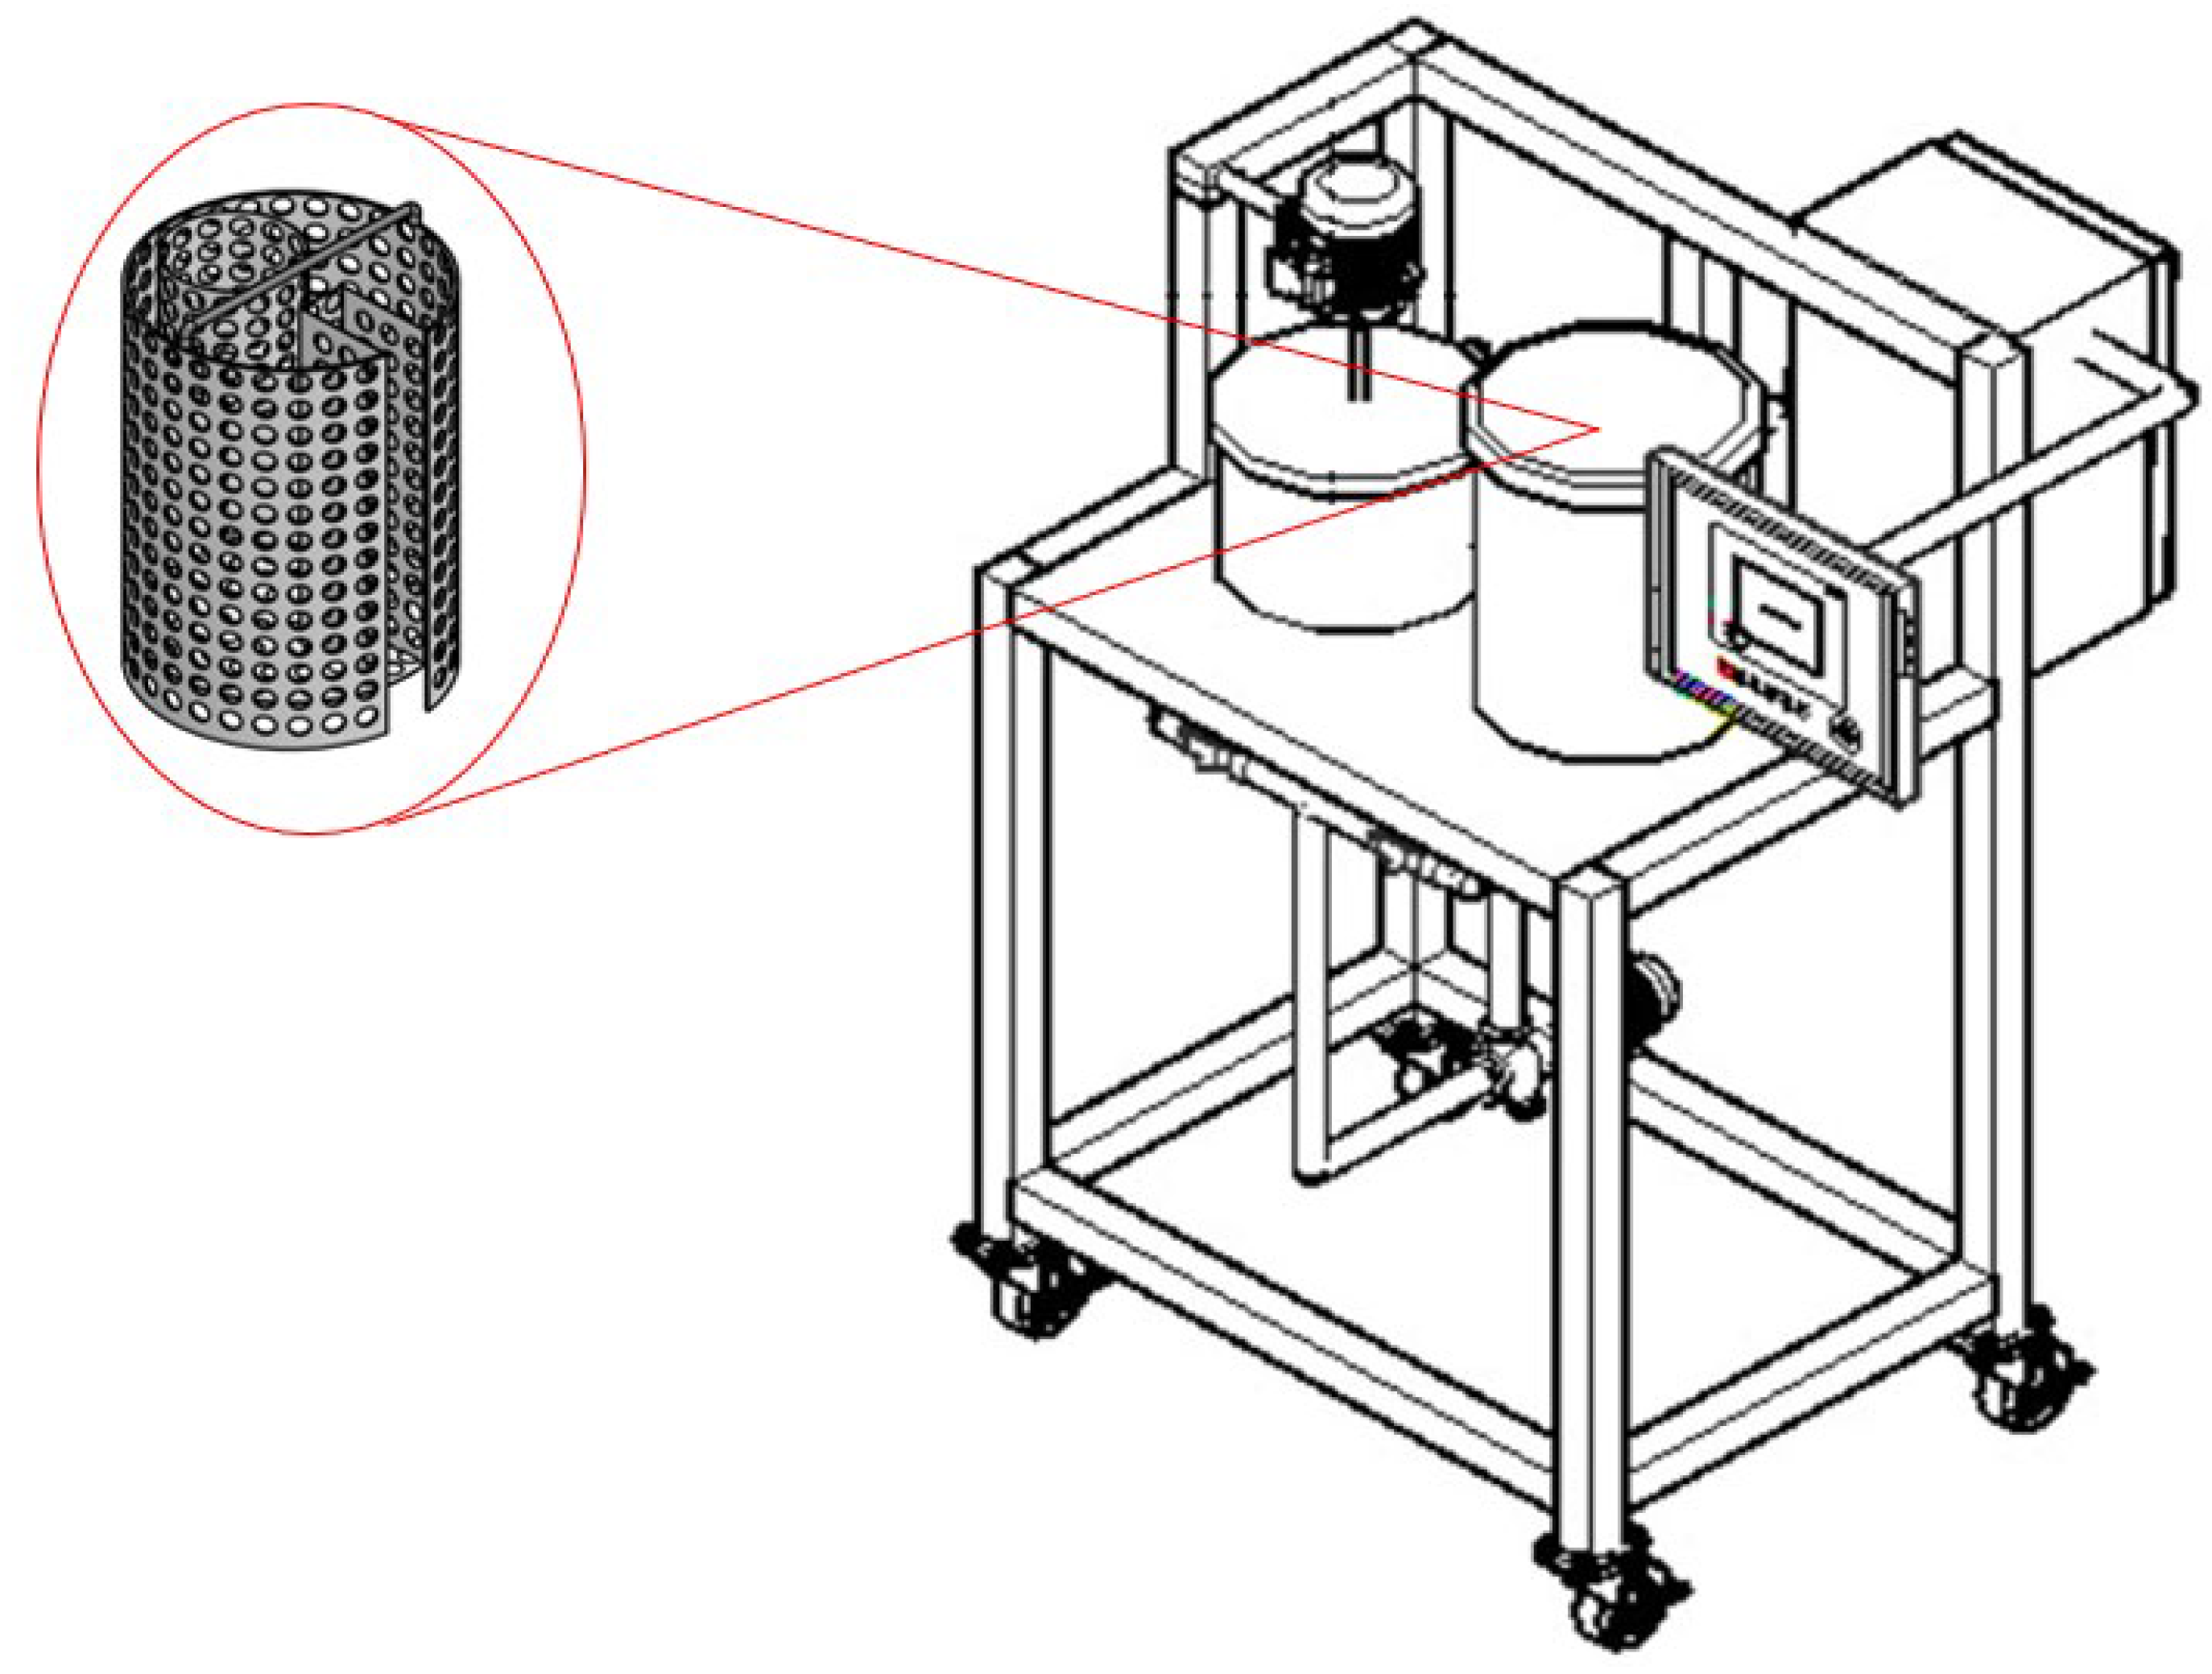
Figure 5.
Control system diagram.
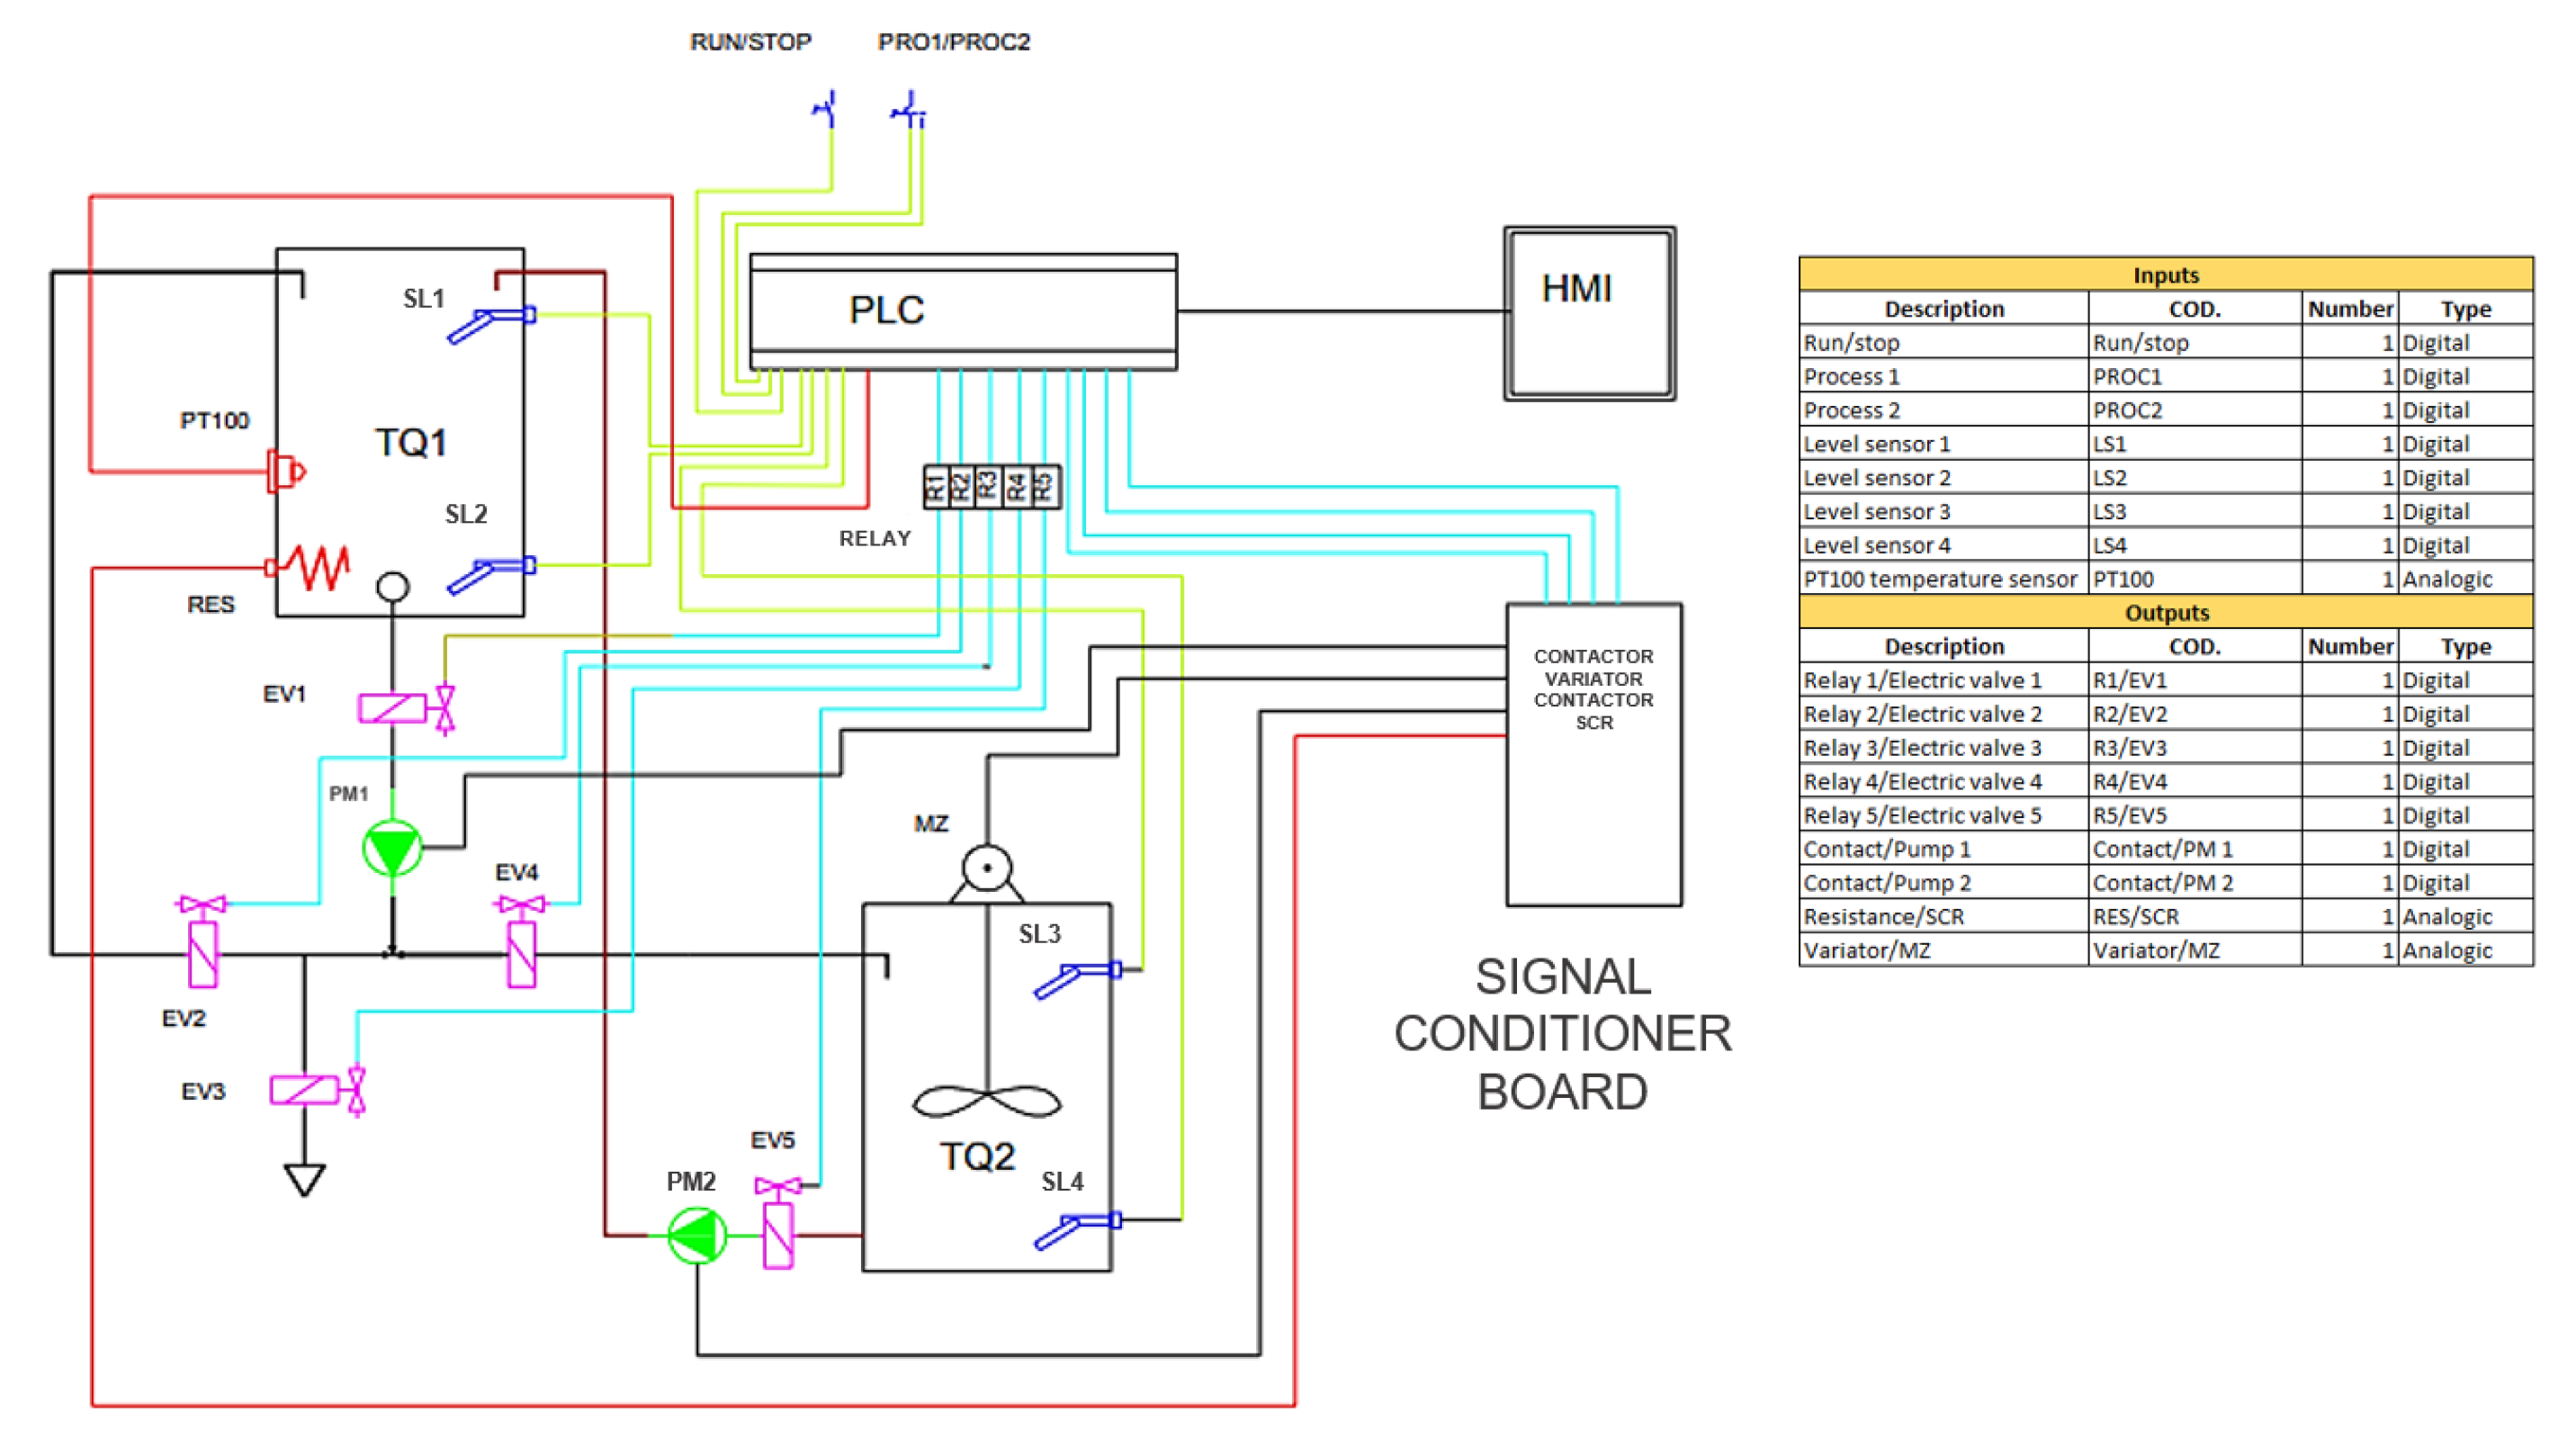
Figure 6.
Control system diagram. Main menu: 1) “Enable system” button”, 2) “Preparation” sub-window, 3) “Pumping” sub-window, 4) “Recircle On/Off” button, 5) “Drain On/Off” button, 6) PV: Process temperature 7) SV: Desired temperature, 8) Resistance ON, 9) Component signal, 10) Additional information, 11) EV (electro valves), 12) Warning: Check the automatic mode and connection.
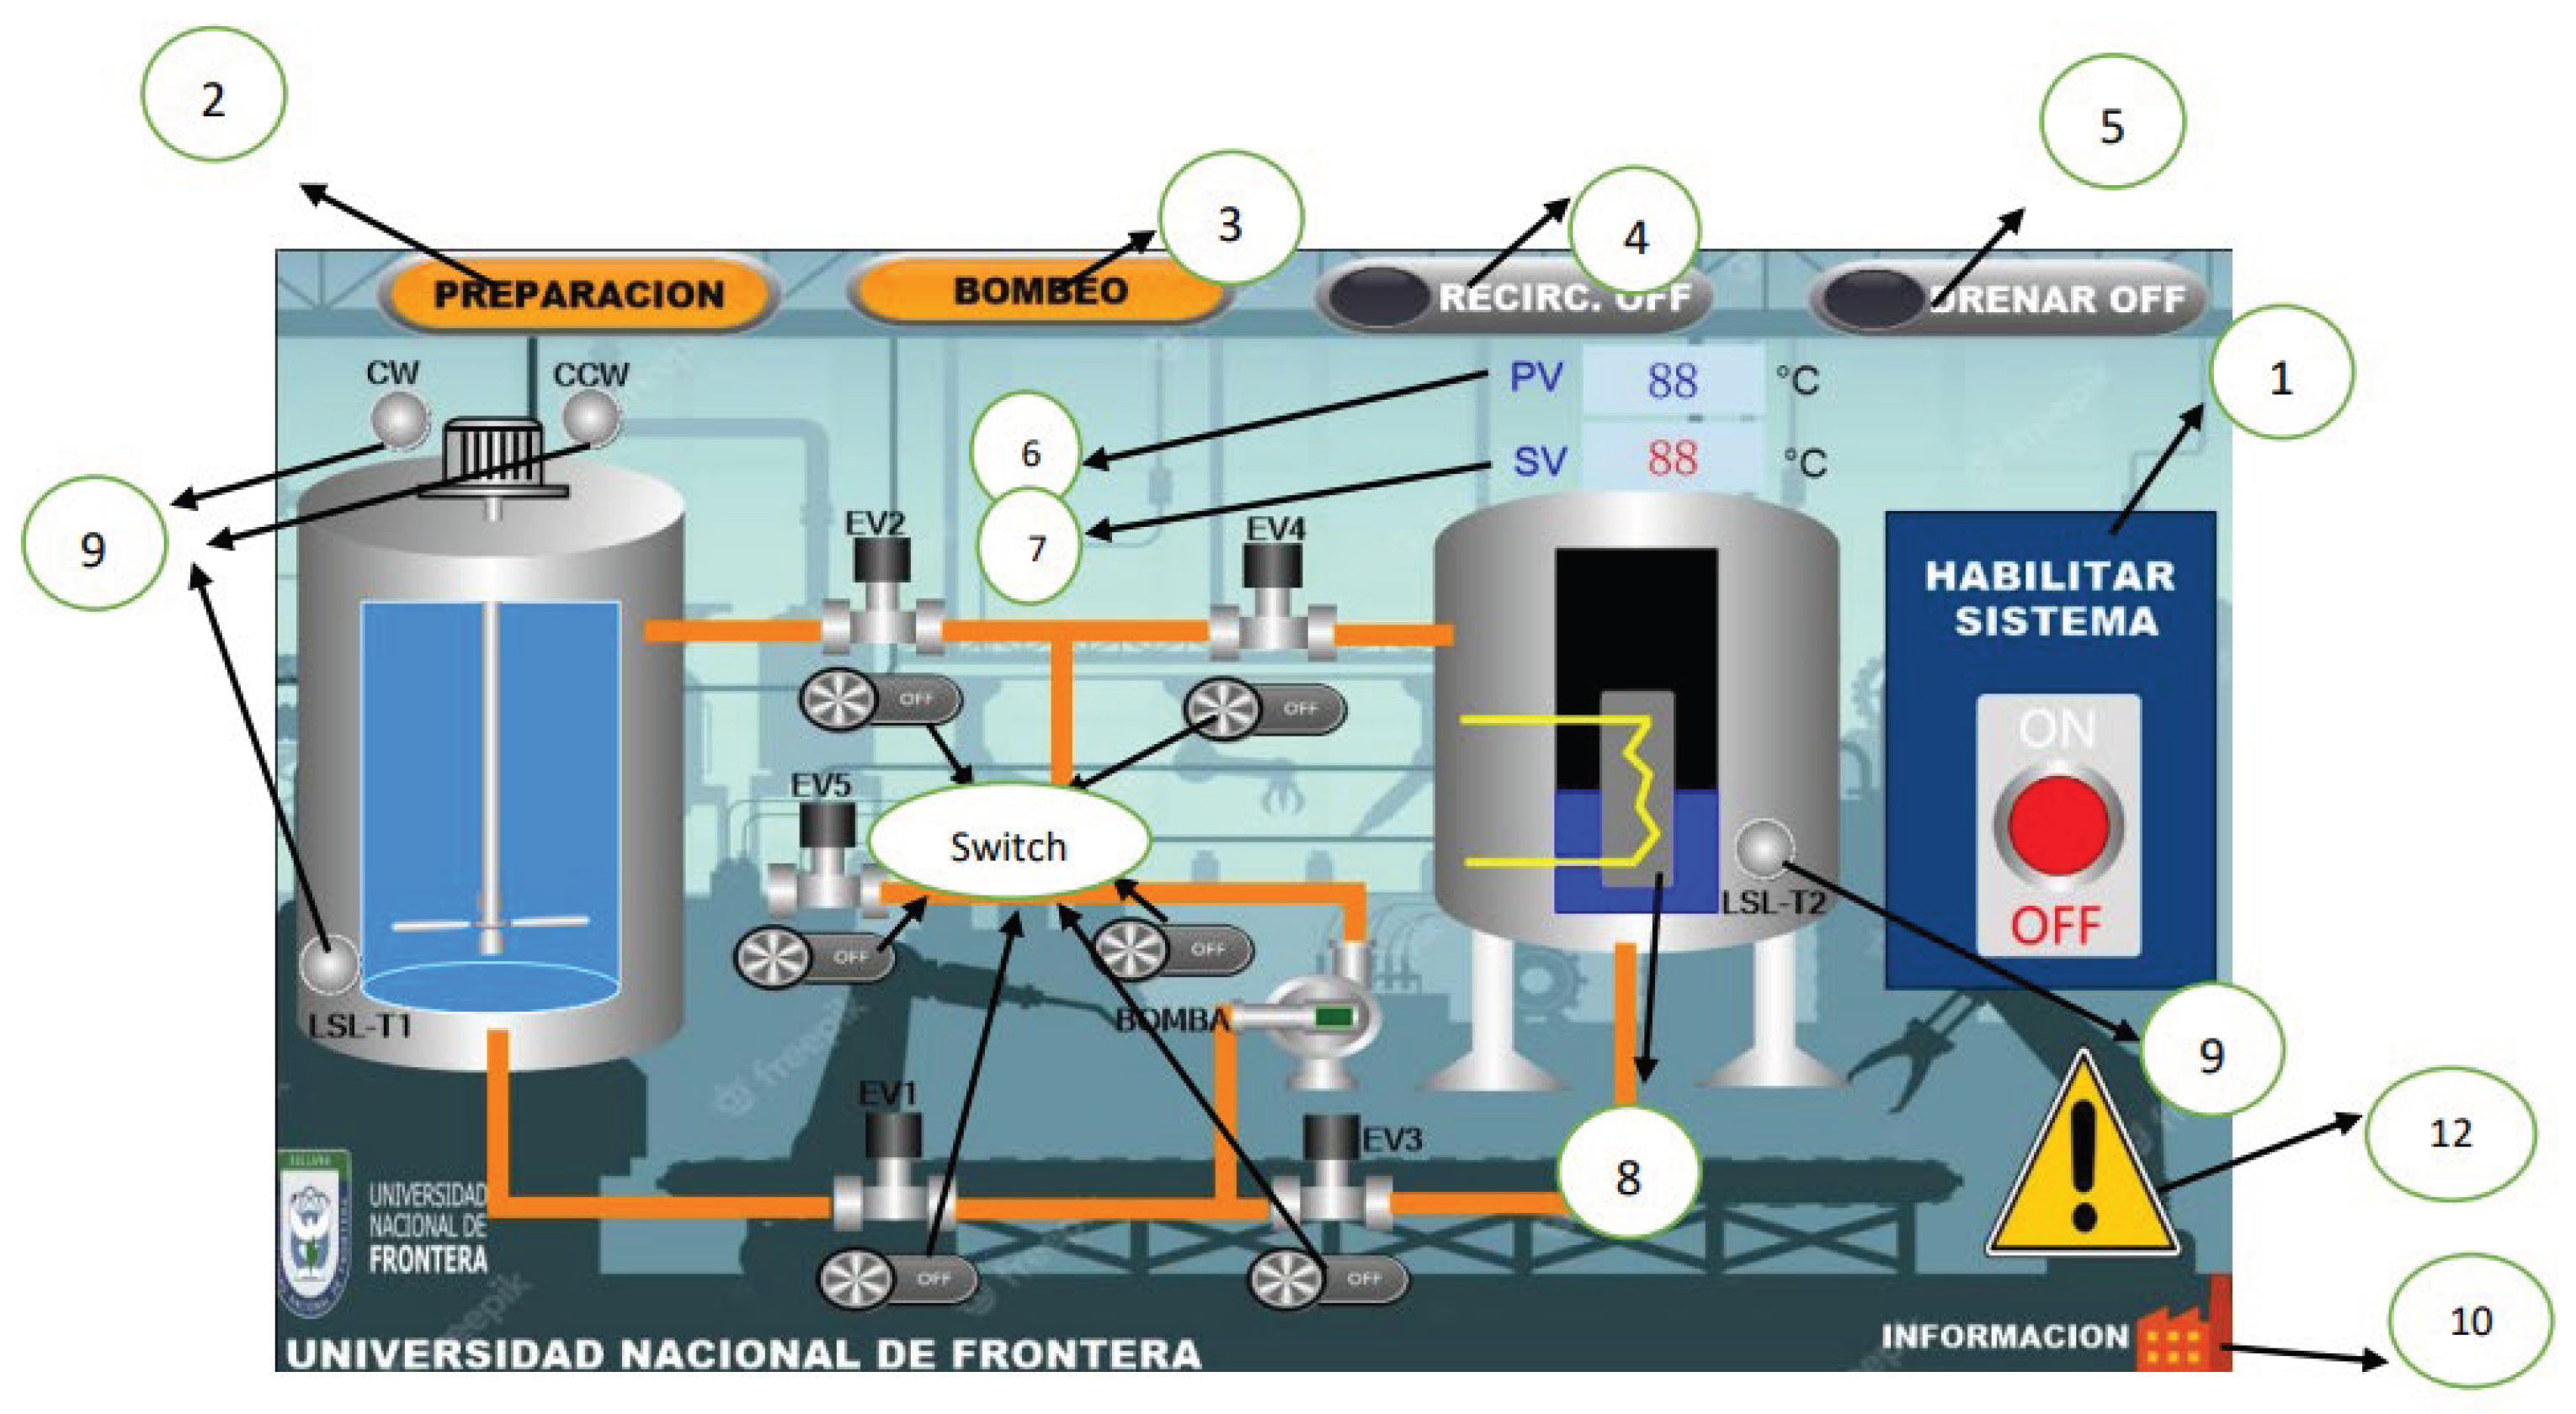
Figure 7.
Syrup preparation menu: 1) “Enable sequence” button”, 2) Motor speed, 3) Time, 4) Rotating time 5) Rotation change, 6) Start, 7) Stop, 8) Return to main menu.
Figure 7.
Syrup preparation menu: 1) “Enable sequence” button”, 2) Motor speed, 3) Time, 4) Rotating time 5) Rotation change, 6) Start, 7) Stop, 8) Return to main menu.
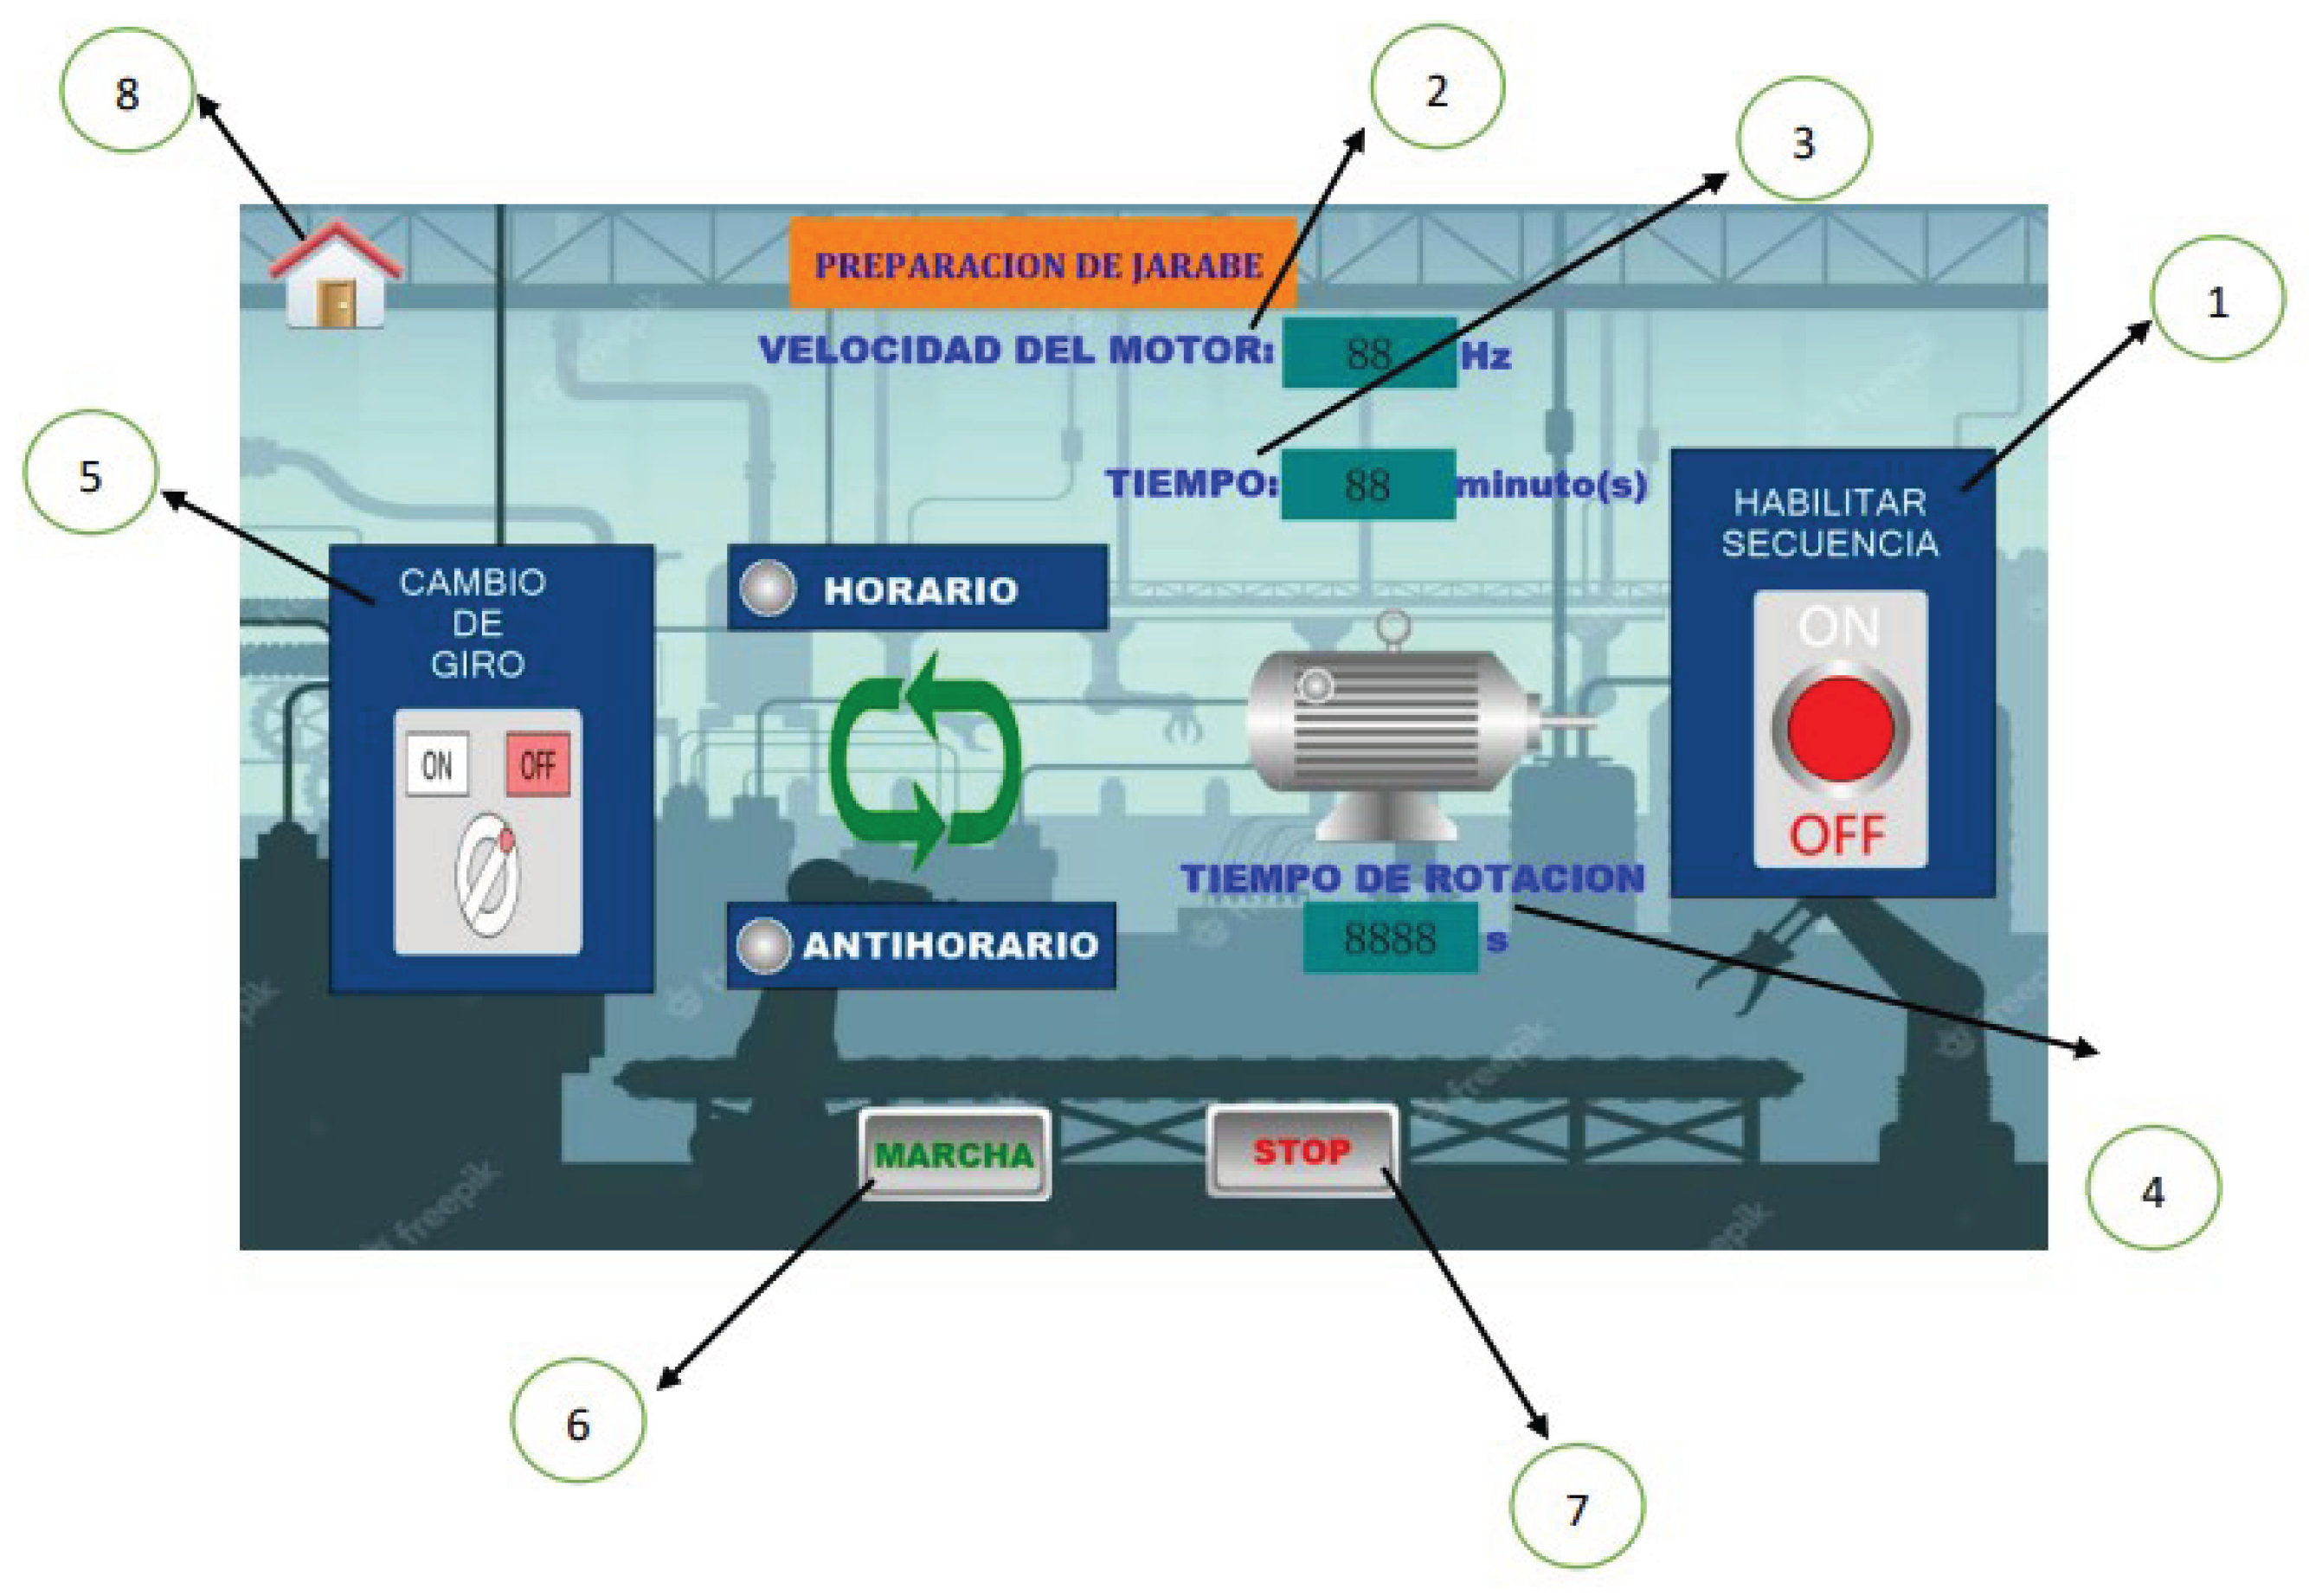
Figure 8.
Temperature control menu: 1) “Enable sequence” button”, 2) Desired temperature, 3) Process temperature, 4) Current temperature 5) Trend, 6) Start, 7) Stop, 8) Return to main menu.
Figure 8.
Temperature control menu: 1) “Enable sequence” button”, 2) Desired temperature, 3) Process temperature, 4) Current temperature 5) Trend, 6) Start, 7) Stop, 8) Return to main menu.
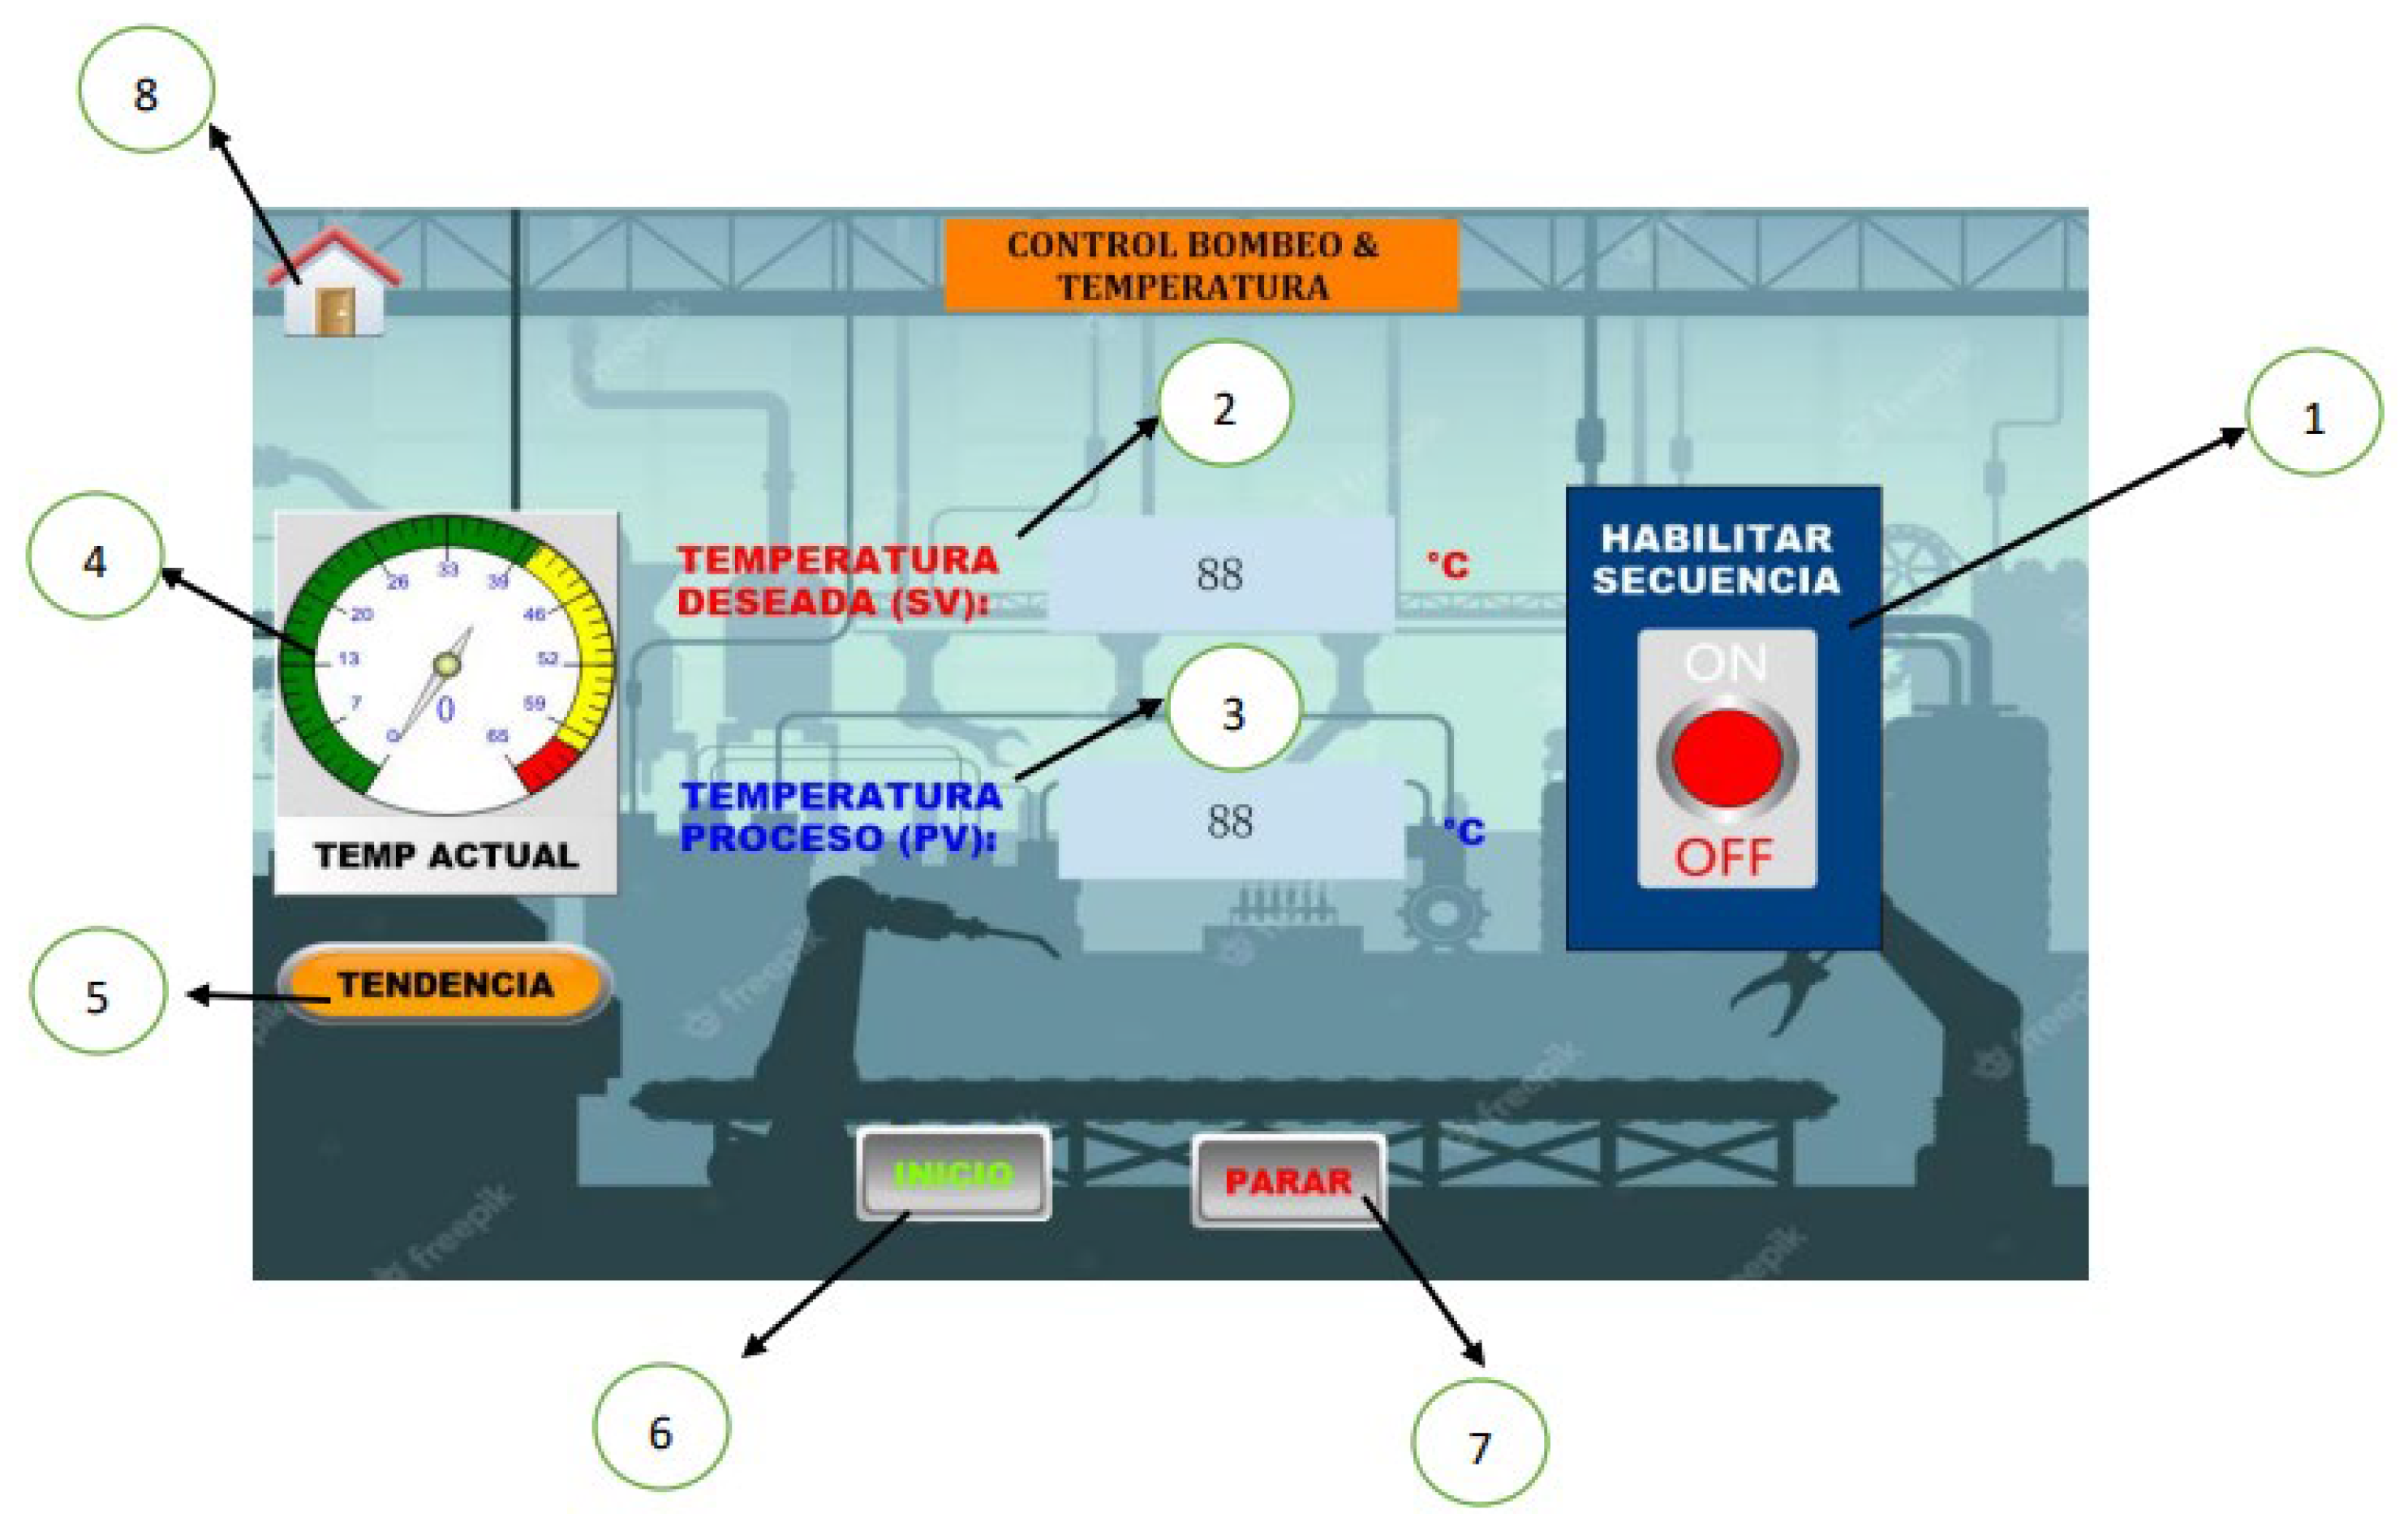
Figure 9.
Temperature trend graph: 1) Temperature vs Time, 2) Zoom, 3) Return to main menu.
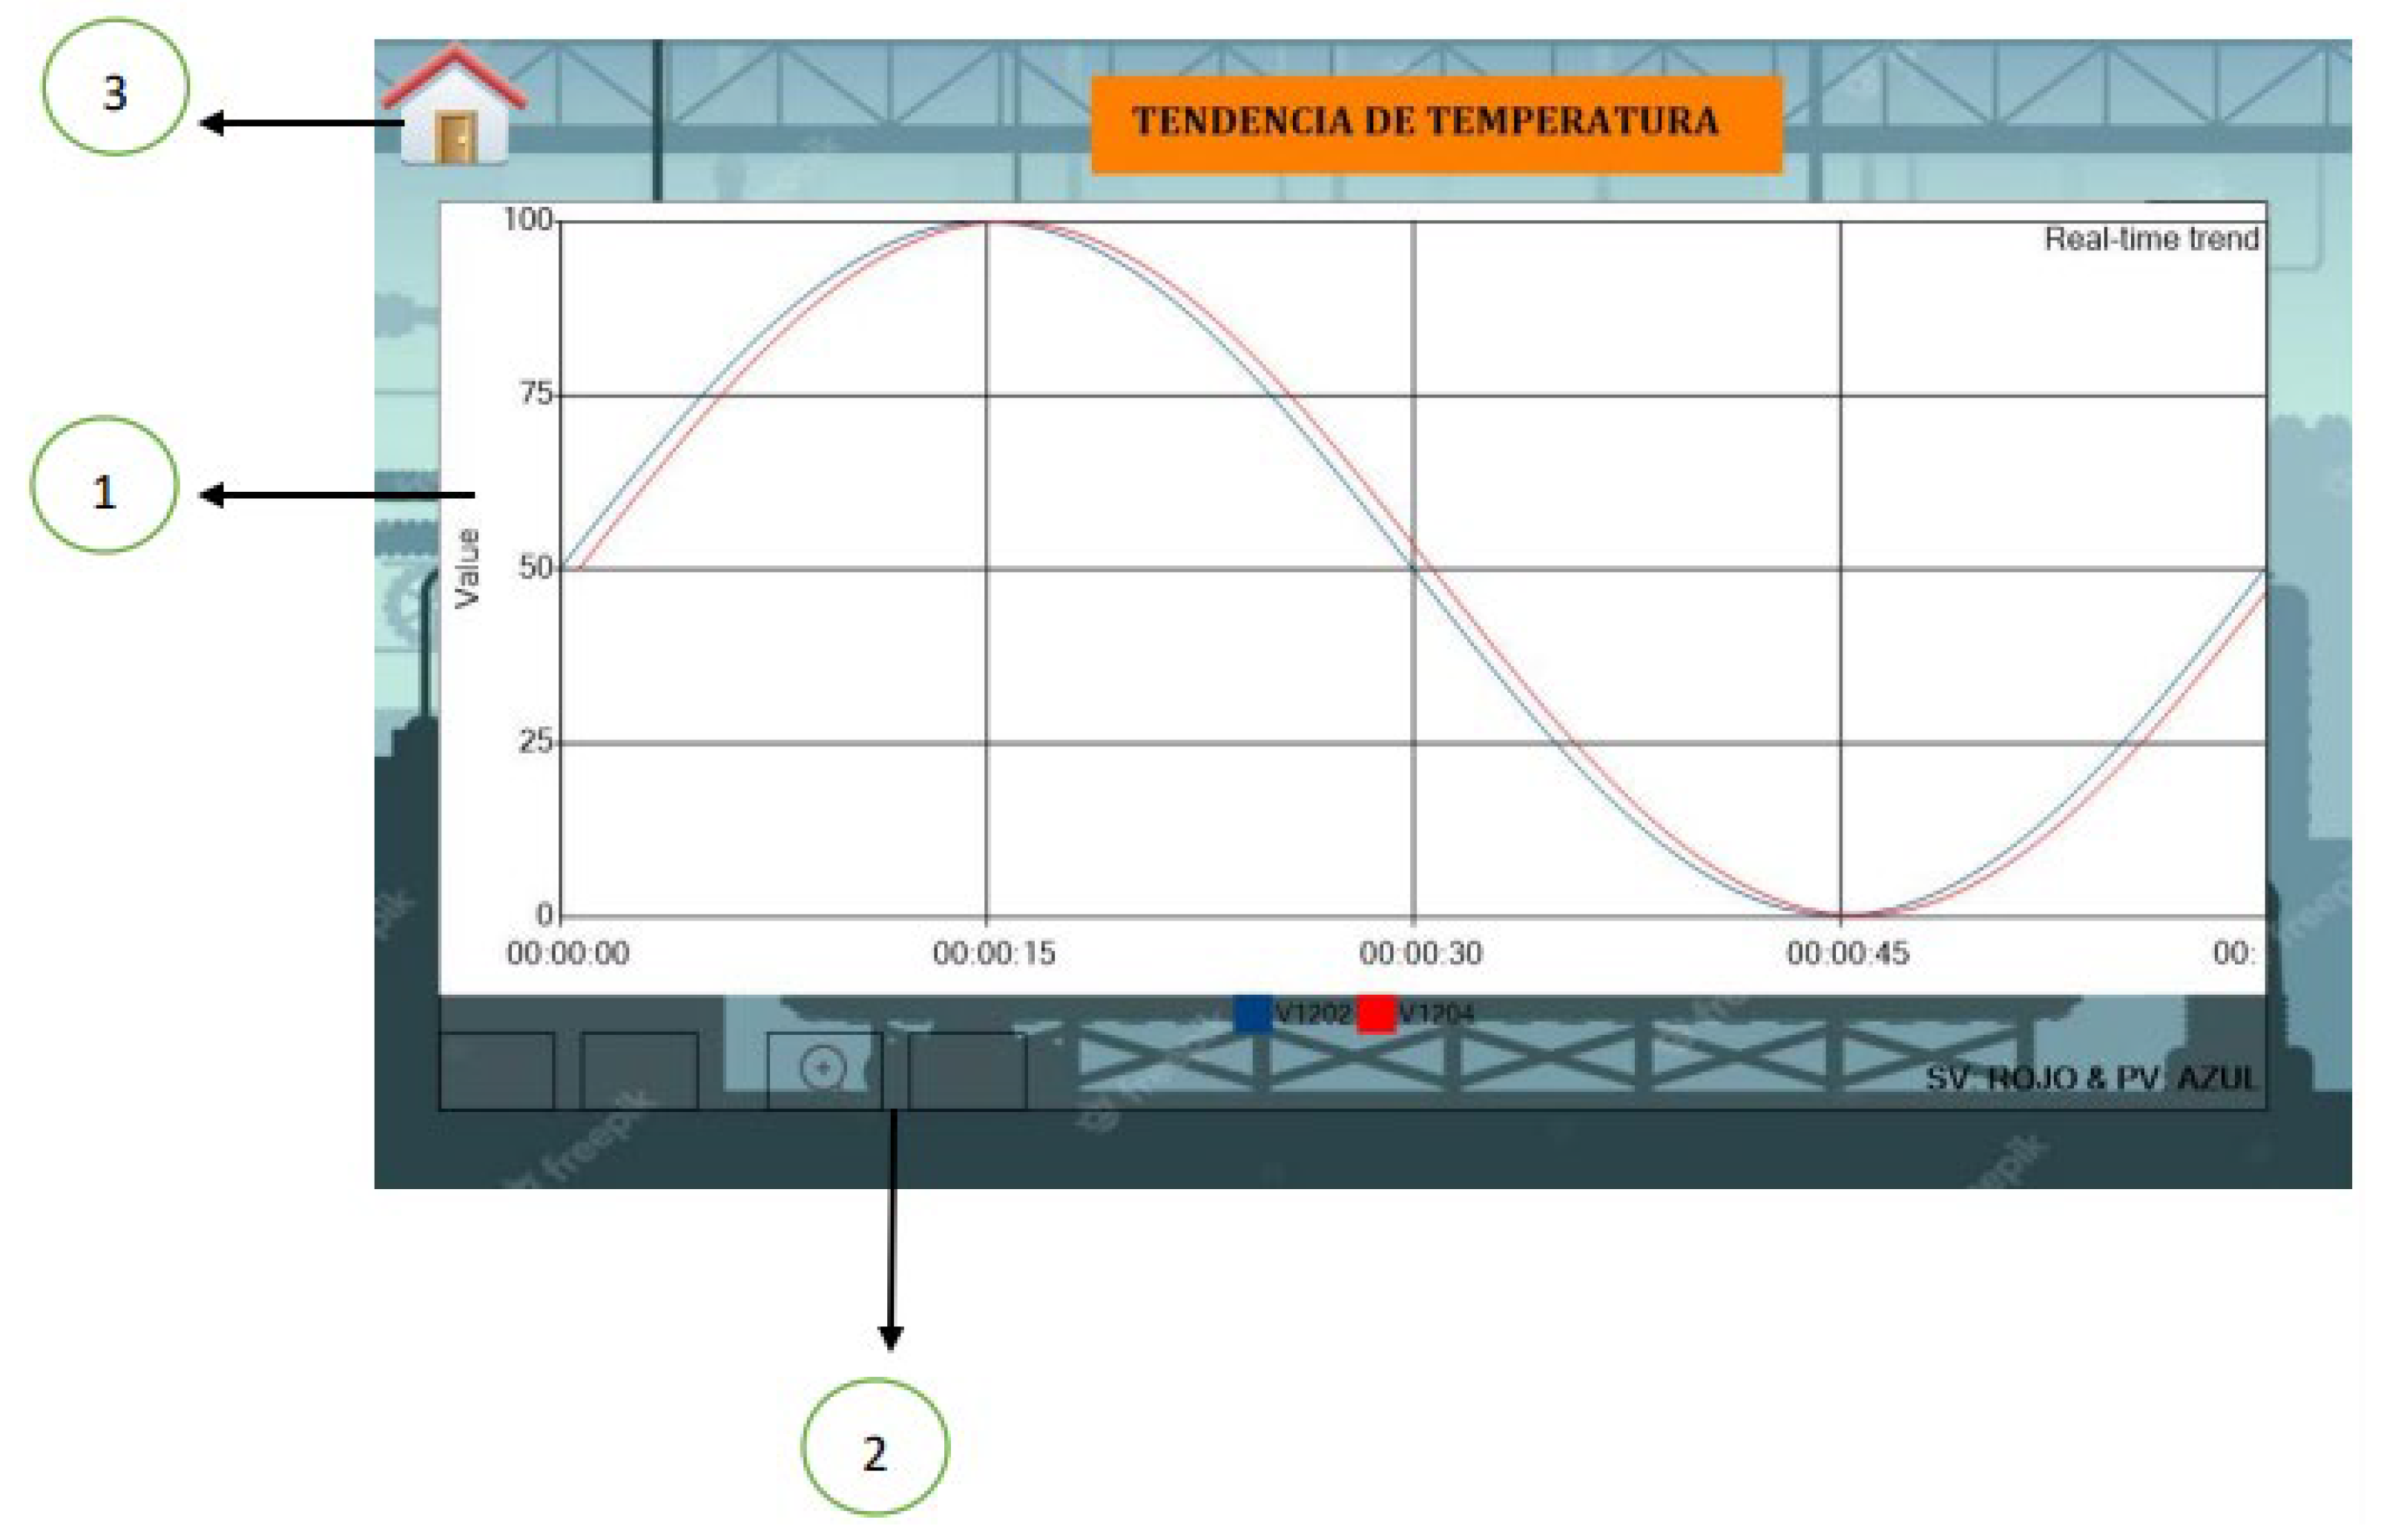
Figure 10.
Weight reduction interaction (WR) at 30 ºC and 40 °C.
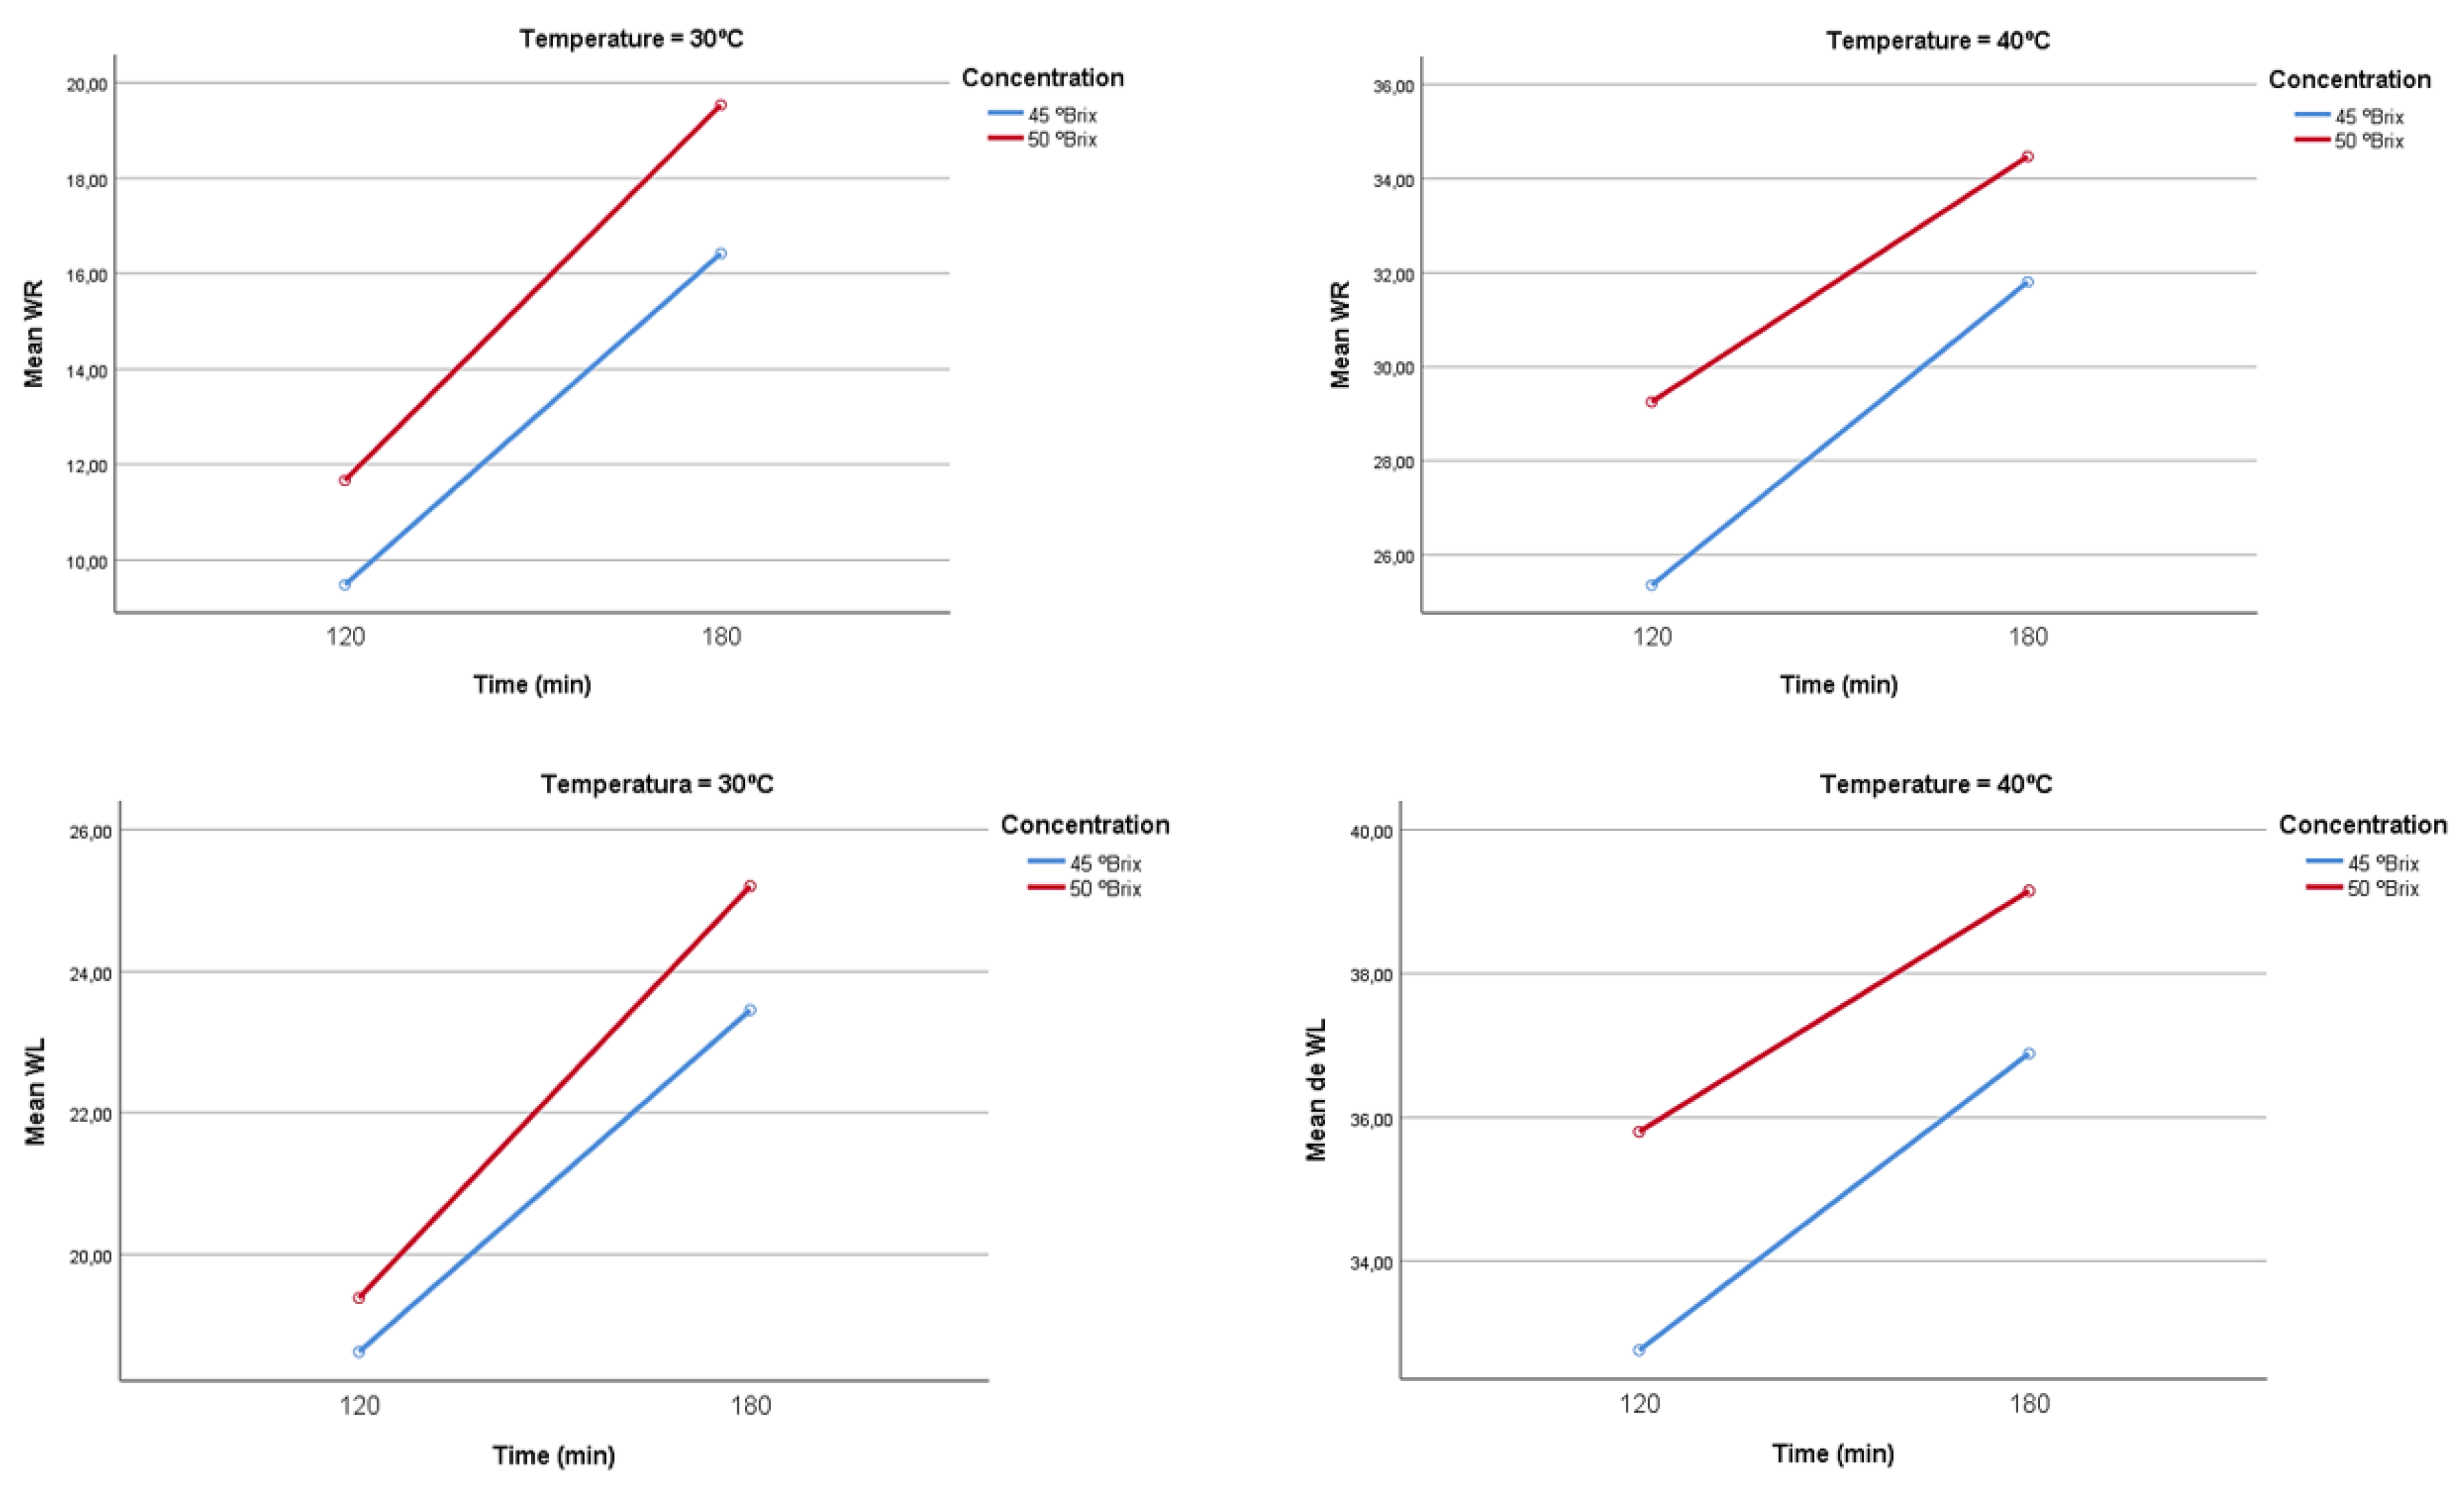
Figure 11.
Solid gain interaction (SG) at 30 ºC and 40 °C.
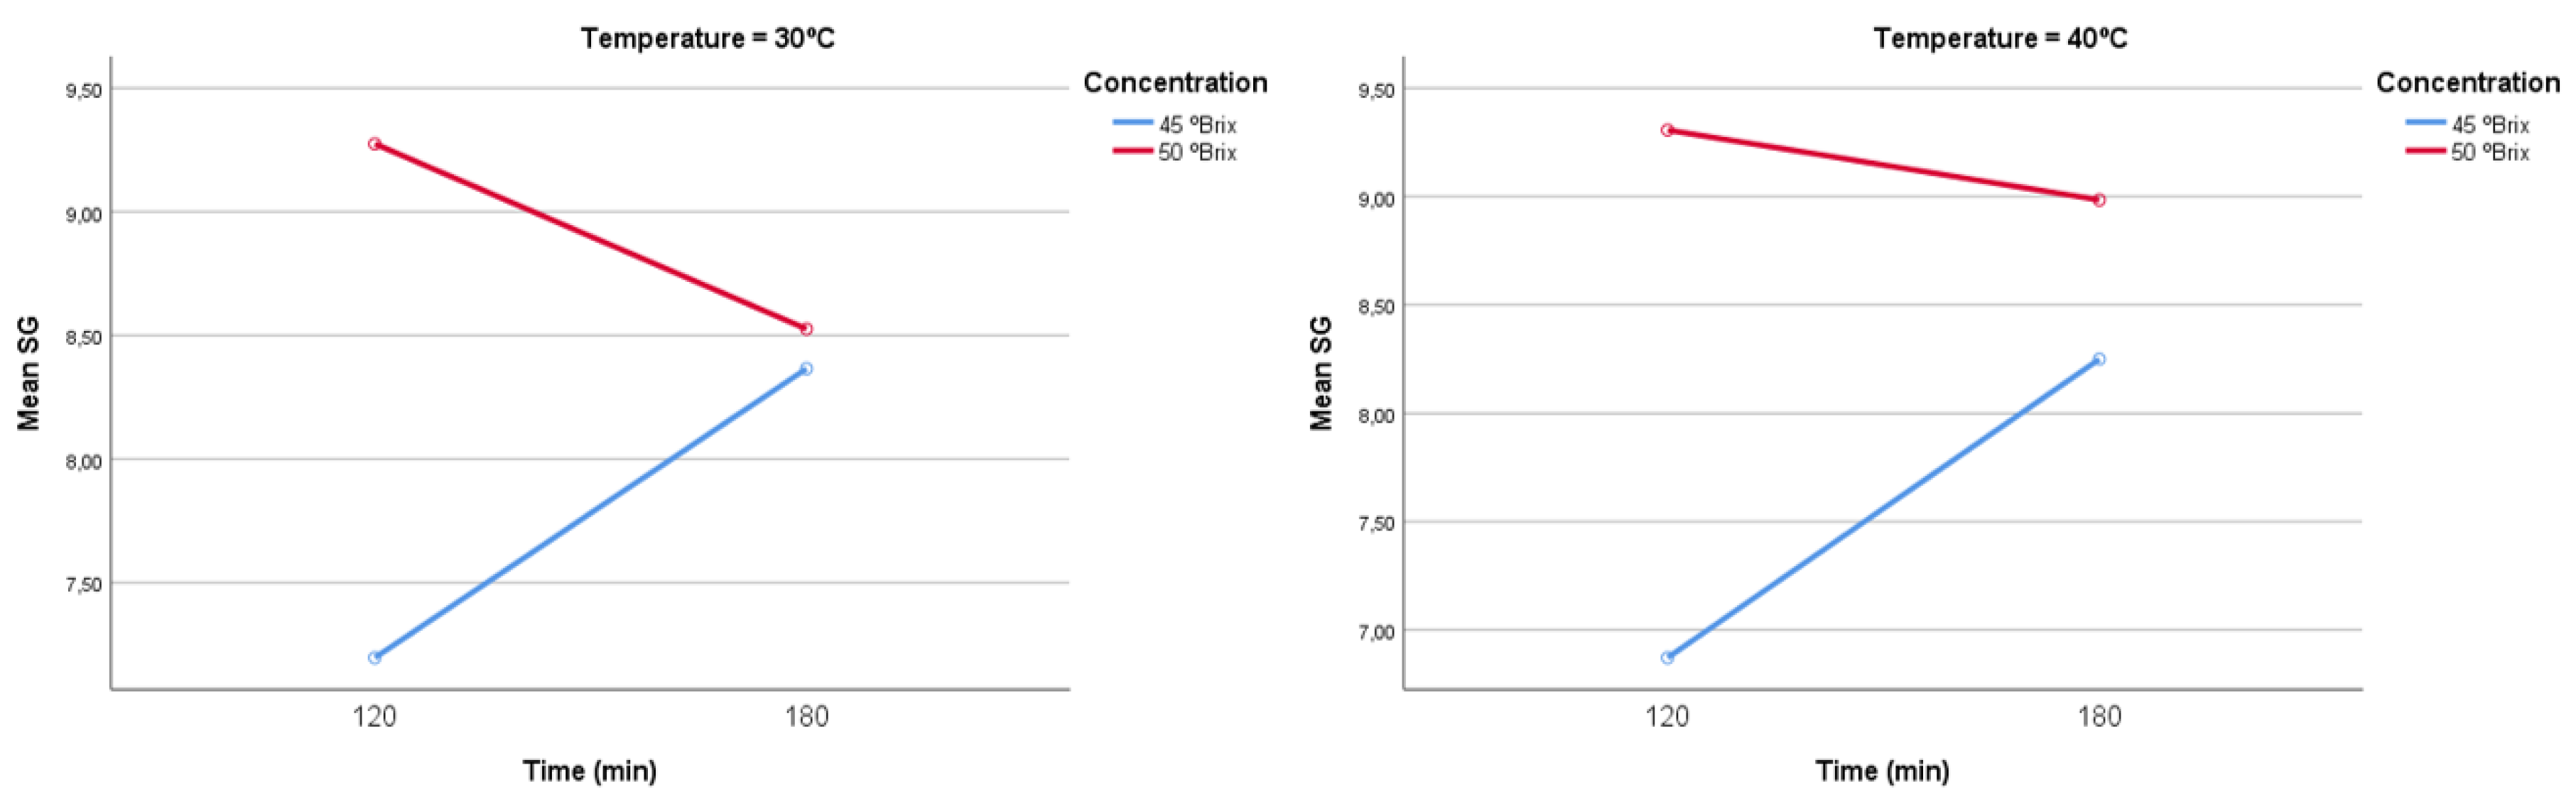
Figure 12.
Drying curves-Moisture on a dry basis vs. time.
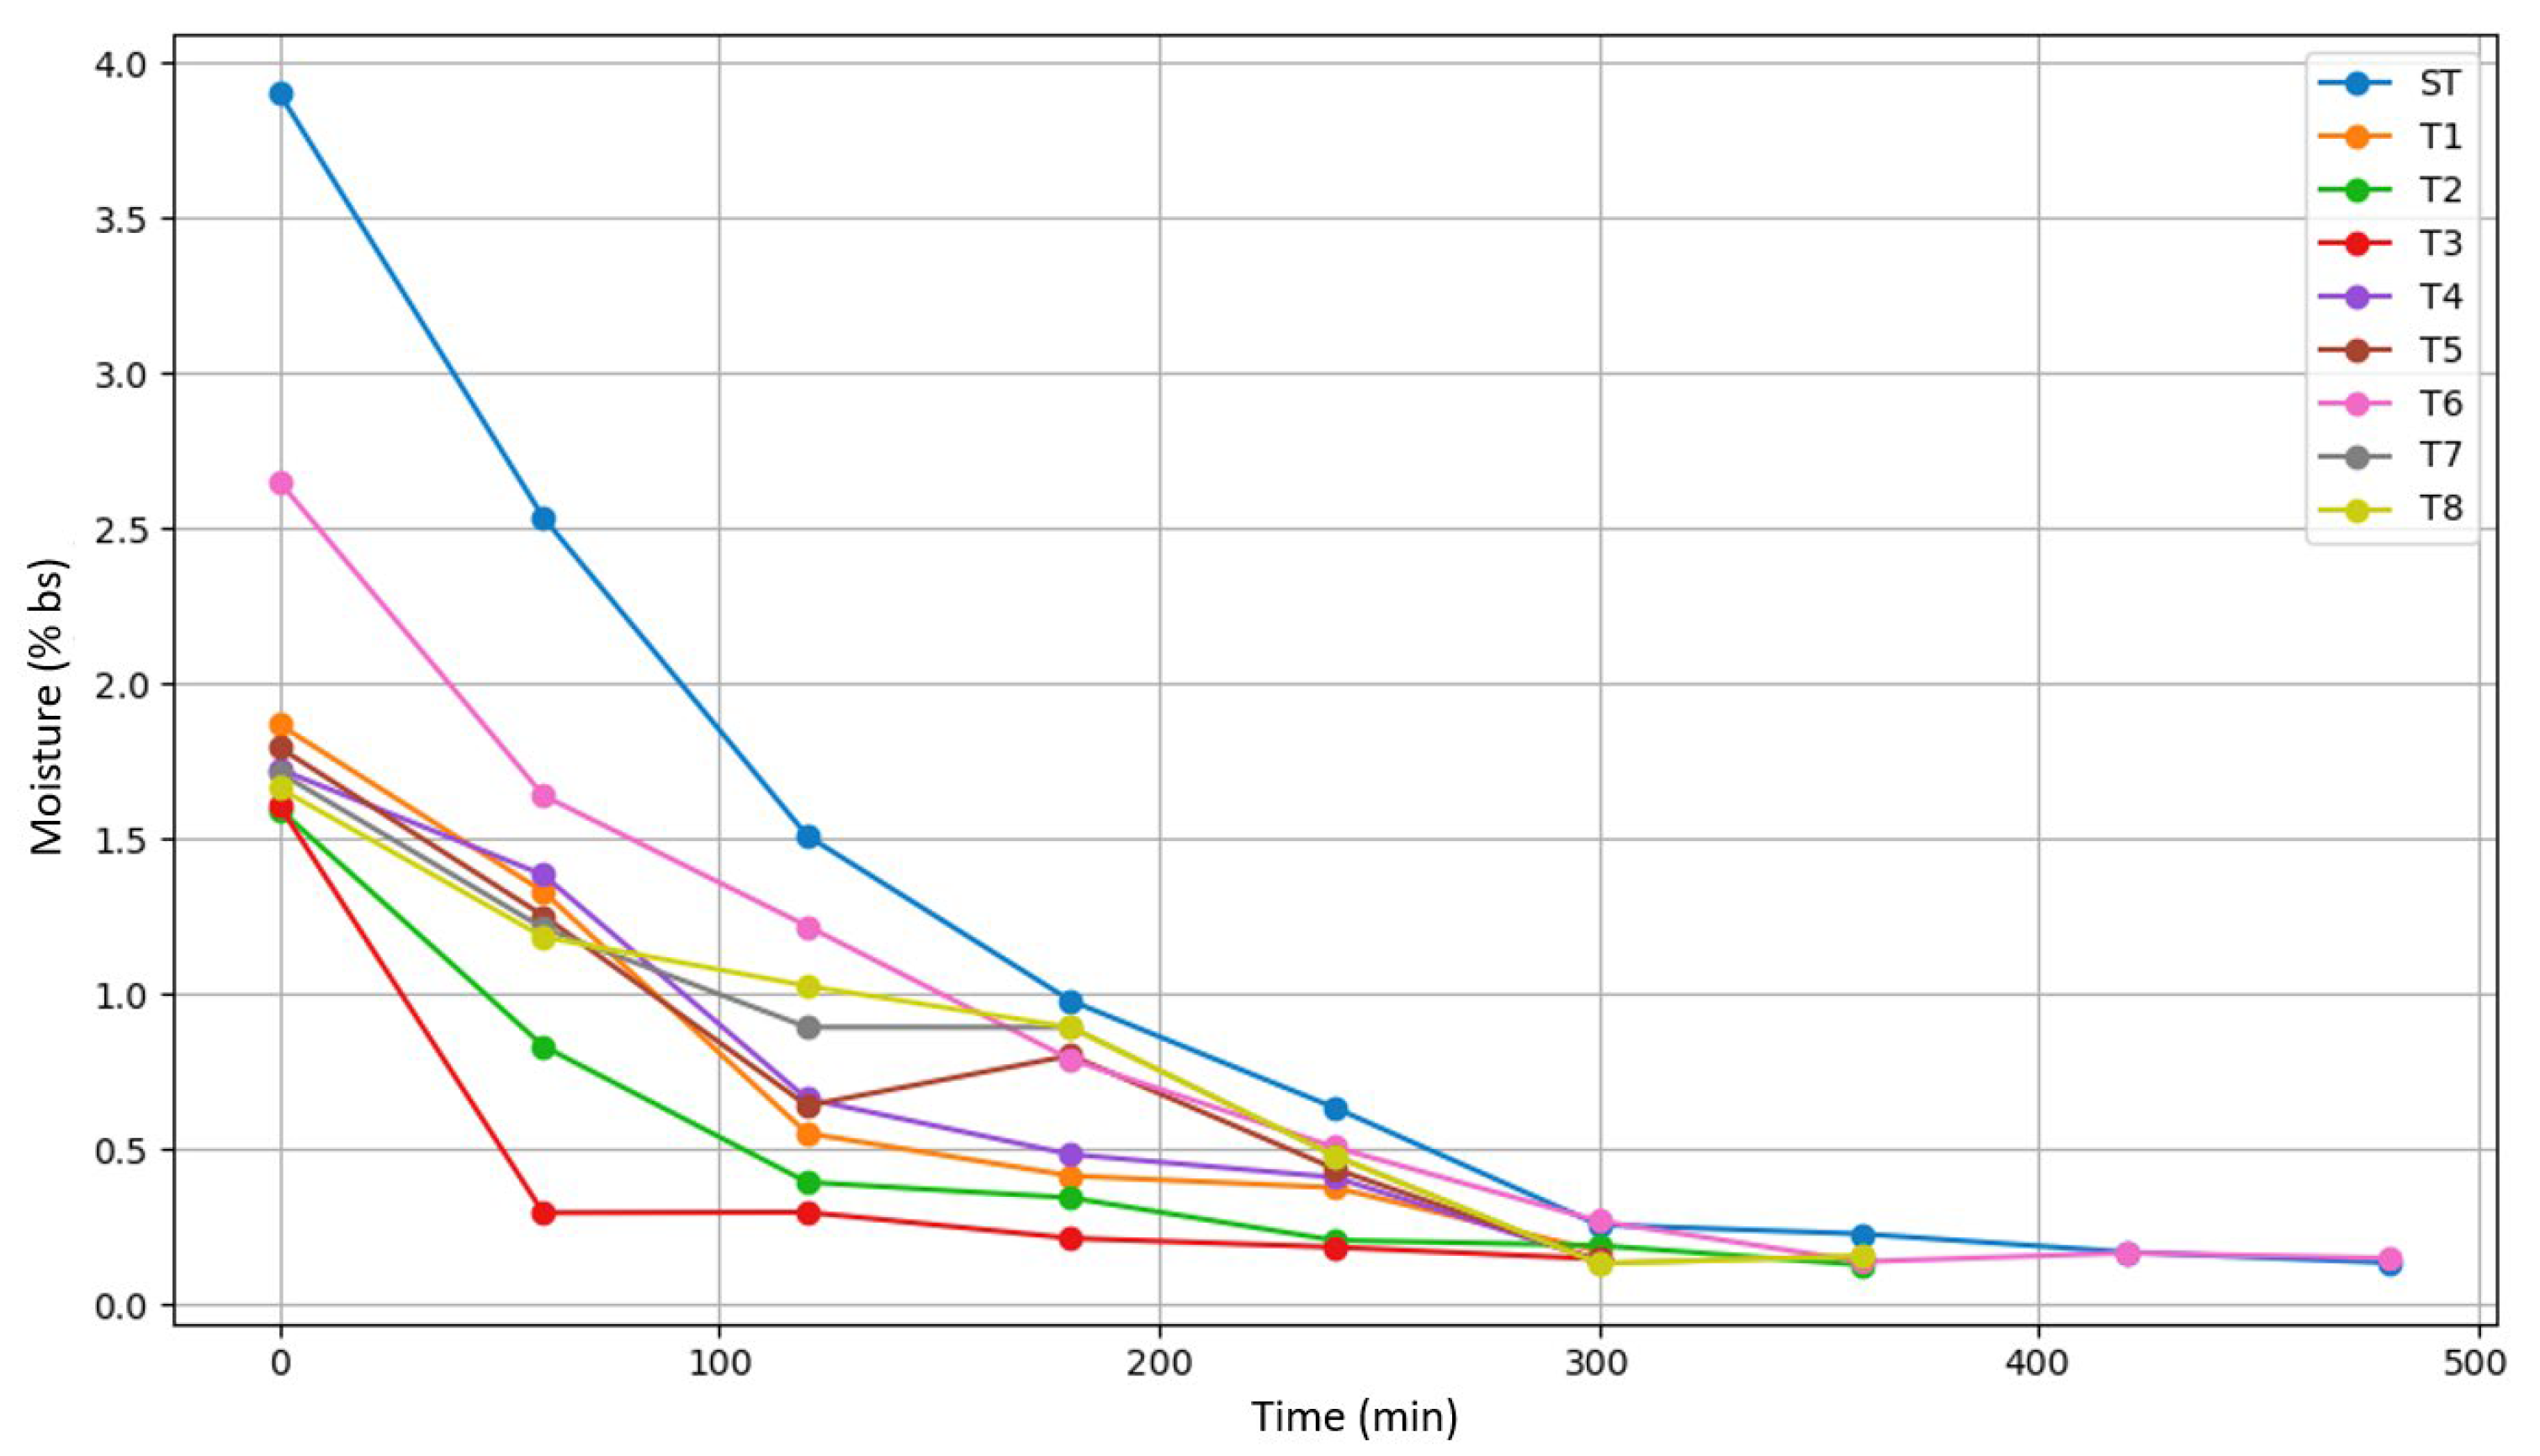
Figure 13.
Modeling of drying curves for T0 (control), T1 (45 ºBrix-30 ºC-120 min), T2 (45 ºBrix-30 ºC-180 min), T3 (45 ºBrix-40 ºC-120 min).
Figure 13.
Modeling of drying curves for T0 (control), T1 (45 ºBrix-30 ºC-120 min), T2 (45 ºBrix-30 ºC-180 min), T3 (45 ºBrix-40 ºC-120 min).
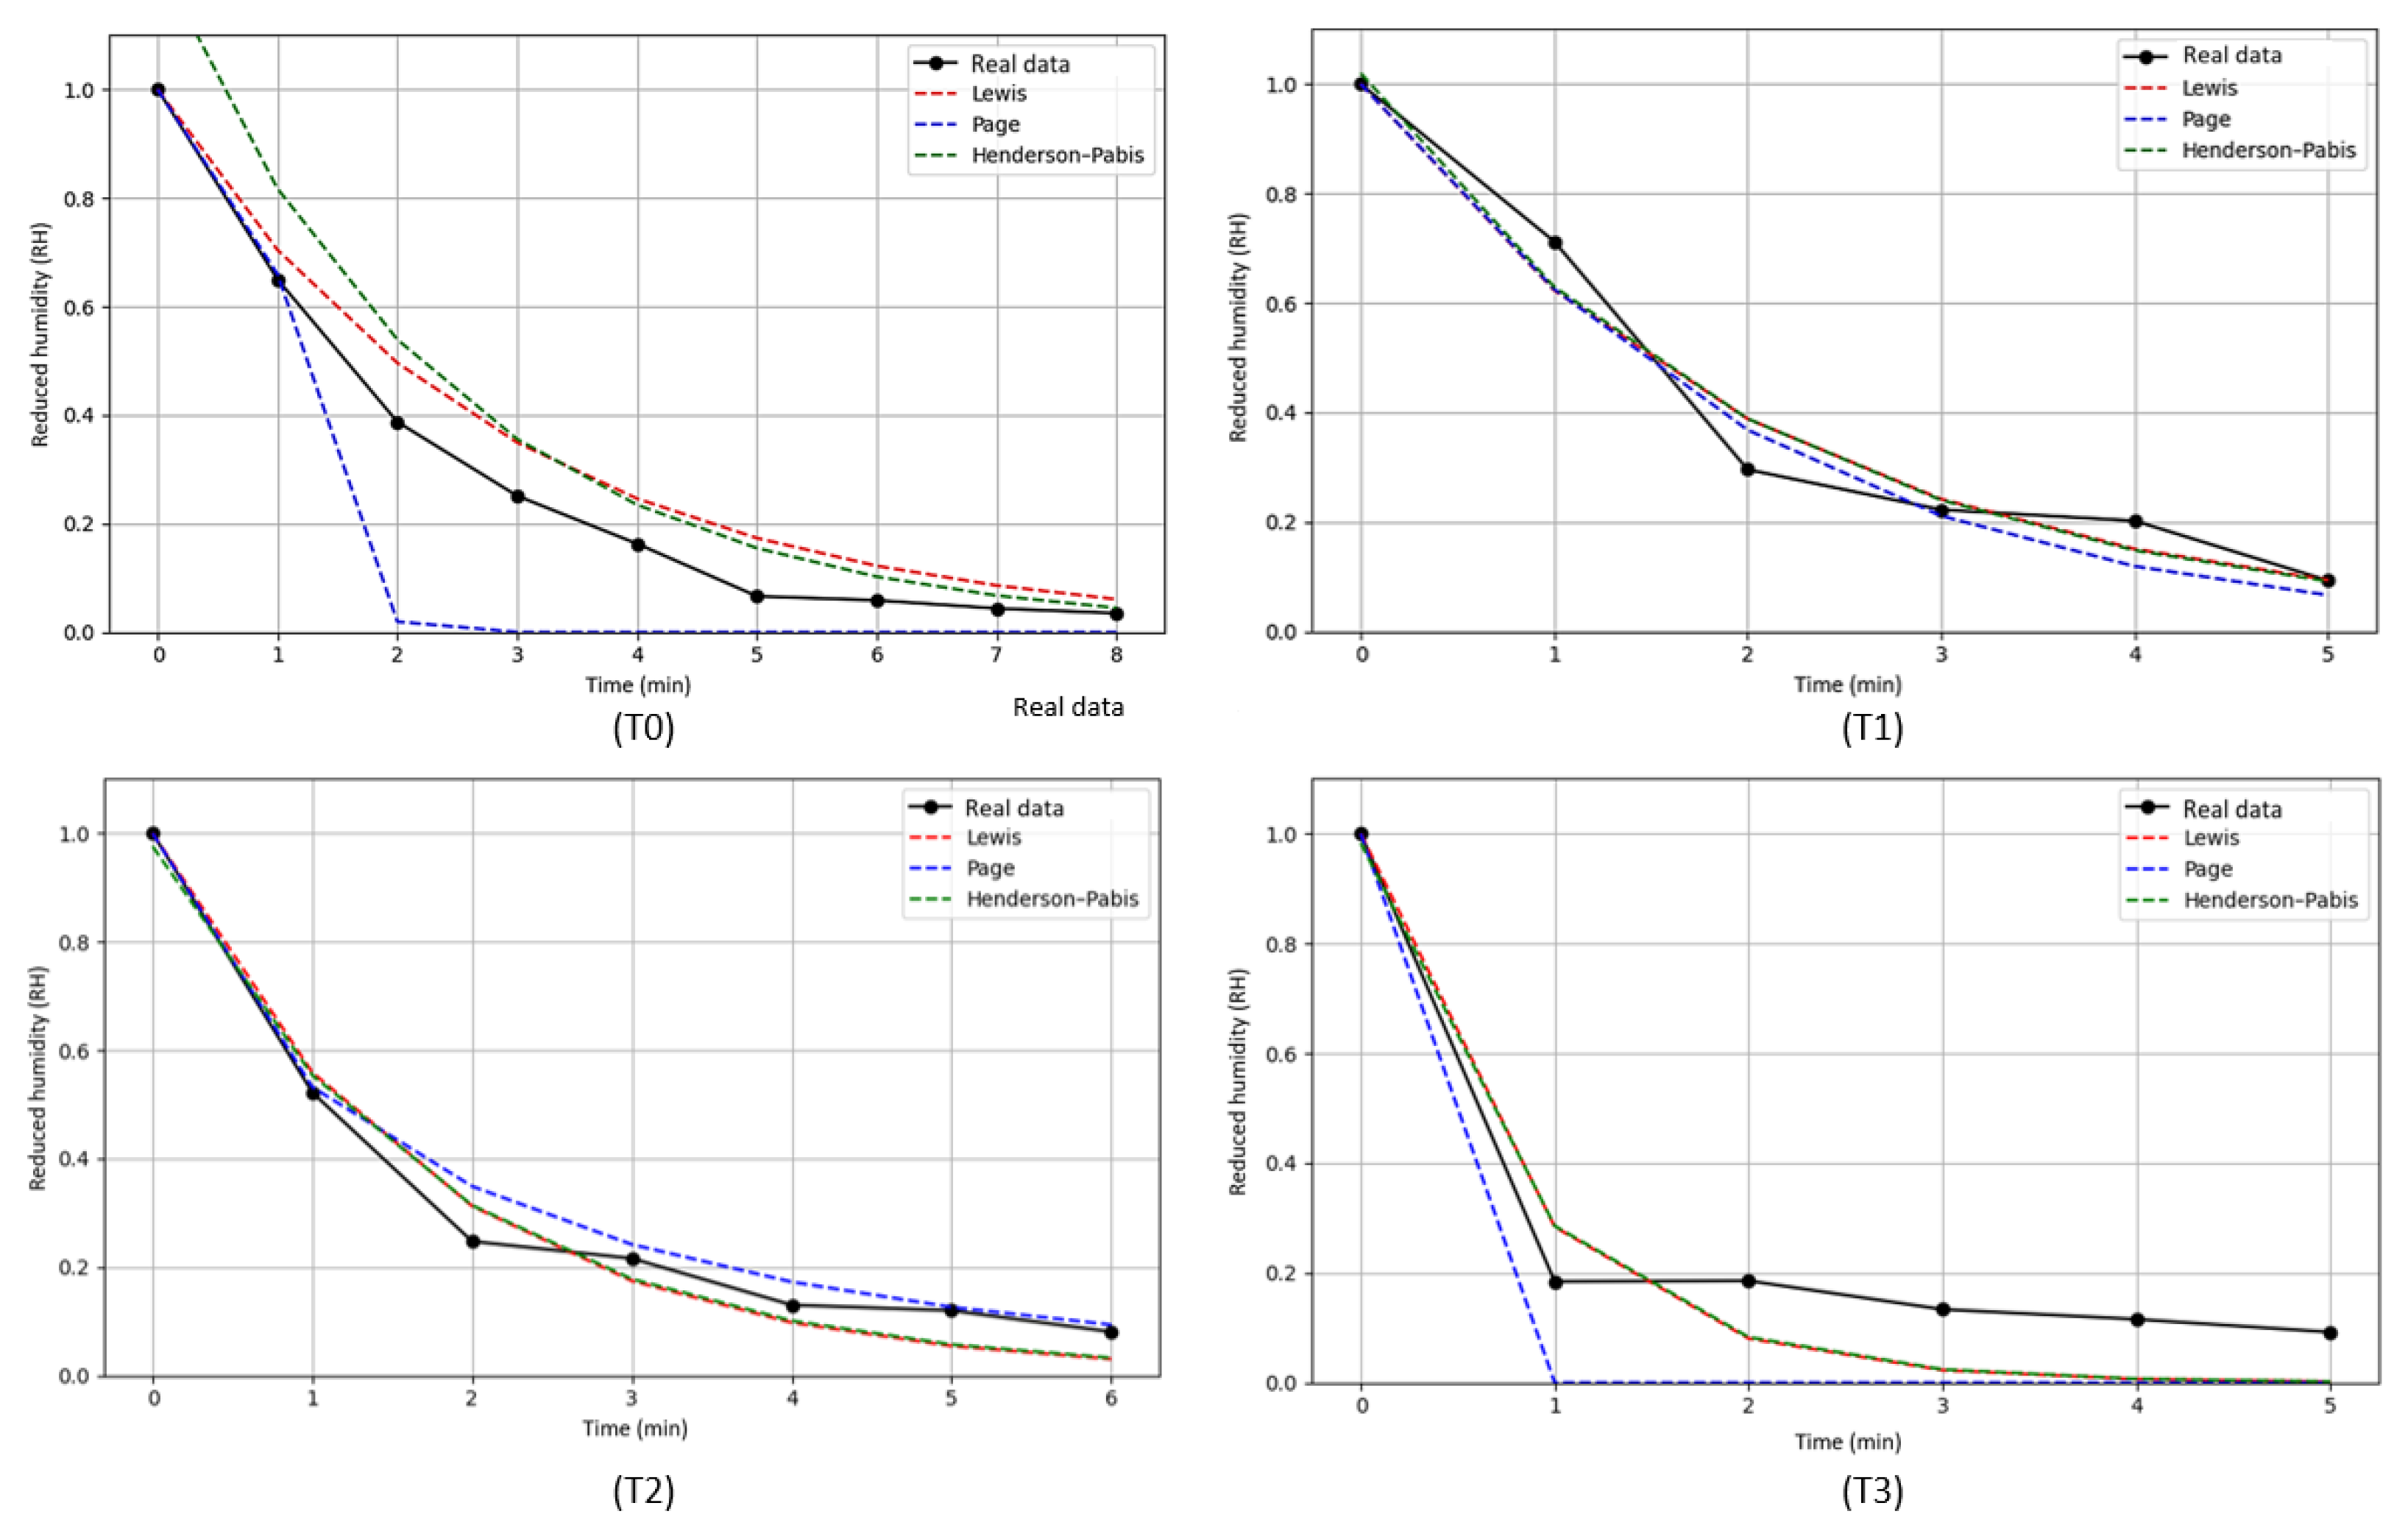
Figure 14.
Modeling of drying curves for T4 (45 ºBrix-40 ºC-180 min), T5 (50 ºBrix-30 ºC-120 min), T6 (50 ºBrix-30 ºC-180 min), T7 (50 ºBrix-40 ºC-120 min) and T8 (50 ºBrix-40 ºC-180 min).
Figure 14.
Modeling of drying curves for T4 (45 ºBrix-40 ºC-180 min), T5 (50 ºBrix-30 ºC-120 min), T6 (50 ºBrix-30 ºC-180 min), T7 (50 ºBrix-40 ºC-120 min) and T8 (50 ºBrix-40 ºC-180 min).
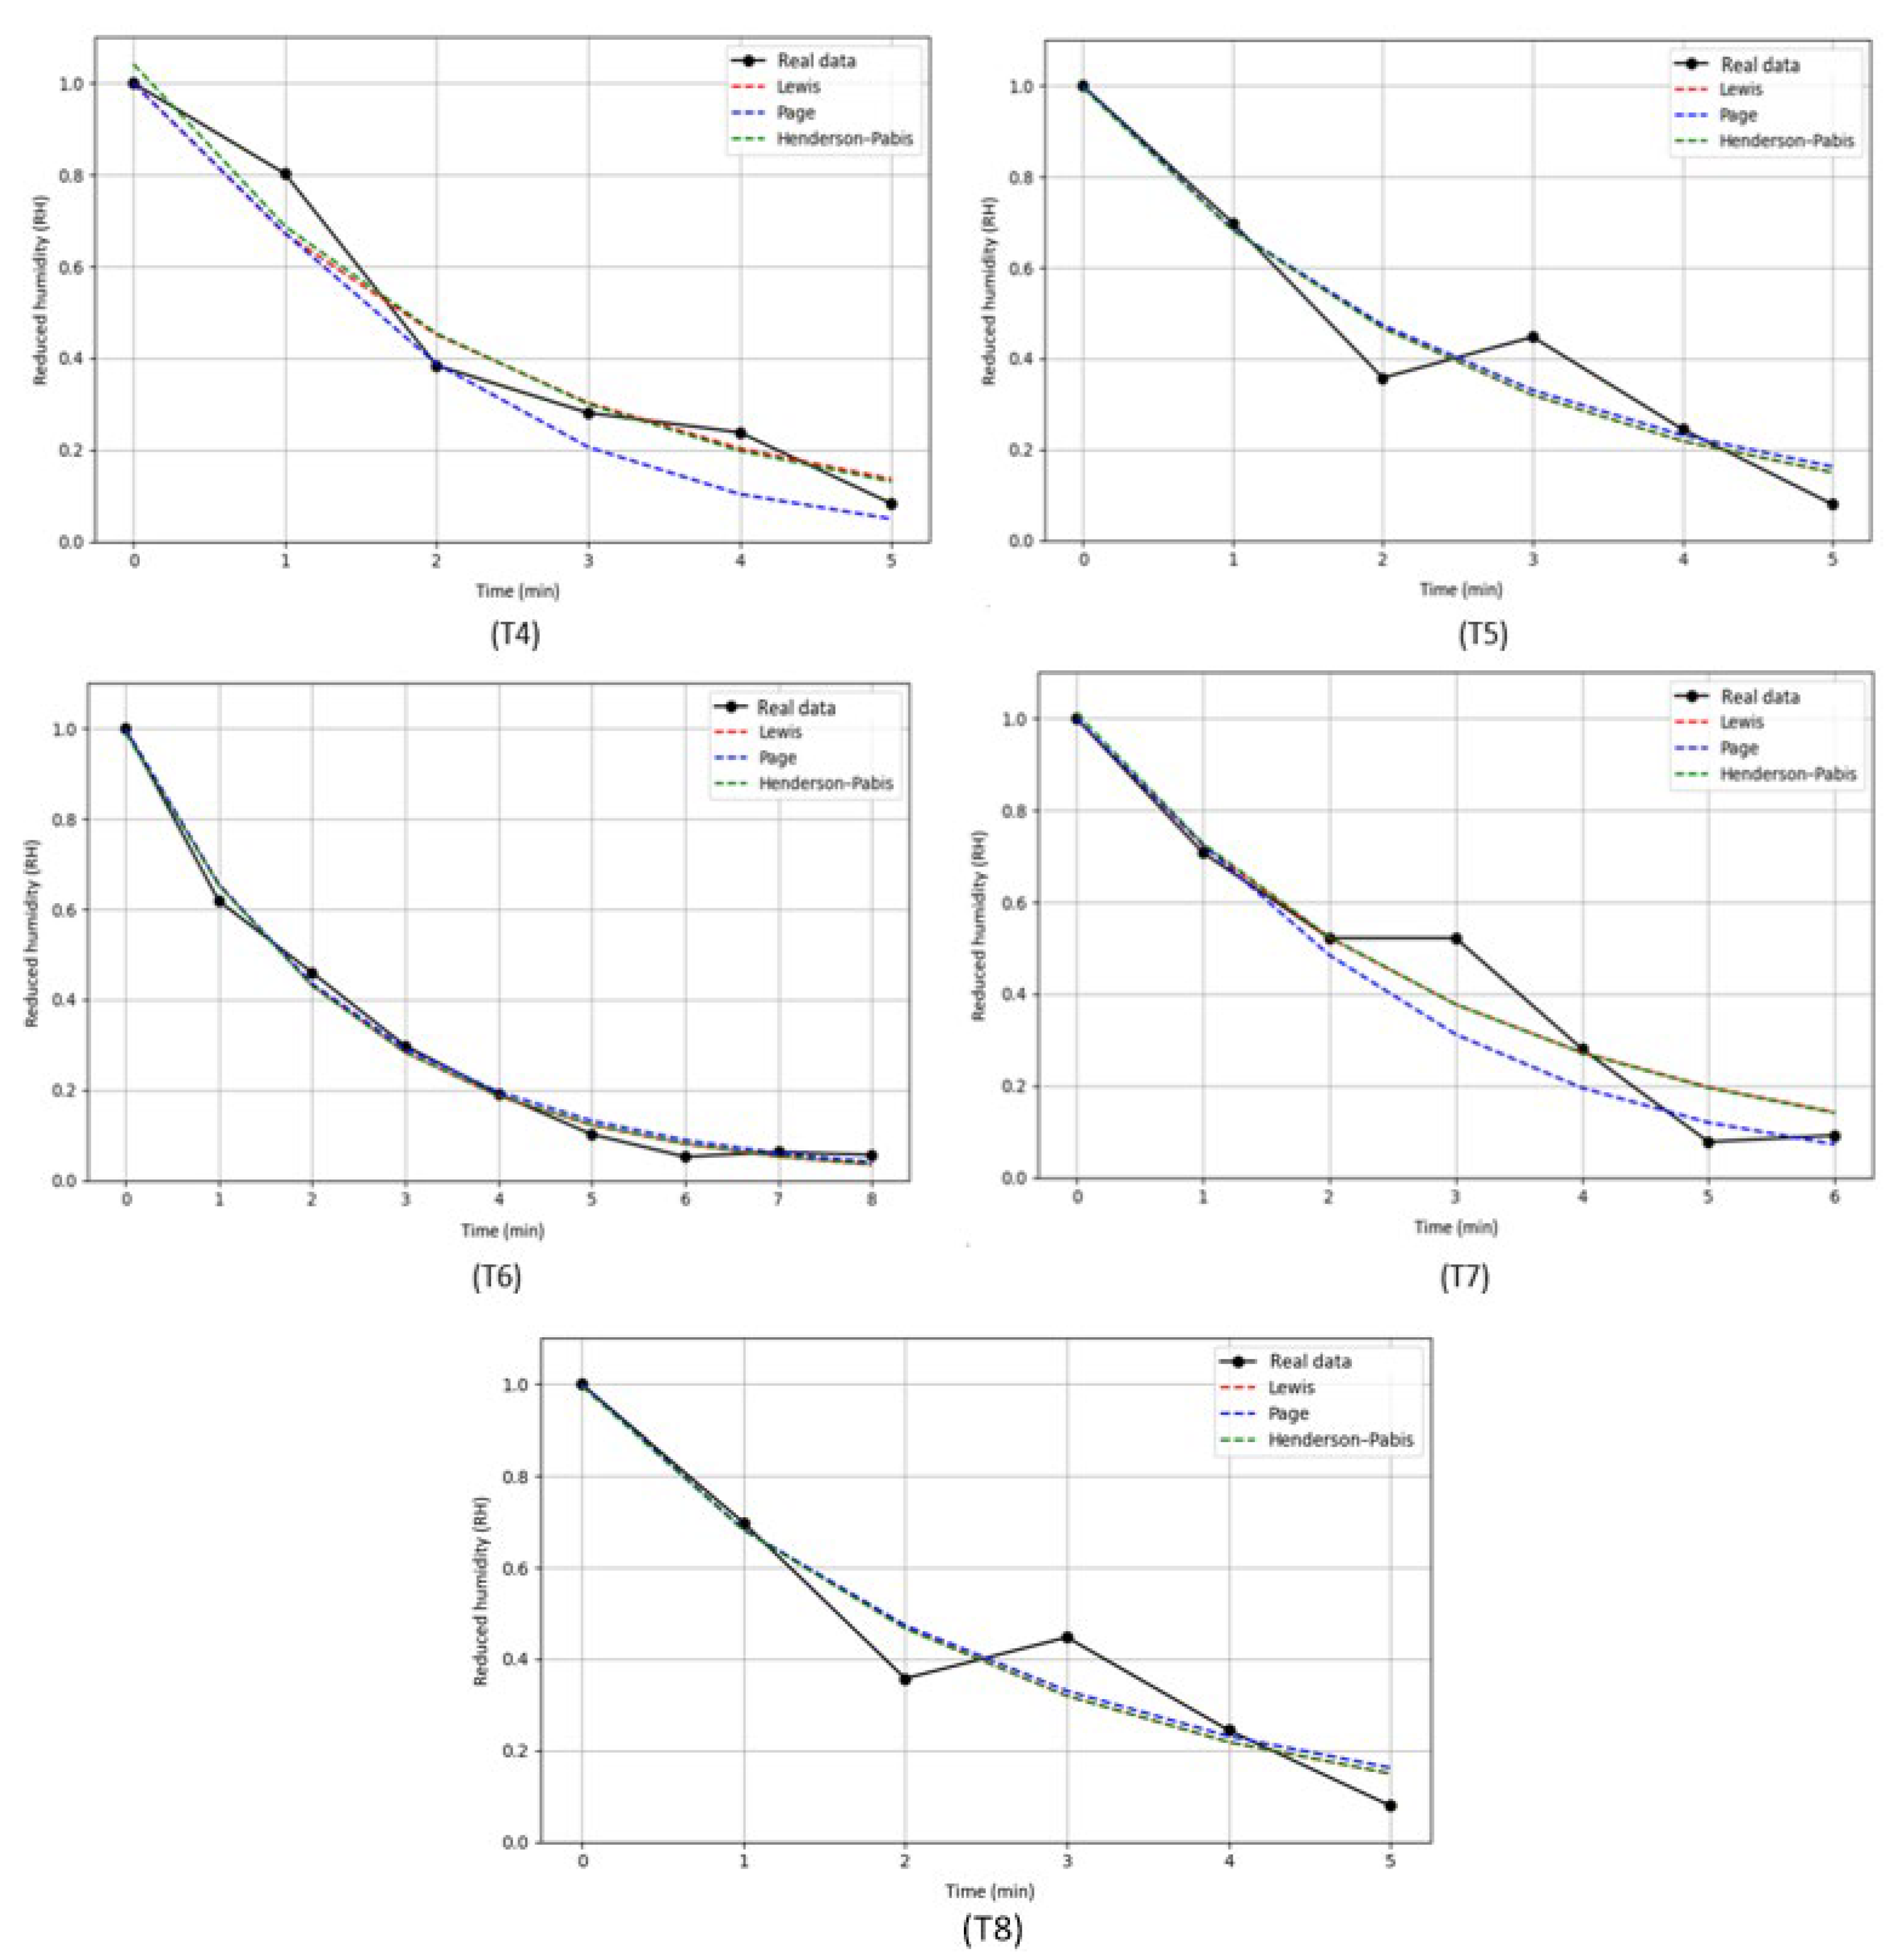

Table 1.
Osmodehydration process variables considered for equipment design.
| Variable | Working range |
|---|---|
| Temperature Concentration Agitation Fruit:syrup ratio |
35–50ºC 45-60 ºBrix Recirculation and blades 1:4 |
Table 2.
Factorial design 23.
| Treatment | Concentration (ºBrix) | Temperature (ºC) | Time (min) |
|---|---|---|---|
| T1 T2 T3 T4 T5 T6 T7 T8 |
45 45 45 45 50 50 50 50 |
30 30 40 40 30 30 40 40 |
120 180 120 180 120 180 120 180 |
Table 3.
Mass transfer results.
| Treatment | WR (Mean ± SD) | WL (Mean ± SD) | SG (Mean ± SD) |
|---|---|---|---|
| T1 T2 T3 T4 T5 T6 T7 T8 |
9.48 ± 0.46 16.42 ± 0.47 25.36 ± 0.77 31.80 ± 0.97 11.67 ± 1.02 19.53 ± 0.37 29.25 ± 0.38 34.47 ± 1.34 |
18.62 ± 0.33 23.45 ± 0.42 32.76 ± 0.59 36.89 ± 0.10 19.38 ± 0.39 25.20 ± 0.67 35.80 ± 0.69 39.15 ± 1.34 |
7.20 ± 0.77 8.37 ± 0.16 6.87 ± 0.23 8.25 ± 0.32 9.27 ± 0.64 8.53 ± 0.90 9.31 ± 0.73 8.98 ± 0.02 |
Table 4.
Mass transfer results.
| Treatment | Model | Parameters | R2 |
|---|---|---|---|
| T0 | Lewis Page Henderson–Pabis |
k = 0.3507 k = 0.4161, n = 3.2455 a = 1.2388, k = 0.4161 |
0.7370 0.8557 0.7786 |
| T1 | Lewis Page Henderson–Pabis |
k = 0.4732 k = 0.4698, n = 1.0897 a = 1.0195, k = 0.4824 |
0.9692 0.9707 0.9699 |
| T2 | Lewis Page Henderson–Pabis |
k = 0.5818 k = 0.6314, n = 0.7379 a = 0.9759, k = 0.5671 |
0.9766 0.9919 0.9776 |
| T3 | Lewis Page Henderson–Pabis |
k = 1.2601 k = 10.4461, n = 0.2037 a = 0.9828, k = 1.2358 |
0.9136 0.9978 0.9141 |
| T4 | Lewis Page Henderson–Pabis |
k = 0.3983 k = 0.3961, n = 1.2588 a = 1.0420, k = 0.4155 |
0.9588 0.9714 0.9621 |
| T5 | Lewis Page Henderson–Pabis |
k = 0.3804 k = 0.3809, n = 0.9716 a = 0.9956, k = 0.3786 |
0.9381 0.9383 0.9382 |
| T6 | Lewis Page Henderson–Pabis |
k = 0.4204 k = 0.4230, n = 0.9731 a = 0.9911, k = 0.4168 |
0.9949 0.9951 0.9950 |
| T7 | Lewis Page Henderson–Pabis |
k = 0.3248 k = 0.3212, n = 1.1729 a = 1.0112, k = 0.3286 |
0.9438 0.9498 0.9441 |
| T8 | Lewis Page Henderson–Pabis |
k = 0.3042 k = 0.3007, n = 1.3325 a = 1.0232, k = 0.3118 |
0.9306 0.9485 0.9317 |
Disclaimer/Publisher’s Note: The statements, opinions and data contained in all publications are solely those of the individual author(s) and contributor(s) and not of MDPI and/or the editor(s). MDPI and/or the editor(s) disclaim responsibility for any injury to people or property resulting from any ideas, methods, instructions or products referred to in the content. |
© 2025 by the authors. Licensee MDPI, Basel, Switzerland. This article is an open access article distributed under the terms and conditions of the Creative Commons Attribution (CC BY) license (http://creativecommons.org/licenses/by/4.0/).
Copyright: This open access article is published under a Creative Commons CC BY 4.0 license, which permit the free download, distribution, and reuse, provided that the author and preprint are cited in any reuse.


