1. Introduction
Rapid urbanization and the expansion of infrastructure networks—including roads, railways, tunnels, levees, and foundations—have increased the demand for construction-ready land. However, suitable sites with favorable geotechnical conditions are becoming scarce [
1], often necessitating construction on problematic soils, particularly those containing high proportions of clay minerals. These fine-grained soils present several geotechnical challenges, such as low permeability, poor bearing capacity, and significant volume changes due to moisture fluctuations, all of which can compromise the stability and longevity of built structures.
The presence of fine particles—particularly clay—within expansive soils has been found to increase swelling potential in proportion to the amount of fine material present [
2]. Clay minerals are electrochemically active, extremely small crystalline particles formed through the chemical weathering of rock-forming minerals. These particles are typically less than 1 μm in diameter and have a flake-like structure composed of repeating atomic layers [
3].
Traditional soil stabilization techniques—such as lime treatment, cement mixing, or fiber reinforcement—have proven effective but are often expensive and environmentally taxing. In response, there has been growing interest in sustainable alternatives, such as nano clay [
4], Xanthan gum [
5], and biochar, a carbon-rich byproduct produced through the pyrolysis of organic biomass under limited oxygen conditions [
6,
7,
8,
9]. Biochar possesses several properties beneficial to geotechnical applications, including high porosity, low density, large surface area, and a strong water retention capacity.
This study explores the feasibility of utilizing wood-based biochar as a sustainable amendment to improve the engineering behavior of medium plasticity clay. Laboratory tests were conducted on clay samples amended with varying biochar contents (3% to 15% by volume) to assess changes in key geotechnical parameters, including compaction behavior, compressibility, shear strength, and unconfined compressive strength. By analyzing the performance of biochar-clay mixtures, this research aims to contribute to the development of eco-friendly solutions for soil improvement in geotechnical engineering.
2. Historical Use of Biochar as a Soil Amendment
Biochar is an environmentally sustainable soil amendment produced through a process known as pyrolysis. This involves heating biomass in a low- or no-oxygen environment at temperatures typically ranging from 200°C to 700°C [
10,
11]. During pyrolysis, organic material is converted into a stable form of carbon—biochar—which resists decomposition and the release of carbon into the atmosphere [
12]. The characteristics of biochar can vary depending on the type of feedstock used. For example, biochar derived from food waste tends to contain more labile carbon and less aromatic structure, resulting in lower stability. In contrast, biochar produced from wood, grass, or straw is more highly carbonized, with aromatic structures that enhance soil stability [
13]. Similarly, biochar generated from agricultural or forestry residues is typically considered highly stable in soil [
13].
In recent years, biochar has attracted increasing attention in geotechnical engineering as a soil stabilizer [
7,
8]. Its beneficial properties—such as high porosity, large specific surface area, low density, water-holding capacity, and nutrient retention—make it a promising material for ground improvement [
14,
15,
16]. Due to its high porosity, biochar enhances soil permeability, reducing water retention and mitigating the swelling behavior of expansive soils. The effects of biochar on the hydraulic conductivity of soils were investigated by numerous researchers [
6,
9,
17]. Beyond geotechnical applications, biochar is also widely used in carbon sequestration, contaminated soil remediation, and water and wastewater treatment [
18]. Nakhli, Goy, Manahiloh and Imhoff [
17] investigated the spatial heterogeneity created when mixing biochar with soil, and its impact on the hydraulic conductivity of soil.
Bian, et al. [
19] observed that soil amended with biochar and high moisture content exhibited favorable geotechnical properties. Specifically, increasing the biochar content was associated with decreases in both the compression index and void ratio, indicating improved soil performance. Biochar also influences various physical and chemical aspects of soil behavior [
16,
20,
21,
22].
Biochar is highly porous, and it has a lower density than soil; thus, the application of soil amendment enhances porosity, pore size distribution, and hydraulic conductivity and reduces the density of soil [
23,
24,
25]. In addition, due to its high surface area compared to soil, adding biochar to soil results in an increase in soil-specific area [
25].
Lamprinakos and Manahiloh [
7] demonstrated that adding biochar to silty sand affects compaction behavior by lowering the maximum dry unit weight and increasing the optimum moisture content. Numerous studies have also confirmed that biochar can mitigate the swelling and shrinking of expansive soils while improving mechanical properties such as strength and stiffness [
15,
16,
26,
27,
28]. Villarreal and Wang [
28] identified two mechanisms through which biochar benefits expansive soils: (1) its superior water-holding capacity compared to clay minerals allows it to retain moisture more effectively, and (2) its high porosity increases soil permeability, thereby reducing expansion deformation.
Further evidence from Zhang, Jing, Chen, Wang and Zhang [
22] shows that biochar enhances soil structure and microbial activity by promoting aggregate formation, which positively influences hydraulic properties. Castellini, Giglio, Niedda, Palumbo and Ventrella [
26] similarly found that biochar increases hydraulic conductivity relative to unamended soils. Reddy, Yaghoubi and Yukselen-Aksoy [
25] indicated that the compressibility of soil decreases as the percentage of biochar content in soil increases, and it increases when the particle size of biochar decreases. This finding aligns with Zhang, Gu, Tang, Shen, Narala and Shi [
16], who reported that the presence of biochar reduces the compressibility of clayey soils due to its low-density characteristics. Additionally, Manahiloh, Kaliakin and Verdi [
15] observed that incorporating biochar into fat clay improves unconfined compressive strength, with higher biochar percentages leading to greater strength gains.
3. Laboratory Test Results and Discussion
3.1. Characterization of the Control Clay
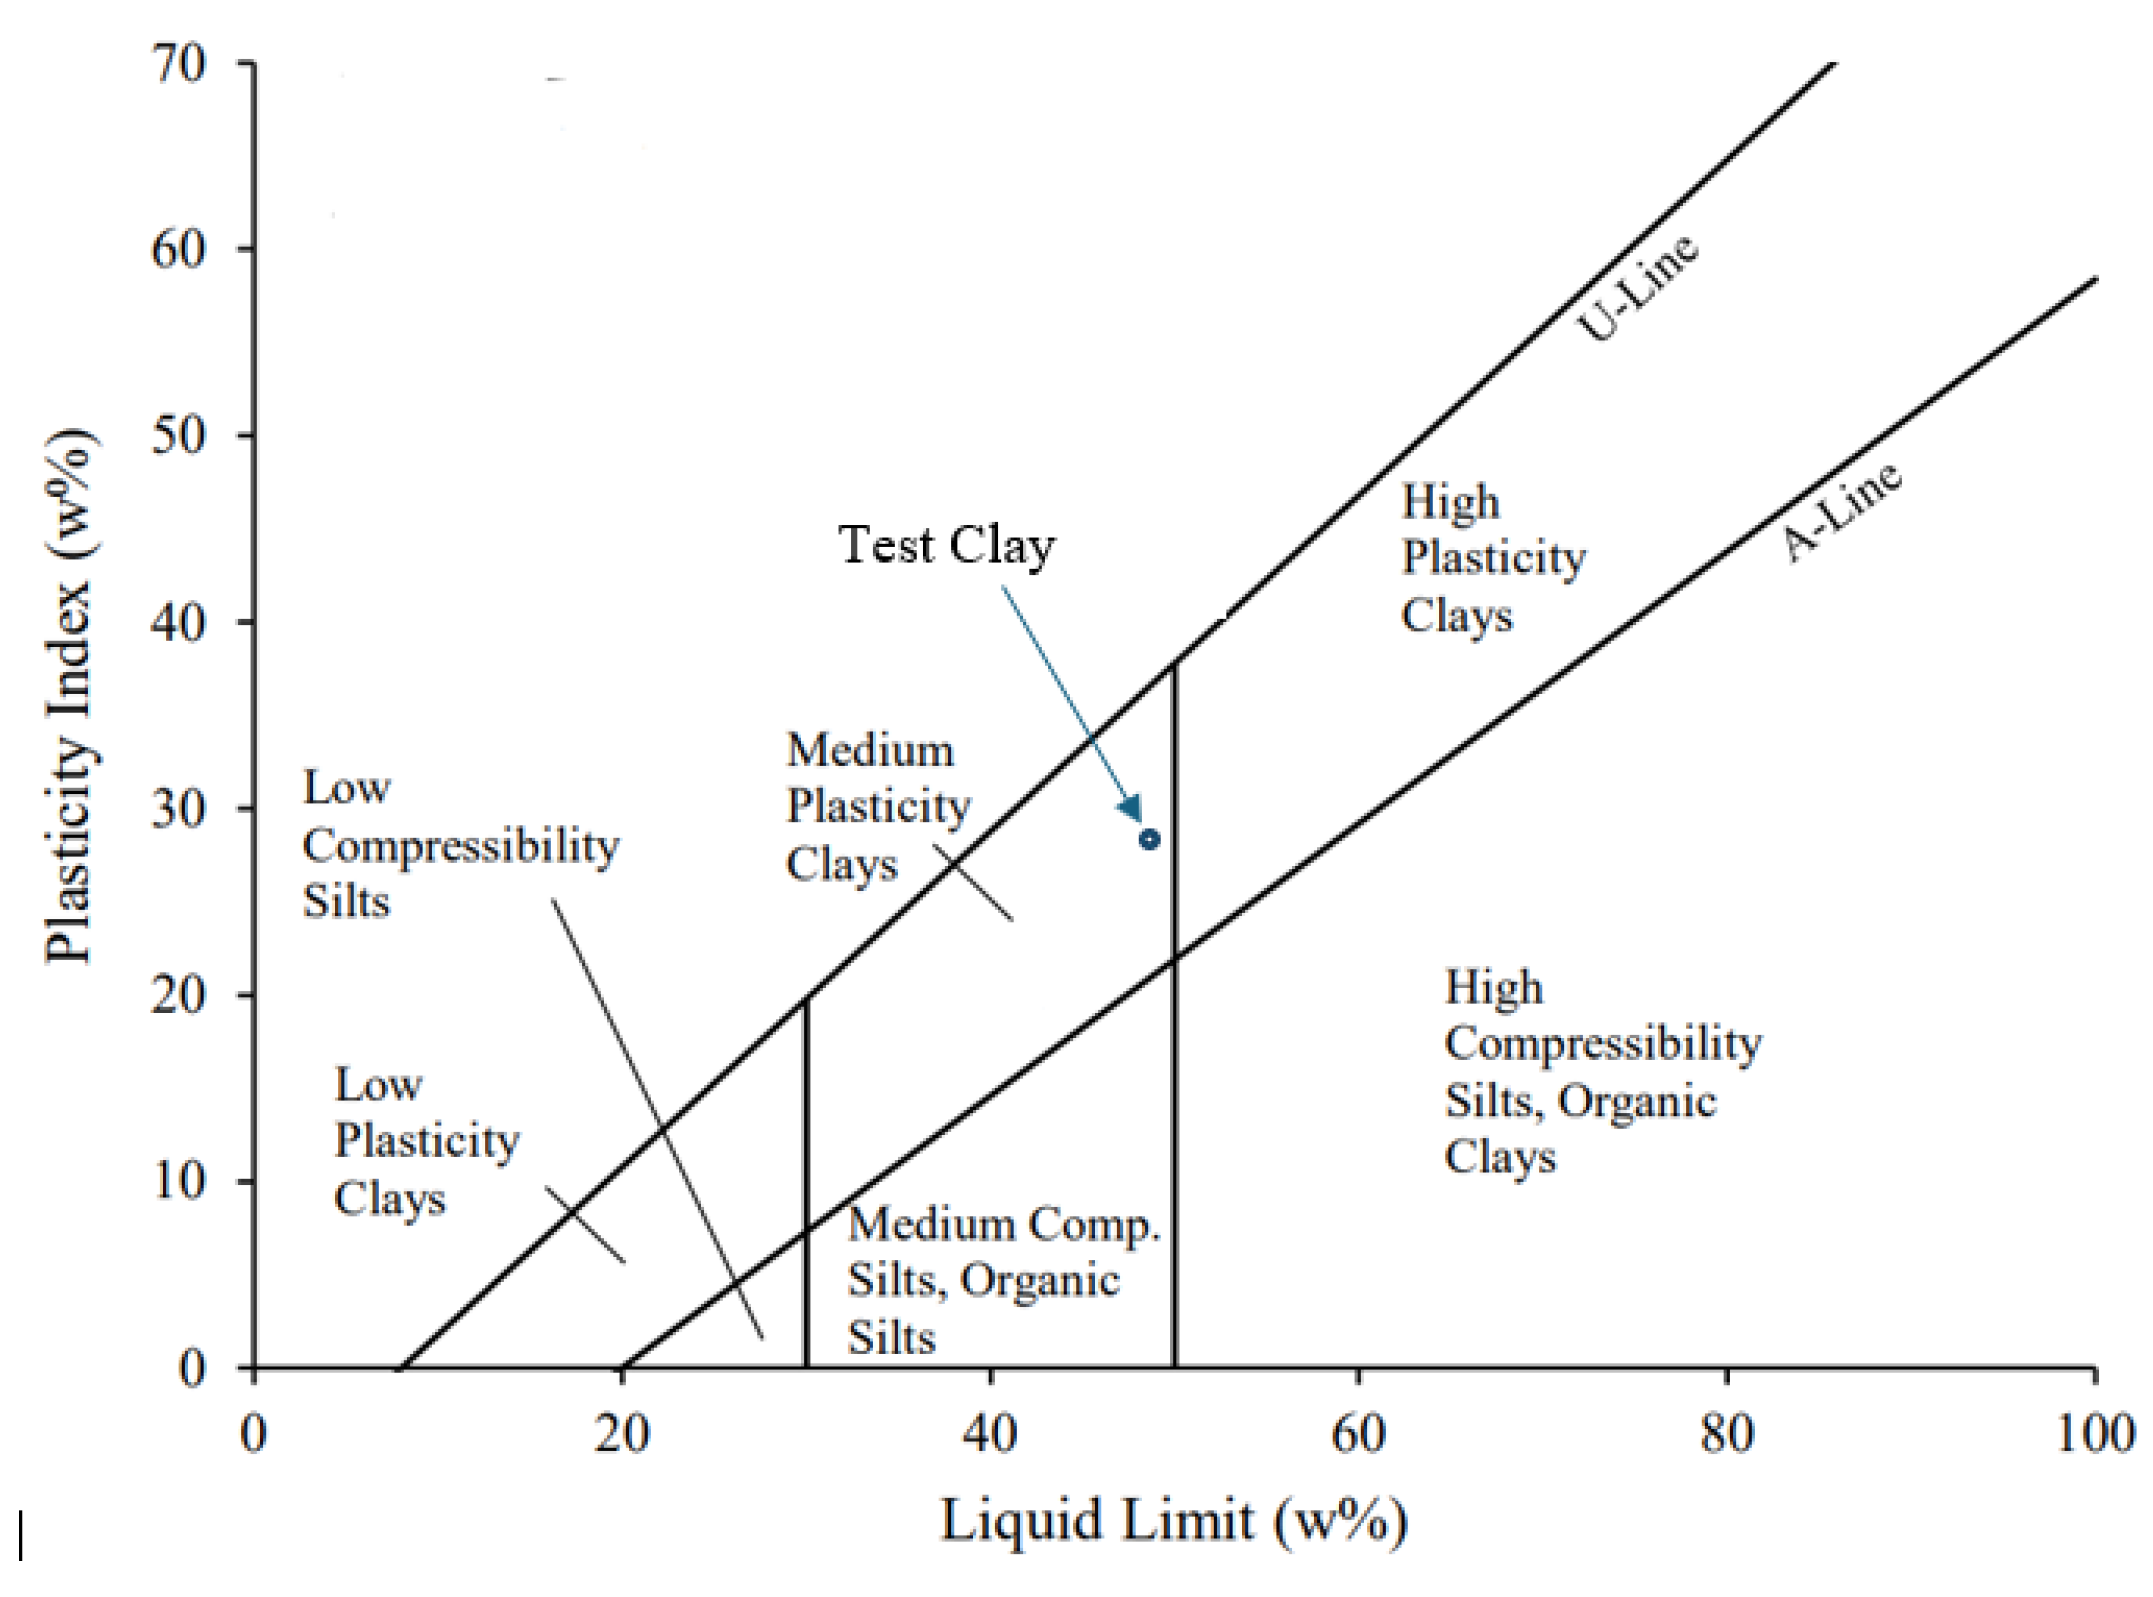
The clay utilized in this study was obtained from a quarry located in Perryville, Maryland. Following ASTM standard procedures, key geotechnical properties such as Atterberg limits, specific gravity, and grain size distribution were determined. Based on the Unified Soil Classification System (USCS), the soil was identified as a medium plasticity clay. As previously noted, the presence of clay minerals in the soil contributes to its tendency to swell and shrink depending on moisture content.
Plasticity refers to a physical characteristic of the interaction between clay and water. It can be quantified through various methods, including Atterberg limits, Pfefferkorn test, penetrometer, capillary rheometer, Brabender rheometer, and tension-deformation analysis [
29]. The plastic behavior of soil is indicative of the presence and nature of clay minerals [
30]. These plasticity characteristics significantly influence the geotechnical behavior of soils. According to Mitchell and Soga [
30], “the greater the plasticity, the greater is the shrinkage on drying (the lower the shrinkage limit).” Furthermore, they note that “the swelling and shrinking properties of the clay minerals follow the same pattern as their plasticity properties; that is, the more plastic the mineral, the more potential for swell and shrinkage.”
Figure 1.
Plasticity Chart for Maryland Clay.
Figure 1.
Plasticity Chart for Maryland Clay.
The Atterberg limits of the Maryland clay were determined in accordance with ASTM D4318-17e. Test results indicated a Liquid Limit of 49.8%, a Plastic Limit of 25.1%, and a Plasticity Index of 24.7%. To confirm the classification, the Liquid Limit test was repeated, as the initial value was near the threshold between medium and high plasticity. Since the average Liquid Limit remained below 50%, the clay was classified as having medium plasticity.
3.2. Standard Proctor Compaction Test
A study on standard Proctor compaction curves for silty sand, 6% biochar-soil mix, and 10% biochar-soil mix demonstrated that the dynamic impact of the compaction hammer can fracture biochar particles [
7]. This fracturing leads to inconsistent compaction curves during re-compaction, indicating that biochar-amended soils should be compacted only once. To maintain consistency in this study, each sample was compacted a single time and then discarded.
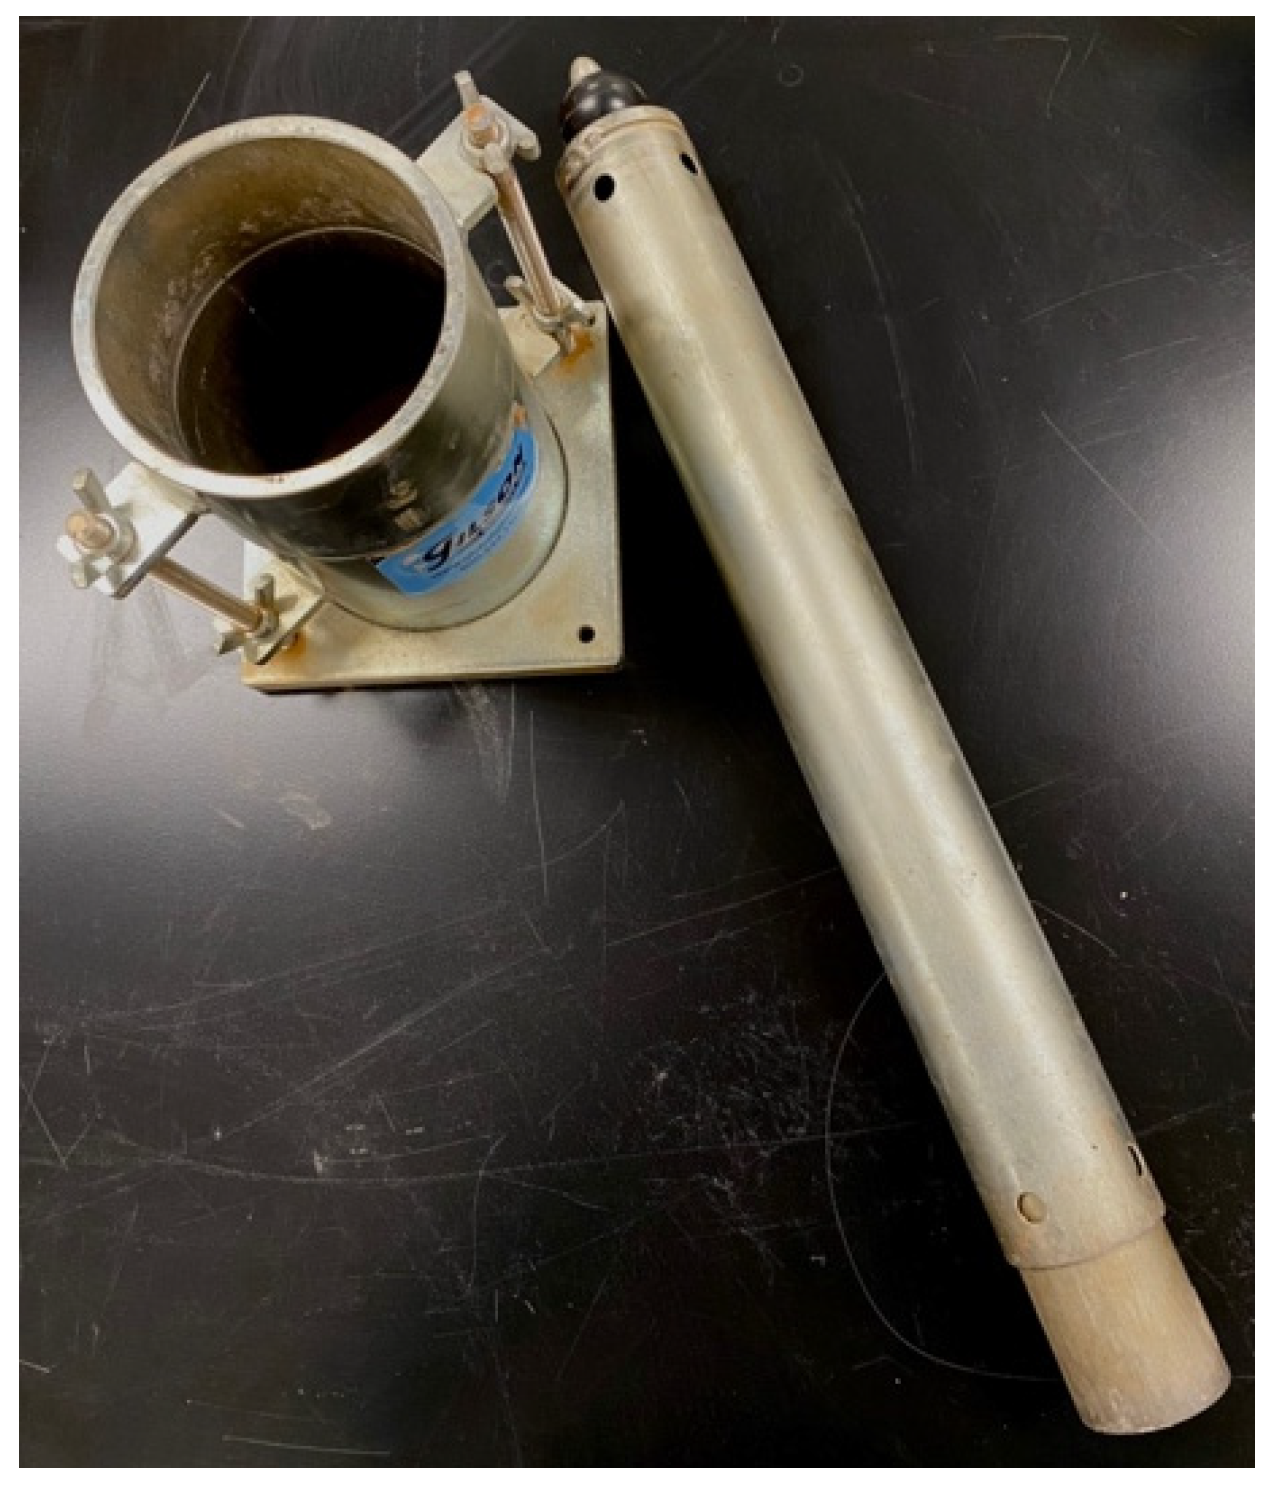
One-point standard Proctor compaction tests were conducted in accordance with [
31]. Samples were prepared at water contents ranging from approximately 20% to 26%, using Maryland clay without biochar. Each sample was placed into a mold in three uniform layers, with each layer compacted 25 times using a 5.5 lb hammer dropped from a height of 12 inches. This procedure was repeated five times, with the water content incrementally increased across the samples.
Figure 2.
Standard Proctor Compaction Mold and Hammer.
Figure 2.
Standard Proctor Compaction Mold and Hammer.
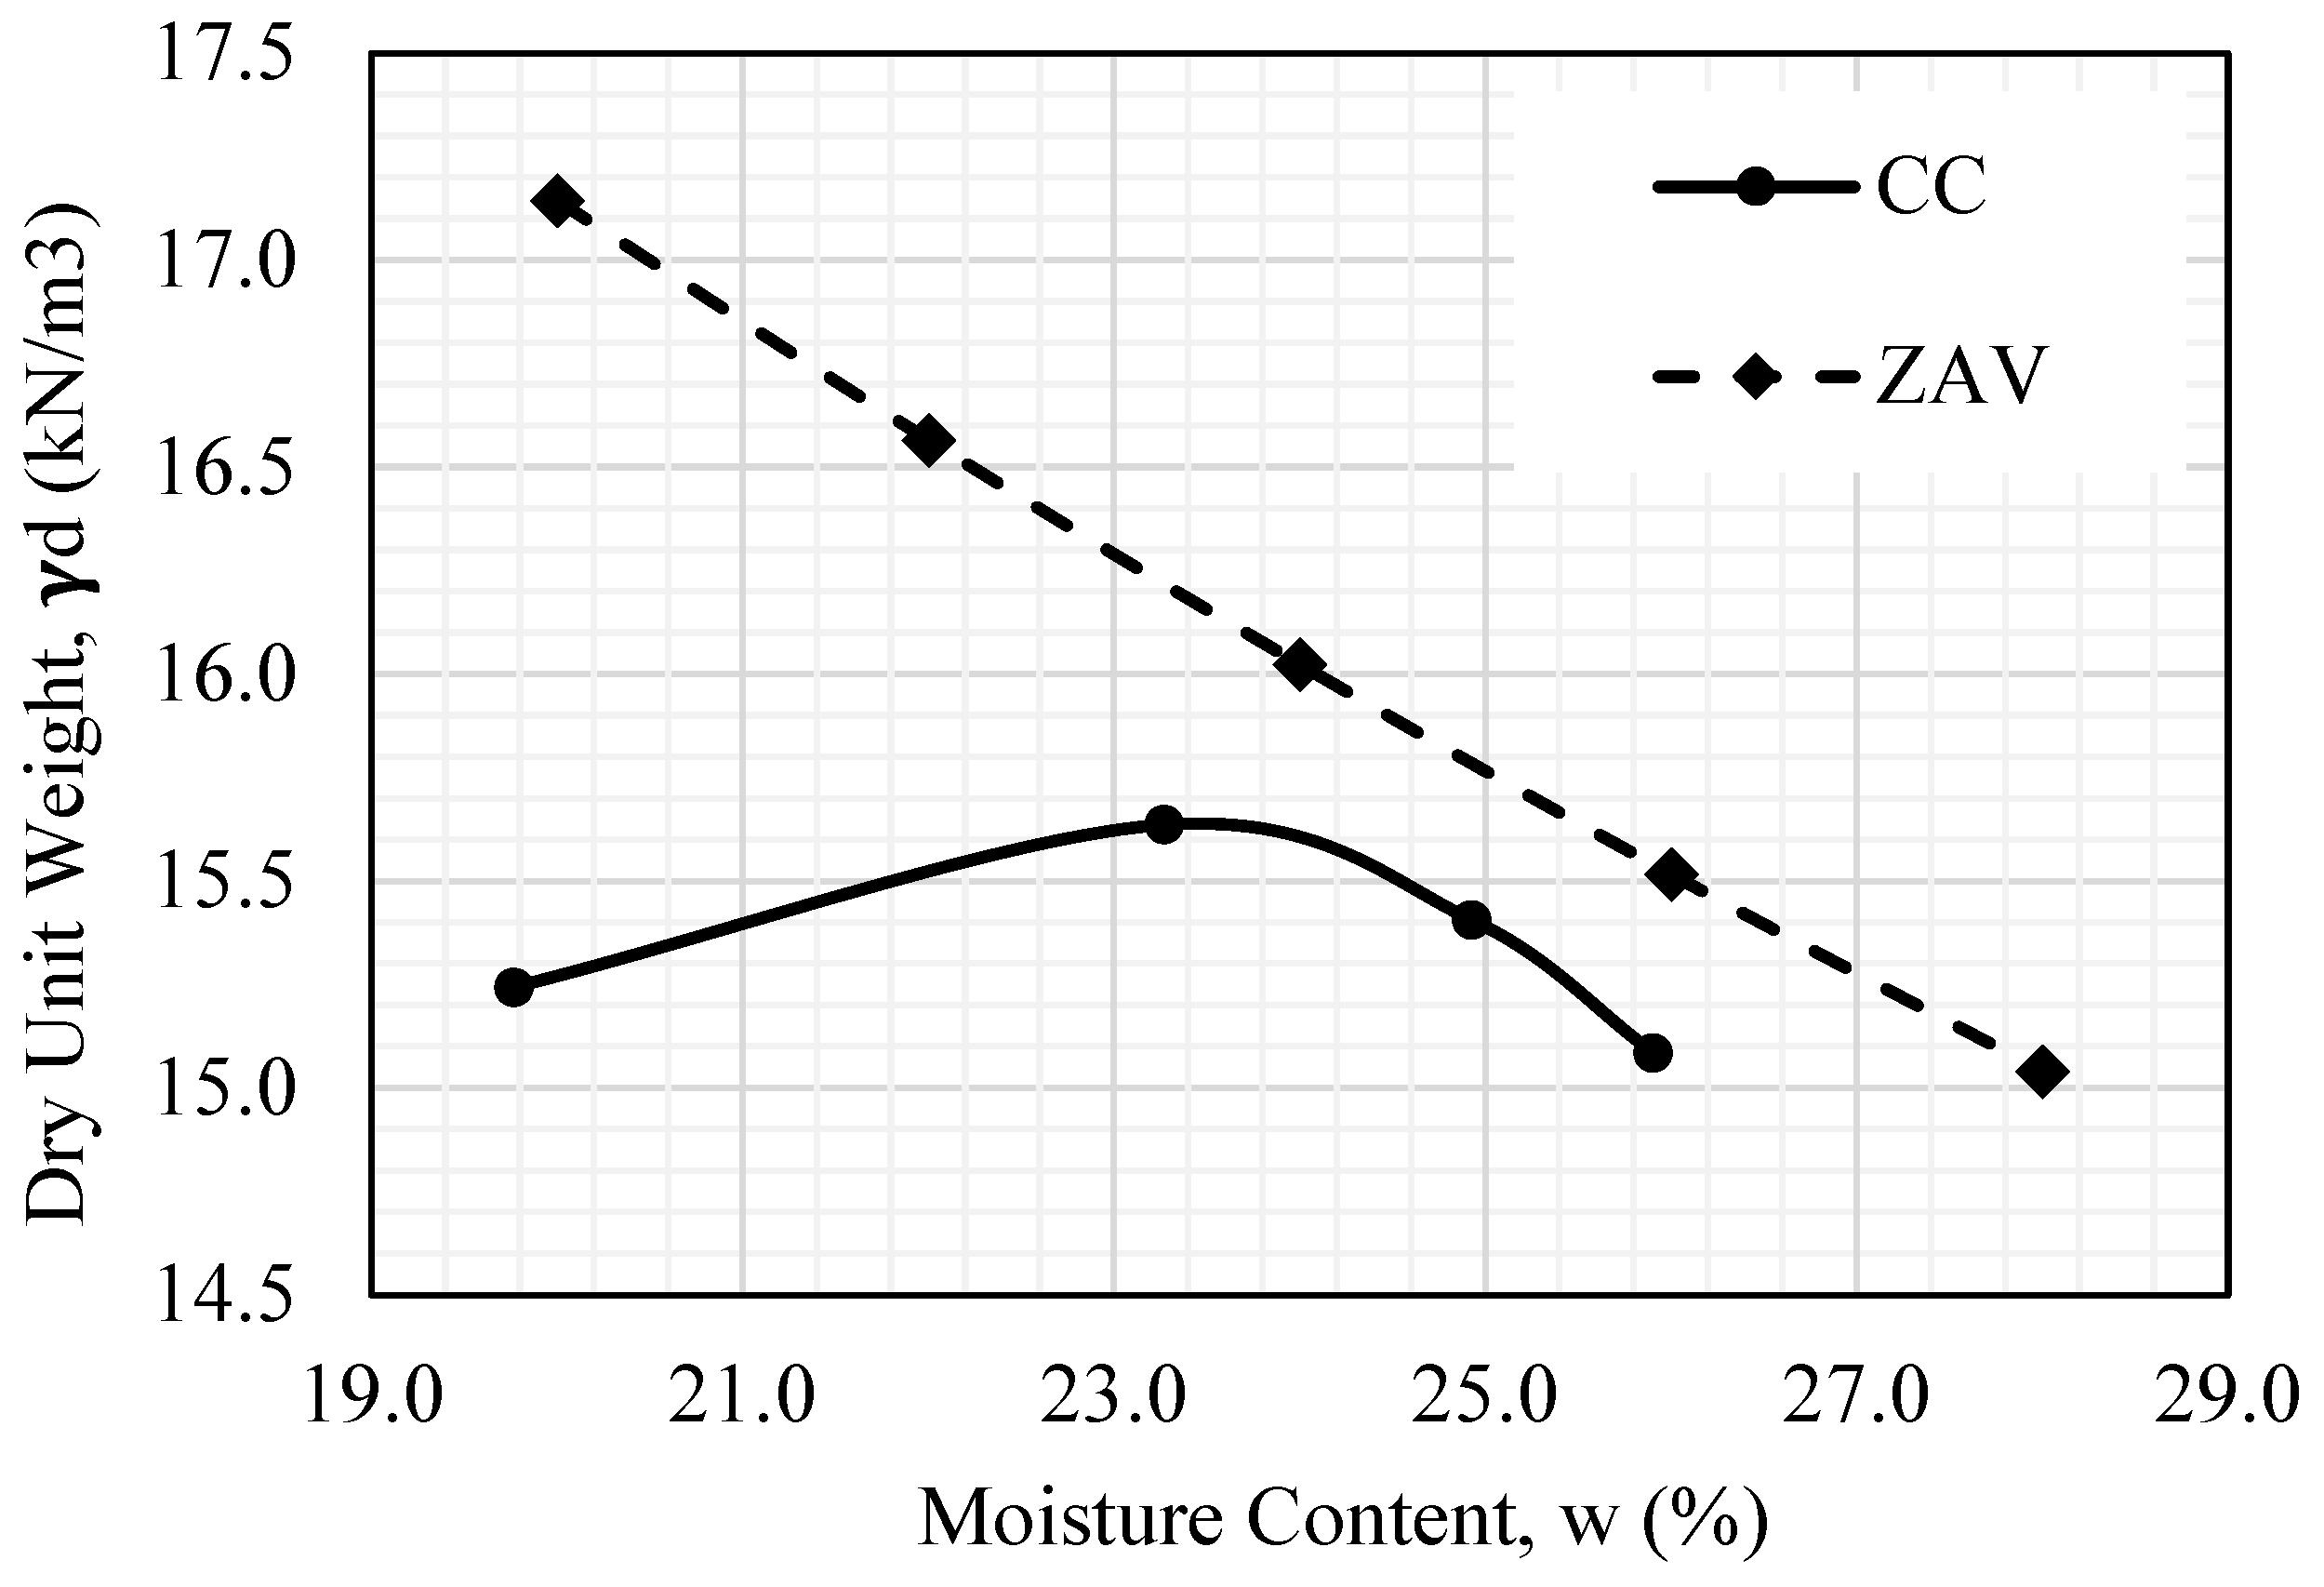
The test results showed that, without biochar amendment, the clay achieved an optimum moisture content of approximately 23.5%, corresponding to a maximum dry density of 15.3 kN/m
3. As shown in
Figure 3 and detailed in
Table 1, dry density increased with rising water content up to about 23%, after which it began to decline. The inflection point on the curve occurs between 23% and 24% water content, identifying 23.5% as the optimal moisture content for compaction.
3.3. Characterization of Biochar-Amended Clay
3.3.1. Atterberg Limits
Specimens consisting of clay amended with biochar at volumetric proportions of 0%, 3%, 6%, 9%, 12%, and 15% were prepared for testing. The Atterberg Limits of these biochar-clay mixtures were determined in accordance with [
32]. The corresponding results are presented in
Table 2.
3.3.2. Compression Test
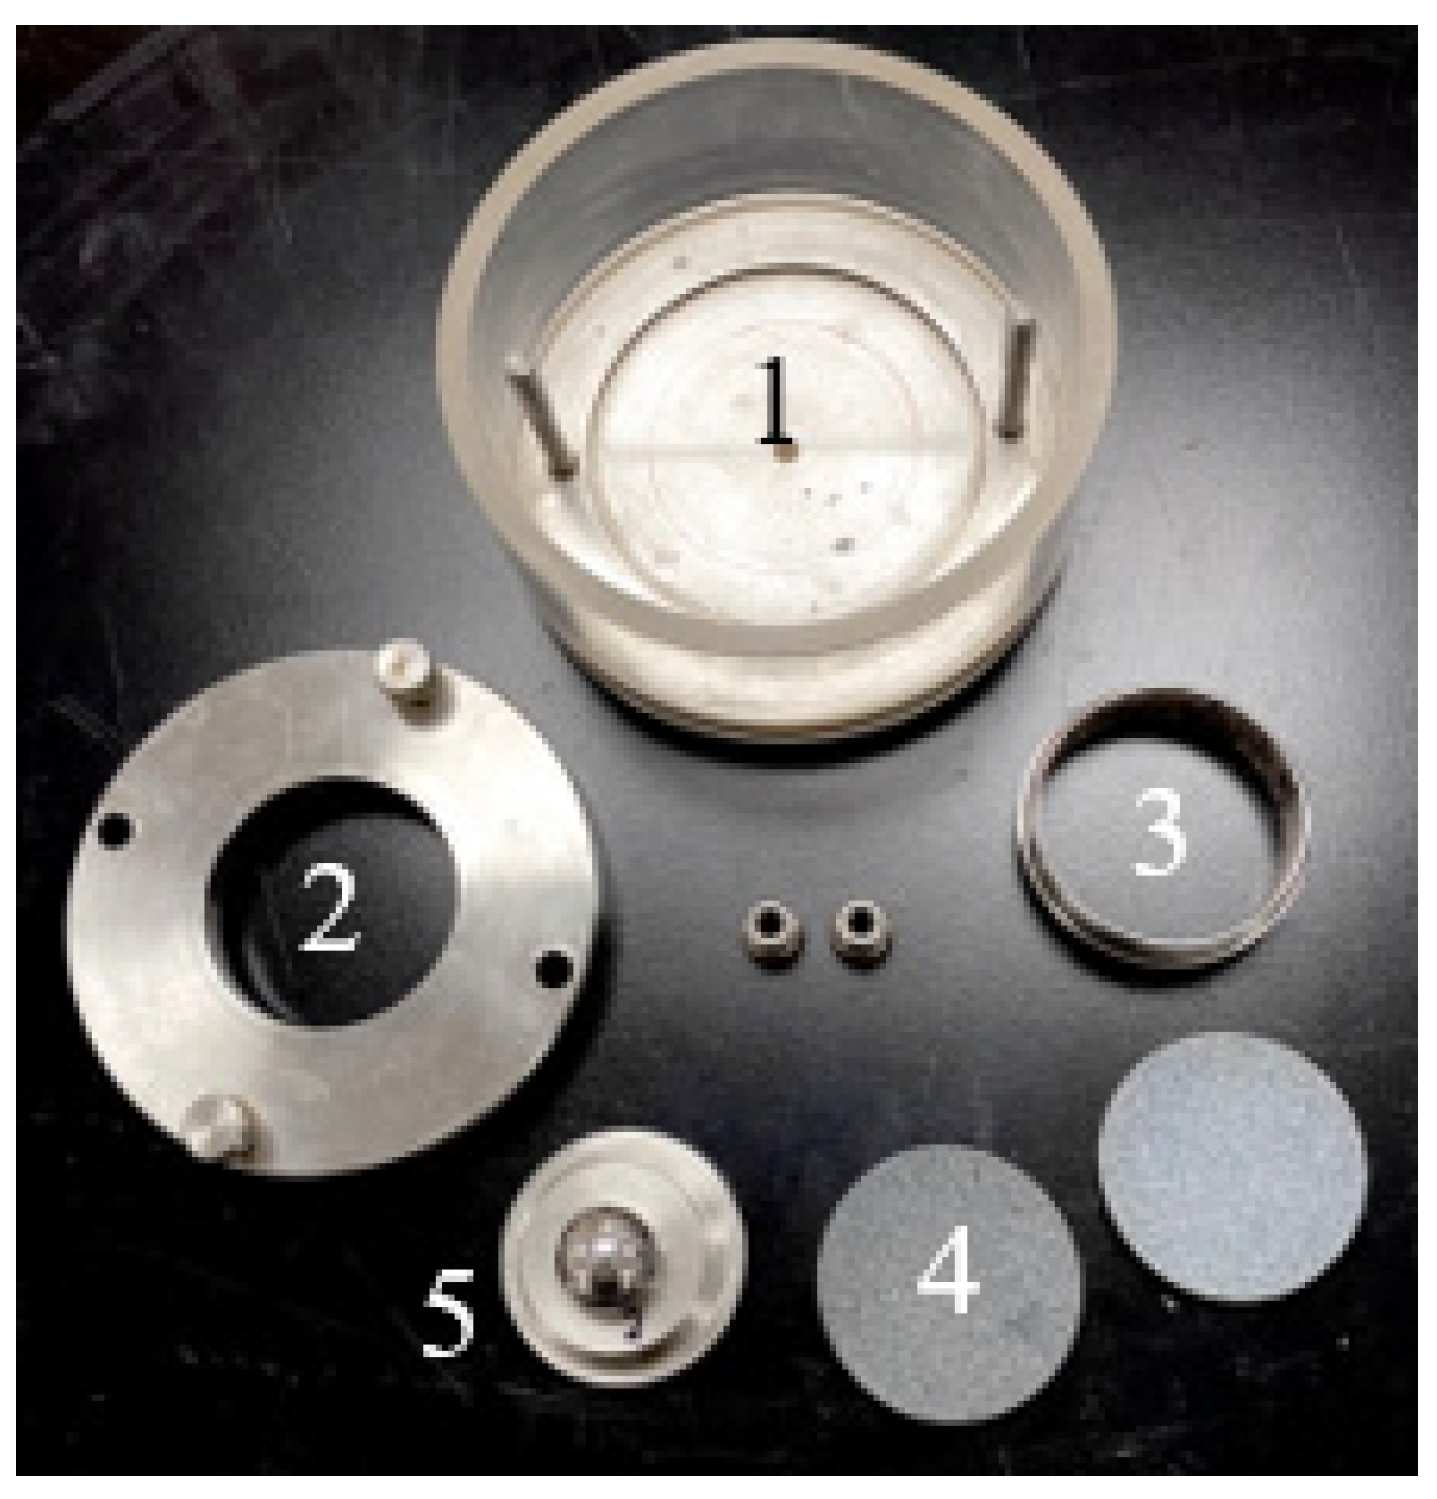
The compressive behavior of both unamended soil and soil–biochar mixtures was assessed using a modified one-dimensional compression test. While compressive characteristics are conventionally determined, on undisturbed disk samples, in accordance with [
33] using a consolidometer apparatus, a customized setup, where the samples were prepared by remolding, was employed in this study. As illustrated in
Figure 4, the apparatuses include: (1) base plate, (2) metal ring, (3) consolidation ring, (4) porous stones, and (5) loading platen and ball bearing.
All specimens were prepared at comparable water contents to ensure uniformity in initial conditions. The biochar content was systematically varied across samples, ranging from 0% to 15% by volume. Each specimen was subjected to a series of incremental vertical stresses: 1, 2, 4, 8, 16, 8, 16, and 32 tons per square foot. Each load increment was maintained for a duration of one day to allow for primary compression before the subsequent load was applied.
Soil specimens were prepared with an initial gravimetric water content of approximately 30%, then compacted to conform to the dimensions of the consolidation ring. The precise initial moisture content was recorded prior to testing. Each specimen was placed within a fixed-ring consolidometer, enclosed between two porous stones to facilitate uniform vertical drainage. Full saturation was achieved by inundating the specimen with water throughout the testing period.
The consolidometer assembly was mounted in a pneumatic loading frame, and vertical deformation was monitored using a linear variable differential transformer (LVDT). An initial vertical stress of 1 ton/ft2 was applied, and vertical displacement readings were recorded at regular intervals over a 24-hour period. The loading sequence continued with incremental stress levels of 2, 4, 8, 16, 8, 16, and 32 tons/ft2. To evaluate the swell behavior of the soil, the stress was decreased from 16 to 8 tons/ft2 and subsequently reapplied to 16 tons/ft2. The consolidation tests were conducted on soil specimens amended with biochar at volumetric proportions of 0% (control), 3%, 6%, 9%, 12%, and 15%.
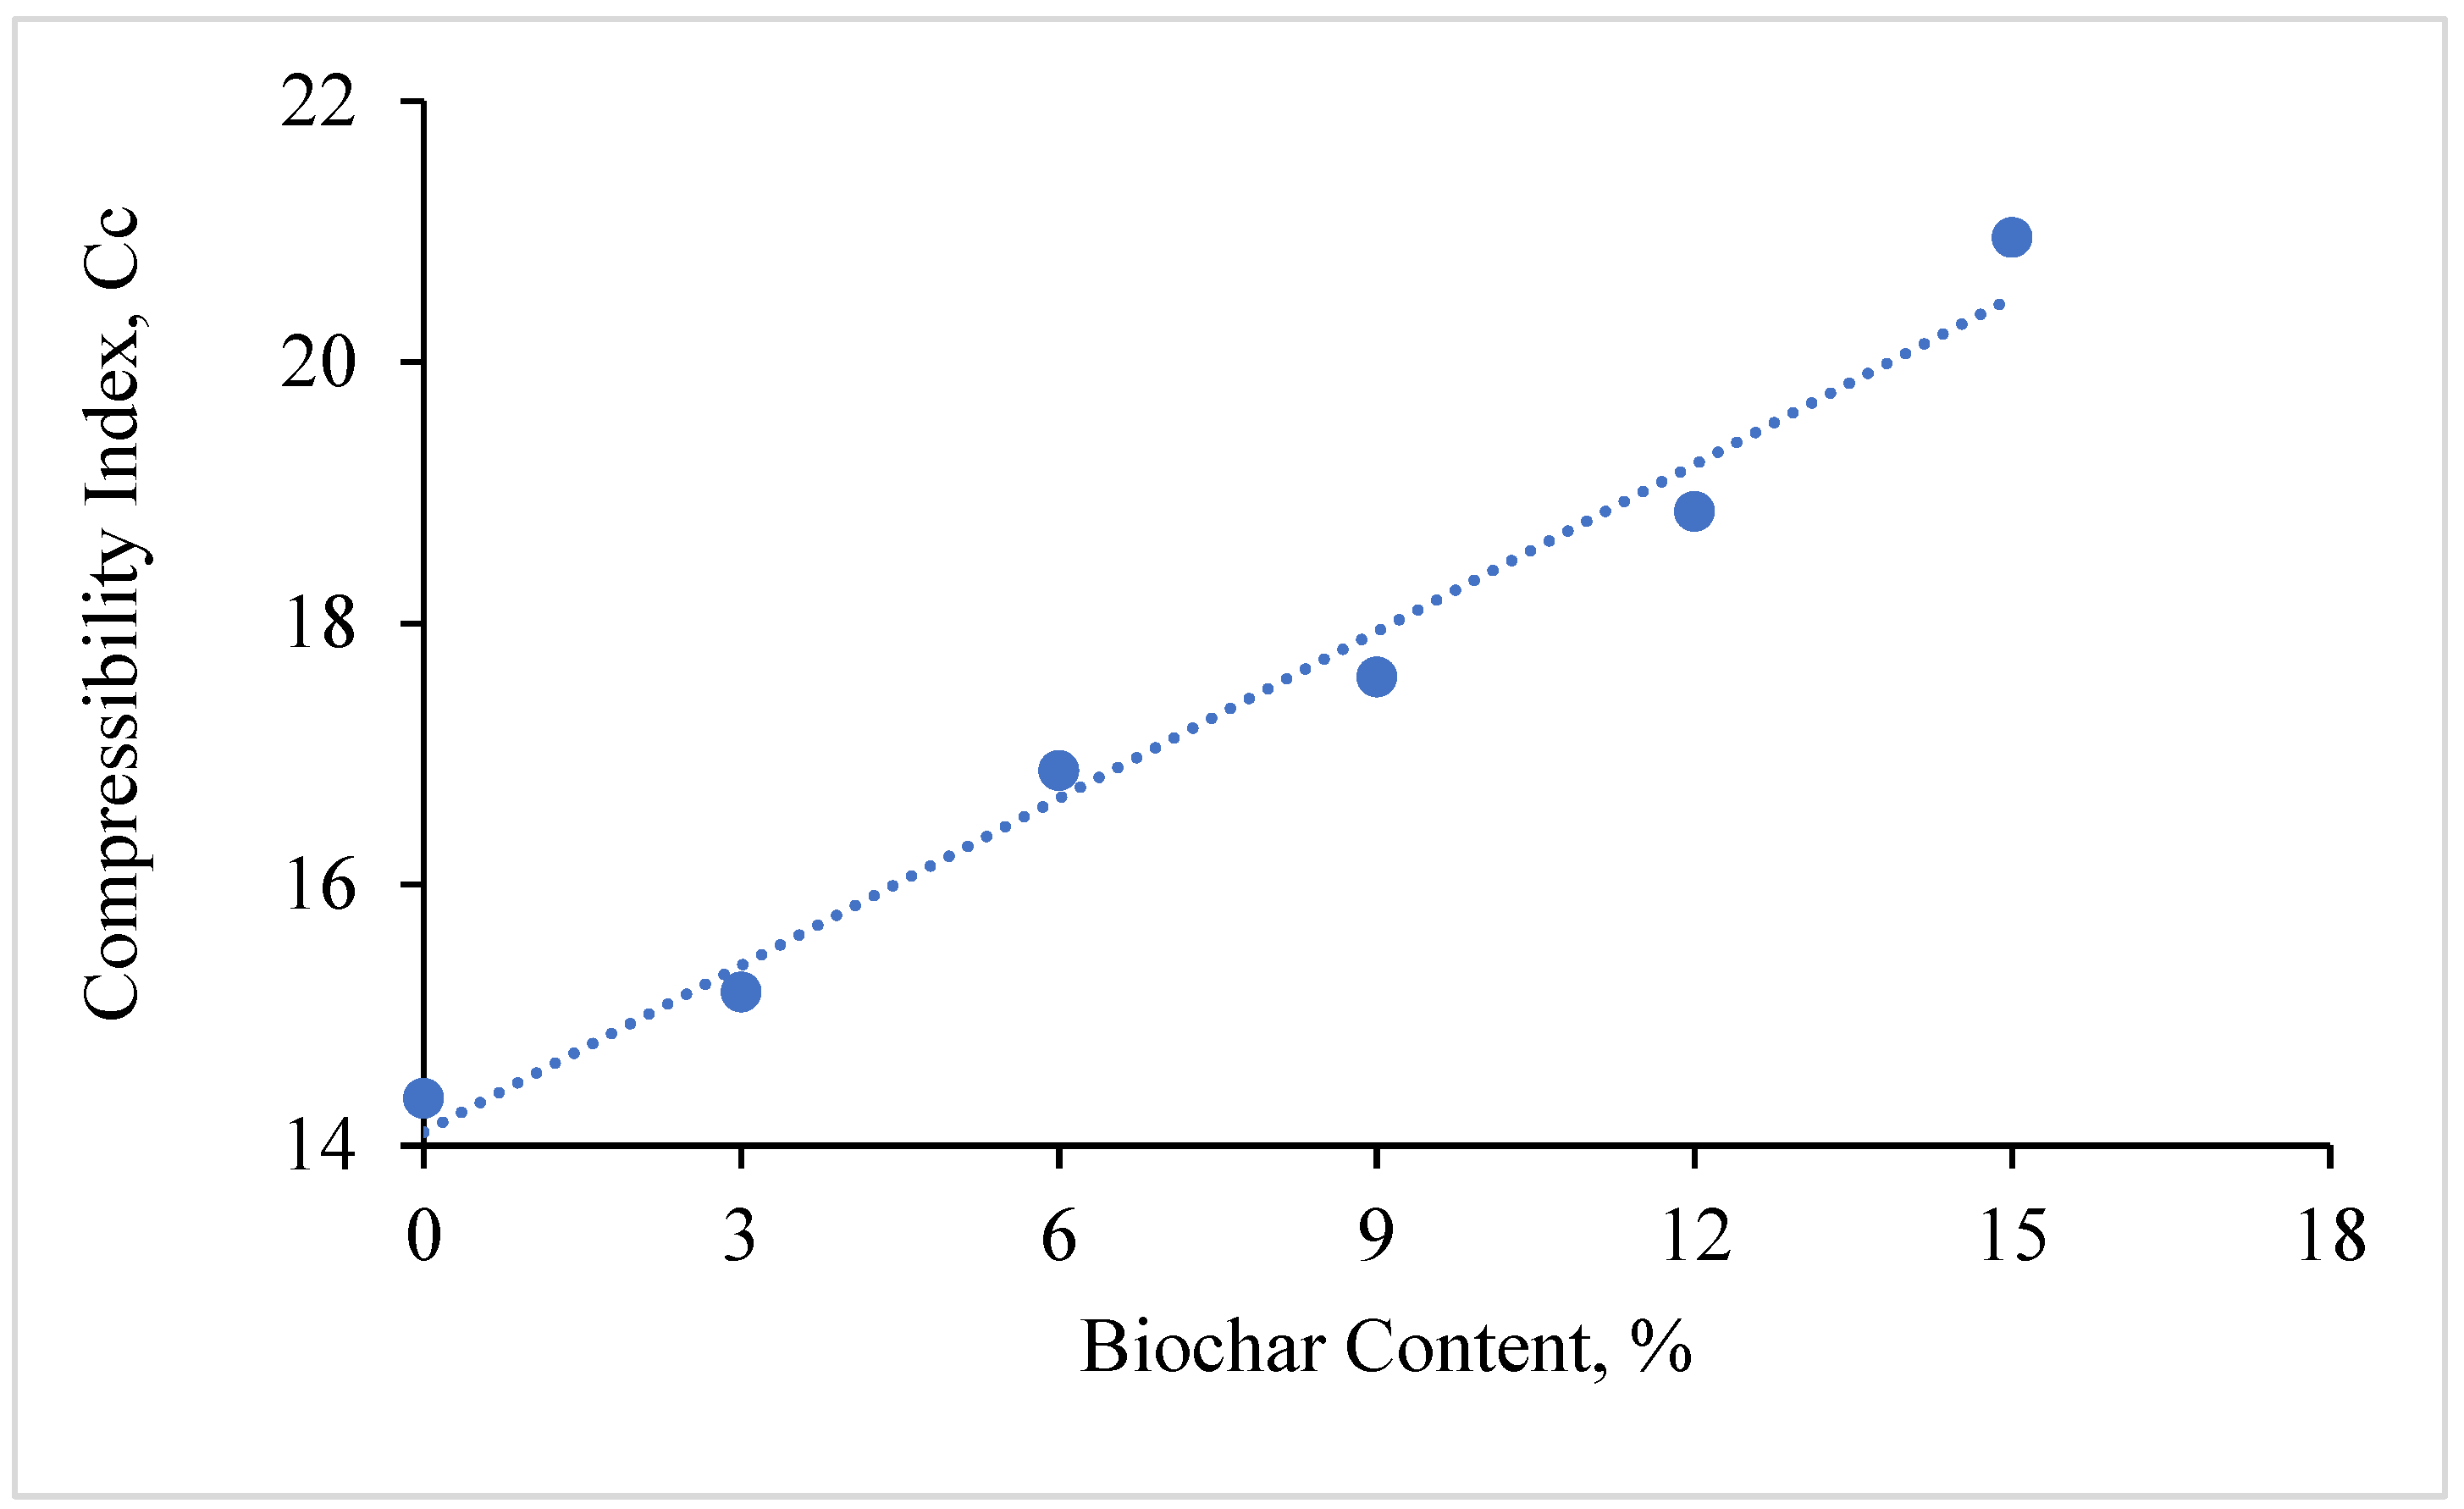
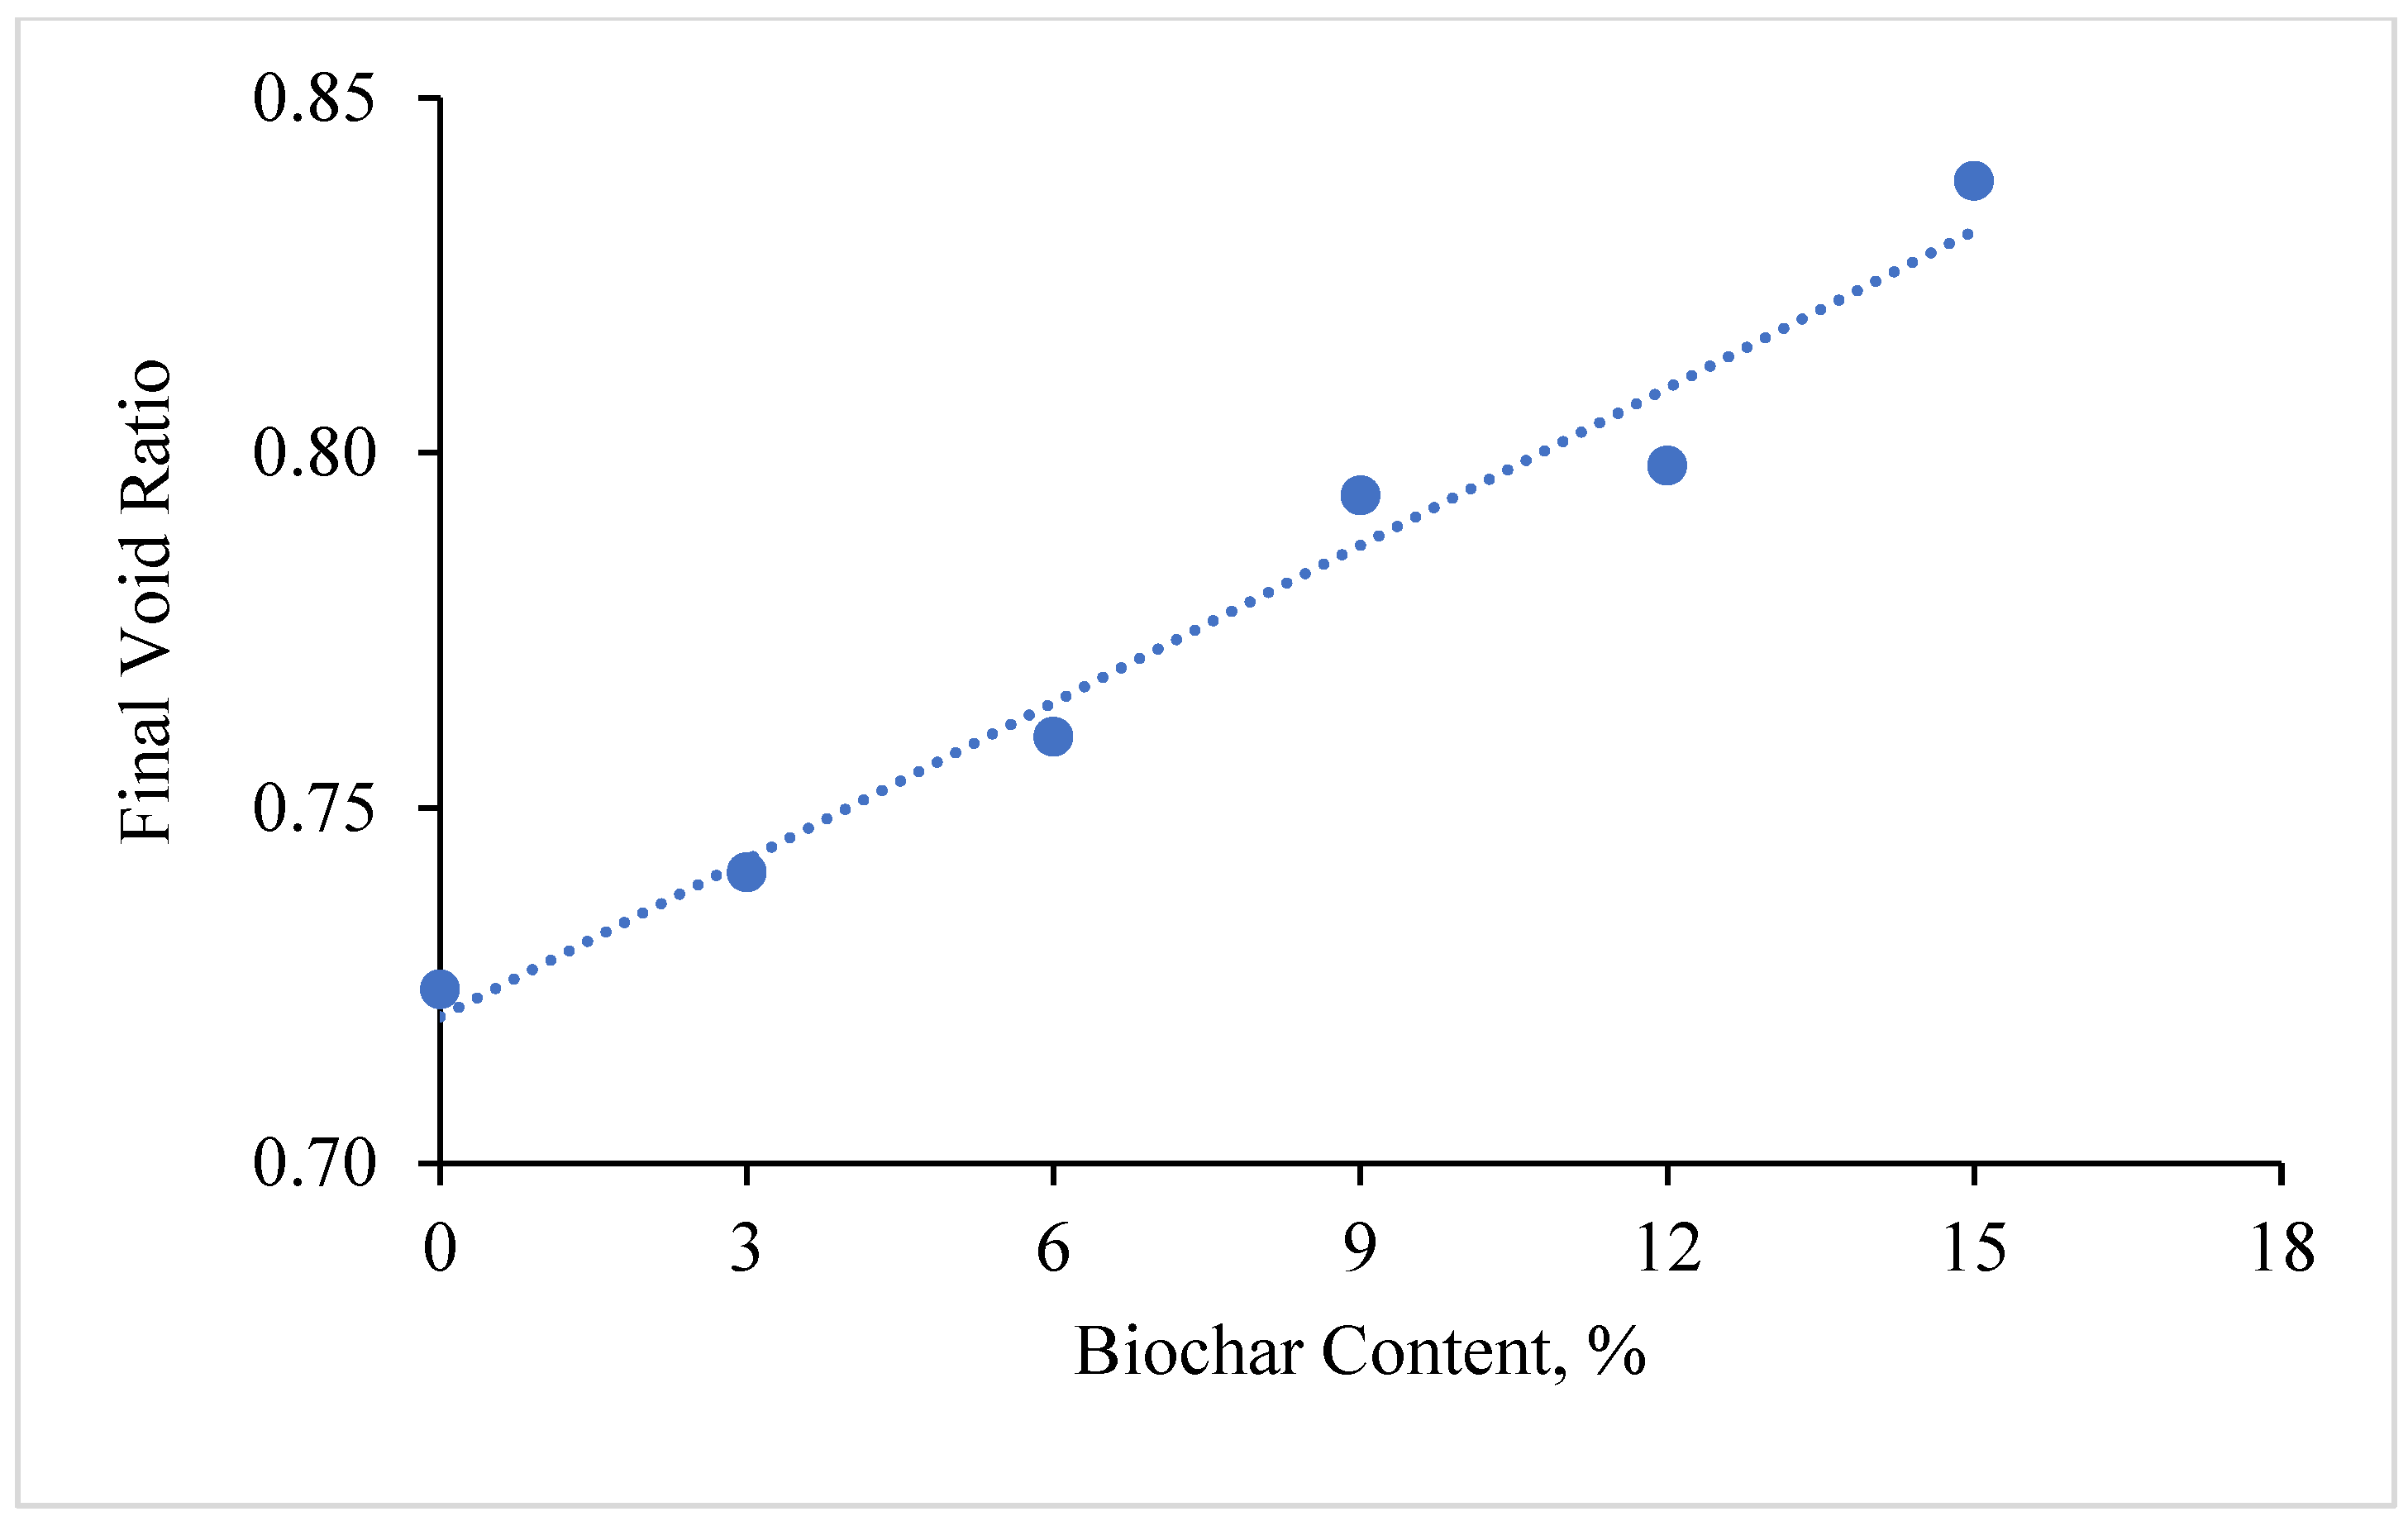
The test results indicate a clear trend of increasing compressibility with higher biochar content. The compression index (Cc) for unamended soil was approximately 14.4, whereas it increased to approximately 21.1 for soil containing 15% biochar by volume (see
Figure 5). Additionally, the final void ratio exhibited a corresponding increase with higher biochar content (
Figure 6). This behavior is attributed to the porous and high-surface-area structure of biochar, which introduces additional voids within the soil matrix by trapping air and water, thereby enhancing the soil’s overall compressibility.
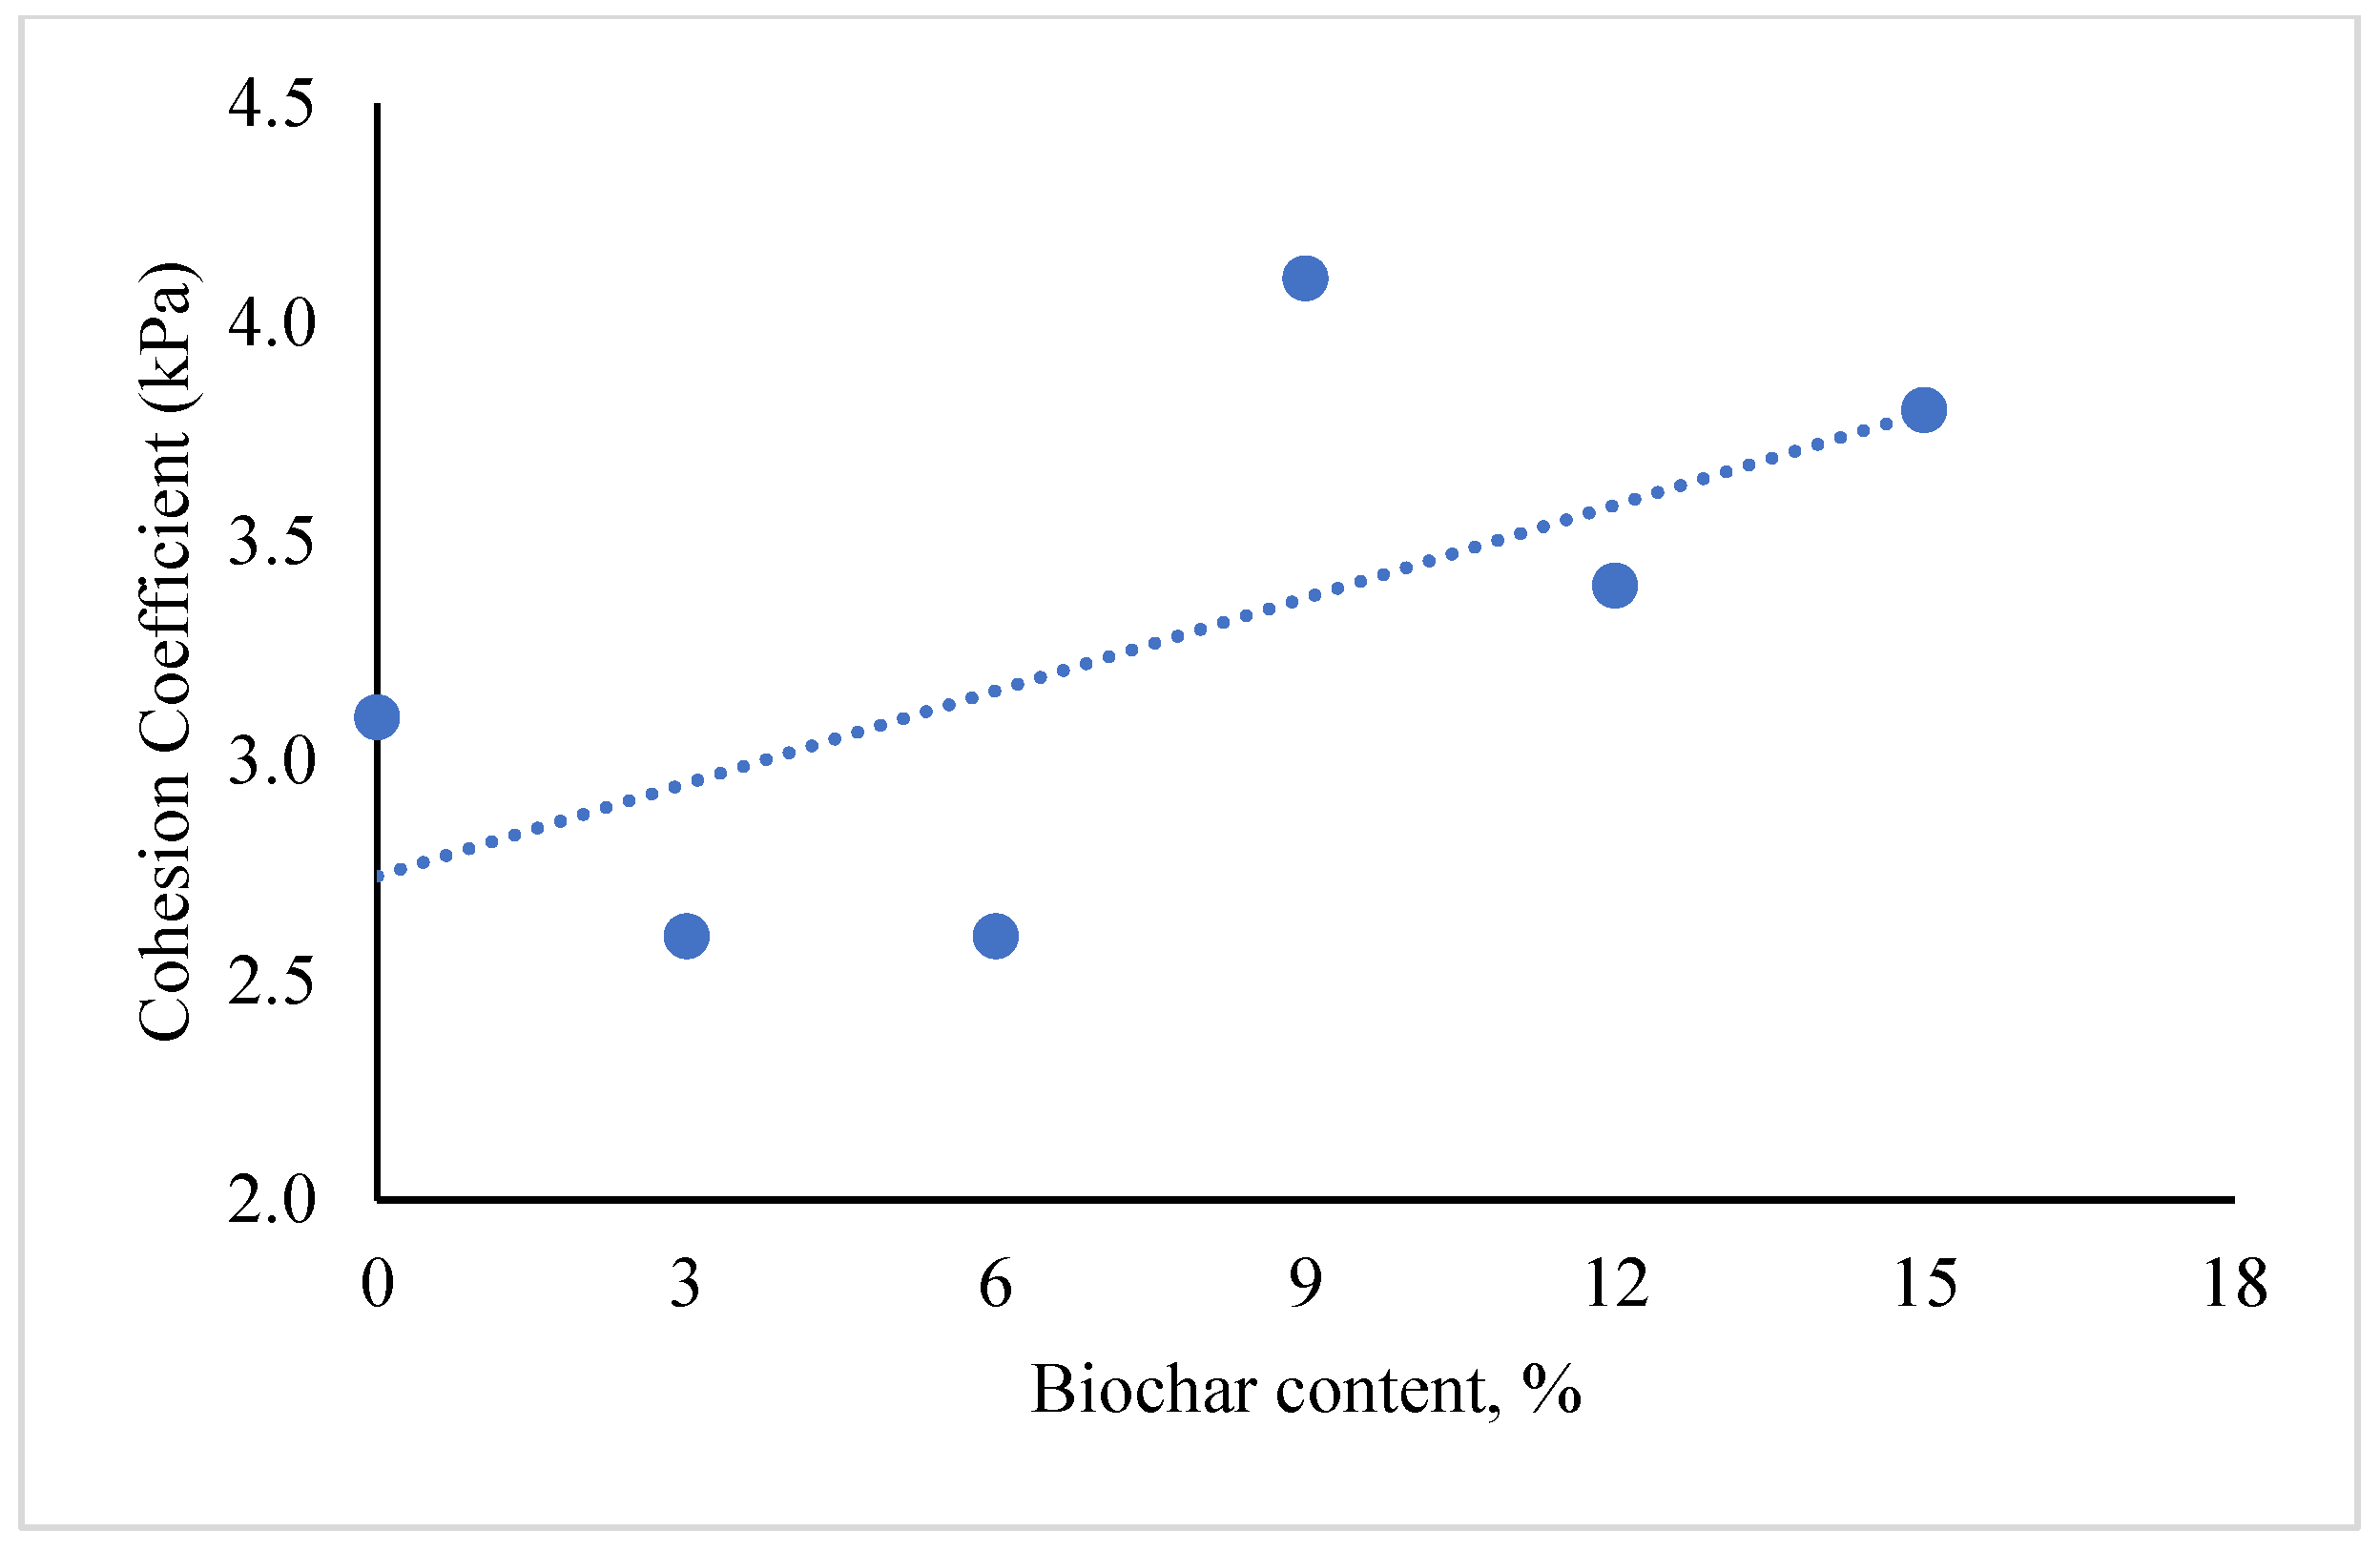
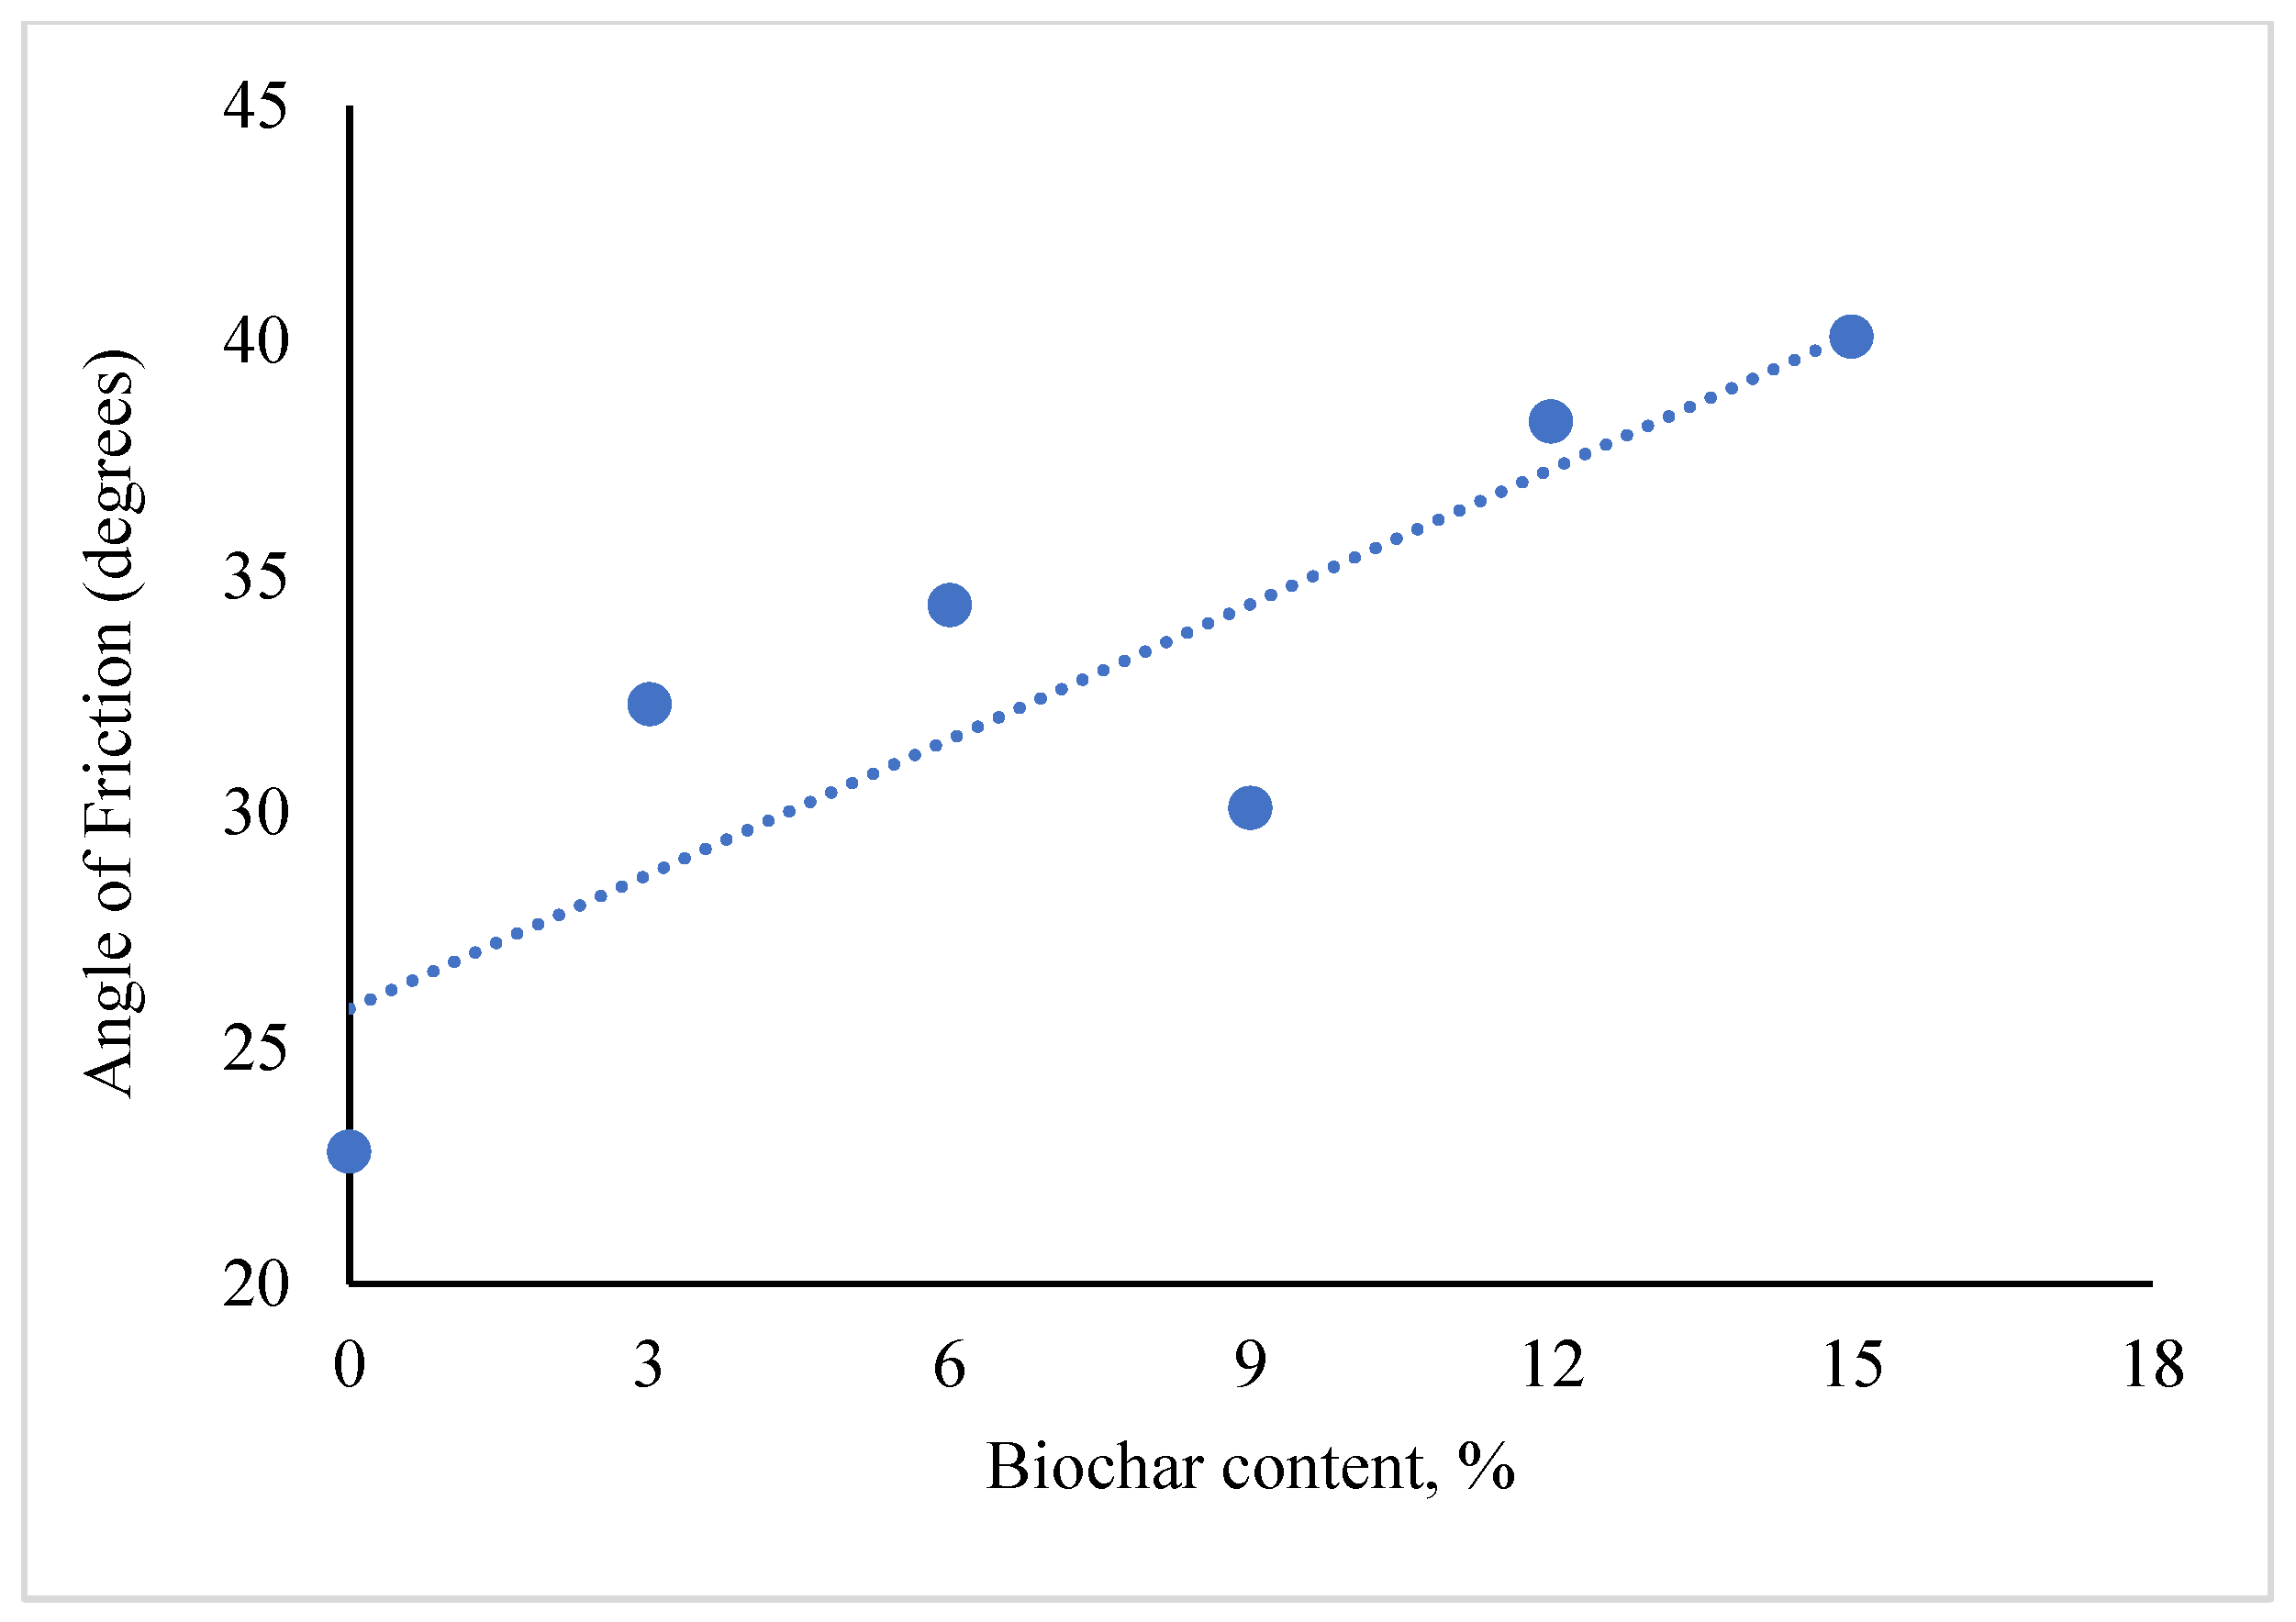
3.3.3. Direct Shear Test
ASTM D3080/D3080M-23 [
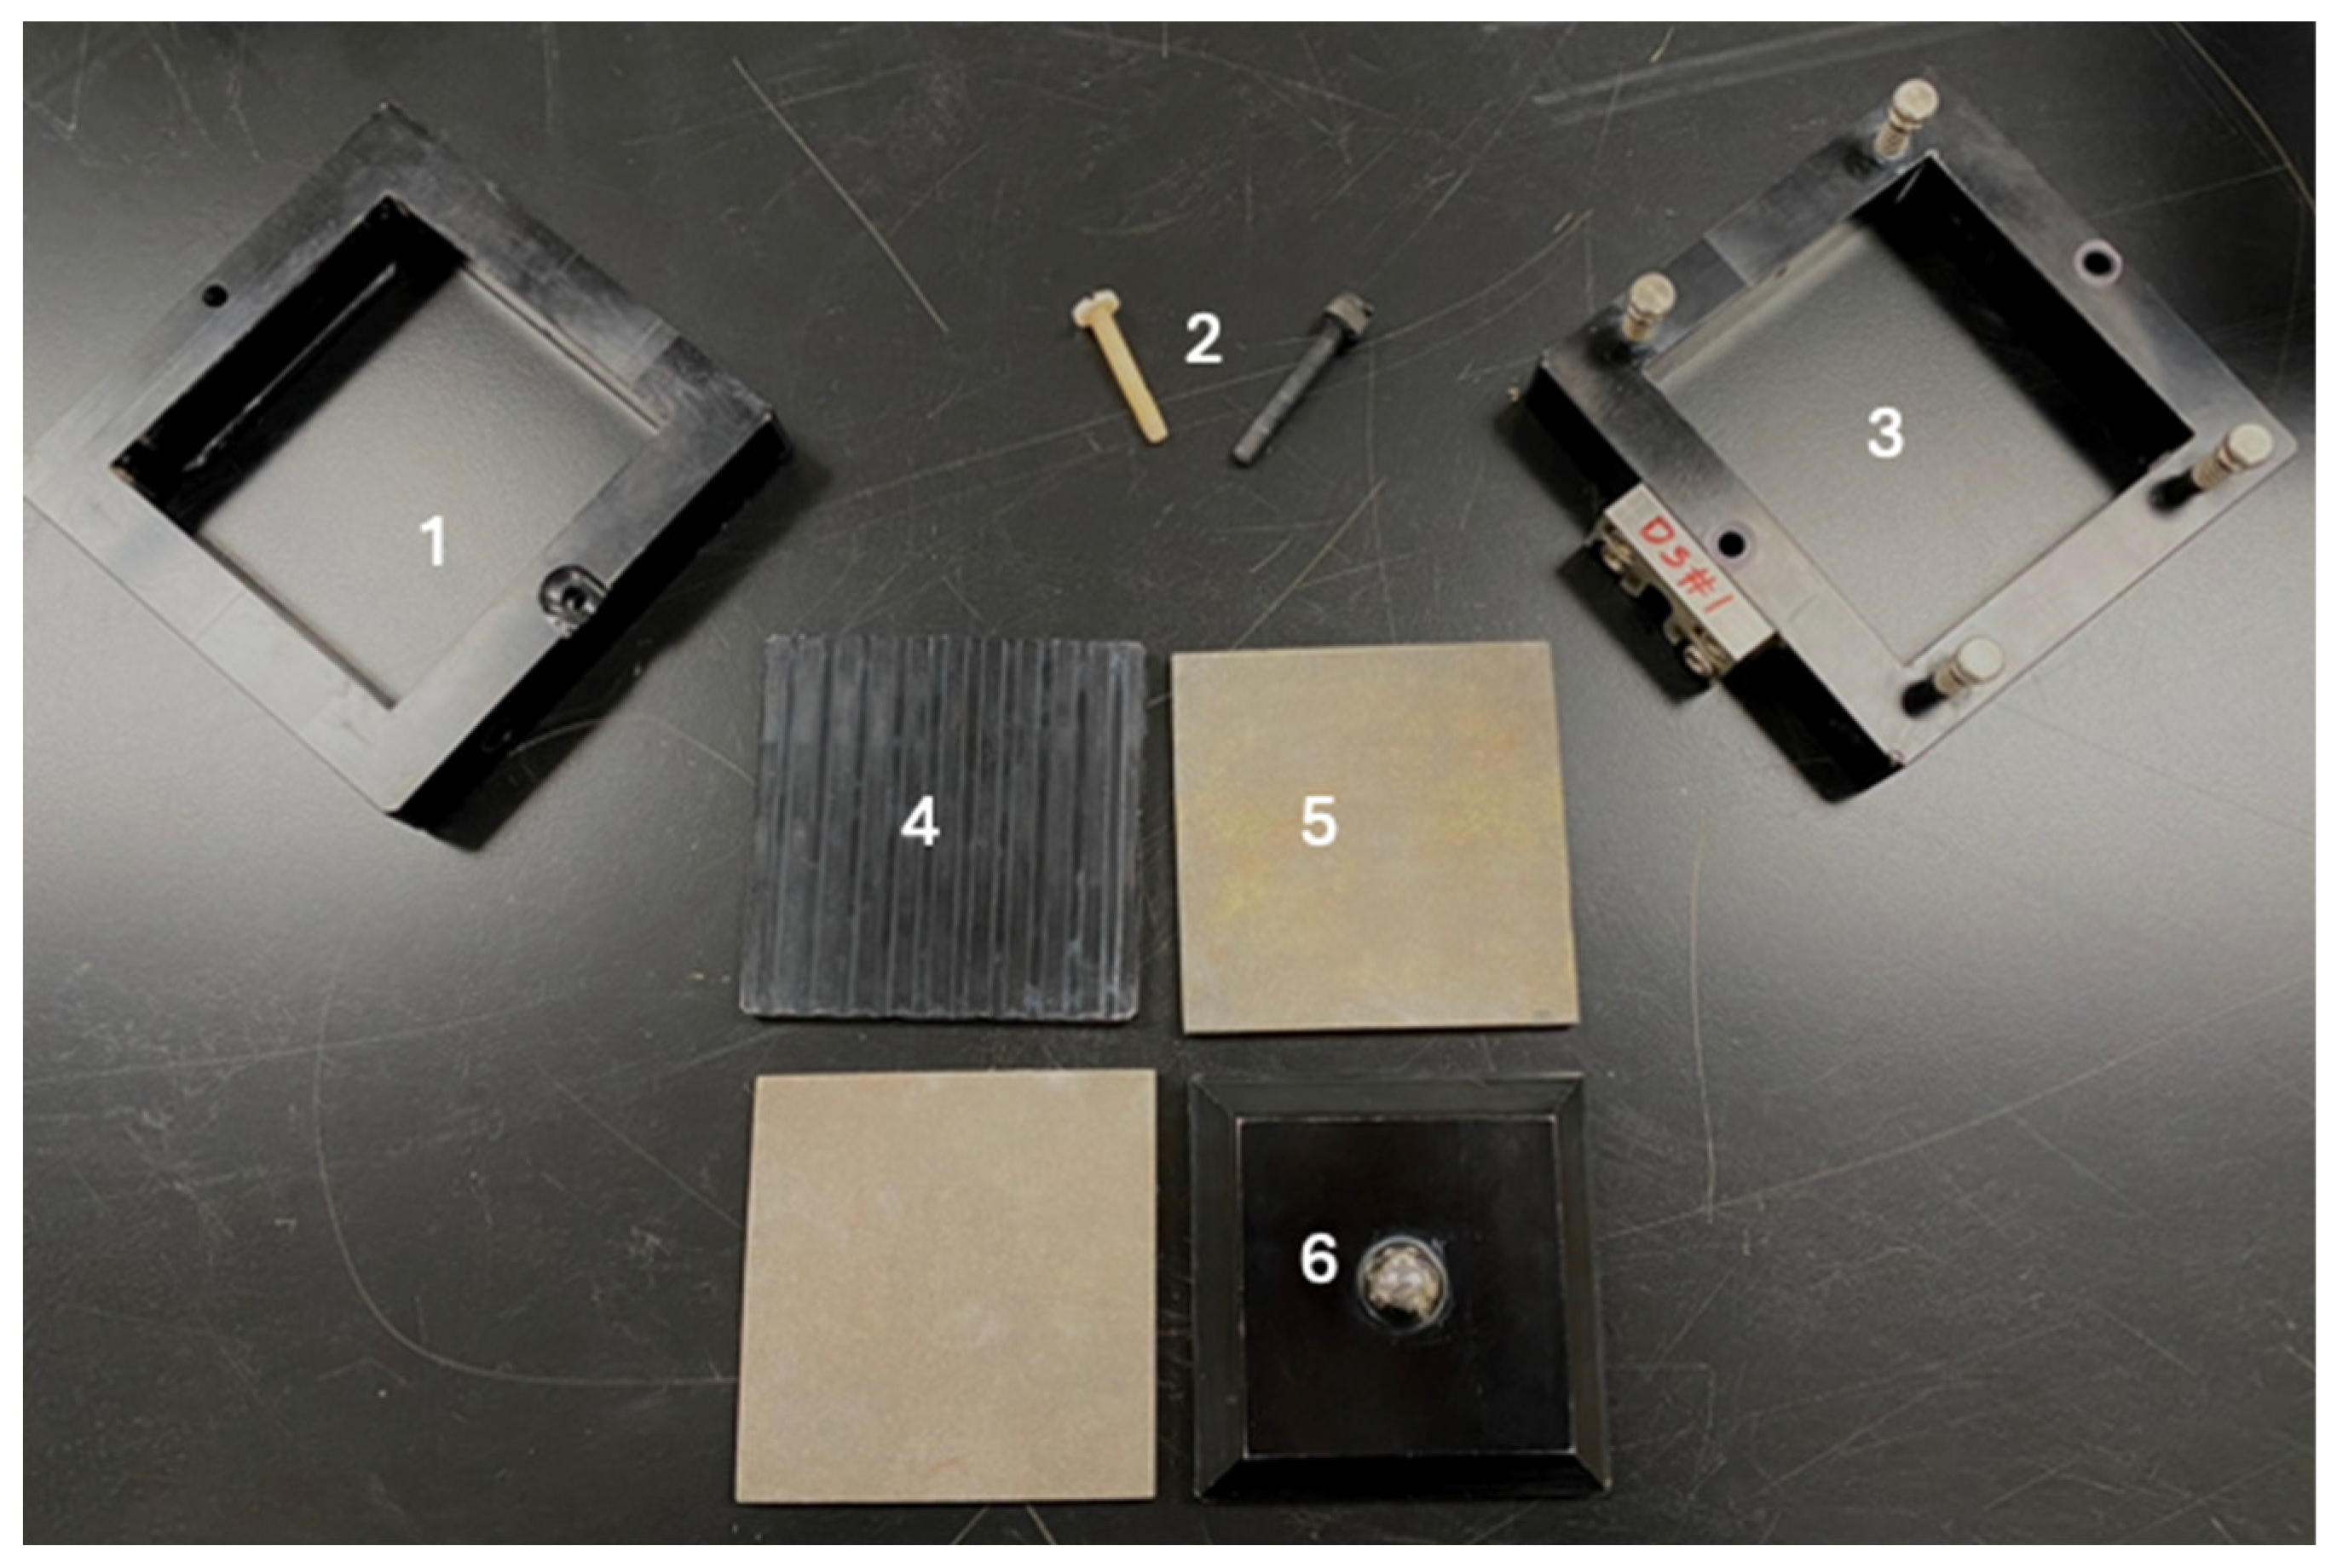
34] procedures were used to determine the drained shear strength parameters of the soil and biochar amended samples (i.e., cohesion coefficient, c’ & angle of internal friction, ϕ’ ). This was done to determine how the shear strength of the clay soil changed when different percentages of biochar amendment were used. The pieces for the direct shear box assembly, the upper (1) and lower (3) portions of the box, the set screws (2), the base plate (4), the porous stones (5), and the loading cap (6) are shown in
Figure 7.
The Mohr-Coulomb (M-C) criterion was used to determine the shear strengths of the 0%, 6%, 9%, 12%, and 15% samples. The shear strength is calculated using the equation:
, where the shear strength (
τ) is expressed as a function of the cohesion coefficient from a drained test (
c’), the effective normal stress (
σn’), and the friction angle from a drained test (
ϕ’). The results obtained for shear strength parameters and the shear strength specimens at the considered normal stress values are presented in
Table 3 (shear strength) and
Table 4, respectively.
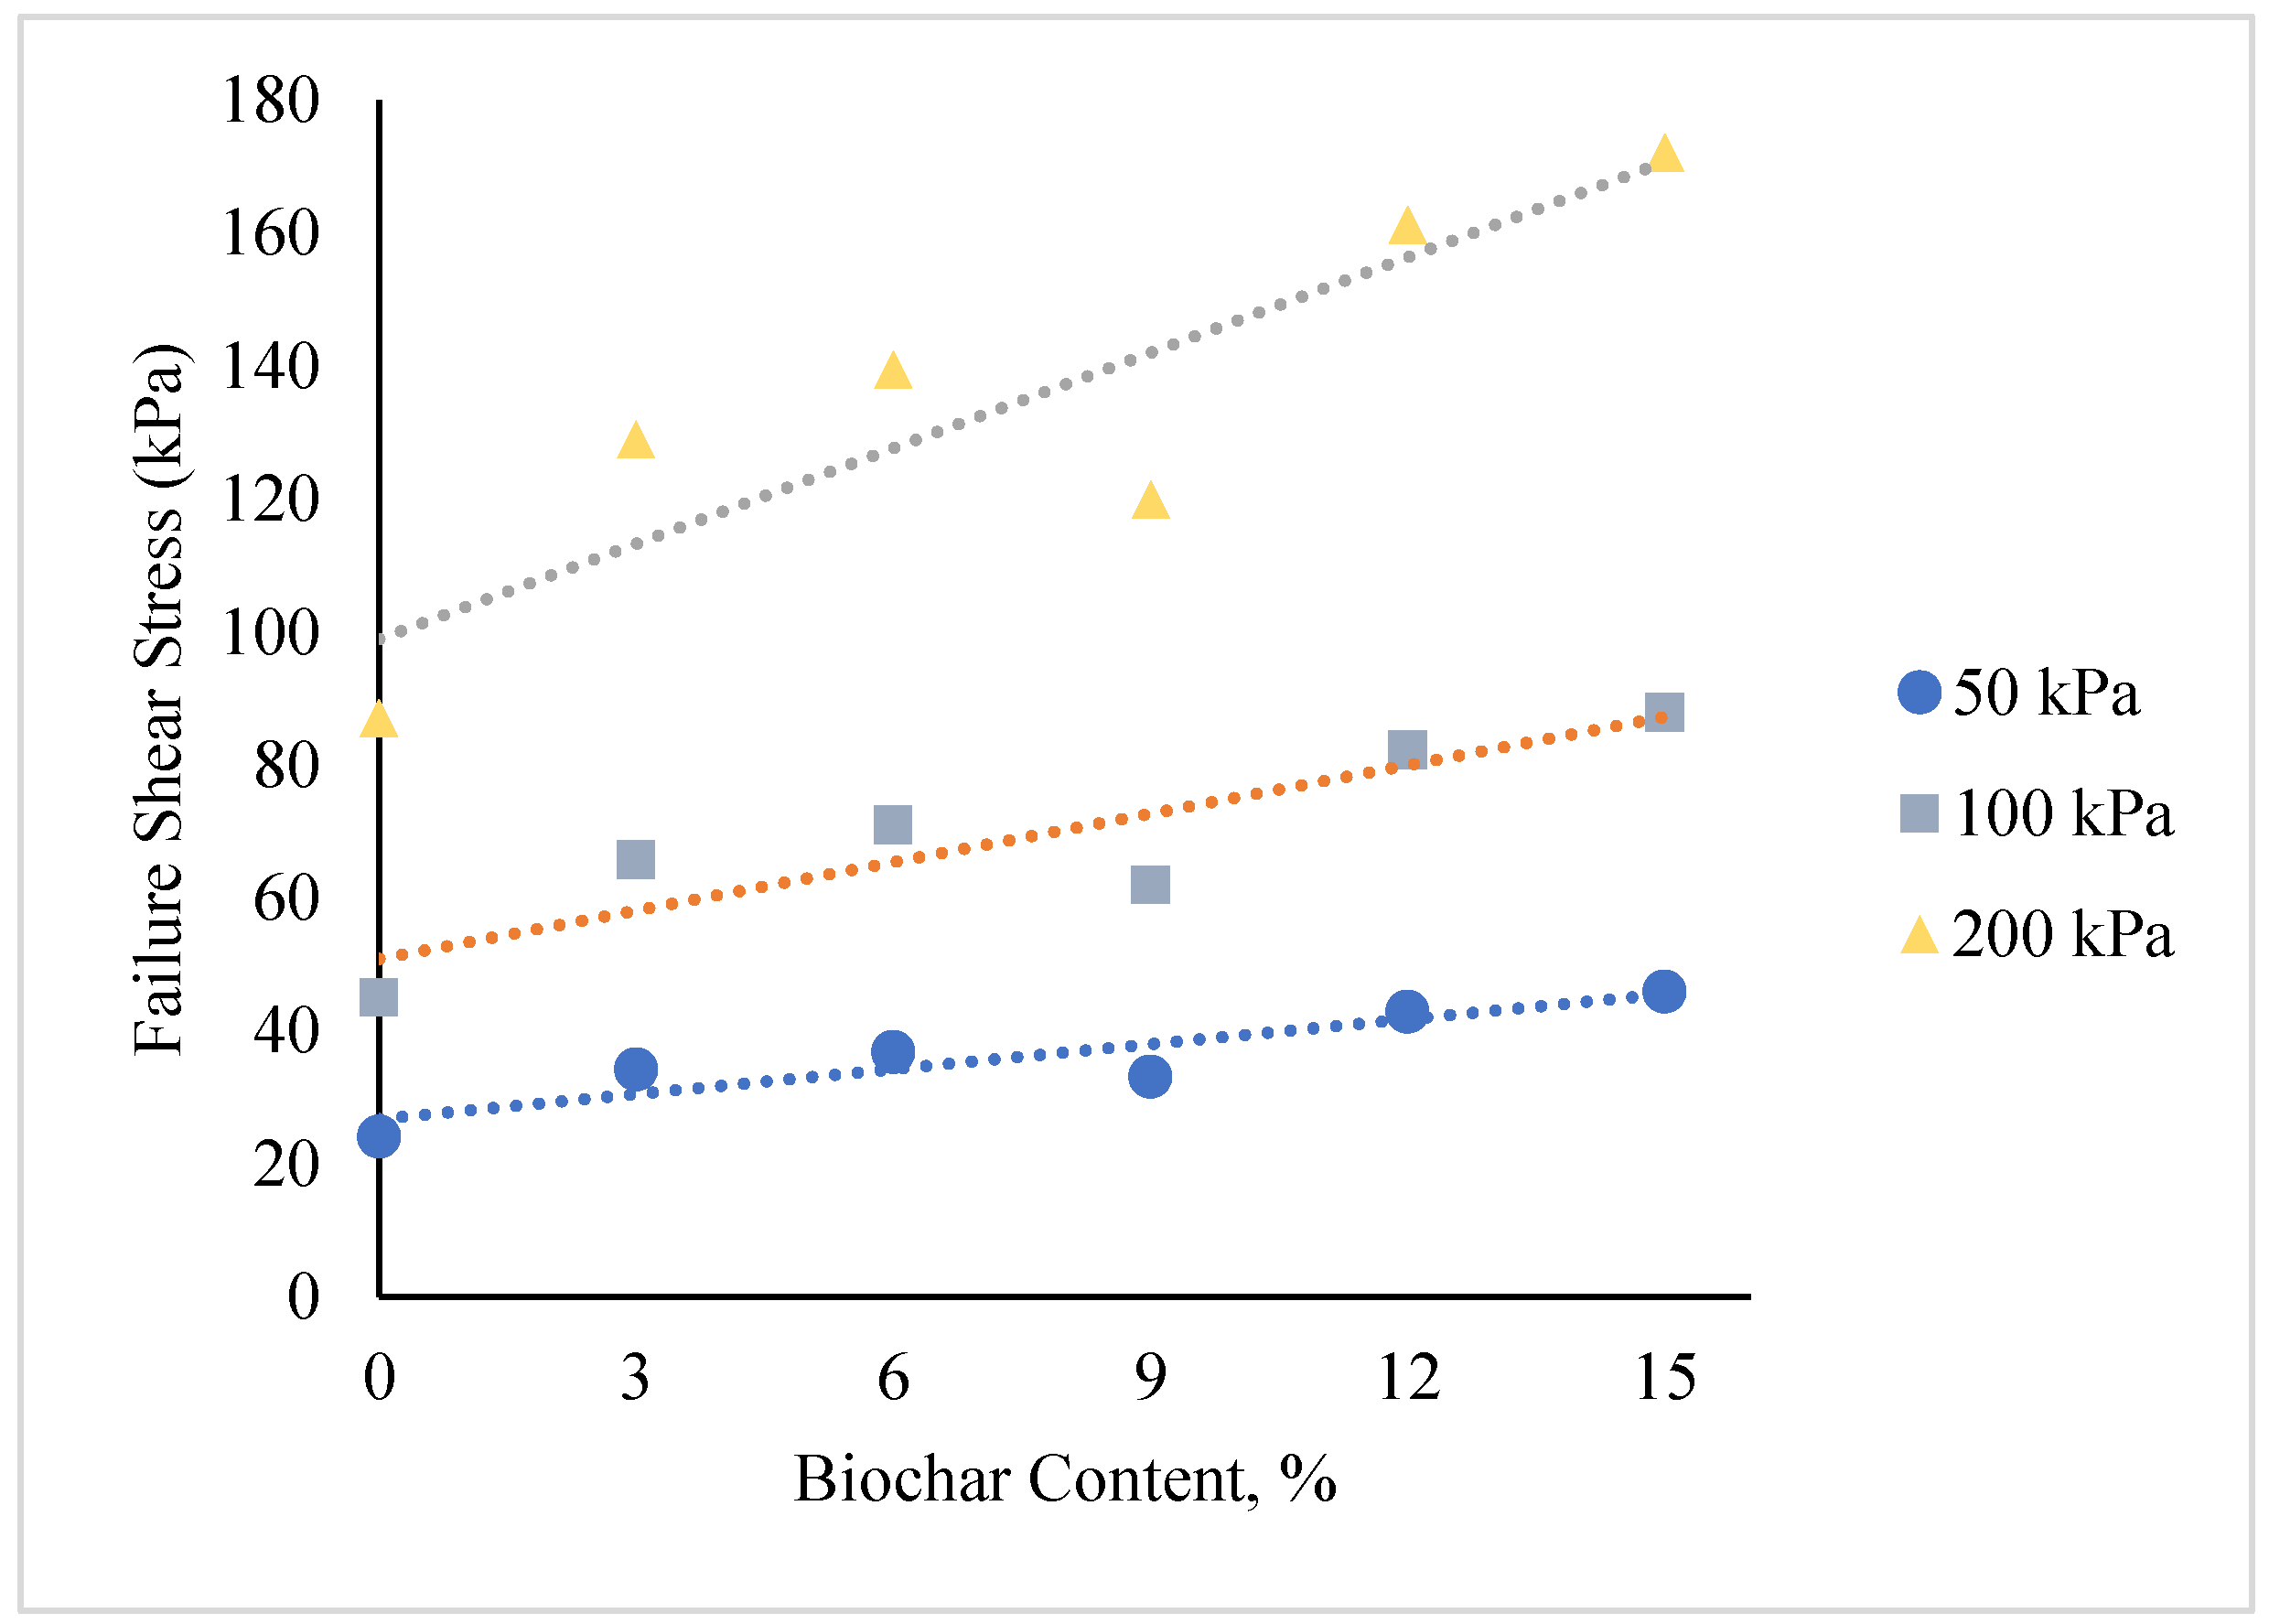
Direct shear test results show that as biochar content increased, the shear strength of the soil also increased. The results also indicated that overall, the soil showed an increasing trend with both the cohesion coefficient and angle of friction. These results can be seen graphically in
Figure 8,
Figure 9 and
Figure 10 below.
3.3.4. Unconfined Compression Test
To evaluate and compare the relative shear strength of natural clay and biochar-amended clay, unconfined compression (UC) tests were conducted in accordance with [
35]. While the UC test does not provide a complete representation of in-situ shear strength due to the absence of confining stress, it remains a rapid and cost-effective method for assessing relative strength characteristics among soil mixtures.
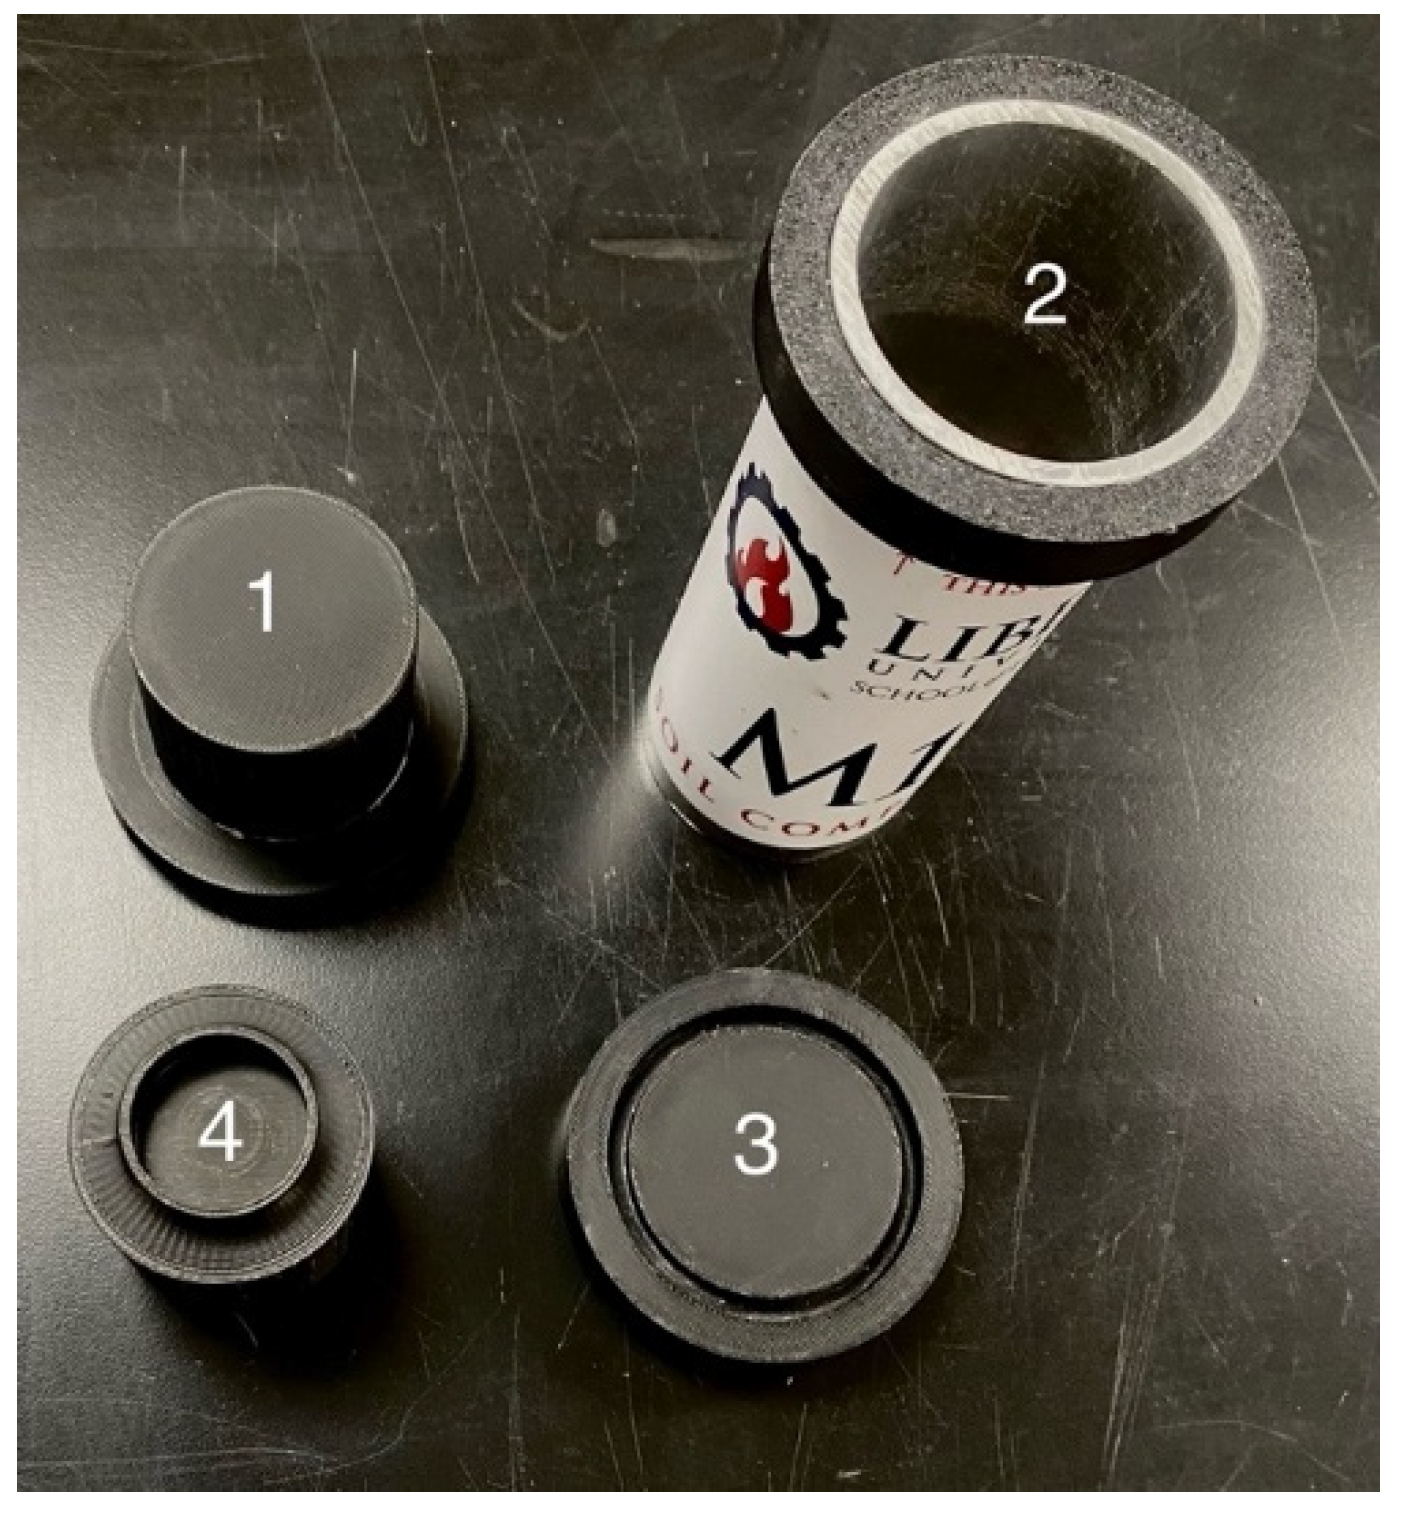
A control sample composed solely of clay was prepared at a target water content of 30%. A mass of 397.7 grams of the saturated clay was compacted into a cylindrical mold measuring 50 mm in diameter and 100 mm in height. The mold assembly is shown in
Figure 11, with components including: (1) Mold cap for compaction, (2) Cylindrical mold, (3) Base plate for compaction, and (5) Base plate for extraction.
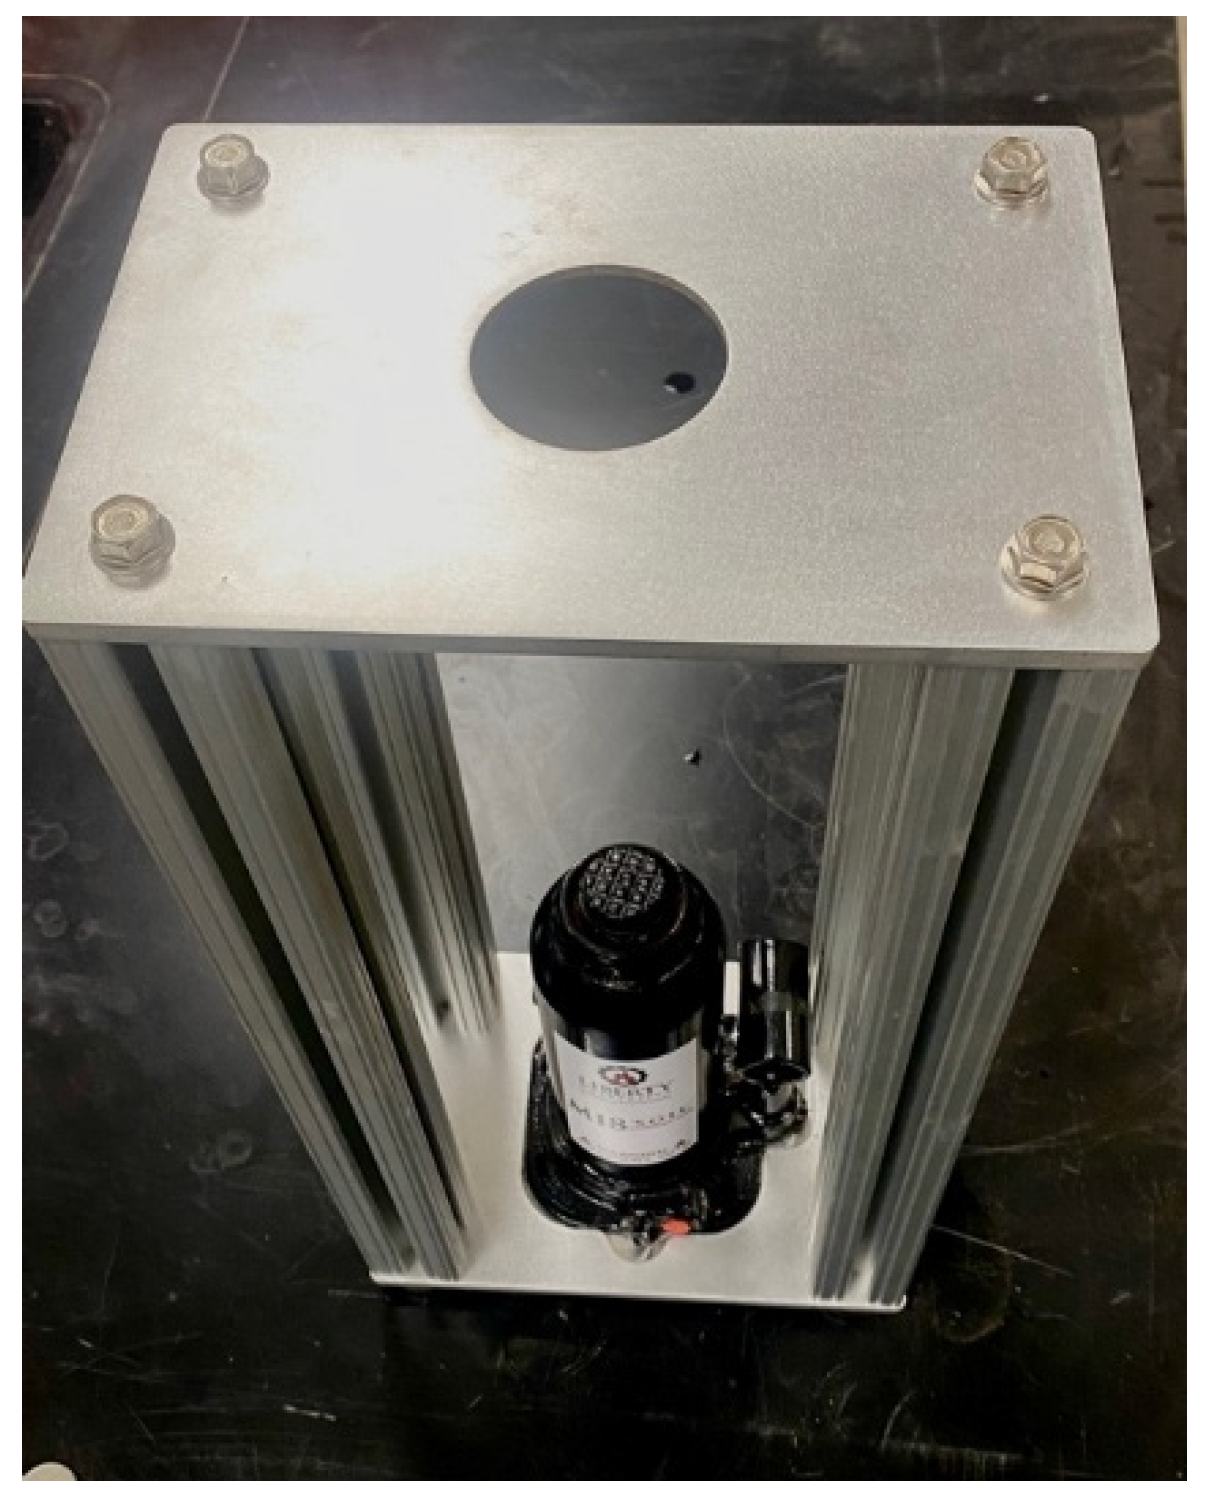
Compaction was performed using a mechanical jack and frame system (
Figure 12) to ensure consistency across all specimens. During compaction, the mold cap and base plate served as physical stops to maintain uniform specimen height. Upon achieving the desired density, the specimen was extracted using an alternate base plate designed for sample removal.
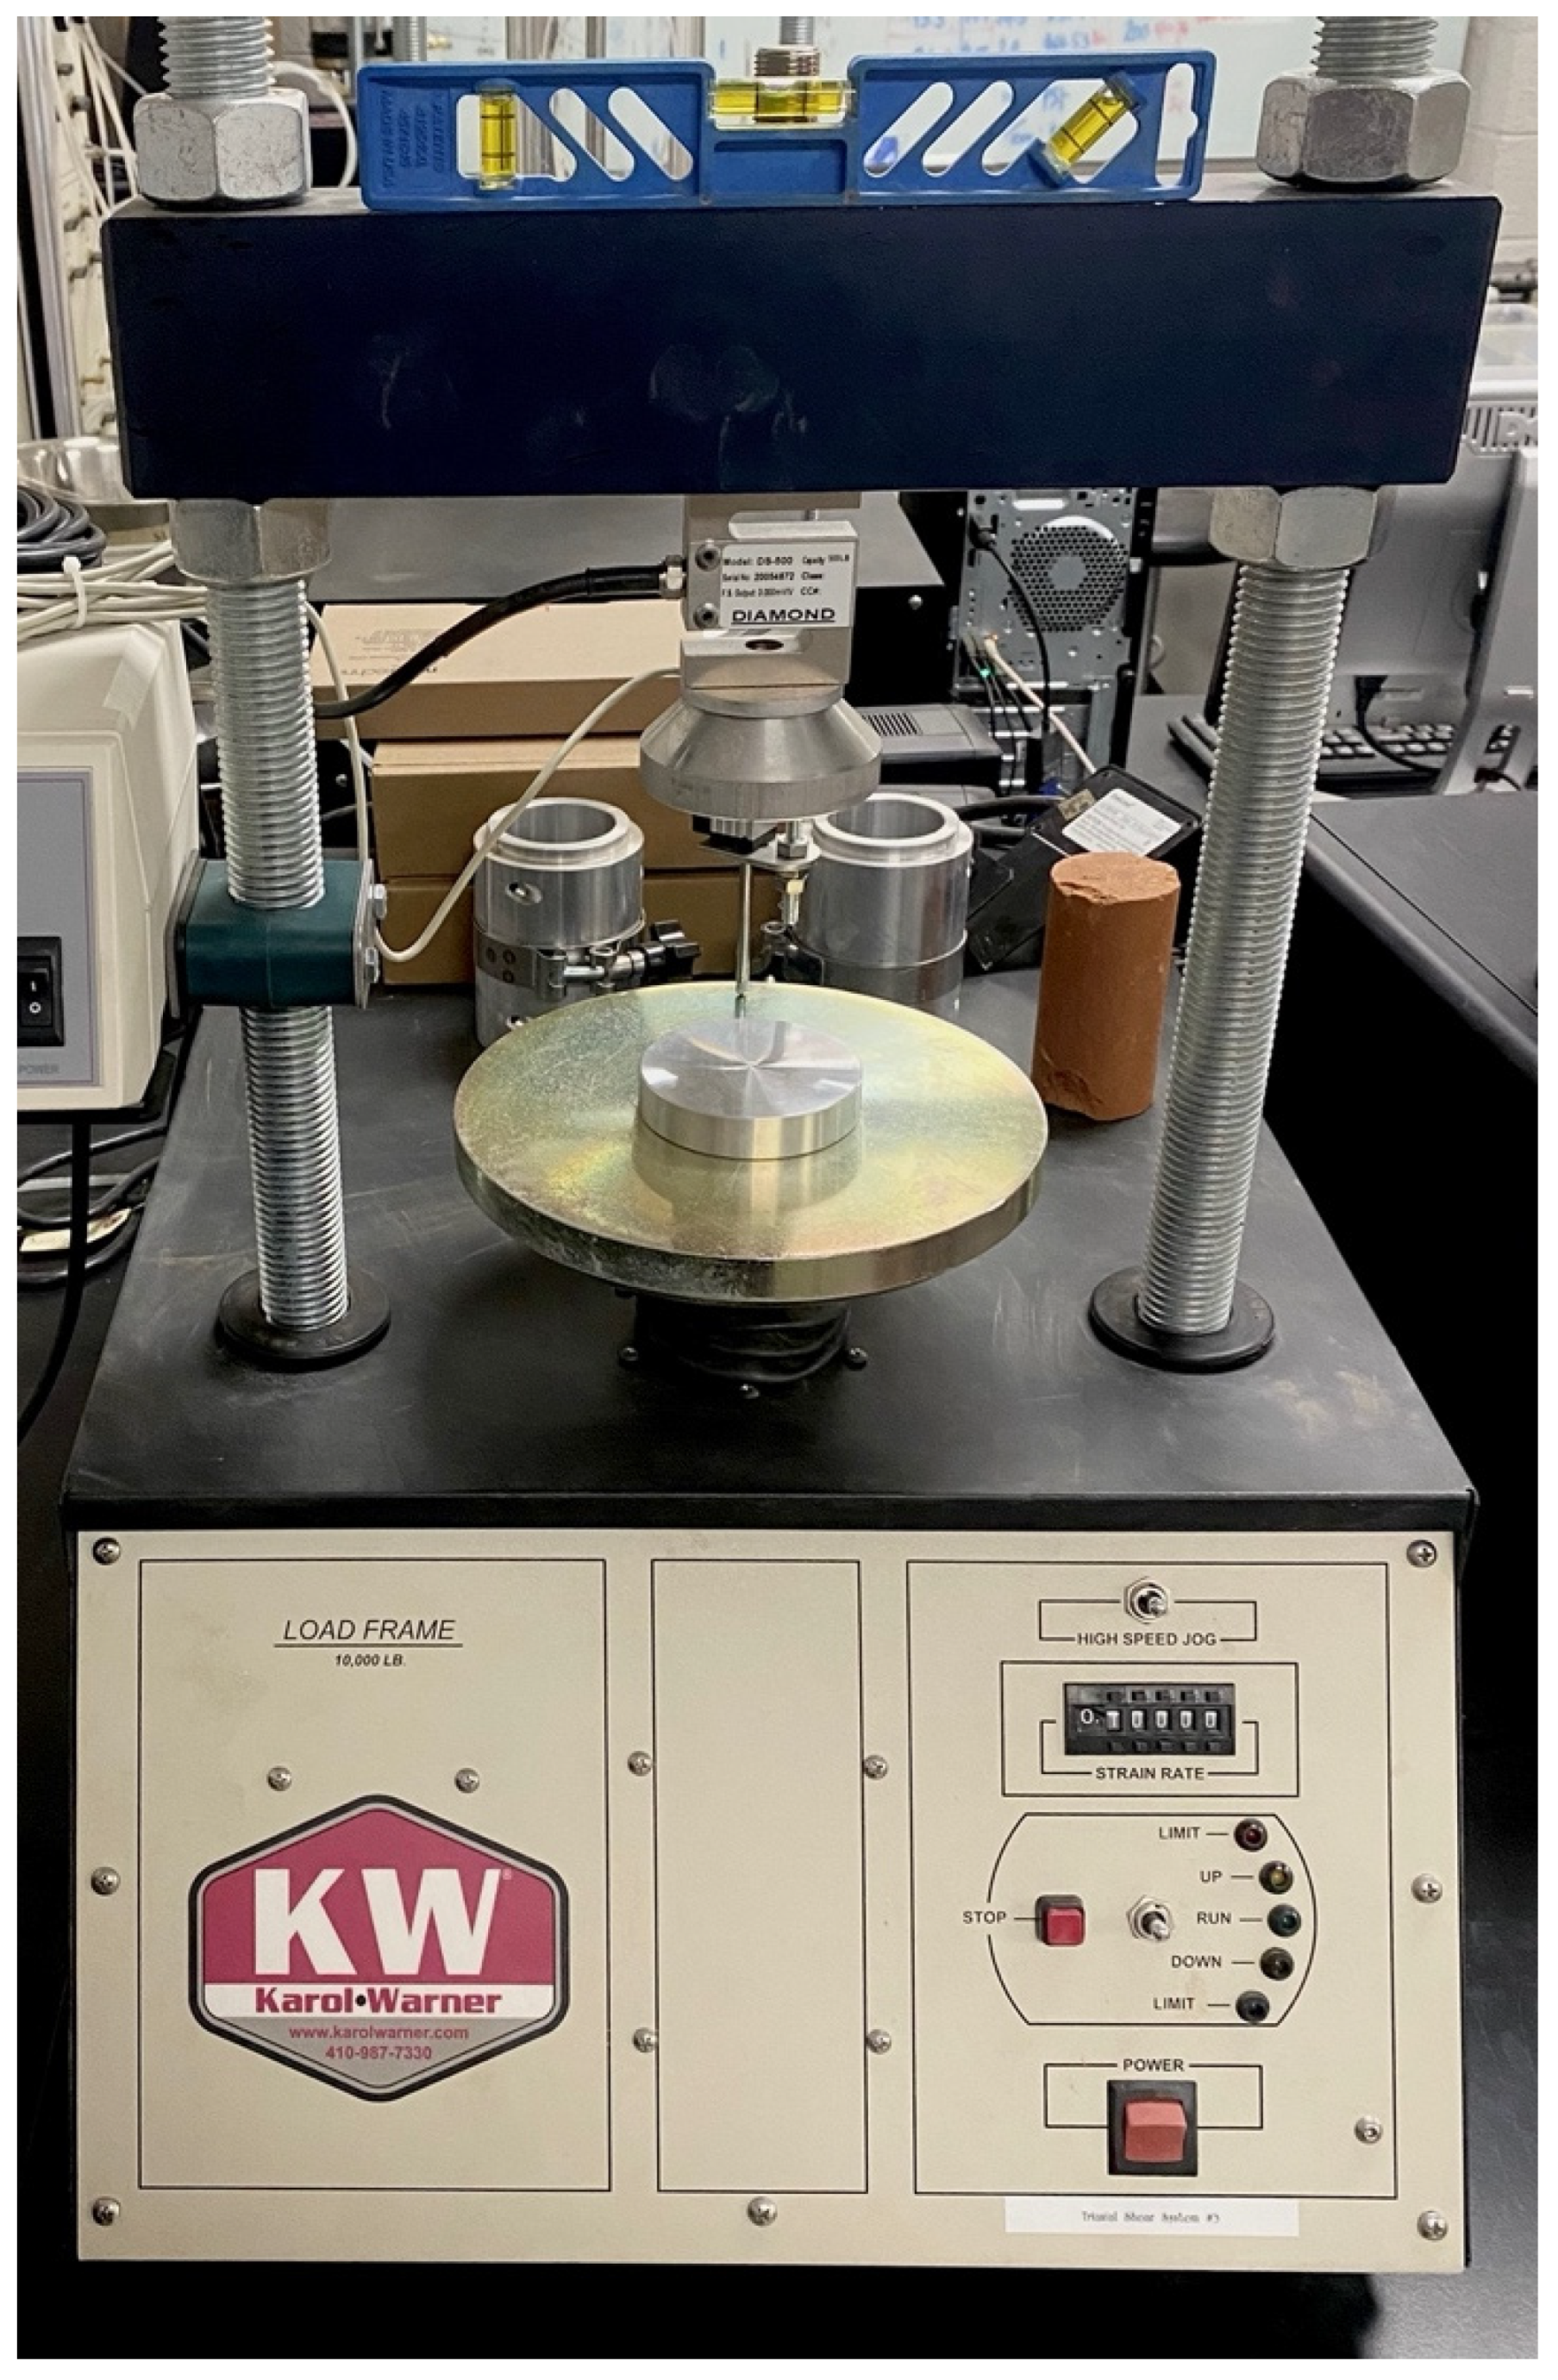
Each prepared sample was placed into the UC load frame (
Figure 13) and subjected to axial loading at a constant strain rate of 25.4 mm/min. The test was continued until a distinct post-peak drop in axial stress was observed, indicating failure. This procedure was repeated for specimens amended with 3%, 6%, 9%, 12%, and 15% biochar by volume.
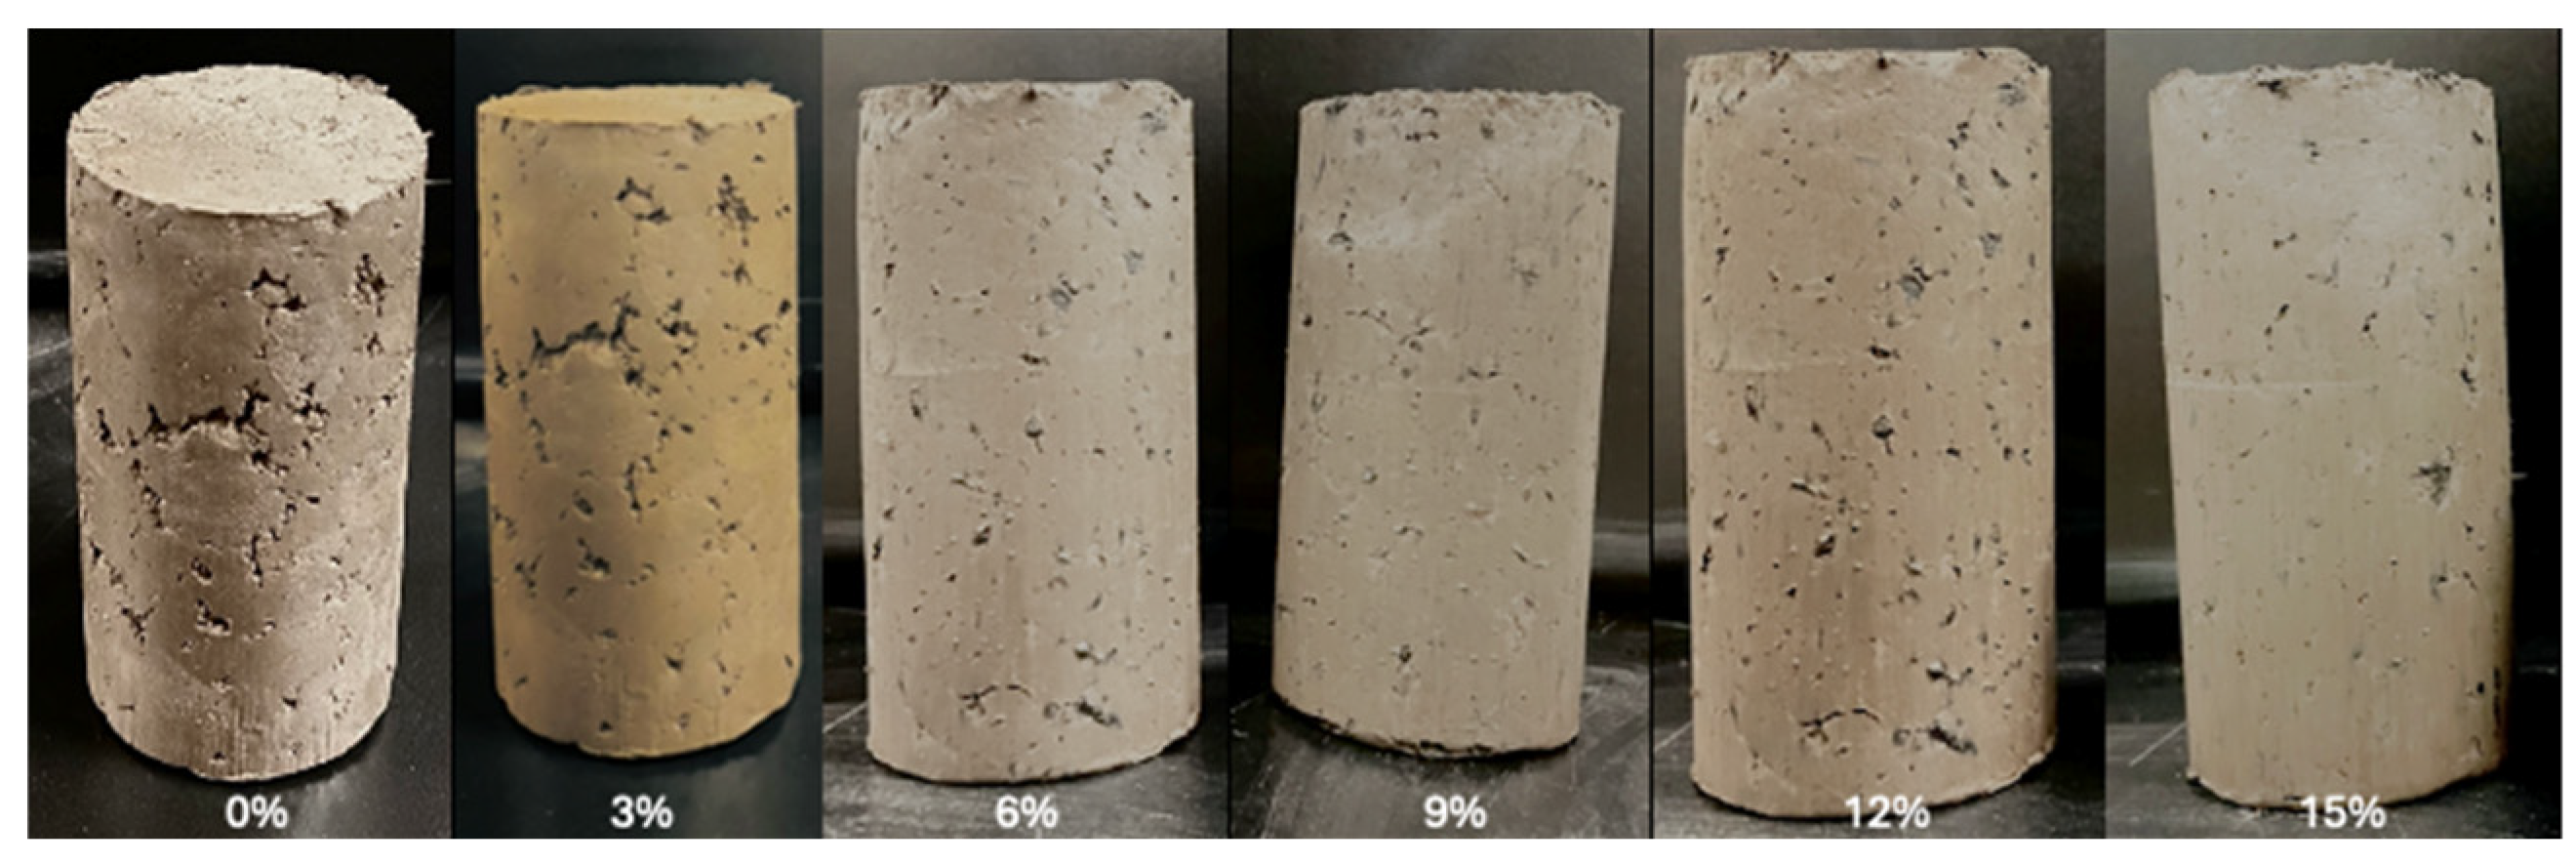
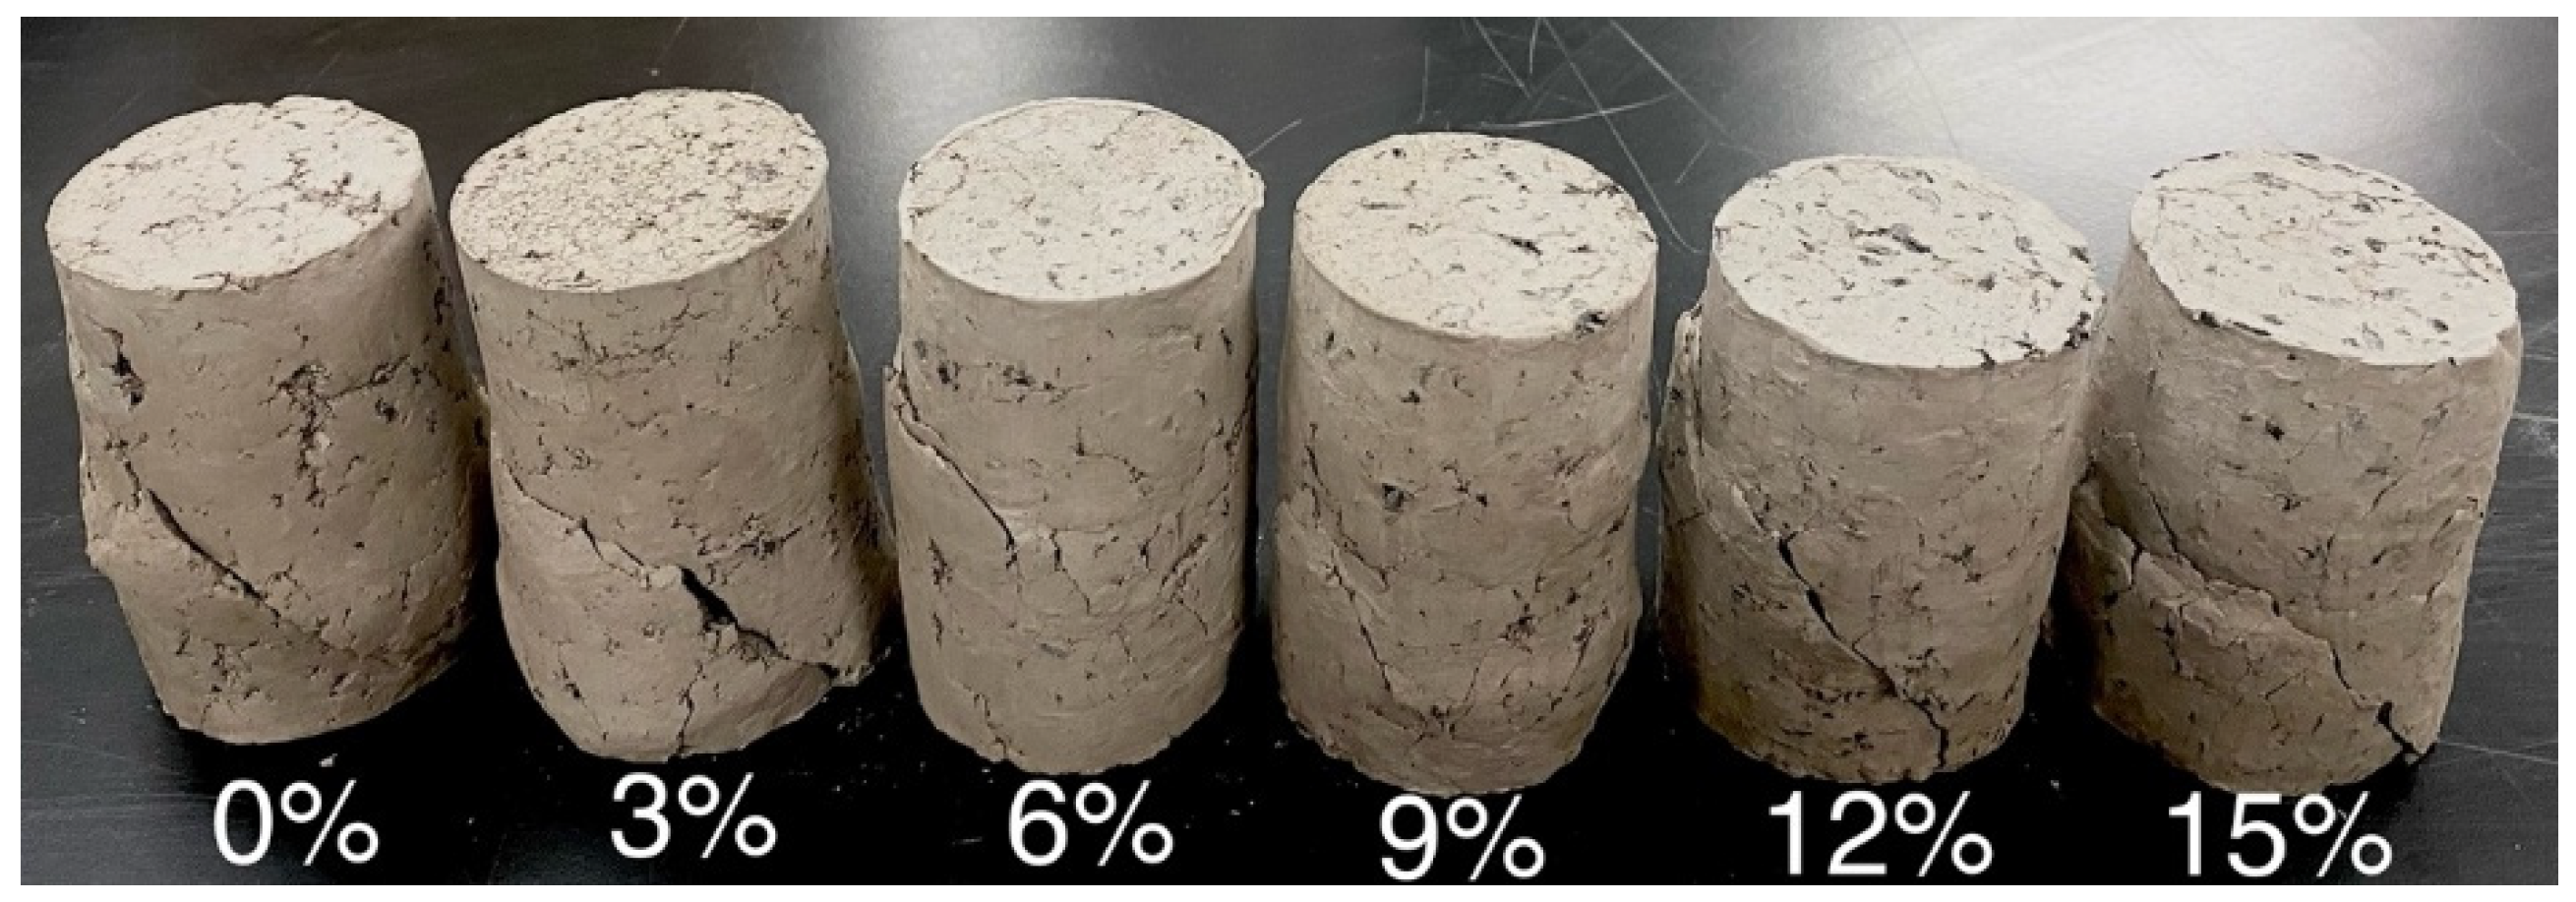
Figure 14 and
Figure 15 illustrate the appearance of representative clay–biochar specimens before and after testing, respectively. Post-test observations indicated that specimens with higher biochar content exhibited increased deformation prior to failure, suggesting enhanced ductility and strain capacity.
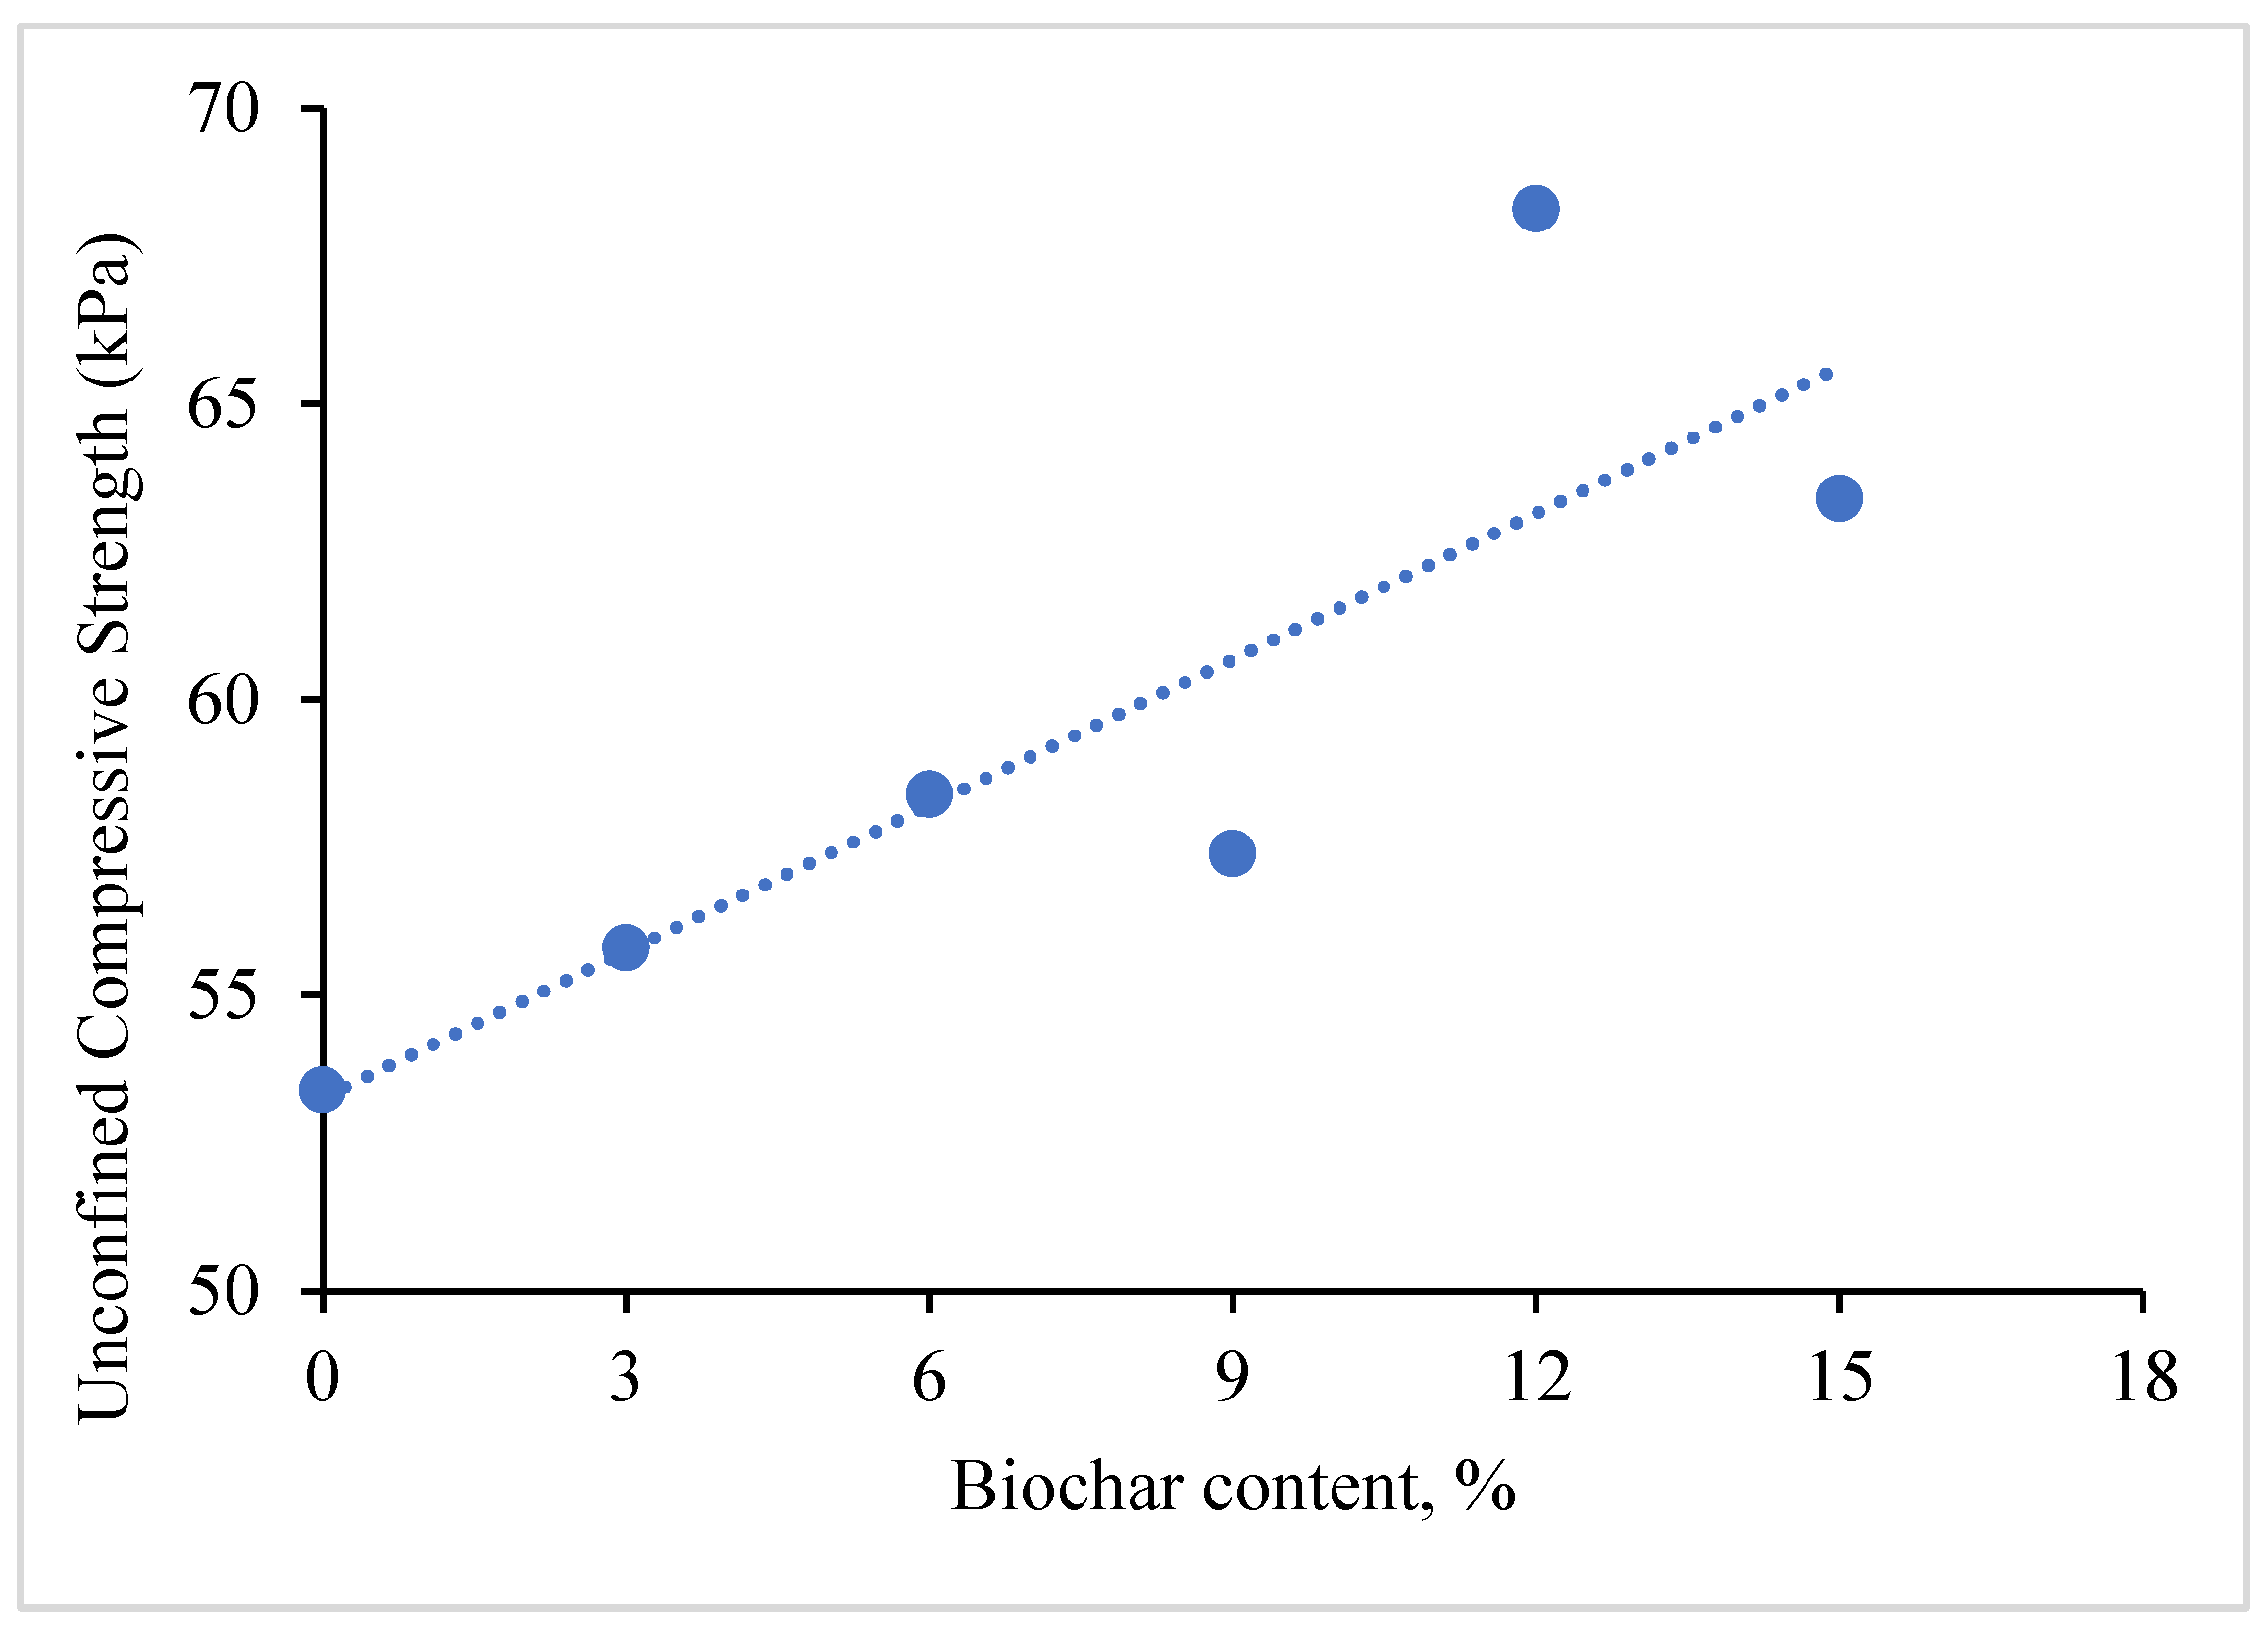
Table 5 summarizes the peak unconfined compressive strength and corresponding axial strain at failure for each mixture.
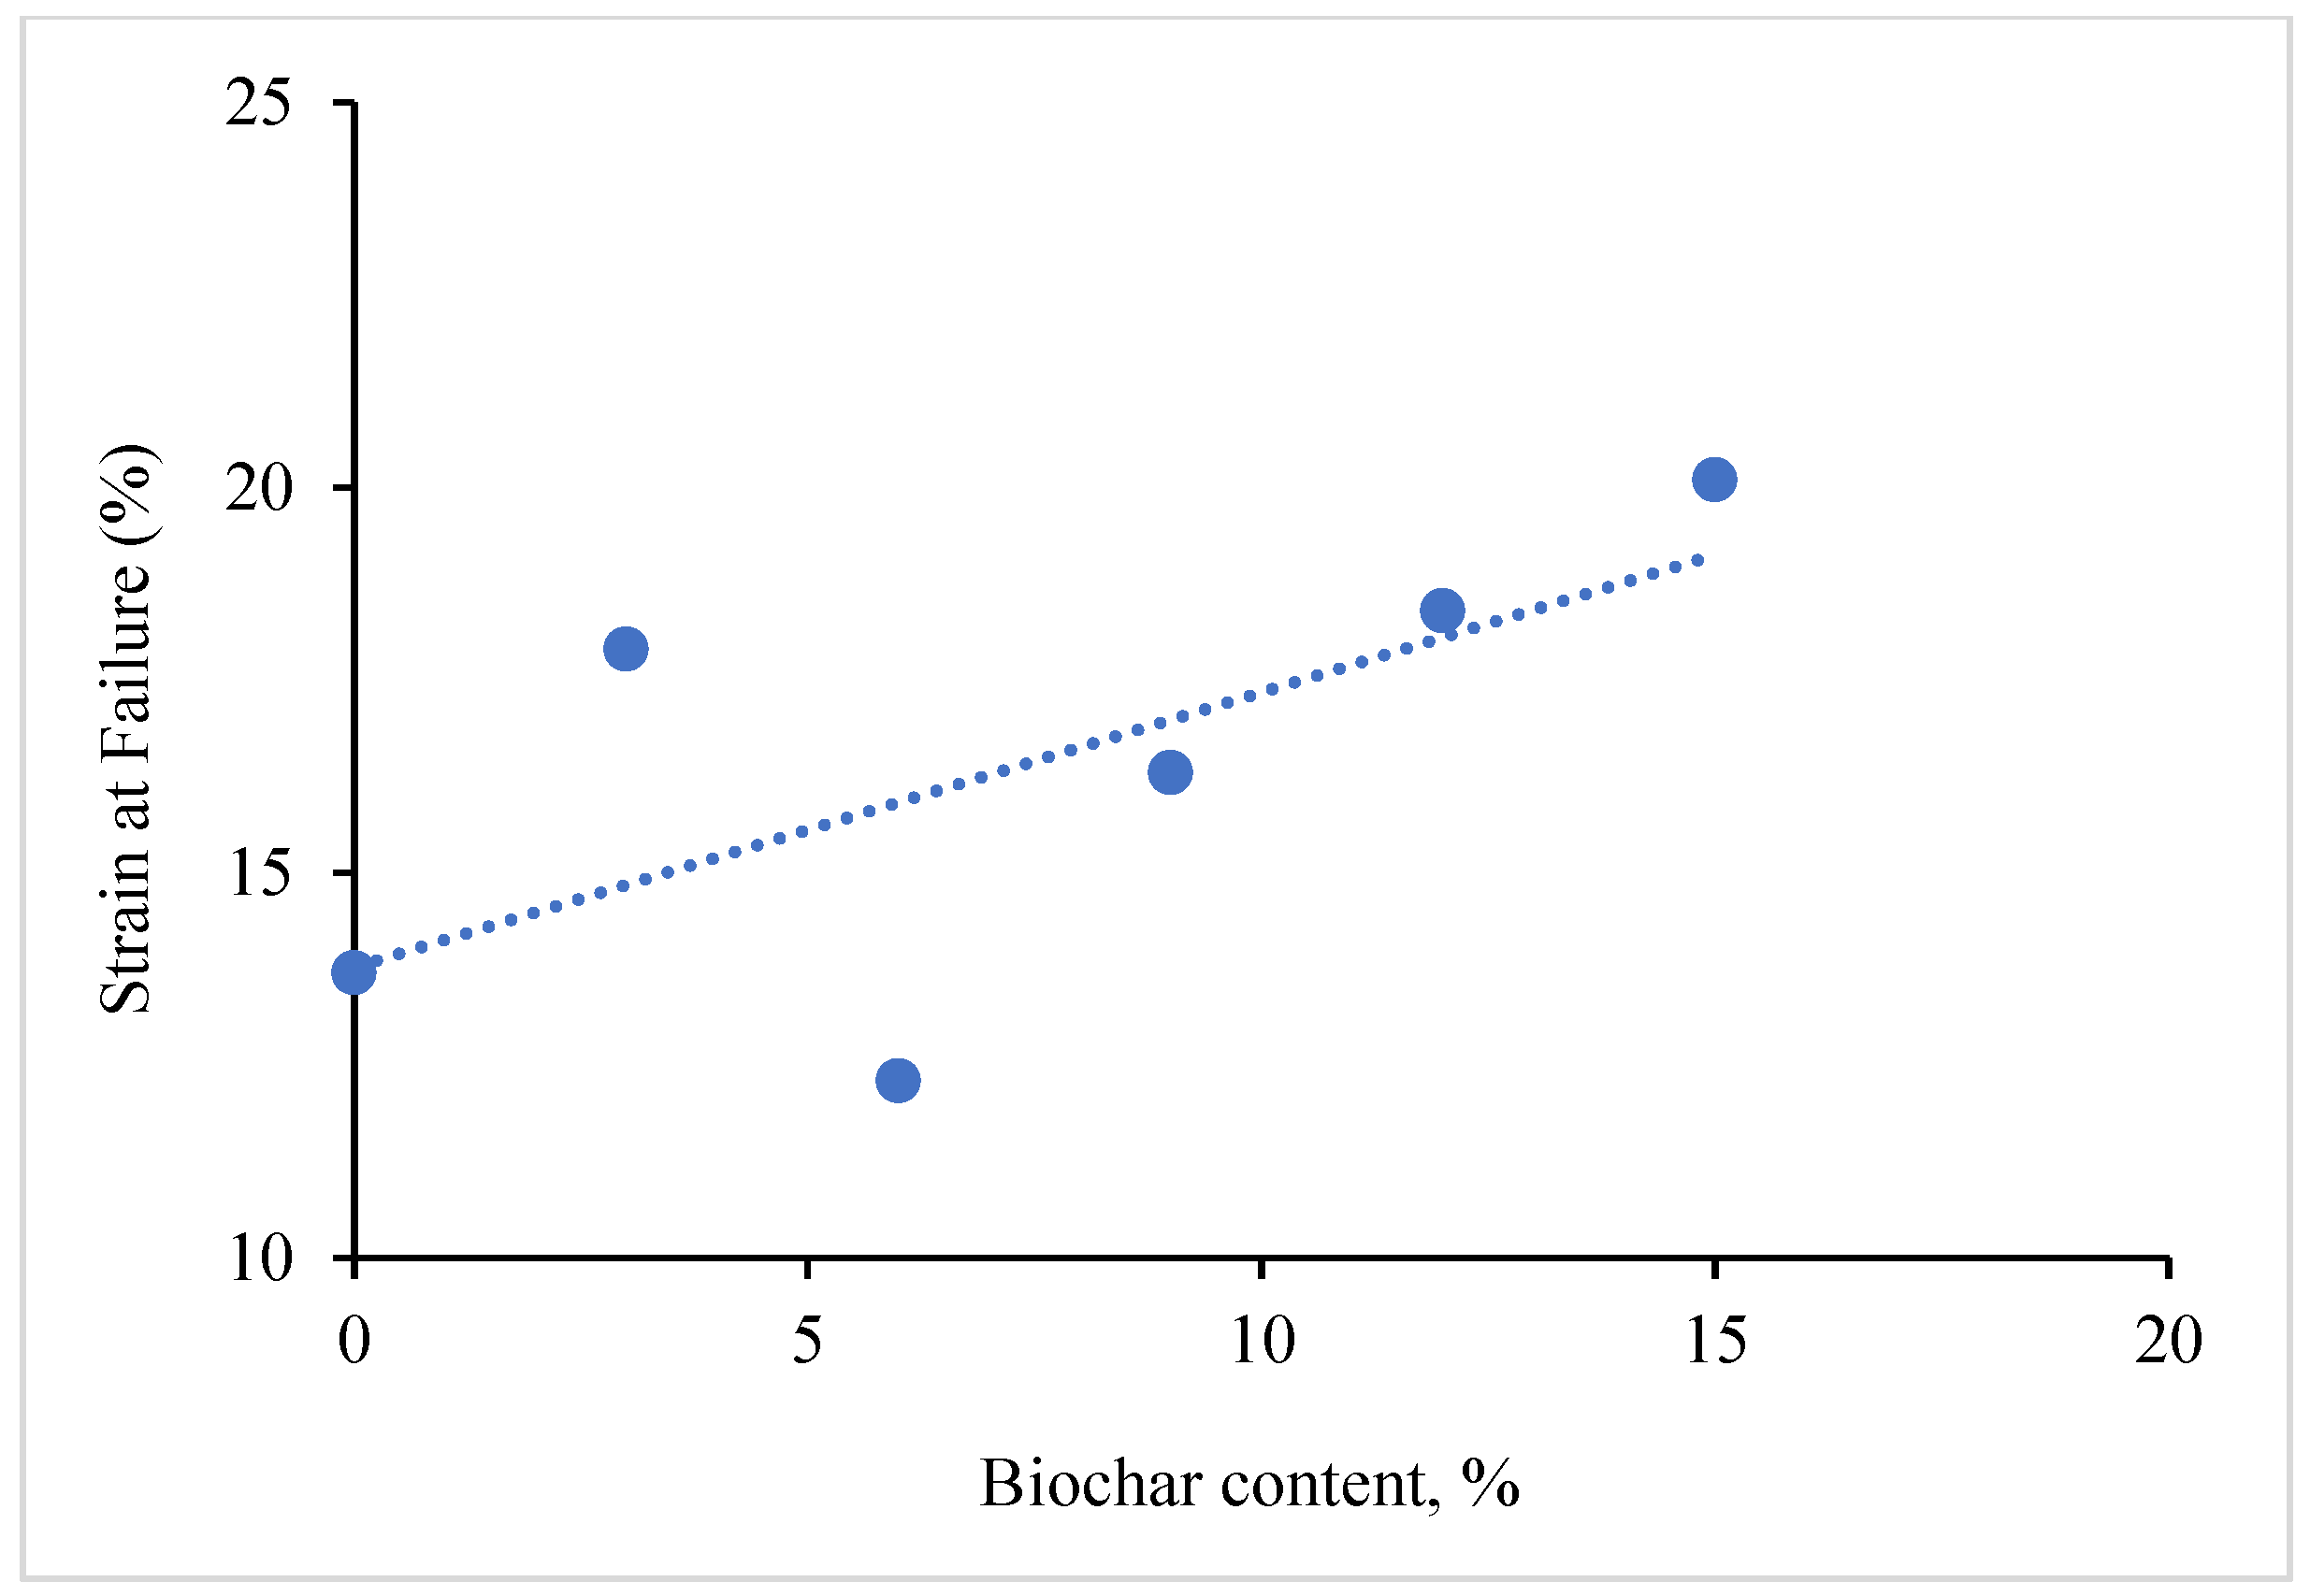
Figure 16 and
Figure 17 present the trends in unconfined compressive strength and strain at failure, respectively. The results demonstrate a general increase in both strength and ductility with rising biochar content. The peak strength rose from 53.4 kPa (0% biochar) to a 68.4 kPa (15% biochar), while strain at failure increased from 13.7% to 20.1% over the same range. These trends suggest that biochar not only enhances the peak strength of the clay matrix but also improves its capacity to undergo larger deformations before failure.
4. Conclusions
This study systematically evaluated the influence of wood-based biochar on the geotechnical properties of medium plasticity clay through a comprehensive suite of laboratory tests. Biochar was incorporated at volumetric contents ranging from 0% to 15%, and the resulting mixtures were assessed for changes in Atterberg limits, compaction characteristics, compressibility, shear strength, and unconfined compressive behavior.
The following are key findings from the investigation:
Plasticity Behavior: The addition of biochar led to a consistent increase in the liquid limit and plasticity index, indicating enhanced water retention capacity and altered clay-water interactions. These changes are attributed to the porous microstructure and high surface area of biochar.
Compaction Characteristics: Increasing biochar content resulted in a reduction in maximum dry unit weight and an increase in optimum moisture content. This trend is consistent with the low specific gravity and high-water absorption capacity of biochar, which influences the compaction response of the soil.
Compressibility: Consolidation tests demonstrated increased compressibility and final void ratio with higher biochar content. This is likely due to the incorporation of porous biochar particles, which introduce additional voids and facilitate water retention within the soil matrix.
Shear Strength Parameters: Direct shear testing revealed overall improvements in shear strength with biochar amendment. Both cohesion and internal friction angle increased with biochar content, suggesting that biochar enhances interparticle bonding and resistance to shear deformation under drained conditions.
Unconfined Compressive Strength: UC tests indicated a general increase in both peak compressive strength and strain at failure with increasing biochar content. The results suggest that biochar not only improves strength but also imparts greater ductility, allowing the clay matrix to undergo larger deformations before failure.
Collectively, the findings support the feasibility of using wood-based biochar as a sustainable and effective soil amendment for enhancing the engineering performance of clayey soils. The improvements in strength, ductility, and compressibility observed in this study highlight biochar’s potential as a low-cost, environmentally friendly alternative to conventional soil stabilizers. Future work should explore the long-term behavior of biochar-amended soils under field conditions and evaluate the effects of different biochar feedstocks and production parameters on geotechnical performance.
Author Contributions
Conceptualization, K.N.M., S.M.F., and D.E.; methodology, K.N.M., S.M.F., and D.E.; software, K.N.M., S.M.F., and D.E.; validation, K.N.M., S.M.F., and D.E.; formal analysis, K.N.M., S.M.F., and D.E.; investigation, K.N.M., S.M.F., and D.E.; resources, K.N.M., S.M.F., and D.E.; data curation, K.N.M., S.M.F., and D.E.; writing—original draft preparation, K.N.M., S.M.F., and D.E.; writing—review and editing, K.N.M., S.M.F., and D.E.; visualization, K.N.M., S.M.F., and D.E.; supervision, K.N.M.; project administration, K.N.M.; funding acquisition, K.N.M. All authors have read and agreed to the published version of the manuscript.
Funding
This research received no external funding.
Data Availability Statement
Some or all data, models, or code that support the findings of this study are available from the corresponding author upon reasonable request.
Conflicts of Interest
The authors declare no conflicts of interest.
References
- Han, J. Principles and practice of ground improvement. 2015.
- Zamin, B.; Nasir, H.; Mehmood, K.; Iqbal, Q.; Farooq, A.; Tufail, M. An Experimental Study on the Geotechnical, Mineralogical, and Swelling Behavior of KPK Expansive Soils. Advances in Civil Engineering 2021, 1–13. [Google Scholar] [CrossRef]
- Holtz, R.D.; Kovacs, W.D.; Sheahan, T.C. An introduction to geotechnical engineering. 1981.
- Tabarsa, A.; Latifi, N.; Meehan, C.L.; Manahiloh, K.N. Laboratory investigation and field evaluation of loess improvement using nanoclay -A sustainable material for construction. Constr.Build.Mater 2018, 158, 454–463. [Google Scholar] [CrossRef]
- Rashid, A.S.A.; Latifi, N.; Meehan, C.L.; Manahiloh, K.N. Sustainable Improvement of Tropical Residual Soil Using an Environmentally Friendly Additive. Geotech.Geol.Eng 2017, 35, 2613–2623. [Google Scholar] [CrossRef]
- Jing, J.; Abera, K.A.; Manahiloh, K.N.; Imhoff, P. Experimental Investigation of the Effects of Biochar on the Hydraulic Conductivity of Soils. Geotechnical Frontiers 2017, 549–558. [Google Scholar]
- Lamprinakos, R.; Manahiloh, K.N. Evaluating the Compaction Behavior of Soils with Biochar Amendment. Geo-Congress 2019, 141–147. [Google Scholar]
- Manahiloh, K.N.; Imhoff, P. Properties of Biochar-Amended Highway Soils: Biochar -An Eco-friendly Geomaterial. GEOSTRATA Magazine 2018, 22, 48–55. [Google Scholar] [CrossRef]
- Yan, Y.; Akbar Nakhli, S.A.; Jin, J.; Mills, G.; Willson, C.S.; Legates, D.R.; Manahiloh, K.N.; Imhoff, P.T. Predicting the impact of biochar on the saturated hydraulic conductivity of natural and engineered media. J.Environ.Manage 2021, 295. [Google Scholar] [CrossRef]
- Wong, J.T.F.; Chen, X.; Deng, W.; Chai, Y.; Ng, C.W.W.; Wong, M.H. Effects of biochar on bacterial communities in a newly established landfill cover topsoil. J.Environ.Manage 2019, 236, 667–673. [Google Scholar] [CrossRef]
- Woolf, D. Biochar as a soil amendment: A review of the environmental implications. 2008.
- Spears, S. What is Biochar? 2018.
- Bednik, M.; Medyńska-Juraszek, A.; Ćwieląg-Piasecka, I. Effect of Six Different Feedstocks on Biochar’s Properties and Expected Stability. Agronomy 2022, 12. [Google Scholar] [CrossRef]
- Duku, M.H.; Gu, S.; Hagan, E.B. Biochar production potential in Ghana-A review. Renewable and Sustainable Energy Reviews 2011, 15, 3539–3551. [Google Scholar] [CrossRef]
- Manahiloh, K.N.; Kaliakin, V.N.; Verdi, K. Evaluation of Biochar as a Soil Improvement Additive to Mid-Atlantic Expansive Clay. Geo-Congress 2024, 2024, 442–449. [Google Scholar]
- Zhang, Y.; Gu, K.; Tang, C.; Shen, Z.; Narala, G.R.; Shi, B. Effects of biochar on the compression and swelling characteristics of clayey soils. International Journal of Geosynthetics and Ground Engineering 2020, 6, 1–8. [Google Scholar] [CrossRef]
- Nakhli, S.A.A.; Goy, S.; Manahiloh, K.N.; Imhoff, P.T. Spatial heterogeneity of biochar (segregation) in biochar-amended media: An overlooked phenomenon, and its impact on saturated hydraulic conductivity. J.Environ.Manage 2021, 279. [Google Scholar] [CrossRef]
- Wang, J.; Wang, S. Preparation, modification and environmental application of biochar: A review. J.Clean.Prod 2019, 227, 1002–1022. [Google Scholar] [CrossRef]
- Bian, X.; Ren, Z.; Zeng, L.; Zhao, F.; Yao, Y.; Li, X. Effects of biochar on the compressibility of soil with high water content. Journal of Cleaner Production 2024, 434, 140032. [Google Scholar] [CrossRef]
- Guney, Y.; Sari, D.; Cetin, M.; Tuncan, M. Impact of cyclic wetting-drying on swelling behavior of lime-stabilized soil. Build.Environ 2007, 42, 681–688. [Google Scholar] [CrossRef]
- Lehmann, J.; Joseph, S. Biochar for environmental management: an introduction. Biochar for environmental management 2015, 1–13. [Google Scholar]
- Zhang, L.; Jing, Y.; Chen, G.; Wang, X.; Zhang, R. Improvement of physical and hydraulic properties of desert soil with amendment of different biochars. Journal of Soils and Sediments 2019, 19, 2984–2996. [Google Scholar] [CrossRef]
- Brassard, P.; Godbout, S.; Lévesque, V.; Palacios, J.H.; Raghavan, V.; Ahmed, A.; Hogue, R.; Jeanne, T.; Verma, M. 4 -Biochar for soil amendment. 2019, 109-146.
- Hardie, M.; Clothier, B.; Bound, S.; Oliver, G.; Close, D. Does biochar influence soil physical properties and soil water availability? Plant Soil 2014, 376, 347–361. [Google Scholar] [CrossRef]
- Reddy, K.R.; Yaghoubi, P.; Yukselen-Aksoy, Y. Effects of biochar amendment on geotechnical properties of landfill cover soil. Waste Manage.Res 2015, 33, 524–532. [Google Scholar] [CrossRef]
- Castellini, M.; Giglio, L.; Niedda, M.; Palumbo, A.D.; Ventrella, D. Impact of biochar addition on the physical and hydraulic properties of a clay soil. Soil Tillage Res 2015, 154, 1–13. [Google Scholar] [CrossRef]
- Manahiloh, K.N.; Natelborg, B. Laboratory Evaluation of the Geotechnical Properties of Biochar Amended Mississippi Chalk. IFCEE 2024, 2024, 346–355. [Google Scholar]
- Villarreal, J.; Wang, F. Feasibility study on biochar-treated expansive soils. International Journal of Geosynthetics and Ground Engineering 2021, 7. [Google Scholar] [CrossRef]
- Andrade, F.A.; Al-Qureshi, H.A.; Hotza, D. Measuring the plasticity of clays: A review. Applied Clay Science 2011, 51, 1–7. [Google Scholar] [CrossRef]
- Mitchell, J.K.; Soga, K. Fundamentals of soil behavior. 2005.
- D698-12, A. Standard Test Methods for Laboratory Compaction Characteristics of Soil Using Standard Effort (12400 ft-lb/ft3(600k-N-m/m3)). 2021.
- D4318-17e1. Standard Test Methods for Liquid Limit, Plastic Limit, and Plasticity Index of Soils. 2018.
- D2435/D2435M-25. Standard Test Methods for One-Dimensional Consolidation Properties of Soils Using Incremental Loading. 2025.
- ASTM D3080/D3080M-23. Standard Test Method for Direct Shear Test of Soils Under Consolidated Drained Conditions. 2023.
- ASTM D2166. Standard Test Method for Unconfined Compressive Strength of Cohesive Soil. 2024.
|
Disclaimer/Publisher’s Note: The statements, opinions and data contained in all publications are solely those of the individual author(s) and contributor(s) and not of MDPI and/or the editor(s). MDPI and/or the editor(s) disclaim responsibility for any injury to people or property resulting from any ideas, methods, instructions or products referred to in the content. |
© 2025 by the authors. Licensee MDPI, Basel, Switzerland. This article is an open access article distributed under the terms and conditions of the Creative Commons Attribution (CC BY) license (https://creativecommons.org/licenses/by/4.0/).