Submitted:
02 September 2025
Posted:
03 September 2025
You are already at the latest version
Abstract
To achieve a sustainable society that is resilient to climate change and natural disasters, it is essential that socioeconomic vulnerabilities are addressed. However, within poor countries, hotspots of vulnerabilities are difficult to identify, as for these countries existing vulnerability measures are only available at the national level. Here we address this issue by presenting a subnational version of the GDL Vulnerability Index (GVI), a composite index designed to monitor and analyze the human dimensions of vulnerability to climate change, natural disasters, and other kinds of shocks. The Subnational GVI (or SVGI) is available for 1300+ regions across 121 Low- and Middle-Income Countries (LMICs), providing an over 10 times more detailed picture of socioeconomic vulnerability than was possible before. Decomposition analyses reveal that this higher resolution increases the observed variation in vulnerability by more than 70 percent in the poorest regions. Since 2000, total vulnerability across LMICs has declined by about 24%, but at the same time the variation in vulnerability has increased, thus highlighting the importance of subnational data. By capturing localized disparities in coping capacity, adaptive capacity and susceptibility, the SGVI provides vital new insights and data for climate adaptation and sustainable development planning.
Keywords:
vulnerability
; composite index
; sustainability
; subnational disparities
; socioeconomic dimensions
; Low- and Middle-Income Countries
1. Introduction
As awareness has grown that hazard-focused approaches are insufficient to address the complex challenges posed by climate change and related disasters, increased attention has turned to the structural and institutional conditions that shape how populations experience and respond to these threats [1,2]. In this context, vulnerability—understood as the susceptibility of people and systems to harm, and their capacity to respond and adapt [3,4] -- has emerged as a central concept in climate risk analysis. In this context, risk is now widely defined as the potential for adverse consequences for human or ecological systems, arising not only from the direct impacts of climate change but also from the human responses to those impacts [4]. Increased understanding of the interactions between physical and social drivers of risk—often operating across spatial and temporal scales—has led to the development of integrated frameworks for climate change risk assessment [5].
The IPCC’s Sixth Assessment Report [6,7] frames climate risk as the outcome of three interacting components: climate hazards, exposure, and vulnerability. Hazards refer to physical climate conditions—including extremes and variability—that can affect human or ecological systems [8]. Exposure refers to the presence of people, assets, ecosystems, infrastructures and livelihoods in areas that could be adversely affected by hazards. Vulnerability captures the propensity of systems to be harmed, and comprises both sensitivity and adaptive capacity: the degree to which systems are affected by climate-related hazards, and their ability to cope with or adjust to them.
In this framing, reducing vulnerability—especially through improvements in adaptive capacity—is central to building more resilient and sustainable societies. Over the past decade, the focus has shifted toward better understanding the multiple and intersecting drivers of vulnerability, including income, poverty, education, health, gender disparities, infrastructure, governance, demographic change, and sociocultural norms [3,4,9,10,11,12,13,14,15]. These human dimensions are key not only to understanding differential risks, but also to guiding sustainable development strategies and adaptation policies. As a result, an increasing number of social indicators and thematic indices have been developed to facilitate international comparisons on these dimensions [13,16,17,18].
In addition to these dimension-specific metrics, composite indices have been created to capture broader patterns of vulnerability, including the INFORM Index [19], the World Risk Index [20], the ND-GAIN Vulnerability Index [21], and the GDL Vulnerability Index [22]. These indices provide integrated measures of societal capacity to withstand shocks and adapt to a changing climate. Their strength lies in their ability to synthesize many indicators into a single score, allowing users to track trends, make cross-country comparisons, and help guide policies and resources toward the most vulnerable areas [23,24,25,26]. However, these composite indices are typically limited to the national level, which restricts insight into subnational variation.
This is a critical limitation, as substantial differences in socioeconomic conditions—and thus vulnerability—can exist within countries. Evidence shows that economic development, education, health, governance, and other key factors vary widely between subnational areas [27,28,29,30,31,32,33,34,35]. These differences are not only relevant for large countries such as China, Nigeria, or Brazil, but also for smaller nations like Nepal, Rwanda, or Costa Rica, where local conditions can also differ substantially. Addressing climate risks in a sustainable and targeted way therefore requires a subnational index.
While expert-based indices such as INFORM, ND-GAIN and WRI draw on a wide set of indicators (ranging from 27 to 54) and aim to cover the full spectrum of exposure, sensitivity, and adaptive capacity, their complexity and reliance on expert weighting makes them less suited for disaggregated, localized analysis. In contrast, the GDL Vulnerability Index (GVI) offers a simple, transparent, and formula-based approach that is fully data-driven and specifically focuses on the human and societal dimensions of vulnerability. It brings together seven core dimensions -- economy, education, health, gender equality, demographics, governance, and infrastructure – which are measured by eleven indicators [22]. Physical aspects (landscape, soils, natural vegetation etc.) as well as exposure-related aspects are not included. Neither are human-environment interactions like agriculture and nature management. This focus on the human and societal aspects of vulnerability makes for a strong index, as the different aspects of human development are known to be highly correlated [36,37,38]. The GVI has demonstrated validity, with correlations between 0.77 and 0.94 with the susceptibility, coping capacity and adaptive capacity subcomponents of INFORM, WRI and ND-GAIN [22].
Because the GVI uses a formula-based calculation method, it can be computed for any geographic unit and point in time for which the necessary input data are available. This makes it highly suitable for subnational applications and for longitudinal monitoring [39]. In this study, we leverage this flexibility to develop the Subnational GVI (SGVI), covering 1,341 regions in 121 Low- and Middle-Income Countries (LMICs) for the period 2000–2022.
Using the SGVI, we assess spatial patterns and temporal trends in vulnerability over the period 2000-2022. We generate maps of the (subnational) variation in vulnerability across the developing world and demonstrate the extent to which national-level statistics obscure local realities. Using a decomposable inequality measure, we quantify how much the observed variation in vulnerability increases when moving from the national to the subnational level, for the whole developing world and for major global regions. Our results show that by using subnational data, the observed variation in vulnerability increases by about 20 percent for the complete developing world, thus underlining the dominance of country differences at a global scale. However, at the level of major regions, the increase in observed inequality is (much) higher and runs to over 70 percent in Sub-Saharan Africa (SSA), which highlights the importance of disaggregated data for targeted policy action.
We find that, on average, vulnerability has declined over the 2000–2022 period, indicating gradual improvement in underlying social conditions. However, disparities remain wide and progress is uneven, especially in SSA. The SGVI provides a powerful tool to identify where sustainable development investments are most needed and to track whether such investments translate into improved resilience. By focusing on the human dimensions of climate vulnerability, the SGVI contributes directly to the evidence base for sustainable climate adaptation and disaster risk reduction.
2. Materials and Methods
2.1. Construction of the SGVI
The GVI as it was originally developed by Smits and Huisman [22] (S&H) covers seven dimensions of socioeconomic vulnerability that are measured with eleven indicators. These dimensions are the economy, education, health, gender, demographics, governance and infrastructure.
To construct the GVI, S&H built a database with information on the eleven indicators for 189 countries. The economic dimension is indicated by GDP per capita of the region and by the poverty level of the population, measured by the poverty headcount ratio at US$ 3.65 a day. Both indicators are expressed in constant 2017 International Dollars PPP and are derived from the World Development Indicators (WDI) of the World Bank (2024) [40]. The educational level of the population is indicated by the mean years of schooling of the adult (25+) population derived from the Human Development Index Database (HDID) of the UNDP (2024) [41]. Health status of the population is indicated by the region’s life expectancy at birth derived from the HDID. For gender inequality, the Gender Development Index (GDI), which indicates the difference in human development between men and women in a region (UNDP, 2021) [42], is derived from the HDID.
For the demographic dimension, two indicators are used. The age structure of the population measured by the dependency ratio, which compares the number of young and old individuals (the dependent population) with the number of individuals in the working age population [43]. And urbanization, measured as the percentage of a region’s population residing in urban areas, based on each country’s national definition. Both demographic indicators are derived from the WDI. The available infrastructure of a region is measured by the percentages of households with access to electricity and clean drinking water and the number of mobile cellular phone subscriptions per 100 people, also derived from the WDI. Governance is measured by the Worldwide Governance Indicators (WGI) of the World Bank (2024) [44], which describe patterns in the perception of the quality of governance.
To construct the GVI, S&H performed Principal Component Analysis [45] on this database to estimate weight factors for the indicators. These weight factors were subsequently transformed into an additive formula with which the GVI can be computed as an indicator running from 0 to 100, with 0 meaning lowest and 100 highest vulnerability. The indicator weights of this formula are presented in Table 1.
2.2. Subnational Indicators
To estimate the SGVI with the GVI formula, subnational data were used derived from the Global Data Lab (GDL, www.globaldatalab.org) [46], which provides freely downloadable subnational development indicators for LMICs [47,48,49,50]. The GDL databases used for this purpose are the Subnational Human Development Database (SHDD) [49], the Area Database (GDL-AD) [48] and the Subnational Corruption Database (SCD) [50], which were constructed by GDL by aggregation from household datasets derived from the Demographic and Health Surveys (DHS, https://www.dhsprogram.com) [51], UNICEF Multiple Indicator Cluster Surveys (MICS, http://mics.unicef.org) [52], population censuses distributed by IPUMS International (https://international.ipums.org) [53] and public opinion surveys, including Afrobarometers (www.afrobarometer.org) [54], Lapop Surveys (www.vanderbilt.edu/lapop/) [55] or Asian Barometers (www.asianbarometer.org/) [56].
Five of the eleven indicators needed for the SGVI were available in the GDL databases with the required definition, so no further transformations were required. These indicators are the mean years of schooling of the adult (25+) population (MYS), life expectancy at birth (LEB), the Gender Development Index (GDI), the dependency ratio (DEP) and the degree of urbanization (URB). For the other six indicators, the definitions in the GDL databases differed somewhat from those used by S&H and regression-based prediction models were developed to translate the subnational indicators into the correct form. Both linear and nonlinear models were tested and the models with the highest explained variance were chosen. For indicators that could not have values below zero, regressions through the origin were used. To develop those models the national versions of the GDL indicators were related to their national equivalents in the GVI Database of S&H [22]. For this purpose, version 2.0 of this database was used derived from the GDL.
For subnational GDP per capita (GDPc) we used the estimate of Gross National Income per capita (GNIc) available in the SHDD database of GDL as starting point. We developed a regression-based prediction model that estimated the national level of GDPc in the GVI Database on the basis of the national GNIc values in the SHDD. This model has a very high explained variance (adj. R2) of 98.1%, hence the prediction is expected to be very good. The model is:
GDPc = 1.19227195 * GNIc
A similar model was developed to estimate the poverty headcount ratio at US$ 3.65 a day (POV365) on the basis of the IPOV50 poverty measure available in GDL-AD. The IPOV50 poverty measure is based on the International Wealth Index (IWI), an asset based wealth index running from 0 (no assets) to 100 (all included assets) that indicates the wealth level of households on the basis of their ownership of durables, housing quality and access to basic services [57]. IPOV50 reflects the percentage of households under an IWI value of 50. Our prediction model for estimating national POV365 on the basis of national IPOV50 has a very high explained variance (adj. R2) of 94.6%. The model is:
Pov365 = 0.76877955 * Ipov50 + 0.00353646 * year
For governance, S&H [22] relied on the Worldwide Governance Index (WGI) of the World Bank [58], which combines six governance indicators -- voice and accountability, political stability, government effectiveness, regulatory quality, rule of law and control of corruption. To create a subnational version of this index, we used the Subnational Corruption Database (SCD) [50] as starting point, as this is the only database with a governance indicator at the subnational level for the complete developing world. Given that the perception of corruption is one of the major indicators of the WGI, we used national versions of the Subnational Corruption Index (SCI) derived from the SCD to create a regression-based prediction model to estimate the WGI. The prediction model has a high explained variance (adj. R2) of 83.9%. The model is:
WGI = -2.04759085 + 0.10616570 * SCI + 1.90585697 * ln((SCI – min(SCI)) + 1)
The infrastructure in a country was indicated by S&H by the percentage of the population using safely managed drinking water services (CWAT) and the percentage of the population with access to electricity (ELEC). In the GDL-AD, the percentage of households with access to piped water is available (PIPED). We used the national values of this indicator in the prediction model. This prediction model has a high explained variance (adj. R2) of 90.5%. The model is:
CWAT = 0.72706093 * Piped + -0.00256948 * Piped2 + 0.02552638 * year
Given that in the GDL-AD the percentage of households with electricity (ELECTR) was available, we used the national value of this indicator to develop a prediction model to estimate the national value of ELEC, the percentage of the population with electricity, on the basis of ELECTR. Although both definitions seem similar, they are not identical and we estimated a prediction model. As could be expected, this prediction model has a very high explained variance (adj. R2) of 99.9%. The model is:
Elec = 0.99814693 * Electr
The communication infrastructure available in a country was indicated by S&H [22] by the number of mobile cellular subscriptions per 100 people (MCS). Given that in the GDL-AD the percentage of households with a mobile phone (PHMP) was available, we used the national value of this indicator to develop a prediction model to estimate the national value of MCS on the basis of PHMP. This prediction model has a very high explained variance (adj. R2) of 95.0%. The model is:
MCS = 0.15092665 * PHMP + 0.01030008 * PHMP2
By applying these prediction models to the subnational data derived from the Global Data Lab, subnational estimates for these indicators were generated, which were subsequently brought together with the indicators for which no estimating models were needed in the Baseline SGVI Database.
2.3. Addressing Missing Data
Given that household surveys and censuses are not held every year, part of the indicators in the Baseline SGVI Database are only available for a restricted number of years, i.e. the years in which a survey was held. This was the case for POV365, MCS, ELEC, CWAT, DEPR and URB. To obtain the values of these indicators for the whole period 2000-2022, we had to estimate the missing information by using interpolation or extrapolation. This estimation process was facilitated by the fact that the GVI Database made available by S&H [22] contains the national values for all indicators for each year in this period, which means that only the subnational variation had to be interpolated or extrapolated [49,50].
For countries for which data for several points in time was available, linear interpolation was used to fill in empty years between the years for which data was available. As no other information for the missing years was available, presuming that in each of the in-between years the indicator values changed in a similar way does seem a reasonable assumption, which has also been used in other data projects [49,50]. If the subnational indicator values were only available for an earlier or a later year, extrapolation had to be used. When extrapolating, no change in the composition of subnational values was assumed, as the closest available subnational distribution seems to offer the most likely prediction, given that subnational variation is a sticky phenomenon [49,50,59].
2.4. Standardization Around National Values
The interpolated and extrapolated indicator values for the period 2000-2022 were subsequently standardized around their national values in the GVI Database. To do this, they were rescaled in such a way that their population weighted national means for a given year matched the corresponding national values in the GVI Database. In this way indicators were obtained that at the national level are exactly equal to the values used by S&H for constructing the GVI, while at the same time their subnational variation was as much as possible in line with the variation in the subnational databases. Such a rescaling approach has been effectively applied in earlier studies [49,50,60]. The population data used for creating population weighted means were derived from the SHDD.
Using the described procedures, the baseline version of the SGVI Database was transformed into a version that contains values for the eleven dimension indicators and population size for each year in the period 2000-2022. This information was available for 1,338 regions across 121 LMICs. Because national values for one or more indicators for the first years of the period were occasionally missing in the GVI Database, the rescaling approach could not be applied to all region-year combinations. In total, the SGVI Database therefore includes data for 32,445 region-year combinations, of which 24,627 (76%) contain complete information for all indicators. Detailed information on data availability by region, country, and year is provided in the SGVI Database available in the online Supplementary Materials.
2.5. Constructing the SGVI
To construct the SGVI on the basis of the indicators in the SGVI Database, the values of these indicators were entered into the GVI formula developed by S&H. The indicator weights of this formula are presented in Table 1. To compute the SGVI, the indicator values had to be multiplied with their weight and summed up, as shown in equation 1.
SGVI’ = -22.63157686 + ∑ βn * xn
In this equation, SGVI' is the estimated vulnerability score, βn the indicator weight of the nth indicator and xn the indicator value of the nth indicator. The SGVI' scale constructed in this way was subsequently reversed to create a scale in which higher values mean more vulnerability, with values running potentially from 0 to 100:
Using this approach, SGVI values could be computed for the 24,627 region-year combinations for which all indicators were available. These SGVI values were subsequently standardized around their national values in the GVI Database of S&H to be sure that their population weighted means were exactly equal to those national values.
For the combinations with one or more indicators missing, alternative formulas were used developed by S&H for situations in which not all indicators are available. For 197 combinations (0.6%), poverty was missing; for 3,542 combinations (10.9%) GDI was missing; for 1,195 combinations (3.7%) governance was missing; for 176 combinations (0.5%) the dependency ratio was missing; for 91 combinations (0.3%) GDPc and GDI were missing; for 48 combinations (0.1%) GDI and life expectancy were missing; for 219 combinations (0.7%) GDI and governance were missing; for 54 combinations (0.2%) GDI and the dependency ratio were missing; for 736 combinations (2.3%) water and electricity were missing; for 125 combinations (0.4%) GDI, water and governance were missing; for 92 combinations (0.3%) GDI, electricity and the dependency ratio were missing; for 138 combinations (0.4%) GDI, water, electricity and phone were missing and for 160 combinations (0.5%) water, electricity, phone and the dependency ratio were missing. For the situations in which one or two indicators are missing, alternative formulas developed by S&H were used. For the situations in which three or four indicators were missing, the approach of S&H was used to develop new formulas. By using these alternative formulas for the combinations with missings, we were able to create SGVI values for all subnational regions of the 121 countries for which we had data.
By adding these SGVI values to the database, the final version of the SGVI Database was constructed, which is made available in the Supplementary Materials. It can also be downloaded from the Global Data Lab (www.globaldatalab.org) were future updates will be made available.
3. Results
3.1. Contribution of Indicators
When applying the GVI at the subnational level, it is useful to verify whether the contribution of the eleven indicators to overall vulnerability remains consistent with the original country-level formulation. Subnational data differ from cross-national data in that within-country variation may not mirror between-country variation, while unobserved national factors may influence regions within a country.
To test whether each indicator has a significant independent association with vulnerability when applied subnationally, we have estimated regression models in which the SGVI values in our database were regressed on the eleven subnational indicators. This was done for all included countries together and separately for four global regions: Sub-Saharan Africa (SSA), Latin America and the Caribbean (LAC); the Middle East, North Africa and the former Soviet States (MENAS) and Central and South Asia and the Pacific (CSAP). Because the subnational regions are clustered within countries, multilevel regression models with country-specific random intercepts were used [61].
The results in Table 2 for all LMICs combined and for each of the four global regions show that all eleven GVI component indicators remain highly significant at the subnational level after controlling for country-specific random effects. All P-values are below P=0.0001. The size and direction of coefficients are remarkably stable across global regions, with only SSA showing some deviations. This consistency indicates that the statistical relationships on which the GVI was built at the national level hold robustly when applied within countries, supporting the conceptual validity of the index for subnational applications.
3.2. SGVI Level and Changes
Table 3 presents the mean SGVI values for all included LMICs and for major global regions for the years 2000, 2011, 2022. The mean SGVI level across the developing world was 72 in 2000 and decreased via 61 in 2011 to 55 in 2022. A substantial reduction of 24 percent over this 22-year period.
Table 3 also shows that the mean SGVI and changes therein differ substantially between world regions. Of the four distinguished regions, SSA had the highest level of vulnerability in 2000 and showed the smallest improvement in vulnerability over the period 2000-2022. In 2000 vulnerability in SSA was 64% higher than in LAC, the global region with the lowest level of subnational vulnerability in all three years. Of the other two regions, MENAS had a slightly higher level of SGVI than LAC over the whole period. The fourth region, CSAP, started at a relatively high SGVI of 72 in 2000. However, the decrease of vulnerability was with 31 percent highest in this region. As a result of the differences in speed of decrease, three of the four regions reached mean SGVI scores in the 40s in 2022 and only SSA remained with a mean of 72 at a very high level.
Improvement in subnational vulnerability seems to have declined over time. In all world regions it was higher during 2000-2011 than 2012-2022. Especially for LAC and MENAS the change during the first period was much higher than during the second period.
In Figure 1, SGVI values for 2000, 2011 and 2022 are displayed on world maps. As could be expected, socioeconomic vulnerability is lowest in subnational regions of the more developed countries and highest in regions of the poorest countries. Particularly high SGVI values, shown as dark orange and red on the maps, are found in subnational regions of SSA and South and South East Asia. In 2022, the most recent year with data, the lowest SGVI values are found in Malaysia and in subnational regions of Latin America, e.g. in Chili, Cuba, Uruguay. The highest SGVI values can be observed in subnational regions of the poorest and least stable countries, e.g. Somalia, Congo Democratic Republic, Central African Republic.
The maps clearly show that between 2000 and 2022 the level of socioeconomic vulnerability has decreased in most of the subnational regions. Whereas in 2000, 42.1% of the subnational regions had a GVI-value above 75, indicating very high levels of vulnerability, in 2011 this had dropped to 31.7%, and in 2022 to 20.1%. Improvements are most substantial in regions of China, Cambodia, Lao and Timor Leste, with SGVI decreases of more than 30 points. However, there are also some subnational regions, mainly in Venezuela and South Sudan, where vulnerability has increased over the study period.
3.3. Decomposing Variation in GVI
To study the variation in SGVI across the developing world, two inequality measures are used. The well-known GINI coefficient [62] is used to get an idea of the size of the variation, as its values are comparable to estimates for other kinds of indices, like income or wealth. With the GINI we can also observe to what extent the variation in vulnerability has changed over time since 2000.
Besides the GINI, we also use the Theil coefficient [63], because it is an additively decomposable inequality index. This means that it can be used to observe how much the variation in vulnerability increases, when besides the variation between countries also the variation between regions withing countries is observed. In this way, we can gain insight in the importance of using subnational instead of national data for studying vulnerability in LMICs.
The GINI coefficient for the total variation in SGVI across the developing world and for major global regions is presented in Table 4 for the years 2000, 2011 and 2022. Over the period 2000-2011, total inequality among all included countries and subnational regions increases from 0.15 to 0.19 after which it remains stable at that value until 2022. This level of inequality is higher than in the four separate world regions, which show values between 0.07 and 0.15. This difference is not surprising as the countries within those global regions tend to resemble each other more than they resemble countries in the other global regions. The higher level of variation, when all countries are compared, is also reflected in the increase in total observed inequality when subnational variation is added. At the level of all countries, this increase is with 18-20 percent rather low, thus revealing that at that level the between-country variation is dominant over the within-country variation.
However, if we look at the four global regions separately, the picture is different. Within these regions, and particularly in SSA, we observe lower levels of inequality than among all LMICs. Thus the countries within these regions resemble each other more than they resemble countries in other parts of the world. However, the increase in observed inequality within these regions when subnational variation is added is substantially higher than among all LMICs. In SSA, taking subnational variation into account increases the observed inequality in 2000 with 89 percent. Between 2000 and 2022, this percentage decreases, but in 2022 it is still considerable (73 percent). Hence in this poorest region of our world, within-country variation plays a role of importance.
To a certain extent this is also true in the other global regions. In LAC inequality was relatively stable (0.13-0.15), but the increase in inequality when subnational variation is added rises from 31 percent in 2000 to 53 percent in 2022. This last number is also higher than what we see in the other two regions, which both start around 40 percent but then decrease to 24 percent (MENA and former Soviet states) or to 30 percent (rest Asia and Pacific) when adding subnational variation.
4. Discussion
Recent advances in climate risk analysis underscore the limitations of hazard-centric approaches, highlighting the importance of structural and institutional conditions that shape how populations experience and respond to climate-related threats [1,2]. In this context, vulnerability has emerged as a central concept, emphasizing the social dimensions of risk alongside physical hazards and exposure. Vulnerability is conceptualized as a function of both sensitivity and adaptive capacity, and reducing it—particularly by enhancing adaptive capacity—is now widely recognized as critical for building resilient and sustainable societies [3,4].
To operationalize vulnerability, various composite indices have been developed, including the INFORM Index [19], World Risk Index [20], ND-GAIN [21], and the GDL Vulnerability Index (GVI) [22]. While these tools offer valuable cross-country insights, their national-level focus limits their ability to capture within-country (subnational) variation, which can be substantial, particularly in LMICs.
In this study, we aim to contribute to the field by presenting a subnational version of the GDL Vulnerability Index (SGVI) [22], covering 1,341 regions across 121 LMICs for the period 2000–2022. Unlike the other indices mentioned above, which incorporate a large number of indicators and depend on expert evaluations, the GVI offers a transparent, formula-based, and fully data-driven measure of socioeconomic vulnerability. The index aggregates eleven indicators across seven core dimensions: economy, education, health, gender equality, demographics, governance, and infrastructure [22].
Data for constructing the SGVI were sourced from the Global Data Lab (GDL; www.globaldatalab.org). Five indicators (mean years of schooling, life expectancy, the Gender Development Index, dependency ratio and urbanization) were directly available, while the remaining indicators were estimated from the GDL data using regression-based estimation procedures. Missing years were imputed through interpolation and extrapolation techniques, and indicators were normalized relative to national values in the GVI database of S&H.
The general GVI formula, developed by S&H through Principal Component Analysis (PCA), was applied to the subnational dataset. For cases with missing indicators, alternative formulas—developed specifically for partial data contexts—were used. The SGVI thus retains compatibility with the original GVI structure while maximizing data coverage at the subnational level, enabling a more granular understanding of vulnerability as a barrier to sustainability.
To assess the validity of applying the GVI framework subnationally, multilevel regression models with country-level random intercepts were estimated. Results confirmed that all eleven indicators have strong associations with SGVI scores across all global regions (SSA, LAC, MENAS, CSAP), with high consistency in coefficient size and direction (all p < 0.0001). This consistency supports the robustness and conceptual validity of the GVI framework and underscores its potential as a tool for informing targeted, equity-focused sustainability policies.
Between 2000 and 2022, the average SGVI score across the developing world declined significantly, from 72 to 55, reflecting a 24% improvement. However, regional disparities remain substantial. Subnational regions in Sub-Saharan Africa (SSA) consistently exhibited the highest levels of vulnerability and the smallest reductions over the study period, while such areas in Latin America and the Caribbean (LAC) maintained the lowest SGVI scores throughout. The most significant declines in subnational vulnerability were observed in Asian countries, followed by MENA and Latin American countries.
In 2000, 42% of subnational regions had SGVI values above 75 (indicating very high vulnerability), a proportion that fell to 20% by 2022. While this trend signals positive movement toward sustainability, setbacks in countries like Venezuela and South Sudan illustrate the fragility of these gains in the face of conflict and institutional breakdown.
Analysis of inequality using the GINI coefficient revealed an increase in SGVI inequality at the global level from 0.15 in 2000 to 0.19 in 2011, remaining stable thereafter. This overall variation reflects both between- and within-country disparities. Notably, within-country variation contributes significantly to overall inequality in LMICs, especially in SSA and Latin America—underscoring the importance of place-based interventions to promote inclusive and sustainable development. These findings reaffirm that national averages often obscure substantial intra-country disparities, particularly in low-income regions. The results in this paper thus highlight the importance of spatially disaggregated data in designing effective vulnerability reduction policies aimed at improving sustainability.
In conclusion, sustainability cannot be achieved without addressing vulnerability at the subnational level. Tools like the SGVI are critical for aligning climate resilience efforts with long-term environmental stewardship. By providing spatially disaggregated insights, the SGVI equips policymakers, researchers, and development practitioners with the evidence needed to design interventions that not only reduce risk but also advance sustainability.
Supplementary Materials
The following supporting information can be downloaded at the website of this paper posted on Preprints.org.
Author Contributions
Both authors contributed equally to all parts of the work and have read and agreed to the published version of the manuscript.
Funding
This research received no external funding.
Institutional Review Board Statement
Not applicable.
Informed Consent Statement
Not applicable.
Data Availability Statement
The database created in this study is available in the Supplementary Materials. It is also available at the Global Data Lab (www.globaldatalab.org), were future updates will be made available. From the Global Data Lab also the original datasets can be downloaded on the basis of which the SGVI was constructed.
Conflicts of Interest
The authors declare no conflicts of interest.
References
- Birkmann, J. et al. (2013). Framing vulnerability, risk and societal responses: the MOVE framework. Natural Hazards 67, 193-211. [CrossRef]
- Parsons, M. et al. (2016). Top-down assessment of disaster resilience: A conceptual framework using coping and adaptive capacities. International Journal of Disaster Risk Reduction 19, 1–11. [CrossRef]
- IPCC, Field, C.B. et al. (eds.). (2014). Summary for Policy Makers, in: Climate Change 2014: Impacts, Adaptation and Vulnerability (Cambridge University Press, 1–34).
- IPCC, Pörtner, H.-O. et al. (eds.) (2022). Summary for Policymakers, in: Climate Change 2022: Impacts, Adaptation and Vulnerability. Contribution of Working Group II to the Sixth Assessment Report of the Intergovernmental Panel on Climate Change (Cambridge University Press, 3–33).
- Simpson, N. P., Mach, K. J., Constable, A., Hess, J., Hogarth, R., Howden, M., Lawrence, J., Lempert, R. J., Muccione, V., Mackey, B., et al. A framework for complex climate change risk assessment. One Earth 4(4), 489–501. (2021). [CrossRef]
- Ara Begum, R., Lempert, R., Ali, E. et al. in Climate Change 2022: Impacts, Adaptation and Vulnerability. Contribution of Working Group II to the Sixth Assessment Report of the Intergovernmental Panel on Climate Change (eds. Pörtner, H.-O., Roberts, D.C., Tignor, M. et al.) Point of Departure and Key Concepts, 121–196 (Cambridge University Press) (2023). [CrossRef]
- O’Neill, B., Van Aalst, M., Zaiton Ibrahim, Z., et al. in Climate Change 2022: Impacts, Adaptation and Vulnerability. Contribution of Working Group II to the Sixth Assessment Report of the Intergovernmental Panel on Climate Chang (eds. Pörtner, H.-O., Roberts, D.C., Tignor, M. et al.) Key Risks across Sectors and Regions, 2411–2538 (Cambridge University Press) (2023). [CrossRef]
- Ruane, A. C., Vautard, R., Ranasinghe, R., et al. The Climatic Impact-Driver Framework for Assessment of Risk-Relevant Climate Information. Earth’s Future 10(11), e2022EF002803. (2022). [CrossRef]
- Muttarak, R. & Lutz, W. (2014). Is education a key to reducing vulnerability to natural disasters and hence unavoidable climate change?. Ecology and Society 19. [CrossRef]
- Kocur-Bera, K.; Czyza, S., 2023, Socio-Economic Vulnerability to Climate Change in Rural Areas in the Context of Green Energy Development—A Study of the Great Masurian Lakes Mesoregion. Int. J. Environ. Res. Public Health 2023, 20, 2689. [CrossRef]
- Hallegatte, S., Fay, M. & Barbier, E. B. (2018). Poverty and climate change: Introduction. Environment and Development Economics 23, 217-233. [CrossRef]
- Ebi, K. et al. (2021). Extreme weather and climate change: population health and health system implications. Annual Review of Public Health 42, 293-315. [CrossRef]
- Atwii, F. et al. (2022). World Risk Report 2022 (Bündnis Entwicklung Hilft. https://www.worldriskreport.org/).
- Cutter, S., Boruff, B. & Lynn Shirley, W. (2003). Social vulnerability to environmental hazards. Social Science Quarterly 84, 42–61. [CrossRef]
- Ayanlade, A., Smucker, Th., Nyasimi, M., et al. Complex climate change risk and emerging directions for vulnerability research in Africa. Climate Risk Management 40, 100497. (2023). [CrossRef]
- Birkmann, J. et al. (2022). Understanding human vulnerability to climate change: A global perspective on index validation for adaptation planning. Science of the Total Environment 803. [CrossRef]
- UNDP. HDR technical note https://hdr.undp.org/sites/default/files/2021-22_HDR/hdr2021-22_technical_notes.pdf (2022).
- Miola, A. (2015). Climate resilient development: theoretical framework, selection criteria and fit for purpose indicators. Institute for Environment and Sustainability, European Commission – Joint Research Centre, JRC94771. [CrossRef]
- Marin-Ferrer, M., Vernaccini, L. & Poljansek, K. (2017). INFORM Index for Risk Management. Concept and Methodology (https://drmkc.jrc.ec.europa.eu/inform-index).
- Welle, T. & Birkmann, J. (2015). The world risk index—an approach to assess risk and vulnerability on a global scale. J Extreme Events 02. [CrossRef]
- Chen, C., Noble, I., Hellmann, J., Coffee, J., Murillo, M. & Chawla, N. (2015). University of Notre Dame Global Adaptation Index: Country Index Technical Report (https://gain.nd.edu/assets/254377/nd_gain_technical_document_2015.pdf).
- Smits, J. & Huisman, J. (2024). The GDL Vulnerability Index (GVI). Social Indicators Research, 174, 721-741. [CrossRef]
- Feldmeyer, D., Wilden, D., Jamshed, A. & Birkmann, J. (2020). Regional climate resilience index: A novel multimethod comparative approach for indicator development, empirical validation and implementation. Ecological Indicators 119, 106861. [CrossRef]
- Garschagen, M., Doshi, D., Reith, J. & Hagenlocher, M. (2021). Global patterns of disaster and climate risk-an analysis of the consistency of leading index-based assessments and their results. Climatic Change 169. [CrossRef]
- Becker, W., Saisana, M., Paruolo, P. & Vandecasteele, I. (2017). Weights and importance in composite indicators: Closing the gap. Ecological Indicators 80, 12-22. [CrossRef]
- Füssel, H.-M. (2006). Vulnerability: a general applicable conceptual framework for climate change research. Global Environmental Change 17, 155-167. [CrossRef]
- Grimm, M., Harttgen, K., Klasen, S., Misselhorn, M. A Human Development Index by Income Groups, World Development, Volume 36, Issue 12, 2008, Pages 2527-2546, ISSN 0305-750X. (https://www.sciencedirect.com/science/article/pii/S0305750X0800106X). [CrossRef]
- Grimm, M., Harttgen, K., Klasen, S. et al. Inequality in Human Development: An Empirical Assessment of 32 Countries. Soc Indic Res 97, 191–211 (2010). [CrossRef]
- Graetz, N., Friedman, J., Osgood-Zimmerman, A. et al. Mapping local variation in educational attainment across Africa. Nature 555, 48–53 (2018). [CrossRef]
- Milanovic, B. (2016). Global inequality: A new approach for the age of globalization. Harvard University Press.
- Permanyer, I. & J. Smits. (2020). Inequality in human development across the globe. Population and Development Review. 46(3), 583-601. Online version available here. [CrossRef]
- Harttgen, Kenneth; Klasen, Stephan (2011) : A Human Development Index at the Household Level, Discussion Papers, No. 75, Georg-August-Universität Göttingen, Courant Research Centre - Poverty, Equity and Growth (CRC-PEG), Göttingen.
- Harttgen, K., & Klasen, S. (2012). Do Fragile Countries Experience Worse MDG Progress? The Journal of Development Studies, 49(1), 134–159. [CrossRef]
- Crombach, L & J. Smits. (2024a). Understanding the Urban-Rural Fertility Divide in sub-Saharan Africa: The Critical Role of Social Isolation. Population, Space and Place, 30, e2801. [CrossRef]
- Huisman, J. & J. Smits (2015). Keeping children in school: Household and district-level determinants of school dropout in 322 districts of 30 developing countries. Sage Open, October-December, 1-15. Paper available here. [CrossRef]
- Yang, Dan & Jiajun Xian (2018). The correlations among the World Development Indicators. IEEE-Xplore. https://ieeexplore.ieee.org/stamp/stamp.jsp?arnumber=8632595.
- Kraemer, G., M. Reichstein, G. Camps-Valls, J. Smits & M. Mahecha (2020). The Low Dimensionality of Development. Social Indicators Research 150, 999–1020.
- Ghislandi, S., Sanderson, W. C., & Scherbov, S. (2019). A simple measure of human development: The human life indicator. Population and Development Review, 45(1), 219. [CrossRef]
- Huisman, J, Rosanne Martyr, René Rott & J. Smits (forthcoming). Projections of climate change vulnerability along the Shared Socioeconomic Pathways, 2020-2100. Nature Scientific Data. [CrossRef]
- WDI (2024). The World Bank, World Development Indicators https://databank.worldbank.org/source/world-development-indicators.
- Human Development Index Database (HDID) of the UNDP (2024).
- UNDP, 2021.
- Crombach, L & J. Smits (2021). The demographic window of opportunity and economic growth at sub-national level in 91 developing countries. Social Indicators Research, 161, pages 171–189. Online version available here. [CrossRef]
- WGI (2024). The World Bank, Worldwide Governance Indicators https://databank.worldbank.org/source/worldwide-governance-indicators.
- Vyas, S., & Kumaranayake, L. (2006). Constructing Socio-Economic Status indices: How to use principal components analysis. Oxford University Press. [CrossRef]
- Global Data Lab, www.globaldatalab.org.
- Huisman, J. & J. Smits. (2009). Effects of household and district-level factors on primary school enrollment in 30 developing countries. World Development, 37(1), 179-193. [CrossRef]
- Smits, J. (2016). GDL Area Database: Sub-national development indicators for research and policy-making. GDL Working paper 16-101.
- Smits, J & I. Permanyer (2019). The Subnational Human Development Database. (Nature) Scientific Data, 6, 190038. Online version available here.
- Crombach, L & J. Smits (2024b). The Subnational Corruption Database: Grand and petty corruption in 1,473 regions of 178 countries, 1995-2022. (Nature) Scientific Data, 11, 686. [CrossRef]
- Demographic and Health Surveys.
- UNICEF Multiple Indicator Cluster Surveys (MICS. https://mics.unicef.org).
- IPUMS International (https://international.ipums.org).
- Afrobarometers (www.afrobarometer.org).
- Lapop Surveys (www.vanderbilt.edu/lapop/).
- Asian Barometers (www.asianbarometer.org/).
- Smits, J. & R. Steendijk (2015). The International Wealth Index (IWI). Social Indicators Research, 122(1), 65-85. [CrossRef]
- Kaufmann, D. & Kraay, A. C. The Worldwide Governance Indicators: Methodology and 2024 Update (English) (Policy Research working paper; Washington, D.C.: World Bank Group). http://documents.worldbank.org/curated/en/099005210162424110 (2024).
- Gbohoui, W., Lam, W. R. & Lledo, V. D. (2019). The Great Divide: Regional Inequality and Fiscal Policy. IMF Working Paper WP/19/88.
- Kummu, M., Taka, M. & Guillaume, J. H. (2018). A. Gridded global datasets for Gross Domestic Product and Human Development Index over 1990-2015. Scientific Data 5 (180004), 1–15 (2018). [CrossRef]
- Snijders, Tom A.B., and Bosker, Roel J. Multilevel Analysis: An Introduction to Basic and Advanced Multilevel Modeling, second edition. London etc.: Sage Publishers, 2012.
- Jenkins, Stephen, and Philippe Van Kerm. 2011. “The Measurement of Economic Inequality.” In The Oxford Handbook of Economic Inequality, edited by Brian Nolan, Wiemer Salverda, and Timothy Smeeding. Oxford, UK: Oxford University Press.
- Cowell, F.A. Measuring Inequality, 3rd ed.; Oxford University Press: Oxford, UK, 2011.
Figure 1.
SGVI in 2000, 2011 and 2022.
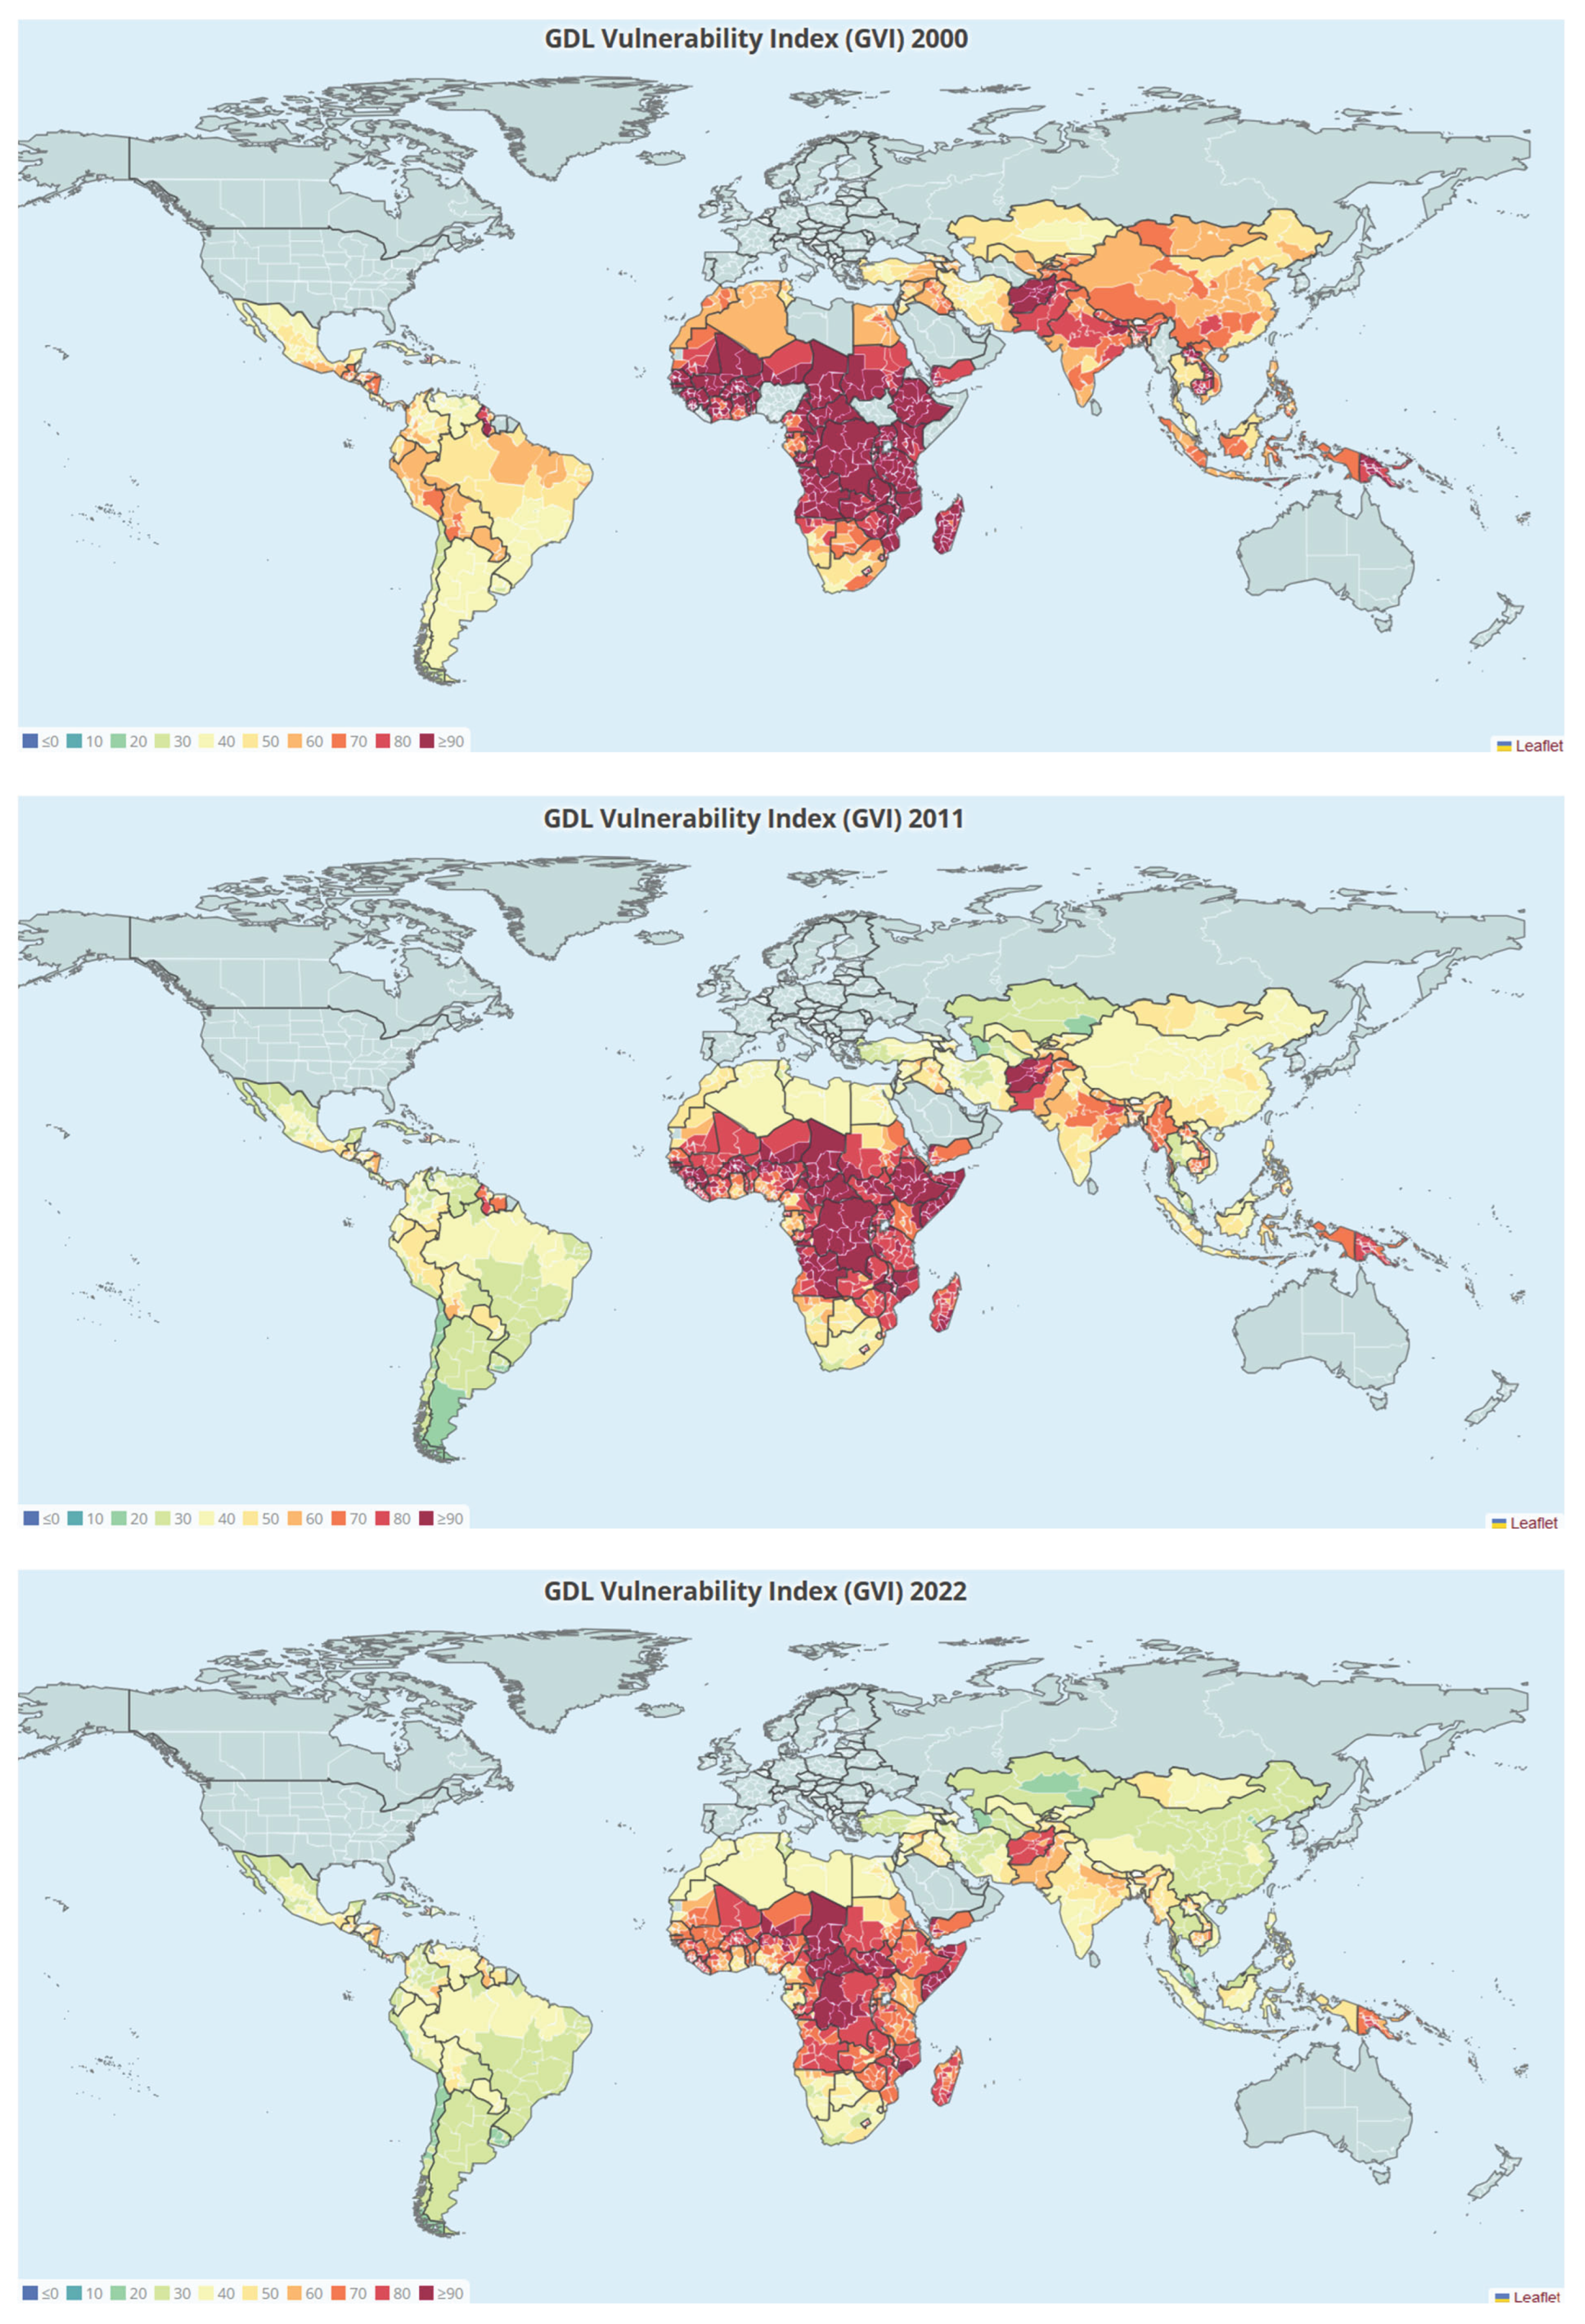

Table 1.
Indicator weights for computing GVI on the basis of all indicators or with one or two indicators missing.
Table 1.
Indicator weights for computing GVI on the basis of all indicators or with one or two indicators missing.
| Indicators | Coefficients |
|---|---|
| GDP per capita (GDPc) | -0.00010686 |
| Poverty headcount at $3.65 | 0.09081646 |
| Years of schooling | -0.71308829 |
| Gender Development Index | -25.59264906 |
| Life expectancy at birth | -0.31492412 |
| Access to clean water | -0.1565931 |
| Access to electricity | -0.08874772 |
| Phone subscriptions | -0.07288862 |
| World Governance Index | -2.32477119 |
| Dependency Ratio | 0.13230595 |
| Urbanization | -0.08628689 |
| Constant | -22.63157686 |
Table 2.
Coefficients of multilevel regression models with SGVI as dependent variable and the eleven indicators as independent variables a.
Table 2.
Coefficients of multilevel regression models with SGVI as dependent variable and the eleven indicators as independent variables a.
| ALL | SSA | LAC | MENAS | CSAP | |
|---|---|---|---|---|---|
| Intercept | 54.88 | 53.71 | 54.84 | 55.03 | 54.98 |
| GDPc | -1.11 | -1.65 | -0.85 | -0.87 | -0.79 |
| Poverty365 | 3.28 | 4.08 | 2.76 | 2.38 | 2.88 |
| Education | -2.10 | -1.99 | -2.03 | -2.02 | -2.07 |
| GDI | -1.54 | -1.20 | -2.07 | -2.15 | -2.05 |
| Life expectancy | -2.21 | -2.39 | -2.10 | -2.29 | -2.18 |
| Clean water | -2.70 | -2.50 | -2.83 | -2.91 | -2.85 |
| Electricity | -2.48 | -2.25 | -2.91 | -3.32 | -2.99 |
| Phones | -1.62 | -1.26 | -2.20 | -2.16 | -2.16 |
| Governance | -1.66 | -1.71 | -1.58 | -1.58 | -1.58 |
| Dependency ratio | 2.97 | 3.31 | 2.52 | 2.46 | 2.53 |
| Urbanization | -2.51 | -2.35 | -2.59 | -2.59 | -2.55 |
a All coefficients are significant at p<0.0001 level.
Table 3.
Average SGVI and change therein for world regions and time periods.
| All | LAC | SSA | MENAS | CSAP | |
|---|---|---|---|---|---|
| Mean SGVI | |||||
| 2000 | 71.7 | 54.4 | 89.2 | 60.9 | 71.8 |
| 2011 | 61.3 | 43.0 | 79.7 | 47.0 | 59.3 |
| 2022 | 54.7 | 40.2 | 71.5 | 44.5 | 49.4 |
| Percentual change in mean SGVI | |||||
| 2000-2011 | 14.6 | 21.0 | 10.6 | 22.8 | 17.4 |
| 2012-2022 | 9.3 | 5.3 | 9.2 | 4.2 | 14.7 |
| 2000-2022 | 23.7 | 26.1 | 19.9 | 27.0 | 31.2 |
Table 4.
GINI coefficient and increase in inequality when including subnational level for all LMICs and for major global regions.
Table 4.
GINI coefficient and increase in inequality when including subnational level for all LMICs and for major global regions.
| GINI | Increase in GINI when including subnational level | |||||
| Region | 2000 | 2011 | 2022 | 2000 | 2011 | 2022 |
| All | 0.15 | 0.19 | 0.19 | 17.8 | 18.9 | 19.9 |
| SSA | 0.07 | 0.11 | 0.12 | 89.4 | 82.1 | 72.8 |
| LAC | 0.13 | 0.15 | 0.14 | 31.1 | 40.4 | 52.5 |
| MENAS | 0.10 | 0.11 | 0.12 | 40.4 | 37.2 | 24.2 |
| CSAP | 0.12 | 0.15 | 0.15 | 40.3 | 38.8 | 30.4 |
Disclaimer/Publisher’s Note: The statements, opinions and data contained in all publications are solely those of the individual author(s) and contributor(s) and not of MDPI and/or the editor(s). MDPI and/or the editor(s) disclaim responsibility for any injury to people or property resulting from any ideas, methods, instructions or products referred to in the content. |
© 2025 by the authors. Licensee MDPI, Basel, Switzerland. This article is an open access article distributed under the terms and conditions of the Creative Commons Attribution (CC BY) license (http://creativecommons.org/licenses/by/4.0/).
Copyright: This open access article is published under a Creative Commons CC BY 4.0 license, which permit the free download, distribution, and reuse, provided that the author and preprint are cited in any reuse.


